global leader in financial services - dear morgan stanley … · 2020. 8. 25. · credit card...
TRANSCRIPT

Dear Morgan Stanley Stockholder:
I am pleased to inform you that the company’s Board of Directors approved the distribution of all of thecommon stock of Discover Financial Services, a wholly-owned subsidiary that is a leading credit card issuer andelectronic payment services company.
The distribution of Discover is scheduled to occur on June 30, 2007. Holders of record of shares of MorganStanley common stock as of the close of business on June 18, 2007, which will be the record date, will receiveone share of Discover common stock for every two shares of Morgan Stanley common stock held. No action isrequired on your part to receive shares of Discover. You will not be required to pay anything for the new sharesor to surrender any Morgan Stanley shares. Because Discover shares will only be maintained in book-entry form,you will not receive a stock certificate representing your interest in Discover. A book-entry account statementreflecting your ownership of shares of Discover common stock will be mailed to you if you hold Morgan Stanleyshares directly, or your brokerage account will be credited for the shares on or about July 2, 2007.
We believe that the separation of Discover from Morgan Stanley will enhance stockholder value andprovide numerous opportunities and benefits by allowing the management of both companies to focus on theirrespective firm-wide strategic priorities, enhancing the competitive positions of the two companies, increasingDiscover’s ability to attract and retain employees and improving Discover’s ability to pursue strategictransactions.
Following the distribution, Morgan Stanley common stock will continue to trade on the New York StockExchange under the symbol “MS.” Discover common stock has been authorized for listing on the NYSE underthe symbol “DFS.”
We expect the distribution to be tax-free to Morgan Stanley stockholders for U.S. federal income taxpurposes. Morgan Stanley has received a ruling from the Internal Revenue Service that, based on customaryrepresentations and qualifications, the distribution will be tax-free to Morgan Stanley stockholders for U.S.federal income tax purposes.
I encourage you to read the enclosed information statement, which is being provided to all Morgan Stanleystockholders. It describes the distribution in detail and contains important business and financial informationabout Discover.
I look forward to your continued support as a stockholder of Morgan Stanley. We remain committed toworking on your behalf to build long-term stockholder value.
Sincerely,
John J. MackChairman and Chief Executive OfficerJune 1, 2007


Dear Discover Stockholder:
We are very pleased to welcome you as a stockholder of Discover Financial Services.
Discover is a leading credit card issuer and electronic payment services company with a 20-year heritage ofinnovation and excellence that has made us one of the most recognized brands in U.S. financial services. Withmore than 50 million cardmembers and $46.3 billion in managed receivables as of February 28, 2007, we are oneof the largest card issuers in the country. We are also a leading card issuer in the United Kingdom where we havemore than 2 million cardmembers and $4.6 billion in managed receivables. In 2006, we processed more than 3billion transactions through the Discover Network, and the PULSE ATM/debit Network. Discover Network cardsare currently accepted at more than 4 million merchant and cash access locations primarily across NorthAmerica. The PULSE Network links cardholders of more than 4,400 financial institutions with nearly 260,000ATMs as well as POS terminals located throughout the United States. We believe that our business model as acombination credit card issuer and electronic payments processor, as well as our strong brands, attractive base ofloyal cardmembers, leading cash rewards program, strong operational platform and excellent customer service,are key competitive advantages that enhance our growth prospects.
We are very excited about our prospects and believe we will be even better positioned to realize growthopportunities for our business as an independent company. Looking forward, we intend to continue to executeour strategies of growing our card issuing business, broadening merchant acceptance of Discover Network cardsand increasing payments transaction volume from external issuers.
Discover common stock has been authorized for listing on the New York Stock Exchange under the symbol“DFS.”
You are invited to learn more about our company by reading the enclosed information statement. On behalfof our board of directors, management team and employees, I thank you in advance for your support as we focuson delivering long-term stockholder value as a publicly-traded company.
Sincerely,
David W. NelmsChief Executive OfficerJune 1, 2007

[THIS PAGE INTENTIONALLY LEFT BLANK]

INFORMATION STATEMENT
Common Stock(Par Value $0.01 Per Share)
Morgan Stanley is furnishing this information statement to holders of Morgan Stanley common stock inconnection with the distribution by Morgan Stanley to its stockholders of all of the issued and outstanding sharesof common stock of Discover Financial Services, or Discover. As of the date of this information statement,Morgan Stanley owns all of our outstanding common stock.
Morgan Stanley expects that the distribution will be made on June 30, 2007 on a pro rata basis to theholders of record of Morgan Stanley common stock as of the close of business on June 18, 2007, which is therecord date. If you are a record holder of Morgan Stanley common stock at the close of business on the recorddate, you will receive one share of Discover common stock for every two shares of Morgan Stanley commonstock you hold on that date. As discussed under “The Distribution,” if you sell your shares of Morgan Stanleycommon stock in the “regular way” market after the record date and prior to the distribution, you also will beselling your right to receive shares of Discover common stock in the distribution. A book-entry accountstatement reflecting your ownership of shares of Discover common stock will be mailed to you, or yourbrokerage account will be credited for the shares, on or about July 2, 2007. Because Discover shares will only bemaintained in book-entry form, you will not receive a stock certificate representing your interest in Discover.Stockholders who would like more information should contact the transfer agent, Mellon Investor Services, toll-free at 1-866-258-6590 or by email at [email protected].
The distribution is expected to be tax-free to Morgan Stanley stockholders for U.S. federal income taxpurposes.
You will not be required to make any payment for the shares of Discover common stock that you willreceive in the distribution, nor will you be required to surrender or exchange your shares of MorganStanley common stock or take any other action in order to receive shares of Discover common stock in thedistribution. No approval by Morgan Stanley stockholders of the distribution is required or being sought.
There is no current trading market for Discover common stock. However, we expect that a limited market,commonly known as a “when-issued” trading market, for Discover common stock will begin on or about theweek of June 11, 2007, and we expect that “regular way” trading of Discover common stock will begin the firstday of trading following the distribution. Discover common stock has been authorized for listing on the NewYork Stock Exchange under the symbol “DFS.”
In reviewing this information statement, you should carefully consider the risksunder “Risk Factors” beginning on page 12 of this information statement.
Neither the Securities and Exchange Commission nor any state securities commission has approved ordisapproved of these securities or determined if this information statement is truthful or complete. Anyrepresentation to the contrary is a criminal offense.
This information statement is not an offer to sell, or a solicitation of an offer to buy, any securities.
June 1, 2007

[THIS PAGE INTENTIONALLY LEFT BLANK]

TABLE OF CONTENTS
Summary . . . . . . . . . . . . . . . . . . . . . . . . . . . . . . . . . . . . . . . . . . . . . . . . . . . . . . . . . . . . . . . . . . . . . . . . . . . . . . 1Risk Factors . . . . . . . . . . . . . . . . . . . . . . . . . . . . . . . . . . . . . . . . . . . . . . . . . . . . . . . . . . . . . . . . . . . . . . . . . . . . 12Special Note Regarding Forward-Looking Statements . . . . . . . . . . . . . . . . . . . . . . . . . . . . . . . . . . . . . . . . . . . 29The Distribution . . . . . . . . . . . . . . . . . . . . . . . . . . . . . . . . . . . . . . . . . . . . . . . . . . . . . . . . . . . . . . . . . . . . . . . . 30Dividend Policy . . . . . . . . . . . . . . . . . . . . . . . . . . . . . . . . . . . . . . . . . . . . . . . . . . . . . . . . . . . . . . . . . . . . . . . . . 37Capitalization . . . . . . . . . . . . . . . . . . . . . . . . . . . . . . . . . . . . . . . . . . . . . . . . . . . . . . . . . . . . . . . . . . . . . . . . . . 38Unaudited Pro Forma Condensed Combined Financial Statements . . . . . . . . . . . . . . . . . . . . . . . . . . . . . . . . . 39Selected Historical and Pro Forma Combined Data . . . . . . . . . . . . . . . . . . . . . . . . . . . . . . . . . . . . . . . . . . . . . 47Management’s Discussion and Analysis of Financial Condition and Results of Operations . . . . . . . . . . . . . . 50Business . . . . . . . . . . . . . . . . . . . . . . . . . . . . . . . . . . . . . . . . . . . . . . . . . . . . . . . . . . . . . . . . . . . . . . . . . . . . . . . 95Arrangements Between Us and Morgan Stanley . . . . . . . . . . . . . . . . . . . . . . . . . . . . . . . . . . . . . . . . . . . . . . . 120Management . . . . . . . . . . . . . . . . . . . . . . . . . . . . . . . . . . . . . . . . . . . . . . . . . . . . . . . . . . . . . . . . . . . . . . . . . . . 127Ownership of Our Stock . . . . . . . . . . . . . . . . . . . . . . . . . . . . . . . . . . . . . . . . . . . . . . . . . . . . . . . . . . . . . . . . . . 142Description of Capital Stock . . . . . . . . . . . . . . . . . . . . . . . . . . . . . . . . . . . . . . . . . . . . . . . . . . . . . . . . . . . . . . . 144Certain Relationships and Related Transactions . . . . . . . . . . . . . . . . . . . . . . . . . . . . . . . . . . . . . . . . . . . . . . . . 147Limitation of Liability and Indemnification of Directors and Officers . . . . . . . . . . . . . . . . . . . . . . . . . . . . . . 148Where You Can Find More Information . . . . . . . . . . . . . . . . . . . . . . . . . . . . . . . . . . . . . . . . . . . . . . . . . . . . . . 149Glossary of Selected Terminology . . . . . . . . . . . . . . . . . . . . . . . . . . . . . . . . . . . . . . . . . . . . . . . . . . . . . . . . . . 150Index to Financial Statements . . . . . . . . . . . . . . . . . . . . . . . . . . . . . . . . . . . . . . . . . . . . . . . . . . . . . . . . . . . . . . F-1
In this information statement, the terms “Company,” “Discover,” “we,” “us” and “our” refer to DiscoverFinancial Services, a Delaware corporation, and its subsidiaries, taken as a whole and, for the period prior to thedistribution date, to our predecessor, the Discover segment of Morgan Stanley. The term “Morgan Stanley” refersto Morgan Stanley, a Delaware corporation, and its subsidiaries, excluding Discover, unless the context indicatesotherwise. References to years refer to fiscal years ending November 30 of each year, unless the context indicatesotherwise.
We own or have rights to use the trademarks, trade names and service marks that we use in conjunction withthe operation of our business, including, but not limited to: Discover, PULSE, Cashback Bonus, ShopDiscover,Discover Motiva Card, Miles by Discover Card, Discover Open Road Card, Discover Network and Goldfish. Allother trademarks, trade names and service marks included in this information statement are the property of theirrespective owners.
Commonly used terms are defined in “Glossary of Selected Terminology.”

[THIS PAGE INTENTIONALLY LEFT BLANK]

SUMMARY
This summary highlights information contained elsewhere in this information statement. This summary doesnot contain all of the information that you should consider. You should read this entire information statementcarefully, especially the risks of owning our common stock discussed under “Risk Factors” and our auditedcombined financial statements and related notes.
Our Company
We are a leading credit card issuer and electronic payment services company with one of the mostrecognized brands in U.S. financial services. Since our inception in 1986, we have grown to become one of thelargest card issuers in the United States, with more than 50 million cardmembers (41.9 million accounts and18.4 million active accounts) and $46.3 billion in managed receivables as of February 28, 2007. We are also aleader in payments processing, as we are one of only two credit card issuers with its own U.S. payments networkand the only issuer whose wholly-owned network operations include both credit and debit functionality. In 2006,we processed more than 3 billion transactions through our signature card network (the “Discover Network”) andPULSE EFT Association (the “PULSE Network” or “PULSE”), one of the nation’s leading ATM/debit networks.
We issue credit cards in the United States under the Discover Card brand to various segments within theconsumer and small business sectors. Most of our cards offer a Cashback Bonus rewards program—the leadingcash rewards program in the United States based on household participation in cash rewards programs—as wellas our top-rated benefits and customer service, which we believe result in excellent customer retention. Inaddition, we offer a range of banking products to our customers, including personal and home equity loans,certificates of deposit and money market accounts.
Discover Network cards are currently accepted at more than 4 million merchant and cash access locationsprimarily in the United States, Mexico, Canada and the Caribbean. In October 2004, the U.S. Department ofJustice (“DOJ”) prevailed in its antitrust lawsuit (the “DOJ litigation”) against Visa U.S.A., Inc. (together with itspredecessors, “Visa”) and MasterCard Worldwide (together with its predecessors, “MasterCard”) whichchallenged their exclusionary rules—rules that effectively precluded us from offering network services tofinancial institutions. Since then, we have accelerated our network growth by entering the debit market with theacquisition of the PULSE Network, and by signing card issuing agreements with a number of financialinstitutions. We also have significantly expanded our relationships with companies that provide merchants withcredit card processing services, which we believe will further increase the number of merchants acceptingDiscover Network cards.
In addition, we issue credit cards on the MasterCard and Visa networks in the United Kingdom, the world’ssecond-largest credit card market. Our portfolio includes Goldfish, one of the United Kingdom’s leading rewardscredit cards, as well as several Morgan Stanley-branded credit cards and a number of affinity credit cards. As ofFebruary 28, 2007, we had more than 2 million cardmembers in the United Kingdom and $4.6 billion of managedreceivables in this market.
Our revenues (net interest income plus other income) have increased over the last three years, from$4.5 billion in 2004 to $5.1 billion in 2006, and net income has increased from $776 million to $1.1 billion overthe same period. Our revenues and net income for the three months ended February 28, 2007 were $1.2 billionand $234 million, respectively, and $1.2 billion and $305 million, respectively, for the three months endedFebruary 28, 2006.
Our executive management team possesses an average of 19 years of financial services experience. Webelieve we are well prepared to operate as a stand-alone company, having maintained our own marketing,operations, customer service and technology systems in our U.S. operations throughout our history.

Competitive Advantages
We believe we possess several key competitive advantages that enhance our growth prospects, including:
• Unique Credit Card Issuer/Payment Services Business Model. We believe that we have a unique businessmodel as a combination credit card issuer and electronic payments processor because we are one of only twocard issuers with its own U.S. payments network; and of these two, we are the only one offering merchantsand financial institutions a comprehensive suite of payment products (credit, debit and prepaid).
• Strong, Established Brands. We believe our strong brands are critical to increasing card usage bycardmembers, growing our customer base, and creating new opportunities to expand into additionalcard and consumer lending sectors.
• Attractive Base of Loyal Cardmembers. Discover has a large, attractive and loyal base of cardmembersin the United States, which we believe provides a strong foundation for the growth of our credit cardissuing business and our expansion into related lending and deposit products.
• Leading Cash Rewards Program in the Industry. We pioneered cash rewards for general purpose creditcards in 1986. We believe our experience, scale and direct merchant relationships make us efficient inhow we design and operate our programs, allowing us to offer greater value to cardmembers whilemaintaining our profitability. Along with our strong brands and customer service, we believe that ourrewards program contributes to increased usage of our cards and our low attrition rate.
• Strong Operational Platform and Customer Service. We believe that our proprietary operationalinfrastructure, which we have developed during our 20-year history, has been a critical component ofour success. We have developed our technology, operating processes and customer experience with thegoal of maintaining business efficiency while generating revenue and cultivating customer loyalty.
• Broad-Based, Flexible Payments Networks. We believe our strong position in the credit and debit cardmarkets positions us well in the payments processing business. In recent years, we have madesignificant progress in capitalizing on new business opportunities, most of which only became possibleas a result of the October 2004 resolution of the DOJ litigation. We offer a complete suite of services tokey merchants that includes the processing of our credit cards, debit cards (signature and PIN) andprepaid cards, as well as other payment network services.
• Strong Risk Management Culture. We take an integrated view of all elements of risk, including credit,operational and regulatory risk. We have built and refined proprietary models that seek to control allaspects of credit risk, including authorization and new account underwriting, and to enable cost-effective collections.
Our Strategy
• Grow Our Card Issuing Business through Brand, Rewards and Service Leadership. We intend tocontinue leveraging our brand strength, rewards expertise and customer service to create needs-basedsolutions that generate increased usage from our existing Discover cardmembers and acquire newaccounts cost-effectively.
• We believe we can leverage our strong national brand recognition and customer loyalty to help usdrive increased usage among cardmembers and broader acceptance among merchants, leading tohigher receivables and revenues.
• We believe we can profitably grow sales and balances through expanded cash rewards leadership,both with existing and new cardmembers.
• We will continue to improve our analytics and launch new products and features.
• Broaden Merchant Acceptance of Discover Network Cards. Discover Network cards are currentlyaccepted at more than 4 million merchant and cash access locations primarily in the United States,
2

Mexico, Canada and the Caribbean. We believe we have unsurpassed acceptance among the 100 largestretailers in the United States. Discover Network cards, however, are less likely to be a customer’sprimary card due to lower acceptance rates among small and mid-size merchants than cards issued onthe Visa and MasterCard networks. We believe that increasing small and mid-size merchant acceptanceof Discover Network cards will create significant opportunities for our card issuing and third-partypayments businesses.
• Grow Payments Transaction Volume from External Issuers. During the past two years, we have beenable to attract a number of third-party issuers, including debit, credit and prepaid, on our Discover andPULSE Networks. Following our acquisition of PULSE, third-party volume on the Discover andPULSE Networks accounted for approximately 59% of network transactions in 2006.
• Expand in Card Sectors and Grow Lending and Deposit Business. We plan to expand in severalcard and consumer lending sectors that we believe offer attractive profit potential and leverage ourassets. Areas of particular focus include: a small business card, which we launched in 2006;relaunching the Miles by Discover Card product; and prepaid cards. We also are pursuingopportunities to profitably leverage our brand, our customer base, and our direct marketing andoperating skills by growing our Discover branded non-card lending (including personal, home equityand student loans) and deposit businesses.
• Strengthen U.K. Card Business. We have made significant investments in our U.K. business duringthe last two years, including our February 2006 acquisition of the Goldfish credit card business. TheU.K. market is currently experiencing high delinquencies and rising bankruptcy levels, compounded bychanging regulations, which have adversely affected our performance. We are in the process ofimplementing a number of initiatives to address these issues, including: changes to our credit andcollections strategies; changes to our operations; and pricing and rewards optimization. While we arestill experiencing losses in the United Kingdom, over time we believe that we can improve ouroperating results and continue to grow our U.K. business.
Payments to Morgan Stanley in Connection with the Distribution
In recent years, Morgan Stanley has provided us funding through a variety of sources. At November 30, 2006,these funding sources totaled $9.8 billion. Of this amount, $7.9 billion was obtained through intercompany noteagreements at market rates available to Morgan Stanley, and $1.9 billion was sourced through the Morgan StanleyGlobal Wealth Management Bank Deposit Program at market rates available to Discover. At February 28, 2007,these funding sources totaled $6.5 billion. Of this amount, $3.9 billion was obtained through intercompany noteagreements at market rates available to Morgan Stanley, and $2.6 billion was sourced through the Morgan StanleyGlobal Wealth Management Bank Deposit Program at market rates available to Discover. In connection with thedistribution, we are in the process of replacing funding provided through Morgan Stanley intercompanyarrangements with alternative sources, including certificates of deposit, external deposits from broker-dealers,unsecured long-term debt and asset-backed financing, of which certain external financing arrangements arecurrently being structured, at market rates available to us. For additional information, see “Unaudited Pro FormaCondensed Combined Financial Statements”. In addition, we expect to pay a dividend to Morgan Stanley prior tothe distribution to the extent the capital on our combined statements of financial condition exceeds our capitalrequirements as determined by us and Morgan Stanley. This dividend is being paid pursuant to, and consistent with,our practice of distributing a substantial percentage of our earnings to Morgan Stanley. As of February 28, 2007,management determined that approximately $5.4 billion of capital was appropriate to support our business.Accordingly, the unaudited pro forma condensed combined statement of financial condition reflects a $100 milliondividend to adjust the capital account set forth in our February 28, 2007 combined statement of financial condition.The final amount of the dividend, which will be paid in the third quarter of 2007, will be based on our capital levelsand capital requirements at that time. Accordingly, the amount of the dividend is expected to be greater than the$100 million dividend reflected in the February 28, 2007 unaudited pro forma condensed combined statement offinancial condition.
3
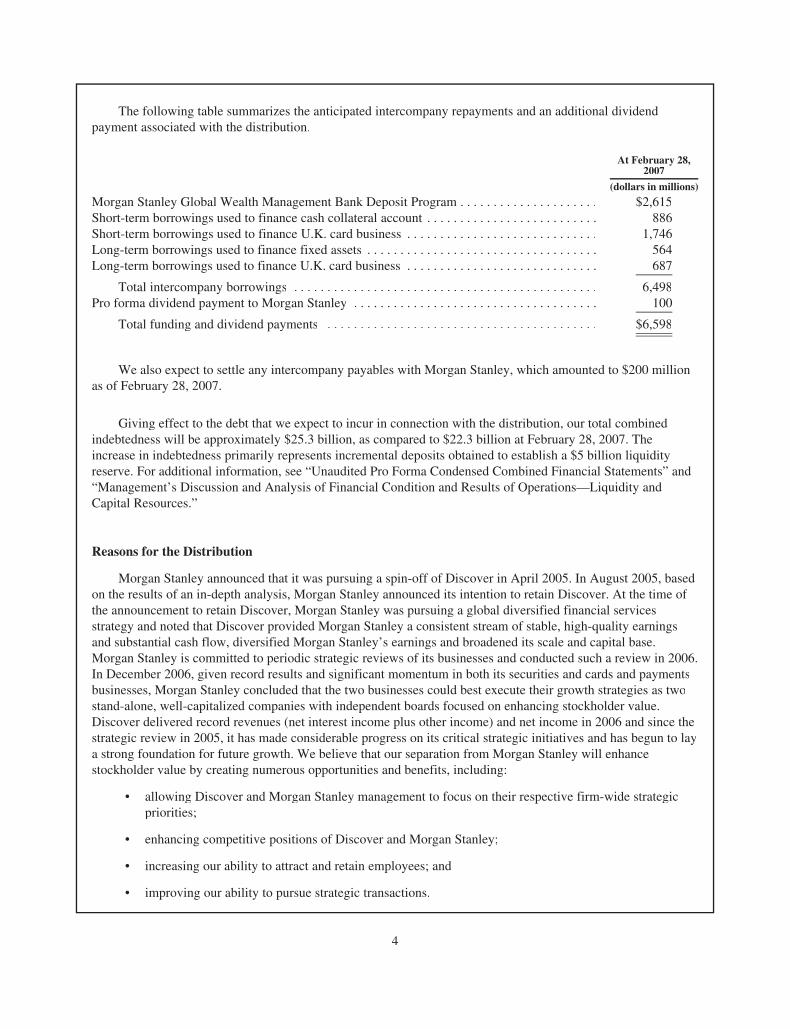
The following table summarizes the anticipated intercompany repayments and an additional dividendpayment associated with the distribution.
At February 28,2007
(dollars in millions)
Morgan Stanley Global Wealth Management Bank Deposit Program . . . . . . . . . . . . . . . . . . . . . $2,615Short-term borrowings used to finance cash collateral account . . . . . . . . . . . . . . . . . . . . . . . . . . 886Short-term borrowings used to finance U.K. card business . . . . . . . . . . . . . . . . . . . . . . . . . . . . . 1,746Long-term borrowings used to finance fixed assets . . . . . . . . . . . . . . . . . . . . . . . . . . . . . . . . . . . 564Long-term borrowings used to finance U.K. card business . . . . . . . . . . . . . . . . . . . . . . . . . . . . . 687
Total intercompany borrowings . . . . . . . . . . . . . . . . . . . . . . . . . . . . . . . . . . . . . . . . . . . . . . 6,498Pro forma dividend payment to Morgan Stanley . . . . . . . . . . . . . . . . . . . . . . . . . . . . . . . . . . . . . 100
Total funding and dividend payments . . . . . . . . . . . . . . . . . . . . . . . . . . . . . . . . . . . . . . . . . $6,598
We also expect to settle any intercompany payables with Morgan Stanley, which amounted to $200 millionas of February 28, 2007.
Giving effect to the debt that we expect to incur in connection with the distribution, our total combinedindebtedness will be approximately $25.3 billion, as compared to $22.3 billion at February 28, 2007. Theincrease in indebtedness primarily represents incremental deposits obtained to establish a $5 billion liquidityreserve. For additional information, see “Unaudited Pro Forma Condensed Combined Financial Statements” and“Management’s Discussion and Analysis of Financial Condition and Results of Operations—Liquidity andCapital Resources.”
Reasons for the Distribution
Morgan Stanley announced that it was pursuing a spin-off of Discover in April 2005. In August 2005, basedon the results of an in-depth analysis, Morgan Stanley announced its intention to retain Discover. At the time ofthe announcement to retain Discover, Morgan Stanley was pursuing a global diversified financial servicesstrategy and noted that Discover provided Morgan Stanley a consistent stream of stable, high-quality earningsand substantial cash flow, diversified Morgan Stanley’s earnings and broadened its scale and capital base.Morgan Stanley is committed to periodic strategic reviews of its businesses and conducted such a review in 2006.In December 2006, given record results and significant momentum in both its securities and cards and paymentsbusinesses, Morgan Stanley concluded that the two businesses could best execute their growth strategies as twostand-alone, well-capitalized companies with independent boards focused on enhancing stockholder value.Discover delivered record revenues (net interest income plus other income) and net income in 2006 and since thestrategic review in 2005, it has made considerable progress on its critical strategic initiatives and has begun to laya strong foundation for future growth. We believe that our separation from Morgan Stanley will enhancestockholder value by creating numerous opportunities and benefits, including:
• allowing Discover and Morgan Stanley management to focus on their respective firm-wide strategicpriorities;
• enhancing competitive positions of Discover and Morgan Stanley;
• increasing our ability to attract and retain employees; and
• improving our ability to pursue strategic transactions.
4

Risk Factors
Our business, financial condition, cash flows and/or results of operations could be materially adverselyaffected by any of the risks described under “Risk Factors.” These risks include but are not limited to risksassociated with the competitive environment, our ability to obtain funding and the cost of such funds, and risksrelating to our separation from Morgan Stanley and our ability to operate as a stand-alone company.
Company Information
We were incorporated in Delaware in 1960. Our principal executive offices are located at 2500 Lake CookRoad, Riverwoods, Illinois 60015. Our main telephone number is (224) 405-0900.
5

QUESTIONS AND ANSWERS ABOUT THE DISTRIBUTION
Please see “The Distribution” for a more detailed description of the matters summarized below.
How will the distributionwork?
Following final approval of the distribution by the Morgan Stanley board ofdirectors, and pursuant to the terms and conditions of a separation anddistribution agreement to be entered into between us and Morgan Stanley, all ofthe outstanding shares of Discover common stock will be distributed pro rata tothe holders of record of Morgan Stanley common stock. In the distribution, eachholder of Morgan Stanley common stock will receive one share of Discovercommon stock for every two shares of Morgan Stanley common stock held as ofthe close of business on June 18, 2007, which is the record date. For a moredetailed description, see “The Distribution.”
What will Discover’srelationship with MorganStanley be after thedistribution?
After the distribution, Discover and Morgan Stanley will be independent,publicly owned companies. Prior to the distribution, Discover and MorganStanley will enter into several agreements relating to the continued provision ofcertain administrative and other services for a limited transition period, andcertain other matters. See “Arrangements Between Us and Morgan Stanley.”
When will the distributionbe completed?
June 30, 2007.
What is the record date forthe distribution?
Close of business on June 18, 2007.
What do I have to do toparticipate in thedistribution?
You are not required to take any action to receive shares of Discover commonstock in the distribution. No vote of Morgan Stanley stockholders will be takenfor the distribution. If you own shares of Morgan Stanley common stock as ofthe close of business on the record date and do not sell those shares in the“regular way” market prior to the distribution, a book-entry account statementreflecting your ownership of shares of our common stock will be mailed to youduring the week of July 2, 2007, or your brokerage account will be credited forthe shares on or about July 2, 2007. Do not mail in Morgan Stanley commonstock certificates in connection with the distribution.
How many shares ofDiscover common stockwill I receive?
Each record holder of Morgan Stanley common stock will receive one share ofDiscover common stock for every two shares of Morgan Stanley common stockthat such record holder owned as of the record date. For example, a record holderof 100 shares of Morgan Stanley common stock will receive 50 shares ofDiscover common stock in the distribution. Fractional shares of Discovercommon stock will not be issued to Morgan Stanley stockholders. Instead,fractional shares will be sold in the public market by the distribution agent. Theaggregate net proceeds of these sales will be distributed ratably, after makingcertain deductions, to those Morgan Stanley stockholders who would otherwisehave received fractional shares. For additional information, see “TheDistribution.”
What is book-entry? The book-entry system allows registered stockholders to hold their shareswithout physical stock certificates. For additional information, see “TheDistribution—Manner of Effecting the Distribution—Book Entry Statements.”
6

Is the distribution taxable forfederal income tax purposes?
Morgan Stanley has received a ruling from the Internal Revenue Service that,based on customary representations and qualifications, the distribution will betax-free to Morgan Stanley stockholders for U.S. federal income tax purposes.Under certain circumstances, Discover will be required to indemnify MorganStanley for all or a portion of Morgan Stanley’s tax liability if the distributiondoes not qualify for tax-free treatment. See “The Distribution—Material U.S.Federal Income Tax Consequences of the Distribution” for a more detaileddescription of the federal income tax consequences of the distribution.
How will the distributionaffect my tax basis in MorganStanley common stock?
Your tax basis in the Morgan Stanley common stock held by you immediatelyprior to the distribution will be allocated between such Morgan Stanley commonstock and the Discover common stock received in the distribution in proportionto the relative fair market values of each on the distribution date, assuming thatthe distribution is tax-free to Morgan Stanley stockholders for U.S. federalincome tax purposes. See “The Distribution—Material U.S. Federal Income TaxConsequences of the Distribution” for more information.
What will happen torestricted stock units andoptions?
Following the distribution, holders of Morgan Stanley restricted stock units(RSUs) and options who are active employees of Discover at the time ofdistribution will have their Morgan Stanley RSUs and options converted intonewly-issued Discover RSUs and options pursuant to a formula that is intended topreserve the “intrinsic” value of their pre-distribution RSUs and options. All otherholders of Morgan Stanley RSUs and options will have their existing MorganStanley RSUs and options adjusted pursuant to a formula that is intended topreserve the “intrinsic” value of their pre-distribution RSUs and options.
Does Discover intend to paydividends on Discovercommon stock?
Our board of directors will determine the payment and amount, if any, of futuredividends on the basis of our financial condition, earnings, capital requirements,legal and regulatory constraints and other relevant factors. See “DividendPolicy” for further information.
Where will I be able to trademy shares of Discovercommon stock?
There is not currently a public market for Discover common stock. Discovercommon stock has been authorized for listing on the New York Stock Exchangeunder the symbol “DFS.” We anticipate that trading in Discover common stockwill commence on a “when-issued” basis prior to the distribution. When-issuedtrading refers to a transaction made conditionally because the security has beenauthorized but not yet issued. On the first trading day following the distributiondate, when-issued trading in respect of Discover common stock will end and“regular way” trading will begin. Regular way trading refers to trading after asecurity has been issued and typically involves a transaction that settles on thethird full business day following the date of a transaction. We cannot predict thetrading prices for Discover common stock before or after the distribution date.
Will the number of shares ofMorgan Stanley commonstock I own change as aresult of the distribution?
No. The number of shares of Morgan Stanley common stock you own will notchange as a result of the distribution.
7

What will happen to thelisting of Morgan Stanleycommon stock?
Morgan Stanley common stock will continue to trade on the New York StockExchange under the symbol “MS.”
Whom do I contact forinformation regardingDiscover and thedistribution?
Before the distribution, you should direct inquiries relating to the distribution to:
Morgan Stanley1585 Broadway
New York, New York 10036Attention: Investor Relations Department
Telephone: (212) 761-4000
After the distribution, you should direct inquiries relating to Discover to:
Discover Financial ServicesInvestor Relations Department
2500 Lake Cook RoadRiverwoods, Illinois 60015Telephone: (224) 405-4555
8

SUMMARY HISTORICAL AND PRO FORMA COMBINED FINANCIAL DATA
The following table presents our summary historical and pro forma combined financial data. The statementof income data for each of the years in the three-year period ended November 30, 2006 and the statement offinancial condition data as of November 30, 2006 and 2005 have been derived from our audited combinedfinancial statements included elsewhere in this information statement. The statement of income data for the threemonths ended February 28, 2007 and 2006 and statement of financial condition data as of February 28, 2007 arederived from our unaudited condensed combined financial statements included elsewhere in this informationstatement. The unaudited pro forma statement of income and financial condition data have been derived from ourunaudited condensed combined financial statements for the three months ended February 28, 2007 and ouraudited combined financial statements for the year ended November 30, 2006 and include adjustments that giveeffect to transactions contemplated by the separation and distribution agreement.
The summary historical and pro forma financial data and operating statistics presented below should be readin conjunction with our audited combined financial statements and accompanying notes and “Management’sDiscussion and Analysis of Financial Condition and Results of Operations” included elsewhere in thisinformation statement. The combined financial information may not be indicative of our future performance anddoes not necessarily reflect what our financial position and results of operations would have been had weoperated as a separate, stand-alone entity during the periods presented, including changes that will occur in ouroperations and capitalization as a result of our separation from Morgan Stanley. See “Unaudited Pro FormaCondensed Combined Financial Statements” for additional discussion of the anticipated changes. The unauditedcondensed combined financial statements are not necessarily indicative of the results to be expected for any otherinterim period or for the year ending November 30, 2007. However, in the opinion of management, the unauditedcondensed combined financial statements include all normal recurring adjustments that are necessary for the fairpresentation of the results for interim periods.
Included in the summary historical and pro forma combined financial data are certain amounts and statisticsreported on a managed basis. Our senior management evaluates business performance and allocates resourcesusing financial data that is presented on a managed basis. Managed loans consist of our on-balance sheet loanportfolio, loans held for sale and transferred loans against which beneficial interests have been issued throughsecuritization transactions. Owned loans, a subset of managed loans, refers to our on-balance sheet loan portfolioand loans held for sale and includes the undivided seller’s interest we retain in our securitizations. A managedbasis presentation, which is not a presentation in accordance with accounting principles generally accepted in theUnited States (“GAAP”), involves reporting securitized loans with our owned loans in the managed basisstatements of financial condition and reporting the earnings on securitized loans in the same manner as theowned loans instead of as securitization income. See “Management’s Discussion and Analysis of FinancialCondition and Results of Operations—GAAP to Managed Reconciliations.”
9

Summary Historical and Pro Forma Combined Financial Data
For the Three Months EndedFebruary 28, For the Years Ended November 30,
2007 ProForma 2007 2006
2006 ProForma 2006 2005 2004
Statement of Income Data: (dollars in thousands)Interest income . . . . . . . . . . . . . . . . . . . . . . . . $ 716,000 $ 680,305 $586,431 $2,672,000 $ 2,458,526 $ 2,174,811 $ 1,859,504Interest expense . . . . . . . . . . . . . . . . . . . . . . . . 330,000 283,959 228,746 1,213,000 940,040 776,479 647,622
Net interest income . . . . . . . . . . . . . . . . . 386,000 396,346 357,685 1,459,000 1,518,486 1,398,332 1,211,882Provision for loan losses . . . . . . . . . . . . . . . . . 195,000 195,386 154,828 756,000 755,637 878,486 925,549
Net interest income after provision forloan losses . . . . . . . . . . . . . . . . . . . . . . 191,000 200,960 202,857 703,000 762,849 519,846 286,333
Other income . . . . . . . . . . . . . . . . . . . . . . . . . . 825,000 825,677 889,275 3,539,000 3,538,939 2,937,037 3,248,386Other expense . . . . . . . . . . . . . . . . . . . . . . . . . 663,000 655,176 607,235 2,775,000 2,719,483 2,532,627 2,315,812
Income before income tax expense . . . . . 353,000 371,461 484,897 1,467,000 1,582,305 924,256 1,218,907Income tax expense . . . . . . . . . . . . . . . . . . . . . 130,000 137,829 179,474 466,000 505,689 346,341 442,654
Net income . . . . . . . . . . . . . . . . . . . . . . . $ 223,000 $ 233,632 $305,423 $1,001,000 $ 1,076,616 $ 577,915 $ 776,253
Statement of FinancialCondition Data (as of):
Total assets . . . . . . . . . . . . . . . . . . . . . . . . . . . $32,403,000 $29,763,803 $29,067,242 $26,943,923 $24,122,009Long-term borrowings . . . . . . . . . . . . . . . . . . $ 1,706,000 $ 1,506,450 $ 1,507,578 $ 863,745 $ 1,198,406Total stockholder’s equity . . . . . . . . . . . . . . . . $ 5,425,000 $ 5,528,658 $ 5,774,772 $ 4,600,449 $ 4,021,349Total average interest earning assets . . . . . . . . $27,834,723 $25,546,145 $23,783,731 $20,627,761Total average interest bearing liabilities . . . . . $22,190,631 $19,830,983 $18,656,289 $15,717,897
Earnings per shareBasic $ 0.44 $ 1.98Diluted $ 0.42 $ 1.89
Weighted average shares outstanding (000s)Basic 504,593 504,593Diluted 528,956 528,956
10

Discover Financial Services
Summary Historical and Pro Forma Combined Financial Data
For the Three MonthsEnded February 28, For the Years Ended November 30,
2007 2006 2006 2005 2004
(dollars in thousands)Ratios:Net interest margin . . . . . . . . . . . . . . . . . . . . . . . . . . . . . . . . . . . . 5.70% 5.43% 5.94% 5.88% 5.88%Return on equity . . . . . . . . . . . . . . . . . . . . . . . . . . . . . . . . . . . . . . 15% 25% 19% 13% 18%Return on average assets . . . . . . . . . . . . . . . . . . . . . . . . . . . . . . . 3.10% 4.42% 3.93% 2.29% 3.54%Average stockholder’s equity to average assets . . . . . . . . . . . . . . 20% 18% 21% 18% 20%Selected Statistics:Total Credit Card LoansCredit card loans—owned . . . . . . . . . . . . . . . . . . . . . . . . . . . . . . $22,520,861 $19,924,447 $ 23,646,901 $ 22,496,211 $19,723,758Average credit card loans—owned . . . . . . . . . . . . . . . . . . . . . . . $24,760,587 $21,976,158 $ 21,656,295 $ 19,931,636 $17,608,445Owned interest yield . . . . . . . . . . . . . . . . . . . . . . . . . . . . . . . . . . . 10.41% 9.87% 10.38% 10.12% 10.05%Owned interest spread . . . . . . . . . . . . . . . . . . . . . . . . . . . . . . . . . 5.22% 5.45% 5.64% 5.96% 5.93%Owned net principal charge-off rate . . . . . . . . . . . . . . . . . . . . . . . 3.77% 4.54% 3.79% 4.84% 5.53%Owned delinquency rate (over 30 days) . . . . . . . . . . . . . . . . . . . . 3.15% 2.99% 3.22% 3.69% 4.08%Owned delinquency rate (over 90 days) . . . . . . . . . . . . . . . . . . . . 1.55% 1.37% 1.53% 1.62% 1.97%Return on owned receivables . . . . . . . . . . . . . . . . . . . . . . . . . . . . 3.77% 5.56% 4.97% 2.90% 4.41%Credit card loans—managed . . . . . . . . . . . . . . . . . . . . . . . . . . . . $50,840,710 $47,825,400 $ 50,350,328 $ 46,936,274 $48,261,402Average credit card loans—managed . . . . . . . . . . . . . . . . . . . . . . $51,478,644 $47,574,515 $ 48,216,546 $ 47,330,143 $47,386,940Managed interest yield . . . . . . . . . . . . . . . . . . . . . . . . . . . . . . . . . 12.25% 12.13% 12.36% 11.72% 11.84%Managed interest spread . . . . . . . . . . . . . . . . . . . . . . . . . . . . . . . . 6.86% 7.46% 7.32% 7.82% 8.89%Managed net principal charge-off rate . . . . . . . . . . . . . . . . . . . . . 4.05% 5.06% 4.08% 5.23% 6.00%Managed delinquency rate (over 30 days) . . . . . . . . . . . . . . . . . . 3.44% 3.45% 3.50% 3.98% 4.55%Managed delinquency rate (over 90 days) . . . . . . . . . . . . . . . . . . 1.68% 1.61% 1.65% 1.75% 2.18%Return on managed receivables . . . . . . . . . . . . . . . . . . . . . . . . . . 1.82% 2.57% 2.23% 1.22% 1.64%Total Credit Card VolumeDomestic . . . . . . . . . . . . . . . . . . . . . . . . . . . . . . . . . . . . . . . . . . . . $26,880,735 $25,053,865 $102,901,893 $ 98,224,437 $94,509,183International(1) . . . . . . . . . . . . . . . . . . . . . . . . . . . . . . . . . . . . . . . . 3,578,199 1,750,085 11,881,465 5,907,089 5,077,478
Total . . . . . . . . . . . . . . . . . . . . . . . . . . . . . . . . . . . . . . . . . . . $30,458,934 $26,803,950 $114,783,358 $104,131,526 $99,586,661
Transactions Processed on Networks (000s)Discover Network . . . . . . . . . . . . . . . . . . . . . . . . . . . . . . . . . . . . . 361,700 339,522 1,399,933 1,301,024 1,226,414PULSE Network(2) . . . . . . . . . . . . . . . . . . . . . . . . . . . . . . . . . . . . 520,866 424,657 1,856,477 1,555,782 —
Total transactions processed . . . . . . . . . . . . . . . . . . . . . . . . . 882,566 764,179 3,256,410 2,856,806 1,226,414
Domestic Credit Card LoansCredit card loans—owned . . . . . . . . . . . . . . . . . . . . . . . . . . . . . . $19,636,991 $17,251,924 $ 20,694,395 $ 20,434,977 $18,606,211Average credit card loans—owned . . . . . . . . . . . . . . . . . . . . . . . $21,841,166 $19,911,585 $ 19,120,946 $ 18,644,660 $16,228,520Owned interest yield . . . . . . . . . . . . . . . . . . . . . . . . . . . . . . . . . . . 10.55% 10.04% 10.50% 10.16% 10.13%Owned interest spread . . . . . . . . . . . . . . . . . . . . . . . . . . . . . . . . . 5.37% 5.57% 5.71% 6.03% 6.09%Owned net principal charge-off rate . . . . . . . . . . . . . . . . . . . . . . . 3.43% 4.66% 3.64% 4.95% 5.75%Owned delinquency rate (over 30 days) . . . . . . . . . . . . . . . . . . . . 2.97% 2.97% 3.05% 3.69% 4.19%Owned delinquency rate (over 90 days) . . . . . . . . . . . . . . . . . . . . 1.46% 1.40% 1.44% 1.61% 2.03%Credit card loans—managed . . . . . . . . . . . . . . . . . . . . . . . . . . . . $46,266,012 $43,641,982 $ 45,706,222 $ 44,261,121 $45,690,728Average credit card loans—managed . . . . . . . . . . . . . . . . . . . . . . $46,870,259 $44,663,714 $ 44,277,249 $ 44,736,702 $45,018,288Managed interest yield . . . . . . . . . . . . . . . . . . . . . . . . . . . . . . . . . 12.45% 12.25% 12.53% 11.78% 11.91%Managed interest spread . . . . . . . . . . . . . . . . . . . . . . . . . . . . . . . . 7.03% 7.59% 7.45% 7.95% 9.06%Managed net principal charge-off rate . . . . . . . . . . . . . . . . . . . . . 3.81% 5.08% 3.96% 5.30% 6.12%Managed delinquency rate (over 30 days) . . . . . . . . . . . . . . . . . . 3.31% 3.43% 3.39% 3.98% 4.65%Managed delinquency rate (over 90 days) . . . . . . . . . . . . . . . . . . 1.63% 1.62% 1.59% 1.75% 2.24%International Credit Card Loans(1)Credit card loans—owned . . . . . . . . . . . . . . . . . . . . . . . . . . . . . . $ 2,883,870 $ 2,672,523 $ 2,952,506 $ 2,061,234 $ 1,117,547Average credit card loans—owned . . . . . . . . . . . . . . . . . . . . . . . $ 2,919,421 $ 2,064,573 $ 2,535,349 $ 1,286,976 $ 1,379,925Owned interest yield . . . . . . . . . . . . . . . . . . . . . . . . . . . . . . . . . . . 9.38% 8.16% 9.51% 9.63% 9.13%Owned interest spread . . . . . . . . . . . . . . . . . . . . . . . . . . . . . . . . . 4.14% 4.24% 5.15% 5.07% 3.87%Owned net principal charge-off rate . . . . . . . . . . . . . . . . . . . . . . . 6.29% 3.41% 4.94% 3.28% 2.94%Owned delinquency rate (over 30 days) . . . . . . . . . . . . . . . . . . . . 4.35% 3.11% 4.36% 3.78% 2.23%Owned delinquency rate (over 90 days) . . . . . . . . . . . . . . . . . . . . 2.16% 1.15% 2.16% 1.73% 0.96%Credit card loans—managed . . . . . . . . . . . . . . . . . . . . . . . . . . . . $ 4,574,698 $ 4,183,418 $ 4,644,106 $ 2,675,153 $ 2,570,674Average credit card loans—managed . . . . . . . . . . . . . . . . . . . . . . $ 4,608,384 $ 2,910,801 $ 3,939,297 $ 2,593,441 $ 2,368,652Managed interest yield . . . . . . . . . . . . . . . . . . . . . . . . . . . . . . . . . 10.25% 10.39% 10.38% 10.72% 10.62%Managed interest spread . . . . . . . . . . . . . . . . . . . . . . . . . . . . . . . . 5.16% 5.59% 5.71% 5.72% 5.57%Managed net principal charge-off rate . . . . . . . . . . . . . . . . . . . . . 6.45% 4.70% 5.45% 4.10% 3.87%Managed delinquency rate (over 30 days) . . . . . . . . . . . . . . . . . . 4.75% 3.70% 4.58% 3.95% 2.78%Managed delinquency rate (over 90 days) . . . . . . . . . . . . . . . . . . 2.25% 1.51% 2.22% 1.81% 1.22%
(1) The Goldfish and Liverpool Victoria portfolios were acquired in 2006.(2) PULSE was acquired in 2005.
11

RISK FACTORS
You should carefully consider the risks described below and all of the other information in this informationstatement in evaluating us. Our business, financial condition, cash flows and/or results of operations could bematerially adversely affected by any of these risks. The trading price of our common stock could decline due toany of these risks.
This information statement also contains forward-looking statements that involve risks and uncertainties.Our actual results could differ materially from those anticipated in these forward-looking statements as a resultof certain factors, including the risks faced by us described below and elsewhere in this information statement.See “Special Note Regarding Forward-Looking Statements.”
Risks Related to Our Business
We face competition from other credit card issuers, and we may not be able to compete effectively, whichcould result in fewer customers and lower account balances and could materially adversely affect ourfinancial condition, cash flows and results of operations.
The credit card issuing business is highly competitive, and we compete with other credit card issuers on thebasis of a number of factors, including: merchant acceptance, products and services, incentives and rewardprograms, brand, network, reputation and pricing. This competition, among other things, affects our ability toobtain applicants for our credit cards, encourage cardmembers to use our credit cards, maximize the revenuegenerated by card usage and generate cardmember loyalty and satisfaction so as to minimize the number ofcardmembers switching to other credit card brands. Competition is also increasingly based on the value providedto the cardholder by rewards programs. Many credit card issuers have instituted rewards programs that aresimilar to ours, and issuers may in the future institute rewards programs that are more attractive to cardmembersthan our programs. In addition, because most domestically issued credit cards, other than those issued byAmerican Express, are issued on the Visa and MasterCard networks, most other card issuers benefit from thedominant position and marketing and pricing power of Visa and MasterCard. If we are unable to competesuccessfully, or if competing successfully requires us to take aggressive actions in response to competitors’actions, our financial condition, cash flows and results of operations could be materially adversely affected.
We incur considerable expenses in competing with other credit card issuers, and many of our competitorshave greater scale, which may place us at a competitive disadvantage.
We incur considerable expenses in competing with other credit card issuers to attract and retaincardmembers and increase card usage. A substantial portion of these expenses relates to marketing expenditures;however, traditional customer acquisition methods have become increasingly challenging. Telemarketing hasbeen hampered by the Federal Trade Commission’s National Do Not Call Registry, which had increased to over125 million phone numbers as of June 2006. Direct mail response rates have fallen, with market researcherSynovate reporting that, in the industry, only three out of every 1,000 offers generated responses in 2005compared to approximately 28 out of every 1,000 in 1992.
Because of the highly competitive nature of the credit card issuing business and increasing marketingchallenges, a primary method of competition among credit card issuers, including us, is to offer low introductoryinterest rates and balance transfer programs that offer a favorable annual percentage rate or other financialincentives for a specified length of time on account balances transferred from another credit card. This type ofcompetition has adversely affected credit card yields, and many cardholders now frequently switch credit cardsor transfer their balances to another card. There can be no assurance that any of the expenses we incur orincentives we offer to attempt to acquire and maintain accounts and increase card usage will be effective.
Furthermore, many of our competitors are larger than we are, have greater financial resources than we doand/or have lower capital costs and operating costs than we have and expect to have, and have assets such as
12

branch locations and co-brand relationships that may help them compete more effectively. In addition, there is anincreasing trend toward consolidation among credit card issuers, resulting in even greater pooled resources. Wemay be at a competitive disadvantage as a result of the greater scale of many of our competitors.
We face competition from other operators of payment networks, and we may not be able to compete effectively,which could result in reduced transaction volume, limited merchant acceptance of our cards, limited issuanceof cards on our network by third parties and materially reduced earnings.
We face substantial and increasingly intense competition in the payments industry. We compete with otherpayment networks to attract third-party issuers to issue credit and debit cards and other card products on theDiscover and PULSE Networks. Competition with other operators of payment networks is generally based onissuer interchange fees, other economic terms, merchant acceptance and network functionality. Competition isalso based on service quality, brand image, reputation and market share.
Many of our competitors are well established, larger than we are and/or have greater financial resourcesthan we do. These competitors have provided financial incentives to card issuers, such as large cash signingbonuses for new programs, funding for and sponsorship of marketing programs and other bonuses. Visa andMasterCard have each been in existence for more than 40 years and enjoy greater merchant acceptance andbroader global brand recognition than we do. In addition, Visa and MasterCard have entered into long-termarrangements with many financial institutions that may have the effect of preventing them from issuing creditcards on the Discover Network or issuing debit cards on the PULSE Network. MasterCard recently completed aninitial public offering, which provided it with significant capital and may enhance its strategic flexibility, andVisa recently announced its intention to undertake an initial public offering. American Express is also a strongcompetitor, with international acceptance, high transaction fees and an upscale brand image.
Furthermore, as a result of their dominant market position and considerable marketing and pricing power, inrecent years Visa and MasterCard have been able to aggressively increase transaction fees charged to merchantsin an effort to retain and grow their issuer volume. If we are unable to remain competitive on issuer interchangeand other incentives, we may be unable to offer adequate pricing to third-party issuers while maintainingsufficient net revenues. At the same time, increasing the transaction fees charged to merchants in order toincrease the interchange fees payable to credit card issuers could adversely affect our effort to increase merchantacceptance of credit cards issued on the Discover Network and may cause merchant acceptance to decrease. See“—Our transaction volume is concentrated among large merchants, and a reduction in the number of, or ratespaid by, merchants that participate in the Discover Network could materially adversely affect our business,financial condition, results of operations and cash flows.” This, in turn, could adversely affect our ability toattract third-party issuers and our ability to maintain or grow revenues from our proprietary network. Similarly,the PULSE Network operates in the highly competitive PIN debit business with well established and financiallystrong network competitors (particularly Visa) that have the ability to offer more attractive economics andbundled products to financial institutions.
In addition, if we are unable to maintain sufficient network functionality to be competitive with othernetworks, our ability to attract third-party issuers and maintain or increase the revenues generated by ourproprietary card issuing business may be materially adversely affected. An inability to compete effectively withother payment networks for the reasons discussed above or any other reason could result in reduced transactionvolume, limited merchant acceptance of our cards, limited issuance of cards on our network by third parties andmaterially reduced earnings.
Our business depends on our ability to manage our credit risks, and failing to manage these risks successfullymay result in high charge-off rates or impede our growth.
We market our products to a wide range of consumers, and our success depends on our ability to continue tomanage our credit risk while attracting new cardmembers with profitable usage patterns. We select ourcardmembers, manage their accounts and establish terms and credit limits using proprietary scoring models and
13
other analytical techniques designed to set terms and credit limits such that we are appropriately compensated forthe credit risk we accept, while encouraging cardmembers to use their available credit. The models andapproaches we use to select, manage and underwrite our cardmembers may not accurately predict future charge-offs due to, among other things, inaccurate assumptions or models. While we continually seek to improve ourassumptions and models, we may make modifications that unintentionally cause them to be less predictive. Wemay also incorrectly interpret the data produced by these models in setting our credit policies. Our ability tomanage credit risk may also be adversely affected by economic conditions, legal or regulatory changes (such asbankruptcy laws, minimum payment regulations and re-age guidance), competitors’ actions and consumerbehavior, as well as inadequate collections staffing, techniques, models and vendor performance.
A cardmember's ability to repay us can be negatively impacted by changes in their payment obligationsunder nontraditional or non-conforming mortgage loans, including subprime mortgage loans. Such changes canresult from changes in economic conditions including increases in base lending rates upon which paymentobligations are based, which in turn could adversely impact the ability of our cardmembers to meet their paymentobligations to other lenders and to us and could result in higher credit losses in our portfolio.
Rising delinquencies and rising rates of bankruptcy are often precursors of future charge-offs. For instance,bankruptcy rates in the United Kingdom have increased significantly in recent years as a result of the relaxationof the bankruptcy laws, which has contributed to increases in charge-off rates in our U.K. operations. Althoughour delinquency rates and charge-off rates have generally decreased in the United States in recent years, and thenumber of bankruptcy filings has decreased following the October 2005 effective date of the new U.S.bankruptcy legislation, we expect that our loan loss rate will increase from 2006 levels. There can be noassurance that our lending standards will protect us against high charge-off levels. In addition, because animportant source of our funding is the securitization market, an increase in delinquencies and/or charge-offscould increase our cost of funds or unintentionally cause an early amortization event. See “— We may be unableto securitize our receivables at acceptable rates or at all, which could materially adversely affect our liquidity,cost of funds, reserves and capital requirements.”
We plan to expand in several card and consumer lending sectors. Areas of particular focus include: a smallbusiness card, which we launched in 2006; relaunching the Miles by Discover Card product; and prepaid cards.We also continuously refine and test our credit criteria, which results in some instances in approving applicationsthat did not previously meet our underwriting criteria. We have less experience in these areas as compared to ourtraditional products and segments, and there can be no assurance that we will be able to manage our credit risk orgenerate sufficient revenue to cover our expenses in these markets. Our failure to manage our credit risks maymaterially adversely affect our profitability and ability to grow.
Economic downturns and other conditions beyond our control could materially adversely affect our business.
Economic downturns may adversely affect consumer spending, asset values, consumer indebtedness andunemployment rates, which in turn can negatively impact our business. If general economic conditions in theUnited States or United Kingdom deteriorate or interest rates increase, the number of transactions, averagepurchase amount of transactions, or average balances outstanding on our cards may be reduced, which wouldreduce transaction fees and interest income and thereby adversely affect profitability. In addition, high levels ofunemployment, low levels of spending, recessions or other conditions, including terrorism, natural disasters orthe outbreak of diseases such as avian flu, may adversely affect the ability of cardmembers to pay amounts owedto us, which would increase delinquencies and charge-offs and could materially adversely affect our business.
Increases in interest rates could materially adversely affect our earnings.
Higher interest rates cause our interest expense to increase, as certain of our debt instruments carry interestrates that fluctuate with market benchmarks. If we are unable to pass our higher cost of funds to our customers,the increase in interest expense could materially adversely affect earnings. Some of our managed receivables bearinterest at a fixed rate or do not earn interest, and we may not be able to increase the rate on those loans to
14
mitigate our higher cost of funds. At the same time, our variable rate managed receivables, which are based on amarket benchmark, may not increase at the same rate as our floating rate debt instruments or may be subject to a cap.
Interest rates may also adversely impact our delinquency and charge-off rates. Many consumer lendingproducts bear interest rates that fluctuate with certain base lending rates published in the market, such as theprime rate and LIBOR (London Interbank Offered Rate). As a result, higher interest rates often lead to higherpayment requirements by consumers under obligations to us or other lenders, which may reduce their ability toremain current on their obligations to us and thereby lead to loan delinquencies and additions to our loan lossprovision, which could materially adversely affect our earnings.
In connection with the distribution, we will incur additional indebtedness that could restrict our operations.
In recent years, Morgan Stanley has provided a significant portion of our funding. Following thedistribution, we will finance our capital needs with third party funding. We are currently negotiating a multi-yearunsecured committed credit facility of at least $1.75 billion, which will contain customary restrictions, covenantsand events of default. See “Management’s Discussion and Analysis of Financial Condition and Results ofOperations—Liquidity and Capital Resources—Changes Related to the Distribution.” The terms of this facilityand any future indebtedness may impose various restrictions and covenants on us (such as tangible net worthrequirements) that could have adverse consequences, including,
• limiting our ability to pay dividends to our stockholders;• increasing our vulnerability to changing economic, regulatory and industry conditions;• limiting our ability to compete and our flexibility in planning for, or reacting to, changes in our
business and the industry;• limiting our ability to borrow additional funds; and• requiring us to dedicate a substantial portion of our cash flow from operations to payments on our debt,
thereby reducing funds available for working capital, capital expenditures, acquisitions and otherpurposes.
Giving effect to the debt that we expect to incur in connection with the distribution, our total combinedindebtedness will be approximately $25.3 billion, as compared to $22.3 billion at February 28, 2007. Theincrease in indebtedness primarily represents incremental deposits obtained to establish a $5 billion liquidityreserve. See “Unaudited Pro Forma Condensed Combined Financial Statements.” We may also incur additionalsubstantial indebtedness in the future.
We may be unable to securitize our receivables at acceptable rates or at all, which could materially adverselyaffect our liquidity, cost of funds, reserves and capital requirements.
The securitization of credit card receivables, which involves the transfer of receivables to a trust and theissuance by the trust of beneficial interests to third-party investors, is our largest single source of funding. Factorsaffecting our ability to securitize our credit card receivables at acceptable pricing levels, or at all, include theoverall credit quality of our receivables, negative credit ratings action affecting our asset-backed securities (orDiscover Bank), the stability of the market for securitization transactions, investor demand, and the legal,regulatory, accounting and tax requirements governing securitization transactions. In addition, future changes toStatement of Financial Accounting Standards No. 140, Accounting for Transfers and Servicing of FinancialAssets and Extinguishments of Liabilities, as amended, may make it more difficult for us to maintain saleaccounting treatment for our securitizations under GAAP or may require us to recognize securitizations on ourcombined statements of financial condition, which could substantially increase Discover Bank’s regulatorycapital requirements.
Our results of operations and financial condition could also be materially adversely affected by theoccurrence of events that could result in the early amortization of our securitization transactions. Credit cardsecuritizations are normally structured as “revolving transactions” that do not distribute to securitizationinvestors their share of monthly principal payment on the receivables during the revolving period, and instead
15
use those payments to fund the purchase of replacement receivables. The occurrence of “early amortizationevents” may result in termination of the revolving period of our securitization transactions. Early amortizationevents include, for example, insufficient cash flows in the securitized pool of receivables to meet contractualrequirements, certain breaches of representations, warranties or covenants in the agreements relating to thesecuritization, and bankruptcy or insolvency.
If we are unable to continue to securitize our credit card receivables at acceptable pricing levels, or at all,including by reason of the early amortization of any of our securitization transactions, we would seek to liquidateinvestment securities, increase bank deposits and use alternative funding sources to fund increases in loanreceivables and meet our other liquidity needs. In the event of an economic early amortization, receivables thatotherwise would have been subsequently purchased by the trust from us would instead continue to be recognizedon our combined statements of financial condition since the cash flows generated in the trust would instead beused to repay investors in the asset-backed securities. Recognizing these receivables would require us to obtainalternative funding. Our available investment securities and other alternative sources may be insufficient to meetour funding needs, which could materially adversely affect our liquidity, cost of funds, reserves and capitalrequirements.
Declines in the value of, or income earned from, our retained interests in our securitization transactions couldmaterially adversely affect our financial condition, results of operations and cash flows.
We retain interests in the assets transferred to or created in our securitization transactions and earn incomefrom these assets. The value of our retained interests and the amount of income that we earn depend on manyfactors, including, among others, the revenues, performance and credit risk of the securitized loans, which aresubject to the same risks and uncertainties as loans that we have not securitized. The value of our interests mayalso change because of changes in the assumptions used to estimate their fair value, such as market interest ratesand other conditions, increases in bankruptcy or charge-off rates, payment rates and changes in the interpretationand application of accounting rules relating to such valuation. In 2007, we expect bankruptcy receipts to risefrom the abnormally low levels experienced in 2006, and accordingly to have an adverse impact on our results ofoperations as compared to 2006. Higher bankruptcy receipts will have the effect of increasing credit losses,increasing provisions to the allowance for loan losses and decreasing excess spread projections on securitizationtransactions, thereby adversely impacting the valuation of the interest-only strip receivable. If the income that weearn from our retained interests in securitization transactions were to decrease or the value of our retainedinterests were to decrease, our financial condition, results of operations and cash flows could be materiallyadversely affected.
An inability to accept brokered deposits in the future could materially adversely affect our liquidity positionand funding costs.
The Federal Deposit Insurance Act (“FDIA”) prohibits a bank, including our subsidiaries Discover Bankand Bank of New Castle, from accepting brokered deposits or offering interest rates on any deposits significantlyhigher than the prevailing rate in its normal market area or nationally (depending upon where the deposits aresolicited), unless (1) it is well-capitalized or (2) it is adequately capitalized and receives a waiver from theFederal Deposit Insurance Corporation (“FDIC”). A bank that is adequately capitalized and that accepts brokereddeposits under a waiver from the FDIC may not pay an interest rate on any deposit in excess of 75 basis pointsover certain prevailing market rates. There are no such restrictions on a bank that is well-capitalized. WhileDiscover Bank and Bank of New Castle each met the FDIC’s definition of “well-capitalized” as of November 30,2006, there can be no assurance that they will continue to meet this definition. An inability to accept brokereddeposits in the future could materially adversely affect our liquidity position and funding costs.
We rely in part on unsecured debt for our funding and the inability to access the U.S. or U.K. debt marketscould materially adversely affect our business, financial condition and results of operations.
While our primary sources of funding are securitizations and brokered deposits, we are also dependent onaccess to the U.S. and U.K. unsecured debt markets to fund our managed receivables as well as other assets. In
16

general, the amount, type and cost of our funding directly affects the cost of operating our business and growing ourassets and is dependent upon outside factors such as our credit rating from ratings agencies. Historically we havebenefited from Morgan Stanley’s credit ratings (Morgan Stanley is rated A+ by Standard & Poor’s (“S&P”), Aa3 byMoody’s Investors Service (“Moody’s”) and AA- by Fitch Ratings (“Fitch”)). Following the announcement of thedistribution, Moody’s and Fitch placed Discover Bank’s debt ratings on negative watch. Moody’s and Fitch reportsindicated that if the distribution occurs as planned, they expect to assign a long-term investment grade rating toDiscover Bank (Baa2 deposit, Baa3 senior unsecured from Moody’s and BBB from Fitch). Discover Bank’s creditrating as a stand-alone entity from S&P is expected to be BBB. The difference in ratings categories betweenMorgan Stanley and us reflects the relative risks associated with the different businesses. While business risks arecomplex and difficult to compare between businesses as different as Morgan Stanley’s and ours, generally MorganStanley is more diversified and has greater overall scale than us. A rating is not a recommendation to purchase, sellor hold any particular security. In addition, there can be no assurance that a rating will be maintained for any givenperiod of time or that a rating will not be lowered or withdrawn in its entirety. If our ratings are for any reasonfurther reduced or we are unable to access the U.S. or U.K. unsecured debt markets for any reason, our business,financial condition and results of operations could be materially adversely affected.
In response to the exploration of the spin-off in 2005, Moody’s placed the asset-backed securities issueddomestically by the Discover Card Master Trust under review for a possible downgrade, which we believecontributed to a temporary disruption in our ability to access the securitization markets, increasing our relianceon intercompany funding and deposit markets. This disruption lasted approximately five months, at which timeMoody’s reaffirmed the ratings on the asset-backed securities.
We may be unable to increase or sustain Discover Card usage, which could impair growth in, or lead todiminishing, average balances and total revenue.
A key element of our strategy is to increase the usage of the Discover Card by our cardmembers, includingmaking it their primary card, and thereby increase our revenue from transaction and service fees and ourmanaged receivables. However, our cardmembers’ use and payment patterns may change because of social, legaland economic factors, and cardmembers may decide not to increase card usage or may decide to pay the balanceswithin the grace period to avoid finance charges. We face challenges from competing credit card products in ourattempts to increase credit card usage by our existing cardmembers. Our ability to increase cardmember usage isalso dependent on cardmember satisfaction, which may be adversely affected by factors outside of our control,including competitors’ actions. As part of our strategy to increase usage, we are seeking to increase the numberof merchants who accept cards issued on the Discover Network. If we are unable to increase merchantacceptance of our cards, our ability to grow usage of Discover Cards may be hampered. As a result of thesefactors, we may be unable to increase or sustain credit card usage, which could impair growth in, or lead todiminishing, average balances and total revenue.
We may be unable to grow earnings if we do not attract new cardmembers, or if we attract cardmembers withunfavorable spending and payment habits.
We are seeking to increase managed receivables by attracting new cardmembers who will use their DiscoverCards, meet their monthly payment obligations and maintain balances that generate interest and fee income forus. We are subject to substantial competition from other credit card issuers for these new cardmembers. We planto continue marketing the Discover Card, but we may not have adequate financial resources to permit us to incurall of the marketing costs that may be necessary to maintain or grow our managed receivables or to attract newaccounts. The spending and payment habits of these new cardmembers may not be sufficient to make theiraccounts as profitable as we expect. In addition, our risk models may not accurately predict the credit risk forthese new cardmembers, which could result in unanticipated losses in future periods. To the extent that thespending and payment habits of new cardmembers do not meet our expectations, our earnings and growth may benegatively affected.
17

Our transaction volume is concentrated among large merchants, and a reduction in the number of, or ratespaid by, merchants that participate in the Discover Network could materially adversely affect our business,financial condition, results of operations and cash flows.
Discover Card transaction volume was concentrated among our top 100 merchants in 2006. Thesemerchants may pressure us to reduce our rates by continuing to participate in the Discover Network only on thecondition that we change the terms of their economic participation. At the same time, we are subject to increasingpricing pressure from third-party issuers as a result of the continued consolidation in the banking industry, whichresults in fewer large issuers that, in turn, generally have a greater ability to negotiate pricing discounts. Inaddition, many of our merchants, primarily our small and mid-size merchants, are not contractually committed tous for any period of time and may cease to participate in the Discover Network at any time on short notice.
In addition, actual and perceived limitations on acceptance of credit cards issued on the Discover Networkcould adversely affect the use of the Discover Card by existing cardmembers and the attractiveness of theDiscover Card to prospective new cardmembers. Furthermore, we may have difficulty attracting and retainingthird-party issuers if we are unable to add and retain merchants on the Discover or PULSE Networks. As a resultof these factors, a reduction in the number of, or rates paid by, our merchants could materially adversely affectour business, financial condition, results of operations and cash flows.
We may be unable to grow earnings if we are unable to increase the number of small and mid-size merchantsthat participate in the Discover Network.
In seeking to expand our merchant acceptance among small and mid-size merchants, we have recentlystarted to use third-party acquirers and processors to obtain merchants and process payments for these merchantson an integrated basis with Visa and MasterCard payments. This strategy could have results that we do notanticipate, such as decreased revenues, higher expenses, degraded service levels and retaliatory responses fromcompetitors. There can be no assurance that the use of third-party acquirers and processors will increasemerchant acceptance among small or mid-size merchants. If we are unable to increase small and mid-sizemerchant acceptance, our ability to grow earnings could be adversely affected.
Our business, financial condition and results of operations may be adversely affected by the increasing focusof merchants on the fees charged by credit card networks.
Merchant acceptance and fees are critical to the success of both our card issuing and payment processingbusinesses. Merchants have shown increasing concern with the levels of fees charged by credit card companies,and have in the past and may in the future seek to negotiate better pricing or other financial incentives as acondition to continued participation in the Discover Network. During the past few years, merchants and theirtrade groups have filed approximately 50 lawsuits against Visa, MasterCard, American Express and their card-issuing banks, claiming that their practices toward merchants, including interchange fees, violate federal antitrustlaws. There can be no assurance that they will not in the future bring legal proceedings against other credit cardissuers and networks, including us. Merchants may also promote forms of payment with lower fees, such as PINdebit, or seek to impose surcharges at the point of sale for use of credit cards. Merchants may also route debittransactions to other networks in order to achieve more favorable pricing. The heightened focus by merchants onthe fees charged by credit card networks, including us, could lead to reduced merchant acceptance of DiscoverNetwork cards or reduced fees, either of which could adversely affect our business, financial condition andresults of operations.
Our U.K. operations are currently not profitable, and there can be no assurance when or if they will becomeprofitable.
Our U.K. operations are an important part of our business strategy, and strengthening these operations is oneof our primary goals. However, the U.K. market is currently experiencing high delinquencies and risingbankruptcy levels, compounded by changing regulations, which have resulted in losses in our U.K. operations.
18

Additionally, the United Kingdom has relatively low levels of interchange and fee income and lower net interestmargin, which has resulted in and may continue to result in insufficient revenues to compensate for the currentlevels of loan losses. Our U.K. operations also have a relatively higher cost structure given their smaller scale.
In addition, we recorded significant goodwill on our combined statements of financial condition inconnection with our acquisition of Goldfish in 2006. We may in the future be required to write down goodwillassociated with this acquisition.
Our strategy to expand our operations in the United Kingdom may also be unsuccessful for several otherreasons, including many of those that are applicable to our attempts to expand our business domestically. Inaddition to the challenging market conditions described above, U.K. and European regulators have recentlyincreased their focus on the credit card industry. There can be no assurance when or if our U.K. operations willbecome profitable.
We expect to continue to incur significant expenses in the litigation we are pursuing against Visa andMasterCard, and there can be no assurance that we will ultimately be successful in this action.
In October 2004, the DOJ prevailed in its antitrust litigation against Visa and MasterCard which challengedtheir exclusionary practices. Following this ruling, we filed a complaint against Visa and MasterCard seekingsubstantial damages for the market foreclosure caused by their anticompetitive rules. The trial date is expected tobe no later than Fall 2008. We expect to continue to incur substantial legal expenses in the litigation we arepursuing against Visa and MasterCard. Outside counsel and consultant legal expenses for this litigation wereapproximately $51 million and $8 million in 2006 and 2005, respectively, with the year-over-year increaseprimarily due to discovery-related expenses incurred in 2006. Fact discovery is scheduled to be completed inMay 2007 and as such, 2007 expenses associated with this litigation are expected to be lower than 2006expenses. Furthermore, there can be no assurance that we will be successful in recovering any damages in thisaction. Upon successful resolution of the litigation, after expenses, we will be required to pay Morgan Stanley thefirst $700 million of value of cash or non-cash proceeds (increased at the rate of 6% per annum until paid in full)(the “minimum proceeds”), plus 50% of any proceeds in excess of $1.5 billion, subject to certain limitations anda maximum potential payment to Morgan Stanley of $1.5 billion. All payments by Discover to Morgan Stanleywill be net of taxes payable by Discover with respect to such proceeds. If, in connection with or following achange of control of Discover, the litigation is settled for an amount less than the minimum proceeds, Discoverwill be required to pay Morgan Stanley an amount equal to the minimum proceeds. As a result of our agreementto pay the value of non-cash proceeds, we may be required to pay amounts to Morgan Stanley in excess of cashreceived in connection with the litigation. The value of non-cash proceeds will be determined by an independentthird party.
Visa and MasterCard may enact additional restrictions on issuing banks, merchants or merchant acquirersthat materially adversely affect the Discover or PULSE Networks, or the Discover Card issuing business.
Visa and MasterCard aggressively seek to protect their networks from competition and have used their rulesand policies to do so. For example, in the past they enacted and enforced rules that prohibited their memberbanks from issuing cards on competing payment networks such as Discover. These rules were ultimately found toviolate the antitrust laws. They have adversely affected our business in the past, and they may have lingeringeffects going forward. Visa and MasterCard also may enact new rules or enforce other rules in the future,including limiting the ability of issuing banks to use the PULSE Network, which may materially adversely affectour ability to compete.
If fraudulent activity associated with our cards increases, our brands could suffer reputational damage, theuse of our cards could decrease and our fraud losses could be materially adversely affected.
We are subject to the risk of fraudulent activity associated with merchants, cardmembers and other thirdparties handling cardmember information. Credit and debit card fraud, identity theft and related crimes are
19

prevalent and perpetrators are growing ever more sophisticated. Our financial condition, the level of our fraudcharge-offs and other results of operations could be materially adversely affected if fraudulent activity were tosignificantly increase. In addition, significant increases in fraudulent activity could lead to regulatoryintervention (such as mandatory card reissuance) and reputational and financial damage to our brands, whichcould negatively impact the use of our cards and thereby have a material adverse effect on our business.
If our security systems, or those of merchants, merchant acquirers or other third parties containinginformation about cardholders, are compromised, we may be subject to liability and damage to our reputation.
Our security protection measures, including the security of transaction information processed on oursystems or the systems or processing technology of third parties participating in the Discover or PULSENetworks, may not be sufficient to protect the confidentiality of information relating to cardholders ortransactions processed on the Discover or PULSE Networks. Cardholder data is also stored on systems of third-party service providers and merchants that may not have adequate security systems. Third-party carriers regularlytransport cardholder data, and they may lose sensitive cardholder information. Unauthorized access to theDiscover or PULSE Networks or any other Discover information systems potentially could jeopardize thesecurity of confidential information stored in our computer systems or transmitted by our cardmembers or others.If our security systems or those of merchants, processors or other third-party service providers are compromisedsuch that this confidential information is disclosed to unauthorized parties, we may be subject to liability. Thepreventive measures we take to address these factors are costly, and may become more costly in the future.Moreover, these measures may not protect us from liability, which may not be adequately covered by insurance,or from damage to our reputation.
The financial services and payment services industries are rapidly evolving, and we may be unsuccessful inintroducing new products or services in response to this evolution.
The financial services and payment services industries experience constant and significant technologicalchanges, such as continuing development of technologies in the areas of smart cards, radio frequency andproximity payment devices, electronic commerce and mobile commerce, among others. The effect oftechnological changes on our business is unpredictable.
We depend in part on third parties for the development of and access to new technologies. We expect thatnew services and technologies relating to the payments business will continue to appear in the market, and thesenew services and technologies may be superior to, or render obsolete, the technologies that we currently use inour card products and services. As a result, our future success is in part dependent on our ability to identify andadapt to technological changes and evolving industry standards and to provide payment solutions for ourcardmembers and merchant and financial institution customers.
Difficulties or delays in the development, production, testing and marketing of new products or servicesmay be caused by a number of factors including, among other things, operational, capital and regulatoryconstraints. The occurrence of such difficulties may affect the success of our products or services, anddeveloping unsuccessful products and services could result in financial losses, as well as decreased capitalavailability. In addition, the new products and services offered may not be attractive to our cardmembers andmerchant and financial institution customers.
If key technology platforms such as our transaction authorization and settlement systems become obsolete, orif we encounter difficulties processing transactions efficiently or at all, our revenue or results of operationscould be materially adversely affected.
Our transaction authorization and settlement systems may encounter service interruptions due to system orsoftware failure, fire, natural disasters, power loss, disruptions in long distance or local telecommunicationsaccess, terrorism or accident. Some of our transaction processing systems are operated at a single facility and
20

could be subject to service interruptions in the event of failure. Our services could be disrupted by a naturaldisaster or other problem at any of our primary or back-up facilities or our other owned or leased facilities.
We also depend on third-party service providers for the timely transmission of information across our datatransportation network and for other telecommunications and technology services, including ancillary transactionprocessing services for the PULSE Network. Regardless of whether as a result of natural disaster, operationaldisruption, terrorism, termination of its relationship with us, or any other reason, if a service provider fails toprovide the communications capacity or deliver services that we require or expect, the failure could interrupt ourservices and operations and hamper our ability to process cardholders’ transactions in a timely and accuratemanner or to maintain thorough and accurate records of those transactions. Such a failure could adversely affectthe perception of the reliability of the Discover and PULSE Networks and the quality of our brands, and couldmaterially adversely affect our revenues or results of operations.
Merchant defaults may adversely affect our business, financial condition, cash flows and results of operations.
As an issuer and merchant acquirer in the United States on the Discover Network, and an issuer in theUnited Kingdom on the MasterCard and Visa networks, we may be contingently liable for certain disputed creditcard sales transactions that arise between cardholders and merchants. If a dispute is resolved in the cardholder’sfavor, we will cause a credit or refund of the amount to be issued to the cardholder and charge back thetransaction to the merchant. If we are unable to collect this amount from the merchant or a third-party acquirer,we will bear the loss for the amount credited or refunded to the cardholder. Where the purchased product orservice is not provided until some later date following the purchase, such as an airline ticket, the likelihood ofpotential liability increases. See Note 20: Commitments, Contingencies and Guarantees to the audited combinedfinancial statements and Note 7: Commitments, Contingencies and Guarantees to the unaudited condensedcombined financial statements.
Our success is dependent, in part, upon our executive officers and other key personnel, and the loss of keypersonnel could materially adversely affect our business.
Our success depends, in part, on our executive officers and other key personnel. Our senior managementteam has significant industry experience and would be difficult to replace. Moreover, our senior managementteam is relatively small and we believe we are in a critical period of competition in the financial services andpayments industry. The market for qualified individuals is highly competitive, and we may not be able to attractand retain qualified personnel or candidates to replace or succeed members of our senior management team orother key personnel. The loss of key personnel could materially adversely affect our business.
We may be unsuccessful in protecting our intellectual property, including our brands.
The Discover, Goldfish and PULSE brands are very important assets, and our success is dependent on ourability to protect these and our other intellectual property. We may not be able to successfully protect ourintellectual property. If others misappropriate, use or otherwise diminish the value of our intellectual property,our business could be adversely affected.
Increased usage by consumers of credit sources such as home equity loans and mortgage refinancings insteadof credit card borrowings could adversely affect our business.
During the last few years, lower interest rates and other factors have led to increased availability toconsumers of credit sources such as home equity loans and mortgage refinancings at comparatively attractiveinterest rates. These and other options for consumer credit compete with our card products as alternative sourcesfor consumer borrowing, as consumers may finance expenditures or refinance account balances with thesealternative sources of credit. Increased usage by consumers of such alternative sources of credit could adverselyaffect our businesses.
21

Acquisitions that we pursue could disrupt our business and harm our financial condition.
We may consider or undertake strategic acquisitions of businesses, products or technologies. If we do so, wemay not be able to successfully finance or integrate any such businesses, products or technologies. In addition,the integration of any acquisition may divert management’s time and resources from our core business anddisrupt our operations. We may allocate resources, such as time and money, on projects that do not increase ourearnings. To the extent we pay the purchase price of any acquisition in cash, it would reduce our cash balances;similarly, if the purchase price is paid with our stock, it could be dilutive to our stockholders.
We are subject to regulation by a number of different regulatory agencies, which have broad discretion torequire us to alter our operations in ways that could adversely affect our business or subject us to penalties fornoncompliance.
We must comply with an array of banking and consumer lending laws and regulations at the state, federal,U.K. and European levels, and these laws and regulations apply to almost every aspect of our business. We aresubject to regulation and regular examinations by the FDIC, the Office of the Delaware State Bank Commissionerand the Financial Services Authority of the United Kingdom (“FSA”). In addition, we are subject to regulation bythe Federal Reserve Board, the Federal Trade Commission, state banking regulators and European regulators. Fromtime to time, these regulations and regulatory agencies have required us to alter certain of our operating practices,and may require us to do the same in the future. Our ability to introduce new products may be impaired or delayedas a result of regulatory review or failure to obtain required regulatory approvals. We conduct our businessprimarily through our banks, and various federal, state and European regulators have broad discretion to imposerestrictions on our operations. U.S. federal and state consumer protection laws and rules, and laws and rules offoreign jurisdictions where we conduct business limit the manner and terms on which we may offer and extendcredit. Failure to comply with these laws and regulations could lead to consequences such as financial, structural,reputational and operational penalties, including receivership. In addition, efforts to abide by these laws andregulations may increase our costs of operations or limit our ability to engage in certain business activities,including affecting our ability to generate or collect receivables from cardmembers.
Changes in regulations, or the application thereof, may adversely affect our business, financial condition andresults of operations.
Periodically, regulatory authorities may enact new laws or amend existing laws to further regulate theindustries in which we operate. Such new laws or rules could impose limits on the amount of interest or fees wecan charge, curtail our ability to collect on account balances, increase compliance costs or materially affect us orthe credit card industry in some other manner. For instance, in the past we have been obligated by industry-wideregulatory guidance to change our re-age policy to alter the terms under which delinquent accounts are returnedto a current status, which negatively affected our charge-off and delinquency rates. Also, in response to industry-wide regulatory guidance, we increased minimum payment requirements on certain credit card loans andmodified our overlimit fee policies and procedures to stop charging such fees for accounts meeting specificcriteria, which have impacted, and we believe will continue to negatively impact, balances of credit card loansand related interest and fee revenue and charge-offs. We cannot predict whether any additional or similarregulatory changes will occur in the future.
Members of Congress are currently holding hearings on certain practices in the credit card industry,including those relating to grace periods, two-cycle billing method (which we utilize on most of our products),interest rates and fees. It is not clear at this time whether new limitations on credit card practices will be adoptedby Congress or at the state level and, if adopted, what impact such new limitations would have on us. In addition,the laws governing bankruptcy and debtor relief in the United States, the United Kingdom or other countrieswhere we have cardmembers, could also change, making it more expensive or more difficult for us to collectfrom our cardmembers. Also, Congress may move to regulate holding companies that own depositoryinstitutions, such as us, which could result in additional complexity and expense. Furthermore, various federaland state agencies and standard-setting bodies may, from time to time, enact new or amend existing accountingrules or standards that could impact our business practices or funding transactions.
22
Regulation of the credit card industry, including regulation applicable to Discover Card and merchants thataccept it, has expanded significantly in recent years. For instance, financial institutions, including us, wererequired to implement an enhanced anti-money laundering program in 2002 pursuant to the USA PATRIOT Act.Various U.S. federal and state regulatory agencies and state legislatures are considering new legislation orregulations relating to the use of credit cards to purchase online prescription drugs and to finance Internetgambling, patent reform, identity theft, account maintenance guidelines, privacy, disclosure rules, data securityand marketing that could have a direct effect on us and our merchant and financial institution customers.
In the United Kingdom, during the last three years there have been increasing regulatory initiatives withrespect to late and overlimit fees, interchange fees and the sale of retail insurance products, a relaxation ofbankruptcy laws and an increase in industry-wide consumer protection measures. We expect that these initiativesand measures will continue to increase our compliance costs and the risk of consumer complaints, litigation andregulatory inquiries, as well as materially adversely affect the economics of our business.
Current and proposed regulation addressing consumer privacy and data use and security could inhibit thenumber of payment cards issued and increase our costs.
Regulatory pronouncements relating to consumer privacy, data use and security affect our business. In theUnited States, we are subject to the Federal Trade Commission’s and the banking regulators’ informationsafeguard rules under the Gramm-Leach-Bliley Act. The rules require that financial institutions (including us)develop, implement and maintain a written, comprehensive information security program containing safeguardsthat are appropriate to the financial institution’s size and complexity, the nature and scope of the financialinstitution’s activities, and the sensitivity of any customer information at issue. Both the United States and theUnited Kingdom have experienced a heightened legislative and regulatory focus on data security, includingrequiring consumer notification in the event of a data breach. In the United States, there are a number of billspending in Congress and in individual states, and there have been numerous legislative hearings focusing onthese issues. In addition, a number of states have enacted security breach legislation requiring varying levels ofconsumer notification in the event of certain types of security breaches, and several other states are consideringsimilar legislation. In the United Kingdom, there are detailed regulations on data privacy under the EuropeanCommission Data Protection Directive (Directive 95/46/EC) and the U.K. Data Protection Act of 1998, whichare enforced by the Information Commissioner, the United Kingdom’s privacy regulator.
Regulation of privacy and data use and security may cause an increase in the costs to issue payment cardsand/or may decrease the number of our cards that we or third parties issue. New regulations in these areas mayalso increase our costs to comply with such regulations, which could materially adversely affect our earnings. Inaddition, failure to comply with the privacy and data use and security laws and regulations to which we aresubject, including by reason of inadvertent disclosure of confidential information, could result in fines, sanctionsor other penalties and loss of consumer confidence, which could materially adversely affect our results ofoperations, overall business and reputation.
Legislation or regulation could be enacted requiring us to hold higher levels of capital, which we may not beable to obtain and which would reduce our return on capital.
Discover Bank and Bank of New Castle are subject to capital, funding and liquidity requirements prescribedby statutes, regulation and orders. If new legislation or regulations are enacted that increase the levels ofregulatory capital that are required, we may be required to obtain additional capital. In addition, regulators havebroad discretion to impose additional capital and other requirements on us, including imposing restrictions on theability of our regulated subsidiaries to pay dividends. Our ability to obtain additional capital would be dependentupon, among other things, general economic conditions, our financial performance and prospects, and our abilityand willingness to make capital contributions to Discover Bank and Bank of New Castle. If we were required toincrease capital for Discover Bank or Bank of New Castle, it would have the effect of reducing our return oncapital. In addition, if Discover Bank and Bank of New Castle were to fail to meet these regulatory capitalrequirements, it would become subject to restrictions that could materially adversely affect our ability to conductnormal operations.
23

Litigation and regulatory actions could subject us to significant fines, penalties and/or requirements resultingin increased expenses.
Businesses in the credit card industry have historically been subject to various significant legal actions,including class action lawsuits. Many of these actions have included claims for substantial compensatory and/orpunitive damages or claims for indeterminate amounts of damages. While we have historically relied on ourarbitration clause in agreements with cardmembers, which has limited our exposure to consumer class actionlitigation, there can be no assurance that we will continue to be successful in enforcing our arbitration clause inthe future or that we will not be subject to significant legal actions such as those to which some of ourcompetitors have been subject. In addition, we may be involved in various actions or proceedings brought bygovernmental regulatory agencies in the event of noncompliance with laws or regulations, which could subject usto significant fines, penalties and/or requirements resulting in increased expenses.
Risks Related to Our Separation from and Relationship with Morgan Stanley
After our separation from Morgan Stanley, our cost of funding will increase and our liquidity may decrease.
In recent years, Morgan Stanley has provided a significant portion of our funding and is not expected tocontinue to do so following the distribution. As of February 28, 2007, we had approximately $22.3 billion ofindebtedness outstanding, of which approximately $6.5 billion was funding sourced through Morgan Stanley. Weare expected to have lower credit ratings and more constrained liquidity than our current parent company,Morgan Stanley. A credit ratings downgrade to below investment grade would reduce our investor base andincrease our cost of funding. Our liquidity may also decrease, and we may be less able to withstand a liquiditystress event. We may also face additional challenges in the future, including more limited capital resources toinvest in or expand our businesses. See “Arrangements Between Us and Morgan Stanley.”
As part of the separation from Morgan Stanley, we will refinance existing intercompany funding and makecertain payments to Morgan Stanley.
In connection with the distribution, we expect to replace funding provided through Morgan Stanleyintercompany arrangements, which totaled $6.5 billion at February 28, 2007, with alternative sources at marketrates available to us, including certificates of deposit, external deposits from broker-dealers, asset-backedfinancing and unsecured long-term debt. We also expect to settle any intercompany payables with MorganStanley, which amounted to $200 million as of February 28, 2007. If we are unable to replace the fundingsourced through Morgan Stanley, our financial condition and results of operations would be negatively affected.
In addition, to the extent the capital on our combined statements of financial condition exceeds our capitalrequirements prior to the distribution as determined by us and Morgan Stanley, such excess amounts will bedistributed to Morgan Stanley in the form of a dividend prior to the distribution.
For additional information regarding our anticipated financing arrangements and payments to MorganStanley, see “Unaudited Pro Forma Condensed Combined Financial Statements” and “Management’s Discussionand Analysis of Financial Condition and Results of Operations—Liquidity and Capital Resources.”
Our historical financial results are as a business segment of Morgan Stanley and therefore may not berepresentative of our results as a separate, stand-alone company.
The historical financial information we have included in this information statement has been derived fromMorgan Stanley’s consolidated financial statements and does not necessarily reflect what our financial condition,results of operations or cash flows would have been had we operated as a separate, stand-alone company duringthe periods presented. The historical costs and expenses reflected in our audited combined financial statementsinclude an allocation for certain corporate functions historically provided by Morgan Stanley, including general
24
corporate expenses, employee benefits and incentives. These allocations were based on what we and MorganStanley considered to be reasonable reflections of the historical utilization levels of these services required insupport of our business. The historical information does not necessarily indicate what our results of operations,financial condition, cash flows or costs and expenses will be in the future. Our pro forma adjustments reflectchanges that may occur in our funding and operations as a result of the separation. However, we cannot assureyou that these adjustments will reflect our costs as a publicly traded, stand-alone company. For additionalinformation, see “Management’s Discussion and Analysis of Financial Condition and Results of Operations,”“Selected Historical and Pro Forma Combined Data,” “Unaudited Pro Forma Condensed Combined FinancialStatements” and the notes to those statements included elsewhere in this information statement.
The obligations associated with being a public company will require significant resources and managementattention.
In connection with the distribution, we will become subject to the reporting requirements of the SecuritiesExchange Act of 1934, as amended (the “Exchange Act”), and the Sarbanes-Oxley Act of 2002 (the “Sarbanes-Oxley Act”). The Exchange Act requires that we file annual, quarterly and current reports with respect to ourbusiness and financial condition. The Sarbanes-Oxley Act requires, among other things, that we establish andmaintain effective internal controls and procedures for financial reporting. All of the procedures and practicesrequired as a subsidiary of Morgan Stanley were previously established but we will have additional proceduresand practices to establish as a separate, stand-alone public company. As a result, we will incur significant legal,accounting and other expenses that we did not previously incur. Furthermore, the need to establish the corporateinfrastructure demanded of a public company may divert management’s attention from implementing our growthstrategy, which could prevent us from improving our business, results of operations and financial condition. Wehave made, and will continue to make, changes to our internal controls and procedures for financial reporting andaccounting systems to meet our reporting obligations. However, the measures we take may not be sufficient tosatisfy our obligations as a public company. In addition, we cannot predict or estimate the amount of additionalcosts we may incur in order to comply with these requirements.
Section 404 of the Sarbanes-Oxley Act requires annual management assessments of the effectiveness of ourinternal control over financial reporting, starting with the second annual report that we file with the SEC, and, inthe annual report for the next succeeding year, a report by our independent auditors addressing such assessments.However, if we determine that we are eligible to use, and decide during 2007 to file, a short form registrationstatement, we will be required to comply with Section 404 as of November 30, 2007. In connection with theimplementation of the necessary procedures and practices related to internal controls over financial reporting, wemay identify deficiencies that we may not be able to remediate in time to meet the deadline imposed by theSarbanes-Oxley Act for compliance with the requirements of Section 404. We will be unable to issue securitiesin the public markets through the use of a shelf registration statement if we are not in compliance withSection 404. In addition, failure to achieve and maintain an effective internal control environment could have amaterial adverse effect on our business and stock price.
After our separation from Morgan Stanley, we may experience increased costs resulting from a decrease inthe purchasing power and other operational efficiencies we currently have due to our association withMorgan Stanley.
We have been able to take advantage of Morgan Stanley’s purchasing power in procuring goods, technologyand services, including insurance, employee benefit support and audit services, and as a smaller separate, stand-alone company, we may be unable to obtain goods, technology and services at prices and on terms as favorableas those available to us prior to the separation, which could have a material adverse effect on our business,financial condition, cash flows and results of operations. Our tax liability may also increase due to increased stateincome taxes in the jurisdictions where combined filings were previously made with Morgan Stanley.
25
In connection with our separation from Morgan Stanley, we will assume past, present and future liabilitiesrelated to our business, and will enter into agreements relating to the ongoing provision of services and othermatters which may be on terms less favorable to us than if they had been negotiated with another party.
Pursuant to certain agreements we will enter into with Morgan Stanley prior to the distribution, we willagree to indemnify Morgan Stanley for, among other matters, past, present and future liabilities related to ourbusiness. Such liabilities will include unknown liabilities, which could be significant.
We will enter into these agreements and other agreements relating to the ongoing provision of services andother matters with Morgan Stanley while still a wholly-owned subsidiary of Morgan Stanley. Accordingly, theterms of those agreements may not reflect those that would have been reached with another party. If theseagreements were to be entered into with another party, we may have obtained more favorable terms than underthese agreements.
We must abide by certain restrictions to preserve the tax treatment of the distribution and we must indemnifyMorgan Stanley for taxes resulting from certain actions we take that cause the distribution to fail to qualify asa tax-free transaction.
Morgan Stanley has received a ruling from the Internal Revenue Service that, based on customaryrepresentations and qualifications, the distribution will be tax-free to Morgan Stanley stockholders for U.S.federal income tax purposes. These representations include representations as to the satisfaction of certainrequirements that must be met in order for the distribution to qualify for tax-free treatment under the InternalRevenue Code of 1986, as amended (the “Code”), and state law. If any of the representations and assumptionsupon which the ruling is based is untrue or incomplete in any material respect, Morgan Stanley may not be ableto rely upon the ruling.
If the distribution were not to qualify for tax-free treatment under sections 355, 368 and related provisionsof the Code, Morgan Stanley would recognize taxable gain equal to the excess of the fair market value of ourstock over Morgan Stanley’s tax basis in our stock. Under certain circumstances, we would be required under theU.S. tax sharing agreement to be entered into between Morgan Stanley and us to indemnify Morgan Stanley forall or a portion of this liability. In addition, each holder who receives our common stock in the distribution wouldbe treated as receiving a taxable distribution in an amount equal to the fair market value of our common stockreceived.
Even if the distribution otherwise qualifies as a tax-free distribution under the Code, current tax lawgenerally creates a presumption that the distribution would be taxable to Morgan Stanley (but not to itsstockholders) if we engage in, or enter into an agreement to engage in, a transaction that would result in a 50% orgreater change, by vote or by value, in our stock ownership during the four-year period beginning on the date thatbegins two years before the distribution date, unless it is established that the transaction is not pursuant to a planor series of transactions related to the distribution. Treasury regulations currently in effect generally provide thatwhether an acquisition transaction and a distribution are part of a plan is determined based on all of the facts andcircumstances including, but not limited to, specific factors listed in the regulations. In addition, the regulationsprovide several “safe harbors” for acquisition transactions that are not considered to be part of a plan.
Under the U.S. tax sharing agreement to be entered into between Morgan Stanley and us, for a period of twoyears following the distribution, generally we may not take certain actions unless Morgan Stanley provides uswith prior written consent for such action, or we provide Morgan Stanley with a tax ruling or rulings, or anunqualified opinion of counsel, in each case acceptable to Morgan Stanley, to the effect that the action will notaffect the tax-free nature of the separation and distribution, but we will remain liable for any taxes and otherliabilities imposed as a result of the separation and distribution failing to qualify as a tax-free transaction, as aresult of such action. These restrictions may prevent us from entering into strategic or other transactions whichmight be advantageous to us or to our stockholders, such as issuing equity securities to satisfy our financingneeds, acquiring businesses or assets by issuing equity securities, or mergers or other business combinations. Foradditional information, see “Arrangements Between Us and Morgan Stanley—Tax Sharing Agreements.”
26

Our ability to operate our business effectively may suffer if we do not, quickly and cost effectively, establishour own financial, administrative and other support functions to operate as a stand-alone company.
Historically, we have relied on certain financial, administrative and other resources of Morgan Stanley tooperate our business. In conjunction with our separation from Morgan Stanley, we will need to enhance our ownfinancial, administrative and other support systems or contract with third parties to replace Morgan Stanley’ssystems. We will also need to rapidly establish our own accounting and auditing policies and systems on a stand-alone basis.
Morgan Stanley has performed many important corporate functions for our operations, including portions ofhuman resources, information technology, accounting, office space leasing, corporate services and treasury. Weestimate the annual costs associated with replacing these functions and establishing our own infrastructure relatedthereto, to be in the range of $50 million to $60 million. See “Unaudited Pro Forma Condensed CombinedFinancial Statements.” Prior to the distribution, we will enter into agreements with Morgan Stanley under whichMorgan Stanley will provide some of these services to us on a transitional basis, for which we will pay MorganStanley. See “Arrangements Between Us and Morgan Stanley” for a description of these arrangements. Upon theoccurrence of certain events, including a change of control, Morgan Stanley may terminate these services. Theseservices may not be sufficient to meet our needs and, after these agreements with Morgan Stanley expire or areterminated, we may not be able to replace these services at all or obtain these services at acceptable prices andterms. Any failure or significant downturn in our own financial or administrative policies and systems or inMorgan Stanley’s financial or administrative policies and systems during the transitional period could impact ourresults and could materially harm our business, financial condition and results of operations.
In the United Kingdom, we have shared a brand and bank charter with Morgan Stanley, and our primarycard brand is “Morgan Stanley.” Starting at the time of distribution, we will have a limited right to use theMorgan Stanley brand for three years, following which we will not be able to use this brand. We expect ourprimary brand in the United Kingdom to be Goldfish, and we will also utilize other brands. Transitioning to anew brand will result in increased marketing and transitional costs and may result in customer attrition.
Risks Related to the Distribution
Because there has not been any public market for our common stock, the market price and trading volume ofour common stock may be volatile.
Prior to the distribution, there has been no public market for our common stock. Although our commonstock has been authorized for listing on the New York Stock Exchange, an active public market for our commonstock may not develop. The market price of our common stock could be subject to significant fluctuations due tofactors such as:
• actual or anticipated fluctuations in our financial condition or quarterly or annual results of operations;
• success of our operating strategies and perceived prospects and the financial services and paymentservices industries in general;
• realization of any of the risks described in this section;
• failure to meet securities analysts’ expectations;
• the depth and liquidity of the market for our common stock;
• our dividend policy;
• decline in the stock prices of peer companies; and
• general economic, industry and market conditions.
27
As a result of these factors, the combined trading prices of Discover common stock and Morgan Stanleycommon stock after the distribution may be less than, equal to or greater than the trading price of Morgan Stanleycommon stock prior to the distribution.
Substantial sales of our common stock could occur in connection with the distribution, which could cause ourstock price to decline.
Based on the distribution ratio and the number of shares of Morgan Stanley common stock outstanding as ofMarch 31, 2007, we expect that immediately following the distribution, there will be approximately 527 millionshares of Discover common stock outstanding which may generally be sold in the public markets. Some MorganStanley stockholders who receive shares of Discover common stock in connection with the distribution may selltheir Discover shares at any time following the distribution for a number of reasons, including the preference toconcentrate their security holdings in financial services firms such as Morgan Stanley instead of credit card andpayment services companies such as Discover. In addition, index funds tied to the Standard & Poor’s 500 Indexand other indices hold shares of Morgan Stanley common stock and will likely be required to sell their Discovershares to the extent Discover is not included in these indices. The sale of significant amounts of Discovercommon stock, or the perception that such sales will occur, may cause our stock price to decline.
Certain provisions of our charter documents and U.S. Federal and Delaware law may make it difficult forstockholders to change the composition of our board of directors and may discourage hostile takeover attemptsthat some of our stockholders may consider to be beneficial.
Certain provisions of our amended and restated certificate of incorporation and bylaws could have the effectof delaying or preventing changes in control if our board of directors determines that such changes in control arenot in the best interests of us and our stockholders. These provisions include, among other things, the following:
• stockholders may not use cumulative voting in the election of directors;
• our board of directors will have the ability to issue shares of preferred stock and to determine the priceand other terms, including preferences and voting rights, of those shares without stockholder approval;
• stockholder action may be taken only at a special or regular meeting;
• stockholders may not call a special meeting of stockholders;
• advance notice procedures for nominating candidates to our board of directors or presenting matters atstockholder meetings; and
• any amendment to our bylaws requires the approval of either a majority of our board of directors orholders of at least 80% of the votes entitled to be cast by the outstanding capital stock in the election ofour board of directors.
While these provisions have the effect of encouraging persons seeking to acquire control of our company tonegotiate with our board of directors, they could enable our board of directors to hinder or frustrate a transactionthat some, or a majority, of our stockholders might believe to be in their best interests and, in that case, mayprevent or discourage attempts to remove and replace incumbent directors. Moreover, because we areincorporated in Delaware, we are governed by the provisions of Section 203 of the General Corporation Law ofthe State of Delaware, which prohibits a person who owns in excess of 15% of our outstanding voting stock frommerging or combining with us for a period of three years after the date of the transaction in which the personacquired in excess of 15% of our outstanding voting stock, unless the merger or combination is approved in aprescribed manner. These provisions would apply even if the proposed merger or acquisition could be consideredbeneficial by some stockholders. For more information, see “Description of Capital Stock—Anti-TakeoverEffects of Our Amended and Restated Certificate of Incorporation and Bylaws and Delaware Law.” In addition,certain acquisitions of our stock may be subject to regulatory approval or notice under U.S. Federal or Delawarelaw. See “Business—Regulatory Matters—Bank Regulation—Acquisition of Control.”
28

SPECIAL NOTE REGARDING FORWARD-LOOKING STATEMENTS
We have made forward-looking statements in this information statement, including under “Summary,”“Risk Factors,” “Management’s Discussion and Analysis of Financial Condition and Results of Operations,”“Business” and elsewhere. These forward-looking statements include statements regarding both us specificallyand the industries in which we operate generally. Statements that include words such as “expect,” “intend,”“plan,” “believe,” “project,” “anticipate,” “seek,” “will” and similar statements of a future or forward-lookingnature identify forward-looking statements for purposes of the U.S. federal securities laws or otherwise. Thesestatements are subject to risks and uncertainties and include any statements that are not historical factors andstatements regarding our financial position, business strategy and other plans and objectives for future operations.Although we believe that these statements are based on reasonable assumptions, they are subject to numerousfactors, risks and uncertainties that could cause actual outcomes and results to be materially different from thoseindicated in such statements.
These factors include those listed under “Risk Factors,” and also include, but are not limited to, thefollowing:
• the impact of our separation from Morgan Stanley;
• our ability to attract and retain employees;
• the effect of political, economic and market conditions and geopolitical events;
• changes in economic variables, such as the number and size of personal bankruptcy filings, the rate ofunemployment and the levels of consumer confidence and consumer debt;
• the level and volatility of equity prices, commodity prices and interest rates, currency values,investments and other market indices;
• the availability and cost of funding and capital;
• the actions and initiatives of current and potential competitors;
• the impact of current, pending and future legislation, regulation and regulatory and legal actions;
• material security breaches of key systems;
• unforeseen and catastrophic events;
• unanticipated developments relating to lawsuits, investigations or similar matters;
• investor sentiment;
• our reputation; and
• the potential effects of technological changes.
The foregoing review of important factors should not be construed as exclusive and should be read inconjunction with the other cautionary statements that are included in this information statement. These factorsexpressly qualify all subsequent oral and written forward-looking statements attributable to us or persons actingon our behalf. Except for any ongoing obligations to disclose material information as required under U.S. federalsecurities laws, we do not have any intention or obligation to update forward-looking statements after wedistribute this information statement, whether as a result of new information, future developments or otherwise.
29

THE DISTRIBUTION
Background and Reasons for the Distribution
On December 19, 2006, Morgan Stanley announced that its board of directors had approved the distributionof our common stock to its stockholders in a tax-free spin-off. Morgan Stanley has received a ruling from theInternal Revenue Service that, based on customary representations and qualifications, the distribution will be tax-free to Morgan Stanley stockholders for U.S. federal income tax purposes. Morgan Stanley is committed toperiodic strategic reviews of its businesses. In December 2006, given record results and significant momentumin both its securities and cards and payments businesses, Morgan Stanley concluded that the two businesses couldbest execute their respective growth strategies as two stand-alone, well-capitalized companies with independentboards focused on enhancing stockholder value. Discover delivered record revenues (net interest income plusother income) and net income in 2006 and since the strategic review in 2005 at which time Morgan Stanleydecided not to pursue a spin-off of Discover, it made considerable progress on its critical strategic initiativesand has begun to lay a strong foundation for future growth. We believe that our separation from Morgan Stanleywill enhance stockholder value by creating numerous opportunities and benefits, including the following:
• Fit and focus. Discover and Morgan Stanley management will be able to more clearly focus theirefforts on their respective strategic priorities. Discover will be able to continue building its strongbrand adding scale through new products and pursuing opportunities in payments. Morgan Stanley willbe able to focus on priorities within its institutional securities, global wealth management group andasset management segments.
• Enhancing competitive position. Discover and Morgan Stanley expect that the separation of Discoverwill eliminate the possibility that Morgan Stanley or Discover will be placed at a competitivedisadvantage relative to their peers because potential clients and strategic partners view Discover orMorgan Stanley, respectively, as a competitor.
• Increasing our ability to attract and retain employees. We believe that incentive compensationarrangements for key employees, directly related to the market performance of our common stock, willprovide enhanced incentives for performance. The distribution will enable us to offer our keyemployees equity-based compensation directly linked to the performance of our business, which weexpect to enhance our ability to attract and retain qualified personnel.
• Improving ability to pursue strategic transactions. We expect that having a more focused equitycurrency will improve our ability to pursue strategic initiatives, including acquisitions, joint venturesand investments, subject to certain limitations under the Internal Revenue Code, as described belowunder “—Effect of Certain Acquisitions of Morgan Stanley Common Stock or Our Common Stock.”
Manner of Effecting the Distribution
The general terms and conditions of the distribution will be set forth in the separation and distributionagreement to be entered into by Morgan Stanley and us. For a description of the expected terms of thatagreement, see “Arrangements Between Us and Morgan Stanley—Separation and Distribution Agreement.”
Overview. The distribution will be accomplished pursuant to the terms and conditions of the separation anddistribution agreement, pursuant to which Morgan Stanley will distribute to its stockholders of record all of theoutstanding shares of our common stock. As discussed under “—Trading of Morgan Stanley Common StockAfter the Record Date and Prior to the Distribution,” if a holder of record of Morgan Stanley common stock sellsthose shares in the “regular way” market after the record date and prior to the distribution, that stockholder willalso be selling the right to receive shares of Discover common stock in the distribution. The distribution will bemade in book-entry form on the basis of one share of Discover common stock for every two shares of MorganStanley common stock held at the close of business on the record date of June 18, 2007. Morgan Stanley will
30
instruct Mellon Investor Services, as distribution agent, to record the distribution on the distribution date to theholders of record of Morgan Stanley common stock at the close of business on the record date (or theirdesignated transferees).
Book Entry Statements. A book-entry account statement reflecting your ownership of shares of Discover commonstock will be mailed to you during the week of July 2, 2007, or your brokerage account will be credited for the shareson or about July 2, 2007.
Treatment of Fractional Shares
Fractional shares of our common stock will not be issued to Morgan Stanley stockholders as part of thedistribution nor credited to book-entry accounts. Accordingly, record stockholders of an odd number of shares ofMorgan Stanley common stock on the record date will receive cash in lieu of fractional shares. The distributionagent will aggregate all of the fractional shares and sell them in the open market at then prevailing prices onbehalf of these stockholders. These stockholders will receive cash payments in the amount of their proportionateshare of the net sale proceeds from the sale of the aggregated fractional shares, based upon the average grossselling price per share of our common stock after making appropriate deductions for required withholdings forU.S. federal income tax purposes, if any, and after deducting an amount equal to all brokerage charges,commissions and transfer taxes attributed to the sale of fractional shares. See “—Material U.S. Federal IncomeTax Consequences of the Distribution” for a discussion of the U.S. federal income tax treatment of the proceedsreceived from the sale of fractional shares. We anticipate that these sales will occur as soon after the distributiondate as practicable as determined by the distribution agent. None of Morgan Stanley, us or the distribution agentwill guarantee any minimum sale price for the fractional shares. The distribution agent will have the solediscretion to select the broker-dealer(s) through which to sell the shares and to determine when, how and at whatprice to sell the shares. Further, neither the distribution agent nor the selected broker-dealer(s) will be ouraffiliate or an affiliate of Morgan Stanley.
Results of the Distribution
Following the distribution, Discover will be an independent, publicly traded company owning and operatingwhat had previously been Morgan Stanley’s Discover segment. We expect to have approximately 115,000stockholders of record and approximately 527 million shares of our common stock outstanding immediatelyfollowing the distribution, based on the distribution ratio described above and the number of holders of record ofMorgan Stanley shares on March 31, 2007. The actual number of shares to be distributed will be determinedbased on the number of shares of Morgan Stanley common stock outstanding on the record date. There will alsobe employee options to purchase, and restricted stock units convertible into, Discover common stock asdescribed in “Arrangements Between Us and Morgan Stanley.” The distribution ratio may result in stockholdersholding odd lots of Discover shares and this may make it more expensive for Discover stockholders to sell theirshares.
You will not be required to make any payment for the shares of Discover common stock you receive, norwill you be required to surrender or exchange your shares of Morgan Stanley common stock or take any otheraction in order to receive Discover common stock. The distribution will not affect the number of outstandingMorgan Stanley shares or any rights of Morgan Stanley stockholders, although it will affect the market value ofthe outstanding Morgan Stanley common stock.
Material U.S. Federal Income Tax Consequences of the Distribution
The following discussion sets forth the material U.S. federal income tax consequences of the distribution.This discussion is based on the Code, Treasury regulations promulgated under the Code and judicial andadministrative interpretations thereof, all as in effect as of the date of this information statement, all of which aresubject to change at any time, possibly with retroactive effect. The discussion assumes that the distribution willbe consummated in accordance with the separation and distribution agreement and as further described in this
31
information statement. This is not a complete description of all of the consequences of the distribution and, inparticular, may not address U.S. federal income tax considerations applicable to holders of Morgan Stanleycommon stock subject to special treatment under U.S. federal income tax law. Holders of Morgan Stanleycommon stock subject to special treatment include, for example:
• financial institutions;
• dealers in securities;
• traders in securities who elect to apply a mark-to-market method of accounting;
• insurance companies;
• tax-exempt entities;
• partnerships and other pass-through entities;
• holders who acquired their shares pursuant to the exercise of an employee stock option or right orotherwise as compensation; and
• holders who hold Morgan Stanley common stock as part of a “hedge,” “straddle,” “conversion” or“constructive sale” transaction.
In addition, this discussion does not address the U.S. federal income tax consequences to holders of MorganStanley common stock who are not U.S. holders (as defined below) or who do not hold Morgan Stanley commonstock as a capital asset. No information is provided in this information statement with respect to the taxconsequences of the distribution under applicable foreign or state or local laws.
For purposes of this information statement, a “U.S. holder” means any beneficial owner of Morgan Stanleycommon stock, other than an entity or arrangement treated as a partnership for U.S. federal income tax purposes,that for U.S. federal income tax purposes is:
• an individual who is a citizen or resident of the United States;
• a corporation (or other entity taxable as a corporation for U.S. federal income tax purposes) created ororganized in or under the laws of the United States or of any political subdivision thereof;
• an estate, the income of which is subject to U.S. federal income taxation regardless of its source; or
• a trust if it (i) is subject to the primary supervision of a court within the United States and one or moreU.S. persons have the authority to control all substantial decisions of the trust or (ii) was in existenceon August 20, 1996, and has properly elected under applicable Treasury regulations to be treated as aU.S. person.
Holders of Morgan Stanley common stock are urged to consult with their tax advisors regarding the taxconsequences of the distribution to them, as applicable, including the effects of U.S. federal, state and local taxlaws, as well as foreign and other tax laws.
The Distribution
Morgan Stanley has received a private letter ruling from the IRS to the effect that, among other things, thedistribution (including certain related transactions) will be tax-free to Morgan Stanley stockholders for U.S.federal income tax purposes under sections 355, 368 and related provisions of the Code. Although a private letterruling from the IRS generally is binding on the IRS, if the factual assumptions or representations made in theprivate letter ruling request are untrue or incomplete in any material respect, then Morgan Stanley will not beable to rely on the ruling. In addition, Morgan Stanley expects to receive an opinion of counsel addressing certainrequirements, the satisfaction of which will be assumed in the private letter ruling, that must be met in order forthe distribution to qualify under sections 355, 368 and related sections of the Code.
32

Assuming (i) the continued validity of the private letter ruling from the IRS and of the opinion of counseland (ii) that the distribution of our common stock to Morgan Stanley stockholders in connection with thedistribution is not otherwise disqualified as tax-free for the reasons set forth under “—Effect of CertainAcquisitions of Morgan Stanley Common Stock or Our Common Stock” below, the material U.S. federal incometax consequences of the distribution will be as follows:
• the distribution will not generally result in any taxable income, gain or loss to Morgan Stanley;
• no taxable income, gain or loss will be recognized by any U.S. holder solely as the result of the receiptof our common stock in the distribution;
• a U.S. holder will recognize capital gain or loss on any cash received in lieu of a fractional share of ourcommon stock equal to the difference between the amount of cash received in lieu of the fractionalshare and the portion of the aggregate tax basis of the Morgan Stanley common stock that is allocableto such fractional share as set forth below;
• the aggregate tax basis of the Morgan Stanley common stock and our common stock, including anyfractional share in lieu of which cash is received, in the hands of a U.S. holder immediately after thedistribution will be the same as the aggregate tax basis of the Morgan Stanley common stock held bysuch holder immediately before the distribution, allocated between the Morgan Stanley common stockand our common stock in proportion to their relative fair market values on the distribution date; and
• the holding period of our common stock received by a U.S. holder will include the holding period ofsuch holder’s Morgan Stanley common stock, provided that the Morgan Stanley common stock is heldas a capital asset on the distribution date.
As described above, the private letter ruling and the opinion of counsel are based, in part, on certainassumptions and representations as to factual matters. If any of those assumptions or representations is untrue orincomplete as of the effective time of the distribution, the tax consequences of the distribution could differmaterially from those described above.
If the distribution were not to qualify for tax-free treatment under sections 355, 368 and related provisionsof the Code, Morgan Stanley would recognize taxable gain equal to the excess of the fair market value of ourstock over Morgan Stanley’s tax basis in our stock. Under certain circumstances, we would be required under theU.S. tax sharing agreement to indemnify Morgan Stanley for all or a portion of this liability. See “ArrangementsBetween Us and Morgan Stanley—Tax Sharing Agreements.” In addition, each U.S. holder who receives ourcommon stock in the distribution would be treated as receiving a taxable distribution in an amount equal to thefair market value of our common stock received.
Morgan Stanley and Discover may incur some tax cost in connection with the distribution (as a result ofcertain intercompany transactions or as a result of certain differences between federal and foreign tax rules),whether or not the distribution qualifies for tax-free treatment under sections 355, 368 and related provisions ofthe Code.
Effect of Certain Acquisitions of Morgan Stanley Common Stock or Our Common Stock
Even if the distribution otherwise qualifies as a tax-free distribution under section 355 of the Code, thedistribution may result in significant U.S. federal income tax liabilities to Morgan Stanley if 50% or more ofMorgan Stanley stock or our stock (in each case by vote or value) is acquired, directly or indirectly, by one ormore persons as part of a plan (or series of related transactions) that includes the distribution. For purposes of thistest, any acquisitions of Morgan Stanley stock or our stock, or any agreement, understanding, arrangement orsubstantial negotiations regarding an acquisition of Morgan Stanley stock or our stock within two years before orafter the distribution are subject to special scrutiny.
The process for determining whether a change in control prohibited under the foregoing rules has occurredis complex, inherently factual and subject to interpretation of the facts and circumstances of a particular case. If adirect or indirect acquisition of Morgan Stanley stock or our stock resulted in a change in control prohibited
33
under those rules, Morgan Stanley (but not its stockholders) would recognize taxable gain as described above.Under certain circumstances, we would be required under the U.S. tax sharing agreement to indemnify MorganStanley for this liability. See “Arrangements Between Us and Morgan Stanley—Tax Sharing Agreements.”
Information Reporting and Backup Withholding
Current Treasury regulations require each holder of Morgan Stanley common stock (i) who ownsimmediately prior to the distribution (a) at least five percent of the total outstanding stock of Morgan Stanley or(b) securities of Morgan Stanley with an aggregate tax basis of $1,000,000 or more and (ii) who receives ourcommon stock in the distribution to attach a statement relating to the distribution to the stockholder’s federalincome tax return for the year in which the distribution occurs.
Information reporting and backup withholding will apply with respect to cash proceeds received in lieu of afractional share of our common stock only if such proceeds equal or exceed $20.
The foregoing sets forth the material U.S. federal income tax consequences of the distribution undercurrent law. This discussion does not address tax consequences that may vary with, or are contingent on,individual circumstances. Moreover, it does not address any non-income tax or any foreign, state or localtax consequences of the distribution. Each beneficial owner of Morgan Stanley common stock isencouraged to consult his, her or its tax advisor as to the particular consequences of the distribution to thestockholder, including the application of state, local and foreign tax laws, and as to possible prospective orretroactive changes in tax law that might affect the tax consequences described above.
Market for Our Common Stock; Trading of Our Common Stock Prior to the Distribution
There is currently no trading market for our common stock. Our common stock has been authorized forlisting on the New York Stock Exchange under the symbol “DFS.” We expect that a limited market, commonlyknown as a “when-issued” trading market, for our common stock will begin on or about the week of June 11,2007. The term “when-issued” means that shares can be traded prior to the time shares are available or issued.We expect that on the first trading day following the distribution date, “when-issued” trading in our commonstock will end and “regular way” trading will begin. “Regular way” trading refers to trading after a security hasbeen issued and typically involves a transaction that settles on the third full business day following the date of atrade. We have not and will not set the initial price of our common stock; that price will be established by thepublic markets.
We cannot predict the price at which our common stock will trade before or after the distribution. In fact,the combined trading prices of Discover common stock and Morgan Stanley common stock after the distributionmay be less than, equal to or greater than the trading price of Morgan Stanley common stock prior to thedistribution. See “Risk Factors—Risks Related to the Distribution—Because there has not been any publicmarket for our common stock, the market price and trading volume of our common stock may be volatile.”
Shares of our common stock distributed to holders of Morgan Stanley common stock in the distribution willbe transferable under the Securities Act of 1933, as amended (the “Securities Act”), except for shares received bypersons who may be deemed to be our affiliates. Persons who may be deemed to be our affiliates after thedistribution generally include individuals or entities that control, are controlled by or are under common controlwith us and may include certain of our officers, directors or principal stockholders. After we become a publiclytraded company, securities held by our affiliates will be subject to the resale restrictions under the Securities Act.Our affiliates will be permitted to sell shares of our common stock only pursuant to an effective registrationstatement or an exemption from the registration requirements of the Securities Act, such as the exemptionafforded by Rule 144 under the Securities Act.
Trading of Morgan Stanley Common Stock After the Record Date and Prior to the Distribution
Beginning on or shortly before the record date and through the distribution date, Morgan Stanley expectsthere will be two concurrent markets in which to trade Morgan Stanley common stock: a “regular way” marketand a “when-issued” market. Shares of Morgan Stanley common stock that trade on the “regular way market”will trade with an entitlement to shares of our common stock distributed in connection with the distribution.
34

Shares that trade on the “when-issued” market will trade without an entitlement to shares of our common stockdistributed in connection with the distribution. Therefore, if you own shares of Morgan Stanley common stock atthe close of business on the record date and sell those shares on the “regular way” market on or prior to thedistribution date, you also will be selling your right to receive the shares of our common stock that would havebeen distributed to you in connection with the distribution. If you sell those shares of Morgan Stanley commonstock on the “when-issued” market prior to or on the distribution, you will still receive the shares of our commonstock that were to be distributed to you pursuant to your ownership of the shares of Morgan Stanley commonstock. If you purchase shares of Morgan Stanley common stock on the “when-issued” market after the recorddate or in the “regular way” market after the distribution date, you will not receive an entitlement to shares of ourcommon stock distributed in the distribution.
Distribution Conditions and Termination
We expect that the distribution will occur on June 30, 2007, provided that, among other things:
• the SEC has declared effective our registration statement on Form 10, of which this informationstatement is a part, under the Exchange Act and no stop order relating to our Form 10 registrationstatement is in effect;
• Morgan Stanley has received a tax ruling and/or an opinion of counsel, in each case satisfactory toMorgan Stanley, to the effect that, among other things, the distribution (and certain relatedtransactions) will be tax-free to Morgan Stanley stockholders for U.S. federal income tax purposes;
• the New York Stock Exchange has approved our common stock for listing, subject to official notice ofissuance;
• all material governmental and third-party approvals and consents have been obtained; and
• no event or development has occurred or exists that in the judgment of Morgan Stanley’s board ofdirectors, in its sole discretion, makes it inadvisable to effect the distribution.
Treatment of Employee Stock Options and Restricted Stock Units
Following the distribution, and pursuant to the provisions of the respective plan documents, holders ofMorgan Stanley restricted stock units (RSUs) and options who are active employees of Discover at the time ofdistribution will have their Morgan Stanley RSUs and options converted into newly-issued Discover RSUs andoptions pursuant to a conversion formula described below that is intended to preserve the “intrinsic” value oftheir pre-distribution RSUs and options. The conversion formula was approved by the Morgan StanleyCompensation, Management Development and Succession Committee, whose members will not receive DiscoverRSUs or options in the distribution. The RSUs and options so issued will have substantially the same terms,including expiration date and vesting schedule, as the converted Morgan Stanley RSUs and Options.
A conversion ratio will be used to calculate the number of Discover RSUs and the number and exerciseprice of Discover options that active employees of Discover at the time of distribution will receive upon theconversion of their Morgan Stanley RSUs and options. This ratio will be calculated by dividing the closing priceof Morgan Stanley common stock immediately prior to the distribution by the opening price of Discovercommon stock immediately following the distribution, in each case as reported on the New York StockExchange. The holder will receive a number of Discover RSUs and options equal to the conversion ratiomultiplied by the number of Morgan Stanley RSUs and options, respectively, held by such holder. The exerciseprice of each Discover option will be determined by dividing the exercise price of the Morgan Stanley option bythe conversion ratio.
Set forth below is an example of how the conversion would work. For purposes of this illustration, weassume that the closing price of Morgan Stanley common stock immediately prior to the distribution is $100.00,and the opening price of Discover common stock immediately following the distribution is $25.00, resulting in aconversion ratio of 4.0 ($100.00/$25.00).
35
Restricted Stock Units
Number of Morgan Stanley RSUs held immediately prior to the distribution . . . . . . . . 50multiplied byConversion ratio . . . . . . . . . . . . . . . . . . . . . . . . . . . . . . . . . . . . . . . . . . . . . . . . . . . . . . . 4.0
Number of Discover RSUs to be issued upon conversion . . . . . . . . . . . . . . . . . . . . . . . 200
How intrinsic value is preserved:
Share Price # of RSUs Intrinsic value
Morgan Stanley immediately prior to the distribution . . . . . . . . . . . . . . . . . . $100 50 $5,000Discover immediately following the distribution . . . . . . . . . . . . . . . . . . . . . $ 25 200 $5,000
Options
Number of Morgan Stanley options held immediately prior to the distribution . . . . . . . 50multiplied byConversion ratio . . . . . . . . . . . . . . . . . . . . . . . . . . . . . . . . . . . . . . . . . . . . . . . . . . . . . . . 4.0
Number of Discover options to be issued upon conversion . . . . . . . . . . . . . . . . . . . . . . 200
Exercise price of each Morgan Stanley option immediately prior to thedistribution . . . . . . . . . . . . . . . . . . . . . . . . . . . . . . . . . . . . . . . . . . . . . . . . . . . . . . . $ 50
divided byConversion Ratio . . . . . . . . . . . . . . . . . . . . . . . . . . . . . . . . . . . . . . . . . . . . . . . . . . . . 4.0
Exercise price of each Discover option to be issued upon conversion . . . . . . . . . . . $12.50
How intrinsic value is preserved:
Share Price Strike Price # of options Intrinsic value
Morgan Stanley immediately prior to the distribution . . . . . . $100.00 $50.00 50 $2,500Discover immediately following the distribution . . . . . . . . . . $ 25.00 $12.50 200 $2,500
All other holders of Morgan Stanley employee stock options and RSUs will have their existing MorganStanley RSUs and options similarly adjusted to preserve the “intrinsic” value of their pre-distribution RSUs andoptions.
Interests of Morgan Stanley Directors and Executive Officers in the Distribution
Following the distribution, none of the directors or executive officers of Morgan Stanley will be directors orexecutive officers of Discover. A majority of the directors and executive officers of Morgan Stanley own sharesof Morgan Stanley common stock and will receive shares of Discover common stock in the distribution on thesame terms as other Morgan Stanley stockholders. All of the Morgan Stanley directors and executive officershold Morgan Stanley RSUs and/or options, which will be adjusted following the distribution pursuant to aformula that is intended to preserve the “intrinsic” value of their pre-distribution RSUs and options.
Reason for Furnishing this Information Statement
This information statement is being furnished solely to provide information to Morgan Stanley stockholderswho will receive shares of Discover common stock in connection with the distribution. It is not provided as aninducement or encouragement to buy or sell any of our securities. You should not assume that the informationcontained in this information statement is accurate as of any date other than the date set forth on the cover.Changes to the information contained in this information statement may occur after that date, and we undertakeno obligation to update the information.
36

DIVIDEND POLICY
Following the distribution, our board of directors intends to consider our policy toward the payment andamount of dividends. The declaration and amount of future dividends, if any, will be determined by our board ofdirectors and will depend on our financial condition, earnings, capital requirements, legal and regulatoryconstraints, industry practice and any other factors that our board of directors believes are relevant.
37
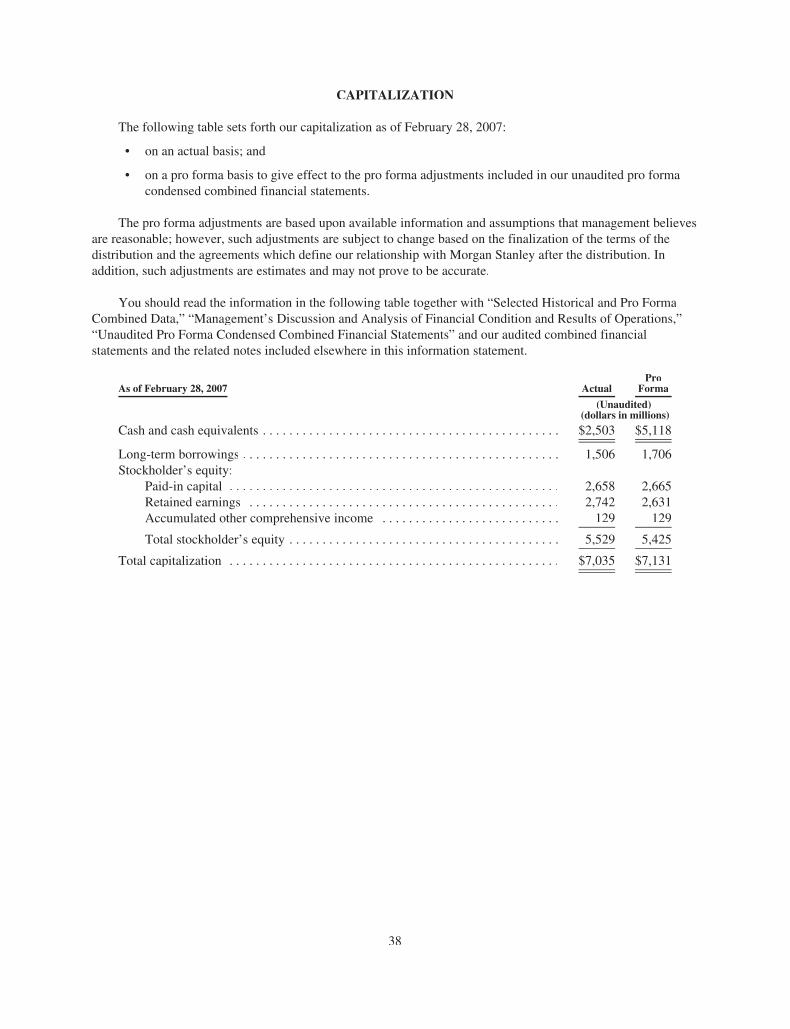
CAPITALIZATION
The following table sets forth our capitalization as of February 28, 2007:
• on an actual basis; and
• on a pro forma basis to give effect to the pro forma adjustments included in our unaudited pro formacondensed combined financial statements.
The pro forma adjustments are based upon available information and assumptions that management believesare reasonable; however, such adjustments are subject to change based on the finalization of the terms of thedistribution and the agreements which define our relationship with Morgan Stanley after the distribution. Inaddition, such adjustments are estimates and may not prove to be accurate.
You should read the information in the following table together with “Selected Historical and Pro FormaCombined Data,” “Management’s Discussion and Analysis of Financial Condition and Results of Operations,”“Unaudited Pro Forma Condensed Combined Financial Statements” and our audited combined financialstatements and the related notes included elsewhere in this information statement.
As of February 28, 2007 ActualPro
Forma
(Unaudited)(dollars in millions)
Cash and cash equivalents . . . . . . . . . . . . . . . . . . . . . . . . . . . . . . . . . . . . . . . . . . . . . $2,503 $5,118
Long-term borrowings . . . . . . . . . . . . . . . . . . . . . . . . . . . . . . . . . . . . . . . . . . . . . . . . 1,506 1,706Stockholder’s equity:
Paid-in capital . . . . . . . . . . . . . . . . . . . . . . . . . . . . . . . . . . . . . . . . . . . . . . . . . . 2,658 2,665Retained earnings . . . . . . . . . . . . . . . . . . . . . . . . . . . . . . . . . . . . . . . . . . . . . . . 2,742 2,631Accumulated other comprehensive income . . . . . . . . . . . . . . . . . . . . . . . . . . . 129 129
Total stockholder’s equity . . . . . . . . . . . . . . . . . . . . . . . . . . . . . . . . . . . . . . . . . 5,529 5,425
Total capitalization . . . . . . . . . . . . . . . . . . . . . . . . . . . . . . . . . . . . . . . . . . . . . . . . . . $7,035 $7,131
38

UNAUDITED PRO FORMA CONDENSED COMBINED FINANCIAL STATEMENTS
Our unaudited pro forma condensed combined financial statements presented below have been derived fromour audited combined financial statements for the year ended November 30, 2006 and from our unauditedcondensed combined financial statements for the three months ended February 28, 2007. The pro formaadjustments and notes to the unaudited pro forma condensed combined financial statements give effect to thedistribution of our common stock by Morgan Stanley and the other transactions contemplated by the separationand distribution agreement. These unaudited pro forma condensed combined financial statements should be readin conjunction with “Management’s Discussion and Analysis of Financial Condition and Results of Operations”and our audited combined financial statements and the notes to those statements included elsewhere in thisinformation statement.
Our unaudited pro forma condensed combined statement of income for the year ended November 30, 2006and our unaudited pro forma condensed combined statement of income for the three months ended February 28,2007 have been prepared as though the distribution had occurred as of December 1, 2005. The unaudited proforma condensed combined statement of financial condition has been prepared as though the distribution hadoccurred on February 28, 2007. The pro forma adjustments are based upon available information andassumptions that management believes are reasonable, that reflect the expected impacts of events that are directlyattributable to the distribution and related transaction agreements, and that are factually supportable and expectedto have a continuing impact on us; however, such adjustments are subject to change based on the finalization ofthe terms of the distribution and the transaction agreements. See “Arrangements Between Us and MorganStanley—Separation and Distribution Agreement.” In addition, such adjustments are estimates and may notprove to be accurate.
Morgan Stanley currently provides portions of certain corporate functions on our behalf and allocates thesecosts to us. As a stand-alone public company, and as a direct result of our separation from Morgan Stanley, wewill incrementally incur expenses in respect of these functions. Such functions include but are not limited tocorporate communications, community affairs, government relations, human resources and benefit management,company management functions, treasury, investor relations, internal audit, business technology and corporatelegal and compliance. We expect that Morgan Stanley will provide certain of these services to us on a transitionalbasis, primarily during the first year following the distribution. The annual costs associated with replacing thesefunctions and establishing our own infrastructure related thereto, which we estimate subject to finalization of ourplans to be in the range of $50 million to $60 million, have not been reflected in the unaudited pro formacondensed combined financial statements presented below. We also incur expenses in the form of corporateallocations from Morgan Stanley for the corporate functions they currently provide to us that will not recur afterthe distribution. The total amount of these allocations from Morgan Stanley was approximately $21 million in thethree months ended February 28, 2007 and approximately $90 million in 2006. The net reduction in expensesassociated with replacing these functions and establishing our own infrastructure related thereto have not beenreflected in the unaudited pro forma condensed combined financial statements presented below. This netreduction in expenses is not expected to be realized until the transition is complete. During the transition,principally in the remaining quarters of 2007, expenses will be greater than historical levels, reflecting transitionrelated expenses.
In connection with the distribution, we expect to replace funding provided through Morgan Stanleyintercompany arrangements with alternative sources at market rates available to us. We expect to settle anyoutstanding intercompany payables, which amounted to $200 million as of February 28, 2007, we have withMorgan Stanley. In addition, we expect to make a dividend payment to Morgan Stanley in an amount equal to theamount by which our stockholder’s equity exceeds our targeted stockholder’s equity prior to distribution. Ourtargeted stockholder’s equity is based upon, among other things, management’s view of underlying business risk,regulatory requirements, and rating agency views. As of February 28, 2007, management determined that $5.4
39
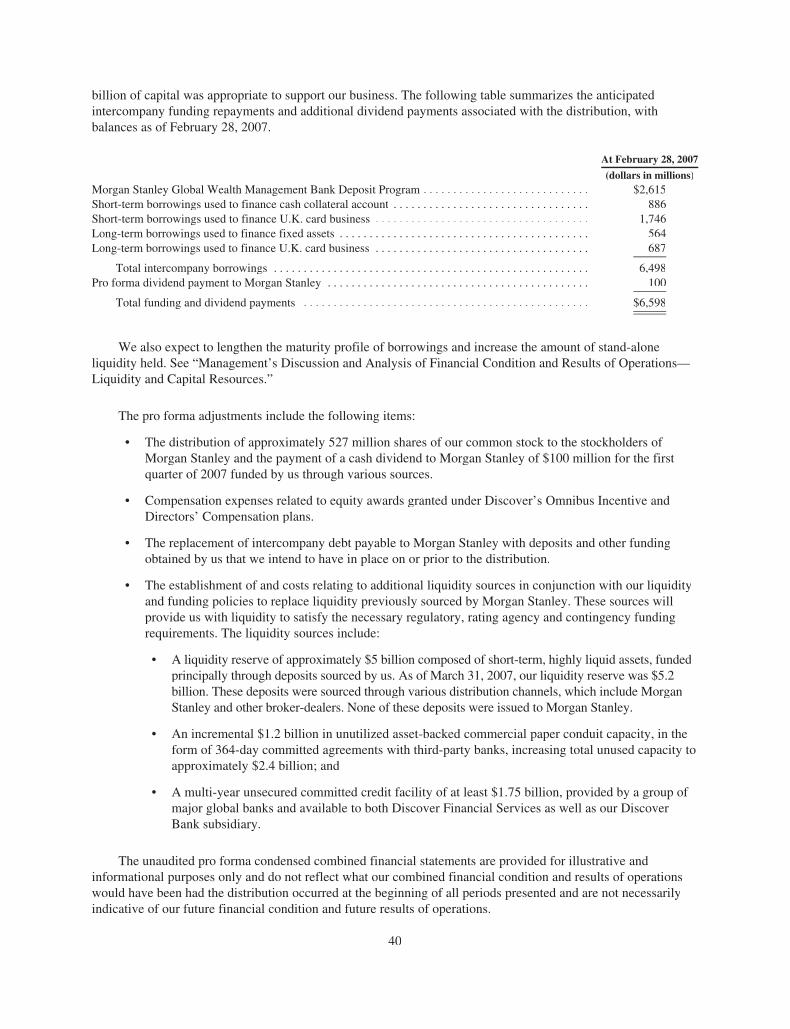
billion of capital was appropriate to support our business. The following table summarizes the anticipatedintercompany funding repayments and additional dividend payments associated with the distribution, withbalances as of February 28, 2007.
At February 28, 2007
(dollars in millions)Morgan Stanley Global Wealth Management Bank Deposit Program . . . . . . . . . . . . . . . . . . . . . . . . . . . . $2,615Short-term borrowings used to finance cash collateral account . . . . . . . . . . . . . . . . . . . . . . . . . . . . . . . . . 886Short-term borrowings used to finance U.K. card business . . . . . . . . . . . . . . . . . . . . . . . . . . . . . . . . . . . . 1,746Long-term borrowings used to finance fixed assets . . . . . . . . . . . . . . . . . . . . . . . . . . . . . . . . . . . . . . . . . . 564Long-term borrowings used to finance U.K. card business . . . . . . . . . . . . . . . . . . . . . . . . . . . . . . . . . . . . 687
Total intercompany borrowings . . . . . . . . . . . . . . . . . . . . . . . . . . . . . . . . . . . . . . . . . . . . . . . . . . . . . 6,498Pro forma dividend payment to Morgan Stanley . . . . . . . . . . . . . . . . . . . . . . . . . . . . . . . . . . . . . . . . . . . . 100
Total funding and dividend payments . . . . . . . . . . . . . . . . . . . . . . . . . . . . . . . . . . . . . . . . . . . . . . . . $6,598
We also expect to lengthen the maturity profile of borrowings and increase the amount of stand-aloneliquidity held. See “Management’s Discussion and Analysis of Financial Condition and Results of Operations—Liquidity and Capital Resources.”
The pro forma adjustments include the following items:
• The distribution of approximately 527 million shares of our common stock to the stockholders ofMorgan Stanley and the payment of a cash dividend to Morgan Stanley of $100 million for the firstquarter of 2007 funded by us through various sources.
• Compensation expenses related to equity awards granted under Discover’s Omnibus Incentive andDirectors’ Compensation plans.
• The replacement of intercompany debt payable to Morgan Stanley with deposits and other fundingobtained by us that we intend to have in place on or prior to the distribution.
• The establishment of and costs relating to additional liquidity sources in conjunction with our liquidityand funding policies to replace liquidity previously sourced by Morgan Stanley. These sources willprovide us with liquidity to satisfy the necessary regulatory, rating agency and contingency fundingrequirements. The liquidity sources include:
• A liquidity reserve of approximately $5 billion composed of short-term, highly liquid assets, fundedprincipally through deposits sourced by us. As of March 31, 2007, our liquidity reserve was $5.2billion. These deposits were sourced through various distribution channels, which include MorganStanley and other broker-dealers. None of these deposits were issued to Morgan Stanley.
• An incremental $1.2 billion in unutilized asset-backed commercial paper conduit capacity, in theform of 364-day committed agreements with third-party banks, increasing total unused capacity toapproximately $2.4 billion; and
• A multi-year unsecured committed credit facility of at least $1.75 billion, provided by a group ofmajor global banks and available to both Discover Financial Services as well as our DiscoverBank subsidiary.
The unaudited pro forma condensed combined financial statements are provided for illustrative andinformational purposes only and do not reflect what our combined financial condition and results of operationswould have been had the distribution occurred at the beginning of all periods presented and are not necessarilyindicative of our future financial condition and future results of operations.
40
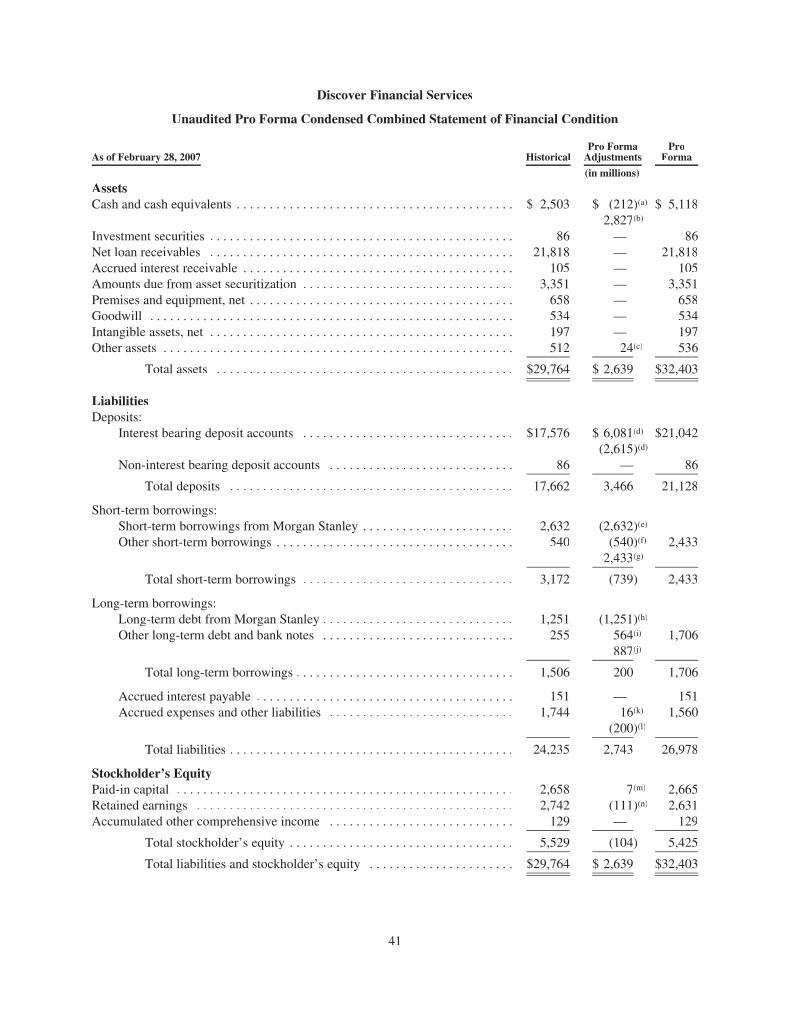
Discover Financial Services
Unaudited Pro Forma Condensed Combined Statement of Financial Condition
As of February 28, 2007 HistoricalPro FormaAdjustments
ProForma
(in millions)
AssetsCash and cash equivalents . . . . . . . . . . . . . . . . . . . . . . . . . . . . . . . . . . . . . . . . . . $ 2,503 $ (212)(a) $ 5,118
2,827(b)
Investment securities . . . . . . . . . . . . . . . . . . . . . . . . . . . . . . . . . . . . . . . . . . . . . . 86 — 86Net loan receivables . . . . . . . . . . . . . . . . . . . . . . . . . . . . . . . . . . . . . . . . . . . . . . 21,818 — 21,818Accrued interest receivable . . . . . . . . . . . . . . . . . . . . . . . . . . . . . . . . . . . . . . . . . 105 — 105Amounts due from asset securitization . . . . . . . . . . . . . . . . . . . . . . . . . . . . . . . . 3,351 — 3,351Premises and equipment, net . . . . . . . . . . . . . . . . . . . . . . . . . . . . . . . . . . . . . . . . 658 — 658Goodwill . . . . . . . . . . . . . . . . . . . . . . . . . . . . . . . . . . . . . . . . . . . . . . . . . . . . . . . 534 — 534Intangible assets, net . . . . . . . . . . . . . . . . . . . . . . . . . . . . . . . . . . . . . . . . . . . . . . 197 — 197Other assets . . . . . . . . . . . . . . . . . . . . . . . . . . . . . . . . . . . . . . . . . . . . . . . . . . . . . 512 24(c) 536
Total assets . . . . . . . . . . . . . . . . . . . . . . . . . . . . . . . . . . . . . . . . . . . . . $29,764 $ 2,639 $32,403
LiabilitiesDeposits:
Interest bearing deposit accounts . . . . . . . . . . . . . . . . . . . . . . . . . . . . . . . . $17,576 $ 6,081(d) $21,042(2,615)(d)
Non-interest bearing deposit accounts . . . . . . . . . . . . . . . . . . . . . . . . . . . . 86 — 86
Total deposits . . . . . . . . . . . . . . . . . . . . . . . . . . . . . . . . . . . . . . . . . . . 17,662 3,466 21,128
Short-term borrowings:Short-term borrowings from Morgan Stanley . . . . . . . . . . . . . . . . . . . . . . . 2,632 (2,632)(e) —Other short-term borrowings . . . . . . . . . . . . . . . . . . . . . . . . . . . . . . . . . . . . 540 (540)(f) 2,433
2,433(g)
Total short-term borrowings . . . . . . . . . . . . . . . . . . . . . . . . . . . . . . . . 3,172 (739) 2,433
Long-term borrowings:Long-term debt from Morgan Stanley . . . . . . . . . . . . . . . . . . . . . . . . . . . . . 1,251 (1,251)(h) —Other long-term debt and bank notes . . . . . . . . . . . . . . . . . . . . . . . . . . . . . 255 564(i) 1,706
887(j)
Total long-term borrowings . . . . . . . . . . . . . . . . . . . . . . . . . . . . . . . . . 1,506 200 1,706
Accrued interest payable . . . . . . . . . . . . . . . . . . . . . . . . . . . . . . . . . . . . . . . 151 — 151Accrued expenses and other liabilities . . . . . . . . . . . . . . . . . . . . . . . . . . . . 1,744 16(k) 1,560
(200)(l)
Total liabilities . . . . . . . . . . . . . . . . . . . . . . . . . . . . . . . . . . . . . . . . . . . 24,235 2,743 26,978
Stockholder’s EquityPaid-in capital . . . . . . . . . . . . . . . . . . . . . . . . . . . . . . . . . . . . . . . . . . . . . . . . . . . 2,658 7(m) 2,665Retained earnings . . . . . . . . . . . . . . . . . . . . . . . . . . . . . . . . . . . . . . . . . . . . . . . . 2,742 (111)(n) 2,631Accumulated other comprehensive income . . . . . . . . . . . . . . . . . . . . . . . . . . . . 129 — 129
Total stockholder’s equity . . . . . . . . . . . . . . . . . . . . . . . . . . . . . . . . . . 5,529 (104) 5,425
Total liabilities and stockholder’s equity . . . . . . . . . . . . . . . . . . . . . . $29,764 $ 2,639 $32,403
41

Discover Financial Services
Unaudited Pro Forma Condensed Combined Statement of Income
For the Three Months Ended February 28, 2007 HistoricalPro FormaAdjustments
ProForma
(dollars in millions, exceptper share amounts)
Interest income . . . . . . . . . . . . . . . . . . . . . . . . . . . . . . . . . . . . . . . . . . . . . . . . . $680 $ 36(b) $ 716Interest expense:
Deposits . . . . . . . . . . . . . . . . . . . . . . . . . . . . . . . . . . . . . . . . . . . . . . . . . . . 187 (12)(d) 27095(d)
Short-term borrowings:Short-term borrowings from Morgan Stanley . . . . . . . . . . . . . . . . . . 70 (70)(e) —Other short-term borrowings . . . . . . . . . . . . . . . . . . . . . . . . . . . . . . . 7 (7)(f) 35
35(g)
Total short-term borrowings . . . . . . . . . . . . . . . . . . . . . . . . . . . 77 (42) 35Long-term borrowings:
Long-term borrowings from Morgan Stanley . . . . . . . . . . . . . . . . . . 17 (17)(h) —Other long-term debt and bank notes . . . . . . . . . . . . . . . . . . . . . . . . 3 9(i) 25
13(j)
Total long-term borrowings . . . . . . . . . . . . . . . . . . . . . . . . . . . . 20 5 25
Total interest expense . . . . . . . . . . . . . . . . . . . . . . . . . . . . . . . . 284 46 330
Net interest income . . . . . . . . . . . . . . . . . . . . . . . . . . . . . . . . . . 396 (10) 386Provision for loan losses . . . . . . . . . . . . . . . . . . . . . . . . . . . . . . . . . . . . . . . . . . 195 — 195
Net interest income after provision for loan losses . . . . . . . . . . 201 (10) 191Other income . . . . . . . . . . . . . . . . . . . . . . . . . . . . . . . . . . . . . . . . . . . . . . . . . . . 825 — 825Other expense . . . . . . . . . . . . . . . . . . . . . . . . . . . . . . . . . . . . . . . . . . . . . . . . . . 655 7(m) 663
1(o)
Income before income tax expense . . . . . . . . . . . . . . . . . . . . . . . . . . . . . . . . . . 371 (18) 353Income tax expense . . . . . . . . . . . . . . . . . . . . . . . . . . . . . . . . . . . . . . . . . . . . . . 137 (7)(p) 130
Net income . . . . . . . . . . . . . . . . . . . . . . . . . . . . . . . . . . . . . . . . $234 $ (11) $ 223
Earnings per share(q)
Basic $ 0.44Diluted $ 0.42
Weighted average shares outstanding (000s)(q)
Basic 504,593Diluted 528,956
42

For the Year Ended November 30, 2006 HistoricalPro FormaAdjustments
ProForma
Interest income . . . . . . . . . . . . . . . . . . . . . . . . . . . . . . . . . . . . . . . . . . . . . . . . . $2,459 $ 213(b) $ 2,672Interest expense:
Deposits . . . . . . . . . . . . . . . . . . . . . . . . . . . . . . . . . . . . . . . . . . . . . . . . . . . 670 (47)(d) 981358(d)
Short-term borrowings:Short-term borrowings from Morgan Stanley . . . . . . . . . . . . . . . . . . 183 (183)(e) —Other short-term borrowings . . . . . . . . . . . . . . . . . . . . . . . . . . . . . . . 11 (11)(f) 128
128(g)
Total short-term borrowings . . . . . . . . . . . . . . . . . . . . . . . . . . . 194 (66) 128Long-term borrowings:
Long-term borrowings from Morgan Stanley . . . . . . . . . . . . . . . . . . 62 (62)(h) —Other long-term debt and bank notes . . . . . . . . . . . . . . . . . . . . . . . . 14 38(i) 104
52(j)
Total long-term borrowings . . . . . . . . . . . . . . . . . . . . . . . . . . . . 76 28 104
Total interest expense . . . . . . . . . . . . . . . . . . . . . . . . . . . . . . . . 940 273 1,213
Net interest income . . . . . . . . . . . . . . . . . . . . . . . . . . . . . . . . . . 1,519 (60) 1,459Provision for loan losses . . . . . . . . . . . . . . . . . . . . . . . . . . . . . . . . . . . . . . . . . . 756 — 756
Net interest income after provision for loan losses . . . . . . . . . . 763 (60) 703Other income . . . . . . . . . . . . . . . . . . . . . . . . . . . . . . . . . . . . . . . . . . . . . . . . . . . 3,539 — 3,539Other expense . . . . . . . . . . . . . . . . . . . . . . . . . . . . . . . . . . . . . . . . . . . . . . . . . . 2,719 51(m) 2,775
5(o)
Income before income tax expense . . . . . . . . . . . . . . . . . . . . . . . . . . . . . . . . . . 1,583 (116) 1,467Income tax expense . . . . . . . . . . . . . . . . . . . . . . . . . . . . . . . . . . . . . . . . . . . . . . 506 (40)(p) 466
Net income . . . . . . . . . . . . . . . . . . . . . . . . . . . . . . . . . . . . . . . . $1,077 $ (76) $ 1,001
Earnings per share(q)
Basic $ 1.98Diluted $ 1.89
Weighted average shares outstanding (000s)(q)
Basic 504,593Diluted 528,956
43

Notes to Unaudited Pro Forma Condensed Combined Financial Statements(a) Represents net reduction to cash balance of $211 million related to pro forma adjustments, composed of the
following:
Net income . . . . . . . . . . . . . . . . . . . . . . . . . . . . . . . . . . . . . . . . . . . . . . . . . . . . . . . . $ (11)Stock Compensation Awards . . . . . . . . . . . . . . . . . . . . . . . . . . . . . . . . . . . . . . . . . . 7Increase in Deferred Taxes . . . . . . . . . . . . . . . . . . . . . . . . . . . . . . . . . . . . . . . . . . . . (24)Increase in Taxes Payable . . . . . . . . . . . . . . . . . . . . . . . . . . . . . . . . . . . . . . . . . . . . . 16Decrease in Intercompany Payables . . . . . . . . . . . . . . . . . . . . . . . . . . . . . . . . . . . . . (200)Increase in Cash Equivalents . . . . . . . . . . . . . . . . . . . . . . . . . . . . . . . . . . . . . . . . . . (2,827)Decrease in Short-Term Borrowings . . . . . . . . . . . . . . . . . . . . . . . . . . . . . . . . . . . . (739)Issuance of Long-Term Debt . . . . . . . . . . . . . . . . . . . . . . . . . . . . . . . . . . . . . . . . . . 1,451Repayment of Long-Term Debt . . . . . . . . . . . . . . . . . . . . . . . . . . . . . . . . . . . . . . . . (1,251)Increase in Deposits . . . . . . . . . . . . . . . . . . . . . . . . . . . . . . . . . . . . . . . . . . . . . . . . . 3,466Dividends paid . . . . . . . . . . . . . . . . . . . . . . . . . . . . . . . . . . . . . . . . . . . . . . . . . . . . . (100)
Net decrease in cash . . . . . . . . . . . . . . . . . . . . . . . . . . . . . . . . . . . . . . . . . . . . . . . . . $ (212)
(b) Represents a $2.8 billion and $4.5 billion increase in our liquidity reserve for the three months endedFebruary 28, 2007 and the year ended November 30, 2006, respectively, to reach a total reserve of $5 billionfunded principally by interest bearing deposits. In the future, a portion of this liquidity reserve may alsoconsist of investment securities, the effect of which would decrease Federal Funds sold (a component ofcash and cash equivalents) and increase investment securities. Incremental interest income on Federal Fundssold reflects the increase in this liquidity reserve to $5 billion at interest rates of approximately 5.2% and4.8% for the three months ended February 28, 2007 and the year ended November 30, 2006, respectively,estimated using the Federal Funds rate minus 10 basis points. The impact on interest income from a 1⁄1 8⁄⁄ of1% change in interest rates is approximately $0.9 million for the three months ended February 28, 2007 and$5.6 million for the year ended November 30, 2006.
(c) Represents the increase in deferred income taxes of $19 million due to the reversal of deferred intercompanytransactions, $2 million due to discontinuing the filing of combined state returns with Morgan Stanley, and$3 million due to the pro forma adjustment for equity based incentive compensation.
(d) Represents incremental deposits of approximately $6.1 billion sourced by us principally to provide anincremental $2.8 billion of funding to establish our $5 billion liquidity reserve, replace $540 million ofexternally sourced Federal Funds, replace $100 million in equity funding which was used for a dividendpayment to Morgan Stanley, and replace amounts payable to Morgan Stanley. These amounts payable toMorgan Stanley include approximately $2.6 billion of deposits which are derived from the Global WealthManagement Bank Deposit Program and short-term borrowings derived from Morgan Stanley intercompanyfunding and Morgan Stanley Bank Federal Funds. Incremental interest expense on these deposits reflectsinterest rates of approximately 5.6% and 5.1% for the three months ended February 28, 2007 and the yearended November 30, 2006, respectively, estimated using 2-year brokered deposit rates swapped to a3-month LIBOR floating rate basis. The impact on interest expense associated with these deposits from a 1⁄1 8⁄⁄of 1% change in interest rates is approximately $2.6 million for the three months ending February 28, 2007and $8.6 million for the year ending November 30, 2006. Historically, Discover Bank has utilized thebrokered deposit market to obtain substantial funding volumes. Discover Bank issued a total of $12.1 billionin brokered deposits during 2005 and a total of $3.6 billion in brokered deposits during 2006, as fundingrequirements decreased, reducing the need to utilize this market. Our management believes that this marketis a stable, reliable source of funding and expects that large issuance levels are attainable.
(e) Represents the elimination of approximately $2.6 billion and $6.6 billion of short-term borrowings fromMorgan Stanley composed of intercompany loans and Morgan Stanley Bank Federal Funds purchased forthe three months ended February 28, 2007 and the year ended November 30, 2006, respectively. Theseborrowings carried interest of approximately 5.4% and 4.6% for the three months ended February 28, 2007and the year ended November 30, 2006, respectively.
(f) Represents the impact of the elimination of $540 million and $100 million of externally sourced FederalFunds for the three months ended February 28, 2007 and the year ended November 30, 2006, respectively.
44
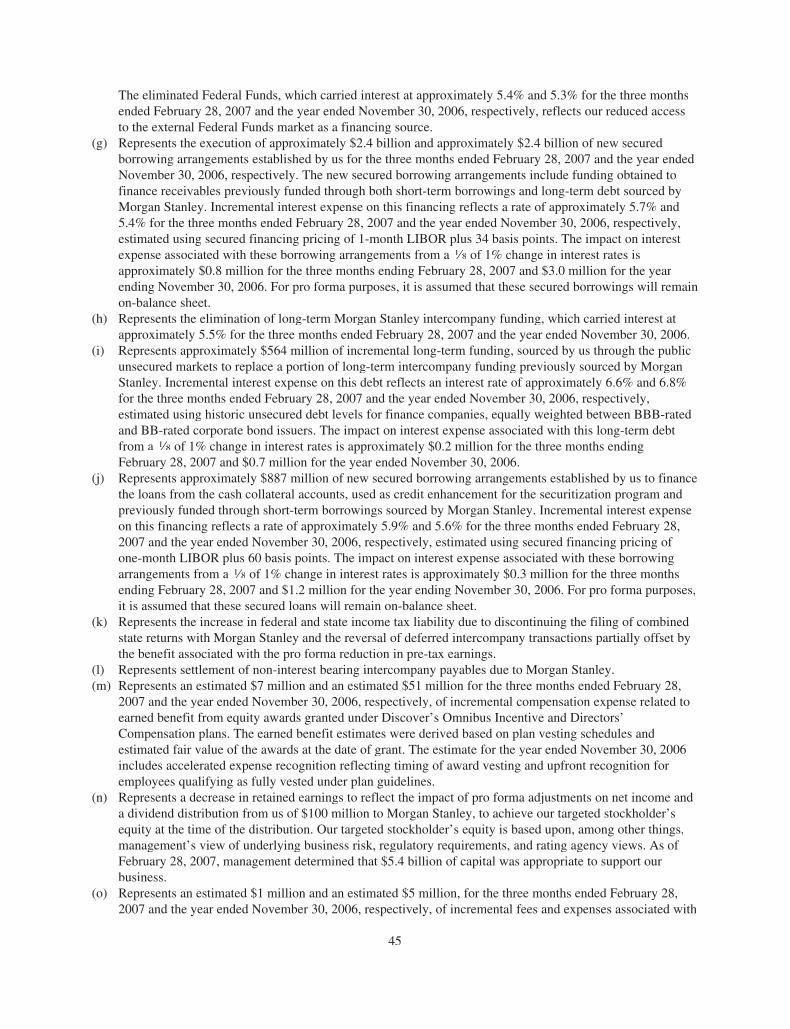
The eliminated Federal Funds, which carried interest at approximately 5.4% and 5.3% for the three monthsended February 28, 2007 and the year ended November 30, 2006, respectively, reflects our reduced accessto the external Federal Funds market as a financing source.
(g) Represents the execution of approximately $2.4 billion and approximately $2.4 billion of new securedborrowing arrangements established by us for the three months ended February 28, 2007 and the year endedNovember 30, 2006, respectively. The new secured borrowing arrangements include funding obtained tofinance receivables previously funded through both short-term borrowings and long-term debt sourced byMorgan Stanley. Incremental interest expense on this financing reflects a rate of approximately 5.7% and5.4% for the three months ended February 28, 2007 and the year ended November 30, 2006, respectively,estimated using secured financing pricing of 1-month LIBOR plus 34 basis points. The impact on interestexpense associated with these borrowing arrangements from a 1⁄1 8⁄⁄ of 1% change in interest rates isapproximately $0.8 million for the three months ending February 28, 2007 and $3.0 million for the yearending November 30, 2006. For pro forma purposes, it is assumed that these secured borrowings will remainon-balance sheet.
(h) Represents the elimination of long-term Morgan Stanley intercompany funding, which carried interest atapproximately 5.5% for the three months ended February 28, 2007 and the year ended November 30, 2006.
(i) Represents approximately $564 million of incremental long-term funding, sourced by us through the publicunsecured markets to replace a portion of long-term intercompany funding previously sourced by MorganStanley. Incremental interest expense on this debt reflects an interest rate of approximately 6.6% and 6.8%for the three months ended February 28, 2007 and the year ended November 30, 2006, respectively,estimated using historic unsecured debt levels for finance companies, equally weighted between BBB-ratedand BB-rated corporate bond issuers. The impact on interest expense associated with this long-term debtfrom a 1⁄1 8⁄⁄ of 1% change in interest rates is approximately $0.2 million for the three months endingFebruary 28, 2007 and $0.7 million for the year ended November 30, 2006.
(j) Represents approximately $887 million of new secured borrowing arrangements established by us to financethe loans from the cash collateral accounts, used as credit enhancement for the securitization program andpreviously funded through short-term borrowings sourced by Morgan Stanley. Incremental interest expenseon this financing reflects a rate of approximately 5.9% and 5.6% for the three months ended February 28,2007 and the year ended November 30, 2006, respectively, estimated using secured financing pricing ofone-month LIBOR plus 60 basis points. The impact on interest expense associated with these borrowingarrangements from a 1⁄1 8⁄⁄ of 1% change in interest rates is approximately $0.3 million for the three monthsending February 28, 2007 and $1.2 million for the year ending November 30, 2006. For pro forma purposes,it is assumed that these secured loans will remain on-balance sheet.
(k) Represents the increase in federal and state income tax liability due to discontinuing the filing of combinedstate returns with Morgan Stanley and the reversal of deferred intercompany transactions partially offset bythe benefit associated with the pro forma reduction in pre-tax earnings.
(l) Represents settlement of non-interest bearing intercompany payables due to Morgan Stanley.(m) Represents an estimated $7 million and an estimated $51 million for the three months ended February 28,
2007 and the year ended November 30, 2006, respectively, of incremental compensation expense related toearned benefit from equity awards granted under Discover’s Omnibus Incentive and Directors’Compensation plans. The earned benefit estimates were derived based on plan vesting schedules andestimated fair value of the awards at the date of grant. The estimate for the year ended November 30, 2006includes accelerated expense recognition reflecting timing of award vesting and upfront recognition foremployees qualifying as fully vested under plan guidelines.
(n) Represents a decrease in retained earnings to reflect the impact of pro forma adjustments on net income anda dividend distribution from us of $100 million to Morgan Stanley, to achieve our targeted stockholder’sequity at the time of the distribution. Our targeted stockholder’s equity is based upon, among other things,management’s view of underlying business risk, regulatory requirements, and rating agency views. As ofFebruary 28, 2007, management determined that $5.4 billion of capital was appropriate to support ourbusiness.
(o) Represents an estimated $1 million and an estimated $5 million, for the three months ended February 28,2007 and the year ended November 30, 2006, respectively, of incremental fees and expenses associated with
45

establishing new unsecured bank facility and asset-backed commercial paper conduit facilities, composed ofan estimated $1.75 billion in an unsecured credit facility priced at an assumed 20 basis points and anincremental $1.2 billion in unutilized asset-backed commercial paper conduit capacity priced at an assumed15 basis points.
(p) Pro forma effective state tax rate has been increased from 1.8% to 2.3% to reflect additional state taxliability as a consequence of not being combined with Morgan Stanley. Income tax has been adjusted for arevaluation of the net deferred state income tax asset to reflect the higher rate.
(q) The calculation of pro forma basic earnings per share and average shares outstanding is based on theaverage number of shares of Morgan Stanley common stock outstanding for the quarter ended February 28,2007 adjusted for the distribution ratio of one share of Discover common stock for every two shares ofMorgan Stanley common stock. The calculation of pro forma diluted earnings per share and sharesoutstanding is based on the average number of shares of Morgan Stanley common stock outstanding for thequarter ended February 28, 2007 and average diluted shares of common stock outstanding for the quarterended February 28, 2007 adjusted for the same distribution ratio. This calculation may not be indicative ofthe dilutive effect that will actually result from the replacement or adjustment of Morgan Stanley stock-based awards held by Discover employees and employees of Morgan Stanley or the grant of new stock-based awards. The number of dilutive shares of Discover common stock that will result from MorganStanley stock options, restricted stock awards and restricted stock units held by our employees will not bedetermined until immediately after the distribution. However, we currently expect the number of dilutiveshares resulting from the replacement of Discover employees’ Morgan Stanley stock options, restrictedstock awards and restricted stock units could be greater than one dilutive share of Discover common stockafter the distribution for every two dilutive shares of Morgan Stanley common stock held prior to thedistribution.
46
SELECTED HISTORICAL AND PRO FORMA COMBINED DATA
The following table presents our selected historical and pro forma financial data and operating statistics. Thestatement of income data for each of the years in the three-year period ended November 30, 2006 and thestatement of financial condition data as of November 30, 2006 and 2005 have been derived from our auditedcombined financial statements included elsewhere in this information statement. The statement of income datafor the years ended November 30, 2003 and 2002 and the statement of financial condition data as ofNovember 30, 2004, 2003 and 2002 are derived from the unaudited combined financial statements not includedelsewhere in this information statement. The statement of income data for the three months ended February 28,2007 and 2006 and statement of financial condition data as of February 28, 2007 are derived from our unauditedcondensed combined financial statements included elsewhere in this information statement. The unauditedcondensed combined financial statements have been prepared on the same basis as the audited combinedfinancial statements, and in the opinion of our management include all adjustments, consisting of only ordinaryrecurring adjustments, necessary for a fair presentation of the information set forth in this information statement.The unaudited pro forma statement of income and financial condition data have been derived from our unauditedcondensed combined financial statements for the three months ended February 28, 2007 and our auditedcombined financial statements for the year ended November 30, 2006 and include adjustments that give effect totransactions contemplated by the separation and distribution agreement.
The selected historical and pro forma financial data and operating statistics presented below should be readin conjunction with our audited combined financial statements and accompanying notes and “Management’sDiscussion and Analysis of Financial Condition and Results of Operations” included elsewhere in thisinformation statement. The combined financial information may not be indicative of our future performance anddoes not necessarily reflect what the financial position and results of operations would have been had weoperated as a separate, stand-alone entity during the periods presented, including changes that will occur in ouroperations and capitalization as a result of the separation and distribution from Morgan Stanley. See “UnauditedPro Forma Condensed Combined Financial Statements” for additional discussion of the anticipated changes. Theunaudited condensed combined financial statements are not necessarily indicative of the results to be expectedfor any other interim period or for the year ending November 30, 2007. However, in the opinion of management,the unaudited condensed combined financial statements include all normal recurring adjustments that arenecessary for the fair presentation of the results for interim periods.
Included in the selected historical financial data are certain amounts and statistics reported on a managedbasis. Our senior management evaluates business performance and allocates resources using financial data that ispresented on a managed basis. Managed loans consist of our on-balance sheet loan portfolio, loans held for saleand transferred loans against which beneficial interests have been issued through securitization transactions.Owned loans, a subset of managed loans, refers to our on-balance sheet loan portfolio and loans held for saleincludes the undivided seller’s interest we retain in our securitizations. A managed basis presentation, which isnot a presentation in accordance with accounting principles generally accepted in the United States (“GAAP”),involves reporting securitized loans with our owned loans in the managed basis statements of financial conditionand reporting the earnings on securitized loans in the same manner as the owned loans instead of as securitizationincome. See “Management’s Discussion and Analysis of Financial Condition and Results of Operations—GAAPto Managed Reconciliations.”
47
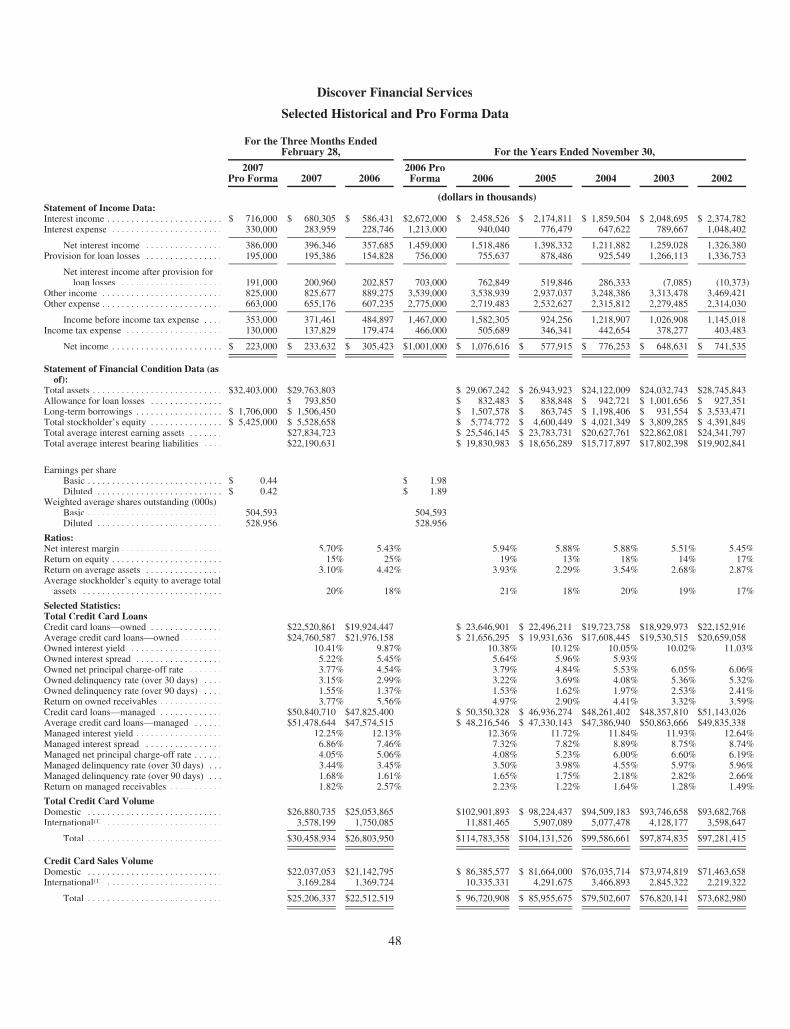
Discover Financial Services
Selected Historical and Pro Forma Data
For the Three Months EndedFebruary 28, For the Years Ended November 30,
2007Pro Forma 2007 2006
2006 ProForma 2006 2005 2004 2003 2002
(dollars in thousands)Statement of Income Data:Interest income . . . . . . . . . . . . . . . . . . . . . . . . $ 716,000 $ 680,305 $ 586,431 $2,672,000 $ 2,458,526 $ 2,174,811 $ 1,859,504 $ 2,048,695 $ 2,374,782Interest expense . . . . . . . . . . . . . . . . . . . . . . . 330,000 283,959 228,746 1,213,000 940,040 776,479 647,622 789,667 1,048,402
Net interest income . . . . . . . . . . . . . . . . 386,000 396,346 357,685 1,459,000 1,518,486 1,398,332 1,211,882 1,259,028 1,326,380Provision for loan losses . . . . . . . . . . . . . . . . 195,000 195,386 154,828 756,000 755,637 878,486 925,549 1,266,113 1,336,753
Net interest income after provision forloan losses . . . . . . . . . . . . . . . . . . . . . 191,000 200,960 202,857 703,000 762,849 519,846 286,333 (7,085) (10,373)
Other income . . . . . . . . . . . . . . . . . . . . . . . . . 825,000 825,677 889,275 3,539,000 3,538,939 2,937,037 3,248,386 3,313,478 3,469,421Other expense . . . . . . . . . . . . . . . . . . . . . . . . . 663,000 655,176 607,235 2,775,000 2,719,483 2,532,627 2,315,812 2,279,485 2,314,030
Income before income tax expense . . . . 353,000 371,461 484,897 1,467,000 1,582,305 924,256 1,218,907 1,026,908 1,145,018Income tax expense . . . . . . . . . . . . . . . . . . . . 130,000 137,829 179,474 466,000 505,689 346,341 442,654 378,277 403,483
Net income . . . . . . . . . . . . . . . . . . . . . . . $ 223,000 $ 233,632 $ 305,423 $1,001,000 $ 1,076,616 $ 577,915 $ 776,253 $ 648,631 $ 741,535
Statement of Financial Condition Data (asof):
Total assets . . . . . . . . . . . . . . . . . . . . . . . . . . . $32,403,000 $29,763,803 $ 29,067,242 $ 26,943,923 $24,122,009 $24,032,743 $28,745,843Allowance for loan losses . . . . . . . . . . . . . . . $ 793,850 $ 832,483 $ 838,848 $ 942,721 $ 1,001,656 $ 927,351Long-term borrowings . . . . . . . . . . . . . . . . . . $ 1,706,000 $ 1,506,450 $ 1,507,578 $ 863,745 $ 1,198,406 $ 931,554 $ 3,533,471Total stockholder’s equity . . . . . . . . . . . . . . . $ 5,425,000 $ 5,528,658 $ 5,774,772 $ 4,600,449 $ 4,021,349 $ 3,809,285 $ 4,391,849Total average interest earning assets . . . . . . . $27,834,723 $ 25,546,145 $ 23,783,731 $20,627,761 $22,862,081 $24,341,797Total average interest bearing liabilities . . . . $22,190,631 $ 19,830,983 $ 18,656,289 $15,717,897 $17,802,398 $19,902,841
Earnings per shareBasic . . . . . . . . . . . . . . . . . . . . . . . . . . . . $ 0.44 $ 1.98Diluted . . . . . . . . . . . . . . . . . . . . . . . . . . $ 0.42 $ 1.89
Weighted average shares outstanding (000s)Basic . . . . . . . . . . . . . . . . . . . . . . . . . . . . 504,593 504,593Diluted . . . . . . . . . . . . . . . . . . . . . . . . . . 528,956 528,956
Ratios:Net interest margin . . . . . . . . . . . . . . . . . . . . . 5.70% 5.43% 5.94% 5.88% 5.88% 5.51% 5.45%Return on equity . . . . . . . . . . . . . . . . . . . . . . . 15% 25% 19% 13% 18% 14% 17%Return on average assets . . . . . . . . . . . . . . . . 3.10% 4.42% 3.93% 2.29% 3.54% 2.68% 2.87%Average stockholder’s equity to average total
assets . . . . . . . . . . . . . . . . . . . . . . . . . . . . . 20% 18% 21% 18% 20% 19% 17%
Selected Statistics:Total Credit Card LoansCredit card loans—owned . . . . . . . . . . . . . . . $22,520,861 $19,924,447 $ 23,646,901 $ 22,496,211 $19,723,758 $18,929,973 $22,152,916Average credit card loans—owned . . . . . . . . $24,760,587 $21,976,158 $ 21,656,295 $ 19,931,636 $17,608,445 $19,530,515 $20,659,058Owned interest yield . . . . . . . . . . . . . . . . . . . 10.41% 9.87% 10.38% 10.12% 10.05% 10.02% 11.03%Owned interest spread . . . . . . . . . . . . . . . . . . 5.22% 5.45% 5.64% 5.96% 5.93%Owned net principal charge-off rate . . . . . . . 3.77% 4.54% 3.79% 4.84% 5.53% 6.05% 6.06%Owned delinquency rate (over 30 days) . . . . 3.15% 2.99% 3.22% 3.69% 4.08% 5.36% 5.32%Owned delinquency rate (over 90 days) . . . . 1.55% 1.37% 1.53% 1.62% 1.97% 2.53% 2.41%Return on owned receivables . . . . . . . . . . . . . 3.77% 5.56% 4.97% 2.90% 4.41% 3.32% 3.59%Credit card loans—managed . . . . . . . . . . . . . $50,840,710 $47,825,400 $ 50,350,328 $ 46,936,274 $48,261,402 $48,357,810 $51,143,026Average credit card loans—managed . . . . . . $51,478,644 $47,574,515 $ 48,216,546 $ 47,330,143 $47,386,940 $50,863,666 $49,835,338Managed interest yield . . . . . . . . . . . . . . . . . . 12.25% 12.13% 12.36% 11.72% 11.84% 11.93% 12.64%Managed interest spread . . . . . . . . . . . . . . . . 6.86% 7.46% 7.32% 7.82% 8.89% 8.75% 8.74%Managed net principal charge-off rate . . . . . . 4.05% 5.06% 4.08% 5.23% 6.00% 6.60% 6.19%Managed delinquency rate (over 30 days) . . . 3.44% 3.45% 3.50% 3.98% 4.55% 5.97% 5.96%Managed delinquency rate (over 90 days) . . . 1.68% 1.61% 1.65% 1.75% 2.18% 2.82% 2.66%Return on managed receivables . . . . . . . . . . . 1.82% 2.57% 2.23% 1.22% 1.64% 1.28% 1.49%
Total Credit Card VolumeDomestic . . . . . . . . . . . . . . . . . . . . . . . . . . . . $26,880,735 $25,053,865 $102,901,893 $ 98,224,437 $94,509,183 $93,746,658 $93,682,768International(1) . . . . . . . . . . . . . . . . . . . . . . . . 3,578,199 1,750,085 11,881,465 5,907,089 5,077,478 4,128,177 3,598,647
Total . . . . . . . . . . . . . . . . . . . . . . . . . . . . $30,458,934 $26,803,950 $114,783,358 $104,131,526 $99,586,661 $97,874,835 $97,281,415
Credit Card Sales VolumeDomestic . . . . . . . . . . . . . . . . . . . . . . . . . . . . $22,037,053 $21,142,795 $ 86,385,577 $ 81,664,000 $76,035,714 $73,974,819 $71,463,658International(1) . . . . . . . . . . . . . . . . . . . . . . . . 3,169,284 1,369,724 10,335,331 4,291,675 3,466,893 2,845,322 2,219,322
Total . . . . . . . . . . . . . . . . . . . . . . . . . . . . $25,206,337 $22,512,519 $ 96,720,908 $ 85,955,675 $79,502,607 $76,820,141 $73,682,980
48

For the Three MonthsEnded February 28, For the Years Ended November 30,
2007 2006 2006 2005 2004 2003 2002
(dollars in thousands)
Other Consumer LoansDomestic loan receivables . . . . . . . . . . . . . . . . . $ 90,846 $ 118,861 $ 95,849 $ 176,329 $ 287,909 $ 404,514 $ 412,349International loan receivables . . . . . . . . . . . . . . — 117,098 — 130,626 117,749 44,600 1,146
Total . . . . . . . . . . . . . . . . . . . . . . . . . . . . . . $ 90,846 $ 235,959 $ 95,849 $ 306,955 $ 405,658 $ 449,114 $ 413,495
Transactions Processed on Networks (000’s)Discover Network . . . . . . . . . . . . . . . . . . . . . . . 361,700 339,522 1,399,933 1,301,024 1,226,414 1,208,505 1,191,242PULSE Network(2) . . . . . . . . . . . . . . . . . . . . . . . 520,866 424,657 1,856,477 1,555,782 — — —
Total . . . . . . . . . . . . . . . . . . . . . . . . . . . . . . 882,566 764,179 3,256,410 2,856,806 1,226,414 1,208,505 1,191,242
Domestic Credit Card LoansCredit card loans—owned . . . . . . . . . . . . . . . . . $19,636,991 $17,251,924 $20,694,395 $20,434,977 $18,606,211 $17,586,884 $20,041,640Average credit card loans—owned . . . . . . . . . . $21,841,166 $19,911,585 $19,120,946 $18,644,660 $16,228,520 $17,938,722 $18,929,119Owned interest yield . . . . . . . . . . . . . . . . . . . . . 10.55% 10.04% 10.50% 10.16% 10.13% 10.15% 11.09%Owned interest spread . . . . . . . . . . . . . . . . . . . . 5.37% 5.57% 5.71% 6.03% 6.09% 5.71% 5.62%Owned net principal charge-off rate . . . . . . . . . 3.43% 4.66% 3.64% 4.95% 5.75% 6.34% 6.32%Owned delinquency rate (over 30 days) . . . . . . 2.97% 2.97% 3.05% 3.69% 4.19% 5.54% 5.59%Owned delinquency rate (over 90 days) . . . . . . 1.46% 1.40% 1.44% 1.61% 2.03% 2.62% 2.53%Credit card loans-managed . . . . . . . . . . . . . . . . $46,266,012 $43,641,982 $45,706,222 $44,261,121 $45,690,728 $46,141,977 $49,031,750Average credit card loans—managed . . . . . . . . $46,870,259 $44,663,714 $44,277,249 $44,736,702 $45,018,288 $48,590,494 $48,105,399Managed interest yield . . . . . . . . . . . . . . . . . . . . 12.45% 12.25% 12.53% 11.78% 11.91% 12.05% 12.73%Managed interest spread . . . . . . . . . . . . . . . . . . 7.03% 7.59% 7.45% 7.95% 9.06% 8.94% 8.86%Managed net principal charge-off rate . . . . . . . . 3.81% 5.08% 3.96% 5.30% 6.12% 6.75% 6.30%Managed delinquency rate (over 30 days) . . . . . 3.31% 3.43% 3.39% 3.98% 4.65% 6.09% 6.10%Managed delinquency rate (over 90 days) . . . . . 1.63% 1.62% 1.59% 1.75% 2.24% 2.88% 2.72%
International Credit Card LoansCredit card loans—owned(1) . . . . . . . . . . . . . . . . $ 2,883,870 $ 2,672,523 $ 2,952,506 $ 2,061,234 $ 1,117,547 $ 1,343,089 $ 2,111,276Average credit card loans—owned(1) . . . . . . . . . $ 2,919,421 $ 2,064,573 $ 2,535,349 $ 1,286,976 $ 1,379,925 $ 1,591,793 $ 1,729,939Owned interest yield . . . . . . . . . . . . . . . . . . . . . 9.38% 8.16% 9.51% 9.63% 9.13% 8.51% 10.40%Owned interest spread . . . . . . . . . . . . . . . . . . . . 4.14% 4.24% 5.15% 5.07% 3.87% 3.34% 5.32%Owned net principal charge-off rate . . . . . . . . . 6.29% 3.41% 4.94% 3.28% 2.94% 2.80% 3.26%Owned delinquency rate (over 30 days) . . . . . . 4.35% 3.11% 4.36% 3.78% 2.23% 2.93% 2.76%Owned delinquency rate (over 90 days) . . . . . . 2.16% 1.15% 2.16% 1.73% 0.96% 1.41% 1.26%Credit card loans-managed(1) . . . . . . . . . . . . . . . $ 4,574,698 $ 4,183,418 $ 4,644,106 $ 2,675,153 $ 2,570,674 $ 2,215,833 $ 2,111,276Average credit card loans—managed(1) . . . . . . . $ 4,608,384 $ 2,910,801 $ 3,939,297 $ 2,593,441 $ 2,368,652 $ 2,273,172 $ 1,729,939Managed interest yield . . . . . . . . . . . . . . . . . . . . 10.25% 10.39% 10.38% 10.72% 10.62% 9.44% 10.40%Managed interest spread . . . . . . . . . . . . . . . . . . 5.16% 5.59% 5.71% 5.72% 5.57% 4.65% 5.32%Managed net principal charge-off rate . . . . . . . . 6.45% 4.70% 5.45% 4.10% 3.87% 3.44% 3.26%Managed delinquency rate (over 30 days) . . . . . 4.75% 3.70% 4.58% 3.95% 2.78% 3.29% 2.76%Managed delinquency rate (over 90 days) . . . . . 2.25% 1.51% 2.22% 1.81% 1.22% 1.60% 1.26%
(1) The Goldfish and Liverpool Victoria portfolios were acquired in 2006.(2) PULSE was acquired in 2005.
49
MANAGEMENT’S DISCUSSION AND ANALYSIS OFFINANCIAL CONDITION AND RESULTS OF OPERATIONS
The following discussion and analysis of our financial condition and results of operations should be read inconjunction with our audited combined financial statements and related notes included elsewhere in thisinformation statement. Some of the information contained in this discussion and analysis constitutes forward-looking statements that involve risks and uncertainties. Actual results could differ materially from thosediscussed in these forward-looking statements. Factors that could cause or contribute to these differencesinclude, but are not limited to, those discussed below and elsewhere in this information statement particularlyunder “Special Note Regarding Forward-Looking Statements” and “Risk Factors.”
Unless otherwise specified, references to Notes to the audited combined financial statements are to theNotes to our audited combined financial statements as of November 30, 2006 and 2005 and for the three-yearperiod ended November 30, 2006, and references to Notes to the unaudited condensed combined financialstatements are to the Notes to our unaudited condensed combined financial statements as of February 28, 2007and for the three months ended February 28, 2007 and 2006.
Introduction and Overview
We are a leading credit card issuer and electronic payment services company with one of the mostrecognized brands in U.S. financial services. We offer credit and prepaid cards and other financial products andservices to qualified customers in the United States and United Kingdom, and provide payment processing andrelated services to merchants and financial institutions in the United States. Our fiscal year ends on November 30of each year.
We strive to increase net income and achieve other business objectives by growing credit card loanreceivables and increasing volume on our payments networks to generate interest and fee revenue, whilecontrolling loan losses and expenses. Our primary revenues come from interest income earned on credit card loanreceivables, securitization income derived from the transfer of credit card loan receivables and subsequentissuance of beneficial interests through securitization transactions, and fees earned from cardmembers, merchantsand issuers. Our primary expenses include funding costs (interest expense), loan losses, cardmember rewards,and expenses incurred to grow and service our credit card loan receivables (e.g., compensation expense andmarketing).
We are actively pursuing a strategy to increase acceptance of Discover Network cards among small andmid-size merchants. We have entered into or are currently pursuing arrangements with all major merchantacquirers to sign new and service existing small and mid-size merchants for acceptance of Discover Networkcards.
We have undertaken a number of initiatives in an effort to restore profitability to our U.K. operations overthe long term and offset the impact of higher loan losses and lower interchange and fee revenues. Theseinitiatives include insourcing of our processing platform, consolidation of our operational centers, reductions instaffing, and achieving procurement efficiencies. In addition, we have revised certain risk policies, modifiedpricing for portions of the portfolio, implemented annual fees for certain customers, introduced new fee productsand modified certain transaction based fees. We will monitor the impact of these initiatives to evaluate theireffectiveness. However, we do not anticipate our U.K. operations becoming profitable in the near future and weexpect our losses in the United Kingdom to increase in the second quarter.
Our business activities have been funded primarily through the process of asset securitization, the raising ofconsumer deposits, and intercompany lending from Morgan Stanley. In a credit card securitization, loanreceivables are first transferred to securitization trusts, from which beneficial interests are issued to investors. Wecontinue to own and service the accounts that generate the securitized loans. The trusts utilized by us to facilitateasset securitization transactions are not our subsidiaries and are independent from us. These trusts are excluded
50

from our audited combined financial statements in accordance with accounting principles generally accepted inthe United States (“GAAP”). Because our securitization activities qualify as sales under GAAP and accordinglyare not treated as secured financing transactions, we remove credit card loan receivables equal to the amount ofthe investor interests in securitized loans from the combined statements of financial condition. As a result, assetsecuritizations have a significant effect on our combined financial statements in that the portions of interestincome, provision for loan losses and certain components of other income related to the transferred loans againstwhich beneficial interests have been issued through securitization transactions are no longer recorded in ourcombined statements of income; however, they remain significant factors in determining the securitizationincome we receive on our retained beneficial interests in those transactions. Securitization income is our secondmost significant revenue category.
Our senior management evaluates business performance and allocates resources using financial data that ispresented on a managed basis. Managed loans consist of our on-balance sheet loan portfolio, loans held for saleand loan receivables that have been transferred and against which beneficial interests have been issued throughsecuritization transactions. Owned loans, a subset of managed loans, refers to our on-balance sheet loan portfolioand loans held for sale and includes the undivided seller’s interest we retain in our securitizations. A managedbasis presentation, which is a non-GAAP presentation, involves reporting securitized loans with our owned loansin the managed basis statements of financial condition and reporting the earnings on securitized loans in the samemanner as the owned loans instead of as securitization income. The managed basis presentation generallyreverses the effects of securitization transactions; however, there are certain assets that arise from securitizationtransactions that are not reversed. Specifically, these assets are the cash collateral accounts that provide creditenhancement to the investors in the transactions and cardmember payments allocated to the securitized loans,both of which are held at the trusts, and the interest-only strip receivable, reflecting the estimated fair value of theexcess cash flows allocated to securitized loans. Income derived from these assets representing interest earned onaccounts at the trusts and changes in the fair value of the interest-only strip receivable also are not reversed in amanaged presentation.
Management believes it is useful for investors to consider the credit performance of the entire managed loanportfolio to understand the quality of loan originations and the related credit risks inherent in the owned portfolioand retained interests in our securitizations. Managed loan data is also relevant because we service the securitizedand owned loans, and the related accounts, in the same manner without regard to ownership of the loans.
Financial measures using managed data are non-GAAP financial measures. Whenever managed data ispresented in this information statement, a reconciliation of the managed data to the most directly comparableGAAP-basis financial measure is provided. See “—GAAP to Managed Reconciliations.”
Key Developments Impacting Reported Results
• In October 2005, new U.S. bankruptcy legislation took effect making it more difficult to declarebankruptcy. We experienced a surge in bankruptcy receipts leading up to the effective date of thislegislation. We charge off bankrupt accounts at the end of the month that is 60 days following thereceipt of notification of the bankruptcy, so in the second half of calendar 2005 we experienced highercharge-offs as a result of this legislation. October 2005 was the peak month for bankruptcy receiptsduring this transition to new legislation. October receipts, in accordance with our policy, were chargedoff in December 2005.
The results of 2005 were adversely impacted by a higher level of bankruptcy charge-offs, a negativerevaluation of the interest-only strip receivable reflecting the impact on projected excess spread ofelevated charge-offs in December 2005 and additional provisions to the allowance for loan losses forbankrupt accounts in the portfolio at November 30, 2005. We experienced a dramatic decline inbankruptcy receipts following the effective date of the new U.S. bankruptcy legislation. The results of2006 benefited from a significantly lower level of bankruptcy charge-offs, a favorable revaluation of
51

the interest-only strip receivable reflecting higher excess spread projections and a decrease in the levelof allowance for loan losses. We believe the passing of this legislation negatively impacted 2005 andbenefited the overall results of 2006.
• In addition to the previously described impact of the surge in bankruptcy receipts, the underlying creditquality of loan receivables continued to improve in 2006 and 2005 as compared to prior periods.
• The Federal Reserve raised short-term interest rates by 125 basis points and 200 basis points in 2006and 2005, respectively. Certain of our interest earning assets and interest bearing liabilities havefloating rates which are tied to short-term market indices such as the prime rate or LIBOR (LondonInterbank Offered Rate). Accordingly, the yields on floating rate interest earning assets, and the costson floating rate interest bearing liabilities have increased over these periods. These impacts were notequal and offsetting, as our proportion of floating rate interest bearing liabilities is generally greaterthan our proportion of floating rate interest earning assets. The rising interest rate environment alsocaused a decrease in the excess spread recognized on securitized loans as well as a negative impact onthe revaluation of the interest-only strip receivable since nearly all rates of return paid to investors areat floating rates and interest yield on these securitized loans did not increase by a proportionateamount.
• During 2006 and 2005, certain matters caused our use of certain funding sources, including the U.S.credit card securitization market, to vary from our historical use of this market for funding ourbusiness. Following Morgan Stanley’s announcement in April 2005 to explore a spin-off of Discover,the counterparty credit ratings on Discover Bank were lowered to their current levels. As a result of ourlower credit ratings, we lost access to Federal Funds as a significant source of short-term financing, butwere able to mitigate the impact by increasing short-term borrowings from Morgan Stanley.
In response to the exploration of the spin-off, Moody’s placed the asset-backed securities issueddomestically by the trust under review for a possible downgrade, which we believe contributed to atemporary disruption in our ability to access the securitization markets. This disruption lastedapproximately five months, at which time Moody’s re-affirmed the ratings on the asset backedsecurities. This deferral of new securitization transactions, as well as a high level of maturities ofexisting securitization transactions and the discontinued issuance of new short-term certificates fromthe Discover securitization trust in response to higher projected charge-offs following the October 2005effective date of the new U.S. bankruptcy legislation, caused the level of securitized loans in 2005 todecrease below prior year levels. These effects lingered into 2006, causing outstanding securitizationtransactions to remain somewhat lower than historical levels on average. In August 2005, MorganStanley announced that it would not pursue a spin-off of Discover.
• In October 2004, the DOJ prevailed in its antitrust lawsuit against Visa and MasterCard whichchallenged their exclusionary rules—rules that effectively precluded us from offering network servicesto financial institutions. Since then, we have accelerated our network growth by entering the debitmarket with the acquisition of PULSE, one of the nation’s leading ATM/debit networks, and by signingcard issuing agreements with a number of financial institutions.
• During 2004, in response to industry-wide regulatory guidance in the United States, we modified ouroverlimit fee policies and procedures to stop charging overlimit fees for accounts meeting specificcriteria. These modifications resulted in lower levels of overlimit fee revenue in 2006 and 2005, whichis included in loan fee income.
• During the last three years, there have been increasing regulatory initiatives in the United Kingdomwith respect to late and overlimit fees, interchange fees and the sale of retail insurance products and arelaxation of bankruptcy laws that have made it more difficult to collect on delinquent accounts andeasier for cardmembers to declare bankruptcy. These changes contributed to increased U.K. bankruptcycharge-offs and lower late fee, overlimit fee and interchange revenues.
• In February 2006, we acquired the Goldfish credit card business in the United Kingdom, addingapproximately $1.4 billion in receivables.
52
Segments
We manage our business activities in three segments: U.S. Card, International Card and Third-PartyPayments. In compiling the segment results that follow, the U.S. Card segment bears all overhead costs that arenot specifically associated with a particular segment and all costs associated with Discover Network marketing,servicing and infrastructure, with the exception of an allocation of direct and incremental costs driven by theThird-Party Payments segment.
U.S. Card. The U.S. Card segment offers Discover Card-branded credit cards issued to individuals andsmall businesses over the Discover Network. Also included within the U.S. Card segment are our other consumerproducts and services businesses, including prepaid and other consumer lending and deposit products offeredthrough our subsidiary, Discover Bank.
International Card. The International Card segment offers consumer finance products and services in theUnited Kingdom, including Morgan Stanley-branded, Goldfish-branded and various affinity-branded credit cardsissued on the MasterCard and Visa networks.
Third-Party Payments. The Third-Party Payments segment includes PULSE and our third-party paymentsbusiness.
53

The following table presents segment data for the three months ended February 28, 2007 and 2006, and theyears ended November 30, 2006, 2005 and 2004, on a managed basis (dollars in thousands), and a reconciliationto a GAAP presentation.
Managed basisGAAPbasis
U.S. CardInternational
CardThird-PartyPayments Total
SecuritizationAdjustment(1) Total
For the Three Months Ended February 28,
2007Interest income . . . . . . . . . . . . . . . . . . . . . . . . $1,481,992 $117,118 $ 574 $1,599,684 $ (919,379) $ 680,305Interest expense . . . . . . . . . . . . . . . . . . . . . . . 593,610 52,201 15 645,826 (361,867) 283,959
Net interest income . . . . . . . . . . . . . . . . . . . . 888,382 64,917 559 953,858 (557,512) 396,346Provision for loan losses . . . . . . . . . . . . . . . . 406,076 76,584 — 482,660 (287,274) 195,386Other income . . . . . . . . . . . . . . . . . . . . . . . . . 490,003 34,754 30,682 555,439 270,238 825,677Other expense . . . . . . . . . . . . . . . . . . . . . . . . 571,283 64,572 19,321 655,176 — 655,176
Income (loss) before income tax expense . . . $ 401,026 $ (41,485) $ 11,920 $ 371,461 $ — $ 371,461
2006Interest income . . . . . . . . . . . . . . . . . . . . . . . . $1,397,284 $ 77,488 $ 343 $1,475,115 $ (888,684) $ 586,431Interest expense . . . . . . . . . . . . . . . . . . . . . . . 503,875 35,240 13 539,128 (310,382) 228,746
Net interest income . . . . . . . . . . . . . . . . . . . . 893,409 42,248 330 935,987 (578,302) 357,685Provision for loan losses . . . . . . . . . . . . . . . . 466,573 40,631 — 507,204 (352,376) 154,828Other income . . . . . . . . . . . . . . . . . . . . . . . . . 600,694 35,335 27,320 663,349 225,926 889,275Other expense . . . . . . . . . . . . . . . . . . . . . . . . 536,894 47,754 22,587 607,235 — 607,235
Income (loss) before income tax expense . . . $ 490,636 $ (10,802) $ 5,063 $ 484,897 $ — $ 484,897
For the Years Ended November 30,
2006Interest income . . . . . . . . . . . . . . . . . . . . . . . . $5,748,698 $416,986 $ 1,801 $6,167,485 $(3,708,959) $2,458,526Interest expense . . . . . . . . . . . . . . . . . . . . . . . 2,160,569 176,997 23 2,337,589 (1,397,549) 940,040
Net interest income . . . . . . . . . . . . . . . . . . . . 3,588,129 239,989 1,778 3,829,896 (2,311,410) 1,518,486Provision for loan losses . . . . . . . . . . . . . . . . 1,663,472 238,172 — 1,901,644 (1,146,007) 755,637Other income . . . . . . . . . . . . . . . . . . . . . . . . . 2,097,676 165,160 110,700 2,373,536 1,165,403 3,538,939Other expense . . . . . . . . . . . . . . . . . . . . . . . . 2,381,880 254,074 83,529 2,719,483 — 2,719,483
Income (loss) before income tax expense . . . $1,640,453 $ (87,097) $ 28,949 $1,582,305 $ — $1,582,305
2005Interest income . . . . . . . . . . . . . . . . . . . . . . . . $5,409,381 $294,343 $ 673 $5,704,397 $(3,529,586) $2,174,811Interest expense . . . . . . . . . . . . . . . . . . . . . . . 1,671,331 129,671 95 1,801,097 (1,024,618) 776,479
Net interest income . . . . . . . . . . . . . . . . . . . . 3,738,050 164,672 578 3,903,300 (2,504,968) 1,398,332Provision for loan losses . . . . . . . . . . . . . . . . 2,263,617 126,462 — 2,390,079 (1,511,593) 878,486Other income . . . . . . . . . . . . . . . . . . . . . . . . . 1,753,828 97,691 92,143 1,943,662 993,375 2,937,037Other expense . . . . . . . . . . . . . . . . . . . . . . . . 2,272,126 167,635 92,866 2,532,627 — 2,532,627
Income (loss) before income tax expense . . . $ 956,135 $ (31,734) $ (145) $ 924,256 $ — $ 924,256
2004(2)
Interest income . . . . . . . . . . . . . . . . . . . . . . . . $5,441,349 $259,746 $ — $5,701,095 $(3,841,591) $1,859,504Interest expense . . . . . . . . . . . . . . . . . . . . . . . 1,234,400 104,766 — 1,339,166 (691,544) 647,622
Net interest income . . . . . . . . . . . . . . . . . . . . 4,206,949 154,980 — 4,361,929 (3,150,047) 1,211,882Provision for loan losses . . . . . . . . . . . . . . . . 2,713,115 83,107 — 2,796,222 (1,870,673) 925,549Other income . . . . . . . . . . . . . . . . . . . . . . . . . 1,878,558 90,454 — 1,969,012 1,279,374 3,248,386Other expense . . . . . . . . . . . . . . . . . . . . . . . . 2,163,246 152,566 — 2,315,812 — 2,315,812
Income before income tax expense . . . . . . . . $1,209,146 $ 9,761 $ — $1,218,907 $ — $1,218,907
(1) The Securitization Adjustment column presents the effect of loan securitization by recharacterizing as securitization income the portionsof the following items that relate to the securitized loans: interest income, interest expense, provision for loan losses, discount andinterchange revenue and loan fee revenues. Securitization income is reported in other income.
(2) For the fiscal year ended November 30, 2004, the Third-Party Payments segment was insignificant and did not include PULSE, whichwas acquired on January 12, 2005.
54

The segment discussions that follow for the three months ended February 28, 2007 and 2006, and the yearsended November 30, 2006, 2005 and 2004 are on a managed basis.
U.S. Card
The U.S. Card segment reported pretax income of $401.0 million for the three months ended February 28,2007, down 18% as compared to the three months ended February 28, 2006. The decrease in pretax income wasdriven by a decrease in other income and an increase in other expense partially offset by lower provision for loanlosses. Other income decreased $110.7 million, or 18%, due to a lower valuation of our interest only stripreceivable and a lower level of new securitization transactions. The valuation of our interest only strip receivablein the three months ended February 28, 2006 benefited from the effect of a sharp decline in bankruptcy receiptsand lower level of related charge-offs following the October 2005 enactment of new U.S. bankruptcy legislation.The level of new securitization transactions in the three months ended February 28, 2006 was higher than thelevel in the 2007 period as 2006 reflected efforts to replace a high level of maturities of existing securitizationtransactions as well as to meet the additional funding requirements resulting from the discontinued issuance ofnew short-term certificates from the Discover securitization trust. See “—Introduction and Overview—KeyDevelopments Impacting Reported Results.” Future levels of new securitization transactions will vary quarterlyand will be largely driven by the level of maturing securitization transactions, receivables growth and asset-backed market demand. Other expense increased $34.4 million, or 6%, reflecting increased marketing costsassociated with account acquisition and holiday promotional spending, higher legal fees primarily related to thelitigation against Visa and MasterCard, and increased consulting costs. Provision for loan losses decreased $60.5million, or 13%, reflecting a lower level of bankruptcy charge-offs due to a decline in bankruptcy filings partiallyoffset by an increase in contractual charge-offs.
For the three months ended February 28, 2007, managed credit card loans grew 6%, to $46.3 billion ascompared to the three months ended February 28, 2006, driven by record transaction volume partially offset byhigher cardmember payment rates. Sales volume increased 4%, primarily reflecting increased cardmember usage.Managed interest spread compressed 56 basis points as increased cost of funds outpaced higher interest yield.The managed net charge-off rate of 3.81% decreased 127 basis points, reflecting strong credit quality and lowerbankruptcy charge-offs. The over 30 and over 90 day delinquency rates decreased 12 basis points and increased 1basis point to 3.31% and 1.63%, respectively, due to a shift to loans with lower risk profiles and improvedcollection experience.
In 2007, we expect bankruptcy receipts to rise from the abnormally low levels experienced in 2006, andaccordingly to have an adverse impact on our results of operations as compared to 2006. Higher bankruptcyreceipts will have the effect of increasing loan losses, increasing provisions to the allowance for loan losses anddecreasing excess spread projections on securitization transactions, thereby adversely impacting the valuation ofthe interest-only strip receivable.
The U.S. Card segment produced strong results for the year ended November 30, 2006, with pretax incomeof $1.6 billion, up 72%, as compared to November 30, 2005. These results reflected the strong credit quality ofthe domestic managed credit card portfolio and the continued favorable impact of the new U.S. bankruptcylegislation on charge-offs, the revaluation of the interest-only strip receivable and the allowance for loan losses.The increase in pretax income was due to higher other income and a lower provision for loan losses partiallyoffset by lower net interest income and higher other expenses. Other income increased $343.8 million, or 20%,due primarily to an increase in the fair value of our interest-only strip receivable as a result of lower bankruptcyreceipts and our estimate of its related favorable impact on future charge-offs as well as a higher level of newsecuritization transactions. Provision for loan losses decreased $600.1 million, or 27%, reflecting strong creditquality and lower bankruptcy charge-offs. Net interest income decreased $149.9 million, or 4%, as higher interestexpense was partially offset by higher interest income. The increase in interest expense was primarily due to anincrease in the cost of funds driven by the rising interest rate environment. The increase in interest incomereflects lower interest charge-offs due to improved credit quality and the effect of a rising interest rate
55

environment on floating rate credit card loan receivables partially offset by higher promotional rate balances.Other expense increased $109.8 million, or 5%, driven by higher compensation and benefits expense andincreased legal fees, primarily related to the litigation against Visa and MasterCard, and consulting costs,partially offset by lower cardmember fraud expense.
For the year ended November 30, 2006, managed credit card loans grew 3%, to $45.7 billion, driven byrecord transaction volume partially offset by higher cardmember payment rates. Sales volume increased 6%,primarily reflecting increased cardmember usage and higher prices of gasoline (which represents approximately8% of sales volume). Managed interest spread compressed 50 basis points as increased cost of funds outpacedhigher interest yield. The managed net charge-off rate of 3.96% decreased 134 basis points, reflecting strongcredit quality and lower bankruptcy charge-offs. Over 30 and over 90 day delinquency rates decreased 59 basispoints and 16 basis points to 3.39% and 1.59%, respectively, due to a shift to loans with lower risk profiles andimproved collection experience.
A small portion of our newly-originated credit cards are issued to borrowers with FICO scores below 660 atthe time of account origination, but who have met our other specific underwriting criteria indicating to us thatthey have the ability and willingness to pay. We have restricted this initiative to potential cardmembers withFICO scores above 600, and the majority of these new accounts had FICO scores at origination in the 640 to 660range. At November 30, 2006, less than 2.5% of receivables related to new accounts originated within the yearwere at FICO scores below 660 at time of origination, and for 2007 originations we project that this amount atyear end will be less than 3.5%.
While we seek to carefully control the level of new account originations at FICO scores below 660, overtime some accounts that were originated at higher FICO scores will migrate to levels below 660 due tocircumstances that affect their credit performance. Consistent with industry standards for reporting securitizationU.S. master trust data, we reported that as of January 31, 2007, approximately 26% of receivable balances in thedomestic trust related to accounts with FICO scores below 660 at that date. This level is down fromapproximately 29% at January 31, 2006. While these percentages relate solely to receivables held in the trust, webelieve they are representative of our managed card receivables portfolio.
Pretax income decreased $253.0 million, or 21%, to $956.1 million for the year ended November 30, 2005as compared to the year ended November 30, 2004, primarily due to lower net interest income and other income,and higher other expense partially offset by lower provision for loan losses. Net interest income decreased$468.9 million, or 11%, primarily due to increased interest expense related to the effect of the rising interest rateenvironment on funding costs and the increase in bankruptcy receipts in the fourth quarter as a result of theOctober 2005 effective date of the new U.S. bankruptcy legislation. This legislation resulted in an acceleration ofcharge-offs in 2005 and early 2006, a negative revaluation of the interest-only strip receivable in 2005 andadditional provisions to the allowance for loan losses in 2005. Interest income was relatively unchanged as theimpact of the increase in the prime rate on floating rate receivables was largely offset by a decline in higher rateloans due to improved credit quality. Other income decreased $124.7 million, or 7%, due to lower late andoverlimit fees as well as a decrease in the fair value of our interest-only strip receivable as a result of theprojected impact of higher bankruptcy receipts on charge-offs and a lower level of outstanding securitizations atyear-end. The decline in late fees reflected lower levels of delinquent accounts. The decrease in overlimit feeswas due to a modification of our overlimit fee policies and procedures, in response to industry-wide regulatoryguidance, to stop charging such fees for accounts meeting specific criteria, as well as lower overlimit feeincidences. The provision for loan losses declined by $449.5 million, or 17%, due to improvement in creditquality partially offset by the impact of higher bankruptcy receipts in advance of the October 2005 effective dateof the new U.S. bankruptcy legislation. Other expense increased $108.9 million, or 5%, primarily due toincreased employee compensation and benefits costs and higher overhead allocations from Morgan Stanley. Theincrease in overhead allocations was due primarily to our assessed share ($29 million) of costs associated withMorgan Stanley senior management changes.
56
For the year ended November 30, 2005, managed credit card loans decreased $1.4 billion, or 3%, to$44.3 billion driven by increased cardmember payments, consistent with industry trends, partially offset by highersales volumes. Managed interest spread compressed 112 basis points due to increased cost of funds and lowerinterest yield reflecting improved credit quality. The net charge-off rate declined 82 basis points to 5.30% reflectingimproved credit quality partially offset by an increase in bankruptcy charge-offs. The over 30 and over 90 daydelinquency rates dropped 67 basis points and 49 basis points to 3.98% and 1.75%, respectively, due to a shift toloans with lower risk profiles and improved collection experience.
International Card
The International Card segment reported a pretax loss of $41.5 million for the three months endedFebruary 28, 2007, an increase of $30.7 million over the loss incurred for the three months ended February 28,2006, primarily driven by the acquisition of the Goldfish business and the continued deterioration of theconsumer credit environment in the United Kingdom. The three months ended February 28, 2006 includesminimal revenues and expenses related to the Goldfish business as it was acquired in late February 2006. Theincrease in pretax loss in 2007 was driven by increases in the provision for loan losses and other expensepartially offset by higher net interest income. The provision for loan losses increased $36.0 million, or 88%, as aresult of a full quarter of charge-offs related to the Goldfish business and the weakened credit environment. Otherexpense increased $16.8 million, or 35%, and net interest income increased $22.7 million, or 54%, drivenprimarily by a full quarter of revenues and expenses related to the Goldfish business.
For the three months ended February 28, 2007, managed credit card loans grew $391 million, or 9%, to $4.6billion as compared to the three months ended February 28, 2006. Transaction volume increased 104% due to afull quarter of Goldfish volume in 2007 and increased cardmember usage. Managed interest spread compressed43 basis points due to a lower yield and a higher cost of funds. The lower interest yield reflected the lowerrevolving rate of the Goldfish portfolio. Credit quality continued to deteriorate as the net charge-off rate rose 175basis points to 6.45% and the over 30 and over 90 day delinquency rates increased to 4.75% and 2.25%,respectively. Delinquent receivables purchased with the Goldfish business in February 2006 were recorded attheir estimated fair value, which was significantly lower than the unpaid balance. This had the effect of loweringthe delinquency rate at February 28, 2006.
The International Card segment reported a pretax loss of $87.1 million for the year ended November 30,2006, an increase of $55.4 million over the loss incurred for the year ended November 30, 2005, primarily as aresult of the acquisition of the Goldfish business and the deteriorating consumer credit environment in the UnitedKingdom. The increase in pretax loss was driven by increases in the provision for loan losses and other expensepartially offset by higher net interest income and other income. The provision for loan losses increased $111.7million, or 88%, as a result of the weakened credit environment in the United Kingdom, the Goldfish acquisitionand increased bankruptcy charge-offs. Other expense increased $86.4 million, or 52%, primarily due toincremental costs as a result of the acquisition of the Goldfish business. Net interest income increased $75.3million, or 46%, and other income increased $67.5 million, or 69%, primarily related to a higher level ofmanaged loan receivables as a result of the acquisition of the Goldfish business. The increase in other incomewas partially offset by lower levels of late and overlimit fee revenues resulting from regulatory changes whichlimited the per-incident amount of fees that can be charged. We expect the adverse credit environment tocontinue in 2007 and affect our International Card segment’s results.
For the year ended November 30, 2006, managed credit card loans grew $2.0 billion, or 74%, to $4.6 billionprimarily due to the addition of the Goldfish business. Managed interest spread was flat compared to the prioryear as lower yield was offset by lower cost of funds. Credit quality continued to deteriorate as the net charge-offrate rose 135 basis points to 5.45%, and the over 30 and over 90 day delinquency rates increased to 4.58% and2.22%, respectively.
The International Card segment reported a pretax loss of $31.7 million for the year ended November 30,2005 versus pretax income of $9.8 million for the year ended November 30, 2004, driven by increased provision
57

for loan losses and higher other expense. The provision for loan losses increased by $43.4 million, or 52%,reflecting deteriorating credit quality. Other expense increased $15.1 million, or 10%, due to higher overheadallocations from Morgan Stanley. The increase in foreign exchange rates also had an impact on reported results.
For the year ended November 30, 2005, managed credit card loans grew $104.5 million, or 4%, to $2.7billion driven by increased sales volume partially offset by higher payments. Credit quality declined as the netcharge-off rate increased 23 basis points to 4.10% and over 30 and over 90 day delinquency rates rose to 3.95%and 1.81%, respectively.
Third-Party Payments
The Third-Party Payments segment reported pretax income of $11.9 million for the three months endedFebruary 28, 2007, a $6.9 million increase from the three months ended February 28, 2006 driven by increasedother income and lower other expense. Other income increased $3.4 million, or 12%, due to increased transactionvolume. Other expense decreased $3.3 million, or 14%, primarily related to a one-time contract termination feepaid in the three months ended February 28, 2006.
Transactions processed on the PULSE Network increased 96 million, or 23%, to 521 million for the threemonths ended February 28, 2007 due to increased point of sale and signature debit volume.
The Third-Party Payments segment reported pretax income of $28.9 million for the year endedNovember 30, 2006 versus a pretax loss of $0.1 million for the year ended November 30, 2005 driven byincreased other income and lower other expense. Other income increased $18.5 million, or 20%, due to highervolume from third-party card issuers signed in mid-2005 and higher transaction processing revenue related toincreased volume on the PULSE Network. Other expense decreased $9.3 million, or 10%, as a result of one-timecosts incurred in 2005 in connection with third-party issuer signings partially offset by higher transactionprocessing expense related to increased volumes on the PULSE Network.
Transactions processed on the PULSE Network increased 300 million, or 19%, to 1.9 billion for the yearended November 30, 2006.
GAAP to Managed Reconciliations
Transferred loans against which beneficial interests have been issued through securitization transactions areremoved from our combined statements of financial condition, and the portions of interest income, provision forloan losses and certain components of other income related to the transferred loans against which beneficialinterests have been issued through securitization transactions are no longer recorded in our combined statementsof income; however, they remain significant factors in determining the securitization income we receive on ourretained beneficial interests in those transactions. Management believes it is useful for investors to consider thecredit performance of the entire managed loan portfolio to understand the quality of loan originations and therelated credit risks inherent in the owned portfolio and retained interests in securitization. Loan receivables on aGAAP (or owned) basis and related performance measures, including yield, charge-offs and delinquencies canvary from those presented on a managed basis. Generally, loan receivables included in the securitization trustsare derived from accounts that are more seasoned, while owned loan receivables represent a greater concentrationof newer accounts, occurring as a result of the degree to which receivables from newer accounts are added to thetrusts. The seasoning of an account is measured by the age of the account relationship. In comparison to moreseasoned accounts, loan receivables of newer accounts typically carry lower interest yields resulting fromintroductory offers to new cardmembers and lower charge-offs and delinquencies.
58

Beginning with “—Earnings Summary,” the discussion of GAAP results is presented on a combined basiswith any material differences between segment performance specifically identified. The table that followsprovides a GAAP to managed reconciliation of loan receivables and related statistics that are impacted by assetsecuritization:
Reconciliation of GAAP to Managed DataThree Months Ended
February 28, Years Ended November 30,
2007 2006 2006 2005 2004
Total Credit Card LoansEnding Balance
GAAP loan receivables . . . . . . . . $22,520,861 $19,924,447 $23,646,901 $22,496,211 $19,723,758Securitized loans . . . . . . . . . . . . . 28,319,849 27,900,953 26,703,427 24,440,063 28,537,644
Total managed loans . . . . . . $50,840,710 $47,825,400 $50,350,328 $46,936,274 $48,261,402
Average BalanceGAAP loan receivables . . . . . . . . $24,760,587 $21,976,158 $21,656,295 $19,931,636 $17,608,445Securitized loans . . . . . . . . . . . . . 26,718,057 25,598,357 26,560,251 27,398,507 29,778,495
Total managed loans . . . . . . $51,478,644 $47,574,515 $48,216,546 $47,330,143 $47,386,940
Interest YieldGAAP loan receivables . . . . . . . . 10.41% 9.87% 10.38% 10.12% 10.05%Securitized loans . . . . . . . . . . . . . 13.96% 14.08% 13.96% 12.88% 12.90%
Total managed loans . . . . . . 12.25% 12.13% 12.36% 11.72% 11.84%Interest Spread
GAAP loan receivables . . . . . . . . 5.22% 5.45% 5.64% 5.96% 5.93%Securitized loans . . . . . . . . . . . . . 8.39% 9.20% 8.69% 9.16% 10.56%
Total managed loans . . . . . . 6.86% 7.46% 7.32% 7.82% 8.89%Return on Receivables
GAAP loan receivables . . . . . . . . 3.77% 5.56% 4.97% 2.90% 4.41%Securitized loans . . . . . . . . . . . . . 3.50% 4.77% 4.05% 2.11% 2.61%
Total managed loans . . . . . . 1.82% 2.57% 2.23% 1.22% 1.64%Net Principal Charge-off Rate
GAAP loan receivables . . . . . . . . 3.77% 4.54% 3.79% 4.84% 5.53%Securitized loans . . . . . . . . . . . . . 4.30% 5.51% 4.31% 5.52% 6.28%
Total managed loans . . . . . . 4.05% 5.06% 4.08% 5.23% 6.00%Delinquency Rate (over 30 days)
GAAP loan receivables . . . . . . . . 3.15% 2.99% 3.22% 3.69% 4.08%Securitized loans . . . . . . . . . . . . . 3.67% 3.79% 3.76% 4.24% 4.87%
Total managed loans . . . . . . 3.44% 3.45% 3.50% 3.98% 4.55%Delinquency Rate (over 90 days)
GAAP loan receivables . . . . . . . . 1.55% 1.37% 1.53% 1.62% 1.97%Securitized loans . . . . . . . . . . . . . 1.79% 1.79% 1.75% 1.87% 2.34%
Total managed loans . . . . . . 1.68% 1.61% 1.65% 1.75% 2.18%
Domestic Credit Card LoansEnding Balance
GAAP loan receivables . . . . . . . . $19,636,991 $17,251,924 $20,694,395 $20,434,977 $18,606,211Securitized loans . . . . . . . . . . . . . 26,629,021 26,390,058 25,011,827 23,826,144 27,084,517
Total managed loans . . . . . . $46,266,012 $43,641,982 $45,706,222 $44,261,121 $45,690,728
Average BalanceGAAP loan receivables . . . . . . . . $21,841,166 $19,911,585 $19,120,946 $18,644,660 $16,228,520Securitized loans . . . . . . . . . . . . . 25,029,093 24,752,129 25,156,303 26,092,042 28,789,768
Total managed loans . . . . . . $46,870,259 $44,663,714 $44,277,249 $44,736,702 $45,018,288
59

Three Months EndedFebruary 28, Years Ended November 30,
2007 2006 2006 2005 2004
Interest YieldGAAP loan receivables . . . . . . . . . . . . . 10.55% 10.04% 10.50% 10.16% 10.13%Securitized loans . . . . . . . . . . . . . . . . . . 14.10% 14.02% 14.08% 12.93% 12.91%
Total managed loans . . . . . . . . . . . 12.45% 12.25% 12.53% 11.78% 11.91%Interest Spread
GAAP loan receivables . . . . . . . . . . . . . 5.37% 5.57% 5.71% 6.03% 6.09%Securitized loans . . . . . . . . . . . . . . . . . . 8.49% 9.21% 8.80% 9.30% 10.66%
Total managed loans . . . . . . . . . . . 7.03% 7.59% 7.45% 7.95% 9.06%Net Principal Charge-off Rate
GAAP loan receivables . . . . . . . . . . . . . 3.43% 4.66% 3.64% 4.95% 5.75%Securitized loans . . . . . . . . . . . . . . . . . . 4.14% 5.43% 4.20% 5.55% 6.32%
Total managed loans . . . . . . . . . . . 3.81% 5.08% 3.96% 5.30% 6.12%Delinquency Rate (over 30 days)
GAAP loan receivables . . . . . . . . . . . . . 2.97% 2.97% 3.05% 3.69% 4.19%Securitized loans . . . . . . . . . . . . . . . . . . 3.56% 3.73% 3.67% 4.23% 4.96%
Total managed loans . . . . . . . . . . . 3.31% 3.43% 3.39% 3.98% 4.65%Delinquency Rate (over 90 days)
GAAP loan receivables . . . . . . . . . . . . . 1.46% 1.40% 1.44% 1.61% 2.03%Securitized loans . . . . . . . . . . . . . . . . . . 1.75% 1.77% 1.72% 1.86% 2.38%
Total managed loans . . . . . . . . . . . 1.63% 1.62% 1.59% 1.75% 2.24%
International Credit Card LoansEnding Balance
GAAP loan receivables . . . . . . . . . . . . . $2,883,870 $2,672,523 $2,952,506 $2,061,234 $1,117,547Securitized loans . . . . . . . . . . . . . . . . . . 1,690,828 1,510,895 1,691,600 613,919 1,453,127
Total managed loans . . . . . . . . . . . $4,574,698 $4,183,418 $4,644,106 $2,675,153 $2,570,674
Average BalanceGAAP loan receivables . . . . . . . . . . . . . $2,919,421 $2,064,573 $2,535,349 $1,286,976 $1,379,925Securitized loans . . . . . . . . . . . . . . . . . . 1,688,963 846,228 1,403,948 1,306,465 988,727
Total managed loans . . . . . . . . . . . $4,608,384 $2,910,801 $3,939,297 $2,593,441 $2,368,652
Interest YieldGAAP loan receivables . . . . . . . . . . . . . 9.38% 8.16% 9.51% 9.63% 9.13%Securitized loans . . . . . . . . . . . . . . . . . . 11.77% 15.86% 11.94% 11.80% 12.69%
Total managed loans . . . . . . . . . . . 10.25% 10.39% 10.38% 10.72% 10.62%Interest Spread
GAAP loan receivables . . . . . . . . . . . . . 4.14% 4.24% 5.15% 5.07% 3.87%Securitized loans . . . . . . . . . . . . . . . . . . 6.90% 9.09% 6.74% 6.36% 7.89%
Total managed loans . . . . . . . . . . . 5.16% 5.59% 5.71% 5.72% 5.57%Net Principal Charge-off Rate
GAAP loan receivables . . . . . . . . . . . . . 6.29% 3.41% 4.94% 3.28% 2.94%Securitized loans . . . . . . . . . . . . . . . . . . 6.72% 7.85% 6.36% 4.91% 5.17%
Total managed loans . . . . . . . . . . . 6.45% 4.70% 5.45% 4.10% 3.87%Delinquency Rate (over 30 days)
GAAP loan receivables . . . . . . . . . . . . . 4.35% 3.11% 4.36% 3.78% 2.23%Securitized loans . . . . . . . . . . . . . . . . . . 5.42% 4.73% 4.96% 4.53% 3.20%
Total managed loans . . . . . . . . . . . 4.75% 3.70% 4.58% 3.95% 2.78%Delinquency Rate (over 90 days)
GAAP loan receivables . . . . . . . . . . . . . 2.16% 1.15% 2.16% 1.73% 0.96%Securitized loans . . . . . . . . . . . . . . . . . . 2.40% 2.14% 2.32% 2.09% 1.43%
Total managed loans . . . . . . . . . . . 2.25% 1.51% 2.22% 1.81% 1.22%
60

Our loan receivables had the following maturity distribution at February 28, 2007 (dollars in thousands):
Due One Yearor Less(1)
Due AfterOne YearThroughFive Years
Due AfterFive Years Total
Domestic:Credit card . . . . . . . . . . . . . . . . . . . . . . . . . . . . $4,635,747 $ 9,829,846 $5,060,540 $19,526,133Commercial loans . . . . . . . . . . . . . . . . . . . . . . 34,478 59,168 17,212 110,858Other consumer loans . . . . . . . . . . . . . . . . . . . 1,358 19,175 70,313 90,846
International . . . . . . . . . . . . . . . . . . . . . . . . . . . . . . . 620,849 1,404,916 858,105 2,883,870
Loan receivables . . . . . . . . . . . . . . . . . . . $5,292,432 $11,313,105 $6,006,170 $22,611,707
(1) Because of the uncertainty regarding loan repayment patterns, which historically have been higher than contractually required minimumpayments, this amount may not necessarily be indicative of our actual loan repayments.
At February 28, 2007, of our loan receivables due after one year, approximately $8.8 billion had interestrates tied to an index and approximately $8.5 billion were fixed rate loans.
Critical Accounting Policies
In preparing our combined financial statements in conformity with GAAP, management must makejudgments and use estimates and assumptions about the effects of matters that are uncertain. For estimates thatinvolve a high degree of judgment and subjectivity, it is possible that different estimates could reasonably bederived for the same period. For estimates that are particularly sensitive to changes in economic or marketconditions, significant changes to the estimated amount from period to period are also possible. Managementbelieves the current assumptions and other considerations used to estimate amounts reflected in our combinedfinancial statements are appropriate. However, if actual experience differs from the assumptions and otherconsiderations used in estimating amounts in our combined financial statements, the resulting changes couldhave a material adverse effect on our combined results of operations and, in certain cases, could have a materialadverse effect on our combined financial condition. Management has identified the policies related to theaccounting for asset securitization transactions, the estimation of the allowance for loan losses, interest incomerecognition, the accrual of cardmember rewards cost, the evaluation of goodwill for potential impairment andaccrual of income taxes as critical accounting policies.
Accounting for Asset Securitization Transactions
We account for our securitization transactions in accordance with Statement of Financial AccountingStandards No. 140, Accounting for Transfers and Servicing of Financial Assets and Extinguishments ofLiabilities, as amended (“Statement No. 140”). The gain on the securitization transaction depends in part on theprevious carrying amount of the assets involved in the transfer, allocated between the assets transferred and theretained interests based upon their respective fair values at the date of the transfer. The interest-only stripreceivable represents the contractual right to receive interest and certain loan fee revenues less certain costs,including loan losses on securitized loans and the contractual rate of interest paid to third-party investors in thesecuritization as well as a servicing fee from the trust over the life of the asset sold. In the absence of observablemarket prices, the fair value of the interest-only strip receivable is estimated based on the present value ofexpected future cash flows using management’s best estimate of the key assumptions, including forecastedinterest yield, loan losses and payment rates, the interest paid to investors and a discount rate commensurate withthe risks involved. Changes in the estimated fair value of the interest-only strip receivable, as well as certainother retained interests, are recorded in securitization income. The use of different estimates or assumptionscould produce materially different financial results. In addition, estimates are likely to change in the future ascomponents of the interest-only strip receivable valuation are sensitive to market and economic conditions.
61

If management used different assumptions in estimating the value of the interest-only strip receivable, theimpact could have a material effect on our combined financial condition and results of operations. For example, a20% change in the excess spread assumption for all securitized loans could have resulted in a change ofapproximately $67 million in the value of the interest-only strip receivable as of November 30, 2006. See Note 8:Credit Card Securitization Activities to the audited combined financial statements for further information aboutthe accounting for securitizations.
Allowance for Loan Losses
The allowance for loan losses represents management’s estimate of probable net loan losses inherent in theloan portfolio. Management evaluates the allowance quarterly for adequacy. The allowance is establishedthrough a charge to the provision for loan losses. In estimating losses inherent in the credit card loan portfolio,we use an approach that utilizes a migration analysis of delinquent and current credit card receivables. Amigration analysis is a technique used to estimate the likelihood that a loan receivable will progress through thevarious stages of delinquency and to charge-off. The migration analysis considers uncollectible principal, interestand fees reflected in loan receivables. In determining the proper level of the allowance for loan losses,management also considers factors that may impact loan loss experience, including current economic conditions,recent trends in delinquencies and bankruptcy receipts, account collection management, policy changes, accountseasoning, loan volume and amounts, payment rates and forecasting uncertainties.
If management used different assumptions in estimating probable losses, the impact to the allowance forloan losses could have a material effect on our combined financial condition and results of operations. Forexample, a 10% change in management’s estimate of probable net loan losses could have resulted in a change ofapproximately $83 million in the allowance for loan losses at November 30, 2006, with a corresponding changein the provision for loan losses. See Note 7: Loan Receivables to the audited combined financial statements forfurther details about the allowance for loan losses.
Interest Income Recognition
Interest income earned through finance charges on credit card loans is calculated based on the amount ofloans outstanding and the contractual interest rates on such loans. Accrued interest is included in credit card loanreceivables when billed to the cardmember. We accrue unbilled interest revenue on a monthly basis from acardmember’s billing cycle date to the end of the month. The unbilled interest accrual is recorded on thecombined statements of financial condition in accrued interest receivable for owned loans and in amounts duefrom asset securitization for securitized loans. We make certain assumptions and estimates in the determinationof unbilled accrued interest, including a projection of the percentage of loan balances that will revolve. We applythe same methodology in the determination of unbilled accrued interest for both owned loans and securitizedloans.
If management used different assumptions in the determination of the unbilled portion of accrued interestincome and the valuation of accrued interest on securitized loans, our financial condition and results ofoperations could have been materially different. For example, a 10% change in management’s projection of thepercentage of loans that will revolve in the next cycle could have resulted in a combined change in accruedinterest receivable and amounts due from asset securitization of approximately $29 million at November 30,2006, with a corresponding change in interest income. See “—Net Interest Income” for additional detailsconcerning interest earned through finance charges on credit card loans.
Cardmember Rewards Cost
We offer our cardmembers various reward programs, including the Cashback Bonus reward program,pursuant to which we offer certain cardmembers a reward equal to a percentage of their purchase amounts basedon the type and volume of the cardmember’s purchases. The liability for cardmember rewards is included in
62

accrued expenses and other liabilities on our combined statements of financial condition. We compute rewardsliability on an individual cardmember basis and it is accumulated as qualified cardmembers make progresstoward earning a reward through their ongoing purchase activity. The liability is adjusted for expected forfeituresof accumulated rewards. We estimate forfeitures based on historical account closure and charge-off experienceand actual cardmember purchase activity. We recognize Cashback Bonus reward cost for both owned loans andsecuritized loans as a reduction of discount and interchange revenue in the combined statements of income.
If management used a different estimate of forfeitures, our combined financial condition and results ofoperations could have differed significantly. For example, a 100 basis point decrease in the estimated forfeiturerate as of November 30, 2006, could have resulted in an increase in accrued expenses and other liabilities ofapproximately $8 million. The corresponding increase in rewards cost would have been reflected as a decrease indiscount and interchange revenue. See “—Other Income” and Note 3: Summary of Significant AccountingPolicies to the audited combined financial statements for further information about cardmember rewards cost.
Goodwill
We recognize goodwill when the purchase price of an acquired business exceeds the fair values of theacquired net assets. As required by GAAP, we test goodwill for impairment annually, or more often if indicatorsof impairment exist. In evaluating goodwill for impairment, management must estimate the fair value of thebusiness unit(s) to which the goodwill relates. Because market data concerning acquisitions of comparablebusinesses typically are not readily obtainable, other valuation techniques such as earnings multiples and cashflow models are used in estimating the fair values of these businesses. In applying these techniques, managementconsiders historical results, business forecasts, market and industry conditions and other factors. We may alsoconsult independent valuation experts where needed in applying these valuation techniques. The valuationmethodologies we use involve assumptions about business performance, revenue and expense growth, discountrates and other assumptions that are judgmental in nature.
If the assumptions used by management in valuing its acquired businesses are inappropriate, we may beexposed to an impairment loss that, when realized, could have a material impact on our combined financialcondition and results of operations. Our annual evaluation of goodwill was completed as of November 30, 2006.Based on the results of these assessments, no goodwill impairment was recognized. See Note 3: Summary ofSignificant Accounting Policies and Note 10: Goodwill to the audited combined financial statements for furtherinformation about goodwill.
Income Taxes
We are subject to the income tax laws of the jurisdictions where we have business operations, primarily theUnited States, its states and municipalities, and the United Kingdom. We must make judgments andinterpretations about the application of these inherently complex tax laws when determining the provision forincome taxes and must also make estimates about when in the future certain items will affect taxable income inthe various taxing jurisdictions. Disputes over interpretations of the tax laws may be settled with the taxingauthority upon examination or audit. We regularly evaluate the likelihood of assessments in each of the taxingjurisdictions resulting from current and subsequent years’ examinations, and tax reserves are established asappropriate.
Changes in the estimate of income taxes can occur due to tax rate changes, interpretations of tax laws, thestatus and resolution of examinations by the taxing authorities, and newly enacted laws and regulations thatimpact the relative merits of tax positions taken. When such changes occur, the effect on our combined financialcondition and results of operations can be significant. See Note 18: Income Taxes to the audited combinedfinancial statements for additional information about income taxes.
63
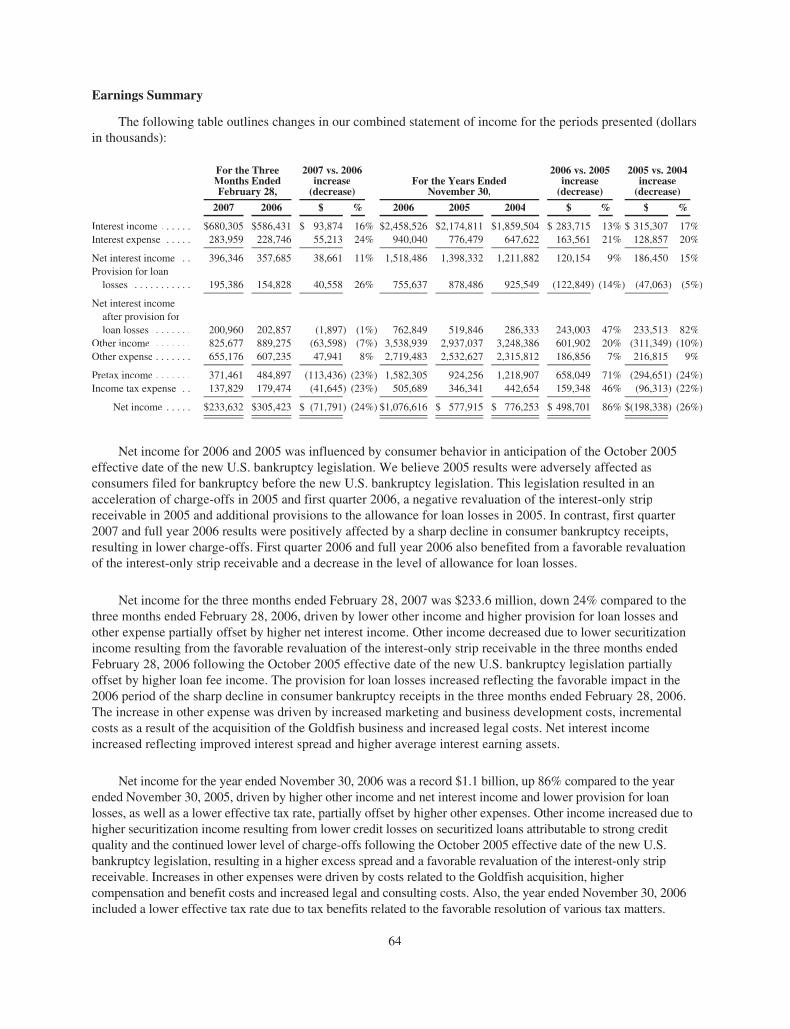
Earnings Summary
The following table outlines changes in our combined statement of income for the periods presented (dollarsin thousands):
For the ThreeMonths EndedFebruary 28,
2007 vs. 2006increase(decrease)
For the Years EndedNovember 30,
2006 vs. 2005increase(decrease)
2005 vs. 2004increase(decrease)
2007 2006 $ % 2006 2005 2004 $ % $ %
Interest income . . . . . . $680,305 $586,431 $ 93,874 16% $2,458,526 $2,174,811 $1,859,504 $ 283,715 13% $ 315,307 17%Interest expense . . . . . 283,959 228,746 55,213 24% 940,040 776,479 647,622 163,561 21% 128,857 20%
Net interest income . . 396,346 357,685 38,661 11% 1,518,486 1,398,332 1,211,882 120,154 9% 186,450 15%Provision for loan
losses . . . . . . . . . . . 195,386 154,828 40,558 26% 755,637 878,486 925,549 (122,849) (14%) (47,063) (5%)
Net interest incomeafter provision forloan losses . . . . . . . 200,960 202,857 (1,897) (1%) 762,849 519,846 286,333 243,003 47% 233,513 82%
Other income . . . . . . . 825,677 889,275 (63,598) (7%) 3,538,939 2,937,037 3,248,386 601,902 20% (311,349) (10%)Other expense . . . . . . . 655,176 607,235 47,941 8% 2,719,483 2,532,627 2,315,812 186,856 7% 216,815 9%
Pretax income . . . . . . . 371,461 484,897 (113,436) (23%) 1,582,305 924,256 1,218,907 658,049 71% (294,651) (24%)Income tax expense . . 137,829 179,474 (41,645) (23%) 505,689 346,341 442,654 159,348 46% (96,313) (22%)
Net income . . . . . $233,632 $305,423 $ (71,791) (24%) $1,076,616 $ 577,915 $ 776,253 $ 498,701 86% $(198,338) (26%)
Net income for 2006 and 2005 was influenced by consumer behavior in anticipation of the October 2005effective date of the new U.S. bankruptcy legislation. We believe 2005 results were adversely affected asconsumers filed for bankruptcy before the new U.S. bankruptcy legislation. This legislation resulted in anacceleration of charge-offs in 2005 and first quarter 2006, a negative revaluation of the interest-only stripreceivable in 2005 and additional provisions to the allowance for loan losses in 2005. In contrast, first quarter2007 and full year 2006 results were positively affected by a sharp decline in consumer bankruptcy receipts,resulting in lower charge-offs. First quarter 2006 and full year 2006 also benefited from a favorable revaluationof the interest-only strip receivable and a decrease in the level of allowance for loan losses.
Net income for the three months ended February 28, 2007 was $233.6 million, down 24% compared to thethree months ended February 28, 2006, driven by lower other income and higher provision for loan losses andother expense partially offset by higher net interest income. Other income decreased due to lower securitizationincome resulting from the favorable revaluation of the interest-only strip receivable in the three months endedFebruary 28, 2006 following the October 2005 effective date of the new U.S. bankruptcy legislation partiallyoffset by higher loan fee income. The provision for loan losses increased reflecting the favorable impact in the2006 period of the sharp decline in consumer bankruptcy receipts in the three months ended February 28, 2006.The increase in other expense was driven by increased marketing and business development costs, incrementalcosts as a result of the acquisition of the Goldfish business and increased legal costs. Net interest incomeincreased reflecting improved interest spread and higher average interest earning assets.
Net income for the year ended November 30, 2006 was a record $1.1 billion, up 86% compared to the yearended November 30, 2005, driven by higher other income and net interest income and lower provision for loanlosses, as well as a lower effective tax rate, partially offset by higher other expenses. Other income increased due tohigher securitization income resulting from lower credit losses on securitized loans attributable to strong creditquality and the continued lower level of charge-offs following the October 2005 effective date of the new U.S.bankruptcy legislation, resulting in a higher excess spread and a favorable revaluation of the interest-only stripreceivable. Increases in other expenses were driven by costs related to the Goldfish acquisition, highercompensation and benefit costs and increased legal and consulting costs. Also, the year ended November 30, 2006included a lower effective tax rate due to tax benefits related to the favorable resolution of various tax matters.
64

Net income for the year ended November 30, 2005 was $577.9 million, down 26% compared to the yearended November 30, 2004, driven by lower other income and higher other expense partially offset by increasednet interest income. Other income decreased due to lower securitization income reflecting lower excess spread onsecuritized loans and a downward revaluation of the interest-only strip receivable, both of which reflect thehigher bankruptcy receipts and the related anticipated charge-offs in conjunction with the October 2005 effectivedate of the new U.S. bankruptcy legislation. This decrease was offset in part by increased transaction processingrevenues related to the acquisition of PULSE. Other expense increased due to increased employee compensationand benefits and other expenses. Employee compensation and benefits increased due to increased salary levelsand benefits costs and additional employees associated with the PULSE business.
Net Interest Income
Net interest income for the three months ended February 28, 2007 increased $38.7 million, or 11%, ascompared to the three months ended February 28, 2006. Net interest margin for the three months endedFebruary 28, 2007 increased 27 basis points to 5.77% from the three months ended February 28, 2006. Netinterest income for the years ended November 30, 2006 and 2005 increased $120.2 million, or 9%, and $186.5million, or 15%, as compared to the respective prior years. For the year ended November 30, 2006, net interestmargin increased 6 basis points to 5.94% from November 30, 2005. The net interest margin for the year endedNovember 30, 2005 was unchanged from the year ended November 30, 2004 at 5.88%.
Net interest income represents the difference between interest income earned on interest earning assetswhich we own and the interest expense incurred to finance those assets, whereas net interest margin representsthe net interest income stated as a percentage of total interest earning assets. Our interest earning assets consist ofcredit card loan receivables, certain retained interests in securitization transactions included in amounts due fromasset securitization and, to a lesser degree, Federal Funds sold and investment securities. Because the investorinterests in securitization transactions are not assets owned by us, they are not included in interest earning assetsnor is the interest yield on the related loans included in interest income.
Interest income is influenced by the level of interest earning assets, which is most significantly impacted bychanges in the level of securitized loans. Both the maturities of existing securitization transactions and the levelof new transactions that equal or exceed those maturities, as well as the timing of each, can cause variability inthe amount of securitized loans outstanding. Other factors that can influence average interest earning assets aregrowth strategies, including portfolio acquisitions, as well as cardmember spending and payment patterns.During the three months ended February 28, 2007, average securitized loans as a percentage of managed creditcard loan receivables was 52% as compared to 54% for the three months ended February 28, 2006. Although thelevel of average securitized loan receivables was higher in the three months ended February 28, 2007, the level ofmanaged loan receivables also was higher due to domestic loan receivables growth and the inclusion of Goldfishloan receivables for a full quarter. The resulting higher level of owned average credit card loan receivables and ahigher yield contributed favorably to interest income in the three months ended February 28, 2007. During theyears ended November 30, 2006, 2005 and 2004, average securitized loans as a percentage of managed creditcard loan receivables were 55%, 58% and 63%, respectively. The decrease in average securitized loans in 2006from 2005 was attributable to a lower beginning of year level associated with the high volume of maturities inthe latter part of 2005. This higher level of maturities as well as the deferral of new transactions as a result of theprevious evaluation of our spin-off from Morgan Stanley caused 2005 average securitized loans to decrease from2004. The lower level of securitized loans in 2006 in comparison to 2005 contributed favorably to interestincome in 2006; similarly, the lower level of securitized loans in 2005 in comparison to 2004 contributedfavorably to interest income in 2005.
Interest earning assets are also impacted by the amount of certain assets retained by us in securitizationtransactions, reported as amounts due from asset securitization. These retained interests include cash collateralaccounts that provide credit enhancement on the investor interests and cardmember payments on securitizedloans that have been transferred to the trusts for the benefit of the investors. The amount of retained interests
65

varies in relation to changes in the amount of securitized loans. Interest income earned on these assets willfluctuate accordingly, and is earned at floating rates.
Interest income is also influenced by the interest rate on interest earning assets. Credit card loan receivablesearn interest at fixed rates as well as floating rates that are tied to short-term rates aligned with the prime rate.Amounts due from asset securitization and Federal Funds sold earn interest at floating rates tied short-term ratesaligned with market indices. Interest income earned on floating rate interest earning assets is influenced bychanges in the interest rate environment. Loan receivables are our largest asset. During the three months endedFebruary 28, 2007 and 2006, average credit card loan receivables earning interest at floating rates represented52% and 53%, respectively, of total average loan receivables. The prime rate during this period increased 75basis points in conjunction with similar changes in the Federal Funds rate. During the years ended November 30,2006, 2005 and 2004, average credit card loan receivables earning interest at floating rates represented 52%, 50%and 34%, respectively, of total average loan receivables; the prime rate increased 1.25%, 2.00% and 1.00%,respectively, during those same years. The incremental increases in the interest rate environment contributedfavorably to interest income earned on the owned loan receivables, amounts due from asset securitizations andFederal Funds sold. Additionally, interest income in the three months ended February 28, 2007 and the yearsended November 30, 2006 and 2005 were further impacted by a higher percentage of loan receivables earninginterest at floating rates.
Interest income is also impacted by credit quality. As a result of the improved credit environment followingthe October 2005 effective date of the new U.S. bankruptcy legislation and our risk management practices, thenumber of cardmembers having lower risk profiles has increased. Generally, cardmembers with a lower riskprofile have higher payment rates, resulting in a lower percentage of loan receivables on which interest isaccrued. Although interest income is lower as a result, interest-related charge-offs, which are recorded as areduction to interest income, are also lower. This was particularly evident following the October 2005 effectivedate of the new U.S. bankruptcy legislation. For the three months ended February 28, 2007 and 2006, interestbilled and subsequently charged-off, net of recoveries, was 0.87% and 0.70%, respectively. For the years endedNovember 30, 2006, 2005 and 2004, interest billed and subsequently charged-off, net of recoveries, was 0.90%,1.14% and 1.33%, respectively.
Interest bearing liabilities reflect our funding requirements and consist of deposits, borrowings from MorganStanley and bank notes. Additionally, in 2006, as a subsidiary of Morgan Stanley, we were able to purchase FederalFunds from Morgan Stanley Bank, an FDIC-regulated banking subsidiary of Morgan Stanley, and to obtain moneymarket accounts sourced from the Morgan Stanley Bank Deposit Program. See “— Liquidity and CapitalResources.” We incur interest expense on our interest bearing liabilities at fixed and floating rates. Changes in theinterest rate environment as well as changes in the percentage of floating rate interest bearing liabilities can impactinterest expense. During the three months ended February 28, 2007 and 2006, floating rate average interest bearingliabilities as a percentage of total average interest bearing liabilities were approximately 62% and 42%, respectively,as a result of a shift in funding from deposits to money market deposits and short-term borrowings. During the yearsended November 30, 2006, 2005 and 2004, floating rate average interest bearing liabilities as a percentage of totalaverage interest bearing liabilities were approximately 48%, 41% and 38%, respectively. Accordingly, interestexpense in the three months ended February 28, 2007 and in the years ended November 30, 2006 and 2005 wereadversely impacted by a rising interest rate environment. Interest expense also includes the effects of any interestrate swaps we enter into as part of our interest rate risk management program. The program is designed to reducethe volatility of earnings resulting from changes in interest rates by having a financing portfolio that reflects theexisting repricing schedules of loan receivables as well as our right, with notice to cardmembers, to reprice certainfixed or floating rate loan receivables to a new interest rate in the future.
In response to industry-wide regulatory guidance, we have increased minimum payment requirements oncertain credit card loans. Bank regulators have discretion to interpret the guidance or its application, and changesin such guidance or its application by the regulators could impact minimum payment requirements. Increases inminimum payment requirements could negatively impact future levels of credit card loans and related interestand fee revenue and charge-offs.
66
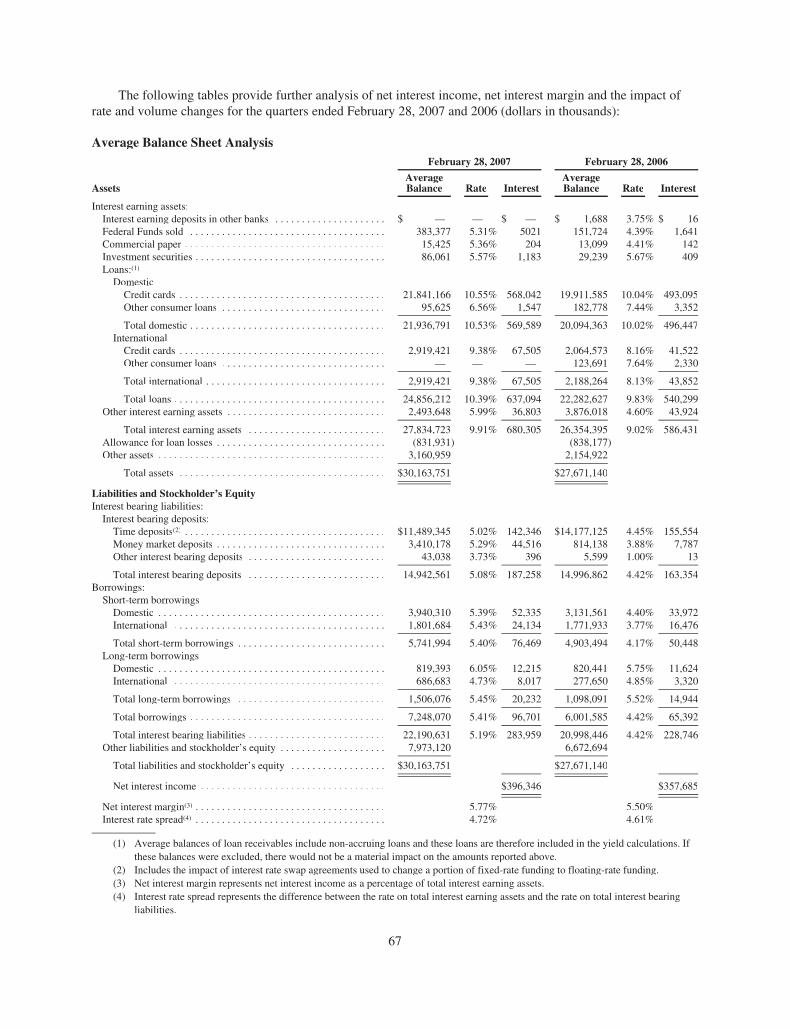
The following tables provide further analysis of net interest income, net interest margin and the impact ofrate and volume changes for the quarters ended February 28, 2007 and 2006 (dollars in thousands):
Average Balance Sheet AnalysisFebruary 28, 2007 February 28, 2006
AssetsAverageBalance Rate Interest
AverageBalance Rate Interest
Interest earning assets:Interest earning deposits in other banks . . . . . . . . . . . . . . . . . . . . . $ — — $ — $ 1,688 3.75% $ 16Federal Funds sold . . . . . . . . . . . . . . . . . . . . . . . . . . . . . . . . . . . . . 383,377 5.31% 5021 151,724 4.39% 1,641Commercial paper . . . . . . . . . . . . . . . . . . . . . . . . . . . . . . . . . . . . . . 15,425 5.36% 204 13,099 4.41% 142Investment securities . . . . . . . . . . . . . . . . . . . . . . . . . . . . . . . . . . . . 86,061 5.57% 1,183 29,239 5.67% 409Loans:(1)
DomesticCredit cards . . . . . . . . . . . . . . . . . . . . . . . . . . . . . . . . . . . . . . . 21,841,166 10.55% 568,042 19,911,585 10.04% 493,095Other consumer loans . . . . . . . . . . . . . . . . . . . . . . . . . . . . . . . 95,625 6.56% 1,547 182,778 7.44% 3,352
Total domestic . . . . . . . . . . . . . . . . . . . . . . . . . . . . . . . . . . . . . 21,936,791 10.53% 569,589 20,094,363 10.02% 496,447International
Credit cards . . . . . . . . . . . . . . . . . . . . . . . . . . . . . . . . . . . . . . . 2,919,421 9.38% 67,505 2,064,573 8.16% 41,522Other consumer loans . . . . . . . . . . . . . . . . . . . . . . . . . . . . . . . — — — 123,691 7.64% 2,330
Total international . . . . . . . . . . . . . . . . . . . . . . . . . . . . . . . . . . 2,919,421 9.38% 67,505 2,188,264 8.13% 43,852
Total loans . . . . . . . . . . . . . . . . . . . . . . . . . . . . . . . . . . . . . . . . 24,856,212 10.39% 637,094 22,282,627 9.83% 540,299Other interest earning assets . . . . . . . . . . . . . . . . . . . . . . . . . . . . . . 2,493,648 5.99% 36,803 3,876,018 4.60% 43,924
Total interest earning assets . . . . . . . . . . . . . . . . . . . . . . . . . . 27,834,723 9.91% 680,305 26,354,395 9.02% 586,431Allowance for loan losses . . . . . . . . . . . . . . . . . . . . . . . . . . . . . . . . (831,931) (838,177)Other assets . . . . . . . . . . . . . . . . . . . . . . . . . . . . . . . . . . . . . . . . . . . 3,160,959 2,154,922
Total assets . . . . . . . . . . . . . . . . . . . . . . . . . . . . . . . . . . . . . . . $30,163,751 $27,671,140
Liabilities and Stockholder’s EquityInterest bearing liabilities:
Interest bearing deposits:Time deposits(2) . . . . . . . . . . . . . . . . . . . . . . . . . . . . . . . . . . . . . . $11,489,345 5.02% 142,346 $14,177,125 4.45% 155,554Money market deposits . . . . . . . . . . . . . . . . . . . . . . . . . . . . . . . . 3,410,178 5.29% 44,516 814,138 3.88% 7,787Other interest bearing deposits . . . . . . . . . . . . . . . . . . . . . . . . . . 43,038 3.73% 396 5,599 1.00% 13
Total interest bearing deposits . . . . . . . . . . . . . . . . . . . . . . . . . . 14,942,561 5.08% 187,258 14,996,862 4.42% 163,354Borrowings:
Short-term borrowingsDomestic . . . . . . . . . . . . . . . . . . . . . . . . . . . . . . . . . . . . . . . . . . . 3,940,310 5.39% 52,335 3,131,561 4.40% 33,972International . . . . . . . . . . . . . . . . . . . . . . . . . . . . . . . . . . . . . . . . 1,801,684 5.43% 24,134 1,771,933 3.77% 16,476
Total short-term borrowings . . . . . . . . . . . . . . . . . . . . . . . . . . . . 5,741,994 5.40% 76,469 4,903,494 4.17% 50,448Long-term borrowings
Domestic . . . . . . . . . . . . . . . . . . . . . . . . . . . . . . . . . . . . . . . . . . . 819,393 6.05% 12,215 820,441 5.75% 11,624International . . . . . . . . . . . . . . . . . . . . . . . . . . . . . . . . . . . . . . . . 686,683 4.73% 8,017 277,650 4.85% 3,320
Total long-term borrowings . . . . . . . . . . . . . . . . . . . . . . . . . . . . 1,506,076 5.45% 20,232 1,098,091 5.52% 14,944
Total borrowings . . . . . . . . . . . . . . . . . . . . . . . . . . . . . . . . . . . . . 7,248,070 5.41% 96,701 6,001,585 4.42% 65,392
Total interest bearing liabilities . . . . . . . . . . . . . . . . . . . . . . . . . . 22,190,631 5.19% 283,959 20,998,446 4.42% 228,746Other liabilities and stockholder’s equity . . . . . . . . . . . . . . . . . . . . 7,973,120 6,672,694
Total liabilities and stockholder’s equity . . . . . . . . . . . . . . . . . . $30,163,751 $27,671,140
Net interest income . . . . . . . . . . . . . . . . . . . . . . . . . . . . . . . . . . . $396,346 $357,685
Net interest margin(3) . . . . . . . . . . . . . . . . . . . . . . . . . . . . . . . . . . . . 5.77% 5.50%Interest rate spread(4) . . . . . . . . . . . . . . . . . . . . . . . . . . . . . . . . . . . . 4.72% 4.61%
(1) Average balances of loan receivables include non-accruing loans and these loans are therefore included in the yield calculations. Ifthese balances were excluded, there would not be a material impact on the amounts reported above.
(2) Includes the impact of interest rate swap agreements used to change a portion of fixed-rate funding to floating-rate funding.(3) Net interest margin represents net interest income as a percentage of total interest earning assets.(4) Interest rate spread represents the difference between the rate on total interest earning assets and the rate on total interest bearing
liabilities.
67

Rate/Volume Variance Analysis(1)
February 28, 2007 vs. 2006
Increase/(Decrease) due to changes in: Volume Rate Total
Interest earning assets:Interest earning deposits in other banks . . . . . . . . . . . . . . . . . . . . . . . . . . . . . . . . . . . . . . . . . . . . . . . . . . $ (8) $ (8) $ (16)Federal Funds sold . . . . . . . . . . . . . . . . . . . . . . . . . . . . . . . . . . . . . . . . . . . . . . . . . . . . . . . . . . . . . . . . . . 2,970 410 3,380Commercial paper . . . . . . . . . . . . . . . . . . . . . . . . . . . . . . . . . . . . . . . . . . . . . . . . . . . . . . . . . . . . . . . . . . 28 34 62Investment securities . . . . . . . . . . . . . . . . . . . . . . . . . . . . . . . . . . . . . . . . . . . . . . . . . . . . . . . . . . . . . . . . 823 (49) 774Loans:
Domestic . . . . . . . . . . . . . . . . . . . . . . . . . . . . . . . . . . . . . . . . . . . . . . . . . . . . . . . . . . . . . . . . . . . . . . . .Credit cards . . . . . . . . . . . . . . . . . . . . . . . . . . . . . . . . . . . . . . . . . . . . . . . . . . . . . . . . . . . . . . . . . . . 49,365 25,582 74,947Other consumer loans . . . . . . . . . . . . . . . . . . . . . . . . . . . . . . . . . . . . . . . . . . . . . . . . . . . . . . . . . . . . (1,447) (357) (1,804)
Total domestic loans . . . . . . . . . . . . . . . . . . . . . . . . . . . . . . . . . . . . . . . . . . . . . . . . . . . . . . . . . . . . . 47,918 25,225 73,143International
Credit cards . . . . . . . . . . . . . . . . . . . . . . . . . . . . . . . . . . . . . . . . . . . . . . . . . . . . . . . . . . . . . . . . . . . 19,083 6,900 25,983Other consumer loans . . . . . . . . . . . . . . . . . . . . . . . . . . . . . . . . . . . . . . . . . . . . . . . . . . . . . . . . . . . . (1,165) (1,165) (2,330)
Total international loans . . . . . . . . . . . . . . . . . . . . . . . . . . . . . . . . . . . . . . . . . . . . . . . . . . . . . . . . . . 17,918 5,735 23,653
Total loans . . . . . . . . . . . . . . . . . . . . . . . . . . . . . . . . . . . . . . . . . . . . . . . . . . . . . . . . . . . . . . . . . . . . 65,835 30,960 96,795Other interest earning assets . . . . . . . . . . . . . . . . . . . . . . . . . . . . . . . . . . . . . . . . . . . . . . . . . . . . . . . . . . . (62,151) 55,030 (7,121)
Total interest income . . . . . . . . . . . . . . . . . . . . . . . . . . . . . . . . . . . . . . . . . . . . . . . . . . . . . . . . . . . . 7,497 86,377 93,874Interest bearing liabilities:
Interest bearing deposits:Time deposits . . . . . . . . . . . . . . . . . . . . . . . . . . . . . . . . . . . . . . . . . . . . . . . . . . . . . . . . . . . . . . . . . . . . (104,788) 91,581 (13,207)Money market deposits . . . . . . . . . . . . . . . . . . . . . . . . . . . . . . . . . . . . . . . . . . . . . . . . . . . . . . . . . . . . 32,958 3,771 36,729Other interest bearing deposits . . . . . . . . . . . . . . . . . . . . . . . . . . . . . . . . . . . . . . . . . . . . . . . . . . . . . . . 272 110 382
Total interest bearing deposits . . . . . . . . . . . . . . . . . . . . . . . . . . . . . . . . . . . . . . . . . . . . . . . . . . . . . (71,558) 95,462 23,904Borrowings:
Short-term borrowingsDomestic . . . . . . . . . . . . . . . . . . . . . . . . . . . . . . . . . . . . . . . . . . . . . . . . . . . . . . . . . . . . . . . . . . . . . . 9,827 8,536 18,363International . . . . . . . . . . . . . . . . . . . . . . . . . . . . . . . . . . . . . . . . . . . . . . . . . . . . . . . . . . . . . . . . . . . 281 7,377 7,658
Total short-term borrowings . . . . . . . . . . . . . . . . . . . . . . . . . . . . . . . . . . . . . . . . . . . . . . . . . . . . . . . 10,108 15,913 26,021Long-term borrowings
Domestic . . . . . . . . . . . . . . . . . . . . . . . . . . . . . . . . . . . . . . . . . . . . . . . . . . . . . . . . . . . . . . . . . . . . . . (103) 695 592International . . . . . . . . . . . . . . . . . . . . . . . . . . . . . . . . . . . . . . . . . . . . . . . . . . . . . . . . . . . . . . . . . . . 5,252 (556) 4,696
Total long-term borrowings . . . . . . . . . . . . . . . . . . . . . . . . . . . . . . . . . . . . . . . . . . . . . . . . . . . . . . . 5,149 139 5,288
Total borrowings . . . . . . . . . . . . . . . . . . . . . . . . . . . . . . . . . . . . . . . . . . . . . . . . . . . . . . . . . . . . . . . 15,257 16,052 31,308
Total interest expense . . . . . . . . . . . . . . . . . . . . . . . . . . . . . . . . . . . . . . . . . . . . . . . . . . . . . . . . . . . . (56,301) 111,514 55,212
Net interest income . . . . . . . . . . . . . . . . . . . . . . . . . . . . . . . . . . . . . . . . . . . . . . . . . . . . . . . . . . . . . . $ 63,799 $ (25,137) $ 38,662
(1) The rate/volume variance for each category has been allocated on a consistent basis between rate and volume variances based on thepercentage of the rate or volume variance to the sum of the two absolute variances.
For the three months ended February 28, 2007, interest income increased $93.9 million, or 16%, ascompared to the three months ended February 28, 2006, due to higher interest earning assets of $1.5 billion andan 89 basis point increase in the interest yield. The higher level of interest earning assets reflects growth indomestic credit card loan receivables and the inclusion of Goldfish loan receivables for a full quarter, offset inpart by lower amounts due from asset securitization included in other interest earning assets. Amounts due fromasset securitization were higher for the three months ended February 28, 2006, reflecting an increase incardmember payments held by the trust on behalf of investors as a result of a high level of maturities of existingsecuritization transactions in comparison to the three months ended February 28, 2007. The interest yield for thethree months ended February 28, 2007 was favorably impacted by improved credit quality following the effectivedate of the new U.S. bankruptcy legislation as well as higher interest yield on floating rate interest earning assetsresulting from the rising interest rate environment. The interest yield for the three months ended February 28,2006 was adversely impacted by the heightened level of bankruptcy receipts in October 2005 related to theeffective date of the new U.S. bankruptcy legislation, resulting in higher principal, interest and fee charge-offs inDecember 2005.
68

For the three months ended February 28, 2007, interest expense increased $55.2 million, or 24%, ascompared to the three months ended February 28, 2006, due to a 77 basis point increase in the average cost offunds and a $1.2 billion higher level of funding to support the increase in interest earning assets. The higher costof funds reflects the impact of the rising interest rate environment on floating rate liabilities as well as a shift infunding from fixed rate certificates of deposit to short-term, floating rate instruments sourced through MorganStanley. Specifically, included in money market deposits were balances obtained through the Morgan StanleyGlobal Wealth Management Bank Deposit Program launched in March 2006, and beginning mid-2006, domesticshort-term borrowings included Federal Funds purchased from Morgan Stanley Bank. Funding obtained fromMorgan Stanley sources was higher on average during the three months ended February 28, 2007, however,balances at the end of the quarter were lower, reflecting the replacement of Federal Funds purchased fromMorgan Stanley Bank and domestic short-term borrowings from Morgan Stanley with brokered certificates ofdeposits.
69
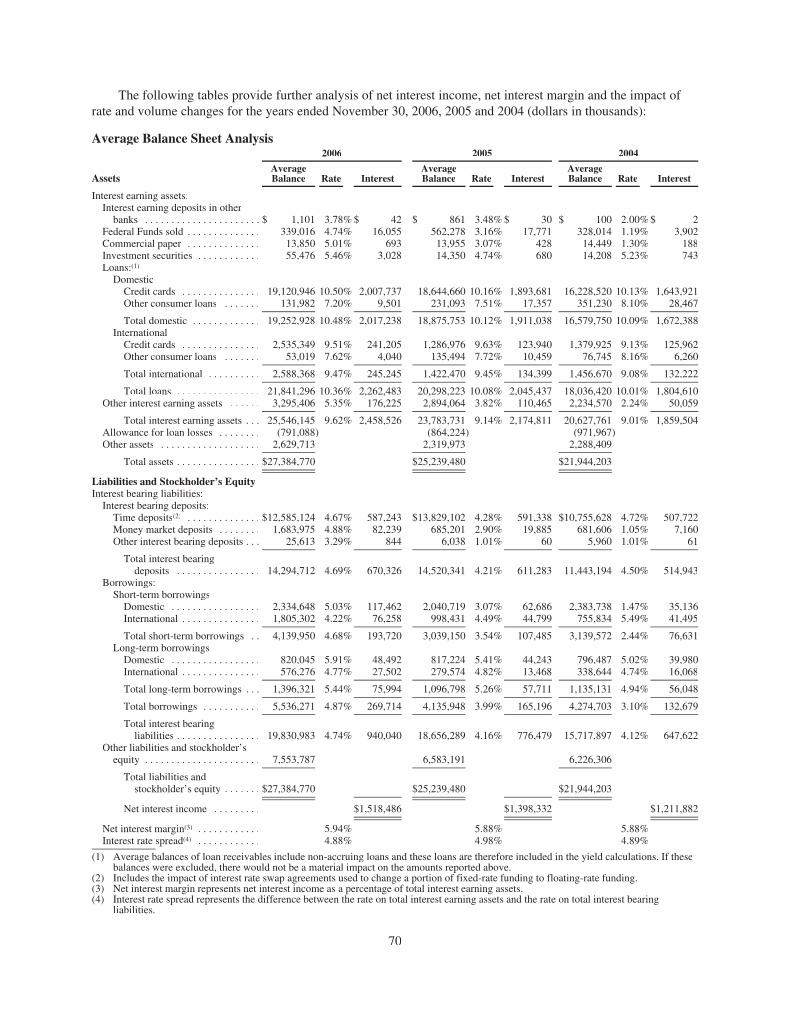
The following tables provide further analysis of net interest income, net interest margin and the impact ofrate and volume changes for the years ended November 30, 2006, 2005 and 2004 (dollars in thousands):
Average Balance Sheet Analysis2006 2005 2004
AssetsAverageBalance Rate Interest
AverageBalance Rate Interest
AverageBalance Rate Interest
Interest earning assets:Interest earning deposits in other
banks . . . . . . . . . . . . . . . . . . . . . . $ 1,101 3.78% $ 42 $ 861 3.48% $ 30 $ 100 2.00% $ 2Federal Funds sold . . . . . . . . . . . . . . 339,016 4.74% 16,055 562,278 3.16% 17,771 328,014 1.19% 3,902Commercial paper . . . . . . . . . . . . . . 13,850 5.01% 693 13,955 3.07% 428 14,449 1.30% 188Investment securities . . . . . . . . . . . . 55,476 5.46% 3,028 14,350 4.74% 680 14,208 5.23% 743Loans:(1)
DomesticCredit cards . . . . . . . . . . . . . . . 19,120,946 10.50% 2,007,737 18,644,660 10.16% 1,893,681 16,228,520 10.13% 1,643,921Other consumer loans . . . . . . . 131,982 7.20% 9,501 231,093 7.51% 17,357 351,230 8.10% 28,467
Total domestic . . . . . . . . . . . . . 19,252,928 10.48% 2,017,238 18,875,753 10.12% 1,911,038 16,579,750 10.09% 1,672,388International
Credit cards . . . . . . . . . . . . . . . 2,535,349 9.51% 241,205 1,286,976 9.63% 123,940 1,379,925 9.13% 125,962Other consumer loans . . . . . . . 53,019 7.62% 4,040 135,494 7.72% 10,459 76,745 8.16% 6,260
Total international . . . . . . . . . . 2,588,368 9.47% 245,245 1,422,470 9.45% 134,399 1,456,670 9.08% 132,222
Total loans . . . . . . . . . . . . . . . . 21,841,296 10.36% 2,262,483 20,298,223 10.08% 2,045,437 18,036,420 10.01% 1,804,610Other interest earning assets . . . . . . 3,295,406 5.35% 176,225 2,894,064 3.82% 110,465 2,234,570 2.24% 50,059
Total interest earning assets . . . 25,546,145 9.62% 2,458,526 23,783,731 9.14% 2,174,811 20,627,761 9.01% 1,859,504Allowance for loan losses . . . . . . . . (791,088) (864,224) (971,967)Other assets . . . . . . . . . . . . . . . . . . . 2,629,713 2,319,973 2,288,409
Total assets . . . . . . . . . . . . . . . . $27,384,770 $25,239,480 $21,944,203
Liabilities and Stockholder’s EquityInterest bearing liabilities:
Interest bearing deposits:Time deposits(2) . . . . . . . . . . . . . . $12,585,124 4.67% 587,243 $13,829,102 4.28% 591,338 $10,755,628 4.72% 507,722Money market deposits . . . . . . . . 1,683,975 4.88% 82,239 685,201 2.90% 19,885 681,606 1.05% 7,160Other interest bearing deposits . . . 25,613 3.29% 844 6,038 1.01% 60 5,960 1.01% 61
Total interest bearingdeposits . . . . . . . . . . . . . . . . 14,294,712 4.69% 670,326 14,520,341 4.21% 611,283 11,443,194 4.50% 514,943
Borrowings:Short-term borrowings
Domestic . . . . . . . . . . . . . . . . . 2,334,648 5.03% 117,462 2,040,719 3.07% 62,686 2,383,738 1.47% 35,136International . . . . . . . . . . . . . . . 1,805,302 4.22% 76,258 998,431 4.49% 44,799 755,834 5.49% 41,495
Total short-term borrowings . . 4,139,950 4.68% 193,720 3,039,150 3.54% 107,485 3,139,572 2.44% 76,631Long-term borrowings
Domestic . . . . . . . . . . . . . . . . . 820,045 5.91% 48,492 817,224 5.41% 44,243 796,487 5.02% 39,980International . . . . . . . . . . . . . . . 576,276 4.77% 27,502 279,574 4.82% 13,468 338,644 4.74% 16,068
Total long-term borrowings . . . 1,396,321 5.44% 75,994 1,096,798 5.26% 57,711 1,135,131 4.94% 56,048
Total borrowings . . . . . . . . . . . 5,536,271 4.87% 269,714 4,135,948 3.99% 165,196 4,274,703 3.10% 132,679
Total interest bearingliabilities . . . . . . . . . . . . . . . . 19,830,983 4.74% 940,040 18,656,289 4.16% 776,479 15,717,897 4.12% 647,622
Other liabilities and stockholder’sequity . . . . . . . . . . . . . . . . . . . . . . 7,553,787 6,583,191 6,226,306
Total liabilities andstockholder’s equity . . . . . . . $27,384,770 $25,239,480 $21,944,203
Net interest income . . . . . . . . . $1,518,486 $1,398,332 $1,211,882
Net interest margin(3) . . . . . . . . . . . . 5.94% 5.88% 5.88%Interest rate spread(4) . . . . . . . . . . . . 4.88% 4.98% 4.89%
(1) Average balances of loan receivables include non-accruing loans and these loans are therefore included in the yield calculations. If thesebalances were excluded, there would not be a material impact on the amounts reported above.
(2) Includes the impact of interest rate swap agreements used to change a portion of fixed-rate funding to floating-rate funding.(3) Net interest margin represents net interest income as a percentage of total interest earning assets.(4) Interest rate spread represents the difference between the rate on total interest earning assets and the rate on total interest bearing
liabilities.
70
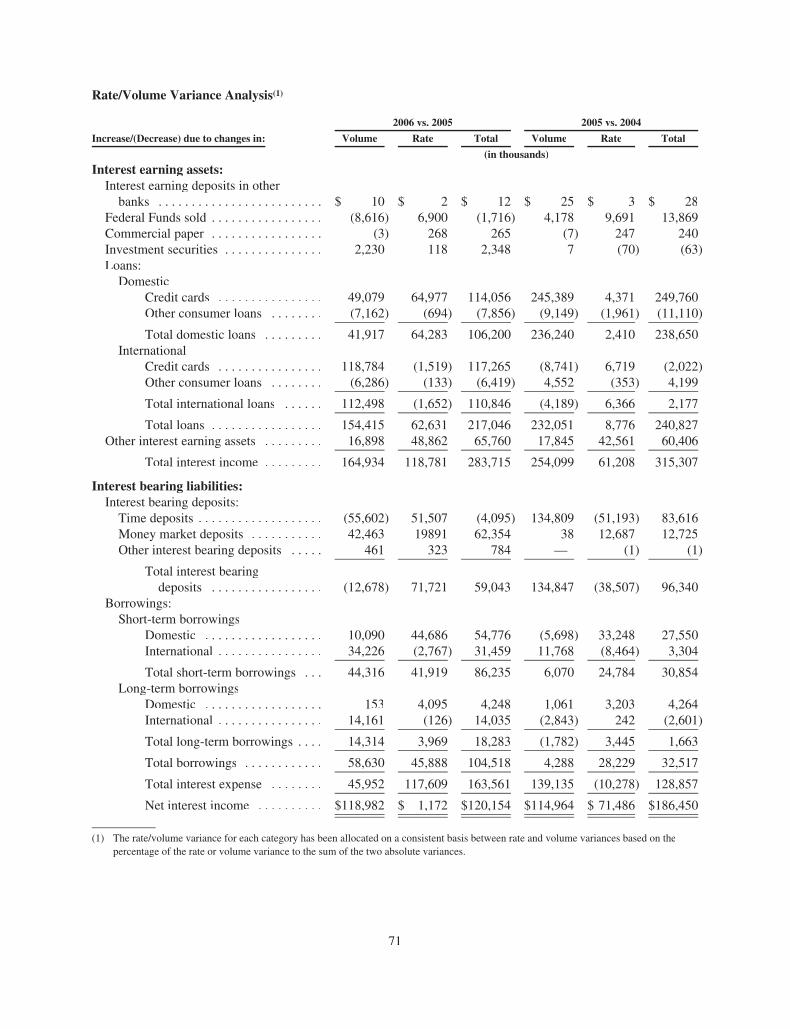
Rate/Volume Variance Analysis(1)
2006 vs. 2005 2005 vs. 2004
Increase/(Decrease) due to changes in: Volume Rate Total Volume Rate Total
(in thousands)
Interest earning assets:Interest earning deposits in other
banks . . . . . . . . . . . . . . . . . . . . . . . . . $ 10 $ 2 $ 12 $ 25 $ 3 $ 28Federal Funds sold . . . . . . . . . . . . . . . . . (8,616) 6,900 (1,716) 4,178 9,691 13,869Commercial paper . . . . . . . . . . . . . . . . . (3) 268 265 (7) 247 240Investment securities . . . . . . . . . . . . . . . 2,230 118 2,348 7 (70) (63)Loans:
DomesticCredit cards . . . . . . . . . . . . . . . . 49,079 64,977 114,056 245,389 4,371 249,760Other consumer loans . . . . . . . . (7,162) (694) (7,856) (9,149) (1,961) (11,110)
Total domestic loans . . . . . . . . . 41,917 64,283 106,200 236,240 2,410 238,650International
Credit cards . . . . . . . . . . . . . . . . 118,784 (1,519) 117,265 (8,741) 6,719 (2,022)Other consumer loans . . . . . . . . (6,286) (133) (6,419) 4,552 (353) 4,199
Total international loans . . . . . . 112,498 (1,652) 110,846 (4,189) 6,366 2,177
Total loans . . . . . . . . . . . . . . . . . 154,415 62,631 217,046 232,051 8,776 240,827Other interest earning assets . . . . . . . . . 16,898 48,862 65,760 17,845 42,561 60,406
Total interest income . . . . . . . . . 164,934 118,781 283,715 254,099 61,208 315,307
Interest bearing liabilities:Interest bearing deposits:
Time deposits . . . . . . . . . . . . . . . . . . . (55,602) 51,507 (4,095) 134,809 (51,193) 83,616Money market deposits . . . . . . . . . . . 42,463 19891 62,354 38 12,687 12,725Other interest bearing deposits . . . . . 461 323 784 — (1) (1)
Total interest bearingdeposits . . . . . . . . . . . . . . . . . (12,678) 71,721 59,043 134,847 (38,507) 96,340
Borrowings:Short-term borrowings
Domestic . . . . . . . . . . . . . . . . . . 10,090 44,686 54,776 (5,698) 33,248 27,550International . . . . . . . . . . . . . . . . 34,226 (2,767) 31,459 11,768 (8,464) 3,304
Total short-term borrowings . . . 44,316 41,919 86,235 6,070 24,784 30,854Long-term borrowings
Domestic . . . . . . . . . . . . . . . . . . 153 4,095 4,248 1,061 3,203 4,264International . . . . . . . . . . . . . . . . 14,161 (126) 14,035 (2,843) 242 (2,601)
Total long-term borrowings . . . . 14,314 3,969 18,283 (1,782) 3,445 1,663
Total borrowings . . . . . . . . . . . . 58,630 45,888 104,518 4,288 28,229 32,517
Total interest expense . . . . . . . . 45,952 117,609 163,561 139,135 (10,278) 128,857
Net interest income . . . . . . . . . . $118,982 $ 1,172 $120,154 $114,964 $ 71,486 $186,450
(1) The rate/volume variance for each category has been allocated on a consistent basis between rate and volume variances based on thepercentage of the rate or volume variance to the sum of the two absolute variances.
71

For the year ended November 30, 2006, interest income increased $283.7 million, or 13%, as compared tothe year ended November 30, 2005, due to higher average interest earning assets of $1.8 billion and a 48 basispoint increase in interest yield. The level of interest earning assets reflects higher credit card loan receivablesresulting from the acquisition of Goldfish and record domestic sales volume, in addition to higher amounts duefrom asset securitization. The increase in the interest yield is largely attributable to improved credit quality on thedomestic credit card loan receivables following the October 2005 effective date of the new U.S. bankruptcylegislation and the related lower level of interest charge-offs. The higher interest yield also reflects higher interestincome on floating rate interest earning assets resulting from the rising interest rate environment.
For the year ended November 30, 2006, interest expense increased $163.6 million, or 21%, as compared tothe year ended November 30, 2005, due to a 58 basis point increase in the average cost of funds and a $1.2billion increase in the level of average interest bearing liabilities to support the increase in interest earning assets.The increase in the average cost of funds reflects the effect of the rising interest rate environment on interestbearing liabilities that are tied to floating rates. This effect was partially offset by the replacement of maturingbrokered certificates of deposit with shorter-term instruments having lower costs. The increase in average interestbearing liabilities consists of higher short-term notes payable to Morgan Stanley due to a lower level of U.K.securitized loans, higher money market accounts obtained from the Bank Deposit Program and higher FederalFunds purchased, specifically from Morgan Stanley Bank.
For the year ended November 30, 2005, interest income increased $315.3 million, or 17%, compared to theyear ended November 30, 2004, due to higher average interest earning assets of $3.2 billion and a 13 basis pointincrease in yield. The increase in average interest earning assets is due to a higher level of domestic credit cardloan receivables and an increase in amounts due from asset securitization. The previous evaluation of ourspin-off from Morgan Stanley in 2005 resulted in the deferral of new securitization transactions. This deferraland a high level of maturities on existing securitized loans resulted in a lower level of average securitized loansand an increase in average owned credit card loan receivables. The increase in amounts due from assetsecuritization reflects the daily transfer to the domestic trust of related cardmember payments which began, inaccordance with the governing securitization documents, as a result of the downgrade of Discover Bank’s short-term debt rating in April 2005. The higher interest yield in 2005 is attributable to the impact of the rising interestrate environment on domestic floating rates as well as an increase in the yield on U.K. receivables.
For the year ended November 30, 2005, interest expense increased $128.9 million, or 20%, as compared tothe year ended November 30, 2004, primarily due to a higher level of average interest bearing liabilities tosupport the increase in average interest earning assets. Average interest bearing liabilities increased $2.9 billionand consisted of higher brokered certificates of deposit.
Provision for Loan Losses
Provision for loan losses is the expense related to maintaining the allowance for loan losses at a leveladequate to absorb the estimated probable losses in the loan portfolio at each period end date. Factors thatinfluence the provision for loan losses include the level and direction of credit card loan delinquencies andcharge-offs, changes in consumer spending and payment behaviors, bankruptcy trends, regulatory changes ornew regulatory guidance, the seasoning of our credit card loan portfolio, interest rate movements and their impacton consumer behavior, and changes in our credit card loan portfolio, including the overall mix of accounts,products and loan balances within the portfolio. We consider the credit quality of the loan portfolio indetermining the allowance for loan losses. See “—Critical Accounting Policies” and Note 3: Summary ofSignificant Accounting Policies to the audited combined financial statements for further discussion. Creditquality at any time reflects, among other factors, our credit granting practices and effectiveness of collectionefforts, the impact of general economic conditions on the consumer, and the seasoning of the loans.
For the three months ended February 28, 2007, the provision for loan losses increased $40.6 million, or26%, compared with the three months ended February 28, 2006. This increase primarily reflected higher balances
72

of domestic loans and higher losses on international loans partially offset by lower net charge-off rates ondomestic loans. In the three months ended February 28, 2006, domestic net charge-offs included the impact onbankruptcy related charge-offs following the October 2005 effective date of the new U. S. bankruptcy legislation.International losses were impacted by the Goldfish acquisition in February 2006.
For the year ended November 30, 2006, the provision for loan losses decreased $122.8 million, or 14%, ascompared to the year ended November 30, 2005. The decrease reflected improvements in domestic loan losseswhich were partially offset by higher losses on international loans. The decrease in net domestic charge-offsreflected an acceleration of charge-offs in 2005, resulting in lower amounts in 2006, as a result of a decline inbankruptcy receipts following the October 2005 effective date of the new U.S. bankruptcy legislation, andimproved domestic credit and collection experience. In 2006, international loan net charge-offs include theimpact of the Goldfish acquisition in February 2006. For the year ended November 30, 2005, the provision forloan losses decreased $47.1 million, or 5%, as compared to the year ended November 30, 2004. The decreasereflected lower domestic net charge-offs due to improvement in credit quality in our domestic loan portfolio,partially offset by the impact of a surge in bankruptcy receipts in advance of the October 2005 effective date ofthe new U.S. bankruptcy legislation, an increase in the international allowance for loan losses and higherinternational net charge-offs.
Allowance for Loan Losses
The following table provides a summary of the allowance for loan losses (dollars in thousands):
For theThree Months
Ended February 28,For the Years Ended
November 30,
2007 2006 2006 2005 2004 2003 2002
Balance, beginning of period . . . . . . . . . . . . . . . . $ 832,483 $ 838,848 $ 838,848 $ 942,721 $ 1,001,656 $ 927,351 $ 845,421Charge-offs:
Domestic . . . . . . . . . . . . . . . . . . . . . . . . . . . (229,124) (275,873) (852,636) (1,076,179) (1,061,084) (1,246,954) (1,290,956)International . . . . . . . . . . . . . . . . . . . . . . . . . (51,660) (24,008) (148,794) (68,177) (58,655) (56,181) (62,217)
Total charge-offs . . . . . . . . . . . . . . . . . (280,784) (299,881) (1,001,430) (1,144,356) (1,119,739) (1,303,135) (1,353,173)Recoveries:
Domestic . . . . . . . . . . . . . . . . . . . . . . . . . . . 41,183 42,444 154,066 145,642 114,721 96,219 89,672International . . . . . . . . . . . . . . . . . . . . . . . . . 5,744 4,510 20,418 20,805 16,835 11,452 5,850
Total recoveries . . . . . . . . . . . . . . . . . . 46,927 46,954 174,484 166,447 131,556 107,671 95,522
Net charge-offs . . . . . . . . . . . . . . . . . . . . . . . . . . (233,857) (252,927) (826,946) (977,909) (988,183) (1,195,464) (1,257,651)
Provision for loan losses:Domestic . . . . . . . . . . . . . . . . . . . . . . . . . . . 147,197 130,798 606,765 816,197 893,531 1,220,094 1,280,350International . . . . . . . . . . . . . . . . . . . . . . . . . 48,189 24,030 148,872 62,289 32,018 46,018 56,403
Total provision for loan losses . . . . . . . 195,386 154,828 755,637 878,486 925,549 1,266,112 1,336,753Other activity:
Domestic . . . . . . . . . . . . . . . . . . . . . . . . . . . — — — (199) — — —International:
Reserves acquired . . . . . . . . . . . . . . . . — 43,557 55,499 — — — —Translation adjustments and other . . . . (162) 676 9,445 (4,251) 3,699 3,656 2,828
Total other activity . . . . . . . . . . . . (162) 44,233 64,944 (4,450) 3,699 3,656 2,828
Balance at end of period . . . . . . . . . . . . . . . . . . . $ 793,850 $ 784,982 $ 832,483 $ 838,848 $ 942,721 $ 1,001,656 $ 927,351
The allowance for loan losses increased $8.9 million, or 1%, at February 28, 2007 as compared toFebruary 28, 2006. The increase was due to higher levels of domestic loans and a decline in international creditquality, offset in part by improved domestic credit quality. The allowance for loan losses at February 28, 2006includes $43.6 million of acquired reserves related to the Goldfish acquisition.
73

The allowance for loan losses declined $38.6 million, or 5%, at February 28, 2007 as compared to November 30, 2006.This decline was due to improved domestic credit quality and a lower level of domestic loans, partially offset by a decline ininternational credit quality.
The allowance for loan losses declined $6.4 million, or 1%, at November 30, 2006 as compared to at November 30,2005. The decline was due to improved domestic credit quality. This improvement was partially offset by a decline ininternational credit quality, recognition of reserves acquired with Goldfish and an increase in the loan portfolio. AtNovember 30, 2005, the allowance for loan losses declined $103.9 million, or 11%, as compared to November 30, 2004. Thisdecline was due to improvement in credit quality in the domestic loan portfolio, partially offset by the impact of higherbankruptcy receipts in advance of the October 2005 effective date of the new U.S. bankruptcy legislation and a decline ininternational loan credit quality. The factors impacting the changes in credit quality across these periods are discussed furtherin the net charge-offs and delinquency sections below.
The following table provides a summary of the composition of the allowance for loan losses (dollars in thousands):
AtFebruary 28, At November 30,
2007 2006 2005 2004 2003 2002
$% toTotal $
% toTotal $
% toTotal $
% toTotal $
% toTotal $
% toTotal
Domestic . . . . . . . . . . . . . . . . . . . . . . . . . $663,172 83.5% $703,917 84.6% $795,722 94.9% $910,261 96.6% $ 963,092 96.1% $893,734 96.4%International . . . . . . . . . . . . . . . . . . . . . . 130,678 16.5 128,566 15.4 43,126 5.1 32,460 3.4 38,564 3.9 33,617 3.6
Allowance for loan losses, end ofperiod . . . . . . . . . . . . . . . . . . . . . . . . . $793,850 100.0% $832,483 100.0% $838,848 100.0% $942,721 100.0% $1,001,656 100.0% $927,351 100.0%
The allowance for loan losses is a general allowance that is determined separately for the domestic and internationalloan portfolios. Accordingly, the percentage of the allowance for loan losses applicable to the domestic and internationalloans will be a function of both the loan balances and credit quality of each portfolio. The percentage of the total allowancefor loan losses applicable to the domestic loan portfolio declined to 83.5% at February 28, 2007 from 84.6% at November 30,2006. This decline was due to improved credit quality in the domestic loan portfolio as compared to deterioration ininternational loan credit quality, offset in part by a slightly higher percentage of loan balances composed of domestic loans.The percentage of the total allowance of loan losses applicable to the domestic loan portfolio declined to 84.6% atNovember 30, 2006 from 94.9% at November 30, 2005 and 96.6% at November 30, 2004. These declines were due toimproved credit quality in the domestic loan portfolio as compared to deterioration in international loan credit quality and aslightly smaller relative percentage of the loan balances composed of domestic loans. In 2006, we recorded an acquiredallowance for loan losses related to international loan portfolio acquisitions of $55.5 million. In 2005, the decline waspartially offset by the impact on the domestic loan portfolio of higher bankruptcy receipts in advance of the October 2005effective date of the new U.S. bankruptcy legislation.
Net Charge-offs
Our net charge-offs include the principal amount of losses charged-off less current period principal recoveries andexclude charged-off interest and fees, current period recoveries of interest and fees and fraud losses. Charged-off andrecovered interest and fees are recorded in interest and loan fee income for loan receivables and in securitization income forsecuritized loans while fraud losses are recorded in other expense. Credit card loans are charged-off at the end of the monthduring which an account becomes 180 days contractually past due, except in the case of cardmember bankruptcies andprobate accounts. Cardmember bankruptcies and probate accounts are charged-off at the end of the month 60 days followingthe receipt of notification of the bankruptcy or death but not later than the 180-day contractual time frame. The net charge-offrate is calculated by dividing net charge-offs for the period by the average loans for the period.
74

The following table presents amounts and rates of net charge-offs of loan receivables (dollars in thousands):
For the Three Months EndedFebruary 28, For the Years Ended November 30,
2007 2006 2006 2005 2004 2003 2002
$ % $ % $ % $ % $ % $ % $ %
Net Charge-OffsDomestic . . . . . . . . . . . . $187,941 3.43% $233,429 4.65% $698,570 3.63% $930,537 4.93% $946,363 5.71% $1,150,735 6.26% $1,201,284 6.24%International . . . . . . . . . . 45,916 6.29% 19,498 3.56% 128,376 4.96% 47,372 3.33% 41,820 2.87% 44,729 2.78% 56,367 3.26%
Total . . . . . . . . . . $233,857 3.76% $252,927 4.54% $826,946 3.79% $977,909 4.82% $988,183 5.48% $1,195,464 5.98% $1,257,651 6.00%
The net charge-off rate on our loan receivables declined 78 basis points for the three months ended February 28, 2007 ascompared with the three months ended February 28, 2006, reflecting strong domestic credit quality partially offset byincreased international net charge-offs. The three months ended February 28, 2006 reflected the impact on the domesticportfolio of bankruptcy related charge-offs following the October 2005 effective date of new U.S. bankruptcy legislation.The three months ended February 28, 2007 include a full quarter of net charge-offs related to the Goldfish business whichwas acquired in February 2006. The net charge-off rate on our total loan receivables declined by 103 basis points for the yearended November 30, 2006 and 66 basis points for the year ended November 30, 2005 compared with the respective prioryears, reflecting an acceleration of charge-offs in 2005, resulting in lower amounts in 2006, and strong domestic portfoliocredit quality partially offset by deterioration in credit quality in the international portfolio and a higher percentage ofinternational loans in the portfolio.
The net charge-off rate on domestic loan receivables declined 122 basis points for the three months ended February 28,2007 compared with the three months ended February 28, 2006. The net charge-off rate on domestic loan receivablesdeclined 130 basis points for the year ended November 30, 2006 and 78 basis points for the year ended November 30, 2005compared with the respective prior years, due to an acceleration in charge-offs in 2005, resulting in lower amounts in 2006,and improved credit and collection experience. The 2006 and 2005 net charge-off rates were also impacted by the October2005 effective date of the new U.S. bankruptcy legislation. This legislation, which made it more difficult for individuals todeclare bankruptcy, resulted in a surge in bankruptcy receipts and related charge-offs in 2005 and early 2006. Also in 2006,domestic net charge-offs benefited from lower bankruptcy related charge-offs that occurred subsequent to the effective dateof this legislation.
The net charge-off rate on international loan receivables increased 273 basis points for the three months endedFebruary 28, 2007 as compared to the three months ended February 28, 2006. The net charge-off rate on international loanreceivables increased 163 basis points for the years ended November 30, 2006 and 46 basis points for the year endedNovember 30, 2005 compared with the respective prior years. These increases were due to legislative changes in the UnitedKingdom that have led to increased bankruptcy and individual voluntary arrangement filings and a general deterioration inconsumer credit quality in the United Kingdom.
Delinquencies
Delinquencies are an indicator of credit quality at any point in time. Loan balances are considered delinquent whencontractual payments on the loan become 30 days past due.
The following table presents the amounts and delinquency rates of loan receivables over 30 days past due (dollars inthousands):
Loans over 30 daysdelinquent
At February 28, At November 30,
2007 2006 2006 2005 2004 2003 2002
$ % $ % $ % $ % $ % $ % $ %
Domestic . . . . . . . . . . . . . $587,245 2.98% $514,940 2.96% $633,150 3.05% $756,198 3.67% $790,048 4.18% $ 990,767 5.51% $1,137,080 5.56%International . . . . . . . . . . . 125,564 4.35% 83,207 2.98% 128,806 4.36% 77,919 3.55% 24,895 2.02% 39,351 2.84% 58,316 2.76%
Total . . . . . . . . . . . . . $712,809 3.15% $598,147 2.97% $761,956 3.21% $834,117 3.66% $814,943 4.05% $1,030,118 5.32% $1,195,396 5.30%
75

The over 30 day delinquency rate of our total loan portfolio increased 18 basis points at February 28, 2007 as comparedto February 28, 2006 due to the acquisition of the Goldfish portfolio and a deterioration in credit quality in the internationalloan portfolio. The over 30 day delinquency rate of our total loan portfolio declined 45 basis points at November 30, 2006and 39 basis points at November 30, 2005 compared with the respective prior year ends, due to improved domestic creditquality partially offset by deterioration of the credit quality in our international card portfolio and a higher percentage ofinternational loans in loan receivables.
The over 30 day delinquency rate of our domestic loan receivables increased 2 basis points at February 28, 2007 ascompared to February 28, 2006. This small increase over the 2006 period reflects continued strong domestic credit quality.The over 30 day delinquency rate of our domestic loan receivables declined 62 basis points at November 30, 2006 and 51basis points at November 30, 2005 compared with the respective prior year ends, due to improved credit and collectionexperience.
The over 30 day delinquency rate of our international loan receivables increased 137 basis points at February 28, 2007as compared to February 28, 2006 due to the acquisition of the Goldfish business and deterioration in consumer credit qualityin the United Kingdom. Delinquent receivables purchased with the Goldfish business in February 2006 were recorded at theirestimated fair value, which was significantly lower than the unpaid balance. This had the effect of lowering the delinquencyrate at February 28, 2006. The over 30 day delinquency rate of our international loan receivables increased 81 basis points atNovember 30, 2006 and 153 basis points at November 30, 2005 compared with the respective prior years. The internationalportfolio over 30 day delinquency rates have increased primarily with a general deterioration in consumer credit quality inthe United Kingdom. For 2006, the over 30 day delinquency rates include the impact of the acquisition of the Goldfishbusiness in February 2006.
The following table presents the amounts and delinquency rates of loan receivables that are accruing interest and areover 90 days delinquent (dollars in thousands):
AtFebruary 28, At November 30,
Loans over 90 days delinquent andaccruing interest
2007 2006 2005 2004 2003 2002
$ % $ % $ % $ % $ % $ %
Domestic . . . . . . . . . . . . . . . . . . . $240,229 1.22% $244,669 1.18% $263,439 1.28% $342,324 1.81% $409,644 2.28% $392,802 1.92%International . . . . . . . . . . . . . . . . . 35,053 1.22% 38,997 1.32% 26,640 1.29% 9,822 0.88% 12,767 0.95% 15,847 0.75%
Total . . . . . . . . . . . . . . . . . . . $275,282 1.22% $283,666 1.19% $290,079 1.27% $352,146 1.75% $422,411 2.18% $408,649 1.81%
These loans are included in loan receivables over 30 days delinquent and the related discussion thereof.
The following table presents the amounts and delinquency rates of loan receivables that are not accruing interest,regardless of delinquency (dollars in thousands):
AtFebruary 28, At November 30,
Loans not accruing interest 2007 2006 2005 2004 2003 2002
$ % $ % $ % $ % $ % $ %
Domestic . . . . . . . . . . . . . . . . . . . $ 96,515 0.49% $110,486 0.53% $215,671 1.05% $116,596 0.62% $138,918 0.77% $162,655 0.80%International(1) . . . . . . . . . . . . . . . 151,200 5.24% 143,435 4.86% 57,428 2.79% 16,467 1.47% 11,601 0.86% 19,675 0.93%
Total . . . . . . . . . . . . . . . . . . . $247,715 1.10% $253,921 1.07% $273,099 1.20% $133,063 0.66% $150,519 0.78% $182,340 0.81%
(1) The increase in international loans not accruing interest beginning in 2006 is attributable to the acquisition of Goldfish.
Loan receivables are placed on non-accrual status upon receipt of notification of the bankruptcy or death of acardmember and as part of certain collection management processes. Trends in loans not accruing interest have beenconsistent with the credit quality trends previously discussed. At November 30, 2005, domestic non-accrual loans werehigher due to the surge in bankruptcy receipts before the October 2005 effective date of the new U.S. bankruptcy legislation.
76

Other Income
The principal component of other income is securitization income. The following table presents the components of otherincome for the periods presented (dollars in thousands):
For the ThreeMonths EndedFebruary 28,
2007 vs. 2006increase(decrease)
For the Years EndedNovember 30,
2006 vs. 2005increase(decrease)
2005 vs. 2004increase(decrease)
2007 2006 $ % 2006 2005 2004 $ % $ %
Securitization income . . . . . . . . . . . . . $520,621 $595,868 $(75,247) (13)% $2,338,405 $1,608,928 $1,921,151 $ 729,477 45% $(312,223) (16)%Loan fee income . . . . . . . . . . . . . . . . . 100,746 88,569 12,177 14% 369,449 338,169 318,153 31,280 9% 20,016 6%Discount and interchange
revenue(1) . . . . . . . . . . . . . . . . . . . . 82,798 97,810 (15,012) (15)% 365,986 618,158 764,926 (252,172) (41)% (146,768) (19)%Insurance . . . . . . . . . . . . . . . . . . . . . . . 51,355 47,580 3,775 8% 188,160 168,791 145,728 19,369 11% 23,063 16%Merchant fees . . . . . . . . . . . . . . . . . . . 25,326 22,955 2,371 10% 109,230 72,871 45,884 36,359 50% 26,987 59%Transaction processing revenue . . . . . 24,510 23,816 694 3% 94,472 86,903 — 7,569 9% 86,903 **Other income . . . . . . . . . . . . . . . . . . . 20,321 12,677 7,644 60% 73,237 43,217 52,544 30,020 69% (9,327) (18)%
Total other income . . . . . . . . . . . . . . . $825,677 $889,275 $(63,598) (7)% $3,538,939 $2,937,037 $3,248,386 $ 601,902 20% $(311,349) (10)%
** Reflects acquisition of PULSE in 2005.(1) Net of rewards, including Cashback Bonus rewards, of $205 million and $181 million for the three months ended February 28, 2007 and 2006,
respectively, and $767 million, $659 million and $550 million for the years ended November 30, 2006, 2005 and 2004, respectively.
Other income decreased $63.6 million, or 7%, for the three months ended February 28, 2007 as compared to the threemonths ended February 28, 2006 primarily related to lower securitization income and discount and interchange revenue,partially offset by higher loan fee and other income.
Other income increased $601.9 million, or 20%, for the year ended November 30, 2006 as compared to the year endedNovember 30, 2005, primarily related to higher securitization income. Other income decreased $311.3 million, or 10%, forthe year ended November 30, 2005 as compared to the year ended November 30, 2004, primarily due to lower securitizationincome and lower discount and interchange revenue, partially offset by transaction processing revenues related to theacquisition of PULSE.
Securitization income in 2006 benefited from a favorable revaluation of the interest-only strip receivable reflectinghigher excess spread projections as a result of the new U.S. bankruptcy legislation which became effective in October2005. Securitization income in 2005 was negatively impacted by the effect of the anticipated level of charge-offs on theprojected excess spread which in turn adversely affected the valuation of the interest-only strip receivable.
For securitization transactions completed on or after November 3, 2004, in accordance with governing securitizationdocuments, we allocate portions of our discount and interchange revenue to new securitization transactions. Within otherincome, this change to allocating discount and interchange revenue has the effect of decreasing discount and interchangerevenue and increasing securitization income. The amount of discount and interchange revenue allocated to securitizationshas increased since this change was made in 2004 and is expected to continue increasing as new transactions which includeallocations are completed and securitization transactions that did not receive allocations mature. For the years endedNovember 30, 2006, 2005 and 2004, there were 54%, 22% and 4%, respectively, of average securitized loans to whichdiscount and interchange revenue was allocated.
To broaden merchant acceptance of Discover Network cards, we began outsourcing our acquisition and servicing ofsmall and mid-sized merchants to merchant acquiring organizations in late 2006. In addition, we are selling small andmid-size merchant acquiring portfolios to third-party acquirers to facilitate integrated servicing and reduce costs. As theoutsourcing continues, merchant discount will be replaced by acquirer interchange and assessments, which will reduceincome on a per transaction basis and, over time, operating expenses as we no longer incur costs to acquire and service smalland mid-sized merchants. The lower cost per transaction is expected to be offset by increased volume due to broaderacceptance. Any gains on the sale of merchant acquiring portfolios will be reflected in other income as earned.
77
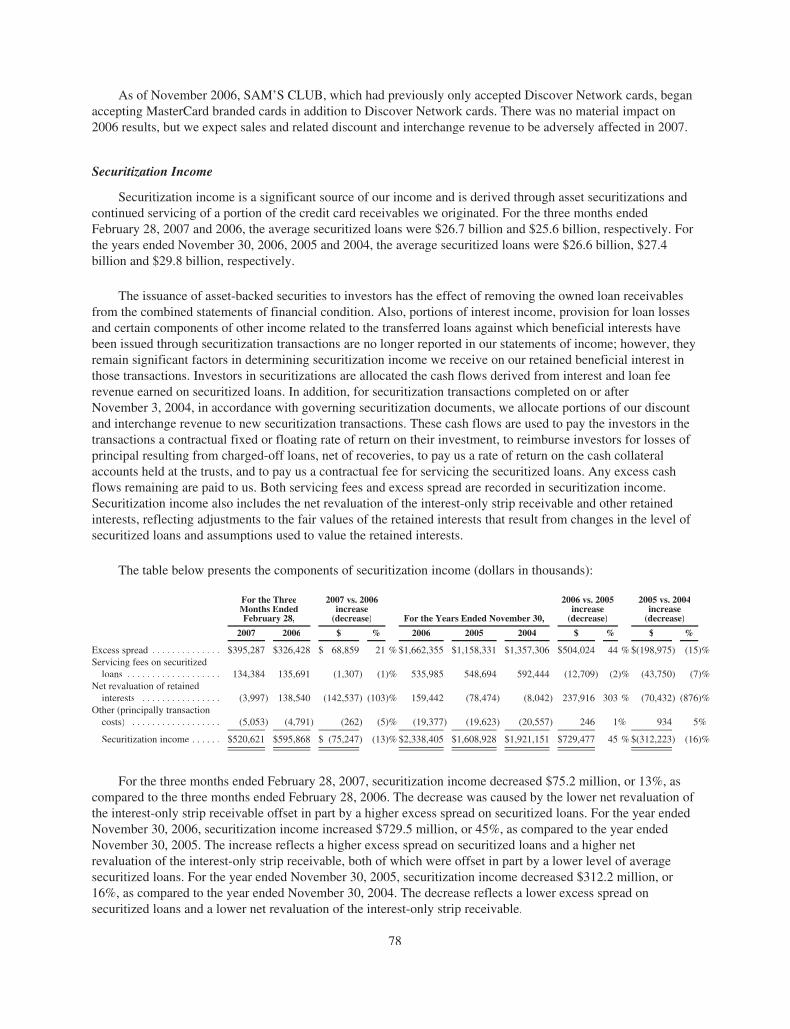
As of November 2006, SAM’S CLUB, which had previously only accepted Discover Network cards, beganaccepting MasterCard branded cards in addition to Discover Network cards. There was no material impact on2006 results, but we expect sales and related discount and interchange revenue to be adversely affected in 2007.
Securitization Income
Securitization income is a significant source of our income and is derived through asset securitizations andcontinued servicing of a portion of the credit card receivables we originated. For the three months endedFebruary 28, 2007 and 2006, the average securitized loans were $26.7 billion and $25.6 billion, respectively. Forthe years ended November 30, 2006, 2005 and 2004, the average securitized loans were $26.6 billion, $27.4billion and $29.8 billion, respectively.
The issuance of asset-backed securities to investors has the effect of removing the owned loan receivablesfrom the combined statements of financial condition. Also, portions of interest income, provision for loan lossesand certain components of other income related to the transferred loans against which beneficial interests havebeen issued through securitization transactions are no longer reported in our statements of income; however, theyremain significant factors in determining securitization income we receive on our retained beneficial interest inthose transactions. Investors in securitizations are allocated the cash flows derived from interest and loan feerevenue earned on securitized loans. In addition, for securitization transactions completed on or afterNovember 3, 2004, in accordance with governing securitization documents, we allocate portions of our discountand interchange revenue to new securitization transactions. These cash flows are used to pay the investors in thetransactions a contractual fixed or floating rate of return on their investment, to reimburse investors for losses ofprincipal resulting from charged-off loans, net of recoveries, to pay us a rate of return on the cash collateralaccounts held at the trusts, and to pay us a contractual fee for servicing the securitized loans. Any excess cashflows remaining are paid to us. Both servicing fees and excess spread are recorded in securitization income.Securitization income also includes the net revaluation of the interest-only strip receivable and other retainedinterests, reflecting adjustments to the fair values of the retained interests that result from changes in the level ofsecuritized loans and assumptions used to value the retained interests.
The table below presents the components of securitization income (dollars in thousands):
For the ThreeMonths EndedFebruary 28,
2007 vs. 2006increase(decrease) For the Years Ended November 30,
2006 vs. 2005increase(decrease)
2005 vs. 2004increase(decrease)
2007 2006 $ % 2006 2005 2004 $ % $ %
Excess spread . . . . . . . . . . . . . . $395,287 $326,428 $ 68,859 21 % $1,662,355 $1,158,331 $1,357,306 $504,024 44 % $(198,975) (15)%Servicing fees on securitized
loans . . . . . . . . . . . . . . . . . . . 134,384 135,691 (1,307) (1)% 535,985 548,694 592,444 (12,709) (2)% (43,750) (7)%Net revaluation of retained
interests . . . . . . . . . . . . . . . . (3,997) 138,540 (142,537) (103)% 159,442 (78,474) (8,042) 237,916 303 % (70,432) (876)%Other (principally transaction
costs) . . . . . . . . . . . . . . . . . . (5,053) (4,791) (262) (5)% (19,377) (19,623) (20,557) 246 1% 934 5%
Securitization income . . . . . . $520,621 $595,868 $ (75,247) (13)% $2,338,405 $1,608,928 $1,921,151 $729,477 45 % $(312,223) (16)%
For the three months ended February 28, 2007, securitization income decreased $75.2 million, or 13%, ascompared to the three months ended February 28, 2006. The decrease was caused by the lower net revaluation ofthe interest-only strip receivable offset in part by a higher excess spread on securitized loans. For the year endedNovember 30, 2006, securitization income increased $729.5 million, or 45%, as compared to the year endedNovember 30, 2005. The increase reflects a higher excess spread on securitized loans and a higher netrevaluation of the interest-only strip receivable, both of which were offset in part by a lower level of averagesecuritized loans. For the year ended November 30, 2005, securitization income decreased $312.2 million, or16%, as compared to the year ended November 30, 2004. The decrease reflects a lower excess spread onsecuritized loans and a lower net revaluation of the interest-only strip receivable.
78
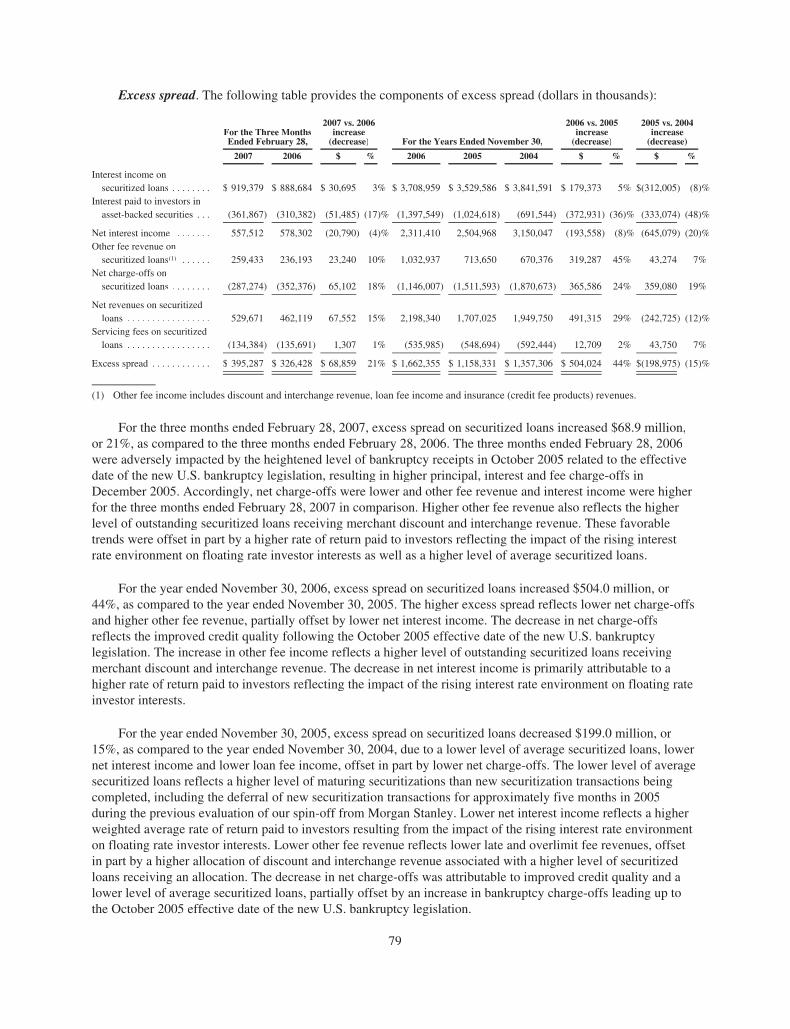
Excess spread. The following table provides the components of excess spread (dollars in thousands):
For the Three MonthsEnded February 28,
2007 vs. 2006increase(decrease) For the Years Ended November 30,
2006 vs. 2005increase(decrease)
2005 vs. 2004increase(decrease)
2007 2006 $ % 2006 2005 2004 $ % $ %
Interest income onsecuritized loans . . . . . . . . $ 919,379 $ 888,684 $ 30,695 3% $ 3,708,959 $ 3,529,586 $ 3,841,591 $ 179,373 5% $(312,005) (8)%
Interest paid to investors inasset-backed securities . . . (361,867) (310,382) (51,485) (17)% (1,397,549) (1,024,618) (691,544) (372,931) (36)% (333,074) (48)%
Net interest income . . . . . . . 557,512 578,302 (20,790) (4)% 2,311,410 2,504,968 3,150,047 (193,558) (8)% (645,079) (20)%Other fee revenue on
securitized loans(1) . . . . . . 259,433 236,193 23,240 10% 1,032,937 713,650 670,376 319,287 45% 43,274 7%Net charge-offs on
securitized loans . . . . . . . . (287,274) (352,376) 65,102 18% (1,146,007) (1,511,593) (1,870,673) 365,586 24% 359,080 19%
Net revenues on securitizedloans . . . . . . . . . . . . . . . . . 529,671 462,119 67,552 15% 2,198,340 1,707,025 1,949,750 491,315 29% (242,725) (12)%
Servicing fees on securitizedloans . . . . . . . . . . . . . . . . . (134,384) (135,691) 1,307 1% (535,985) (548,694) (592,444) 12,709 2% 43,750 7%
Excess spread . . . . . . . . . . . . $ 395,287 $ 326,428 $ 68,859 21% $ 1,662,355 $ 1,158,331 $ 1,357,306 $ 504,024 44% $(198,975) (15)%
(1) Other fee income includes discount and interchange revenue, loan fee income and insurance (credit fee products) revenues.
For the three months ended February 28, 2007, excess spread on securitized loans increased $68.9 million,or 21%, as compared to the three months ended February 28, 2006. The three months ended February 28, 2006were adversely impacted by the heightened level of bankruptcy receipts in October 2005 related to the effectivedate of the new U.S. bankruptcy legislation, resulting in higher principal, interest and fee charge-offs inDecember 2005. Accordingly, net charge-offs were lower and other fee revenue and interest income were higherfor the three months ended February 28, 2007 in comparison. Higher other fee revenue also reflects the higherlevel of outstanding securitized loans receiving merchant discount and interchange revenue. These favorabletrends were offset in part by a higher rate of return paid to investors reflecting the impact of the rising interestrate environment on floating rate investor interests as well as a higher level of average securitized loans.
For the year ended November 30, 2006, excess spread on securitized loans increased $504.0 million, or44%, as compared to the year ended November 30, 2005. The higher excess spread reflects lower net charge-offsand higher other fee revenue, partially offset by lower net interest income. The decrease in net charge-offsreflects the improved credit quality following the October 2005 effective date of the new U.S. bankruptcylegislation. The increase in other fee income reflects a higher level of outstanding securitized loans receivingmerchant discount and interchange revenue. The decrease in net interest income is primarily attributable to ahigher rate of return paid to investors reflecting the impact of the rising interest rate environment on floating rateinvestor interests.
For the year ended November 30, 2005, excess spread on securitized loans decreased $199.0 million, or15%, as compared to the year ended November 30, 2004, due to a lower level of average securitized loans, lowernet interest income and lower loan fee income, offset in part by lower net charge-offs. The lower level of averagesecuritized loans reflects a higher level of maturing securitizations than new securitization transactions beingcompleted, including the deferral of new securitization transactions for approximately five months in 2005during the previous evaluation of our spin-off from Morgan Stanley. Lower net interest income reflects a higherweighted average rate of return paid to investors resulting from the impact of the rising interest rate environmenton floating rate investor interests. Lower other fee revenue reflects lower late and overlimit fee revenues, offsetin part by a higher allocation of discount and interchange revenue associated with a higher level of securitizedloans receiving an allocation. The decrease in net charge-offs was attributable to improved credit quality and alower level of average securitized loans, partially offset by an increase in bankruptcy charge-offs leading up tothe October 2005 effective date of the new U.S. bankruptcy legislation.
79

Servicing fees on securitized loans. We are paid a servicing fee from the cash flows generated by thesecuritized loans. These cash flows include interest income and loan fee income as well as discount andinterchange revenue for certain securitized loans. For the three months ended February 28, 2007, servicing feesdecreased $1.3 million, or 1%, as compared to the three months ended February 28, 2006. Although averagesecuritized loans were higher, servicing fees were slightly lower in comparison, reflecting the favorable impactof a high level of new securitization transactions during the three months ended February 28, 2006 incomparison. For the years ended November 30, 2006 and 2005, servicing fees decreased $12.7 million, or 2%,and $43.7 million, or 7%, from the respective prior years. The decrease in both years was due to a lower level ofsecuritized loans in comparison to the respective prior years.
Net revaluation of retained interests. Amounts included in the net revaluation of retained interests reflectprincipally changes in the fair value of the interest-only strip receivable. The components of net revaluation ofretained interests are summarized in the table below (dollars in thousands):
For the Three MonthsEnded February 28, For the Years Ended November 30,
2007 2006 2006 2005 2004
Initial gain on new securitization transactions . . . . . . . $ 23,789 $ 75,645 $103,805 $ 81,947 $ 43,886Revaluation of retained interests . . . . . . . . . . . . . . . . . (27,786) 62,895 55,637 (160,421) (51,928)
Net revaluation of retained interests . . . . . . . . . . $ (3,997) $138,540 $159,442 $ (78,474) $ (8,042)
The net revaluation of retained interests includes the initial gain on transferred loan receivables againstwhich beneficial interests have been issued through securitization transactions and changes in the fair value ofretained interests, principally the interest-only strip receivable. The net revaluation of the interest-only stripreceivable represents changes in the estimated present value of certain components of excess spread on thesecuritized loans to be earned in the future. Changes in the estimate of performance measures of the securitizedloans, such as interest yield and charge-offs, as well as changes in the interest rate environment, can affect futureexcess spread projections and, accordingly, the net revaluation of the interest-only strip receivable.
The net positive revaluation of retained interests for the three months ended February 28, 2006 and the yearended November 30, 2006 were favorably impacted by the effect of lower charge-offs following the October2005 effective date of the new U.S. bankruptcy legislation on the interest-only strip receivable. The netrevaluation of retained interests for the three months ended February 28, 2007 decreased $142.5 million ascompared to the three months ended February 28, 2006. The net revaluation of retained interests for the yearended November 30, 2006 increased $237.9 million as compared to the year ended November 30, 2005.Additionally, during the year ended November 30, 2006, there was a higher level of new credit cardsecuritization transactions as compared to the year ended November 30, 2005, as well as a decrease in net gainamortization related to prior securitization transactions.
For the year ended November 30, 2005, the net revaluation of retained interests decreased $70.4 million ascompared to November 30, 2004. The decrease is due to a lower level of securitized loans at year-end and theeffect on projected charge-offs of higher bankruptcy receipts leading up to the October 2005 effective date of thenew U.S. bankruptcy legislation. The lower level of securitized loans is attributable to the discontinued issuancefrom the Discover securitization trust of new short-term certificates in the fourth quarter of 2005.
Loan Fee Income
Loan fee income consists primarily of fees on credit card loans and includes late, overlimit, balance transfer,cash advance and other miscellaneous fees. Loan fee income increased $12.2 million, or 14%, for the threemonths ended February 28, 2007 as compared to the three months ended February 28, 2006, reflecting higherbalance transfer fees related to increased balance transfer volume. Loan fee income increased $31.3 million, or9%, for the year ended November 30, 2006 as compared to the year ended November 30, 2005, primarily due toportfolio growth in the United Kingdom related to the Goldfish acquisition as well as lower fee net charge-offs
80

and waivers and higher balance transfer fees in the United States. Loan fee income increased $20.0 million, or6%, for the year ended November 30, 2005 as compared to the year ended November 30, 2004, primarily relatedto an increase in loan receivables partially offset by lower overlimit fees due to the modification of our overlimitfee policies and procedures, in response to industry-wide regulatory guidance, to stop charging such fees foraccounts meeting specific criteria.
Discount and Interchange Revenue
Discount and interchange revenue includes discount revenue net of interchange paid to third-party issuers inthe United States, and interchange revenue in the United Kingdom. In the United States, we earn discountrevenue from fees charged to merchants with whom we have entered into card acceptance agreements forprocessing cardmember purchase transactions. We incur an interchange cost to card issuing entities that haveentered into contractual arrangements to issue cards on the Discover Network. This cost is contractuallyestablished and is based on the card issuing organizations’ transaction volume and is reported as a reduction todiscount and interchange revenue. In the United Kingdom, where we issue MasterCard and Visa branded cards,we earn interchange revenue from transactions processed by those networks. We offer our cardmembers variousreward programs, including the Cashback Bonus reward program, pursuant to which we pay certaincardmembers a percentage of their purchase amounts based on the type and volume of the cardmember’spurchases. Reward costs are recorded as a reduction to discount and interchange revenue. For securitizationtransactions completed on or after November 3, 2004, in accordance with governing securitization documents,we allocate portions of discount and interchange revenue to new securitization transactions, which results in adecrease in discount and interchange revenue and an increase in securitization income. However, cardmemberrewards costs associated with the securitized loans are not allocated to investor interests, and as such, do notimpact securitization income.
Discount and interchange revenue decreased $15.0 million, or 15%, for the three months ended February 28,2007 as compared to the three months ended February 28, 2006, due to higher allocations to securitized loanswhich have the effect of reclassifying discount and interchange revenue to securitization income, and highercardmember rewards partially offset by an increase in discount and interchange revenue earned. The increase inallocations to securitized loans was due to a higher level of outstanding securitized loans receiving allocationsthan in 2006. This adverse effect on discount and interchange revenue was partially offset by record sales volumein 2007 reflecting increased cardmember usage and the acquisition of Goldfish in February 2006. The increase incardmember rewards reflected record sales volume and the impact of promotional programs which offer certaincardmembers additional rewards for various types of purchases.
Discount and interchange revenue decreased $252.2 million, or 41%, for the year ended November 30, 2006as compared to the year ended November 30, 2005, due to higher allocations to securitized loans which have theeffect of reclassifying discount and interchange revenue to securitization income, and due to higher cardmemberrewards partially offset by an increase in discount and interchange revenue earned. The increase in allocations tosecuritized loans was due to a higher level of outstanding securitized loans receiving allocations than in 2005.This adverse effect on discount and interchange revenue was partially offset by record sales volume in 2006reflecting increased cardmember usage and the acquisition of Goldfish in February 2006. The increase incardmember rewards reflected record sales volume and the impact of promotional programs which offer certaincardmembers additional rewards for various types of purchases.
Discount and interchange revenue decreased $146.8 million, or 19%, for the year ended November 30, 2005as compared to the year ended November 30, 2004, primarily due to higher allocations to securitized loans whichhave the effect of reclassifying discount and interchange revenue to securitization income and highercardmember rewards partially offset by an increase in discount and interchange revenue earned. The increase inallocations to securitized loans is due to a higher level of outstanding securitized loans receiving allocations thanin 2004. The increase in discount and interchange revenue earned was driven by higher sales volumes reflectingincreased cardmember usage. The increase in cardmember rewards reflected higher sales volume and the impactof promotional programs which offer certain cardmembers additional rewards for various types of purchases.
81

Insurance (Credit Fee Products)
We earn revenue primarily related to fees received for marketing credit-related ancillary products includinginsurance, debt deferment/debt cancellation contracts and credit protection services to cardmembers. The amountof revenue recorded is based on the terms of the insurance policies and contracts with third-party providers. Wedo not retain any significant underwriting loss exposure. We recognize this income over the policy or contractperiod as earned. Insurance income increased $3.8 million, or 8%, for the three months ended February 28, 2007as compared to February 28, 2006, primarily related to increased cardmember participation resulting from theGoldfish acquisition. Insurance income increased $19.4 million, or 11%, for the year ended November 30, 2006as compared to the year ended November 30, 2005, primarily related to increased cardmember participationresulting from the Goldfish acquisition. Revenue from these products increased $23.1 million, or 16%, for theyear ended November 30, 2005 as compared to the year ended November 30, 2004, related to a change inrevenue sharing on certain products.
Merchant Fees
Merchant fees consist primarily of fees charged to merchants for various services including manualauthorization of transactions and delivery of hardcopy statements. Merchant fees increased $2.4 million, or 10%,for the three months ended February 28, 2007 as compared to February 28, 2006. Merchant fees increased $36.4million, or 50%, for the year ended November 30, 2006 as compared to the year ended November 30, 2005, dueto an increase in pricing on certain fees. Merchant fees increased $27.0 million, or 59%, for the year endedNovember 30, 2005 as compared to the year ended November 30, 2004 due to implementation of new fees tocover production and mailing costs of merchant statements. As merchant acquiring portfolios are sold to third-party merchant acquirers, this revenue will decrease along with associated costs.
Transaction Processing Revenue
Transaction processing revenues include switch and settlement fees charged to financial institutions foraccessing the PULSE Network to process transactions and various participation and membership fees. Switchfees are charged on a per transaction basis. Transaction processing revenue increased $0.7 million, or 3%, for thethree months ended February 28, 2007 as compared to February 28, 2006, related to increased transactionvolumes. Transaction processing revenue increased $7.6 million, or 9%, for the year ended November 30, 2006as compared to the year ended November 30, 2005, related to an increased volume of transactions processed onthe network. Transaction processing revenue was a new revenue source in 2005 introduced by our acquisition ofPULSE in January 2005.
Other Income
Other income includes revenues on various fee-based products, revenues from the referral of declinedapplications to certain third-party issuers on the Discover Network, unrealized gains and losses related toderivative contracts, gains on sales of mortgage loans, investment gains and losses, and other miscellaneousrevenue items. See Note 26: Related Party Transactions to the audited combined financial statements for furtherinformation related to the sale of mortgage loans. Other income increased $7.6 million, or 60%, for the threemonths ended February 28, 2007 as compared to February 28, 2006, related to increased revenue from thereferral of declined applications and increased cardmember participation in our Wallet Protection program (oneof our fee-based products). Other income increased $30.0 million, or 69%, for the year ended November 30,2006 as compared to the year ended November 30, 2005, primarily related to increased revenue from the referralof declined applications and an increase in unrealized gains on derivative transactions. Other income decreased$9.3 million, or 18%, for the year ended November 30, 2005 as compared to the year ended November 30, 2004,primarily related to a decline in fee based product revenue and lower volumes of mortgage loan sales.
82
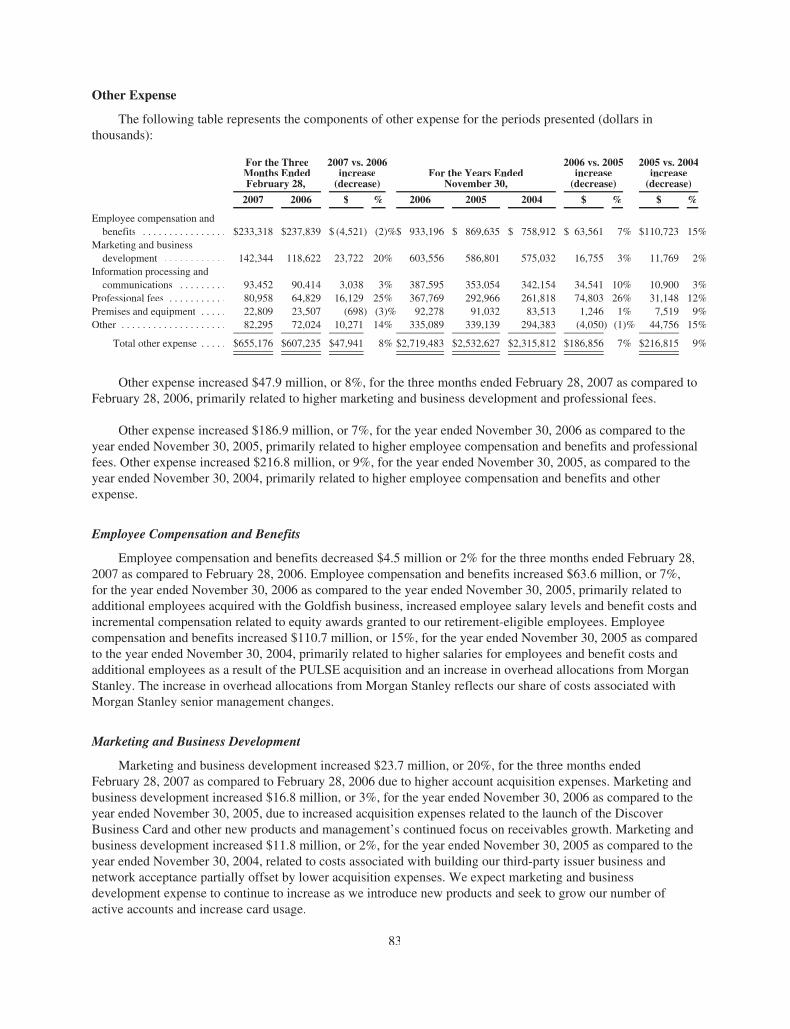
Other Expense
The following table represents the components of other expense for the periods presented (dollars inthousands):
For the ThreeMonths EndedFebruary 28,
2007 vs. 2006increase(decrease)
For the Years EndedNovember 30,
2006 vs. 2005increase(decrease)
2005 vs. 2004increase(decrease)
2007 2006 $ % 2006 2005 2004 $ % $ %
Employee compensation andbenefits . . . . . . . . . . . . . . . . $233,318 $237,839 $ (4,521) (2)%$ 933,196 $ 869,635 $ 758,912 $ 63,561 7% $110,723 15%
Marketing and businessdevelopment . . . . . . . . . . . . 142,344 118,622 23,722 20% 603,556 586,801 575,032 16,755 3% 11,769 2%
Information processing andcommunications . . . . . . . . . 93,452 90,414 3,038 3% 387,595 353,054 342,154 34,541 10% 10,900 3%
Professional fees . . . . . . . . . . . 80,958 64,829 16,129 25% 367,769 292,966 261,818 74,803 26% 31,148 12%Premises and equipment . . . . . 22,809 23,507 (698) (3)% 92,278 91,032 83,513 1,246 1% 7,519 9%Other . . . . . . . . . . . . . . . . . . . . 82,295 72,024 10,271 14% 335,089 339,139 294,383 (4,050) (1)% 44,756 15%
Total other expense . . . . . $655,176 $607,235 $47,941 8% $2,719,483 $2,532,627 $2,315,812 $186,856 7% $216,815 9%
Other expense increased $47.9 million, or 8%, for the three months ended February 28, 2007 as compared toFebruary 28, 2006, primarily related to higher marketing and business development and professional fees.
Other expense increased $186.9 million, or 7%, for the year ended November 30, 2006 as compared to theyear ended November 30, 2005, primarily related to higher employee compensation and benefits and professionalfees. Other expense increased $216.8 million, or 9%, for the year ended November 30, 2005, as compared to theyear ended November 30, 2004, primarily related to higher employee compensation and benefits and otherexpense.
Employee Compensation and Benefits
Employee compensation and benefits decreased $4.5 million or 2% for the three months ended February 28,2007 as compared to February 28, 2006. Employee compensation and benefits increased $63.6 million, or 7%,for the year ended November 30, 2006 as compared to the year ended November 30, 2005, primarily related toadditional employees acquired with the Goldfish business, increased employee salary levels and benefit costs andincremental compensation related to equity awards granted to our retirement-eligible employees. Employeecompensation and benefits increased $110.7 million, or 15%, for the year ended November 30, 2005 as comparedto the year ended November 30, 2004, primarily related to higher salaries for employees and benefit costs andadditional employees as a result of the PULSE acquisition and an increase in overhead allocations from MorganStanley. The increase in overhead allocations from Morgan Stanley reflects our share of costs associated withMorgan Stanley senior management changes.
Marketing and Business Development
Marketing and business development increased $23.7 million, or 20%, for the three months endedFebruary 28, 2007 as compared to February 28, 2006 due to higher account acquisition expenses. Marketing andbusiness development increased $16.8 million, or 3%, for the year ended November 30, 2006 as compared to theyear ended November 30, 2005, due to increased acquisition expenses related to the launch of the DiscoverBusiness Card and other new products and management’s continued focus on receivables growth. Marketing andbusiness development increased $11.8 million, or 2%, for the year ended November 30, 2005 as compared to theyear ended November 30, 2004, related to costs associated with building our third-party issuer business andnetwork acceptance partially offset by lower acquisition expenses. We expect marketing and businessdevelopment expense to continue to increase as we introduce new products and seek to grow our number ofactive accounts and increase card usage.
83
Information Processing and Communications
Information processing and communications increased $3.0 million, or 3%, for the three months endedFebruary 28, 2007 as compared to February 28, 2006 due primarily to additional processing costs as a result ofthe Goldfish acquisition. Information processing and communications increased $34.5 million, or 10%, for theyear ended November 30, 2006 as compared to the year ended November 30, 2005, primarily related toadditional processing costs as a result of the Goldfish acquisition and increased transaction volume on thePULSE Network. Information processing and communications increased $10.9 million, or 3%, for the year endedNovember 30, 2005 as compared to the year ended November 30, 2004, primarily related to additionalprocessing costs as a result of the PULSE acquisition partially offset by lower data equipment costs.
Professional Fees
Professional fees increased $16.1 million, or 25%, for the three months ended February 28, 2007 ascompared to February 28, 2006, primarily related to increased legal fees and consulting costs. The increase inlegal fees was primarily driven by costs associated with our lawsuit against Visa and MasterCard. Consultingcosts increased due to investments in the Discover Business Card and various other business initiatives.Professional fees increased $74.8 million, or 26%, for the year ended November 30, 2006 as compared to theyear ended November 30, 2005, primarily related to increased legal fees and consulting costs. The increase inlegal fees was primarily driven by costs associated with our lawsuit against Visa and MasterCard. Consultingcosts increased due to investments in the Discover Business Card and various other business initiatives.Professional fees increased $31.1 million, or 12%, for the year ended November 30, 2005 as compared to theyear ended November 30, 2004, related to incremental costs as a result of the PULSE acquisition, as well asincreased legal fees and higher consulting costs due to investments in various business initiatives and higheroverhead allocations from Morgan Stanley.
Premises and Equipment
Premises and equipment decreased $0.7 million, or 3%, for the three months ended February 28, 2007 ascompared to February 28, 2006. Premises and equipment increased $1.2 million, or 1%, at November 30, 2006 ascompared to November 30, 2005, and $7.5 million, or 9%, at November 30, 2005 as compared to November 30,2004. See Note 9: Premises and Equipment to the audited combined financial statements for further informationrelated to premises and equipment.
Other
Other expense increased $10.3 million, or 14%, for the three months ended February 28, 2007 as comparedto February 28, 2006, primarily related to higher fraud expense. Other expense decreased $4.0 million, or 1%, forthe year ended November 30, 2006 as compared to the year ended November 30, 2005, primarily related to lowerfraud expense and legal accruals partially offset by higher franchise taxes, amortization of intangibles and costassociated with new account acquisitions. Other expense increased $44.8 million, or 15%, for the year endedNovember 30, 2005 as compared to the year ended November 30, 2004, primarily related to higher fraudexpenses, taxes, legal accruals and cost associated with new account acquisitions.
Income Tax Expense
Income tax expense decreased $41.6 million, or 23%, for the three months ended February 28, 2007 ascompared to February 28, 2006, reflecting lower pretax income. Income tax expense increased $159.3 million, or46%, for the year ended November 30, 2006 as compared to the year ended November 30, 2005, reflecting anincrease in pretax income partially offset by a lower effective tax rate. The effective tax rate decreased to 32.0%for the year ended November 30, 2006 from 37.5% for the year ended November 30, 2005, primarily related tothe favorable resolution of tax examination issues addressed during the course of a federal tax audit for the years1997 through 1998 as well as the favorable settlement of state tax matters. Income tax expense decreased $96.3million, or 22%, for the year ended November 30, 3005 as compared to the year ended November 30, 2004,
84
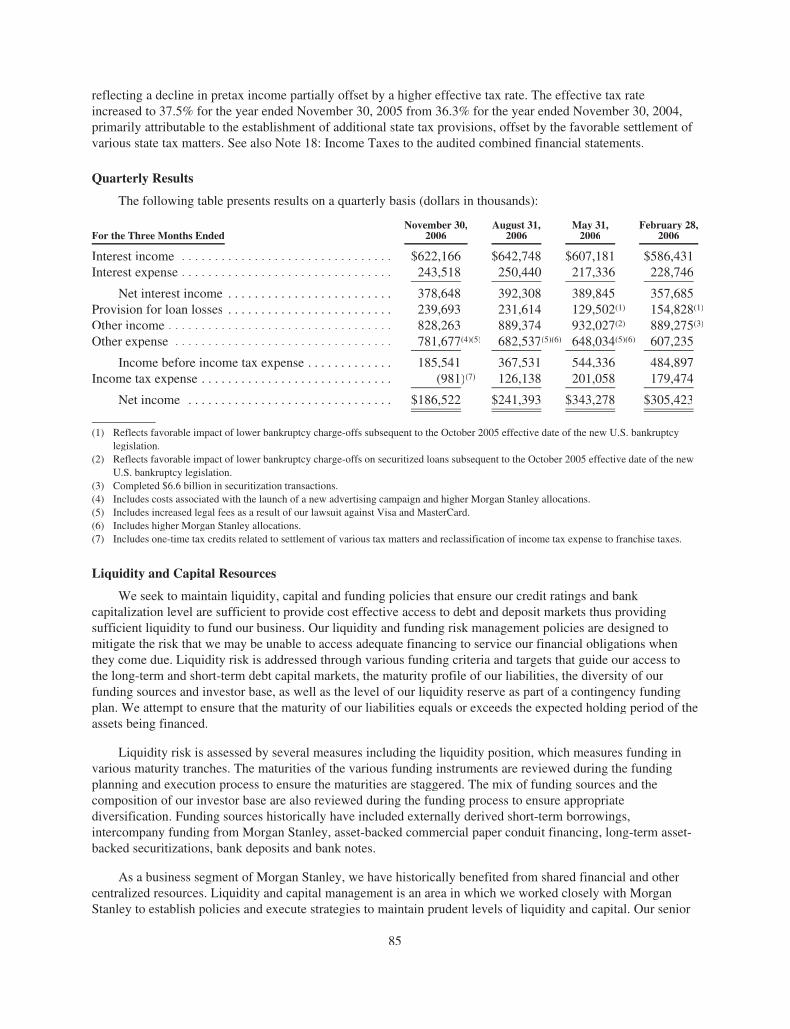
reflecting a decline in pretax income partially offset by a higher effective tax rate. The effective tax rateincreased to 37.5% for the year ended November 30, 2005 from 36.3% for the year ended November 30, 2004,primarily attributable to the establishment of additional state tax provisions, offset by the favorable settlement ofvarious state tax matters. See also Note 18: Income Taxes to the audited combined financial statements.
Quarterly Results
The following table presents results on a quarterly basis (dollars in thousands):
For the Three Months EndedNovember 30,
2006August 31,
2006May 31,2006
February 28,2006
Interest income . . . . . . . . . . . . . . . . . . . . . . . . . . . . . . . . $622,166 $642,748 $607,181 $586,431Interest expense . . . . . . . . . . . . . . . . . . . . . . . . . . . . . . . . 243,518 250,440 217,336 228,746
Net interest income . . . . . . . . . . . . . . . . . . . . . . . . . 378,648 392,308 389,845 357,685Provision for loan losses . . . . . . . . . . . . . . . . . . . . . . . . . 239,693 231,614 129,502(1) 154,828(1)
Other income . . . . . . . . . . . . . . . . . . . . . . . . . . . . . . . . . . 828,263 889,374 932,027(2) 889,275(3)
Other expense . . . . . . . . . . . . . . . . . . . . . . . . . . . . . . . . . 781,677(4)(5) 682,537(5)(6) 648,034(5)(6) 607,235
Income before income tax expense . . . . . . . . . . . . . 185,541 367,531 544,336 484,897Income tax expense . . . . . . . . . . . . . . . . . . . . . . . . . . . . . (981)(7) 126,138 201,058 179,474
Net income . . . . . . . . . . . . . . . . . . . . . . . . . . . . . . . $186,522 $241,393 $343,278 $305,423
(1) Reflects favorable impact of lower bankruptcy charge-offs subsequent to the October 2005 effective date of the new U.S. bankruptcylegislation.
(2) Reflects favorable impact of lower bankruptcy charge-offs on securitized loans subsequent to the October 2005 effective date of the newU.S. bankruptcy legislation.
(3) Completed $6.6 billion in securitization transactions.(4) Includes costs associated with the launch of a new advertising campaign and higher Morgan Stanley allocations.(5) Includes increased legal fees as a result of our lawsuit against Visa and MasterCard.(6) Includes higher Morgan Stanley allocations.(7) Includes one-time tax credits related to settlement of various tax matters and reclassification of income tax expense to franchise taxes.
Liquidity and Capital Resources
We seek to maintain liquidity, capital and funding policies that ensure our credit ratings and bankcapitalization level are sufficient to provide cost effective access to debt and deposit markets thus providingsufficient liquidity to fund our business. Our liquidity and funding risk management policies are designed tomitigate the risk that we may be unable to access adequate financing to service our financial obligations whenthey come due. Liquidity risk is addressed through various funding criteria and targets that guide our access tothe long-term and short-term debt capital markets, the maturity profile of our liabilities, the diversity of ourfunding sources and investor base, as well as the level of our liquidity reserve as part of a contingency fundingplan. We attempt to ensure that the maturity of our liabilities equals or exceeds the expected holding period of theassets being financed.
Liquidity risk is assessed by several measures including the liquidity position, which measures funding invarious maturity tranches. The maturities of the various funding instruments are reviewed during the fundingplanning and execution process to ensure the maturities are staggered. The mix of funding sources and thecomposition of our investor base are also reviewed during the funding process to ensure appropriatediversification. Funding sources historically have included externally derived short-term borrowings,intercompany funding from Morgan Stanley, asset-backed commercial paper conduit financing, long-term asset-backed securitizations, bank deposits and bank notes.
As a business segment of Morgan Stanley, we have historically benefited from shared financial and othercentralized resources. Liquidity and capital management is an area in which we worked closely with MorganStanley to establish policies and execute strategies to maintain prudent levels of liquidity and capital. Our senior
85

management reviews financial performance relative to these policies, monitors the availability of alternativefinancing sources, evaluates liquidity risk and capital adequacy, and assesses the interest rate sensitivity of ourassets and liabilities.
Morgan Stanley historically has provided various sources of funding to us on both a short-term and long-term basis to meet various financing needs. This funding has been used to finance receivables in both our U.S.and U.K. card businesses, the cash collateral account in connection with our domestic asset-backed securitizationprogram and fixed assets, which include office facilities and equipment. The following table summarizes fundingsourced through Morgan Stanley (dollars in thousands):
AtFebruary 28,
2007
At November 30,
2006 2005 2004
Morgan Stanley Global Wealth Management BankDeposit Program . . . . . . . . . . . . . . . . . . . . . . . . . . . . . . . $2,615,307 $1,928,443 $ — $ —
Federal Funds purchased from Morgan Stanley Bank . . . . — 3,000,000 — —Short-term borrowings . . . . . . . . . . . . . . . . . . . . . . . . . . . . 2,632,147 3,639,678 3,773,060 2,728,358Long-term borrowings . . . . . . . . . . . . . . . . . . . . . . . . . . . . . 1,250,804 1,251,662 606,796 945,779
Total . . . . . . . . . . . . . . . . . . . . . . . . . . . . . . . . . . . . . . $6,498,258 $9,819,783 $4,379,856 $3,674,137
During the three months ended February 28, 2007, total intercompany balances declined by $3.3 billion andwere replaced mainly through interest bearing deposit sources. At February 28, 2007, there were no outstandingFederal Funds purchased from Morgan Stanley Bank and short-term borrowings with Morgan Stanley werereduced significantly. Deposits obtained through the Morgan Stanley Global Wealth Management Bank DepositProgram increased during the three months ended February 28, 2007; however, we expect to discontinue ourparticipation in this program, decreasing our deposits sourced from this program to $0 prior to the distribution.Funding sourced through the Morgan Stanley Global Wealth Management Bank Deposit Program and theFederal Funds purchased from Morgan Stanley Bank began in March 2006 and June 2006, respectively. Short-term and long-term funding from Morgan Stanley have been borrowed as needed over time.
In light of the distribution, we are developing our own infrastructure to manage and execute our liquidityand capital management functions as an independent company. Our efforts include a review of our liquidity andfunding risk management policies to ensure that they continue to support the successful execution of our businessstrategies while maintaining sufficient liquidity through the business cycle and during periods of financial stress.Prior to the distribution we intend to execute certain agreements providing for ongoing Morgan Stanley supportin certain functions. See “Arrangements Between Us and Morgan Stanley.”
As a business segment of Morgan Stanley, our Contingency Funding Plan (“CFP”) model incorporated a widerange of potential cash outflows during a liquidity stress event, including, but not limited to: (i) repayment of alldebt maturing within one year; (ii) expected funding requirements from receivable growth and/or volatility; and(iii) client cash withdrawals from interest bearing deposits. During a stress event, we can reduce our fundingrequirements through adjustments in the level of new loan originations. Given our historical access to MorganStanley intercompany funding, our CFP was driven by Morgan Stanley stress events and assumed that we would beable to access deposits and the asset-backed market for a significant portion of our funding requirements. OnFebruary 28, 2007, in addition to access to the Morgan Stanley parent liquidity reserve and our own liquidityreserve of $2.2 billion at Discover Bank, we had a total of $1.3 billion of unutilized commitments from third-partycommercial paper asset-backed conduits for securitization funding to meet any unexpected funding requirements.As of March 31, 2007, our liquidity reserve was $5.2 billion.
As part of our CFP, and to meet volatility in daily cash requirements, we managed our liquidity reserve inconjunction with access to Morgan Stanley intercompany funding to a size prudent for anticipated credit card loanreceivables fluctuations and conditions in the markets for asset-backed securitization, unsecured debt and deposits.
86

Prior to the distribution, we intend to replace all Morgan Stanley sourced funding with certificates of deposit,unsecured long-term debt, external deposits from broker-dealers and asset-backed financing. Furthermore, our CFPhas been revised to eliminate reliance on Morgan Stanley sourced funding while limiting our access to the asset-backed and certificate of deposit markets. See “—Changes Related to the Distribution” below.
Our unaudited condensed combined statement of financial condition at February 28, 2007 consistedprimarily of credit card loan receivables, of which 87% were originated in the United States and 13% in theUnited Kingdom. The combined statements of financial condition assets fluctuate from time to time due to trendsin credit card spending and payments, as well as the issuance of new securitization transactions and maturities ofexisting securitization transactions. Our credit card loan receivables provide us with flexibility in financing andmanaging our business, as the market for financing credit card loan receivables is large and active.
Equity Capital Management. Our senior management views equity capital as an important source offinancial strength. We determine the level of capital necessary to support our business based on our managedcredit card loan receivables, goodwill and other intangible assets, taking into account, among other things,regulatory requirements, rating agency guidelines and internally managed requirements to sustain growth. As ofFebruary 28, 2007, management determined that approximately $5.4 billion of capital was appropriate to supportour business. Accordingly, the Unaudited Pro Forma Condensed Combined Statement of Financial Conditionreflects a $100 million dividend to adjust the capital account set forth in our February 28, 2007 statement offinancial condition. Using the same methodology, a $500 million dividend was paid in each of November 2006and February 2007 to further adjust our capital to its appropriate level. In anticipation of our possible spin-off in2005, no dividend was paid in that year.
Under regulatory capital requirements adopted by the FDIC and other bank regulatory agencies, FDIC-insured financial institutions must maintain minimum levels of capital that are dependent upon the risk of thefinancial institutions assets, specifically (a) 3% to 5% of Tier 1 capital, as defined, to average assets (“leverageratio”), (b) 4% to 6% of Tier 1 capital, as defined, to risk-weighted assets (“Tier 1 risk-weighted capital ratio”)and (c) 8% to 10% of total capital, as defined, to risk-weighted assets (“total risk-weighted capital ratio”). AtFebruary 28, 2007, the leverage ratio, Tier 1 risk-weighted capital ratio and total risk-weighted capital ratio ofDiscover Bank as well as our other FDIC-insured financial institution, Bank of New Castle, exceeded theseregulatory minimums.
Short-Term Borrowings. We have financed our short-term funding requirements primarily throughintercompany arrangements with Morgan Stanley, including short-term intercompany loans. In addition, we haveaccess to the Federal Funds market through third parties for both overnight borrowings and term borrowings thatmature in more than one business day. See Note 13: Short-Term Borrowings to the audited combined financialstatements and Note 4: Short-Term Borrowings to the unaudited condensed combined financial statements.
87
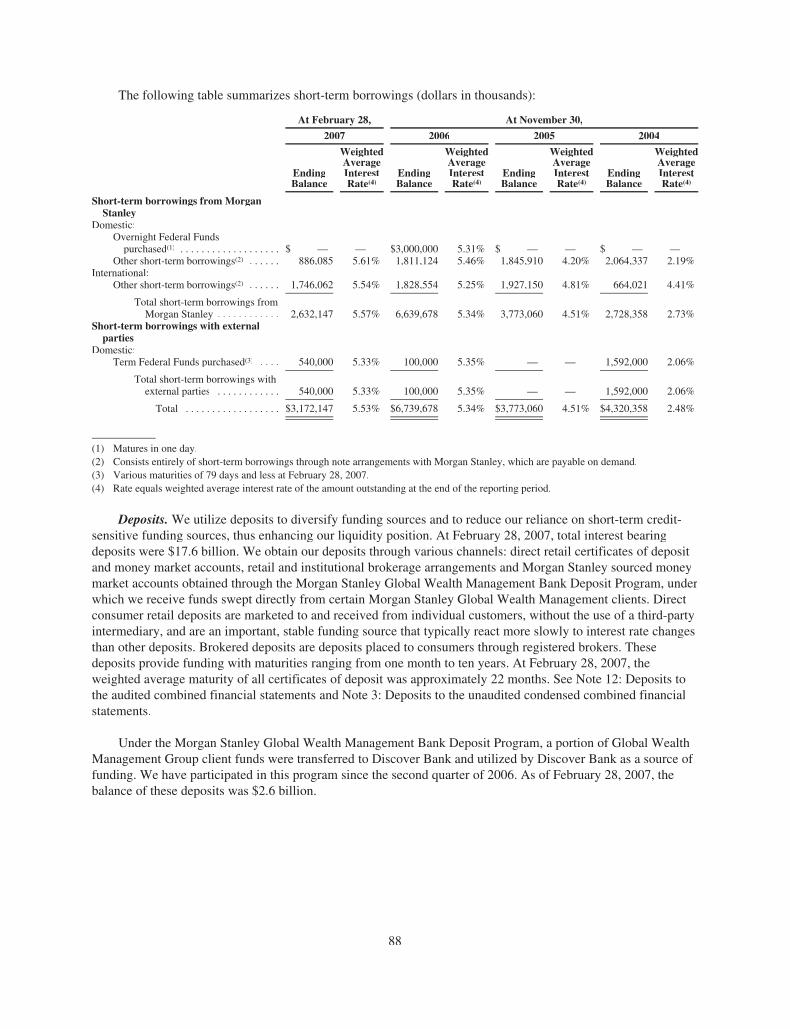
The following table summarizes short-term borrowings (dollars in thousands):
At February 28, At November 30,
2007 2006 2005 2004
EndingBalance
WeightedAverageInterestRate(4)
EndingBalance
WeightedAverageInterestRate(4)
EndingBalance
WeightedAverageInterestRate(4)
EndingBalance
WeightedAverageInterestRate(4)
Short-term borrowings from MorganStanley
Domestic:Overnight Federal Funds
purchased(1) . . . . . . . . . . . . . . . . . . . $ — — $3,000,000 5.31% $ — — $ — —Other short-term borrowings(2) . . . . . . 886,085 5.61% 1,811,124 5.46% 1,845,910 4.20% 2,064,337 2.19%
International:Other short-term borrowings(2) . . . . . . 1,746,062 5.54% 1,828,554 5.25% 1,927,150 4.81% 664,021 4.41%
Total short-term borrowings fromMorgan Stanley . . . . . . . . . . . . 2,632,147 5.57% 6,639,678 5.34% 3,773,060 4.51% 2,728,358 2.73%
Short-term borrowings with externalparties
Domestic:Term Federal Funds purchased(3) . . . . 540,000 5.33% 100,000 5.35% — — 1,592,000 2.06%
Total short-term borrowings withexternal parties . . . . . . . . . . . . 540,000 5.33% 100,000 5.35% — — 1,592,000 2.06%
Total . . . . . . . . . . . . . . . . . . $3,172,147 5.53% $6,739,678 5.34% $3,773,060 4.51% $4,320,358 2.48%
(1) Matures in one day.(2) Consists entirely of short-term borrowings through note arrangements with Morgan Stanley, which are payable on demand.(3) Various maturities of 79 days and less at February 28, 2007.(4) Rate equals weighted average interest rate of the amount outstanding at the end of the reporting period.
Deposits. We utilize deposits to diversify funding sources and to reduce our reliance on short-term credit-sensitive funding sources, thus enhancing our liquidity position. At February 28, 2007, total interest bearingdeposits were $17.6 billion. We obtain our deposits through various channels: direct retail certificates of depositand money market accounts, retail and institutional brokerage arrangements and Morgan Stanley sourced moneymarket accounts obtained through the Morgan Stanley Global Wealth Management Bank Deposit Program, underwhich we receive funds swept directly from certain Morgan Stanley Global Wealth Management clients. Directconsumer retail deposits are marketed to and received from individual customers, without the use of a third-partyintermediary, and are an important, stable funding source that typically react more slowly to interest rate changesthan other deposits. Brokered deposits are deposits placed to consumers through registered brokers. Thesedeposits provide funding with maturities ranging from one month to ten years. At February 28, 2007, theweighted average maturity of all certificates of deposit was approximately 22 months. See Note 12: Deposits tothe audited combined financial statements and Note 3: Deposits to the unaudited condensed combined financialstatements.
Under the Morgan Stanley Global Wealth Management Bank Deposit Program, a portion of Global WealthManagement Group client funds were transferred to Discover Bank and utilized by Discover Bank as a source offunding. We have participated in this program since the second quarter of 2006. As of February 28, 2007, thebalance of these deposits was $2.6 billion.
88
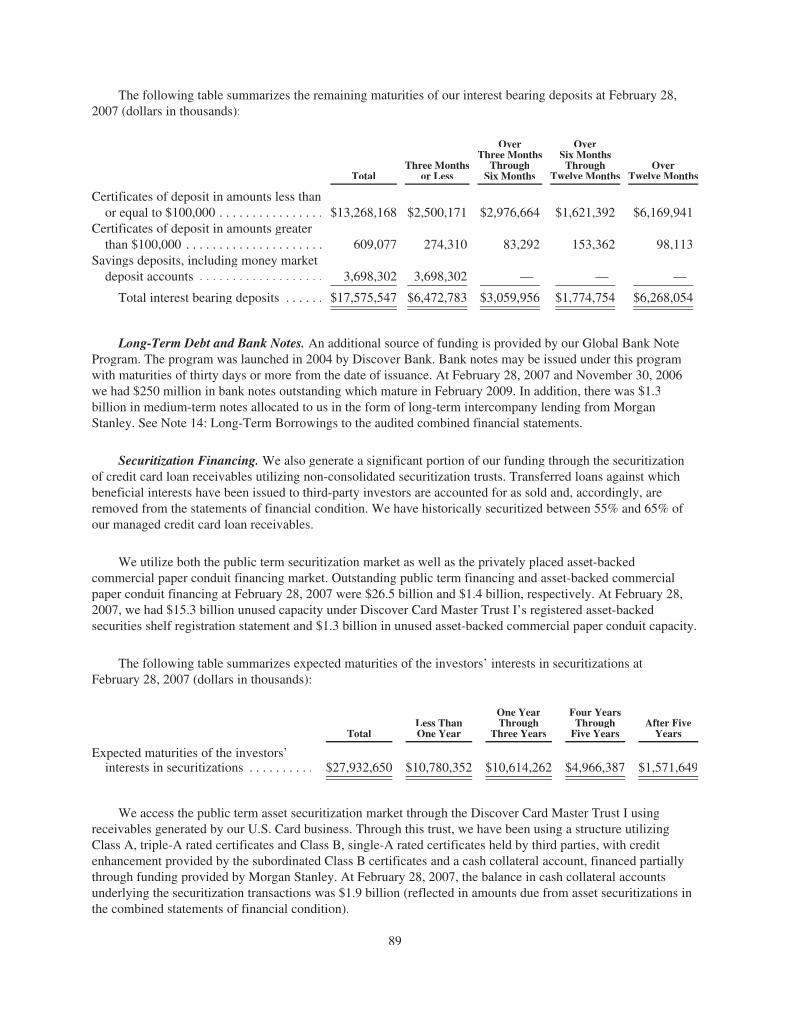
The following table summarizes the remaining maturities of our interest bearing deposits at February 28,2007 (dollars in thousands):
TotalThree Months
or Less
OverThree Months
ThroughSix Months
OverSix MonthsThrough
Twelve MonthsOver
Twelve Months
Certificates of deposit in amounts less thanor equal to $100,000 . . . . . . . . . . . . . . . . $13,268,168 $2,500,171 $2,976,664 $1,621,392 $6,169,941
Certificates of deposit in amounts greaterthan $100,000 . . . . . . . . . . . . . . . . . . . . . 609,077 274,310 83,292 153,362 98,113
Savings deposits, including money marketdeposit accounts . . . . . . . . . . . . . . . . . . . 3,698,302 3,698,302 — — —
Total interest bearing deposits . . . . . . $17,575,547 $6,472,783 $3,059,956 $1,774,754 $6,268,054
Long-Term Debt and Bank Notes. An additional source of funding is provided by our Global Bank NoteProgram. The program was launched in 2004 by Discover Bank. Bank notes may be issued under this programwith maturities of thirty days or more from the date of issuance. At February 28, 2007 and November 30, 2006we had $250 million in bank notes outstanding which mature in February 2009. In addition, there was $1.3billion in medium-term notes allocated to us in the form of long-term intercompany lending from MorganStanley. See Note 14: Long-Term Borrowings to the audited combined financial statements.
Securitization Financing. We also generate a significant portion of our funding through the securitizationof credit card loan receivables utilizing non-consolidated securitization trusts. Transferred loans against whichbeneficial interests have been issued to third-party investors are accounted for as sold and, accordingly, areremoved from the statements of financial condition. We have historically securitized between 55% and 65% ofour managed credit card loan receivables.
We utilize both the public term securitization market as well as the privately placed asset-backedcommercial paper conduit financing market. Outstanding public term financing and asset-backed commercialpaper conduit financing at February 28, 2007 were $26.5 billion and $1.4 billion, respectively. At February 28,2007, we had $15.3 billion unused capacity under Discover Card Master Trust I’s registered asset-backedsecurities shelf registration statement and $1.3 billion in unused asset-backed commercial paper conduit capacity.
The following table summarizes expected maturities of the investors’ interests in securitizations atFebruary 28, 2007 (dollars in thousands):
TotalLess ThanOne Year
One YearThrough
Three Years
Four YearsThroughFive Years
After FiveYears
Expected maturities of the investors’interests in securitizations . . . . . . . . . . $27,932,650 $10,780,352 $10,614,262 $4,966,387 $1,571,649
We access the public term asset securitization market through the Discover Card Master Trust I usingreceivables generated by our U.S. Card business. Through this trust, we have been using a structure utilizingClass A, triple-A rated certificates and Class B, single-A rated certificates held by third parties, with creditenhancement provided by the subordinated Class B certificates and a cash collateral account, financed partiallythrough funding provided by Morgan Stanley. At February 28, 2007, the balance in cash collateral accountsunderlying the securitization transactions was $1.9 billion (reflected in amounts due from asset securitizations inthe combined statements of financial condition).
89

The following table summarizes estimated maturities of the cash collateral accounts at February 28, 2007(dollars in thousands):
TotalLess ThanOne Year
One YearThrough
Three Years
Four YearsThroughFive Years
AfterFive Years
Estimated maturities of cash collateral accounts . . . $1,943,044 $625,962 $810,281 $414,453 $92,348
In our U.K. business, we access the public term asset-backed securitization market through theCumbernauld Funding plc master trust. Through this trust, we have traditionally been using a structure utilizingClass A, triple-A rated certificates, with credit enhancement provided by subordination through theovercollateralization of receivables.
The securitization structures include certain features designed to protect investors that could result in earlier-than-expected amortization of the transactions, accelerating the need for alternative funding. The primary featurerelates to the availability and adequacy of cash flows in the securitized pool of receivables to meet contractualrequirements (“economic early amortization”). In the event of an economic early amortization (which wouldoccur if the excess spread falls below 0% for a contractually specified period, generally a three-month average),the receivables that otherwise would have been subsequently purchased by the trust from us would insteadcontinue to be recognized on our combined statements of financial condition since the cash flows generated inthe trust would instead be used to repay investors in the asset-backed securities. As of February 28, 2007, noeconomic early amortization events have occurred. The table below provides information concerning investorinterest and related excess spreads at February 28, 2007 (dollars in thousands).
InvestorInterest
# of SeriesOutstanding
3-MonthRollingAverageExcessSpread
Interchange series(1) . . . . . . . . . . . . . . . . . . . . . . . . . . . . . . . . . $15,451,060 18 7.88%Non-interchange series . . . . . . . . . . . . . . . . . . . . . . . . . . . . . . . 10,812,615 12 4.57%
Discover Card Master Trust I . . . . . . . . . . . . . . . . . . . . . . . . . . 26,263,675 30 4.57%Cumbernauld Funding plc . . . . . . . . . . . . . . . . . . . . . . . . . . . . 1,668,975 2 3.14%
Total Company . . . . . . . . . . . . . . . . . . . . . . . . . . . . . . . . . $27,932,650 32
(1) Discover Card Master Trust I certificates issued subsequent to and including series 2004-1 include cash flows derived from discount andinterchange revenue earned by Discover Bank.
Secured Committed Credit Facilities. The maintenance of revolving committed credit agreements serves tofurther diversify our funding sources. In connection with our asset securitization program, we have access tocommitted undrawn funding capacity through third-party bank-sponsored securitization conduits to supportcredit card loan receivables funding requirements. At February 28, 2007, these conduits totaled $2.7 billion, ofwhich $1.27 billion was unused. At April 16, 2007, these conduits totaled $5.1 billion, of which approximately$2.4 billion was unused. These facilities are 364-day agreements and are reviewed for renewal annually.
90
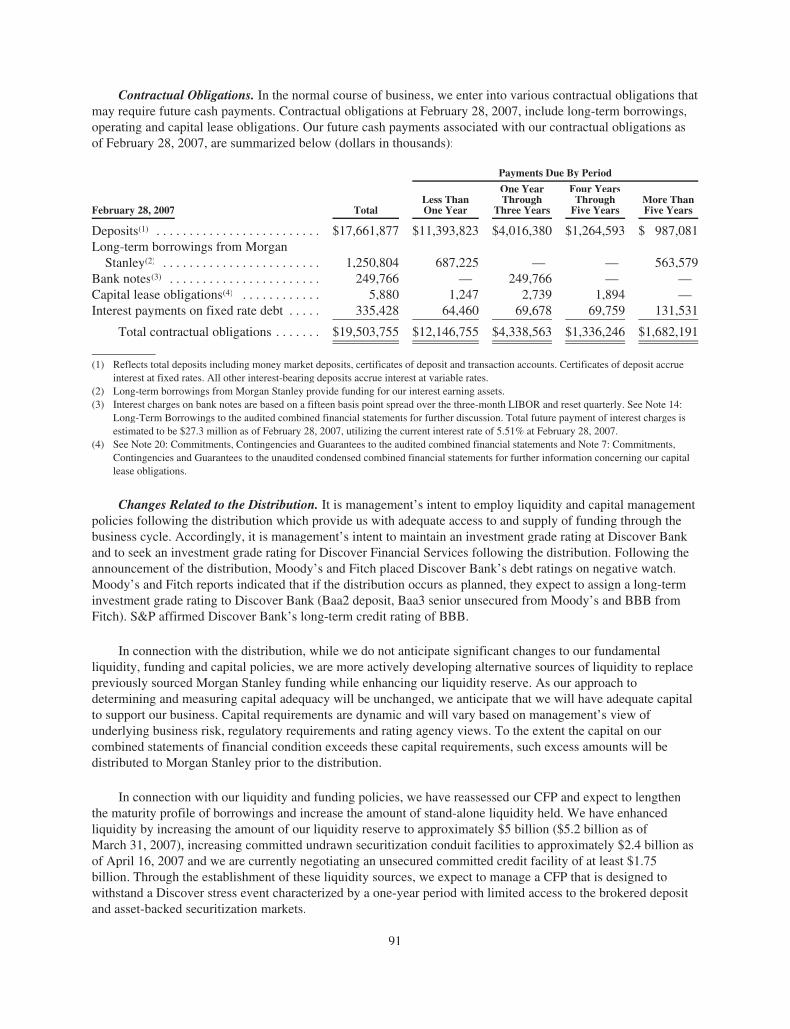
Contractual Obligations. In the normal course of business, we enter into various contractual obligations thatmay require future cash payments. Contractual obligations at February 28, 2007, include long-term borrowings,operating and capital lease obligations. Our future cash payments associated with our contractual obligations asof February 28, 2007, are summarized below (dollars in thousands):
Payments Due By Period
February 28, 2007 TotalLess ThanOne Year
One YearThrough
Three Years
Four YearsThroughFive Years
More ThanFive Years
Deposits(1) . . . . . . . . . . . . . . . . . . . . . . . . . $17,661,877 $11,393,823 $4,016,380 $1,264,593 $ 987,081Long-term borrowings from Morgan
Stanley(2) . . . . . . . . . . . . . . . . . . . . . . . . 1,250,804 687,225 — — 563,579Bank notes(3) . . . . . . . . . . . . . . . . . . . . . . . 249,766 — 249,766 — —Capital lease obligations(4) . . . . . . . . . . . . 5,880 1,247 2,739 1,894 —Interest payments on fixed rate debt . . . . . 335,428 64,460 69,678 69,759 131,531
Total contractual obligations . . . . . . . $19,503,755 $12,146,755 $4,338,563 $1,336,246 $1,682,191
(1) Reflects total deposits including money market deposits, certificates of deposit and transaction accounts. Certificates of deposit accrueinterest at fixed rates. All other interest-bearing deposits accrue interest at variable rates.
(2) Long-term borrowings from Morgan Stanley provide funding for our interest earning assets.(3) Interest charges on bank notes are based on a fifteen basis point spread over the three-month LIBOR and reset quarterly. See Note 14:
Long-Term Borrowings to the audited combined financial statements for further discussion. Total future payment of interest charges isestimated to be $27.3 million as of February 28, 2007, utilizing the current interest rate of 5.51% at February 28, 2007.
(4) See Note 20: Commitments, Contingencies and Guarantees to the audited combined financial statements and Note 7: Commitments,Contingencies and Guarantees to the unaudited condensed combined financial statements for further information concerning our capitallease obligations.
Changes Related to the Distribution. It is management’s intent to employ liquidity and capital managementpolicies following the distribution which provide us with adequate access to and supply of funding through thebusiness cycle. Accordingly, it is management’s intent to maintain an investment grade rating at Discover Bankand to seek an investment grade rating for Discover Financial Services following the distribution. Following theannouncement of the distribution, Moody’s and Fitch placed Discover Bank’s debt ratings on negative watch.Moody’s and Fitch reports indicated that if the distribution occurs as planned, they expect to assign a long-terminvestment grade rating to Discover Bank (Baa2 deposit, Baa3 senior unsecured from Moody’s and BBB fromFitch). S&P affirmed Discover Bank’s long-term credit rating of BBB.
In connection with the distribution, while we do not anticipate significant changes to our fundamentalliquidity, funding and capital policies, we are more actively developing alternative sources of liquidity to replacepreviously sourced Morgan Stanley funding while enhancing our liquidity reserve. As our approach todetermining and measuring capital adequacy will be unchanged, we anticipate that we will have adequate capitalto support our business. Capital requirements are dynamic and will vary based on management’s view ofunderlying business risk, regulatory requirements and rating agency views. To the extent the capital on ourcombined statements of financial condition exceeds these capital requirements, such excess amounts will bedistributed to Morgan Stanley prior to the distribution.
In connection with our liquidity and funding policies, we have reassessed our CFP and expect to lengthenthe maturity profile of borrowings and increase the amount of stand-alone liquidity held. We have enhancedliquidity by increasing the amount of our liquidity reserve to approximately $5 billion ($5.2 billion as ofMarch 31, 2007), increasing committed undrawn securitization conduit facilities to approximately $2.4 billion asof April 16, 2007 and we are currently negotiating an unsecured committed credit facility of at least $1.75billion. Through the establishment of these liquidity sources, we expect to manage a CFP that is designed towithstand a Discover stress event characterized by a one-year period with limited access to the brokered depositand asset-backed securitization markets.
91
We expect to replace funding provided through Morgan Stanley intercompany arrangements with alternativesources at market rates available to us, including certificates of deposit, external deposits from broker-dealers,asset-backed financing and unsecured long-term debt. The replacement of these existing funding sources willhave an impact on the cost of funds of our liability portfolio due to funding mix changes and differences in creditratings and maturities. See “Unaudited Pro Forma Condensed Combined Financial Statements.”
Historically, certificates of deposit sourced through brokerage arrangements were distributed throughMorgan Stanley’s syndicate desk. In anticipation of the distribution, we have expanded the distribution of thesedeposits to include other broker-dealers.
We expect to replace short-term intercompany financing sourced through Morgan Stanley, and during thethree months ended February 28, 2007, we replaced all Federal Funds purchased from Morgan Stanley Bank andother short-term intercompany lending related to our U.S. card receivables. We are currently structuring externalsecured financing agreements to replace short-term intercompany lending related to our U.K. card business.Funding sourced through the Morgan Stanley Global Wealth Management Bank Deposit Program is expected tobe replaced through the issuance of deposits and the use of alternative external broker-dealer client fundsdeposited into Discover Bank. All long-term intercompany lending is expected to be replaced with alternativefunding sources of similar durations. We also expect to incur approximately $600 million to $750 million ofunsecured senior debt prior to the distribution.
Within our Discover Card Master Trust I, we will move towards a structure that also utilizes subordinatedClass C, triple-B rated securities which will be held by third parties. This structure will eliminate the need toestablish cash collateral accounts for new securitizations and will provide greater flexibility by allowing seniorand subordinated classes of securities to be issued at different times. We are currently structuring externalsecured financing agreements to replace short-term intercompany lending related to the cash collateral accounts.
We are currently negotiating a multi-year unsecured committed credit facility of at least $1.75 billion thatwill serve to diversify our funding sources and enhance our liquidity. This facility is expected to be provided by agroup of major global banks, and to be available to both Discover Financial Services and our Discover Banksubsidiary. Our borrowings (as opposed to those of Discover Bank) under the credit facility cannot exceed 30%of the total facility. It is expected that the credit facility will include various financial and other restrictivecovenants. Financial covenants in the new credit facility are expected to include, among others, a requirementthat Discover Bank and any other regulated bank subsidiary remain well capitalized, a limit on the ratio of ourintangible assets plus our investment in subsidiaries to our net worth, a limit on the ratio of delinquent loans toour total managed loans, maintenance by Discover Bank of a 4% ratio of Tier 1 capital to managed loans, and ourmaintenance of a minimum tangible net worth. Negative covenants in the new credit facility are expected toinclude limitations on indebtedness of subsidiaries; liens; fundamental changes such as mergers, consolidationsand sales of assets or changes in line of business; investments, loans, advances, guarantees and acquisitions;swap agreements; transactions with affiliates; and certain other restrictive agreements. Events of default in thenew credit facility are expected to include, among other things, nonpayment of principal when due; nonpaymentof interest, fees or other amounts; material inaccuracy of representations and warranties; violation of covenants;default under other indebtedness; bankruptcy events; and a change in control. We anticipate that the facility willsupport general liquidity needs and may be drawn to meet short-term funding needs from time to time. Thesyndication of the facility is expected to be complete by the time of distribution. In addition, we have furtherenhanced our liquidity position by increasing our committed unused asset-backed commercial papersecuritization lines of credit to approximately $2.4 billion.
Off-Balance Sheet Arrangements
See “—Liquidity and Capital Resources—Securitization Financing.”
92
Quantitative and Qualitative Disclosures about Market Risk
Market risk refers to the risk that a change in the level of one or more market prices, rates, indices,correlations or other market factors will result in losses for a position or portfolio. We are exposed to market riskprimarily from changes in interest rates and currency exchange rates.
Interest Rate Risk. We are exposed to market risk primarily from changes in interest rates. Such changes ininterest rates impact interest earning assets, principally credit card loan receivables and other assets and netexcess servicing fees received in connection with the transferred loan receivables against which beneficialinterests have been issued through asset securitizations, as well as interest sensitive liabilities that finance theseassets, including asset-backed securitizations, long-term borrowings, and deposits.
Our interest rate risk management policies are designed to reduce the potential volatility of earnings thatmay arise from changes in interest rates by having a financing portfolio that reflects the existing repricingschedules of credit card loan receivables as well as our right, with notice to cardmembers, to reprice certain fixedor variable rate credit card loan receivables to a new interest rate in the future. To the extent that asset and relatedfinancing repricing characteristics of a particular portfolio are not matched effectively, we may utilize interestrate derivative contracts, such as swap agreements, to achieve our objectives. Interest rate swap agreementseffectively convert the underlying asset or financing from fixed to variable repricing or from variable to fixedrepricing.
Sensitivity Analysis Methodology, Assumptions and Limitations. We use an interest rate sensitivitysimulation to assess its interest rate risk exposure. For purposes of presenting the possible earnings effect of ahypothetical, adverse change in interest rates over the 12-month period from our reporting date, we assume thatall interest rate sensitive assets and liabilities will be impacted by a hypothetical, immediate 100-basis-pointincrease in interest rates as of the beginning of the period.
Interest rate sensitive assets are assumed to be those for which the stated interest rate is not contractuallyfixed for the next 12-month period. Portions of our credit card loan receivables have fixed interest rates, althoughwe have the right, with notice to cardmembers, to subsequently reprice these receivables to a new interest rateunless the account has been closed or the cardmember opts out. Therefore, we consider the credit card loanreceivables with a fixed interest rate to be interest rate sensitive. We measured the earnings sensitivity for theseassets from the expected repricing date, which takes into consideration the required notice period. In addition,assets with rates that are fixed at year-end but which will mature, or otherwise contractually reset to a market-based indexed or other fixed rate prior to the end of the 12-month period, are rate sensitive. The latter categoryincludes certain credit card loans that may be offered at below-market rates for an introductory period, such asbalance transfers and special promotional programs, after which the loans will contractually reprice inaccordance with our normal market-based pricing structure. For purposes of measuring rate sensitivity for suchloans, only the effect of the hypothetical 100-basis-point change in the underlying market-based indexed or otherfixed rate has been considered rather than the full change in the rate to which the loan would contractuallyreprice. For assets that have a fixed interest rate at fiscal year-end but which contractually will, or are assumed to,reset to a market-based indexed or other fixed rate during the next 12 months, earnings sensitivity is measuredfrom the expected repricing date. In addition, for all interest rate sensitive assets, earnings sensitivity iscalculated net of expected loan losses.
Interest rate sensitive liabilities are assumed to be those for which the stated interest rate is not contractuallyfixed for the next 12-month period. Thus, liabilities that vary with changes in a market-based index, such asFederal Funds or LIBOR, which will reset before the end of the 12-month period, or liabilities whose rates arefixed at fiscal year-end but which will mature and are assumed to be replaced with a market-based indexed rateprior to the end of the 12-month period, are rate sensitive. For these fixed rate liabilities, earnings sensitivity ismeasured from the expected repricing date.
Assuming an immediate 100-basis-point increase in the interest rates affecting all interest rate sensitiveassets and liabilities as of February 28, 2007, we estimate that the pre-tax income of lending and related activities
93
over the following 12-month period would be reduced by approximately $124 million. We estimate thecomparable reduction of pre-tax income for the 12-month period following February 28, 2006 to beapproximately $51 million. The hypothetical decline in pre-tax income was greater than that of the prior year dueto a higher level of variable rate funding for the period ended February 28, 2007.
Assuming an immediate 100-basis-point increase in the interest rates affecting all interest rate sensitiveassets and liabilities as of November 30, 2006, we estimate that the pre-tax income of lending and relatedactivities over the following 12-month period would be reduced by approximately $125 million. We estimate thecomparable reduction of pre-tax income for the 12-month period following November 30, 2005 to beapproximately $36 million. The hypothetical decline in pre-tax income was greater than that of the prior year dueto a higher level of variable rate funding for the year ended November 30, 2006.
The model assumes that the balances of interest rate sensitive assets and liabilities at fiscal year-end willremain constant over the next 12-month period. It does not assume any growth, strategic change in businessfocus, change in asset pricing philosophy or change in asset/liability funding mix. Thus, this model represents astatic analysis that cannot adequately portray how we would respond to significant changes in market conditions.Furthermore, the analysis does not necessarily reflect our expectations regarding the movement of interest ratesin the near term, including the likelihood of an immediate 100-basis-point change in market interest rates, nornecessarily the actual effect on earnings if such rate changes were to occur. In addition, this analysis does notreflect any expected changes in funding attributed to the distribution.
Foreign Currency Exchange Risk. Changes in foreign exchange rates relative to the U.S. dollar mayimpact earnings and capital translated from international operations. Our U.K. business generates credit card loanreceivables denominated in pounds sterling. We monitor and manage our exposure to reflect the risk toleranceestablished by our senior management. As a business segment of Morgan Stanley, our exchange rate risk wasmanaged from a firm-wide perspective at the Morgan Stanley level. We expect to continue to monitor andcontrol foreign exchange exposure created as a result of our net investment in international operations and tomanage these risks within our risk management guidelines.
Guarantees
Guarantees are contracts or indemnification agreements that contingently require us to make payments to aguaranteed party based on changes in an underlying asset, liability, equity security of a guaranteed party, rate orindex. Our guarantees relate to certain representations and warranties made with regard to securitized loans,transactions processed through the Discover Network and cardmember-related services provided to U.K.cardmembers. At February 28, 2007 and November 30, 2006, we had not recorded any contingent liabilities inthe combined statements of financial condition related to these transactions. See Note 20: Commitments,Contingencies and Guarantees to the audited combined financial statements and Note 7: Commitments,Contingencies and Guarantees to the unaudited condensed combined financial statements for further discussionregarding our guarantees.
94
BUSINESS
Introduction
We are a leading credit card issuer and electronic payment services company with one of the mostrecognized brands in U.S. financial services. Since our inception in 1986, we have grown to become one of thelargest card issuers in the United States, with more than 50 million cardmembers (41.9 million accounts and18.4 million active accounts) and $46.3 billion in managed receivables as of February 28, 2007. We are also aleader in payments processing, as we are one of only two credit card issuers with its own U.S. payments networkand the only issuer whose wholly-owned network operations include both credit and debit functionality. In 2006,we processed more than 3 billion transactions through our Discover and PULSE Networks.
We issue credit cards in the United States under the Discover Card brand to various segments within theconsumer and small business sectors. Most of our cards offer a Cashback Bonus rewards program—the leadingcash rewards program in the United States based on household participation in cash rewards programs—as wellas our top-rated benefits and customer service, which we believe result in excellent customer retention. Rewardscurrently represent the largest and fastest-growing category of the credit card market. In 2006, U.S. cardmembernet sales were $86.4 billion, a 6% increase from the prior year. In addition, we offer a range of banking productsto our customers, including personal and home equity loans, certificates of deposit and money market accounts.
Discover Network cards are currently accepted at more than 4 million merchant and cash access locationsprimarily in the United States, Mexico, Canada, and the Caribbean. In October 2004, the DOJ prevailed in itsantitrust lawsuit against Visa and MasterCard which challenged their exclusionary rules—rules that effectivelyprecluded us from offering network services to banks. Since then, we have accelerated our network growth byentering the debit market with the acquisition of the PULSE Network and by signing card issuing agreementswith a number of financial institutions. We also have significantly expanded our relationships with companiesthat provide merchants with credit card processing services, which we believe will further increase the number ofmerchants accepting Discover Network cards.
In addition, we issue credit cards on the MasterCard and Visa networks in the United Kingdom, the world’ssecond-largest credit card market. Our portfolio includes Goldfish, one of the United Kingdom’s leading rewardscredit cards, as well as several Morgan Stanley-branded credit cards and a number of affinity credit cards. As ofFebruary 28, 2007, we had more than 2 million cardmembers in the United Kingdom and $4.6 billion of managedreceivables in this market.
Our revenues (net interest income plus other income) have increased over the last three years, from$4.5 billion in 2004 to $5.1 billion in 2006, and net income has increased from $776 million to $1.1 billion overthe same period. Our revenues and net income for the three months ended February 28, 2007 were $1.2 billionand $234 million, respectively, and $1.2 billion and $305 million, respectively, for the three months endedFebruary 28, 2006.
Our executive management team possesses an average of 19 years of financial services experience. Webelieve we are well prepared to operate as a stand-alone company, having maintained our own marketing,operations, customer service and technology systems in our U.S. operations throughout our history.
We became a subsidiary of Morgan Stanley in May 1997 as a result of the combination of Dean Witter,Discover & Co. and Morgan Stanley Group, Inc. The entity currently named Discover Financial Services was asubsidiary of Sears, Roebuck and Co. (“Sears”) from 1960 until 1993, when it was part of the spin-off of DeanWitter Financial Services Group Inc. from Sears. The Discover Card business was launched in 1986.
95

Industry Trends
We believe a number of key trends have shaped and will continue to shape our industry, creating newgrowth opportunities and challenges for card issuers and payments networks, including:
Continued Growth of Credit and Debit Card Volume in the United States
The use of electronic payments has increased in recent years as a percentage of total U.S. consumerspending. In 2005, credit card transactions represented 25.4% of consumer spending volume, up from 23.4% in2000, according to the December 2006 Nilson Report. During this same period, cash as a percentage of consumerspending volume remained relatively flat, while check usage fell from 42.9% to 27.8%.
Debit card transactions have grown at even higher rates than credit card transactions, with 21% annualgrowth between 2002 and 2006, reaching an estimated record 26.5 billion transactions in 2006 according to a2006 study by the Federal Reserve Bank of Kansas City. Personal identification number (PIN) debit point-of-sale(POS) volume has helped drive this increase in debit card transactions due in significant part to an increasingnumber of merchants offering this payment option to consumers. According to the same report, debit card’s shareof non-cash transactions increased to 23% in 2004, a 6% increase from 2002, and 63% of retail transactions arestill made with cash, indicating that a substantial growth opportunity still exists for both PIN and signature debit.
The following chart reflects U.S. payments trends, as measured by form of payment and dollar volume oftransactions between 2000 and 2005:
U.S. Payments TrendsPayment Share by Volume ($)
0
5
10
15
20
25
30
35
40
45
50
2000
Perce
nt
Checks Cash Credit Cards Debit Cards Other
2001 2002 2003 2004 2005
Source: December 2002, November 2003, November 2004, December 2005 and December 2006 Nilson Reports
96
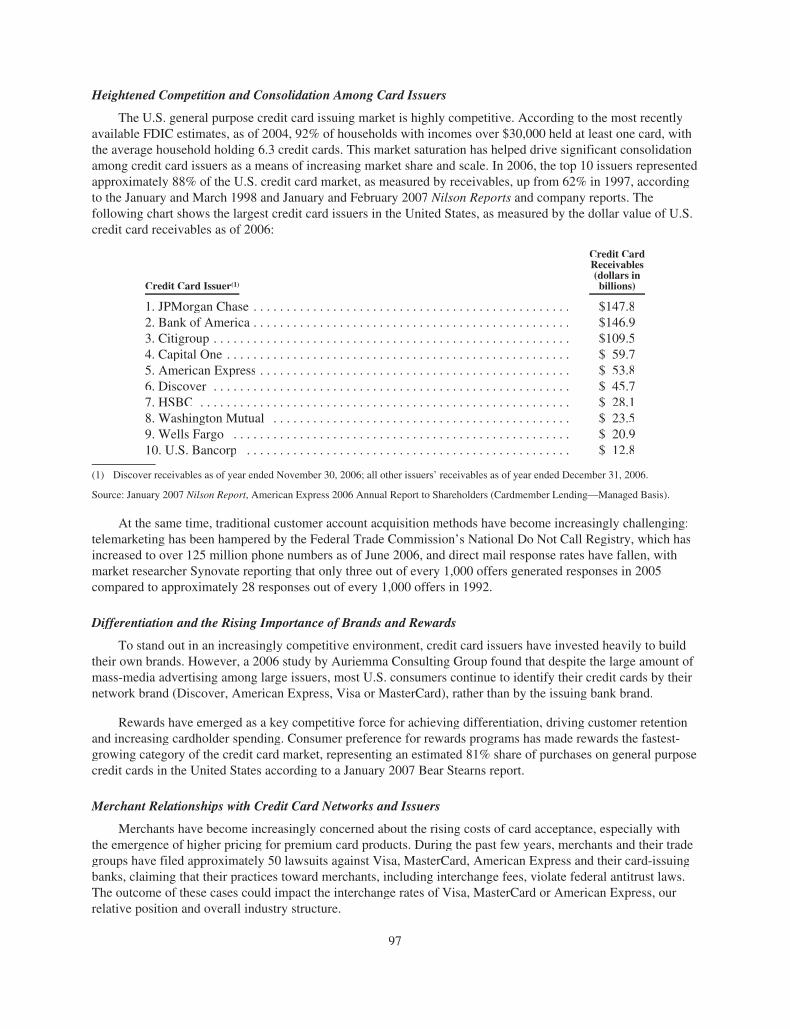
Heightened Competition and Consolidation Among Card Issuers
The U.S. general purpose credit card issuing market is highly competitive. According to the most recentlyavailable FDIC estimates, as of 2004, 92% of households with incomes over $30,000 held at least one card, withthe average household holding 6.3 credit cards. This market saturation has helped drive significant consolidationamong credit card issuers as a means of increasing market share and scale. In 2006, the top 10 issuers representedapproximately 88% of the U.S. credit card market, as measured by receivables, up from 62% in 1997, accordingto the January and March 1998 and January and February 2007 Nilson Reports and company reports. Thefollowing chart shows the largest credit card issuers in the United States, as measured by the dollar value of U.S.credit card receivables as of 2006:
Credit Card Issuer(1)
Credit CardReceivables(dollars inbillions)
1. JPMorgan Chase . . . . . . . . . . . . . . . . . . . . . . . . . . . . . . . . . . . . . . . . . . . . . . . . $147.82. Bank of America . . . . . . . . . . . . . . . . . . . . . . . . . . . . . . . . . . . . . . . . . . . . . . . . $146.93. Citigroup . . . . . . . . . . . . . . . . . . . . . . . . . . . . . . . . . . . . . . . . . . . . . . . . . . . . . . $109.54. Capital One . . . . . . . . . . . . . . . . . . . . . . . . . . . . . . . . . . . . . . . . . . . . . . . . . . . . $ 59.75. American Express . . . . . . . . . . . . . . . . . . . . . . . . . . . . . . . . . . . . . . . . . . . . . . . $ 53.86. Discover . . . . . . . . . . . . . . . . . . . . . . . . . . . . . . . . . . . . . . . . . . . . . . . . . . . . . . $ 45.77. HSBC . . . . . . . . . . . . . . . . . . . . . . . . . . . . . . . . . . . . . . . . . . . . . . . . . . . . . . . . $ 28.18. Washington Mutual . . . . . . . . . . . . . . . . . . . . . . . . . . . . . . . . . . . . . . . . . . . . . $ 23.59. Wells Fargo . . . . . . . . . . . . . . . . . . . . . . . . . . . . . . . . . . . . . . . . . . . . . . . . . . . $ 20.910. U.S. Bancorp . . . . . . . . . . . . . . . . . . . . . . . . . . . . . . . . . . . . . . . . . . . . . . . . . $ 12.8
(1) Discover receivables as of year ended November 30, 2006; all other issuers’ receivables as of year ended December 31, 2006.
Source: January 2007 Nilson Report, American Express 2006 Annual Report to Shareholders (Cardmember Lending—Managed Basis).
At the same time, traditional customer account acquisition methods have become increasingly challenging:telemarketing has been hampered by the Federal Trade Commission’s National Do Not Call Registry, which hasincreased to over 125 million phone numbers as of June 2006, and direct mail response rates have fallen, withmarket researcher Synovate reporting that only three out of every 1,000 offers generated responses in 2005compared to approximately 28 responses out of every 1,000 offers in 1992.
Differentiation and the Rising Importance of Brands and Rewards
To stand out in an increasingly competitive environment, credit card issuers have invested heavily to buildtheir own brands. However, a 2006 study by Auriemma Consulting Group found that despite the large amount ofmass-media advertising among large issuers, most U.S. consumers continue to identify their credit cards by theirnetwork brand (Discover, American Express, Visa or MasterCard), rather than by the issuing bank brand.
Rewards have emerged as a key competitive force for achieving differentiation, driving customer retentionand increasing cardholder spending. Consumer preference for rewards programs has made rewards the fastest-growing category of the credit card market, representing an estimated 81% share of purchases on general purposecredit cards in the United States according to a January 2007 Bear Stearns report.
Merchant Relationships with Credit Card Networks and Issuers
Merchants have become increasingly concerned about the rising costs of card acceptance, especially withthe emergence of higher pricing for premium card products. During the past few years, merchants and their tradegroups have filed approximately 50 lawsuits against Visa, MasterCard, American Express and their card-issuingbanks, claiming that their practices toward merchants, including interchange fees, violate federal antitrust laws.The outcome of these cases could impact the interchange rates of Visa, MasterCard or American Express, ourrelative position and overall industry structure.
97
Evolution of Payments Networks
In October 2004, the DOJ prevailed in its antitrust litigation against Visa and MasterCard that challengedVisa’s and MasterCard’s exclusionary practices. As a result, Visa and MasterCard were permanently enjoinedfrom enforcing their rules prohibiting their members from issuing cards on other networks, including theDiscover Network and American Express. Consequently, financial institutions that issue cards on the Visa and/orMasterCard networks are now also able to issue cards on other networks such as Discover and AmericanExpress. Discover and American Express each has filed a complaint against Visa and MasterCard seekingsubstantial damages for the market foreclosure caused by their anticompetitive practices.
In 2006, our two largest network competitors, Visa and MasterCard, underwent, or announced the intentionto undergo, restructurings in anticipation of initial public offerings. MasterCard converted from a non-stocknot-for-profit membership association to a public corporation, and Visa announced plans to restructure itsorganization in anticipation of an initial public offering.
Changes in the Regulatory Environment
As participants in a highly regulated industry, credit card companies are subject to ongoing regulation andlegislative oversight with respect to industry practices. During the past several years, U.S. regulators havetightened industry practices relating to the assessment of minimum payments and late and overlimit fees toensure that consumer loans amortize over a defined period of time. In addition, members of Congress arecurrently holding hearings on certain practices in the credit card industry, including those relating to graceperiods, two-cycle billing method, interest rates, fees and other finance charge calculation methods. It is not clearat this time whether new limitations on credit card practices will be adopted by Congress or at the state level.
In addition, Congress passed a major reform of U.S. bankruptcy laws that took effect in October 2005. Thelaw established a new “means based” test to qualify for Chapter 7 bankruptcy and more stringent statutorystandards for bankruptcy eligibility. As a result, bankruptcy filings in the United States decreased by 72% in2006 as compared to 2005. However, most industry observers expect bankruptcy filings to rise from theseabnormally low levels over time.
In the United Kingdom, issuers are experiencing an increased regulatory focus on their role in theconsumer credit industry. During the last three years there have been increasing regulatory initiatives withrespect to late and overlimit fees, interchange fees (which are already below U.S. levels) and the sale of retailinsurance products, a relaxation of bankruptcy laws and an increase in industry-wide consumer protectionmeasures.
Our Competitive Advantages
We believe we possess several key competitive advantages that enhance our growth prospects, including:
Unique Credit Card Issuer/Payment Services Business Model
We believe that we have a unique business model as a combination credit card issuer and electronicpayments processor because we are one of only two card issuers with its own U.S. payments network; and ofthese two, we are the only one offering merchants and financial institutions a comprehensive suite of paymentproducts (credit, debit and prepaid). This provides advantages to our card issuing business, primarily in the areasof brand management and product differentiation, and positions us well in the electronic payments processingbusiness.
• Signage for the Discover Network brand at merchant points of sale increases our overall brandawareness.
98

• We leverage our many direct relationships with merchants and our network capabilities to developprograms that we believe contribute to higher usage of our cards. For example, we have signed morethan 70 merchants who fund specific Cashback Bonus redemption offerings that enhance our rewardsprogram and can create programs such as instant rewards limited to specific malls and merchants.
• We directly integrate network acceptance strategies into our Discover Card products. For example, ournew Discover Business Card offers cardmembers the ability to use PurchaseChecks to access theircredit lines for purchases with merchants who do not accept credit cards. These transactions enable usto contact these merchants with an effective sales message regarding Discover Network cardacceptance.
Strong, Established Brands
We believe our strong brands are critical to increasing card usage by cardmembers, growing our customerbase and creating new opportunities to expand into additional card and consumer lending sectors.
• Among credit card issuers, our Discover Card maintains the highest brand awareness score with U.S.credit card users, according to the November 2006 Issuer Brand Index report issued by AuriemmaConsulting Group. Auriemma attributes this leadership, which we have maintained for the past fiveevaluation periods, in part to our distinctive role as both an issuer and network.
• We have received Brandweek’s “Customer Loyalty Award” for the last ten years. The award is basedon a third-party brand consultancy’s determination that our brand leads the credit card industry incustomer loyalty.
• We continuously strengthen our brand by delivering customer service to our cardmembers that hasbeen recognized as industry leading, most recently by the 2006 Service Quality Measurement Group,Inc. (SQM) “World Class Customer Satisfaction” award and the 2006 Keynote Systems ranking for thebest online customer service experience.
• In the United Kingdom, our Goldfish credit card has high levels of awareness among consumers.
Attractive Base of Loyal Cardmembers
Discover has a large, attractive and loyal base of cardmembers in the United States, which we believeprovides a strong foundation for the growth of our credit card issuing business and our expansion into relatedconsumer lending and deposit products.
• In 2006, an estimated 28% of U.S. households had a Discover Card, according to a 2006 study by TNSMedia Intelligence.
• Discover cardmembers have held their cards for an average of 8.6 years compared to a U.S. industryaverage of 6.2 years.
• Discover cardmembers are also the least likely to switch to another card if offered a lower rate: ourattrition rate for cardmembers in 2006 was 4.5%, half the U.S. industry average (excluding Discoverand American Express) of 9.1% cited by Cardweb’s January 2007 Monthly Survey.
• We have the second highest penetration among affluent households (defined as having annualhousehold incomes exceeding $150,000), with 40% owning Discover Cards according to the 2005-2006 Phoenix Affluent Marketing Service Card Report. By comparison, American Express has thehighest penetration with 41% of affluent households and Citibank MasterCard ranks third with 30%penetration.
In the United Kingdom, our cardmembers are similarly attractive from a customer satisfaction perspective.In the September 2006 GfK Financial Research Survey, Morgan Stanley credit cards achieved the highestsatisfaction scores among key U.K. competitors, with more than 70% of our cardmembers reporting being“extremely satisfied” with our products.
99
Leading Cash Rewards Program in the Industry
Rewards have become increasingly important for acquiring and retaining customers, as well as forincreasing card usage. According to a November 2006 GfK Arbor Research Survey, 75–80% of U.S. consumersprefer cash to other reward options (such as miles or points).
We pioneered cash rewards for general purpose credit cards in 1986. We believe our experience, scale anddirect relationships with large merchants make us efficient in how we design and operate our programs, allowingus to offer greater value to cardmembers while maintaining our profitability. Along with our strong brands andcustomer service, we believe that our rewards program contributes to increased usage of our cards and our lowattrition rate.
• Discover was ranked by Kiplinger’s Personal Finance magazine in January 2007 as having the bestcash reward credit card.
• Our program is simple and straightforward, rewarding cardmembers up to 1% on every purchase.Rewards are unlimited and never expire for active cardmembers. We offer 5% cash rewards optionsthrough our Get More program, and Discover cardmembers can earn 5–20% Cashback Bonus at toponline retailers when using our exclusive online shopping portal, ShopDiscover.
• When redeeming rewards with one of our more than 70 merchant partners, cardmembers can increasetheir reward, up to double the reward amount.
• In the United Kingdom, we have developed a rewards-based strategy that leverages our expertise in theUnited States. We offer two different reward propositions to attract a broad range of customers. OurCashback Bonus program in the United Kingdom is similar to that in the United States in thatcardmembers earn money back on every purchase. Our Goldfish cardmembers earn points with eachpurchase that can be used for cash vouchers with popular retailers. We believe these rewards programshave strong market appeal in the United Kingdom and provide consumers with broad choices andvalue.
Strong Operational Platform and Customer Service
We believe that our proprietary operational infrastructure, which we have developed during our 20-yearhistory, has been a critical component of our success. We have developed our technology, operating processesand customer experience with the goal of maintaining business efficiency while generating revenue andcultivating customer loyalty.
• Our in-house systems facilitate all aspects of our operations, from activation and authorizations throughmerchant disputes and collections. Designed around customer and account manager needs, our systemsallow information to be quickly accessed and presented in a manner that enables accurate and timelyresolution of inquiries.
• Our service standards are based on connecting our customers to an account manager within 60 secondsof calling us and dialing zero. Our operations centers fielded over 70 million inbound service calls,mailed over 196 million cardmember statements and produced more than 33 million cards in 2006.
• We view each customer interaction as an opportunity to reinforce cardmember loyalty and grow ourbusiness. Our proprietary predictive modeling seeks to enable our account managers to moreeffectively build cardmember relationships and to offer them the most relevant products and services,such as balance transfers and various fee products.
• We also have established a strong e-business platform that provides our cardmembers with a fast,flexible and transparent way to manage their accounts. We were one of the first to offer single-useaccount numbers for online transactions, as well as email alerts regarding credit card payment duedates and transaction information. More than 12 million Discover cardmembers have registered tomanage their accounts online as of February 2007, and in 2006 Keynote Systems, Inc. ranked us ashaving the best online customer experience within our industry.
100

Broad-Based, Flexible Payments Networks
We believe our strong position in the credit and debit card markets positions us well in the paymentsprocessing business. In recent years, we have made significant progress in capitalizing on new businessopportunities, most of which only became possible as a result of the October 2004 resolution of the DOJlitigation:
• With our 2005 acquisition of the PULSE Network, we are now the only integrated card issuer/paymentservices company in the United States to offer financial institutions a comprehensive suite of paymentcard products. We currently serve more than 4,400 financial institutions and more than 4 millionmerchant and cash access locations.
• We offer a complete suite of services to key merchants that includes the processing of our credit cards,debit cards (signature and PIN) and prepaid cards, as well as other payment network services.
• We offer a differentiated brand proposition for third-party issuers, and have attracted a number ofissuers to the Discover Network, including GE Money and HSBC.
• We are able to leverage our networks’ flexibility to tailor product offerings at specific merchantlocations (e.g., mall cards and private label cards) and to provide special discounts and benefits forcardholders at particular merchants.
• Our direct network relationships with large merchants provide them with ongoing access to ourdistinctive product offerings and marketing programs. We believe our direct connectivity and acquirerrelationships with large merchants provide us with a competitive advantage versus Visa andMasterCard.
Strong Risk Management Culture
We take an integrated view of all elements of risk, including credit, operational and regulatory risk.
• We have built and refined proprietary models that seek to control all aspects of credit risk, includingauthorization and new account underwriting, and to enable cost-effective collections. Prudent creditrisk management is a key component of maintaining profitable growth of our business. Many measuresof our performance reflect this investment, including balances delinquent over 30 days, whichexperienced a 10-year low in 2006, due in part to the favorable impact of the new U.S. bankruptcylegislation that took effect in October 2005.
• We use externally developed and proprietary models to protect our cardmembers from fraud. Our fraudrates as a percentage of sales are currently at a 10-year low. In recognition of our excellence in thisarea, Javelin Strategy and Research rated us #1 in fraud detection among the largest credit card issuersin their June 2005 report.
Our Strategy
Grow Our Card Issuing Business through Brand, Rewards and Service Leadership
We intend to continue leveraging our brand strength, rewards expertise and customer service to createneeds-based solutions that generate increased usage from our existing Discover cardmembers and acquire newaccounts cost-effectively.
• We believe we can leverage our strong national brand recognition and customer loyalty to help us driveincreased usage among cardmembers and broader acceptance among merchants, leading to higherreceivables and revenues.
• We believe we can profitably grow sales and balances through expanded cash rewards leadership, bothwith existing and new cardmembers.
• We will continue to improve our analytics and launch new products and features. Our initiatives haveled to improved activation rates and accounts of higher credit quality. From 2004 to 2006, we reducedour cost per new account acquired by over 10% while increasing our number of new accounts by 18%,despite rising postage expenses and lower industry response rates.
101

Broaden Merchant Acceptance of Discover Network Cards
Discover Network cards are currently accepted at more than 4 million merchant and cash access locationsprimarily in the United States, Mexico, Canada and the Caribbean. We believe we have unsurpassed acceptanceamong the 100 largest retailers in the United States. Discover Network cards, however, are less likely to be acustomer’s primary card due to lower acceptance rates among small and mid-size merchants than cards issued onthe Visa and MasterCard networks. We believe that increasing small and mid-size merchant acceptance ofDiscover Network cards will create significant opportunities for our card issuing and third-party paymentsbusinesses.
• We recently began outsourcing our acquisition and servicing of small and mid-sized merchants to theindustry’s leading merchant acquiring organizations (the entities that settle transactions withmerchants). With this evolution of our business model, merchant acquirers have started offering thesemerchants cost-effective servicing for Discover, Visa and MasterCard acceptance on a fully-integratedbasis. Our objective is to use this new model to significantly increase our acceptance among small andmid-size merchants during the next two years.
• We are working with merchant acquirers to continue building acceptance outside the United Stateswhere the majority of international travel by Americans is concentrated (Mexico, Canada and theCaribbean). We also have signed reciprocal network arrangements for acceptance in other countries,including China UnionPay in China and JCB in Japan, and may pursue other similar arrangements inthe future. China UnionPay is the only national bankcard payment network in China, and JCB is aleading card network in Japan.
Grow Payments Transaction Volume from External Issuers
We intend to continue to take advantage of new growth opportunities created by the October 2004resolution of the DOJ litigation. During the past two years, we have been able to attract a number of third-partyissuers, including debit, credit and prepaid, on our Discover and PULSE Networks. Following our acquisition ofPULSE, third-party volume on the Discover and PULSE Networks accounted for approximately 59% of networktransactions in 2006.
• Through the PULSE Network, we are well-positioned in the PIN debit market, where the dollar valueof transaction volume has increased 21% annually since 2002—a growth rate that far surpasses that ofthe credit card market during that period.
• We will continue to add issuers to our networks by providing them with a competitively priced,comprehensive product offering that includes credit, PIN debit and signature debit and prepaid cardsalong with a high-service approach.
• We will continue to target large issuers by offering them a strong brand that has less market saturationthan MasterCard or Visa and serves as a differentiated account acquisition tool in a highly competitivemarketplace. Our ability to provide flexible product solutions and straightforward operating guidelinesallows issuers to further differentiate their Discover Network card products.
• We are able to offer financial institutions attractive network economics with little incrementalinvestment by us because of the largely fixed-cost nature of the Discover and PULSE Networks andinfrastructure.
• Through our “network to network” alliances with China UnionPay and JCB that leverage our PIN andsignature infrastructures, we expect to gain transaction volume over time as we will be their exclusivenetwork partner for cardholders coming to the United States.
In addition to taking advantage of the growth opportunities created by the resolution of the DOJ litigation,we are suing Visa and MasterCard under the antitrust laws seeking significant monetary damages for the marketforeclosure caused by their anticompetitive rules which were found to be illegal in the DOJ litigation. We filed
102

suit against Visa and MasterCard in the U.S. District Court for the Southern District of New York in 2004. Thecase is currently in the discovery phase and trial is anticipated to begin in 2008. Upon successful resolution of thelitigation, after expenses, we will be required to pay Morgan Stanley the first $700 million of value of cash ornon-cash proceeds (increased at the rate of 6% per annum until paid in full) (the “minimum proceeds”), plus 50%of any proceeds in excess of $1.5 billion, subject to certain limitations and a maximum potential payment toMorgan Stanley of $1.5 billion. All payments by Discover to Morgan Stanley will be net of taxes payable byDiscover with respect to such proceeds. If, in connection with or following a change of control of Discover, thelitigation is settled for an amount less than the minimum proceeds, Discover will be required to pay MorganStanley an amount equal to the minimum proceeds.
Expand in Card Sectors and Grow Consumer Lending and Deposit Business
We plan to expand in several card and consumer lending sectors that we believe offer attractive profitpotential and leverage our assets. Areas of particular focus include: a small business card, which we launched in2006; relaunching the Miles by Discover Card product; and prepaid cards.
We also are pursuing opportunities to profitably leverage our brand, our customer base, and our directmarketing and operating skills by growing our Discover branded non-card consumer lending (including personal,home equity and student loans) and deposit businesses.
Strengthen U.K. Card Business
We have made significant investments in our U.K. business during the last two years, including ourFebruary 2006 acquisition of the Goldfish credit card business. We believe that the acquisition of Goldfish willadd economies of scale through better utilization of our existing U.K. infrastructure and strengthen our positionin the U.K. credit card market. The U.K. market is currently experiencing high delinquencies and risingbankruptcy levels, compounded by changing regulations, which have adversely affected our performance. We arein the process of implementing a number of initiatives to address these issues, including: changes to our creditand collections strategies; changes to our operations; and pricing and rewards optimization. While we are stillexperiencing losses in the United Kingdom, over time we believe that we can improve our operating results andcontinue to grow our U.K. business.
Operating Model
We operate in three reportable segments: U.S. Card, International Card and Third-Party Payments.
U.S. Card
From our inception in 1986 until October 2004, we operated as a “closed loop” credit card business in whichwe performed all functions related to our credit card business by acting as the card issuer, network and merchantacquirer. As a result of the resolution of the DOJ litigation, we recently began entering into agreements with anumber of third-party merchant acquirers.
We issue Discover Cards through our wholly-owned subsidiary Discover Bank. Cardmembers are permittedto “revolve” their balances and repay their obligations over a period of time and at an interest rate set forth intheir cardmember agreements, which may be either fixed or variable. The interest that we earn on revolvingbalances is our primary source of revenue from cardmembers. We finance these balances using a variety of debtinstruments, including securitizations, from which we derive a significant portion of our income. We also chargecardmembers other fees, including fees for late payment and for exceeding credit limits. In addition, we receivefees from merchants or merchant acquirers based on sales volume charged to Discover Network cards. Werecognize reward cost as a reduction of discount and interchange revenue.
Where we have a direct relationship with the merchant, which is the case with respect to our large merchantsthat represent a majority of Discover Card sales volume, we receive discount and fee revenue from merchants.Discount and fee revenue, which is our primary source of merchant revenue, is based on pricing that varies due toa number of factors including competitive pricing levels, size of merchant, industry and special marketingarrangements.
103

Where we do not have a direct relationship with the merchant, we receive interchange and assessment feesfrom the merchant acquirer that settles transactions with the merchant. The amount of this fee is based on apublished schedule and can vary based on the type of merchant or type of card (e.g., consumer vs. business).
The following chart shows the U.S. Card transaction cycle:
U.S. CardTransaction Cycle*
Merchant AcquirerDiscover Network/Discover Bank
MerchantDiscover
Cardmember
Discover billsCardmember foramount of transaction
Cardmember makespayment to Discover
Direct MerchantDiscover reimbursesMerchant for amount oftransaction lessdiscount fee
Merchant submitstransaction to Discover
Discover reimbursesAcquirer for amount of transaction less acquirerinterchange fee
Acquirer submitstransaction to Discover
Indirect MerchantAcquirer reimbursesMerchant for amountof transaction lessdiscount fee
Merchant submitstransaction to Acquirer
Cardmember makes purchase atMerchant accepting Discover
* This is a simplified illustration of a typical credit card transaction. It does not reflect certain operations and assessment fees, cash or balance transfer transactions, authorizations, disputes or other specifics.
We also offer various products and services, such as identity theft protection, fraud protection and otherfee-based products to our existing customer base.
International Card
Our international card issuing business differs from our U.S. card business in that we rely on third-partynetworks, historically the MasterCard Network, and more recently, as a member of Visa Europe, the VisaNetwork. As a result, third parties maintain the relationships with merchants and pass customer charges on to ourU.K. card issuing bank. We have applied for a license for a new U.K. bank, which we expect to receive prior tothe distribution. As in the U.S. card business, we charge interest fees, late payment and overlimit fees and feesfor various other products and services.
104
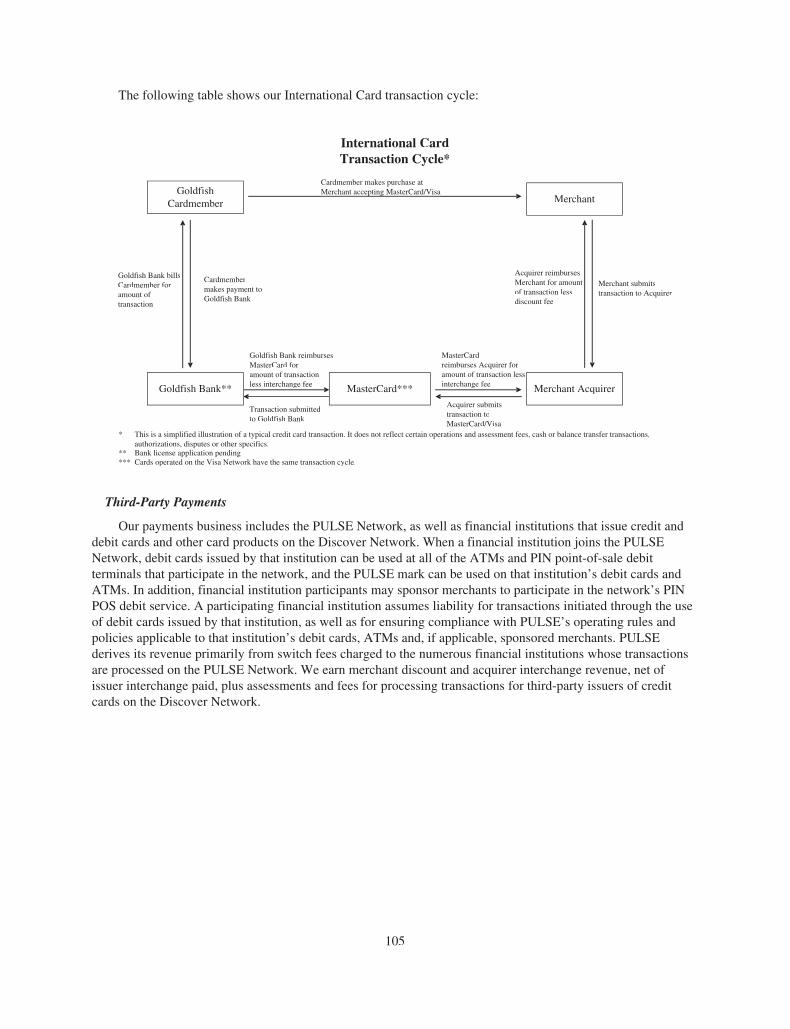
The following table shows our International Card transaction cycle:
International CardTransaction Cycle*
Merchant AcquirerMasterCard***
MerchantGoldfish
Cardmember
Goldfish Bank billsCardmember foramount oftransaction
Cardmembermakes payment toGoldfish Bank
MasterCardreimburses Acquirer foramount of transaction lessinterchange fee
Acquirer submitstransaction toMasterCard/Visa
Acquirer reimbursesMerchant for amountof transaction lessdiscount fee
Merchant submitstransaction to Acquirer
Goldfish Bank**
Goldfish Bank reimbursesMasterCard foramount of transactionless interchange fee
Transaction submittedto Goldfish Bank
Cardmember makes purchase atMerchant accepting MasterCard/Visap gp gp g
* This is a simplified illustration of a typical credit card transaction. It does not reflect certain operations and assessment fees, cash or balance transfer transactions, authorizations, disputes or other specifics.** Bank license application pending*** Cards operated on the Visa Network have the same transaction cycle.
Third-Party Payments
Our payments business includes the PULSE Network, as well as financial institutions that issue credit anddebit cards and other card products on the Discover Network. When a financial institution joins the PULSENetwork, debit cards issued by that institution can be used at all of the ATMs and PIN point-of-sale debitterminals that participate in the network, and the PULSE mark can be used on that institution’s debit cards andATMs. In addition, financial institution participants may sponsor merchants to participate in the network’s PINPOS debit service. A participating financial institution assumes liability for transactions initiated through the useof debit cards issued by that institution, as well as for ensuring compliance with PULSE’s operating rules andpolicies applicable to that institution’s debit cards, ATMs and, if applicable, sponsored merchants. PULSEderives its revenue primarily from switch fees charged to the numerous financial institutions whose transactionsare processed on the PULSE Network. We earn merchant discount and acquirer interchange revenue, net ofissuer interchange paid, plus assessments and fees for processing transactions for third-party issuers of creditcards on the Discover Network.
105
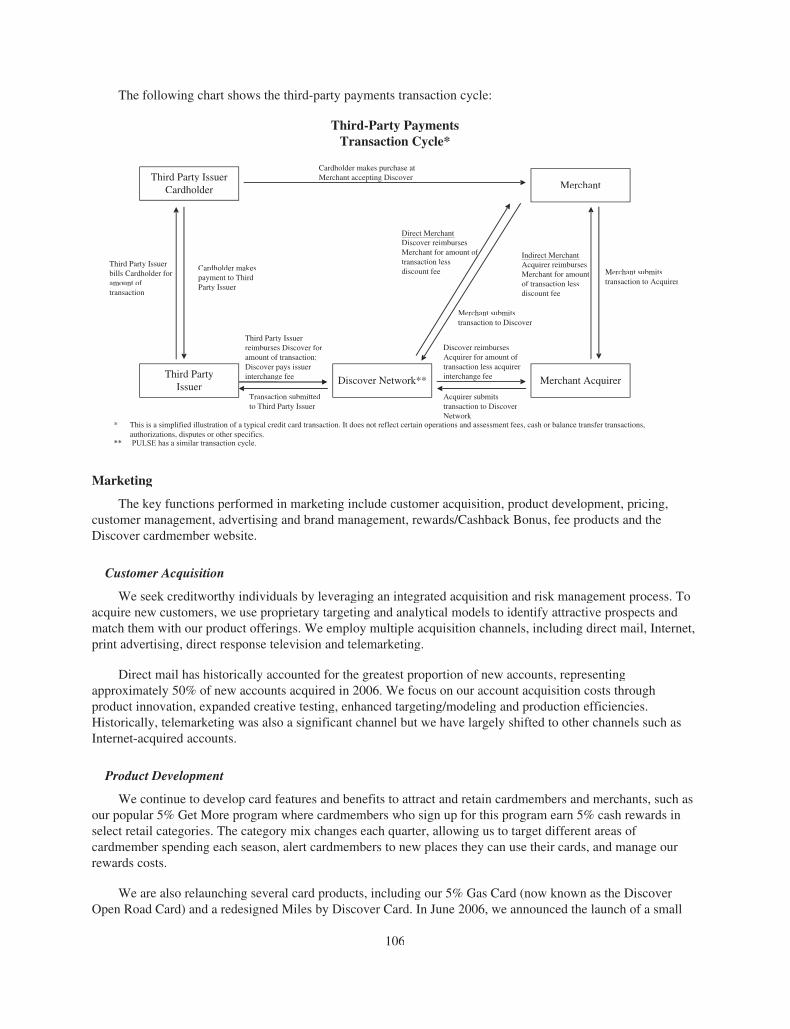
The following chart shows the third-party payments transaction cycle:
Third-Party PaymentsTransaction Cycle*
Merchant AcquirerDiscover Network**
MerchantThird Party Issuer
Cardholder
Third Party Issuerbills Cardholder foramount oftransaction
Cardholder makespayment to ThirdParty Issuer
Direct MerchantDiscover reimbursesMerchant for amount offfftransaction lessdiscount fee
Merchant submitstransaction to Discover
Discover reimbursesAcquirer for amount oftransaction less acquirerinterchange fee
Acquirer submitstransaction to DiscoverNetwork
Indirect MerchantAcquirer reimbursesMerchant for amountof transaction lessdiscount fee
Merchant submitstransaction to Acquirer
Third PartyIssuer
Third Party Issuerreimburses Discover foramount of transaction;Discover pays issuerinterchange fee
Transaction submittedto Third Party Issuer
Cardholder makes purchase atMerchant accepting Discover
* This is a simplified illustration of a typical credit card transaction. It does not reflect certain operations and assessment fees, cash or balance transfer transactions, authorizations, disputes or other specifics.
** PULSE has a similar transaction cycle.
Marketing
The key functions performed in marketing include customer acquisition, product development, pricing,customer management, advertising and brand management, rewards/Cashback Bonus, fee products and theDiscover cardmember website.
Customer Acquisition
We seek creditworthy individuals by leveraging an integrated acquisition and risk management process. Toacquire new customers, we use proprietary targeting and analytical models to identify attractive prospects andmatch them with our product offerings. We employ multiple acquisition channels, including direct mail, Internet,print advertising, direct response television and telemarketing.
Direct mail has historically accounted for the greatest proportion of new accounts, representingapproximately 50% of new accounts acquired in 2006. We focus on our account acquisition costs throughproduct innovation, expanded creative testing, enhanced targeting/modeling and production efficiencies.Historically, telemarketing was also a significant channel but we have largely shifted to other channels such asInternet-acquired accounts.
Product Development
We continue to develop card features and benefits to attract and retain cardmembers and merchants, such asour popular 5% Get More program where cardmembers who sign up for this program earn 5% cash rewards inselect retail categories. The category mix changes each quarter, allowing us to target different areas ofcardmember spending each season, alert cardmembers to new places they can use their cards, and manage ourrewards costs.
We are also relaunching several card products, including our 5% Gas Card (now known as the DiscoverOpen Road Card) and a redesigned Miles by Discover Card. In June 2006, we announced the launch of a small
106
business credit card that offers cash rewards, distinctive control features and dedicated service. The DiscoverMotiva Card, launched in March 2006, provides cardmembers with a full month’s interest as a reward each timethey make six consecutive on-time payments.
Pricing and Analytics
We use an analytical pricing strategy that provides competitive pricing for cardmembers and seeks tomaximize revenue on a risk-adjusted basis. We assign specific annual percentage rates (APRs), fees and termsfor different products and cardmembers, including purchases, balance transfers, and cash advances. Weperiodically assess individual-level behavior practices and use risk models to determine appropriate pricing termsfor our cardmembers, providing lower promotional rates for some customers while assessing higher rates forothers who have demonstrated high-risk behaviors such as defaulting on their payments.
Customer Management
We actively work to increase sales and build loan balances of new and existing cardmembers by marketingto them through a variety of channels, including mail, phone and online. Targeted offers may include balancetransfers, fee products and reinforcement of our Cashback Bonus rewards program.
We also continue to improve our modeling and customer engagement capabilities, which we believe willhelp us offer the right products and pricing at the right time and through the right channels. Recent enhancementsinclude the development of a large prospect database, trade-line level data and a customer contact strategy andmanagement system.
Advertising and Brand Management
We maintain a full-service, in-house marketing and communications department charged with deliveringcommunications to foster customer engagement with our products and services. This helps us promote ourbrands, launch new products, supervise external agencies and provide integrated marketing communications.
Rewards / Cashback Bonus
Under our Cashback Bonus rewards program, we provide cardmembers rewards based upon their level andtype of purchases. The amount of the Cashback Bonus generally increases as the cardmember’s purchasesincrease during the year, up to a full 1.0% when the purchases during the coverage period exceed $3,000. Annualpurchases up to $1,500 earn 0.25% Cashback Bonus and purchases between $1,500 and $3,000 earn 0.50%.Purchases made at certain warehouse clubs or discount stores earn a fixed Cashback Bonus reward of 0.25%.
Cardmembers can choose from several card products that allow them to accelerate their cash rewardsearnings based on how they want to use credit. For example, the Discover Open Road Card provides 5%Cashback Bonus on the first $1,200 in gas and auto maintenance purchases each year.
Cardmembers who are not delinquent may redeem Cashback Bonus rewards at any time in increments of$20, and cardmembers have the option to choose a statement credit, check, direct deposit, partner gift card orcharitable donation. When cardmembers choose to redeem their Cashback Bonus with one of our more than70 merchant partners, they have the opportunity to increase their reward, up to double the reward amount.
Fee Products
We market several fee-based products to our cardmembers, including the following:
• Identity Theft Protection: The most comprehensive identity theft monitoring service we offer includesan initial credit report, credit bureau file monitoring, prompt alerts that help cardmembers spot possibleidentity theft quickly, and access to knowledgeable professionals who can provide information aboutidentity theft issues or credit reports.
107

• Payment Protection: This service allows cardmembers to suspend their payments in the event ofunemployment, disability or other life events for up to two years. Any outstanding balance up to$25,000 is cancelled in the event of death.
• Wallet Protection: This service offers one-call convenience if the cardmember’s wallet is lost or stolen,including cancellation of all the cardmember’s credit and debit cards, providing replacement DiscoverCards, requesting replacement of the cardmember’s other credit and debit cards, monitoring thecardmember’s credit files for 90 days, providing up to $100 to replace the cardmember’s wallet, and ifneeded, lending the cardmember up to $1,000 in emergency cash.
Cardmember Website
Cardmembers can register their accounts online at Discovercard.com, which offers a range of benefits andcontrol features that allow cardmembers to customize their accounts to meet their own preferences and needs.Key offerings include:
• Online account services that allow cardmembers to customize their accounts, choose how and whenthey pay their bills, and create annual account summaries that assist with budgeting and taxes;
• Email reminders to help cardmembers avoid fees and track big purchases or returns;
• Secure online account numbers that let cardmembers shop online without ever revealing their actualaccount numbers; and
• ShopDiscover, an online portal where cardmembers automatically earn 5–20% Cashback Bonus whenthey shop at well-known online merchants.
Credit Risk
Risk management is a critical and fully integrated component of our management and growth strategy. Wehave developed a risk management structure to manage credit and other risks facing our business.
Credit risk refers to the risk of loss arising from borrower default when a borrower is unable or unwilling tomeet their financial obligations to Discover. Our credit risk is generally highly diversified across millions ofaccounts without significant individual exposures; accordingly, we manage risk on a portfolio basis. We have arisk committee that is composed of our senior management and is responsible for the establishment of criteriarelating to risk management.
New Cardmembers
We subject all credit applications to an underwriting process that assesses the creditworthiness of eachapplicant. In terms of identifying potential cardmembers, we give consideration to the prospective cardmember’sfinancial stability, as well as ability and willingness to pay.
Prospective cardmembers’ applications are evaluated using credit information provided by the creditbureaus and other sources. Credit scoring systems, both externally developed and proprietary, are used toevaluate cardmember and credit bureau data. We assign credit lines to our cardmembers on the basis of risk level,income and expected card usage.
We use experienced credit underwriters to supplement our automated decision-making processes.Approximately 25% of all applications are subject to manual review that covers the areas of key cardmemberdata verification, fraud prevention and approval of higher credit lines. We periodically review policy proceduresand processes to ensure accurate implementation.
108

Portfolio Management
Proactive management of a cardmember’s account is a critical part of credit management, and all accountsare subject to ongoing credit assessment. This assessment reflects information relating to the performance of theindividual’s Discover account as well as information from a credit bureau relating to the cardmember’s broadercredit performance. This information is used as an integral part of credit decision-making as well as formanagement reporting purposes.
The measurement and management of credit risk is supported by scoring models (statistical evaluationmodels). At the individual cardmember level, we use custom risk models together with generic industry modelsas an integral part of the credit decision-making process.
Depending on the duration of the cardmember’s account, risk profile and other performance metrics, theaccount may be subject to a range of account management treatments, for example, eligibility for marketinginitiatives, authorization, increases or decreases in retail and cash credit limits, pricing adjustments anddelinquency strategies.
Cardmember Assistance
Authorizations. Each transaction is subject to screening and approval through a proprietary point-of-saledecision system. This system utilizes rules-based decision-making logic, statistical models and data integritychecks to manage fraud and credit risks. Strategies are subject to regular review and enhancement to enable us torespond quickly to changing credit conditions as well as to protect our cardmembers and the business fromemerging fraud activity.
Proactive Account Management. We use a variety of collection and recovery strategies, with overduedelinquent accounts scored and segmented to tailor the collection approach. We employ predictive callcampaigns, as well as offering payment programs for certain cardmembers to find customized solutions that fittheir financial situation. We offer tools such as payment email reminders, flexible payment plans and acollections website designed to educate and assist cardmembers with their payment needs. Our payment plans aredesigned to help bring accounts out of delinquency or overlimit exposure.
Collections. All monthly billing statements of accounts with past due amounts include a request for paymentof such amounts. These accounts also receive a written notice of late fee charges, as well as an additional requestfor payment, after the first monthly statement that reflects a past due amount. Collection personnel generallyinitiate telephone contact with cardmembers within 30 days after any portion of their balance becomes past due.The nature and the timing of the initial contact, typically a personal call or letter, are determined by a review ofthe cardmember’s prior account activity and payment habits. For higher risk accounts, as determined bystatistically derived predictive models, telephone contacts may begin as soon as the account becomes past due.Lower risk cardmembers are typically contacted by letter and further collection efforts are determined bybehavioral scoring, financial exposure and the lateness of the payment.
We reevaluate our collection efforts and consider the implementation of other techniques as a cardmemberbecomes more days delinquent. We limit our exposure to delinquencies through controls within theauthorizations system and criteria based account suspension and revocation. In situations involving acardmember with financial difficulties, we may enter into arrangements to extend or otherwise change paymentschedules.
Recovery. Our current policy is to recognize losses and to write off an account if the minimum paymentrelating to a past due amount has not been received by the end of the sixth full calendar month after such past dueamount was first due. The only exceptions are bankrupt accounts, deceased customers, accounts on paymenthardship or settlement programs and fraudulent transactions, which are charged off earlier.
109
We use various recovery techniques and channels that include internal collection activities, use ofcollections agencies, legal action, and sales of charged-off accounts and the related receivables. The timing andchoice of channel utilized are subject to a recovery optimization strategy that encompasses factors such as costand duration against expected recovery effectiveness.
Fraud Prevention
We actively monitor cardmember accounts to prevent, detect, investigate and resolve fraud. Our fraudprevention processes are designed to protect the security of cards, applications and accounts in a mannerconsistent with our cardmembers’ needs to easily acquire and use our products. Prevention systems handle theauthorization of application information, verification of cardmember identity, sales, processing of convenienceand balance transfer checks and electronic transactions.
Our fraud detection program utilizes a variety of proven systems techniques to identify and halt fraudulenttransactions, including neural and pattern recognition technology, rules-based decision-making logic, reportanalysis and manual account reviews. Accounts identified by the fraud detection system are managed byproprietary software that integrates effective fraud prevention with customer centric service.
Customer Service and Processing Services
Customer Service
We currently manage over 70 million annual inbound service calls placed to 1-800-Discover. We arecommitted to answering calls within 60 seconds or less and to providing “one-call resolution.”
We perform the functions required to service and operate cardmember credit accounts, including newaccount solicitation, application processing, new account fulfillment, transaction authorization and processing,cardmember billing, payment processing, cardmember service and collection of delinquent accounts. We believethat direct management of this function reduces our customer attrition and is cost-effective.
Designed around customer and account manager needs, our technology and systems enable our accountmanagers to quickly access information in a manner that supports accurate and timely resolution of inquiries. Wedevelop and maintain our infrastructure solutions with the flexibility to change and adapt quickly to meetcustomer expectations and needs. In addition to our systems, we invest in our people, providing them with thetraining and work environment that facilitates their ability to build strong customer relationships.
Processing Services
Processing Services is composed of four functional areas: card personalization/embossing, print/mail,remittance processing and check/document processing. Card personalization/embossing is responsible for theembossing and mailing of plastic credit cards for new accounts, replacements and reissues, as well as gift cards.Print/mail specializes in statement and letter printing and mailing for merchants and cardmembers. Remittanceprocessing handles account payments, check processing and product enrollments.
Technology
We provide technology systems processing through a combination of owned and hosted data centers locatedin the United States. These data centers support our Discover and PULSE Networks, provide cardmembers withaccess to their accounts at all times, and manage transaction authorizations, among other functions.
Our approach to technology development and management involves both third-party and in-house resources.We use third-party vendors for basic technology services (e.g., telecommunications, hardware and operating
110
systems). Each vendor participates in a formal selection process to ensure that we have partners who can provideus with a cost-effective and reliable technology platform. This approach enables us to focus our in-houseresources on building proprietary systems (e.g., for cardmember and merchant settlement, authorizations andcustomer relationship management) that we believe enhance our operations, improve cost efficiencies and helpdistinguish us in the marketplace.
Discover Card Terms and Conditions
The terms and conditions governing our products vary by product and change over time. Each cardmemberenters into an agreement governing the terms and conditions of the cardmember’s account. Discover Card’sterms and conditions are generally uniform from state to state. The cardmember agreement permits us to changethe credit terms, including the annual percentage rates and the fees imposed on accounts, with notice to thecardmember. The cardmember has the right to opt out of the change of terms and pay their balance off under theold terms. Each cardmember agreement provides that the account can be used for purchases, cash advances andbalance transfers. Each Discover Card account is assigned a credit limit when the account is initially opened.Thereafter, individual credit limits may be increased or decreased from time to time, at our discretion, basedprimarily on our evaluation of the cardmember’s creditworthiness.
Discover Bank offers various features and services with the Discover Card accounts, including the CashbackBonus reward described under “—Marketing—Rewards/Cashback Bonus.” A cardmember’s earned CashbackBonus rewards are recorded in a “Cashback Bonus Account”; eligible cardmembers may redeem their rewards inincrements of $20.
Discover Card accounts generally have the same billing and payment structure, though there are somedifferences between the consumer and business credit cards, as described below. Unless we waive the right to doso, we send a monthly billing statement to each cardmember who has an outstanding debit or credit balance.Cardmembers also can waive their right to receive a physical copy of their bill, in which case they will receiveemail notifications of the availability of their billing statement online at the Discover Card Account Center.Discover Card accounts are grouped into multiple billing cycles for operational purposes. Each billing cycle hasa separate billing date, on which we process and bill to cardmembers all activity that occurred in the relatedaccounts during the period of approximately 28 to 34 days that ends on that date.
We offer fixed and variable rates of periodic finance charges on accounts. Neither cash advances norbalance transfers are subject to a grace period. Periodic finance charges on purchases are calculated on a dailybasis, subject to a grace period that essentially provides that periodic finance changes are not imposed if thecardmember pays his or her entire balance each month. Certain account balances, such as balance transfers, mayaccrue periodic finance charges at lower fixed rates for a specified period of time. Variable rates are indexed tothe highest prime rate published in The Wall Street Journal on the last business day of the month.
Additional Consumer Card Terms. Each cardmember with an outstanding debit balance in his or herconsumer Discover Card account must generally make a minimum payment each month. If a cardmemberexceeds his or her credit limit as of the last day of the billing period, we may include all or a portion of thisexcess amount in the cardmember’s minimum monthly payment. From time to time, we have offered and maycontinue to offer eligible cardmembers the opportunity to not make the minimum monthly payment, whilecontinuing to accrue periodic finance charges, without being considered to be past due. A cardmember may paythe total amount due at any time. We also may enter into arrangements with delinquent cardmembers to extend orotherwise change payment schedules, and to waive finance charges, fees and/or principal due, including re-agingaccounts in accordance with regulatory guidance. Income may be reduced during any period in which we offercardmembers the opportunity to not make the minimum monthly payment or to extend or change paymentschedules.
In addition to periodic finance charges, we may impose other charges and fees on Discover Card accounts,including cash advance transaction fees, late fees where a cardmember has not made a minimum payment by the
111
required due date, overlimit fees for balances that exceed a cardmember’s credit limit as of the close of thecardmember’s monthly billing cycle, balance transfer fees, returned check fees, pay-by-phone fees, and fees forbalance transfers or other promotional checks that are returned by us due to insufficient credit availability.
For most consumer cards we use the two-cycle billing method for determining periodic finance charges.This means if a cardmember begins a billing cycle with no outstanding balance, makes purchases or othertransactions and then does not pay the outstanding balance in full by the payment due date, we impose financecharges beginning on the date transactions were posted to the account.
Terms and conditions may vary for other products, such as the Discover Business Card, Discover MotivaCard and our U.K. cards.
Payments and Merchant Relationships
Merchant Relationships
We support our growing base of merchants through a merchant acquiring model that includes directrelationships with the largest merchants in the United States and outsourced arrangements with our merchantacquiring partners for small and mid-size merchants.
We have chosen to retain direct relationships with most of our largest merchant accounts because manyprefer dealing with us directly, we are able to retain the entire discount revenue from the merchant and we areable to capitalize on joint marketing programs and opportunities. Competitor networks and credit card companiestypically do not enjoy direct relationships with merchants.
Since mid-2006, Discover Network has worked with merchant acquirers to allow them to begin offering acomprehensive payments processing package for small and mid-size merchants that includes consolidatedservicing for Discover, Visa and MasterCard transactions. Integrated payments solutions provide these merchantswith streamlined statementing and customer service. In some cases, Discover has sold and will continue to sellsmall and mid-size merchant acquiring portfolios to third-party acquirers to facilitate integrated servicing andreduced costs. As we outsource merchant acquiring, we expect to reduce our fee income and expenses.
In addition to our U.S.-based merchant acceptance locations, Discover Network cards are also accepted(through relationships with in-country banks and processors) at many locations in Canada, Mexico and theCaribbean. Also, over the past two years we have signed reciprocal network agreements with China UnionPayand JCB that enable our cardmembers to use their Discover Network cards in China and, eventually, in Japan.
Networks and Merchant Operations
Account Governance, Regulations and Specifications
The terms of our merchant relationships are governed by a Merchant Services Agreement (MSA). TheseMSAs also provide additional program documents that further define our network functionality andrequirements, including operating regulations, technical specifications and dispute rules. To enable ongoingimprovements in our network’s functionality and in accordance with industry convention, we publish updates toour program documents on a semi-annual basis. In a growing number of cases, particularly with small andmid-size merchants, the agreement will be between the merchant and a merchant acquirer, and not with Discoverdirectly.
New Accounts
To facilitate growth in merchant acceptance, Discover Network offers prospective merchants several optionsin applying for an account. Merchants may be acquired through one of our many partnerships or may apply
112

directly by either calling our toll-free number or submitting an application through our website. Direct merchantapplications are processed electronically by our systems, which perform a credit evaluation and screenapplications against files of unacceptable businesses. The Office of Foreign Asset Control SpecificallyDesignated Nationals list is included in this screening process. Any applications that cannot be systematicallyapproved are referred for analyst review.
Transaction Processing
Discover Network partners with a number of vendors to maintain our secure and highly redundantconnectivity that enables continuous support of POS authorizations. This connectivity also enables merchants toreceive timely payment for their Discover Network card transactions.
Risk Management, Fraud Prevention and Compliance
Discover Network operates systems and processes that seek to prevent fraud and ensure compliance withour operating regulations. Our systems evaluate incoming merchant sales activity to identify abnormalities thatrequire investigation prior to the initiation of settlement. Risk Management personnel are responsible forvalidating compliance with our operating regulations and law, including enforcing our data security standardsand our prohibitions against Internet gambling and other illegal or otherwise unacceptable activities. DiscoverNetwork is a founding and current member of the PCI Security Standards Council, LLC, and requires merchantsand service providers to comply with the Payment Card Industry Data Security Standard.
Third-Party Payments/PULSE EFT Association
Third-Party Payments Business
In October 2004, the U.S. Supreme Court declined to consider the appeal by Visa and MasterCard of a courtruling that would end years of anticompetitive practices that had effectively prevented us from offering ourelectronic payment products and services to other financial institutions. As a result of this ruling, third-partyfinancial institutions are now able to issue debit and credit cards and other card products on the Discover orPULSE Networks.
Following this ruling, we have signed third-party issuing/distribution agreements for credit, debit andprepaid cards, including agreements with GE Money (to issue Wal-Mart and SAM’S CLUB Discover Networkcards), HSBC, and a number of other financial institutions for issuance of card products on the DiscoverNetwork.
PULSE EFT Association
In January 2005, we strengthened our payment processing capabilities through the acquisition of PULSEEFT Association, one of the nation’s leading ATM/debit networks. PULSE links cardholders of more than4,400 financial institutions with nearly 260,000 ATMs as well as POS terminals located throughout the UnitedStates.
PULSE’s primary source of revenue is transaction fees charged for switching and settling ATM, PIN POS,and signature debit transactions initiated through the use of debit cards issued by participating financialinstitutions. In addition, PULSE offers a variety of optional products and services that produce income for thenetwork, including signature debit processing, prepaid card processing, and connections to other regional andnational electronic funds transfer networks.
International Card Business
In 1999, we launched our international card issuing business in the United Kingdom, the world’s secondlargest credit card market. Our U.K. business is focused primarily on rewards-based offerings. Our model has
113

been to establish local resources and capabilities in all functions, but leverage our capabilities and scale in theUnited States by actively transferring skills, applications and best practices to the U.K. market. For example, ourbusiness has an operations center in Scotland that performs all key customer service and collections functionswith its own technology platform tailored for international markets, but processing is conducted in the UnitedStates. The recent migration of technology and risk systems in-house to the United States and away from anoutsourced local provider has substantially reduced the cost per account. We expect to become more efficientduring the course of 2007 as we migrate the Goldfish and Liverpool Victoria businesses (discussed below) to thisplatform as well. We do expect, however, to continue to have a moderately higher cost structure than some of ourcompetitors due to their larger scale. Given the widespread acceptance of MasterCard and Visa in Europe, wecurrently issue our U.K. cards on the MasterCard network and recently became a member of Visa Europe.
In 2006, Discover made two acquisitions: the Goldfish credit card business from Lloyds TSB Bank Plc andseveral card portfolios from Liverpool Victoria Banking Services Limited (“Liverpool Victoria”). The Goldfishbusiness now forms part of our international business, providing us with a strong brand, and the LiverpoolVictoria portfolios supplement our existing affinity programs. Goldfish customers earn points based on spendthat can be redeemed for vouchers at many of the leading retailers in the United Kingdom.
Our Morgan Stanley Platinum Card has a Cashback Bonus program similar to the program offered in theUnited States. We also offer the buy and fly! MasterCard that has a travel rewards program. A newer product isi24, our fee-based card targeted to a more affluent customer base and providing services such as concierge andtravel insurance in addition to cash rewards.
We plan to migrate customers away from the Morgan Stanley brand over a transition period of up to threeyears and we expect our primary brand going forward to be Goldfish as well as other affinity brands.
Our financial performance in the United Kingdom has been adversely affected by market conditions such ashigh delinquencies and rising bankruptcy levels, compounded by changing regulations. In order to improveprofitability, we are changing our credit and collections strategies and pricing; operations; and pricing andrewards optimization.
Competition
We compete with other card issuers and networks on the basis of a number of factors, including: merchantacceptance, products and services, incentives and reward programs, brand, network, reputation and pricing. Manyof our competitors are well established and financially strong, have greater financial resources than we do, arelarger than us and/or have lower capital costs and operating costs than we have and expect to have.
As a credit card issuer, we compete for accounts and utilization with cards issued by other financialinstitutions (including American Express, Bank of America/MBNA, Chase and Citigroup, as well as third-partyissuers on the Discover Network) and, to a lesser extent, businesses that issue their own private label cards orotherwise extend credit to their customers. There has been a trend toward consolidation among credit cardissuers, leading to greater concentration of resources. Credit card industry participants have increasingly usedadvertising, targeted marketing, account acquisitions and pricing competition in interest rates, annual fees,reward programs and low-priced balance transfer programs to attract and retain cardholders and increase cardusage. In addition, because most domestically issued credit cards, other than those issued on the AmericanExpress network, are issued on the Visa and MasterCard networks, most other card issuers benefit from thedominant position and marketing and pricing power of Visa and MasterCard. See “Risk Factors—We facecompetition from other credit card issuers, and we may not be able to compete effectively, which could result infewer customers and lower account balances and could materially adversely affect our financial condition, cashflows and results of operations” and “Risk Factors—We incur considerable expenses in competing with othercredit card issuers, and many of our competitors have greater scale, which may place us at a competitivedisadvantage.”
114

In the United Kingdom, we issue credit cards on the MasterCard Network and recently became a member ofVisa Europe. We compete for accounts and utilization with cards issued by other financial institutions (includingAmerican Express, Bank of America/MBNA, Barclays, Capital One, Halifax Bank of Scotland and Royal Bankof Scotland). As in the United States, credit card issuers in the United Kingdom have used advertising, targetedmarketing, pricing competition in interest rates, reward programs and low-priced balance transfer programs toattract and retain cardholders and increase card usage.
In our third-party payments business, we compete with other networks to attract third-party issuers to issuecredit, debit and prepaid cards and other card products on the Discover and PULSE Networks. DiscoverNetwork’s primary competitors are Visa, MasterCard and American Express, and PULSE Network’s competitorsinclude Visa’s Interlink, Star, NYCE, Co-op and Maestro. The former exclusionary rules of Visa and MasterCardlimited our ability to attract merchants and credit and debit card issuers, and the impact of those rules continuesto harm us. In addition, Visa and MasterCard have entered into long-term arrangements with many financialinstitutions that may have the effect of preventing them from issuing credit or debit cards on the Discover orPULSE Networks. See “Risk Factors—We face competition from other operators of payment networks, and wemay not be able to compete effectively, which could result in reduced transaction volume, limited merchantacceptance of our cards, limited issuance of cards on our network by third parties and materially reducedearnings.”
Employees
As of February 28, 2007, we employed approximately 14,000 individuals, including approximately1,000 employees of Morgan Stanley in the United Kingdom who will become Discover employees in connectionwith the distribution. We believe our employee relations are good.
Properties
As of February 28, 2007, we owned seven principal properties in the United States. Our headquarters inRiverwoods, Illinois, consists of approximately 1.2 million square feet and the remaining six propertiesencompass in the aggregate approximately 1 million square feet. We also lease five principal properties,including our London headquarters where we share space held by Morgan Stanley on a lease. See “ArrangementsBetween Us and Morgan Stanley.” We believe that our facilities are sufficient to meet our current and projectedneeds.
Legal Proceedings
In the normal course of business, we have been named, from time to time, as a defendant in various legalactions, including arbitrations, class actions and other litigation, arising in connection with our activities. Certainof the actual or threatened legal actions include claims for substantial compensatory and/or punitive damages orclaims for indeterminate amounts of damages. We have historically relied on the arbitration clause in ourcardmember agreements which has limited the costs of, and our exposure to, litigation. We are also involved,from time to time, in other reviews, investigations and proceedings (both formal and informal) by governmentalagencies regarding our business, including, among other matters, accounting and operational matters, some ofwhich may result in adverse judgments, settlements, fines, penalties, injunctions or other relief. Litigation andregulatory actions could also adversely affect our reputation.
We contest liability and/or the amount of damages as appropriate in each pending matter. In view of theinherent difficulty of predicting the outcome of such matters, particularly in cases where claimants seeksubstantial or indeterminate damages or where investigations and proceedings are in the early stages, we cannotpredict with certainty the loss or range of loss, if any, related to such matters, how such matters will be resolved,when they will ultimately be resolved, or what the eventual settlement, fine, penalty or other relief, if any, mightbe. Subject to the foregoing, we believe, based on current knowledge and after consultation with counsel, that the
115
outcome of the pending matters will not have a material adverse effect on our financial condition, although theoutcome of such matters could be material to our operating results and cash flows for a particular future period,depending on, among other things, our level of income for such period.
Regulatory Matters
Discover’s operations are subject to regulation by U.S. federal, state and foreign laws and regulations.
Bank Regulation
Banking Subsidiaries. Discover operates two banking subsidiaries in the United States and is in the processof establishing a banking subsidiary in the United Kingdom. In the United States, Discover Bank offers a widevariety of products, but does not offer commercial loans other than business credit cards. Discover Bank offerscredit card loans, home loans, and personal loans, as well as checking accounts, certificates of deposit and moneymarket accounts. Discover Bank is chartered and regulated by the Office of the Delaware State BankCommissioner (the “Delaware Commissioner”) and the FDIC, which insures its deposits and serves as the bank’sfederal banking regulator. Discover Bank is considered to be a “bank” for purposes of the Bank HoldingCompany Act of 1956, as amended (“BHCA”), a federal statute that requires companies controlling banks toregister with the Board of Governors of the Federal Reserve System (the “Federal Reserve”). However, Discoveris not regulated by the Federal Reserve as a bank holding company pursuant to a grandfather provision that limitsFederal Reserve oversight of certain companies that meet specific statutory criteria. Discover’s grandfathered-status would be forfeited and Discover would be required to register as a bank holding company if, among otherthings, Discover Bank engages in commercial lending at the same time that it accepts demand deposits, or issubject to a change in control under federal banking law or if Discover acquires more than five percent of theshares or assets of another bank or savings association, other than in certain limited circumstances. We have nocurrent intention of engaging in activities that would require us to register as a bank holding company.
Bank of New Castle is a limited purpose credit card bank, chartered and regulated by the DelawareCommissioner and the FDIC, which also insures its deposits. Ownership of Bank of New Castle does not subjectDiscover to ongoing holding company regulation by the Delaware Commissioner or the FDIC, and Discover isnot regulated by the Federal Reserve as a bank holding company, as long as the activities of Bank of New Castleare limited to credit card operations.
Following completion of the distribution, we currently expect that we will continue to be able to rely uponthis exemption. However, business initiatives or strategic decisions we take following the distribution couldresult in our becoming a bank holding company subject to regulation by the Federal Reserve. Additionally, riskof Congressional activity to regulate holding companies such as Discover that own depository institutions but arenot regulated at the holding company level could have a negative impact on our business, resulting in additionalcomplexity and expense.
Acquisition of Control. Because Discover Bank and Bank of New Castle are each insured depositoryinstitutions, certain acquisitions of the voting stock of Discover may be subject to regulatory approval or noticeunder U.S. federal or Delaware law. Investors are responsible for ensuring that they do not, directly or indirectly,acquire shares of stock of Discover in excess of the amount which can be acquired without regulatory approvalunder the Change in Bank Control Act, the BHCA, and the Delaware Change in Bank Control provisions, whichprohibit any person or company from acquiring control of Discover without, in most cases, the prior writtenapproval of each of the FDIC, the Federal Reserve and the Delaware Commissioner.
FDIC Requirements Applicable to Discover’s U.S. Banking Subsidiaries. The FDIA imposes variousrequirements on insured depository institutions. For example, the FDIA requires, among other things, the federalbanking agencies to take “prompt corrective action” in respect of depository institutions that do not meetminimum capital requirements. The FDIA sets forth the following five capital tiers: “well-capitalized,”
116
“adequately capitalized,” “undercapitalized,” “significantly undercapitalized” and “critically undercapitalized.”A depository institution’s capital tier will depend upon how its capital levels compare with various relevantcapital measures and certain other factors that are established by regulation. At February 28, 2007, DiscoverBank and Bank of New Castle met all applicable requirements to be deemed “well-capitalized.” Recentregulations proposed by the U.S. bank regulators referred to as the Basel II and Basel IA proposals could alter thecapital adequacy framework for participating banking organizations. Discover will continue to closely monitordevelopments on these matters and assess their impact on Discover and its banking subsidiaries.
The FDIA also prohibits any depository institution from making any capital distributions (includingpayment of a dividend) or paying any management fee to its parent holding company if the depository institutionwould thereafter be “undercapitalized.” “Undercapitalized” institutions are subject to growth limitations and arerequired to submit a capital restoration plan. For a capital restoration plan to be acceptable, among other things,the depository institution’s parent holding company must guarantee that the institution will comply with suchcapital restoration plan.
If a depository institution fails to submit an acceptable plan, it is treated as if it is “significantlyundercapitalized.” “Significantly undercapitalized” depository institutions may be subject to a number ofrequirements and restrictions, including orders to sell sufficient voting stock to become “adequately capitalized,”requirements to reduce total assets, and cessation of receipt of deposits from correspondent banks. “Criticallyundercapitalized” institutions are subject to the appointment of a receiver or conservator.
Each of Discover’s U.S. banking subsidiaries may also be held liable by the FDIC for any loss incurred, orreasonably expected to be incurred, due to the default of the other U.S. banking subsidiary and for any assistanceprovided by the FDIC to the other U.S. banking subsidiary that is in danger of default.
The FDIA prohibits a bank from accepting brokered deposits or offering interest rates on any depositssignificantly higher than the prevailing rate in its normal market area or nationally (depending upon where thedeposits are solicited), unless (1) it is well-capitalized or (2) it is adequately capitalized and receives a waiverfrom the FDIC. A bank that is adequately capitalized and that accepts brokered deposits under a waiver from theFDIC may not pay an interest rate on any deposit in excess of 75 basis points over certain prevailing marketrates. There are no such restrictions on a bank that is well-capitalized. As of February 28, 2007, Discover Bankand Bank of New Castle each met the FDIC’s definition of a well-capitalized institution for purposes ofaccepting brokered deposits. An inability to accept brokered deposits in the future could materially adverselyimpact funding costs. Under the regulatory definition of brokered deposits, as of February 28, 2007, DiscoverBank had brokered deposits of $12.6 billion and Bank of New Castle had no brokered deposits.
The FDIA also affords FDIC-insured depository institutions, such as Discover Bank and Bank of NewCastle, the ability to “export” favorable interest rates permitted under the laws of the state where the bank islocated. Discover Bank and Bank of New Castle are both located in Delaware and, therefore, charge interest onloans to out of state borrowers at rates permitted under Delaware law, regardless of the usury limitations imposedby the state laws of the borrower’s residence. Delaware law does not limit the amount of interest that may becharged on loans of the type offered by Discover Bank or Bank of New Castle. This flexibility facilitates thecurrent nationwide lending activities of Discover Bank and Bank of New Castle. Legislation recently enacted byCongress that establishes a ceiling on the annual percentage rate of interest that can be imposed on consumercredit extended to covered members of the armed forces or their dependents may require changes in the lendingagreements and practices of Discover Bank and Bank of New Castle.
U.S. Credit Card Regulation
The relationship between Discover and its U.S. customers is regulated extensively under federal and stateconsumer protection laws. Federal laws include the Truth in Lending Act, the Equal Credit Opportunity Act, theFair Credit Reporting Act, and the Gramm-Leach-Bliley Act. Moreover, our U.S. banking subsidiaries are
117
subject to the Servicemembers Civil Relief Act, which protects persons called to active military service and theirdependents from undue hardship resulting from their military service. The Servicemembers Civil Relief Actapplies to all debts incurred prior to the commencement of active duty (including credit card and other open-enddebt) and limits the amount of interest, including service and renewal charges and any other fees or charges(other than bona fide insurance) that is related to the obligation or liability. These and other federal laws, amongother things, require disclosures of the cost of credit, provide substantive consumer rights, prohibit discriminationin credit transactions, regulate the use of credit report information, provide financial privacy protections, requiresafe and sound banking operations, and prohibit unfair and deceptive trade practices. State, and in some caseslocal, laws also may regulate in these areas as well as provide additional consumer protections.
Violations of applicable consumer protection laws can result in significant potential liability in litigation bycustomers, including civil money penalties, actual damages, restitution and attorneys’ fees. Federal bankingregulators, as well as state attorneys general and other state and local consumer protection agencies, also mayseek to enforce consumer protection requirements and obtain these and other remedies.
Members of Congress are currently holding hearings on certain practices in the credit card industry,including those relating to grace periods, two-cycle billing method (which we utilize on most of our products),interest rates and fees. It is not clear at this time whether new limitations on credit card practices or new requireddisclosures will be adopted by Congress or at the state level and, if adopted, what impact any new limitationswould have on Discover. See “Risk Factors—Changes in regulations, or the application thereof, may adverselyaffect our business, financial condition and results of operations.”
Anti-Money Laundering
Our Anti-Money Laundering (AML) Program is coordinated and implemented on an enterprise-wide basis.In the United States, for example, the USA PATRIOT Act of 2001 imposes significant obligations to determoney laundering and terrorist financing activity, identify customers, report suspicious activity to appropriateauthorities, adopt an AML program that includes policies, procedures and internal controls, provide employeeswith AML training, designate an AML compliance officer and undergo an annual, independent audit to assess theeffectiveness of its AML program. Outside the United States, designated types of financial institutions aresubject to similar AML requirements. Discover has established appropriate policies, procedures and internalcontrols that are designed to comply with these AML requirements.
Activities in the United Kingdom
We intend to conduct our U.K. credit card business through a new bank, which has submitted an applicationto the Financial Services Authority (“FSA”) and which will be subject to supervision by the FSA in relation to,among other matters, capital adequacy, non-investment insurance mediation activities, anti-money launderingand deposit taking. The bank’s deposit taking and insurance mediation activities will be supervised by the FSAand its consumer credit activities will be regulated by the Office of Fair Trading.
The relationship between the U.K. bank and its U.K. customers is regulated extensively under consumerprotection laws. These include the Consumer Credit Act, the Data Protection Act and the Unfair Terms inConsumer Contracts Regulations. The bank is also governed by two key self-regulatory codes of practice—theBanking Code and the British Code of Advertising, Sales Promotion and Direct Marketing. These and other lawsand regulations, among other things, regulate the content of credit advertisements and credit agreements, providesubstantive consumer rights, regulate the use of customer data, and provide enforcement powers to regulatoryauthorities in relation to unfair and deceptive trade practices.
Violations of applicable consumer protection laws may result in the bank not being able to enforce creditagreements against cardmembers, potential civil liability in litigation by customers, and enforcement action bythe regulatory authorities.
118

During the last three years there have been increasing regulatory initiatives with respect to late and overlimitfees, interchange fees and the sale of retail insurance products, a relaxation of bankruptcy laws and an increase inindustry-wide consumer protection measures. For instance, in May 2006, Office of Fair Trading actions resultedin an industry-wide reduction of late, overlimit and insufficient funds fees. As a result, we reduced the fees in ourU.K. business from £20 to £12. We expect future regulatory measures will continue to increase our compliancecosts and the risk of consumer complaints, litigation and regulatory inquiries, as well as materially impact theeconomics of our business.
Electronic Funds Networks
Discover operates the Discover and PULSE Networks, which deliver switching and settlement services tofinancial institutions and other program participants for a variety of ATM, POS and other electronic bankingtransactions. These operations are regulated by certain state and federal banking, privacy and data security laws.Moreover, the Discover and PULSE Networks are subject to examination by the Federal Financial InstitutionsExamination Council, an interagency body composed of the federal bank and thrift regulators and the NationalCredit Union Association. Changes in existing federal or state regulation could increase the cost or risk ofproviding network services, change the competitive environment, or otherwise materially adversely affect ouroperations. The legal environment regarding privacy and data security is particularly dynamic, and any disclosureof confidential customer information could have a material adverse impact on our business, including loss ofconsumer confidence.
Company Information
We were incorporated in Delaware in 1960. Our principal executive offices are located at 2500 Lake CookRoad, Riverwoods, Illinois 60015. Our main telephone number is (224) 405-0900.
119

ARRANGEMENTS BETWEEN US ANDMORGAN STANLEY
We have provided below a summary description of the Separation and Distribution Agreement and the keyrelated agreements. This description, which summarizes the material terms of these agreements, is qualified byreference to the full text of the Separation and Distribution Agreement, Transition Services Agreement, U.S.Employee Matters Agreement, U.S. Tax Sharing Agreement and Transitional Trade Mark Licence Agreement,which have been filed with the SEC as exhibits to the registration statement into which this information statementis incorporated. The terms of these agreements have not yet been finalized; changes, some of which may bematerial, may be made prior to the distribution.
General
Immediately prior to the distribution, we will be a wholly-owned subsidiary of Morgan Stanley. After thedistribution, Morgan Stanley will not have any ownership interest in our common stock, and we will be anindependent, publicly traded company.
We will enter into agreements with Morgan Stanley prior to the distribution to govern the terms of thedistribution and to define our ongoing relationship following the distribution, allocating responsibility forobligations arising before and after the distribution, including obligations with respect to liabilities relating toMorgan Stanley’s business and to Discover’s business and obligations with respect to our employees, certaintransition services and taxes. We will enter into these agreements with Morgan Stanley while we are still awholly-owned subsidiary of Morgan Stanley and certain terms of these agreements are not necessarily the sameas could have been obtained from an independent third party.
Separation and Distribution Agreement
The separation and distribution agreement will provide, among other things, for the principal corporatetransactions required to effect the distribution of our common stock to the holders of record of Morgan Stanleycommon stock and certain other agreements governing our relationship with Morgan Stanley after thedistribution. Set forth below are certain provisions expected to be included in the separation and distributionagreement. In addition to the separation and distribution agreement, the parties also expect to enter into certainancillary agreements, including those described below.
Prior to the Distribution. The separation and distribution agreement is expected to provide that, on or priorto the distribution, the parties will take certain actions, including:
• Morgan Stanley and Discover will use reasonable efforts to settle intercompany receivables, payablesand other balances and terminate the other party’s obligations under each party’s financial instruments;
• Each individual who is an officer, director or employee of both Morgan Stanley and Discover willresign, effective as of the distribution, all of his or her positions from one of the parties;
• Morgan Stanley and Discover will use commercially reasonable efforts to obtain approvals andconsents that are reasonably necessary or advisable to consummate the transactions contemplated bythe separation and distribution agreement;
• Discover will declare a cash dividend to Morgan Stanley to the extent that Discover’s balance sheetcapital exceeds the amount that is determined to be necessary as of the distribution date, based onMorgan Stanley’s and Discover’s views (which will take into consideration, among other things, theamount of managed credit card receivables, deferred tax assets and intangible assets of Discover) ofunderlying business risks, regulatory requirements and rating agency views; and
• Discover will declare a special dividend to Morgan Stanley in the amount of the first $700 million ofvalue of cash or non-cash proceeds, after expenses, from the successful resolution of the Visa andMasterCard litigation (increased at the rate of 6% per annum until paid in full) (the “minimumproceeds”), plus 50% of any proceeds in excess of $1.5 billion, subject to certain limitations
120

and a maximum potential payment to Morgan Stanley of $1.5 billion. All payments by Discover toMorgan Stanley will be net of taxes payable by Discover with respect to such proceeds. If, inconnection with or following a change of control of Discover, the litigation is settled for an amount lessthan the minimum proceeds, Discover will be required to pay Morgan Stanley an amount equal to theminimum proceeds.
Conditions Precedent to the Distribution. The distribution will be subject to the satisfaction (or waiver byMorgan Stanley in its discretion) of certain conditions, including:
• the Morgan Stanley board of directors shall be satisfied that the distribution will be made out of surpluswithin the meaning of Section 170 of the Delaware General Corporation Law;
• Discover shall have declared the dividend relating to the excess capital described above;
• Discover shall have declared a special dividend to Morgan Stanley in the amount of the minimumproceeds, plus 50% of any proceeds in excess of $1.5 billion, subject to certain limitations and amaximum potential payment to Morgan Stanley of $1.5 billion. All payments by Discover to MorganStanley will be net of taxes payable by Discover with respect to such proceeds. If, in connection withor following a change of control of Discover, the litigation is settled for an amount less than theminimum proceeds, Discover will be required to pay Morgan Stanley an amount equal to the minimumproceeds;
• the restructuring transactions contemplated by the separation and distribution agreement shall havebeen consummated;
• no stop order suspending the effectiveness of the registration statement of which this informationstatement is a part shall be in effect, and no proceedings for such purpose shall be pending before orthreatened by the SEC;
• all actions and filings necessary or appropriate under applicable federal, state or foreign securities or“blue sky” laws shall have been taken and, where applicable, become effective or been accepted;
• the shares of Discover common stock to be delivered in the distribution shall have been approved forlisting on the New York Stock Exchange, subject to official notice of issuance;
• the Discover board of directors shall have been duly elected, and the amended and restated certificateof incorporation and bylaws of Discover, in substantially the form attached as exhibits to theregistration statement of which this information statement is a part shall be in effect;
• each of the ancillary agreements contemplated by the separation and distribution agreement shall havebeen entered into;
• Morgan Stanley shall have received a tax ruling and/or an opinion of counsel, in each case reasonablysatisfactory to Morgan Stanley, to the effect that the distribution will be tax-free to Morgan Stanleystockholders for U.S. federal income tax purposes;
• no applicable law shall have been adopted, promulgated or issued that prohibit the consummation ofthe distribution and the other transactions contemplated by the separation and distribution agreement;
• all material governmental and third party approvals and consents necessary to effect the distributionshall have been obtained;
• Discover shall have received credit ratings from the rating agencies that are satisfactory to MorganStanley; and
• no event or development shall have occurred or exist that, in the judgment of the Morgan Stanley boardof directors, in its sole discretion, makes it inadvisable to effect the distribution or the othertransactions contemplated by the separation and distribution agreement.
121

These conditions will be for the sole benefit of Morgan Stanley and will not in any way limit MorganStanley’s rights to abandon the distribution and/or terminate the separation and distribution agreement prior tothe distribution.
No Representations and Warranties. Except as otherwise agreed, we will take all of the business, assets andliabilities transferred to or assumed by us pursuant to the separation and distribution agreement or other ancillaryagreements on an “as is, where is” basis without any representations or warranties by Morgan Stanley.
Access to Information; Retention of Records. For a period of six years after the distribution date, we andMorgan Stanley will afford the other party and its agents reasonable access during normal business hours to suchparty’s books and records, employees and auditors to the extent necessary in connection with any audit,investigation, dispute or litigation of the other party, provided that such access does not unreasonably interferewith the conduct of the business of the party providing such access, and that in the event any party reasonablydetermines that affording such access to the other party would violate any applicable law or agreement to whichsuch party is a party, or waive attorney-client privilege applicable to such party, the parties shall use reasonableefforts to permit the compliance with such request in a manner that avoids any such harm or consequence. Inaddition, to the extent reasonably required in connection with any litigation relating to the other party’s businessor operations prior to the distribution, we and Morgan Stanley will cooperate and make available to the otherparty our directors, officers, employees and representatives as witnesses. In each case of the foregoing, we orMorgan Stanley, as applicable, will be reimbursed by the other party for all out-of-pocket costs and expensesincurred in providing such access, information, witnesses or cooperation.
Except as otherwise required by law or agreed to in writing, we and Morgan Stanley will retain any and allinformation in each party’s possession relating to the other party’s business and operations in accordance withsuch party’s own retention practice. We and Morgan Stanley will agree to not destroy or dispose of any suchinformation without providing prior notice to the other party, and, subject to certain exceptions, return suchinformation to the other party if requested.
Confidentiality; Privileged Information. The separation and distribution agreement is expected to includecustomary confidentiality provisions pursuant to which we and Morgan Stanley will keep confidential allconfidential information of the other party, subject to certain exceptions. In addition, the parties will agree tomaintain and protect any privileged claim to the information in each party’s possession that relates to the otherparty.
Indemnification. The separation and distribution agreement is expected to contain the followingindemnification provisions. We will indemnify Morgan Stanley and its directors, officers, employees andaffiliates from and against any and all losses arising out of or in connection with (i) any liabilities relating to theDiscover business or operations or assets, whether arising before, on or after the distribution or relating to factsoccurring before, on or after the distribution, or our failure to pay, perform or otherwise discharge any suchliabilities, (ii) any of our financial instruments, and (iii) any breach by us of the separation and distributionagreement. Morgan Stanley will indemnify us and our directors, officers, employees and affiliates from andagainst any and all losses arising out of or in connection with (i) any liabilities relating to the Morgan Stanleybusiness or operations or assets (except those relating to Discover), whether arising before, on or after thedistribution or relating to facts occurring before, on or after the distribution, or its failure to pay, perform orotherwise discharge any such liabilities, (ii) any of Morgan Stanley’s financial instruments, and (iii) any breachby Morgan Stanley of the separation and distribution agreement.
In addition, except as provided in the immediately succeeding sentence, we will indemnify Morgan Stanleyfrom and against any and all losses caused by any untrue statement or alleged untrue statement of a material factcontained in the registration statement or information statement (including any amendments or supplementsthereto) or any omission or alleged omission to state therein a material fact necessary to make the statementstherein, in the light of the circumstances under which they were made, not misleading. Morgan Stanley will
122

indemnify us from and against any and all losses caused by any such untrue statement or omission or allegeduntrue statement or omission arising out of information furnished to us in writing by Morgan Stanley expresslyfor use in the registration statement or information statement.
Expenses. Except as otherwise provided in the separation and distribution agreement or other ancillaryagreements, we and Morgan Stanley will bear each party’s own costs and expenses in connection with thedistribution and the related transactions.
Termination. At any time prior to the distribution, Morgan Stanley may in its sole discretion terminate theseparation and distribution agreement and/or abandon the distribution, and neither party nor any of its directorsor officers will have any liability or further obligation to the other party.
Transition Services Agreement
We will enter into a transition services agreement with Morgan Stanley pursuant to which Morgan Stanleyand Discover will provide each other with a variety of services for a period of time, generally expected not toexceed 18 months, following the distribution. Services to be provided by Morgan Stanley and Discover, directlyor indirectly through their respective subsidiaries or subcontractors, will include services in the areas of humanresources, information technology, accounting, office space leasing, corporate services and treasury. It isexpected that compensation for transition services that are not marketed to third parties will be determined usingan internal cost allocation methodology based on fully loaded cost (e.g., including an allocation of corporateoverhead) or, in certain cases, on arm’s-length terms. Upon a sale or other disposition of any party’s business,assets or properties (or portion thereof), the other party’s obligation to provide any service in respect of suchdisposed business, assets or properties will terminate. Similarly, if any party acquires business, assets orproperties or rights in respect of the foregoing, the other party will have no obligation to provide any services inrespect of such acquired business, assets or properties.
The transition services agreement will provide that any service may be terminated (i) by the servicerecipient upon advance notice to the service provider or (ii) by either party if the other party has breached itsobligations under the agreement relating to the service and has not cured the breach within a specified period oftime. In addition, at any time following the announcement of a transaction involving a change of control of oneparty, the other party may elect to terminate any and all services it provides, provided that no service will beterminated prior to the closing of the change of control transaction unless agreed to by the service recipient.Either party will be able to terminate the transition services agreement if the other party becomes insolvent.
In general, neither we nor Morgan Stanley will be liable to the other party in connection with any serviceprovided under the transition services agreement except in the case of gross negligence or willful misconduct.
Employee Matters Agreements
We will enter into employee matters agreements with Morgan Stanley providing for our respectiveobligations to employees and former employees who are or were associated with Discover (including employeeswho transfer employment from Morgan Stanley to Discover prior to the distribution), and for other employmentand employee benefits matters.
U.S. Employee Matters Agreement
Under the terms of the U.S. employee matters agreement, Discover generally will assume all liabilitiesand assets relating to employee benefits for current and former Discover employees, and Morgan Stanleygenerally will retain all liabilities and assets relating to employee benefits for current and former MorganStanley employees.
On or about the distribution date, sponsorship of Morgan Stanley U.S. benefit plans that cover solelycurrent and former Discover employees will be transferred to Discover, and Morgan Stanley U.S. benefitplans that cover current and former Discover employees and that also cover current and former Morgan
123

Stanley employees will be split into two separate plans, one covering Morgan Stanley employees and onecovering Discover employees, and sponsorship of the plans covering Discover employees will be transferredto Discover, in each case except as otherwise provided in the agreement. For transferred plans that arefunded, assets allocable to the liabilities of such plans also will be transferred to related trusts established byDiscover. Current and former Morgan Stanley and Discover employees will receive credit for service for allperiods of employment with Morgan Stanley and Discover, as applicable, prior to the distribution date, forpurposes of vesting, eligibility and benefit levels under any pension or welfare plan in which theyparticipate after the consummation of the transaction (other than under the supplemental executiveretirement plan and the excess benefit plan to which participation has been closed).
U.K. Employee Matters Agreement
Under the terms of the U.K. employee matters agreement, Discover generally will retain liabilityrelating to current and former Discover employees and Morgan Stanley will retain liabilities relating tocurrent and former Morgan Stanley employees.
No U.K. benefit plans will be split or transferred between Morgan Stanley and Discover.
On or about the distribution date, current Discover employees will cease to be entitled to participate inMorgan Stanley benefit plans in the United Kingdom and will be entitled to participate in newly establishedDiscover benefit plans, being granted credit for all periods of service with Discover and Morgan Stanley inrelation to any benefit plans in which they participate at Discover after the consummation of the transaction.
Morgan Stanley will administer certain of Discover’s benefit programs for a transitional period under theterms of the transition services agreement.
The employee matters agreements also provide for sharing of certain employee and former employeeinformation to enable Discover and Morgan Stanley to comply with their respective obligations.
In addition, the employee matters agreements provide that following the distribution, holders of MorganStanley restricted stock units (RSUs) and options who are active employees of Discover at the time ofdistribution will have their Morgan Stanley RSUs and options converted into newly-issued Discover RSUs andoptions pursuant to a formula that is intended to preserve the “intrinsic” value of their pre-distribution RSUs andoptions. Please refer to “The Distribution—Treatment of Employee Stock Options and Restricted Stock Units”for further discussion of such formula and the treatment of other holders’ Morgan Stanley RSUs and options.
Intercompany Funding Arrangements
Morgan Stanley has historically provided financing to us, including by means of guaranteeing indebtedness,and has agreed to continue to provide such financing to us, if needed, for a transitional period after thedistribution, until such time as we are able to replace such financing with third-party financing. Such post-distribution intercompany funding from Morgan Stanley (or its subsidiaries) would have a term that notexceeding 12 months, bear an arm’s-length rate of interest and otherwise have arm’s-length commerciallyreasonable terms for financing of this type. We expect to be able to refinance our borrowings and terminate anyguarantees from Morgan Stanley and its subsidiaries promptly, and in any event within 12 months, after thedistribution.
In connection with the distribution, we will also enter into an unsecured committed credit facility, currentlyestimated to be for a total of at least $1.75 billion, to provide us with additional liquidity if required in connectionwith our business. The lead arrangers on this credit facility will be unrelated financial institutions, who willsyndicate the commitments under the credit facility. Morgan Stanley or a subsidiary may participate in thesyndicate on the same terms and conditions as other members of the syndicate. Such terms and conditions will benegotiated at arm’s-length by the lead arrangers on behalf of the syndicate, and will be customary commercial
124

terms used in the lending business. The maximum term for any loan that will be outstanding under this creditfacility is 59 months.
Tax Sharing Agreements
We will enter into a U.S. tax sharing agreement with Morgan Stanley setting forth the rights and obligationsof Morgan Stanley and us with respect to taxes (other than certain U.K. taxes which, as described below, will begoverned by a separate U.K. tax sharing agreement). Under the terms of the U.S. tax sharing agreement, we andMorgan Stanley generally will be liable for taxes imposed on our respective businesses for taxable periodsending on or before the close of business on the distribution date, which we refer to as “Pre-Distribution Taxes.”The portion of any Pre-Distribution Taxes determined on a consolidated, combined or unitary basis that isattributable to us or any member of our taxable group (as such taxable group will exist immediately after thedistribution) will be determined as if our taxable group were a taxable group separate from Morgan Stanley’staxable group prior to the distribution.
Furthermore, under the U.S. tax sharing agreement, Morgan Stanley will prepare and file the consolidatedfederal and applicable consolidated, combined or unitary state, local and foreign income tax returns (other thanreturns with respect to certain U.K. taxes which, as described below, will be governed by the U.K. tax sharingagreement) for taxable periods ending on or before the close of business on the distribution date in which we or amember of our taxable group, on the one hand, and Morgan Stanley or a member of its taxable group, on theother hand, are included. Tax controversies relating to Morgan Stanley or a member of its taxable group,regardless of whether such tax controversy relates to us or a member of our taxable group, generally will becontrolled by Morgan Stanley. However, we may participate at our own expense in any such tax controversy thatalso relates to us or a member of our taxable group, and in certain circumstances may be entitled to controlcertain controversies relating to taxes that solely relate to us or a member of our taxable group.
Under the U.S. tax sharing agreement, we will be generally liable for any taxes and other liabilities that areimposed as a result of the separation and distribution failing to qualify as tax-free transactions for federal andstate income tax purposes, if such failure is the result of a breach by us or any member of our taxable group ofany representation or covenant made by us in the U.S. tax sharing agreement. Such covenants generally includethat (i) during the twelve-month period following the distribution date, we will continue the active conduct of thehistoric business relied upon for purposes of the tax ruling request, and we will not liquidate, merge orconsolidate any of our companies conducting such active business, (ii) during the two-year period following thedistribution date, we will not enter into any transaction or make any change in our equity structure which maycause the distribution to be treated as part of a “plan (or series of related transactions)” pursuant to which one ormore persons acquire directly or indirectly our stock representing a 50-percent or greater interest by vote orvalue, and (iii) we will not take any action inconsistent with the information and representations furnished to theIRS, the California Franchise Tax Board or counsel. Notwithstanding the foregoing, we will be permitted to takeany of the actions specified in such covenants if Morgan Stanley provides us with prior written consent for suchaction, or we provide Morgan Stanley with a tax ruling or rulings, or an unqualified opinion of counsel, in eachcase acceptable to Morgan Stanley, to the effect that such action will not affect the tax-free nature of theseparation and distribution, but we will remain liable for any taxes and other liabilities imposed as a result of theseparation and distribution failing to qualify as tax-free transactions as a result of such action.
We will also enter into a U.K. tax sharing agreement with Morgan Stanley in relation to certain U.K. taxes.This U.K. tax sharing agreement will make provision for (i) payments to be made of, and in respect of, certainU.K taxes attributable to our business and (ii) the conduct of certain U.K. tax controversies. The U.K. tax sharingagreement will also acknowledge that we will be liable for certain U.K. taxes as a result of the separation anddistribution.
125

Transitional Trade Mark Licence Agreement
Our U.K. business currently uses certain Morgan Stanley trademarks, including on credit cards issued tocardmembers. In connection with the distribution, we will enter into a transitional trade mark licence agreementwith Morgan Stanley pursuant to which Morgan Stanley will grant us a royalty-free license of limited scope anduse to continue to use certain Morgan Stanley trademarks for up to three years in connection with our U.K.business.
Ongoing Leasehold Arrangements
Morgan Stanley’s Global Wealth Management Group currently has a brokerage branch office in one of thebuildings that comprise our headquarters in Riverwoods, Illinois. The office currently serves our employees andother customers of Morgan Stanley and is physically separated from the portion of the building that serves as partof our headquarters. This branch office is currently subject to a lease agreement between us, as landlord, andMorgan Stanley’s Global Wealth Management Group, as tenant, and this arrangement will continue followingthe distribution.
In addition, a subsidiary of Morgan Stanley currently leases three floors of office space in a building inLondon, two floors of which are occupied by personnel engaged in our U.K. business. In connection with thedistribution, the Morgan Stanley subsidiary will arrange for an assignment or sublease to be granted to us withrespect to the two floors and associated car parking.
The rent and other terms of all such leases and/or subleases, as the case may be, are (or will be) consistentwith arm’s-length commercially reasonable terms for leasehold agreements of these types.
Investment Banking Agreement
We will enter into an agreement with Morgan Stanley & Co. Incorporated (“MS&Co.”) pursuant to whichMS&Co. will have the right to provide certain investment banking services to us for a period of up to three yearsafter the distribution. The terms for these services will be consistent with arm’s-length commercially reasonableterms for services of this type.
Mortgage Loan Underwriting and Processing
Morgan Stanley currently provides marketing and application processing services for a home-mortgageproduct known as “Discover Home Loans” that is offered to our customers. Morgan Stanley will continue toprovide these services, on an arm’s-length pricing basis, for a transition period of up to 15 months following thedistribution.
We currently provide certain marketing, information technology and print and imaging services inconnection with Morgan Stanley’s mortgage lending business, including generating billing statements, printingIRS Form 1098s, mail printing, document scanning and storage and loan file management and retrieval. We willcontinue to provide these services to Morgan Stanley for a transition period of up to 18 months under anagreement that will have arm’s-length commercially reasonable terms, including a fee-per-item pricingarrangement consistent with comparable agreements between unrelated parties.
Derivative Contracts
Certain of our subsidiaries currently have outstanding certain hedging contracts with a subsidiary of MorganStanley. The contracts utilized are interest rate swaps for interest rate hedging, and were entered into in theordinary course of business. Each interest rate swap hedges interest rate risks relating to our business and hasarm’s-length terms. The terms of the swaps vary in relation to the underlying liability being hedged and havematurity dates ranging from 2007 to 2023. The aggregate notional amount of swaps expected to be outstanding asof June 1, 2007, is approximately $1.43 billion. Because we consider the swaps necessary to our business andbecause breakage fees would be required to be paid if the swaps were terminated, the swaps are expected toremain outstanding pursuant to their terms. After the distribution, we will hedge our interest-rate exposure withunrelated third parties, as well as Morgan Stanley, on an arm’s-length basis.
126
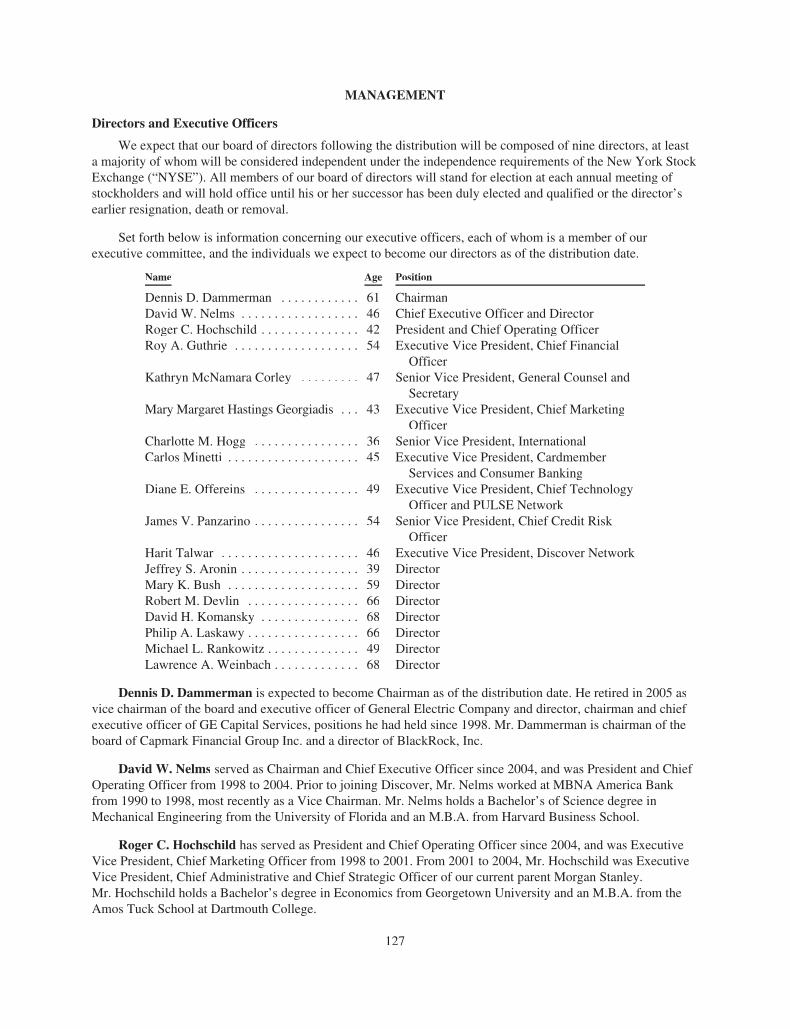
MANAGEMENT
Directors and Executive Officers
We expect that our board of directors following the distribution will be composed of nine directors, at leasta majority of whom will be considered independent under the independence requirements of the New York StockExchange (“NYSE”). All members of our board of directors will stand for election at each annual meeting ofstockholders and will hold office until his or her successor has been duly elected and qualified or the director’searlier resignation, death or removal.
Set forth below is information concerning our executive officers, each of whom is a member of ourexecutive committee, and the individuals we expect to become our directors as of the distribution date.
Name Age Position
Dennis D. Dammerman . . . . . . . . . . . . 61 ChairmanDavid W. Nelms . . . . . . . . . . . . . . . . . . 46 Chief Executive Officer and DirectorRoger C. Hochschild . . . . . . . . . . . . . . . 42 President and Chief Operating OfficerRoy A. Guthrie . . . . . . . . . . . . . . . . . . . 54 Executive Vice President, Chief Financial
OfficerKathryn McNamara Corley . . . . . . . . . 47 Senior Vice President, General Counsel and
SecretaryMary Margaret Hastings Georgiadis . . . 43 Executive Vice President, Chief Marketing
OfficerCharlotte M. Hogg . . . . . . . . . . . . . . . . 36 Senior Vice President, InternationalCarlos Minetti . . . . . . . . . . . . . . . . . . . . 45 Executive Vice President, Cardmember
Services and Consumer BankingDiane E. Offereins . . . . . . . . . . . . . . . . 49 Executive Vice President, Chief Technology
Officer and PULSE NetworkJames V. Panzarino . . . . . . . . . . . . . . . . 54 Senior Vice President, Chief Credit Risk
OfficerHarit Talwar . . . . . . . . . . . . . . . . . . . . . 46 Executive Vice President, Discover NetworkJeffrey S. Aronin . . . . . . . . . . . . . . . . . . 39 DirectorMary K. Bush . . . . . . . . . . . . . . . . . . . . 59 DirectorRobert M. Devlin . . . . . . . . . . . . . . . . . 66 DirectorDavid H. Komansky . . . . . . . . . . . . . . . 68 DirectorPhilip A. Laskawy . . . . . . . . . . . . . . . . . 66 DirectorMichael L. Rankowitz . . . . . . . . . . . . . . 49 DirectorLawrence A. Weinbach . . . . . . . . . . . . . 68 Director
Dennis D. Dammerman is expected to become Chairman as of the distribution date. He retired in 2005 asvice chairman of the board and executive officer of General Electric Company and director, chairman and chiefexecutive officer of GE Capital Services, positions he had held since 1998. Mr. Dammerman is chairman of theboard of Capmark Financial Group Inc. and a director of BlackRock, Inc.
David W. Nelms served as Chairman and Chief Executive Officer since 2004, and was President and ChiefOperating Officer from 1998 to 2004. Prior to joining Discover, Mr. Nelms worked at MBNA America Bankfrom 1990 to 1998, most recently as a Vice Chairman. Mr. Nelms holds a Bachelor’s of Science degree inMechanical Engineering from the University of Florida and an M.B.A. from Harvard Business School.
Roger C. Hochschild has served as President and Chief Operating Officer since 2004, and was ExecutiveVice President, Chief Marketing Officer from 1998 to 2001. From 2001 to 2004, Mr. Hochschild was ExecutiveVice President, Chief Administrative and Chief Strategic Officer of our current parent Morgan Stanley.Mr. Hochschild holds a Bachelor’s degree in Economics from Georgetown University and an M.B.A. from theAmos Tuck School at Dartmouth College.
127

Roy A. Guthrie has served as Executive Vice President, Chief Financial Officer since 2005. Prior to joiningDiscover, Mr. Guthrie was President, Chief Executive Officer of CitiFinancial International, LTD, a ConsumerFinance Business of Citigroup, from 2000 to 2004. In addition Mr. Guthrie served on Citigroup’s ManagementCommittee during this period of time. Mr. Guthrie served as Chief Financial Officer of Associates First CapitalCorporation from 1996 to 2000, while it was a public company and served as a member of its board from 1998 to2000. Mr. Guthrie holds a Bachelor’s degree in Economics from Hanover College and an M.B.A. from DrakeUniversity.
Kathryn McNamara Corley has served as Senior Vice President and General Counsel since 1999, and asSecretary since 2007. Prior to becoming General Counsel, Ms. Corley was Managing Director for our currentparent Morgan Stanley’s global government and regulatory relations. Ms. Corley holds a Bachelor’s degree inPolitical Science from the University of Southern California and a J.D. from George Mason University School ofLaw.
Mary Margaret Hastings Georgiadis has served as Executive Vice President, Chief Marketing Officersince 2004. Ms. Georgiadis was at McKinsey & Company from 1986 to 1988 and 1990 to 2004, most recently asPartner. At McKinsey & Company, Ms. Georgiadis headed the marketing and retail practices and also co-founded and led the customer acquisition and management and retail practices. Ms. Georgiadis holds aBachelor’s degree in Economics from Harvard-Radcliffe Colleges and an M.B.A. from Harvard Business School.
Charlotte M. Hogg has served as Senior Vice President and Managing Director of our internationalbusiness since 2004. Ms. Hogg was a Managing Director and Head of our current parent Morgan Stanley’sStrategic Planning Group from 2001 to 2004. Ms. Hogg holds a Bachelor’s degree in Economics and Historyfrom Oxford University and was a Kennedy Memorial Trust Scholar at the John F. Kennedy School ofGovernment at Harvard University.
Carlos Minetti has served as Executive Vice President, Cardmember Services since January 2001. Inaddition, he was appointed to oversee consumer banking products in 2006. Prior to joining Discover, Mr. Minettiworked in card operations and risk management for American Express from 1987 to 2000, most recently asSenior Vice President. Mr. Minetti holds a Bachelor’s of Science degree in Industrial Engineering from TexasA & M University and an M.B.A. from the University of Chicago.
Diane E. Offereins has served as Executive Vice President, Chief Technology Officer since 1998. Inaddition, she was appointed to oversee the PULSE Network in 2006. From 1993 to 1998, Ms. Offereins was atMBNA America Bank, most recently as Senior Executive Vice President. Ms. Offereins holds a Bachelor ofBusiness Administration degree in Accounting from Loyola University.
James V. Panzarino has served as Senior Vice President, Chief Credit Risk Officer since 2006, and wasSenior Vice President, Cardmember Assistance from 2003 to 2006. Prior to joining Discover, Mr. Panzarino wasVice President of External Collections and Recovery at American Express from 1998 to 2002. Mr. Panzarinoholds a Bachelor’s degree in Business Management and Communication from Adelphi University.
Harit Talwar has served as Executive Vice President, Discover Network since December 2003. From 2000to 2003, Mr. Talwar was Managing Director for Discover international business. Mr. Talwar held a number ofpositions at Citigroup from 1985 to 2000, most recently Country Head, Consumer Banking Division, Poland.Mr. Talwar holds a B.A. Hons degree in Economics from Delhi University in India and received his M.B.A. fromthe Indian Institute of Management, Ahmedabad.
Jeffrey A. Aronin is the founder, president and chief executive officer of Ovation Pharmaceuticals, Inc., abiopharmaceutical company founded in 2000. Mr. Aronin has served as its president since 2000, as its chiefexecutive officer from 2000 to 2003 and since 2004, and as its chief operating officer from 2003 to 2004.
128

Mary K. Bush has served as the president of Bush International, which advises U.S. companies and foreigngovernments on international financial markets, banking and economic matters, since 1991. She is a member ofthe board and independent trustees, nominating, valuation and policy administration committees of The PioneerFamily of Mutual Funds; a member of the board and audit, compensation and finance committees of BradyCorporation; a member of the board and audit and compensation committees of Briggs & Stratton; a member ofthe board and audit and public responsibility committees of UAL corporation; and a member of the board ofMANTECH International Corporation.
Robert M. Devlin is chairman of Curragh Capital Partners, a private equity and investment firm he foundedin 2002. He was chairman, president and chief executive officer of American General Corporation from 1996 until2001. He is also a director of Cooper Industries and LKQ Corporation, and a director and owner of ForethoughtFinancial Group Inc.
David H. Komansky retired in 2003 as chairman of the board of Merrill Lynch, a position he had held since1997. Mr. Komansky also served as a director and chief executive officer of Merrill Lynch from 1996 to 2002.Mr. Komansky is a director of BlackRock, Inc., WPP Group plc, AEA Investors LLC and Burt’s Bees, Inc.
Philip A. Laskawy retired in 2001 as chairman and chief executive officer of Ernst & Young LLP. He hasserved as the chairman of the board of General Motors Corporation since 2003 and is a member of its audit andinvestment funds committees. Mr. Laskawy is also a director and member of the audit and governancecommittees of Henry Schein, Inc., a director and member of the audit committee of Loews Corporation, and adirector and member of the audit committee of The Progressive Corporation.
Michael L. Rankowitz has served as a senior advisor to Morgan Stanley, and as a member of its pensioncommittee, since 2006. In 2001, Mr. Rankowitz retired from Morgan Stanley, where he worked for over 20years, most recently as co-head of global high yield, responsible for risk management, research and sales for highyield, emerging markets, bank debt and distressed securities. He currently is a director and chairman of thefinance committee of the New York Racing Association.
Lawrence A. Weinbach has been a partner of Yankee Hill Capital Management LLC since 2006. Prior tothat, he was the executive chairman of Unisys Corporation from 2005 to 2006, and its chairman and chiefexecutive officer from 1997 to 2004. He is a member of the board and audit committee of Avon Products Inc., amember of the board and audit committee of UBS AG and a member of the board and audit committee of QuadraRealty Trust.
Annual MeetingOur bylaws provide that the annual meeting of stockholders will be held at the date, place and time specified
by our board of directors. We expect the first annual meeting of our stockholders following the distribution to beheld in 2008.
Committees of Our Board of DirectorsConcurrent with the completion of this distribution, our board of directors will establish the following
committees: Audit, Compensation and Nominating and Governance. The membership and function of eachcommittee is described below.
Audit CommitteeWe expect that our Audit Committee will be composed of three individuals, each of whom is expected to be
determined by our board of directors to be independent under applicable independence standards of the NYSEand the Exchange Act. The Audit Committee is responsible for the oversight of the integrity of our consolidatedfinancial statements, our system of internal control over financial reporting, our risk management, thequalifications and independence of our independent registered accounting firm, the performance of our internalauditor and independent auditor and our compliance with legal and regulatory requirements. The AuditCommittee will also have the sole authority and responsibility to select, determine the compensation of, evaluateand, when appropriate, replace our independent auditor. We expect that at least one of our Audit Committeemembers will qualify as an “audit committee financial expert,” as such term is defined in the regulations underthe Exchange Act.
129

Compensation Committee
We expect that our Compensation Committee will be composed of three individuals, each of whom isexpected to be determined by our board of directors to be independent under applicable independence standardsof the NYSE. The Compensation Committee is responsible for annually reviewing and approving the corporategoals and objectives relevant to the compensation of the Chief Executive Officer and evaluating his performancein light of these goals; determining the compensation of our executive officers and other appropriate officers;administering our incentive and equity-based compensation plans; and overseeing plans for managementdevelopment and succession.
Nominating and Governance Committee
We expect that our Nominating and Governance Committee will be composed of three individuals, each ofwhom is expected to be determined by our board of directors to be independent under applicable independencestandards of the NYSE. The Nominating and Governance Committee is responsible for identifying andrecommending candidates for election to our board of directors and each board committee, establishingprocedures for its oversight of the evaluation of our board of directors and management, recommending directorcompensation and benefits and reviewing annually our corporate governance policies.
Code of Ethics and Code of Business Conduct
Concurrent with the completion of the distribution, our board of directors will establish a code of businessconduct and code of ethics that will apply to our employees, officers and directors. Any waiver of the code ofbusiness conduct or code of ethics may be made only by our board of directors and will be promptly disclosed asrequired by law or stock exchange regulations.
Corporate Governance Policies
Concurrent with the completion of the distribution, our board of directors will adopt corporate governancepolicies that comply with applicable stock exchange and SEC regulations.
Compensation of Directors
We expect to adopt, subject to the approval of our sole stockholder, a 2007 Directors’ Compensation Plan.The purpose of our 2007 Directors’ Compensation Plan will be to set forth our directors’ annual compensationand to further advance the interest of Discover and its stockholders by encouraging increased stock ownership byour non-employee directors, in order to promote long-term stockholder value.
Cash Compensation. We expect that each non-employee director will receive the following cashcompensation under the 2007 Directors’ Compensation Plan for service on our board of directors and committeesof our board of directors:
• an annual retainer fee of $75,000;
• an additional annual retainer fee for our lead director of $75,000;
• an annual retainer fee of $25,000 for the chairperson of each committee of our board of directors otherthan the audit committee; and
• an annual retainer fee of $50,000 for the chairperson of the audit committee of our board of directors.
Directors who also are our employees will not receive any of the compensation described above.
130
Equity Compensation. Pursuant to the 2007 Directors’ Compensation Plan, we may issue up to 500,000shares of common stock. We expect that each non-employee director will receive the following equitycompensation under the 2007 Directors’ Compensation Plan for service on our board of directors and committeesof our board of directors:
• for those appointed to our board before December 31, 2007, an initial grant of $350,000 in restrictedstock units (reduced by one-24th for each month after the distribution in which the director becomes amember of our board); and
• an annual grant of $125,000 in restricted stock units beginning with our 2008 annual meeting.
• for those elected to our board after December 31, 2007, an annual grant of $125,000 in restricted stockunits beginning with the first annual meeting at which the director is elected to our board, and for thosejoining our board on a date other than an annual meeting, a grant of $125,000 in restricted stock unitson the date on which the director becomes a member of our board, adjusted by one-12th for each monthbefore the next annual meeting of stockholders.
The number of restricted stock units will be determined by dividing the dollar amount by our share price on thedate of grant. The initial grant will vest in two equal annual installments on each of the first two anniversaries oftheir dates of grant. Each grant made thereafter will vest in its entirety on the first anniversary of its date of grant.Unless provided otherwise in the restricted stock unit agreement, restricted stock units granted to each non-employee director will become fully vested upon the occurrence of (i) such director’s termination due todisability or death or (ii) a change in control.
Directors who also are our employees will not receive any of the compensation described above.
Reimbursements. Directors will be reimbursed for reasonable expenses incurred in attending board ofdirectors, committee and stockholder meetings, including those for travel, meals and lodging.
Consulting Agreements. The corporate governance guidelines our board of directors will adopt will providethat we should not enter into paid consulting agreements with non-employee directors.
Director Attendance at Annual Meetings. The corporate governance guidelines that our board of directorswill adopt will provide that directors are expected to attend annual meetings of stockholders.
Communications with the Board of Directors
Following the distribution, stockholders and other interested parties may contact any member of our boardof directors by writing to: Discover Financial Services, 2500 Lake Cook Road, Riverwoods, Illinois 60015,Attention: Secretary. Stockholder and interested party communications received in this manner will be handled inaccordance with procedures to be approved by our independent directors.
Executive Compensation
The following table contains compensation information for our chief executive officer and the four otherexecutive officers who were our most highly compensated executive officers for the year ended November 30,2006. We refer to these individuals as our “named executive officers.” The information included in this tablereflects compensation earned by our named executive officers for services rendered to us.
131

Summary Compensation Table
Annual CompensationLong-Term
Compensation Awards
All OtherCompensation
($)(4)Name and Principal Position Salary($) Bonus($)(1)
Other AnnualCompensation
($)
RestrictedStock
Award(s)($)(2)
SecuritiesUnderlyingOptions/
SARs (#)(3)
David W. Nelms . . . . . . . . . . . . . . . 900,000 2,835,000 — 3,120,790 15,424 6,100Chief Executive Officer 10,522
Roger C. Hochschild . . . . . . . . . . . .President and Chief Operating
Officer
380,000 2,619,000 — 2,883,003 14,248 950
Roy A. Guthrie . . . . . . . . . . . . . . . .Executive Vice President, Chief
Financial Officer
500,000 1,125,000 222,808(5) 1,105,753 7,567 6,100
Diane E. Offereins . . . . . . . . . . . . . .Executive Vice President, Chief
Technology Officer and PULSENetwork
500,000 1,080,000 — 1,155,851 7,344 6,100
Carlos Minetti . . . . . . . . . . . . . . . . .Executive Vice President,
Cardmember Services andBanking
450,000 1,005,000 — 1,275,881 7,567 6,100
(1) Includes amounts contributed to various Morgan Stanley deferred compensation plans. See “—NonqualifiedDeferred Compensation” below.
(2) The market value of the common stock underlying restricted stock units (RSUs) was calculated using theclosing price per share of common stock on the applicable grant date, as reported on the New York StockExchange Composite Transaction Tape. The 2006 RSUs were granted on December 12, 2006 (the closingprice was $78.40) and 50% vest on January 2, 2009 and 50% vest on January 2, 2010. For Messrs. Nelmsand Hochschild, unvested RSUs vest upon a voluntary or involuntary termination of employment notinvolving any cancellation provision or upon a change of control of Morgan Stanley. For Messrs. Guthrieand Minetti and Ms. Offereins, unvested RSUs vest upon an involuntary termination of employment notinvolving any cancellation provision or upon a change of control of Morgan Stanley. Dividend equivalentsare paid on RSUs at the same rate that dividends are paid on shares of common stock. These RSUs are nottransferable, are generally distributed in the form of shares of common stock approximately three years afterthe grant date and are subject to cancellation in certain circumstances. The following tables list the numberof RSUs awarded for performance in 2006 and the total number and value (calculated using the closingprice on November 30, 2006) of RSUs held as of November 30, 2006 (including the 2006 grant).
Named Executive Officer
Number of RSUsawarded for
performance in2006
David W. Nelms . . . . . . . . . . . . . . . . . . . . . . . . . . . . . . . . . . . . . . . 39,806Roger C. Hochschild . . . . . . . . . . . . . . . . . . . . . . . . . . . . . . . . . . . 36,773Roy A. Guthrie . . . . . . . . . . . . . . . . . . . . . . . . . . . . . . . . . . . . . . . . 14,104Diane E. Offereins . . . . . . . . . . . . . . . . . . . . . . . . . . . . . . . . . . . . . 14,743Carlos Minetti . . . . . . . . . . . . . . . . . . . . . . . . . . . . . . . . . . . . . . . . 16,274
132

Total RSUs held as ofNovember 30, 2006
Named Executive Officer Number Held Market Value
David W. Nelms . . . . . . . . . . . . . . . . . . . . . . . . . . . . . . . . . . . . . . . . . . . . 205,228 $15,630,164Roger C. Hochschild . . . . . . . . . . . . . . . . . . . . . . . . . . . . . . . . . . . . . . . . 169,044 $12,874,391Roy A. Guthrie . . . . . . . . . . . . . . . . . . . . . . . . . . . . . . . . . . . . . . . . . . . . . 25,618 $ 1,951,067Diane E. Offereins . . . . . . . . . . . . . . . . . . . . . . . . . . . . . . . . . . . . . . . . . . 95,026 $ 7,237,180Carlos Minetti . . . . . . . . . . . . . . . . . . . . . . . . . . . . . . . . . . . . . . . . . . . . . . 127,403 $ 9,703,012
Following the distribution, Morgan Stanley RSUs granted to our named executive officers will be convertedinto newly-issued Discover RSUs pursuant to a formula that is intended to preserve the “intrinsic” value oftheir pre-distribution RSUs. See “Arrangements Between Us and Morgan Stanley—Employee MattersAgreement.”
(3) Represents awards of Morgan Stanley stock options for services in 2006, and 10,522 restoration optionsgranted to Mr. Nelms upon exercise of options with restoration option rights (RORs). The terms and presentvalue of these stock options are described under “—Option Grants of Morgan Stanley Common Stock inLast Fiscal Year.” The named executive officers have no stock appreciation rights.
(4) Represents Morgan Stanley contributions awarded under defined contribution plans.(5) Mr. Guthrie received approximately $200,000 in benefits under our relocation policy for U.S. professional
employees in connection with his appointment as Executive Vice President, Chief Financial Officer and hisrelocation to our executive offices.
Option Grants of Morgan Stanley Common Stock in Last Fiscal Year
The following table sets forth information regarding stock options granted in the year ended November 30,2006 to our named executive officers with respect to shares of Morgan Stanley common stock, including optionsgranted upon the exercise of options with RORs that were granted before 2006. Following the distribution,Morgan Stanley options granted to our named executive officers will be converted into newly-issued options topurchase shares of Discover common stock pursuant to a formula that is intended to preserve the “intrinsic”value of their pre-distribution options. See “Arrangements Between Us and Morgan Stanley—Employee MattersAgreement.”
Name
Number ofSecuritiesUnderlyingOptions
Granted (#)
Percent ofTotal OptionsGranted toEmployees inFiscal Year(2)
Exerciseor BasePrice($/Sh)
ExpirationDate
Grant DatePresent
Value ($)(3)
David W. Nelms . . . . . . . . . . . . . . . . . . . . . . . . . . 15,424(1) 17% 78.40 12/12/2016 346,495.5410,522(4) 12% 73.56 1/2/2009 83,087.47
Roger C. Hochschild . . . . . . . . . . . . . . . . . . . . . . 14,248(1) 16% 78.40 12/12/2016 320,077.05Roy A. Guthrie . . . . . . . . . . . . . . . . . . . . . . . . . . . 7,567(1) 8% 78.40 12/12/2016 169,990.39Diane E. Offereins . . . . . . . . . . . . . . . . . . . . . . . . 7,344(1) 8% 78.40 12/12/2016 164,980.76Carlos Minetti . . . . . . . . . . . . . . . . . . . . . . . . . . . . 7,567(1) 8% 78.40 12/12/2016 169,990.39
(1) Represents awards under Morgan Stanley’s Employees’ Equity Accumulation Plan for services in 2006.These options vest and become exercisable 50% on January 2, 2009 and 50% on January 2, 2010, are nottransferable and are subject to cancellation under certain circumstances. Shares of common stock acquiredupon the exercise of such options generally may not be transferred or sold until January 2, 2010. For Messrs.Nelms and Hochschild, upon a change in control of Morgan Stanley or the recipient’s voluntary orinvoluntary termination of employment under circumstances not involving violation of any cancellationprovision, these options will vest and become exercisable. For Messrs. Guthrie and Minetti andMs. Offereins, upon a change in control of Morgan Stanley or the recipient’s involuntary termination ofemployment under circumstances not involving cause or violation of any cancellation provision, theseoptions will vest and become exercisable.
(2) In 2006, 17 Discover employees received a portion of their annual equity awards in the form of optionsinstead of RSUs.
133

(3) The present value of stock options granted was determined using the Black-Scholes model as of the grantdate, consistent with Statement of Financial Accounting Standards No. 123R, Share-Based Payment(“Statement No. 123R”). Except for the 10,522 restoration options granted to Mr. Nelms, the Black-Scholesvalue assumes (i) the stock option was exercised at the end of the expected option term (6.32 years); (ii) anexpected stock price volatility of 23.771%; (iii) the risk free yield on the U.S. Treasury STRIPS with aremaining term closest to the expected option life on the grant date; and (iv) Morgan Stanley’s annualizeddividend yield on the grant date was constant over the expected option life. The different inputs for theBlack-Scholes model used in determining the present value for Mr. Nelms’ 10,522 restoration options,which were granted upon the exercise of RORs and have the same expiration date as the underlying options,are: (i) the expected option term (1.36 years); and (ii) an expected stock price volatility of 19.08%.
(4) Restoration options were granted to Mr. Nelms on October 3, 2006 upon the exercise of RORs granted in1998. Restoration options vest upon grant and have the same expiration date and transfer restrictions as theunderlying options. RORs entitle the grantee, upon tendering shares of common stock to Morgan Stanley topay the option exercise price of the underlying options, to restoration options. Restoration options entitle thegrantee to acquire the number of shares of common stock equal to the number of shares of common stocktendered to pay the exercise price and withheld to pay taxes upon the exercise of the underlying options, at aper share price equal to the closing price of Morgan Stanley’s common stock on the option’s exercise date.Restoration options do not increase the option holder’s net equity position. Instead, they maintain theholder’s net equity position – the sum of shares owned and shares subject to option.
Aggregate Exercises of Morgan Stanley Stock Options in Last Fiscal Year and Year-End Option Values
The following table sets forth information regarding the exercise of options to purchase Morgan Stanleycommon stock by our named executive officers in the year ended November 30, 2006, as well as the number andvalue of their unexercised options to purchase Morgan Stanley common stock as of November 30, 2006(including those awarded on December 12, 2006 for service in 2006). Following the distribution, Morgan Stanleyoptions granted to our named executive officers will be converted into newly-issued options to purchase shares ofDiscover common stock pursuant to a formula that is intended to preserve the “intrinsic” value of theirpre-distribution options. See “Arrangements Between Us and Morgan Stanley—Employee Matters Agreement.”
Name
SharesAcquired
onExercise(#)(1)
ValueRealized
($)
Number of SecuritiesUnderlying UnexercisedOptions/SARs At Fiscal
Year-End (#) (2)
Value of UnexercisedIn-The-Money Options/SARs
At Fiscal Year-End ($)(3)
Exercisable(4) Unexercisable Exercisable(4) Unexercisable
David W. Nelms . . . . . . . . . . . . . 42,368(5) 2,379,290 558,192 15,424 18,263,732 —Roger C. Hochschild . . . . . . . . . . 25,246(5) 980,680 196,086 66,306 4,392,419 1,217,652Roy A. Guthrie . . . . . . . . . . . . . . — — 16,862 24,428 388,276 388,253Diane E. Offereins . . . . . . . . . . . . 25,246(6) 941,085 107,850 7,344 2,398,087 —Carlos Minetti . . . . . . . . . . . . . . . — — 127,338 7,567 1,778,516 —
(1) Represents the number of shares underlying options exercised in 2006.(2) The named executive officers have no stock appreciation rights. The shares of common stock that would be
acquired upon exercising certain of these options are subject to transfer restrictions.(3) The value of unexercised, in-the-money options is the aggregate, calculated on a grant-by-grant basis, of the
product of (a) the number of unexercised options multiplied by (b) the difference between $76.4067, thevolume weighted average price of Morgan Stanley’s common stock on November 30, 2006, and the exerciseprices of all such options. The actual value, if any, realized, on the options will depend on the future price ofour common stock.
(4) Includes options that vested and became exercisable on January 2, 2007.(5) The number of shares Messrs. Nelms and Hochschild received from options exercised in 2006 (net of shares
tendered to cover the exercise price and withheld to pay income tax) was 19,934 and 19,954, respectively.(6) Options exercised in a cashless sell, in which all of the shares acquired pursuant to the option exercise were
immediately sold and Ms. Offereins received cash for the net proceeds.
134

Nonqualified Deferred Compensation
The following table contains information with respect to the participation of the named executive officers inour unfunded nonqualified deferred compensation plans. Each named executive officer participated in one ormore of three non-qualified deferred compensation plans as of November 30, 2006: the LeveragedCo-Investment Plan (LCIP), the Key Employee Private Equity Recognition Plan (KEPER), and the SelectEmployee’s Capital Accumulation Program (SECAP). The named executive officers participate in the plans onthe same terms and conditions as other similarly situated employees, except not all named executive officers areeligible to participate in LCIP.
Name
ExecutiveContributionsin Last FiscalYear ($)(1)
RegistrantContributionsin Last Fiscal
Year ($)
AggregateEarningsin LastFiscal
Year ($)(2)
AggregateWithdrawals/Distributions inLast Fiscal Year
($)(3)
AggregateBalance at LastFiscal Year-End
($)(2)
David W. Nelms . . . . . . . . . . . . . . . . . . . $250,000 — $ 0 $ 0 $250,000Roger C. Hochschild . . . . . . . . . . . . . . . — — $ 2,811 $173,542 $ 53,968Roy A. Guthrie . . . . . . . . . . . . . . . . . . . . $425,000 — $ 0 $ 0 $425,000Diane E. Offereins . . . . . . . . . . . . . . . . . $330,000 — $10,593 $ 16,351 $404,313Carlos Minetti . . . . . . . . . . . . . . . . . . . . . $255,000 — $ 4,885 $ 7,316 $280,410
(1) Represents contributions from compensation earned in 2006, however deferred after November 30, 2006.(2) Earnings and balances are valued as of November 30, 2006, except that KEPER is valued as of August 31,
2006. Ending balances include contribution referenced in footnote (1) above.(3) Distributions from SECAP and KEPER.
Earnings on contributions to LCIP are based on the performance of notional investments in Morgan Stanleyand third-party funds that are selected by Morgan Stanley. Earnings on contributions to SECAP are based on theperformance of notional investments available under the plan that is selected by the participant. Earnings oncontributions to KEPER are based on notional interests in investment earnings and interest on risk capitalinvestments that are selected by Morgan Stanley. Participants in KEPER cannot select the underlyinginvestments on which their return is based. Employees cannot make further contributions under KEPER.
Under LCIP, participants generally are entitled to receive distributions in respect of their notional planinvestments (minus any applicable deductions), based on the valuation of the notional investments and anyrealizations of those investments prior to the distribution date. Under SECAP, participants generally are entitledto elect, in accordance with rules and procedures determined by Morgan Stanley, the payment method and timingof commencement of distributions in respect of their plan balance. Under KEPER, participants generally areentitled to receive distributions of their pro rata share (minus any applicable deductions) of dividends,distributions of capital, liquidation proceeds or other distributions related to the underlying investments selectedby Morgan Stanley after such amounts are paid from the underlying investments.
Defined Benefit Pension Plan
The paragraphs below discuss the amounts we estimate we will pay to each of the named executive officersin annual benefits upon retirement.
Messrs. Nelms, Hochschild, Guthrie, Minetti and Ms. Offereins each participate in a Morgan Stanley-sponsored defined benefit pension plan intended to qualify under Section 401(a) of the Internal Revenue Code(the “qualified plan”) under which benefits are determined with reference to career-average pay limited to$170,000 per year. Benefits under the qualified plan for each calendar year of service generally equal: (i) 1% ofthe participant’s eligible annual pay; plus (ii) 0.5% of the participant’s eligible annual pay which exceeds theSocial Security covered compensation limit.
If they remain in service until retirement at the annual salary reported under Salary in the summarycompensation table, the estimated annual benefits payable under the plan at the earliest age at which a participant
135
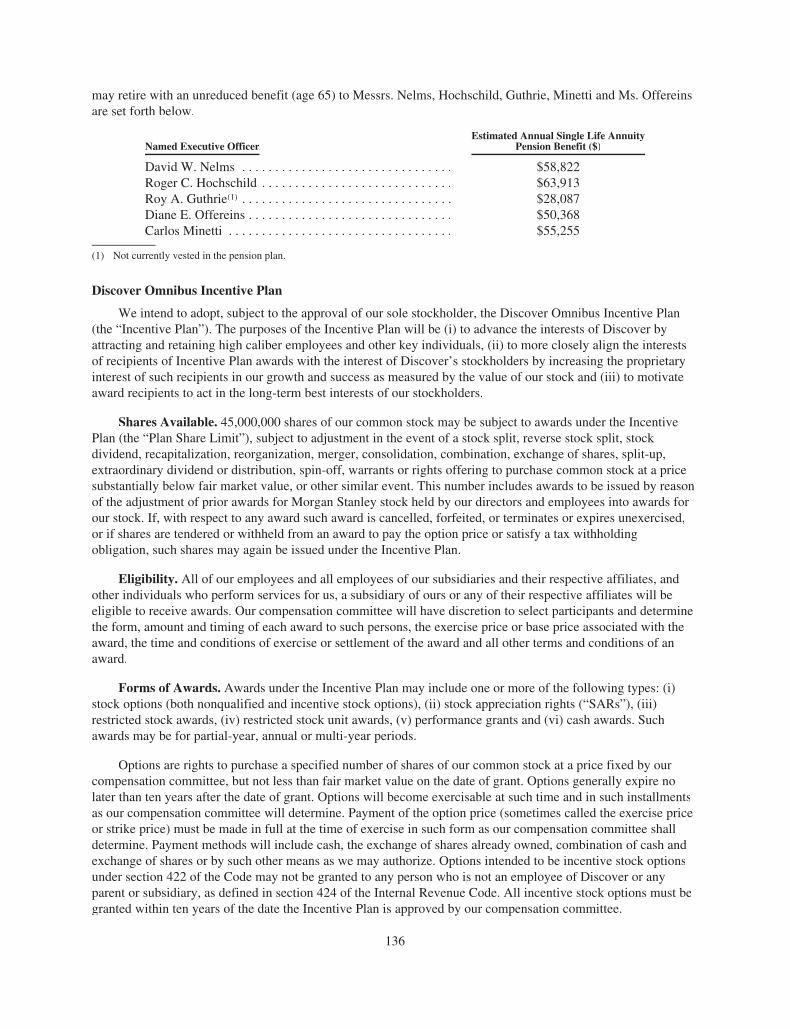
may retire with an unreduced benefit (age 65) to Messrs. Nelms, Hochschild, Guthrie, Minetti and Ms. Offereinsare set forth below.
Named Executive OfficerEstimated Annual Single Life Annuity
Pension Benefit ($)
David W. Nelms . . . . . . . . . . . . . . . . . . . . . . . . . . . . . . . . $58,822Roger C. Hochschild . . . . . . . . . . . . . . . . . . . . . . . . . . . . . $63,913Roy A. Guthrie(1) . . . . . . . . . . . . . . . . . . . . . . . . . . . . . . . . $28,087Diane E. Offereins . . . . . . . . . . . . . . . . . . . . . . . . . . . . . . . $50,368Carlos Minetti . . . . . . . . . . . . . . . . . . . . . . . . . . . . . . . . . . $55,255
(1) Not currently vested in the pension plan.
Discover Omnibus Incentive Plan
We intend to adopt, subject to the approval of our sole stockholder, the Discover Omnibus Incentive Plan(the “Incentive Plan”). The purposes of the Incentive Plan will be (i) to advance the interests of Discover byattracting and retaining high caliber employees and other key individuals, (ii) to more closely align the interestsof recipients of Incentive Plan awards with the interest of Discover’s stockholders by increasing the proprietaryinterest of such recipients in our growth and success as measured by the value of our stock and (iii) to motivateaward recipients to act in the long-term best interests of our stockholders.
Shares Available. 45,000,000 shares of our common stock may be subject to awards under the IncentivePlan (the “Plan Share Limit”), subject to adjustment in the event of a stock split, reverse stock split, stockdividend, recapitalization, reorganization, merger, consolidation, combination, exchange of shares, split-up,extraordinary dividend or distribution, spin-off, warrants or rights offering to purchase common stock at a pricesubstantially below fair market value, or other similar event. This number includes awards to be issued by reasonof the adjustment of prior awards for Morgan Stanley stock held by our directors and employees into awards forour stock. If, with respect to any award such award is cancelled, forfeited, or terminates or expires unexercised,or if shares are tendered or withheld from an award to pay the option price or satisfy a tax withholdingobligation, such shares may again be issued under the Incentive Plan.
Eligibility. All of our employees and all employees of our subsidiaries and their respective affiliates, andother individuals who perform services for us, a subsidiary of ours or any of their respective affiliates will beeligible to receive awards. Our compensation committee will have discretion to select participants and determinethe form, amount and timing of each award to such persons, the exercise price or base price associated with theaward, the time and conditions of exercise or settlement of the award and all other terms and conditions of anaward.
Forms of Awards. Awards under the Incentive Plan may include one or more of the following types: (i)stock options (both nonqualified and incentive stock options), (ii) stock appreciation rights (“SARs”), (iii)restricted stock awards, (iv) restricted stock unit awards, (v) performance grants and (vi) cash awards. Suchawards may be for partial-year, annual or multi-year periods.
Options are rights to purchase a specified number of shares of our common stock at a price fixed by ourcompensation committee, but not less than fair market value on the date of grant. Options generally expire nolater than ten years after the date of grant. Options will become exercisable at such time and in such installmentsas our compensation committee will determine. Payment of the option price (sometimes called the exercise priceor strike price) must be made in full at the time of exercise in such form as our compensation committee shalldetermine. Payment methods will include cash, the exchange of shares already owned, combination of cash andexchange of shares or by such other means as we may authorize. Options intended to be incentive stock optionsunder section 422 of the Code may not be granted to any person who is not an employee of Discover or anyparent or subsidiary, as defined in section 424 of the Internal Revenue Code. All incentive stock options must begranted within ten years of the date the Incentive Plan is approved by our compensation committee.
136

A SAR entitles the holder to receive, upon exercise, an amount equal to any positive difference between thefair market value of one share of our common stock on the date the SAR is exercised and the exercise price,multiplied by the number of shares of common stock with respect to which the SAR is exercised. Ourcompensation committee will have the authority to determine whether the amount to be paid upon exercise of aSAR will be paid in cash, common stock (including restricted stock) or a combination of cash and commonstock.
Restricted stock awards provide for a specified number of shares of our common stock subject to arestriction against transfer during a period of time or until performance measures are satisfied, as established byour compensation committee. Unless otherwise set forth in the agreement relating to a restricted stock award, theholder has all rights as a stockholder, including voting rights, the right to receive dividends and the right toparticipate in any capital adjustment applicable to all holders of common stock; provided, however, that ourcompensation committee may determine that distributions with respect to shares of common stock will bedeposited with Discover and will be subject to the same restrictions as the shares of common stock with respectto which such distribution was made.
A restricted stock unit award is a right to receive a specified number of shares of our common stock (or thefair market value thereof in cash, or any combination of our common stock and cash, as determined by ourcompensation committee), subject to the expiration of a specified restriction period and/or the achievement ofany performance measures selected by the compensation committee, consistent with the terms of the IncentivePlan. The restricted stock unit award agreement will specify whether the award recipient is entitled to receivedividend equivalents with respect to the number of shares of our common stock subject to the award. Prior to thesettlement of a restricted stock unit award in our common stock, the award recipient will have no rights as astockholder of our company with respect to our common stock subject to the award.
Performance grants are awards whose final value or amount, if any, is determined by the degree to whichspecified performance measures have been achieved during a performance period set by our compensationcommittee. Performance periods can be partial-year, annual or multi-year periods, as determined by ourcompensation committee. Performance measures that may be used include (without limitation) one or more ofthe following: the attainment by a share of common stock of a specified value within or for a specified period oftime, earnings per share, earnings before interest expense and taxes, return to stockholders (including dividends),return on equity, earnings, revenues, cash flow or cost reduction goals, operating profit, pretax return on totalcapital, economic value added or any combination of the foregoing. Such criteria and objectives may relate toresults obtained by the individual, Discover, a subsidiary, or an affiliate, or any business unit or division thereof,or may relate to results obtained relative to a specific industry or a specific index. Payment may be made in theform of cash, common stock, restricted stock, restricted stock units or a combination thereof, as specified by ourcompensation committee.
Annual incentive awards are generally cash awards based on the degree to which certain of any or all of acombination of individual, team, department, division, subsidiary, group or corporate performance objectives aremet or not met. Our compensation committee may establish the terms and provisions, including performanceobjectives, for any annual incentive award.
An award agreement may contain additional terms and restrictions, including vesting conditions, notinconsistent with the terms of the Incentive Plan, as the Committee may determine.
Maximum Award. To the extent necessary for an award to be qualified performance-based compensationunder section 162(m) of the Internal Revenue Code, the maximum number of options and SARs which may begranted to any individual during a calendar year is 2,000,000. The maximum number of shares that may besubject to restricted stock or stock units granted to or elected by a participant in any fiscal year shall be 1,000,000shares. The maximum cash bonus payable to any individual in any fiscal year will be $10,000,000.
137

Federal Income Tax Consequences. A participant to whom a nonqualified stock option is granted willrecognize no income at the time of the grant and we will not be entitled to a deduction at that time. When theparticipant exercises a nonqualified stock option, he or she will generally recognize ordinary income equal to theexcess, if any, of the fair market value (determined as of the date of exercise) of the common stock received overthe option exercise price. The tax basis of such shares to the participant will be equal to the exercise price paidplus the amount includable in his or her gross income as compensation. The holding period for purposes ofdetermining whether a subsequent sale of such share by the participant results in the recognition of short-term orlong-term capital gain or loss will commence on the day after the date the share is transferred to the participant.A participant to whom a stock option is granted will recognize no income at the time of grant. When theparticipant exercises a stock option, he or she will generally recognize ordinary compensation income equal tothe difference, if any, between the fair market value of the common stock he or she receives at such time and thesum of the exercise price for such shares.
A participant to whom an incentive stock option which qualifies under section 422 of the Internal RevenueCode is granted will generally recognize no income at the time of grant or at the time of exercise, and we will notbe entitled to a deduction at that time. However, upon the exercise of an incentive stock option, the excess of thefair market value of the common stock over the exercise price thereof may result in the participant being subjectto an alternative minimum tax under applicable provisions of the Internal Revenue Code. In order to obtainincentive stock option treatment for federal income tax purposes, the participant (i) must be an employee ofDiscover, a subsidiary of Discover, or any of their respective affiliates continuously from the date of grant untilany termination of employment and (ii) in the event of such a termination, must generally exercise an incentivestock option within three months after such termination. When a participant sells the common stock receivedupon exercise of an incentive stock option more than one year after exercise and more than two years after thedate of grant of such incentive stock option, he or she will normally recognize long-term capital gain or lossequal to the difference, if any, between the sale price of such shares at such time and the exercise price. If theparticipant disposes of such shares before such periods end the participant will recognize ordinary compensationincome equal to the lesser of (i) the difference, if any, between the fair market value of such shares on the date ofexercise and the exercise price, and (ii) the difference, if any, between the sale price and the exercise price. Anyother gain or loss on such sale (in addition to the ordinary income mentioned above), will normally be capitalgain or loss. The tax basis of such shares to the participant, for purposes of computing such other gain or loss,should be equal to the exercise price paid (plus the amount includable in his gross income as compensation, if any).
The inclusion of SARs with a nonqualified stock option or an incentive stock option will normally not resultin taxable income to the participant, and we will not be entitled to a deduction at that time. At the time ofexercise, the participant will normally recognize ordinary compensation income in an amount equal to the cashand the fair market value of the common stock he or she receives to satisfy his or her SAR. The tax basis of anysuch shares received by the participant pursuant to a SAR should be equal to the amount includable in his grossincome as compensation in respect of such shares, and the participant’s holding period therefore should normallycommence on the day after the day on which he or she recognizes taxable income in respect of such shares.
A participant granted shares of restricted stock will not recognize taxable income at the time of grant andDiscover will not be allowed a deduction for federal income tax purposes at that time. However, a participantgranted such shares may elect to recognize taxable compensation in the year of the grant in an amount equal tothe fair market value of the shares at the time of grant by filing a “Section 83(b) election” to such effect with usand the Internal Revenue Service within 30 days after the date of grant. If shares with respect to which aparticipant has made the above-described Section 83(b) election are forfeited, no deduction will be allowed to theparticipant with respect to such forfeiture. If a Section 83(b) election is not made, a participant granted shares ofrestricted stock will recognize taxable compensation in an amount equal to the fair market value of the shares atthe time the shares first become transferable. Any dividends paid on shares of restricted stock prior to the date onwhich the participant recognizes taxable compensation with respect to the shares will be taxable to the participantas additional compensation rather than as ordinary dividends. Subject to the $1 million limit on the amount ofcompensation that can be deducted for payments to our senior officers, we will be allowed a deduction for federal
138

income tax purposes at the time the holder of restricted stock recognizes taxable compensation equal to theamount of compensation recognized by such participant. A participant’s basis for shares of restricted stock willbe the amount recognized as taxable compensation. A participant’s holding period for such shares will begin onthe day after the date the participant recognizes taxable compensation with respect to the shares.
A person who has been granted a restricted stock unit award will not recognize taxable income on the dateof grant and Discover will not be entitled to a deduction at that time. When the restricted stock unit award vestsand shares are transferred to the holder, the holder will recognize ordinary income in an amount equal to the fairmarket value of the transferred shares at such time less any cash consideration which the holder paid for theshares, and Discover will be entitled to a corresponding deduction. Any gain or loss realized upon the holder’ssale or exchange of the shares will be treated as long-term or short-term capital gain or loss. The holder’s basisfor the shares will be the amount recognized as taxable compensation plus any cash consideration which theholder paid for the shares. The holder’s holding period for the shares will begin on the day after the date theshares are transferred to the holder.
A participant to whom a performance grant award is made will not recognize taxable income at the timesuch award is made. The participant will recognize taxable income, however, at the time cash, common stock orother Discover securities or property is paid to the participant pursuant to such award, and the amount of suchincome will be the amount of such cash and the fair market value at such time of such shares or securities, orproperty. The tax basis of any such shares, securities or property received by the participant pursuant to aperformance grant award should be equal to the amount includable in the participant’s gross income ascompensation in respect of such shares, securities or property, and the holding period therefore should normallycommence on the day following the date on which the participant recognizes taxable income in respect of suchshares, securities or property. Any income equivalents paid to a recipient with respect to his or her performancegrant award should generally be regarded for federal income tax purposes as compensation. A participant whoreceives a bonus stock award will recognize taxable income at the time the bonus stock is awarded.
Any compensation includable in the gross income of a recipient will be subject to appropriate federalincome tax withholding.
The company for which a participant is performing services will generally be allowed to deduct amountsthat are includable in the income of the participant as ordinary compensation income at the time such amountsare so includable, provided that the amounts qualify as reasonable compensation for personal services actuallyrendered.
The discussion set forth above is a brief overview of certain United States federal income tax consequencesof awards made under the Incentive Plan. This overview should not be relied upon as being a completedescription of the applicable United States federal income tax consequences. In addition, this overview does notaddress the state, local, foreign or other tax aspects of awards made under the Incentive Plan or the effect on suchawards of guidance that may be issued by the United States Treasury under section 409A of the Internal RevenueCode.
Discover 401(k) Plan
Effective as of the time of spin-off, we expect to adopt a defined contribution retirement plan (the “Discover401(k) Plan”) for our United States employees, including our executive officers, which will be structured withthe intention of qualifying under section 401(a) of the Internal Revenue Code. Under the Discover 401(k) Plan,participants will be permitted to make pre-tax deferrals of up to the maximum allowable amount under theInternal Revenue Code. In addition, we will make matching contributions equal to 100% of the first $2,000 ofeligible pre-tax employee contributions plus 50% of eligible pre-tax employee contributions in excess of $2,000,up to a limit of $6,100 per participant per year. Participants will be fully vested in their company match afterthree years of service, inclusive of service prior to the spin off.
139
Employee Stock Purchase Plan
Anticipated Plan Design. We expect to adopt, subject to the approval of our sole stockholder, an employeestock purchase plan (the “ESPP”) which will provide eligible employees with the opportunity to purchaseDiscover common stock at a discount of up to 15% on the date of purchase through payroll deductions. Aneligible employee may not participate in the ESPP to the extent that participation would permit the eligibleemployee to purchase stock under all employee stock purchase plans of Discover and its subsidiaries in anycalendar year in an amount which, in the aggregate, would exceed the statutory limit based on the fair marketvalue of such stock, or if the participation would cause the eligible employee to own stock equaling 5% or moreof the combined voting power or value of all classes of our stock.
Participation in the ESPP will be voluntary and dependent upon each eligible employee’s election toparticipate and his or her determination as to the level of payroll deductions, subject to the ESPP’s limits.Accordingly, future purchases under the ESPP are not determinable. It is expected that the ESPP will becomeeffective on or about October 1, 2007. Eligible pay may be determined from time to time by our compensationcommittee. Participants continue to participate in the ESPP each year on the same basis unless the participantnotifies Discover to the contrary.
It is anticipated that, unless a participant elects otherwise, cash dividends paid on common stock held in aparticipant’s account will be invested automatically in our common stock purchased at 100% of fair market valueon the dividend payment date.
Certain Federal Income Tax Information. Set forth below is a general summary of certain federal incometax consequences to Discover and ESPP participants. The following discussion is general in nature and is notintended to be a complete analysis of all potential tax consequences.
The ESPP is intended to qualify as an “Employee Stock Purchase Plan” under Section 423 of the Code.Under Code Section 423, a participant who purchases common stock through the ESPP will not recognize anyincome, and the Company will not be entitled to a deduction for tax purposes, at the time of the purchase for thedifference between the fair market value of the common stock at the time of purchase and the purchase price (i.e.,the discount below fair market value). If a participant disposes of common stock purchased through the ESPPtwo or more years after the first day of the purchase right period or one year or more after the date the purchaseright is exercised, which is the last day of the purchase right period, whichever is later, the participant willrecognize compensation income equal to the lesser of (i) the amount by which the fair market value of thecommon stock when purchased exceeds the purchase price (i.e., the discount below fair market value), and (ii)the amount, if any, by which the common stock’s fair market value at the time of disposition exceeds thepurchase price. The participant’s tax basis in the common stock will be increased by the amount recognized ascompensation and any further gain recognized on the disposition will be treated as long-term capital gain or loss.In general, the Company will not be entitled to a deduction with respect to the disposition of stock described inthis paragraph.
However, if the participant disposes of shares of common stock acquired under the plan within two yearsafter the first day of the purchase right period or within one year after the date the purchase right is exercised,whichever is later, the participant will recognize compensation income, and the Company (or one of its affiliates)will be entitled to a deduction for tax purposes in an amount equal to the excess of the fair market value of thecommon stock on the last day of the purchase right period over the purchase price of the common stock under theESPP. The participant’s tax basis in the shares disposed of will be increased by the amount recognized ascompensation income. In addition, upon disposition of the common stock, the participant will recognize capitalgain or loss equal to the difference between the price at which the common stock is disposed of and the cost basisof the common stock, as so increased. The Company will not be entitled to any deduction with respect to theamount recognized by the participant as capital gain.
140

Executive Severance Plan
Subject to, and, effective with, approval of the Discover Compensation Committee, we intend to establishand adopt a severance plan for the payment of certain benefits to senior executives, including our namedexecutive officers, and certain other employees, upon termination of employment from Discover with respect to achange in control of Discover to ensure continuity of our management employees through periods of transitionfor the Company. The severance plan will apply to eligible executives and employees who, during the 24 monthsfollowing or 6 months before a change in control of Discover, are involuntarily terminated, other than for“cause,” or terminated for good reason.
For executives with the position of senior vice president and above, including our named executive officers,we expect the plan will provide benefits similar to those described below:
• A cash payment equal to the senior executive’s base pay plus the average of the cash bonuses paid tothe executive for the preceding three years, multiplied by two (the “Severance Benefit”).
• Cash payment equal to the premiums for continued health care coverage for 24 months of coverage.
• All equity compensation awards that were made pursuant to our Omnibus Incentive Plan, includingthose that are performance based, will become fully vested and exercisable on the date of termination.
• Out placement services for 24 months after termination.
Equity Grant
In connection with the distribution, and subject to the approval of our Compensation Committee, we expectto grant approximately $132,000,000 of Discover RSUs to our named executive officers as well as to a subset ofthe broader employee population on the first trading day following the date of the distribution. The followingtable contains the proposed Founder’s Grants for our named executive officers. The number of RSUscorresponding to these amounts will be determined by dividing the amount listed below by the average stockprice of Discover on the first trading day following the date of the distribution. The RSUs granted to the namedexecutive officers will vest in equal annual installments over four years from the date of grant. We do notanticipate making further equity awards to our senior management, including the named executive officers, inrespect of 2007.
Named Executive Officer
ProposedFounder’sGrant ($)
David W. Nelms . . . . . . . . . . . . . . . . . . . . . . . . . . . . . . . . . . . . . . . . . . . . . . . . $14,000,000Roger C. Hochschild . . . . . . . . . . . . . . . . . . . . . . . . . . . . . . . . . . . . . . . . . . . . . $12,000,000Roy A. Guthrie . . . . . . . . . . . . . . . . . . . . . . . . . . . . . . . . . . . . . . . . . . . . . . . . . $ 5,000,000Diane E. Offereins . . . . . . . . . . . . . . . . . . . . . . . . . . . . . . . . . . . . . . . . . . . . . . . $ 5,000,000Carlos Minetti . . . . . . . . . . . . . . . . . . . . . . . . . . . . . . . . . . . . . . . . . . . . . . . . . . $ 5,000,000
141

OWNERSHIP OF OUR STOCK
The following table sets forth the anticipated beneficial ownership of our common stock immediatelyfollowing the distribution date by (i) those that we expect to be the beneficial owners of more than five percent ofthe outstanding shares of Discover common stock immediately upon the distribution, (ii) each of our directors,director nominees and named executive officers, and (iii) all directors, director nominees and executive officersas a group, in each case based on (A) information available to us concerning ownership of Morgan Stanleycommon stock on April 15, 2007 and (B) the distribution ratio of one share of our common stock for every twoshares of Morgan Stanley common stock. The mailing address of each of our directors and executive officers isc/o Discover Financial Services, 2500 Lake Cook Road, Riverwoods, Illinois 60015. As used in this informationstatement, “beneficial ownership” means that a person has, or may have within 60 days, the sole or shared powerto vote or direct the voting of a security and/or the sole or shared investment power with respect to a security(i.e., the power to dispose or direct the disposition of a security). Following the distribution, holders of MorganStanley restricted stock units (RSUs) and options who are active employees of Discover at the time ofdistribution will have their Morgan Stanley RSUs and options converted into newly-issued Discover RSUs andoptions pursuant to a formula that is intended to preserve the “intrinsic” value of their pre-distribution RSUs andoptions. All other holders of Morgan Stanley RSUs and options will have their existing Morgan Stanley RSUsand options adjusted pursuant to a formula that is intended to preserve the “intrinsic” value of theirpre-distribution RSUs and options.
Name and Address
Shares ofDiscoverCommonStock to beBeneficiallyOwned
MorganStanleyRSUs
Subject toConversion
Morgan StanleyOptions Subjectto Conversion
Percent ofDiscoverCommonStock to be
Outstanding(1)
State Street Bank and Trust Company (State Street)(2)
225 Franklin Street, Boston, MA 02110 63,943,782 — — 12.1%Barclays Global Investors, N.A., and
other reporting entities (Barclays)(3)
45 Fremont Street, San Francisco, CA 94105 32,221,319 — — 6.1%Dennis D. Dammerman . . . . . . . . . . . . . . . . . . . . . . . . . . — — — *David W. Nelms . . . . . . . . . . . . . . . . . . . . . . . . . . . . . . . . 172,371 205,228 297,557 *Roger C. Hochschild . . . . . . . . . . . . . . . . . . . . . . . . . . . . 1,649 169,044 196,086 *Roy A. Guthrie . . . . . . . . . . . . . . . . . . . . . . . . . . . . . . . . . 452 25,618 16,862 *Diane E. Offereins . . . . . . . . . . . . . . . . . . . . . . . . . . . . . . 433 95,026 107,850 *Carlos Minetti . . . . . . . . . . . . . . . . . . . . . . . . . . . . . . . . . . 5,383 127,403 127,338 *Jeffrey S. Aronin . . . . . . . . . . . . . . . . . . . . . . . . . . . . . . . — — — *Mary K. Bush . . . . . . . . . . . . . . . . . . . . . . . . . . . . . . . . . . — — — *Robert M. Devlin . . . . . . . . . . . . . . . . . . . . . . . . . . . . . . . 352(4) — — *David H. Komansky . . . . . . . . . . . . . . . . . . . . . . . . . . . . . — — — *Philip A. Laskawy . . . . . . . . . . . . . . . . . . . . . . . . . . . . . . — — — *Michael L. Rankowitz . . . . . . . . . . . . . . . . . . . . . . . . . . . 4,025 — — *Lawrence A. Weinbach . . . . . . . . . . . . . . . . . . . . . . . . . . — — — *All directors, director nominees and executive officers
as a group (18 persons) . . . . . . . . . . . . . . . . . . . . . . . . 204,707 811,611 942,930 *
* Represents beneficial ownership of less than 1%.(1) Percentages calculated based upon 526,965,282 shares of Discover common stock outstanding immediately
following the distribution, which represents the Morgan Stanley common stock outstanding as of March 31,2007 multiplied by the distribution ratio. This number does not give effect to the number additional sharesof Discover common stock that will result from the conversion of Morgan Stanley RSUs and options heldby active employees of Discover at the time of distribution, as this number cannot be determined until afterthe distribution.
142

(2) Based on a Schedule 13G Information Statement filed February 12, 2007 by State Street, acting in variousfiduciary capacities. The Schedule 13G discloses that State Street had sole voting power as to 47,230,411shares, shared voting power as to 80,657,153 shares and shared dispositive power as to 127,887,564 shares,in each case of Morgan Stanley common stock; that shares held by State Street on behalf of (i) a trust thatholds shares of Morgan Stanley common stock underlying stock units awarded to employees under severalof Morgan Stanley’s equity-based plans and (ii) a Morgan Stanley-sponsored equity-based compensationprogram amounted to 7.6% of Morgan Stanley common stock as of December 31, 2006; and that StateStreet disclaimed beneficial ownership of all shares reported therein.
(3) Based on a Schedule 13G Information Statement filed January 23, 2007 (dated January 31, 2007) byBarclays Global Investors, N.A., Barclays Global Fund Advisors, Barclays Global Investors, Ltd, BarclaysGlobal Investors Japan Trust and Banking Company Limited, and Barclay’s Global Investors Japan Limited.In the Schedule 13G, the reporting entities do not affirm the existence of a group. The Schedule 13Gdiscloses that the reporting entities, taken as a whole, had sole voting power as to 56,284,434 shares andsole dispositive power as to 64,442,639 shares and did not have shared power as to any shares, in each caseof Morgan Stanley common stock. This Information Statement states that Barclays beneficially owned6.15% of Morgan Stanley common stock on December 31, 2006.
(4) Shares held by the Devlin Foundation, of which Mr. Devlin’s wife is president.
143
DESCRIPTION OF CAPITAL STOCK
We have provided below a summary description of our capital stock. This description is not complete, and isqualified in its entirety by the full text of our amended and restated certificate of incorporation and bylaws,which will be filed as exhibits to the registration statement into which this information statement is incorporated.You should read the full text of our amended and restated certificate of incorporation and bylaws, as well as theprovisions of applicable Delaware law.
General
Upon the completion of the distribution, we will be authorized to issue 2,000,000,000 shares of commonstock, par value $0.01 per share, and 200,000,000 shares of preferred stock, par value $0.01 per share.
Common Stock
Voting Rights. The holders of common stock are entitled to one vote per share on all matters to be voted onby stockholders. Holders of shares of common stock are not entitled to cumulate their votes in the election ofdirectors. Generally, all matters to be voted on by stockholders must be approved by a majority of the votesentitled to be cast by the holders of common stock present in person or represented by proxy, voting together as asingle class, subject to any voting rights granted to holders of any preferred stock.
Dividends. Holders of common stock will share equally on a pro rata basis in any dividends as may bedeclared by our board of directors out of funds legally available for that purpose, subject to any preferentialrights of holders of any outstanding shares of preferred stock and any other class or series of stock havingpreference over the common stock as to dividends.
Other Rights. Upon voluntary or involuntary liquidation, dissolution or winding up of our company, afterpayment in full of the amounts required to be paid to creditors and holders of any preferred stock that may bethen outstanding, all holders of common stock are entitled to share equally on a pro rata basis in all remainingassets.
No shares of common stock are subject to redemption or have preemptive rights to purchase additionalshares of common stock or other securities of our company. There are no other subscription rights or conversionrights, and there are no sinking fund provisions applicable to our common stock.
Upon completion of the distribution, all the outstanding shares of common stock will be validly issued, fullypaid and nonassessable.
Preferred Stock
Our board of directors has the authority, without action by our stockholders, to designate and issue ourpreferred stock in one or more series and to designate the rights, preferences and privileges of each series, whichmay be greater than the rights of our common stock. It is not possible to state the actual effect of the issuance ofany shares of our preferred stock upon the rights of holders of our common stock until our board of directorsdetermines the specific rights of the holders of our preferred stock. However, the effects might include, amongother things:
• restricting dividends on our common stock;
• diluting the voting power of our common stock;
• impairing the liquidation rights of our common stock; or
• delaying or preventing a change in control of our company without further action by our stockholders.
At the closing of the distribution, no shares of our preferred stock will be outstanding, and we have nopresent plans to issue any shares of preferred stock.
144

Board of Directors
Our amended and restated certificate of incorporation provides that our board of directors shall consist ofsuch number of directors as may be prescribed in our amended and restated bylaws. Each director shall be electedto our board of directors at each annual meeting by a majority of the votes cast with respect to such director andshall hold office for a term expiring at the next annual meeting of stockholders, with each director to hold officeuntil his or her successor has been duly elected and qualified. A “majority of the votes cast” means that thenumber of votes cast “for” a director exceeds the number of votes cast “against” that director. All vacancies onthe board of directors, including those created by an increase in the size of our board of directors, shall be filledsolely by vote of the remaining directors, even if less than a quorum.
Any director may be removed from office at any time, whether with or without cause.
Anti-Takeover Effects of Our Amended and Restated Certificate of Incorporation and Bylaws andDelaware Law
Some provisions of Delaware law and our amended and restated certificate of incorporation and bylawscould make the following more difficult:
• acquisition of us by means of a tender offer or merger;
• acquisition of us by means of a proxy contest or otherwise; or
• removal of our incumbent officers and directors.
These provisions, summarized below, are expected to discourage coercive takeover practices and inadequatetakeover bids. These provisions also are designed to encourage persons seeking to acquire control of us to firstnegotiate with our board of directors. We believe that the benefits of the potential ability to negotiate with theproponent of an unfriendly or unsolicited proposal to acquire or restructure our company outweigh thedisadvantages of discouraging those proposals because negotiation of them could result in an improvement oftheir terms.
Stockholder Action by Written Consent
Subject to the rights of holders of any series of preferred stock, any action required or permitted to be takenby our stockholders must be effected at a duly called annual or special meeting of stockholders and may not beeffected by any consent in writing in lieu of a meeting.
Amendments to our Governing Documents
The amendment of any provision of our amended and restated certificate of incorporation requires approvalby our board of directors and a majority vote of stockholders. Any amendment to our bylaws requires theapproval of either a majority of our board of directors or holders of at least 80% of the votes entitled to be cast bythe outstanding capital stock in the election of our board of directors.
Stockholder Meetings
Our amended and restated bylaws provide that special meetings of our stockholders may be called only byour secretary at the direction of and pursuant to a resolution of our board of directors.
Requirements for Advance Notification of Stockholder Nominations and Proposals
Our amended and restated bylaws establish advance notice procedures with respect to stockholder proposalsand nomination of candidates for election as directors.
145

Delaware Anti-Takeover Law
Our amended and restated certificate of incorporation does not exempt us from the application ofSection 203 of the Delaware General Corporation Law, an anti-takeover law.
In general, Section 203 prohibits a publicly held Delaware corporation from engaging in a businesscombination with an interested stockholder for a period of three years following the date the person became aninterested stockholder, unless the business combination or the transaction in which the person became aninterested stockholder is approved in a prescribed manner. Generally, a “business combination” includes amerger, asset or stock sale, or other transaction resulting in a financial benefit to the interested stockholder.Generally, an “interested stockholder” is a person that, together with affiliates and associates, owns, or withinthree years prior to the determination of interested stockholder status, did own, 15% or more of a corporation’svoting stock. This may have an anti-takeover effect with respect to transactions not approved in advance by ourboard of directors, including discouraging attempts that might result in a premium over the market price for theshares of our common stock.
No Cumulative Voting
Our amended and restated certificate of incorporation and bylaws do not provide for cumulative voting inthe election of directors.
Undesignated Preferred Stock
The authorization of our undesignated preferred stock makes it possible for our board of directors to issueour preferred stock with voting or other rights or preferences that could impede the success of any attempt tochange control of us. These and other provisions may have the effect of deferring hostile takeovers or delayingchanges of control of our management.
Transfer Agent and Registrar
The transfer agent and registrar for our common stock is Mellon Investor Services.
New York Stock Exchange Listing
Our common stock has been authorized for listing on the New York Stock Exchange under the symbol“DFS.”
146

CERTAIN RELATIONSHIPS AND RELATED TRANSACTIONS
Morgan Stanley has historically performed many corporate functions for us. Also, in connection with thedistribution, we will enter into certain other agreements with Morgan Stanley to define our ongoing relationshipwith Morgan Stanley after the distribution. These other agreements will define responsibility for obligationsarising before and after the distribution date, including obligations relating to our employees, certain transitionservices and taxes. See “Arrangements Between Us and Morgan Stanley.”
Certain of our officers and employees have received extensions of credit from Morgan Stanley or us inconnection with mortgage loans, credit card transactions and lines of credit. The extensions of credit were madein the ordinary course of business on substantially the same terms, including interest rates and collateral, as thoseprevailing at the time for comparable transactions with other persons not related to the lender and did not involvemore than normal risk of collectibility or present other unfavorable terms.
Morgan Stanley offers mortgage products to the public and provides its employees and certain individuals adiscount on select mortgage loan origination fees. Since December 1, 2003, three of our executive officers havereceived extensions of credit from Morgan Stanley. The extensions of credit to our executive officers all weresold by Morgan Stanley in the ordinary course of business to unaffiliated third parties. The information belowcovers the period before the applicable date of sale. Diane E. Offereins had a home equity line of credit bearinginterest at the prime rate minus 0.50%, which was sold in November 2005. From December 1, 2003 until its sale,the largest amount of principal outstanding on this line was $149,000. Carlos Minetti had a mortgage loanbearing interest at 3.875%, which was sold in June 2004. From December 1, 2003 until its sale, the largestamount of principal outstanding on this loan was $324,000. Kathryn McNamara Corley had two mortgage loansbearing interest at 4.75% and 6.625%, which were sold in February 2004 and December 2006, respectively. FromDecember 1, 2003 until their sale, the largest amounts of principal outstanding on the mortgage loans were$350,000 and $417,000, respectively. These extensions of credit were made in the ordinary course of business onsubstantially the same terms (other than employee discounts on origination fees referred to above), includinginterest rates and collateral, as those prevailing at the time for comparable transactions with other persons notrelated to the lender and did not involve more than normal risk of collectibility or other unfavorable terms.
In his capacity as senior advisor of Morgan Stanley, Mr. Rankowitz has received payments of approximately$200,000 in the aggregate.
147
LIMITATION OF LIABILITY AND INDEMNIFICATION OF DIRECTORS AND OFFICERS
Limitation of Liability of Directors
Our amended and restated certificate of incorporation limits the liability of directors to the maximum extentpermitted by Delaware law. Delaware law provides that directors of a corporation will not be personally liable tothe corporation or its stockholders for monetary damages for breach of their fiduciary duties as directors, exceptfor liability:
• for any breach of their duty of loyalty to the corporation or its stockholders;
• for acts or omissions not in good faith or which involve intentional misconduct or a knowing violationof law;
• under Section 174 of the Delaware General Corporation Law relating to unlawful payments ofdividends or unlawful stock repurchases or redemptions; or
• for any transaction from which the director derived an improper personal benefit.
The limitation of liability does not apply to liabilities arising under the federal or state securities laws anddoes not affect the availability of equitable remedies, such as injunctive relief or rescission.
Indemnification of Officers and Directors
Our amended and restated certificate of incorporation provides that each person who was or is a director orofficer shall be indemnified to the fullest extent permitted by Delaware law, including those circumstances inwhich indemnification would otherwise be discretionary, and requires that we advance expenses to our officersand directors as incurred in connection with proceedings against them for which they may be indemnified.
We intend to obtain directors and officers liability insurance for the benefit of our directors and officers.
148
WHERE YOU CAN FIND MORE INFORMATION
We have filed with the SEC a registration statement, of which this information statement constitutes a part,under the Exchange Act with respect to our common stock being received by holders of Morgan Stanley commonstock in the distribution. This information statement does not contain all of the information set forth in theregistration statement. For further information with respect to our business and our common stock being receivedby holders of Morgan Stanley common stock in the distribution, please refer to the registration statement. Whilewe have provided a summary of the material terms of certain agreements and other documents, the summarydoes not describe all of the details of the agreements and other documents. In each instance where a copy of anagreement or other document has been filed as an exhibit to the registration statement, please refer to theregistration statement. Each statement in this information statement regarding an agreement or other document isqualified in all respects by such exhibit. You may read and copy all or any portion of the registration statement atthe Public Reference Room of the SEC at 100 F Street, N.E., Washington, D.C. 20549. Please call the SEC at1-800-SEC-0330 for further information about the public reference rooms. The SEC maintains a website,http://www.sec.gov, that contains reports, proxy and information statements and other information regardingregistrants, such as Morgan Stanley and Discover, that file electronically with the SEC. Upon effectiveness of ourregistration statement on Form 10 of which this information statement forms a part, we will become subject tothe information and periodic reporting requirements of the Securities Exchange Act of 1934, as amended, and, inaccordance therewith, will file periodic reports, proxy statements and other information with the SEC. Theseperiodic reports, proxy statements and other information will be available for inspection and copying at theSEC’s public reference rooms and the SEC’s website.
We intend to furnish our stockholders with annual reports containing consolidated financial statements(beginning with the year ending November 30, 2007) audited, and with an opinion expressed by, an independentregistered public accounting firm.
You should rely only on the information contained in this information statement and other documentsreferred to in this information statement. Neither we nor Morgan Stanley has authorized anyone to provide youwith information that is different. This information statement is being furnished by Morgan Stanley solely toprovide information to Morgan Stanley stockholders who will receive Discover common stock in thedistribution. It is not, and it is not to be construed as, an inducement or encouragement to buy or sell anysecurities of Morgan Stanley or Discover. We and Morgan Stanley believe that the information presented hereinis accurate as of the date hereof. Changes will occur after the date of this information statement, and neither wenor Morgan Stanley will update the information except to the extent required in the normal course of ourrespective public disclosure practices and as required pursuant to the federal securities laws.
149

GLOSSARY OF SELECTED TERMINOLOGY
Account seasoning—Refers to the length of time an account relationship has been in existence, withoutregard to any related loan balance. In contrast, aging refers to the length of time a receivable balance has been inexistence.
Accrued interest receivable—Accrued interest receivable represents interest earned but not yet billed tocardmembers’ accounts. Accrued interest receivable applicable to owned loans is presented on the face of ourcombined statements of financial condition. Accrued interest receivable related to securitized loans is included inamounts due from asset securitization and is a component of securitized loans. See also “Securitized loans.”
Acquirer interchange—A fee paid by a merchant acquirer to our network to compensate us for networkoperating and other costs. We earn income, recognized as acquirer interchange revenue, on all Discover Networktransactions made by cardholders at merchants that have entered into contractual arrangements to acceptDiscover Network cards with third-party merchant acquirers.
Active account—A credit card account with a debit or credit balance, monetary transaction or authorizationin the current billing period.
Affinity card—A credit card issued by a financial institution in conjunction with an organization or specialddinterest group.
Asset securitization—A funding mechanism in which a pool of financial assets, such as credit card loanreceivables, is transferred to a trust. Interests in the trust, commonly referred to as asset-backed securities, areissued and sold to investors. The trust uses the proceeds from the issuance of asset-backed securities to pay thepurchase price for the transferred loan receivables. The cash flows from the credit card loan receivables are usedto pay interest and principal on the securities and to reimburse other costs on the securities issued by the trust.Asset securitizations that qualify for sale accounting treatment, as our securitizations do, have the effect ofremoving the credit card loan receivables from the combined statements of financial condition. Also, portions ofinterest income, provision for loan losses and certain components of other income related to the transferred loansare no longer reported in our statements of income; however, they remain significant factors in determiningsecuritization income we receive on our retained beneficial interests in those transactions, which is reported inother income.
Balance transfer—The use of a cardholder’s available credit on their credit card account to pay a balance, inrrwhole or in part, on a credit card account with another financial institution for which a balance transfer fee maybe assessed on the cardholder’s account.
Brokered deposits—Bank deposits, such as certificates of deposit, sourced by third parties or brokers whoreceive a commission.
Card issuing entity—A financial institution that issues credit, debit or prepaid cards to cardholders.
Cardholder—A generic term that refers to the individual owner or authorized user of a debit, credit orrrprepaid account, regardless of the issuer. Includes holders of Discover Network cards issued by third parties.
Cardmember—The owner of a credit, debit or prepaid account issued by us.rr
Credit card loan receivables—Represents the outstanding amount due from cardmembers for charges madeon their credit cards as well as any unpaid billed finance charges and card-related fees.
Discount revenue—A fee paid by a merchant either to a merchant acquirer or network operator in exchangefor the benefits of card acceptance (commonly referred to as merchant discount). We earn discount revenue for
150

transactions made by cardholders using Discover Network cards at merchants with whom we have an acquirerrelationship. The discount revenue is generally deducted from our payment to the merchant to settle cardholderpurchase activity.
Excess spread—The interest and other revenue earned on securitized loans less certain costs, including loanddlosses on those receivables, servicing fees, credit enhancement fees and the interest paid to investors in the asset-backed securities; also referred to as excess servicing fees.
FICO score—A credit score developed by Fair Isaac & Co. that is widely used as a means of evaluating thelikelihood that credit users will pay their debt obligations. A FICO score of 660 or below is one of a number ofcredit risk characteristics considered by U.S. banking regulators as illustrative of a subprime borrower.
Fraud losses—Charge-offs of fraudulently originated account transactions, net of amounts recovered.
Interest-only strip receivable—A retained interest recognized by us upon the securitization of credit cardreceivables. The interest-only strip receivable represents the estimated fair value of our rights to certain excesscash flows allocated to securitized loans that remain after the reimbursement of securitization transaction costs,specifically the contractual rate of return paid to investors for their interests in the transactions, the payment ofservicing fees to us and the reimbursement to the trust for credit losses (i.e., the excess spread).
Issuer interchange—A fee paid to a card issuing entity as compensation for risk and operating costs. Weearn income, recognized as interchange revenue, on all transactions made by cardmembers using cards issued byus on the Visa and MasterCard networks in the United Kingdom. We recognize an obligation to pay interchangeto card issuing entities that have entered into contractual arrangements with us to issue Discover Network cards.
Late fee—A fee which may be assessed on a cardmember’s account when the minimum payment due is notreceived by the payment due date.
Loan losses—Also referred to as credit losses. Net amounts written-off as a result of failure bycardmembers to repay amounts owed on their accounts. The allowance for loan losses reported on the combinedstatements of financial condition is management’s estimate of the amount of probable loan losses inherent in theloan portfolio. The provision for loan losses reported on the combined statements of income reflects thecumulative adjustments made in the period to establish and maintain the allowance for loan losses at theappropriate level.
Managed loans—Loans reported on our combined statements of financial condition in accordance withGAAP (“owned loans”), as well as loan receivables that have been securitized (“securitized loans”). See also“Owned loans” and “Securitized loans.”
Merchant acquirer—An entity that solicits and signs up merchants to accept payment cards. The merchantrracquirer arranges for payment processing services for the merchant. See also “Discount revenue.”
Nonaccruing loans—Cardmember loans that are not currently accruing interest. We stop accruing intereston loans after receiving notice of cardmember bankruptcy or death, as well as on fraudulent transactions. Wemay also stop accruing interest on loans to assist cardmembers who have experienced financial difficulties inrepaying loan balances.
Overlimit fee—A fee which may be assessed on a cardmember’s account when the pre-established creditlimit is exceeded.
Owned loans—Represents loan receivables that have not been securitized and which are therefore stillrecorded on our combined statements of financial condition. Owned loans reflect our on-balance sheet loanportfolio and loans held for sale, and include the undivided seller’s interest we retain in securitized loans. Seealso “Securitized loans.”
151
Payment cards—Includes all credit cards, debit cards and prepaid cards.
PIN-based payment—A debit transaction at any automated teller machine or merchant point-of-salett(“POS”) terminal where a cardholder must enter a personal identification number (“PIN”) to complete thetransaction.
Prepaid cards—Prepaid financial instruments, including gift cards and reloadable cards, which holders canuse for purchasing goods and services.
Re-age—A re-aging adjusts the status of a cardmember’s account from past due to current whereconforming partial payment of past due amounts has been received. Re-ages assist cardmembers who haveexperienced financial difficulties and who have demonstrated an ability and willingness to repay in order to curetheir delinquency and return their accounts to current status. The granting of re-ages must comply with bankregulatory guidelines.
Revolving—When a cardholder does not pay a balance in full when due and the remaining balance is carriedforward and subject to finance charges.
Sales volume—The dollar value of cardmembers’ purchase activity at merchants, net of returns.
Securitization income—Securitization income includes the gain on sale recognized at the time a newsecuritization transaction is executed, the impact of period-to-period changes in the valuation of the interest-onlystrip receivable and other retained interests, excess spread relating to the securitized loans and fees for thecontinued servicing of the securitized loans net of certain issuance costs. See also “Asset securitization“ .”
Securitized loans—The total of securitized loans is equal to asset-backed securities outstanding and theassociated accrued interest receivable, which is a component of amounts due from asset securitization on ourcombined statements of financial condition. See also “Accrued interest receivable“ .”
Signature-based payment—Payment transactions in which the cardholder signs a sales receipt, as opposedttto entering a PIN, to complete a transaction.
Switch fee—A fee paid by a financial institution for routing an ATM, POS or debit transaction over thePULSE switch. The switch refers to a cluster of servers and software that routes electronic transactions amongterminals and processors that hold the cardholder’s account records.
Third-party issuer—An entity unrelated to us who issues credit, debit, prepaid or other card products thatrrare accepted on the Discover Network.
Undivided seller’s interest—Represents the amount of receivables transferred by us to the trust in excess ofttthe amount backing outstanding securities issued by the trust to investors. Because cardmember balancesfluctuate daily, the retention of a seller’s interest is necessary to ensure the total balance of loans held by the trustremains sufficient to support the investor securities throughout the revolving period of a securitization.
152

INDEX TO FINANCIAL STATEMENTS
Page
Combined Financial Statements:Report of Independent Registered Public Accounting Firm . . . . . . . . . . . . . . . . . . . . . . . . . . . . . . . . . . F-2Combined Statements of Financial Condition as of November 30, 2006 and 2005 . . . . . . . . . . . . . . . . F-3Combined Statements of Income for the Years Ended November 30, 2006, 2005 and 2004 . . . . . . . . . F-4Combined Statements of Changes in Stockholder’s Equity for the Years Ended November 30, 2006,
2005 and 2004 . . . . . . . . . . . . . . . . . . . . . . . . . . . . . . . . . . . . . . . . . . . . . . . . . . . . . . . . . . . . . . . . . . . F-5Combined Statements of Cash Flows for the Years Ended November 30, 2006, 2005 and 2004 . . . . . F-6Notes to Combined Financial Statements . . . . . . . . . . . . . . . . . . . . . . . . . . . . . . . . . . . . . . . . . . . . . . . . F-7
Unaudited Interim Condensed Combined Financial StatementsCondensed Combined Statements of Financial Condition as of February 28, 2007 and November 30,
2006 . . . . . . . . . . . . . . . . . . . . . . . . . . . . . . . . . . . . . . . . . . . . . . . . . . . . . . . . . . . . . . . . . . . . . . . . . . . F-56Condensed Combined Statements of Income for the Three Months Ended February 28, 2007 and
2006 . . . . . . . . . . . . . . . . . . . . . . . . . . . . . . . . . . . . . . . . . . . . . . . . . . . . . . . . . . . . . . . . . . . . . . . . . . . F-57Condensed Combined Statements of Changes in Stockholder’s Equity for the Three Months Ended
February 28, 2007 . . . . . . . . . . . . . . . . . . . . . . . . . . . . . . . . . . . . . . . . . . . . . . . . . . . . . . . . . . . . . . . . F-58Condensed Combined Statements of Cash Flows for the Three Months Ended February 28, 2007 and
2006 . . . . . . . . . . . . . . . . . . . . . . . . . . . . . . . . . . . . . . . . . . . . . . . . . . . . . . . . . . . . . . . . . . . . . . . . . . . F-59Notes to Condensed Combined Financial Statements . . . . . . . . . . . . . . . . . . . . . . . . . . . . . . . . . . . . . . . F-60
F-1

REPORT OF INDEPENDENT REGISTERED PUBLIC ACCOUNTING FIRM
To the Board of Directors of Morgan Stanley and Stockholder ofDiscover Financial Services
We have audited the accompanying combined statements of financial condition of Discover FinancialServices (the “Company”), consisting of certain entities and accounts under the common ownership of MorganStanley, as of November 30, 2006 and 2005, and the related combined statements of income, changes instockholder’s equity, and cash flows for each of the three years in the period ended November 30, 2006. Thesecombined financial statements are the responsibility of the Company’s management. Our responsibility is toexpress an opinion on these combined financial statements based on our audits.
We conducted our audits in accordance with the standards of the Public Company Accounting OversightBoard (United States). Those standards require that we plan and perform the audit to obtain reasonable assuranceabout whether the financial statements are free of material misstatement. The Company is not required to have,nor were we engaged to perform, an audit of its internal control over financial reporting. Our audits includedconsideration of internal control over financial reporting as a basis for designing audit procedures that areappropriate in the circumstances, but not for the purpose of expressing an opinion on the effectiveness of theCompany’s internal control over financial reporting. Accordingly, we express no such opinion. An audit alsoincludes examining, on a test basis, evidence supporting the amounts and disclosures in the financial statements,assessing the accounting principles used and significant estimates made by management, as well as evaluatingthe overall financial statement presentation. We believe that our audits provide a reasonable basis for ouropinion.
In our opinion, such combined financial statements present fairly, in all material respects, the combinedfinancial position of the Company at November 30, 2006 and 2005, and the combined results of its operationsand its cash flows for each of the three years in the period ended November 30, 2006, in conformity withaccounting principles generally accepted in the United States of America.
As discussed in Note 1 to the combined financial statements, the Company is comprised of the Discoversegment of Morgan Stanley. The combined financial statements also include allocations from Morgan Stanley.The allocations may not be indicative of the conditions that would have existed or the results of operations hadthe Company operated as an independent entity apart from Morgan Stanley.
Chicago, IllinoisMarch 22, 2007 (May 16, 2007 as to the reclassification discussed in Note 26)
F-2

Discover Financial Services
Combined Statements of Financial ConditionNovember 30,
2006November 30,
2005
(dollars in thousands)AssetsCash and due from banks . . . . . . . . . . . . . . . . . . . . . . . . . . . . . . . . . . . . . . . . . . . . . . . . . . . . . . . . . . . $ 334,035 $ 292,453Federal Funds sold . . . . . . . . . . . . . . . . . . . . . . . . . . . . . . . . . . . . . . . . . . . . . . . . . . . . . . . . . . . . . . . . 525,000 250,000Commercial paper . . . . . . . . . . . . . . . . . . . . . . . . . . . . . . . . . . . . . . . . . . . . . . . . . . . . . . . . . . . . . . . . . 15,322 13,029
Cash and cash equivalents . . . . . . . . . . . . . . . . . . . . . . . . . . . . . . . . . . . . . . . . . . . . . . . . . . . . . . . 874,357 555,482Interest earning deposits in other banks . . . . . . . . . . . . . . . . . . . . . . . . . . . . . . . . . . . . . . . . . . . . . . . . — 1,688Investment securities:
Available-for-sale (amortized cost of $2,000 at November 30, 2006 and 2005) . . . . . . . . . . . . . 2,314 2,362Held-to-maturity (fair value $82,241 and $14,261 at November 30, 2006 and 2005,
respectively) . . . . . . . . . . . . . . . . . . . . . . . . . . . . . . . . . . . . . . . . . . . . . . . . . . . . . . . . . . . . . . . 82,097 14,357Loan receivables:
Loans held for sale . . . . . . . . . . . . . . . . . . . . . . . . . . . . . . . . . . . . . . . . . . . . . . . . . . . . . . . . . . . . 1,056,380 3,128,540Loan portfolio:
Credit card . . . . . . . . . . . . . . . . . . . . . . . . . . . . . . . . . . . . . . . . . . . . . . . . . . . . . . . . . . . . . . . 22,535,181 19,370,520Commercial loans . . . . . . . . . . . . . . . . . . . . . . . . . . . . . . . . . . . . . . . . . . . . . . . . . . . . . . . . . 59,089 —Other consumer loans . . . . . . . . . . . . . . . . . . . . . . . . . . . . . . . . . . . . . . . . . . . . . . . . . . . . . . 92,100 304,106
Total loan portfolio . . . . . . . . . . . . . . . . . . . . . . . . . . . . . . . . . . . . . . . . . . . . . . . . . . . . 22,686,370 19,674,626
Total loan receivables . . . . . . . . . . . . . . . . . . . . . . . . . . . . . . . . . . . . . . . . . . . . . . . . . . 23,742,750 22,803,166Allowance for loan losses . . . . . . . . . . . . . . . . . . . . . . . . . . . . . . . . . . . . . . . . . . . . . . . . . . . . . . . (832,483) (838,848)
Net loan receivables . . . . . . . . . . . . . . . . . . . . . . . . . . . . . . . . . . . . . . . . . . . . . . . . . . . 22,910,267 21,964,318Accrued interest receivable . . . . . . . . . . . . . . . . . . . . . . . . . . . . . . . . . . . . . . . . . . . . . . . . . . . . . . . . . . 123,955 127,240Amounts due from asset securitization . . . . . . . . . . . . . . . . . . . . . . . . . . . . . . . . . . . . . . . . . . . . . . . . . 3,169,895 2,784,852Premises and equipment, net . . . . . . . . . . . . . . . . . . . . . . . . . . . . . . . . . . . . . . . . . . . . . . . . . . . . . . . . . 660,900 624,525Goodwill . . . . . . . . . . . . . . . . . . . . . . . . . . . . . . . . . . . . . . . . . . . . . . . . . . . . . . . . . . . . . . . . . . . . . . . . 533,728 255,421Intangible assets, net . . . . . . . . . . . . . . . . . . . . . . . . . . . . . . . . . . . . . . . . . . . . . . . . . . . . . . . . . . . . . . . 201,177 66,623Other assets . . . . . . . . . . . . . . . . . . . . . . . . . . . . . . . . . . . . . . . . . . . . . . . . . . . . . . . . . . . . . . . . . . . . . . 508,552 547,055
Total assets . . . . . . . . . . . . . . . . . . . . . . . . . . . . . . . . . . . . . . . . . . . . . . . . . . . . . . . . . . $29,067,242 $26,943,923
Liabilities and Stockholder’s EquityDeposits:
Interest bearing deposit accounts . . . . . . . . . . . . . . . . . . . . . . . . . . . . . . . . . . . . . . . . . . . . . . . . . $13,238,827 $15,966,826Non-interest bearing deposit accounts . . . . . . . . . . . . . . . . . . . . . . . . . . . . . . . . . . . . . . . . . . . . . 105,032 98,806
Total deposits . . . . . . . . . . . . . . . . . . . . . . . . . . . . . . . . . . . . . . . . . . . . . . . . . . . . . . . . 13,343,859 16,065,632Short-term borrowings:
Short-term borrowings from Morgan Stanley . . . . . . . . . . . . . . . . . . . . . . . . . . . . . . . . . . . . . . . . 6,639,678 3,773,060Term Federal Funds purchased . . . . . . . . . . . . . . . . . . . . . . . . . . . . . . . . . . . . . . . . . . . . . . . . . . . 100,000 —
Total short-term borrowings . . . . . . . . . . . . . . . . . . . . . . . . . . . . . . . . . . . . . . . . . . . . . 6,739,678 3,773,060Long-term borrowings:
Long-term borrowings from Morgan Stanley . . . . . . . . . . . . . . . . . . . . . . . . . . . . . . . . . . . . . . . . 1,251,662 606,796Other long-term debt and bank notes . . . . . . . . . . . . . . . . . . . . . . . . . . . . . . . . . . . . . . . . . . . . . . 255,916 256,949
Total long-term borrowings . . . . . . . . . . . . . . . . . . . . . . . . . . . . . . . . . . . . . . . . . . . . . 1,507,578 863,745Accrued interest payable . . . . . . . . . . . . . . . . . . . . . . . . . . . . . . . . . . . . . . . . . . . . . . . . . . . . . . . . . . . . 135,464 181,917Accrued expenses and other liabilities . . . . . . . . . . . . . . . . . . . . . . . . . . . . . . . . . . . . . . . . . . . . . . . . . 1,565,891 1,459,120
Total liabilities . . . . . . . . . . . . . . . . . . . . . . . . . . . . . . . . . . . . . . . . . . . . . . . . . . . . . . . . 23,292,470 22,343,474Commitments, contingencies and guarantees (Note 20)Stockholder’s EquityCommon stock ($100 par value; 50,000 shares authorized; 1,000 shares issued and outstanding in
2006 and 2005) . . . . . . . . . . . . . . . . . . . . . . . . . . . . . . . . . . . . . . . . . . . . . . . . . . . . . . . . . . . . . . . . . 100 100Paid-in capital . . . . . . . . . . . . . . . . . . . . . . . . . . . . . . . . . . . . . . . . . . . . . . . . . . . . . . . . . . . . . . . . . . . . 2,636,265 2,123,324Retained earnings . . . . . . . . . . . . . . . . . . . . . . . . . . . . . . . . . . . . . . . . . . . . . . . . . . . . . . . . . . . . . . . . . 3,008,421 2,431,805Accumulated other comprehensive income . . . . . . . . . . . . . . . . . . . . . . . . . . . . . . . . . . . . . . . . . . . . . . 129,986 45,220
Total stockholder’s equity . . . . . . . . . . . . . . . . . . . . . . . . . . . . . . . . . . . . . . . . . . . . . . . 5,774,772 4,600,449
Total liabilities and stockholder’s equity . . . . . . . . . . . . . . . . . . . . . . . . . . . . . . . . . . . $29,067,242 $26,943,923
See Notes to Combined Financial Statements.
F-3
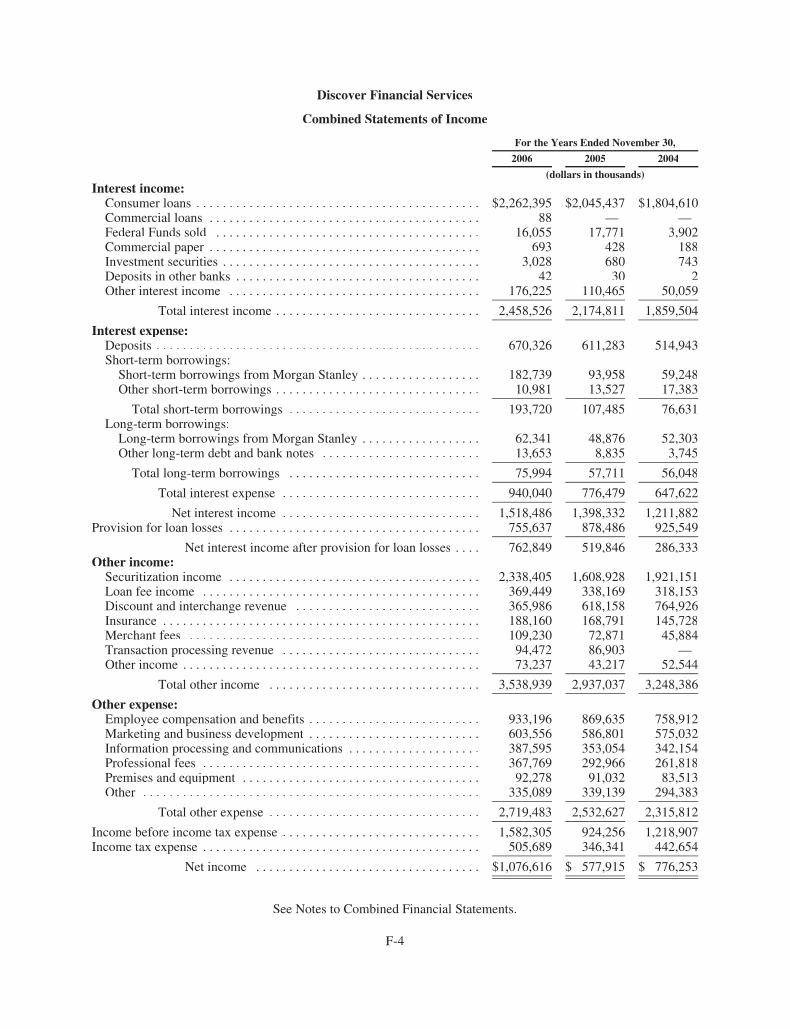
Discover Financial Services
Combined Statements of Income
For the Years Ended November 30,
2006 2005 2004
(dollars in thousands)Interest income:
Consumer loans . . . . . . . . . . . . . . . . . . . . . . . . . . . . . . . . . . . . . . . . . . . $2,262,395 $2,045,437 $1,804,610Commercial loans . . . . . . . . . . . . . . . . . . . . . . . . . . . . . . . . . . . . . . . . . 88 — —Federal Funds sold . . . . . . . . . . . . . . . . . . . . . . . . . . . . . . . . . . . . . . . . 16,055 17,771 3,902Commercial paper . . . . . . . . . . . . . . . . . . . . . . . . . . . . . . . . . . . . . . . . . 693 428 188Investment securities . . . . . . . . . . . . . . . . . . . . . . . . . . . . . . . . . . . . . . . 3,028 680 743Deposits in other banks . . . . . . . . . . . . . . . . . . . . . . . . . . . . . . . . . . . . . 42 30 2Other interest income . . . . . . . . . . . . . . . . . . . . . . . . . . . . . . . . . . . . . . 176,225 110,465 50,059
Total interest income . . . . . . . . . . . . . . . . . . . . . . . . . . . . . . . 2,458,526 2,174,811 1,859,504
Interest expense:Deposits . . . . . . . . . . . . . . . . . . . . . . . . . . . . . . . . . . . . . . . . . . . . . . . . . 670,326 611,283 514,943Short-term borrowings:
Short-term borrowings from Morgan Stanley . . . . . . . . . . . . . . . . . . 182,739 93,958 59,248Other short-term borrowings . . . . . . . . . . . . . . . . . . . . . . . . . . . . . . . 10,981 13,527 17,383
Total short-term borrowings . . . . . . . . . . . . . . . . . . . . . . . . . . . . . 193,720 107,485 76,631Long-term borrowings:
Long-term borrowings from Morgan Stanley . . . . . . . . . . . . . . . . . . 62,341 48,876 52,303Other long-term debt and bank notes . . . . . . . . . . . . . . . . . . . . . . . . 13,653 8,835 3,745
Total long-term borrowings . . . . . . . . . . . . . . . . . . . . . . . . . . . . . 75,994 57,711 56,048
Total interest expense . . . . . . . . . . . . . . . . . . . . . . . . . . . . . . 940,040 776,479 647,622
Net interest income . . . . . . . . . . . . . . . . . . . . . . . . . . . . . . 1,518,486 1,398,332 1,211,882Provision for loan losses . . . . . . . . . . . . . . . . . . . . . . . . . . . . . . . . . . . . . . 755,637 878,486 925,549
Net interest income after provision for loan losses . . . . 762,849 519,846 286,333Other income:
Securitization income . . . . . . . . . . . . . . . . . . . . . . . . . . . . . . . . . . . . . . 2,338,405 1,608,928 1,921,151Loan fee income . . . . . . . . . . . . . . . . . . . . . . . . . . . . . . . . . . . . . . . . . . 369,449 338,169 318,153Discount and interchange revenue . . . . . . . . . . . . . . . . . . . . . . . . . . . . 365,986 618,158 764,926Insurance . . . . . . . . . . . . . . . . . . . . . . . . . . . . . . . . . . . . . . . . . . . . . . . . 188,160 168,791 145,728Merchant fees . . . . . . . . . . . . . . . . . . . . . . . . . . . . . . . . . . . . . . . . . . . . 109,230 72,871 45,884Transaction processing revenue . . . . . . . . . . . . . . . . . . . . . . . . . . . . . . 94,472 86,903 —Other income . . . . . . . . . . . . . . . . . . . . . . . . . . . . . . . . . . . . . . . . . . . . . 73,237 43,217 52,544
Total other income . . . . . . . . . . . . . . . . . . . . . . . . . . . . . . . . 3,538,939 2,937,037 3,248,386
Other expense:Employee compensation and benefits . . . . . . . . . . . . . . . . . . . . . . . . . . 933,196 869,635 758,912Marketing and business development . . . . . . . . . . . . . . . . . . . . . . . . . . 603,556 586,801 575,032Information processing and communications . . . . . . . . . . . . . . . . . . . . 387,595 353,054 342,154Professional fees . . . . . . . . . . . . . . . . . . . . . . . . . . . . . . . . . . . . . . . . . . 367,769 292,966 261,818Premises and equipment . . . . . . . . . . . . . . . . . . . . . . . . . . . . . . . . . . . . 92,278 91,032 83,513Other . . . . . . . . . . . . . . . . . . . . . . . . . . . . . . . . . . . . . . . . . . . . . . . . . . . 335,089 339,139 294,383
Total other expense . . . . . . . . . . . . . . . . . . . . . . . . . . . . . . . . 2,719,483 2,532,627 2,315,812
Income before income tax expense . . . . . . . . . . . . . . . . . . . . . . . . . . . . . . 1,582,305 924,256 1,218,907Income tax expense . . . . . . . . . . . . . . . . . . . . . . . . . . . . . . . . . . . . . . . . . . 505,689 346,341 442,654
Net income . . . . . . . . . . . . . . . . . . . . . . . . . . . . . . . . . . $1,076,616 $ 577,915 $ 776,253
See Notes to Combined Financial Statements.
F-4

Discover Financial Services
Combined Statements of Changes in Stockholder’s Equity
CommonStock
AdditionalPaid-inCapital
RetainedEarnings
AccumulatedOther
ComprehensiveIncome (Loss)
TotalStockholder’s
Equity
(dollars in thousands)Balance at November 30, 2003 . . . . . . . . . . . $100 $2,042,357 $1,719,294 $ 47,534 $3,809,285
Comprehensive income:Net income . . . . . . . . . . . . . . . . . . . . . . — — 776,253 — 776,253Foreign currency translation
(accumulated amount of $88,972 atNovember 30, 2004) . . . . . . . . . . . . . — — — 41,580 41,580
Net unrealized gains on investmentsecurities . . . . . . . . . . . . . . . . . . . . . . — — — 240 240
Other comprehensive income . . . . — — — — 41,820
Comprehensive income . . . . . — — — — 818,073Capital contribution from Morgan
Stanley . . . . . . . . . . . . . . . . . . . . . . . . . . . . — 35,648 — — 35,648Cash dividends paid to Morgan Stanley . . . . — — (637,000) — (637,000)Other . . . . . . . . . . . . . . . . . . . . . . . . . . . . . . . — — (4,657) — (4,657)
Balance at November 30, 2004 . . . . . . . . . . . 100 2,078,005 1,853,890 89, 354 4,021,349
Comprehensive income:Net income . . . . . . . . . . . . . . . . . . . . . . — — 577,915 — 577,915Foreign currency translation
(accumulated amount of $45,229 atNovember 30, 2005) . . . . . . . . . . . . . — — — (43,743) (43,743)
Net unrealized losses on investmentsecurities . . . . . . . . . . . . . . . . . . . . . . — — — (154) (154)
Other . . . . . . . . . . . . . . . . . . . . . . . . . . . — — — (237) (237)
Other comprehensive loss . . . . . . . — — — — (44,134)
Comprehensive income . . . . . — — — — 533,781Capital contribution from Morgan Stanley . . . — 42,133 42,133Other . . . . . . . . . . . . . . . . . . . . . . . . . . . . . . . — 3,186 — — 3,186
Balance at November 30, 2005 . . . . . . . . . . . 100 2,123,324 2,431,805 45,220 4,600,449
Comprehensive income:Net income . . . . . . . . . . . . . . . . . . . . . . — — 1,076,616 — 1,076,616Foreign currency translation
(accumulated amount of $129,984 atNovember 30, 2006) . . . . . . . . . . . . . — — — 84,755 84,755
Net unrealized losses on investmentsecurities . . . . . . . . . . . . . . . . . . . . . . — — — (25) (25)
Other . . . . . . . . . . . . . . . . . . . . . . . . . . . — — — 36 36
Other comprehensive income . . . . — — — — 84,766
Comprehensive income . . . . . — — — — 1,161,382Capital contribution from Morgan
Stanley . . . . . . . . . . . . . . . . . . . . . . . . . . . . — 512,941 — — 512,941Cash dividends paid to Morgan Stanley . . . . — — (500,000) — (500,000)
Balance at November 30, 2006 . . . . . . . . . . . $100 $2,636,265 $3,008,421 $129,986 $5,774,772
See Notes to Combined Financial Statements.
F-5

Discover Financial Services
Combined Statements of Cash Flows
For the Years Ended November 30,
2006 2005 2004
(dollars in thousands)Cash flows from operating activities
Net income . . . . . . . . . . . . . . . . . . . . . . . . . . . . . . . . . . . . . . . . . . . . . . . . . . $ 1,076,616 $ 577,915 $ 776,253Adjustments to reconcile net income to net cash provided by operating
activities:Gains on sale of mortgages and installment loans . . . . . . . . . . . . . . . . (7,399) (6,195) (9,673)Net principal disbursed on loans originated for sale . . . . . . . . . . . . . . (207,659) (115,901) (202,832)Proceeds from sale of loans originated for sale . . . . . . . . . . . . . . . . . . 213,545 124,739 245,592Deferred income taxes . . . . . . . . . . . . . . . . . . . . . . . . . . . . . . . . . . . . . 76,285 (43,608) (25,367)Depreciation and amortization on premises and equipment . . . . . . . . 113,169 112, 856 116,751Other depreciation and amortization . . . . . . . . . . . . . . . . . . . . . . . . . . 109,629 101,455 76,379Provision for loan losses . . . . . . . . . . . . . . . . . . . . . . . . . . . . . . . . . . . 755,637 878,486 925,549Amortization of deferred revenues . . . . . . . . . . . . . . . . . . . . . . . . . . . (26,150) (28,998) (31,951)Changes in assets and liabilities:
(Increase) decrease in amounts due from assetsecuritizations . . . . . . . . . . . . . . . . . . . . . . . . . . . . . . . . . . . . . (377,273) 91,106 127,269
(Increase) decrease in other assets . . . . . . . . . . . . . . . . . . . . . . . . (52,542) (33,882) 106,548Increase (decrease) in accrued expenses and other liabilities . . . 46,929 (21,899) (516,559)
Net cash provided by operating activities . . . . . . . . . . . . . . . . . . . . . . . . . . . . . . 1,720,787 1,636,074 1,587,959Cash flows from investing activities
Net proceeds from (payments for):Business and other acquisitions (net of cash received of $0 and $692,
respectively) . . . . . . . . . . . . . . . . . . . . . . . . . . . . . . . . . . . . . . . . . . . (1,924,491) (323,426) —Maturities of investment securities held-to-maturity . . . . . . . . . . . . . . 6,952 5,422 5,640Purchases of investment securities held-to-maturity . . . . . . . . . . . . . . (73,055) (10,529) (6,283)Proceeds from securitization and sale of loans held for investment . . 8,949,961 7,324,055 3,714,735Net principal disbursed on loans held for investment . . . . . . . . . . . . . (8,839,046) (11,207,376) (5,378,614)Purchases of premises and equipment . . . . . . . . . . . . . . . . . . . . . . . . . (144,151) (97,963) (98,712)
Net cash used in investing activities . . . . . . . . . . . . . . . . . . . . . . . . . . . . . . . . . . (2,023,830) (4,309,817) (1,763,234)Cash flows from financing activities
Net increase (decrease) in short-term borrowings . . . . . . . . . . . . . . . . 3,258,908 (380,173) (522,906)Proceeds from issuance of long-term debt . . . . . . . . . . . . . . . . . . . . . . 638,691 — 340,879Maturity of long-term debt and bank notes . . . . . . . . . . . . . . . . . . . . . (45,621) (321,242) (104,451)Net (decrease) increase in deposits . . . . . . . . . . . . . . . . . . . . . . . . . . . (2,730,723) 3,127,611 645,012Cash dividends paid to Morgan Stanley . . . . . . . . . . . . . . . . . . . . . . . (500,000) — (637,000)
Net cash provided by (used for) financing activities . . . . . . . . . . . . . . . . . . . . . . 621,255 2,426,196 (278,466)Effect of exchange rate changes on cash and cash equivalents . . . . . . . . . . . . . . 663 (1,583) 3,496
Net increase (decrease) in cash and cash equivalents . . . . . . . . . . . . . . . . . . . . . 318,875 (249,130) (450,245)Cash and cash equivalents, at beginning of year . . . . . . . . . . . . . . . . . . . . . . . . . 555,482 804,612 1,254,857
Cash and cash equivalents, at end of year . . . . . . . . . . . . . . . . . . . . . . . . . . . . . . $ 874,357 $ 555,482 $ 804,612
SUPPLEMENTAL DISCLOSURES OF CASH FLOW INFORMATION:Cash paid during the year for
Interest expense paid . . . . . . . . . . . . . . . . . . . . . . . . . . . . . . . . . . . . . . $ 992,575 $ 710,748 $ 655,268
Income taxes, net of income tax refunds . . . . . . . . . . . . . . . . . . . . . . . $ 519,717 $ 437,158 $ 481,675
Non-cash transactions:Capital contributions from Morgan Stanley . . . . . . . . . . . . . . . . . . . . $ 512,941 $ 42,133 $ 35,648
Capitalized leases . . . . . . . . . . . . . . . . . . . . . . . . . . . . . . . . . . . . . . . . . $ (1,153) $ 4,203 $ (4,337)
See Notes to Combined Financial Statements.
F-6

Discover Financial Services
Notes to Combined Financial Statements
1. Formation of the Company and Basis of Presentation
Distribution. On December 19, 2006, Morgan Stanley, a global financial services firm, announced that itsBoard of Directors had authorized the separation and distribution of its Discover segment (the “Company”) to theholders of Morgan Stanley common stock (the “Distribution”). Prior to the Distribution, the Discover segmentcomprises Discover Financial Services (formerly known as NOVUS Credit Services Inc.) (“DFS”), a wholly-owned subsidiary of Morgan Stanley, as well as certain other subsidiaries and assets related to credit cardoperations in the United Kingdom (“U.K.”) to be contributed or sold to the Discover segment by Morgan Stanleypursuant to a separation and distribution agreement to be entered into between the companies. DFS is a DelawareCorporation whose principal subsidiaries include Discover Financial Services LLC, a Delaware limited liabilitycompany headquartered in Riverwoods, Illinois, and two Delaware state-chartered banks, Discover Bank andBank of New Castle, both of which are regulated by the Federal Deposit Insurance Corporation (“FDIC”) and theDelaware State Bank Commissioner. Following the Distribution, Morgan Stanley and the Company will beindependent, publicly-owned companies with separate boards of directors and management. The Distribution issubject to final approval by Morgan Stanley’s Board of Directors. The Distribution is expected to occur duringthe Company’s third fiscal quarter in 2007. Prior to the Distribution, a total of 50,000 shares of common stock ofDFS was authorized with par value of $100 per share, and 1,000 shares were issued and outstanding. TheCompany expects to increase the number of shares and decrease the par value of its common stock to facilitatethe Distribution.
Basis of Presentation. The combined financial statements have been prepared in accordance withaccounting principles generally accepted in the United States of America (“GAAP”), which require the Companyto make estimates and assumptions that affect reported amounts in the combined financial statements and relateddisclosures. These estimates are based on information available as of the date of the combined financialstatements. The Company believes that the estimates used in the preparation of the combined financial statementsare reasonable. Actual results could differ from those estimates.
The accompanying combined financial statements were prepared in connection with the Distribution. Thesecombined financial statements reflect the historical combined results of operations, financial condition and cashflows of the Morgan Stanley subsidiaries that comprised its Discover segment (as described in the precedingsection) for the periods presented. The combined statements of income reflect intercompany expense allocationsmade to the Discover segment by Morgan Stanley for certain corporate functions such as treasury, financialcontrol, human resources, internal audit, legal, investor relations and various other functions historically providedby Morgan Stanley. Where possible, these allocations were made on a specific identification basis. Otherwise,such expenses were allocated by Morgan Stanley based on relative percentages of headcount or some other basisdepending on the nature of the cost that was allocated. These historical cost allocations may not be indicative ofcosts the Company will incur to obtain these same services as an independent entity. See Note 26: Related PartyTransactions for further information on expenses allocated by Morgan Stanley. Prior to the Distribution fromMorgan Stanley, the Company will enter into certain transitional services agreements with Morgan Stanley andits subsidiaries to obtain certain corporate services for a period of up to eighteen months at prices negotiatedbetween the two companies. As a stand-alone entity, the Company expects to incur expenses that may not becomparable in future periods to what is reported for the historical periods presented in these combined financialstatements.
These financial statements present the combined financial condition, results of operations and cash flows ofthe Company, which prior to the Distribution was under the common control and management of MorganStanley. The historical financial results in the combined financial statements presented may not be indicative ofthe results that would have been achieved had the Company operated as a separate, stand-alone entity duringthose periods. The combined financial statements presented do not reflect any changes that may occur in the
F-7

financing and operations of the Company as a result of the Distribution. The Company is expected to have acapital structure different from the capital structure in the combined financial statements and accordingly, interestexpense is not necessarily indicative of the interest expense that the Company would have incurred as a separate,independent company. However, management believes that the combined financial statements include alladjustments necessary for a fair presentation of the business. All intercompany balances and transactions of theCompany have been eliminated.
Principles of Consolidation. The combined financial statements include the accounts of the Company andits wholly-owned subsidiaries. The Company’s policy is to consolidate all entities in which it owns more than50% of the outstanding voting stock unless it does not control the entity. However, the Company did not have acontrolling financial interest in any entity other than its wholly-owned subsidiaries in the periods presented in theaccompanying combined financial statements. It is also the Company’s policy to consolidate any variable interestentity for which the Company is the primary beneficiary, as required by Financial Accounting Standards Board(“FASB”) Interpretation No. 46R, Consolidation of Variable Interest Entities (revised December 2003)—aninterpretation of ARB No. 51 (“FIN 46R”). However, the Company has determined that it was not the primarybeneficiary of any variable interest entity in the periods presented in the accompanying combined financialstatements. For investments in any entities in which the Company owns 50% or less of the outstanding votingstock but in which the Company has significant influence over operating and financial decisions, the Companyapplies the equity method of accounting. In cases where the Company’s investment is less than 20% andsignificant influence does not exist, such investments are carried at cost.
Whenever the Company securitizes credit card receivables, it does so using trusts that are considered to bequalifying special purpose entities (“QSPEs”) under Statement of Financial Accounting Standards No. 140,Accounting for Transfers and Servicing of Financial Assets and Extinguishments of Liabilities, as amended(“Statement No. 140”). As QSPEs, these trusts are specifically exempted from the consolidation provisions ofFIN 46R. Pursuant to the provisions of Statement No. 140 and FIN 46R, these QSPEs are not consolidated by orcombined with the Company and are therefore excluded from the accompanying combined financial statements.
2. Description of Business
The Company is a leading credit card issuer and electronic payment services company. The Company’sbusiness segments include U.S. Card, International Card and Third-Party Payments. The U.S. Card segmentincludes Discover Card-branded credit cards issued over the Discover Network and other consumer lending anddeposit products offered through the Company’s Discover Bank subsidiary. The International Card segmentincludes credit cards and consumer lending products and services in the United Kingdom. The Third-PartyPayments segment includes PULSE, an automated teller machine, debit and electronic funds transfer networkand the Company’s third-party payments business. See Note 23: Segment Disclosures for additional informationabout the Company’s operating segments.
3. Summary of Significant Accounting Policies
Cash and Cash Equivalents. Cash and cash equivalents includes cash and due from banks, Federal Fundssold and commercial paper. Cash and due from banks is defined by the Company as cash on hand and on depositwith banks, including time deposits and other highly liquid investments with maturities of 90 days or less whenpurchased.
Investment Securities. Investment securities consist of U.S. Treasury obligations, mortgage-backedsecurities issued by government and government-sponsored agencies and state agency bonds, all of which havematurities of six months or more when purchased. Investment securities are classified based on management’sintent on the date of purchase. Investment securities which the Company has the positive intent and ability tohold to maturity are classified as held–to-maturity and are reported at amortized cost. All other investmentsecurities are classified as available-for-sale, as the Company does not hold investment securities for trading
F-8

purposes. Investment securities available-for-sale are reported at fair value with unrealized gains and losses, netof tax, reported as a component of accumulated other comprehensive income included in stockholder’s equity.The amortized cost, for both held-to-maturity and available-for–sale securities, is adjusted for amortization ofpremiums and accretion of discounts. Such amortization or accretion is included in interest income. TheCompany evaluates its unrealized loss positions for impairment in accordance with FASB Staff PositionNo. 115-1, The Meaning of Other-Than-Temporary Impairment and its Application to Certain Investments.Realized gains and losses and other-than-temporary impairments related to investment securities are determinedusing the specific identification method and are reported in other income.
Retained Interests in Securitized Assets. The Company periodically transfers credit card loan receivables toasset securitization trusts. Securitized credit card loan receivables include outstanding principal, interest and fees.The Company’s securitization transactions are recognized as sales under Statement No. 140; accordingly, theCompany removes securitized credit card receivables from its combined statements of financial condition. TheCompany may retain interests in the transferred financial assets in various forms including an undivided seller’sinterest, accrued interest and fees on securitized credit card receivables (“accrued interest receivable”), cashcollateral accounts, servicing rights and rights to certain excess cash flows remaining after payments to investorsin the securitization trust of their contractual rate of return, the payment of servicing fees to the Company andreimbursement of credit card losses (“interest-only strip receivables”).
The Company includes its undivided seller’s interest within loan receivables in the combined statements offinancial condition. A portion of the undivided seller’s interest will be reclassified as loans held for sale to theextent that new securitizations are expected to take place. Due to contractual requirements to hold minimumseller’s interest percentages under the securitization agreements, only a portion of the Company’s undividedseller’s interest can be classified as held for sale (also see Loans Held for Sale). The remaining retained interestsare recorded on the combined statements of financial condition in amounts due from asset securitization at theirestimated fair values. These other retained interests are accounted for as trading securities; accordingly, changesin the estimated fair values of these retained interests are recorded in securitization income. The Company doesnot recognize servicing assets or servicing liabilities for servicing rights since the servicing fee approximates justadequate compensation to the Company for performing the servicing.
Cash flows associated with the securitization of credit card receivables that were originated for investmentare included in cash flows from investing activities. Cash flows related to credit card receivables transferred tothe trust during the term of a securitization in order to maintain a constant level of investor interest in receivablesare classified as operating cash flows, as those receivables are treated as being originated specifically for sale.
Loans Held for Sale. Loans held for sale includes the amount of credit card receivables necessary to supportnet new securitization transactions expected to take place in the next three months as well as mortgages that wereoriginated with the intent to sell. Management believes its ability to reasonably forecast the amount of existingcredit card receivables that should be reclassified as held for sale is limited to three months from the balancesheet date, as securitizations that occur beyond that point will involve a significant proportion of receivables thathave not yet been originated, due to cardholder repayment behavior and the revolving nature of credit cards. Inestimating the amount of credit card receivables that should be classified as held for sale, the Company considersits ability to access the securitization market given current market conditions, scheduled maturities of outstandingasset-backed securities, management’s targeted mix of funding sources used, and the relative availability of theCompany’s other funding sources.
The amount of credit card receivables classified as held for sale is determined on a homogeneous portfoliobasis, because the seller’s interest represents an undivided interest in each loan transferred to the securitizationtrust. In contrast, mortgages held for sale are classified on an individual loan basis since virtually all mortgagesare sold shortly after origination. The Company includes its loans held for sale in loan receivables and carriesthese assets at the lower of aggregate cost or fair value. The par value of loans classified as held for sale in thecombined statements of financial condition approximates their fair values as a result of the short-term nature ofthese assets. An allowance for loan losses does not apply to loans held for sale.
F-9

When credit card receivables that are classified as held for sale are securitized and beneficial interests areissued to third parties, loans held for sale is reduced, cash is received and amounts due from asset securitizationis adjusted to reflect changes in the Company’s retained interests as applicable.
Loan Receivables. Loan receivables consist of credit card receivables and other loans and include loansclassified as held for sale and loans classified as held for investment. Loans held for investment include creditcard, commercial loans and other consumer loans. Credit card receivables include consumer credit cardreceivables and business credit card receivables. Business credit card receivables are presented in the combinedfinancial statements and accompanying notes as commercial loans. Other consumer loans consist of mortgagesand other consumer installment loans. Consumer and business credit card loan receivables are reported at theirprincipal amounts outstanding and include uncollected billed interest and fees. Other consumer loans are reportedat their principal amounts outstanding.
All new originations of credit card receivables (except for the amount of new receivables transferred to thetrust during the term of a securitization to maintain a constant level of investor interest in receivables) aredeemed to be held for investment at origination because management has the intent and ability to hold them forthe foreseeable future. In determining the amount of loans held for investment, management makes judgmentsabout the Company’s ability to fund these loans through means other than securitization, such as deposits andother borrowings, and considers the targeted mix of funding sources to be used. In determining what constitutesthe foreseeable future, management considers the short average life and homogeneous nature of credit cardreceivables. In assessing whether loans can continue to be held for investment, management also considerscapital levels and scheduled maturities of funding instruments used. Management believes that the assertionregarding its intent and ability to hold credit card loans for the foreseeable future can be made with a high degreeof certainty given the maturity distribution of deposits and other on-balance sheet funding instruments, thehistoric ability to replace maturing deposits and other borrowings with new deposits or borrowings, and historiccredit card payment activity. Due to the homogeneous nature of credit card receivables, loans are classified asheld for investment on a portfolio basis. When a decision to securitize additional credit card receivables is made,to the extent necessary, loans held for investment will be reclassified as held for sale on a portfolio basis.
Cash flows associated with loans that are originated with the intent to sell are included in cash flows fromoperating activities. Cash flows associated with loans originated for investment are classified as investing cashflows, regardless of a subsequent change in intent.
Allowance for Loan Losses. The Company maintains an allowance for loan losses at a level that is adequateto absorb probable losses inherent in the loan portfolio. The allowance is evaluated quarterly for adequacy and isestablished through a charge to the provision for loan losses. Additions to the allowance are made throughcharges to the provision for loan losses and when reserves are acquired as part of business or portfolioacquisitions. Charge-offs are deducted from the allowance and subsequent recoveries increase the allowance.
The allowance for loan losses is applicable to the loan portfolio. In estimating net charge-offs inherent in thecredit card loan portfolio, the Company uses an approach which utilizes a migration analysis of delinquent andcurrent credit card receivables. A migration analysis is a technique used to estimate the likelihood that a loanreceivable will progress through the various stages of delinquency to charge off. The migration analysis considersuncollectible principal, interest and fees reflected in loan receivables. In determining the proper level of theallowance for loan losses, management also considers factors that may impact loan loss experience, includingcurrent economic conditions, recent trends in delinquencies and bankruptcy filings, account collection management,policy changes, account seasoning, loan volume and amounts, payment rates and forecasting uncertainties.
The allowance for loan losses is applicable only to the Company’s owned loan portfolio and does not considerlosses inherent in securitized loans. Net charge-offs related to securitized loans are absorbed by the securitizationtrusts pursuant to the terms of documents governing the securitization transactions, and as such, are not included inthe Company’s allowance for loan losses but are reflected in the valuation of the interest-only strip receivable.
F-10

Delinquent Loans. The entire balance of an account is contractually past due if the minimum payment is notreceived by the specified date on the cardmember’s billing statement. Delinquency is reported on loans that are30 or more days past due.
Credit card loans are charged-off at the end of the month during which an account becomes 180 days pastdue, except in the case of cardmember bankruptcies, probate accounts and fraudulent transactions. Cardmemberbankruptcies and probate accounts are charged-off at the end of the month 60 days following the receipt ofnotification of the bankruptcy or death, but not later than the 180-day time frame described above. TheCompany’s charge-off policies comply with guidelines established by the Federal Financial InstitutionsExamination Council (“FFIEC”).
Fraudulent transactions are included in loan receivables. The receivables are adjusted to their net realizablevalue upon receipt of notification of the alleged or potential fraud through a charge to other expense and aresubsequently written off at the end of the month 90 days following notification, but not later than the contractual180-day time frame.
The practice of re-aging an account also may affect credit card loan delinquencies and charge-offs. A re-ageis intended to assist delinquent cardmembers who have experienced financial difficulties but who demonstrateboth an ability and willingness to repay. Accounts meeting specific criteria are re-aged when the Company andthe cardmember agree on a temporary repayment schedule that may include concessionary terms. With re-aging,the outstanding balance of a delinquent account is returned to a current status. Cardmembers may also qualify fora workout re-age when either a longer term or permanent hardship exists. The Company’s re-age practicescomply with FFIEC guidelines.
Premises and Equipment. Premises and equipment are stated at cost less accumulated depreciation andamortization, which is computed using the straight-line method over the estimated useful lives of the assets.Buildings are depreciated over a period of 39 years. The costs of leasehold improvements are capitalized anddepreciated over the lesser of the remaining term of the lease or the asset’s estimated useful life, typically tenyears. Furniture and fixtures are depreciated over a period of five to ten years. Equipment is depreciated overthree to ten years. Capitalized leases, consisting of computers and processing equipment, are depreciated overthree and six years, respectively. Maintenance and repairs are immediately expensed, while the costs ofimprovements are capitalized.
Purchased software and capitalized costs related to internally developed software are amortized over theiruseful lives of three to five years. Costs incurred during the application development stage related to internallydeveloped software are capitalized in accordance with American Institute of Certified Public Accountants(“AICPA”) Statement of Position 98-1, Accounting for the Cost of Computer Software Developed or Obtainedfor Internal Use (“SOP 98-1”). Pursuant to SOP 98-1, costs are expensed as incurred during the preliminaryproject stage and post implementation stage. Once the capitalization criteria of SOP 98-1 have been met, externaldirect costs incurred for materials and services used in developing or obtaining internal-use computer software;payroll and payroll-related costs for employees who are directly associated with the internal-use computersoftware project (to the extent those employees devoted time directly to the project); and interest costs incurredwhen developing computer software for internal use are capitalized. Amortization of capitalized costs beginswhen the software is ready for its intended use. Capitalized software is included in premises and equipment in theCompany’s combined statements of financial condition. See Note 9: Premises and Equipment for furtherinformation about the Company’s premises and equipment.
Goodwill. Goodwill is recorded as part of the Company’s acquisitions of businesses when the purchase priceexceeds the fair value of the net tangible and separately identifiable intangible assets acquired. The Company’sgoodwill is not amortized, but rather is subject to an impairment test each year, or more often if conditionsindicate impairment may have occurred, pursuant to Statement of Financial Accounting Standards No. 142,Goodwill and Other Intangible Assets (“Statement No. 142”). There was no impairment write-down of theCompany’s goodwill in the years ended November 30, 2006 and 2005. The Company did not have any goodwillat November 30, 2004.
F-11

Intangible Assets. The Company’s amortizable intangible assets consist of acquired customer relationshipsand trade name intangibles. Acquired customer relationships include purchased credit cardholder relationships(“PCCRs”) and other customer relationships. All of the Company’s amortizable intangible assets are carried atnet book value and are amortized over their estimated useful lives. The amortization periods approximate theperiods over which the Company expects to generate future net cash inflows from the use of these assets.Accordingly, PCCRs and other customer relationships are amortized over a useful life of 15 years, and tradenames are amortized over a useful life of 25 years. The Company’s policy is to amortize all intangibles in amanner that reflects the pattern in which the projected net cash inflows to the Company are expected to occur, asopposed to the straight-line basis. This method of amortization typically results in a greater portion of theintangible asset’s carrying value being amortized in the earlier years of the asset’s useful life.
All of the Company’s amortizable intangible assets, as well as other amortizable or depreciable long-livedassets such as premises and equipment, are subject to impairment testing in accordance with Statement ofFinancial Accounting Standards No. 144, Accounting for the Impairment or Disposal of Long-Lived Assets(“Statement No. 144”) when events or conditions indicate that the assets may not be fully recoverable. A test forrecoverability is done by comparing the asset’s carrying value to the sum of the undiscounted future net cashinflows expected to be generated from the use of the asset over its remaining useful life. In accordance withStatement No. 144, impairment exists if the sum of the undiscounted expected future net cash inflows is less thanthe carrying amount of the asset. Impairment would result in a write-down of the asset to its estimated fair value.The estimated fair values of these assets are based on the discounted present value of the stream of future netcash inflows expected to be derived over their remaining useful lives. If an impairment write-down is recorded,the remaining useful life of the asset will be evaluated to determine whether revision of the remainingamortization or depreciation period is appropriate. There was no impairment write-down of any of theCompany’s intangible assets nor of any of the Company’s other amortizable or depreciable long-lived assets forthe years ended November 30, 2006, 2005 and 2004. The Company did not have any intangible assets atNovember 30, 2004.
Securitization Income. In accordance with Statement No. 140, when a new loan securitization transactionoccurs, the Company recognizes a gain on the transfer of the loan receivables, the amount of which depends inpart on the previous carrying amount of the assets involved in the transfer, allocated between the assetstransferred and the retained interests based upon their relative fair values at the date of the transfer. An interest-only strip receivable is recorded in the combined statements of financial condition and represents the contractualright to receive interest and certain other revenue less certain costs, including charge-offs on securitized loansand the interest paid to investors in the securitization transactions (“the excess spread”) from the trust over theestimated life of the securitized loan receivables. The interest-only strip receivable is recorded at its estimatedfair value with subsequent changes in fair value recorded in securitization income. The Company estimates thefair value of the interest-only strip receivable based on the present value of expected future cash flows usingmanagement’s best estimate of the key assumptions, including forecasted interest yield, loan losses and paymentrates, the interest rate paid to investors and a discount rate commensurate with the risks involved. Therecognition of securitization income from the actual net excess cash flows accrued is offset in part by therevaluation of the interest-only strip receivable such that the interest-only strip receivable reflects only futureexcess cash flows. In accordance with Emerging Issues Task Force (“EITF”) Issue No. 99-20, Recognition ofInterest Income and Impairment of Purchased and Retained Beneficial Interests in Securitized Financial Assets(“EITF Issue No. 99-20”), the interest component of cash flows attributable to the Company’s retained interestsis recorded in other interest income. Also included in securitization income is the annual servicing fee theCompany receives based on a percentage of the investor interest outstanding. The Company does not recognizeservicing assets or servicing liabilities for servicing rights since the servicing fee approximates just adequatecompensation to the Company for performing the servicing. In addition, for securitization transactions completedon or after November 3, 2004, the Company, in accordance with governing securitization documents, allocatesportions of discount and interchange revenue to new securitization transactions, which is also recognized assecuritization income. Securitization transaction costs are deferred and amortized to securitization income overthe life of the related transactions.
F-12
Loan Interest and Fee Income. Interest on loans is comprised largely of interest on credit card loans and isrecognized based upon the amount of loans outstanding and their contractual interest rate. Interest on loans isincluded in loan receivables when billed to the cardmember. The Company accrues unbilled interest revenue on amonthly basis from a cardmember’s billing cycle date to the end of the month. The Company applies an estimateof the percentage of loans that will revolve in the next cycle in the estimation of the accrued unbilled portion ofinterest revenue that is included in accrued interest receivable on the combined statements of financial condition.The Company also applies the same estimate in the valuation of the accrued interest on securitized loans that isincluded in amounts due from asset securitization.
The Company recognizes fees (except annual fees and certain product fees) on loan receivables in earningsas fees are assessed. Annual fees and certain product fees are recognized in revenue ratably over the periods towhich they relate. Loan fee income consists of fees on credit card loans and includes annual, late, overlimit,balance transfer, returned check, cash advance and other miscellaneous fees and is reflected net of waivers. Thesefees are included in loan receivables when billed to credit card loans and accrued interest receivable when billedto other consumer loans. Pursuant to EITF Issue No. 92-5, Amortization Period for Net Deferred Credit CardOrigination Costs, direct loan origination costs on credit card loans are deferred and amortized to consumer orcommercial loan interest income on a straight-line basis over a one-year period. As of November 30, 2006 and2005, the remaining unamortized deferred costs related to these items were $29.4 million and $22.1 million,respectively, and are recorded in loan receivables.
The Company accrues interest and fees on loan receivables until the loans are paid or charged-off, except ininstances of cardmember bankruptcy, death or fraud, where no further interest and fee accruals occur followingnotification. The Company may, in connection with collection activities, place a loan on non-accrual status.When loan receivables are charged-off, unpaid accrued interest and fees are reversed against the income lineitems in which they were originally recorded in the combined statements of income. The Company considersuncollectible interest and fee revenues in assessing the adequacy of the allowance for loan losses.
Discount and Interchange Revenue. The Company earns discount revenue from fees charged to merchantswith whom the Company has entered into a direct card acceptance agreement for processing cardmemberpurchase transactions. The Company earns acquirer interchange revenue from merchant acquirers on all DiscoverNetwork card transactions made by cardholders at merchants with whom merchant acquirers have entered intocard acceptance agreements for processing cardholder purchase transactions. Discount revenue is deducted fromthe payment to the merchant and recorded in discount and interchange revenue at the time the cardmembercharge transaction is captured.
Issuer interchange is a fee paid to the card-issuing entity as compensation for risk and other operating costs.In the United Kingdom, where the Company issues MasterCard and Visa branded cards, the Company earnsinterchange revenue from that network. Such fees are set by MasterCard and Visa and are based on cardmembersales volumes. Issuer interchange revenue is recognized as earned and recorded in discount and interchangerevenue.
The Company also pays issuer interchange to third-party card issuers that have entered into contractualarrangements to use the Company’s proprietary merchant network. This cost is contractually established and isbased on the card issuing entity’s transaction volume. It is recorded at the time the cardholder charge transactionis captured. The Company earns discount revenue or acquirer interchange from these transactions, net of theissuer interchange cost paid to the card issuing entity.
Cardmember Rewards. The Company offers its cardmembers various reward programs, including theCashback Bonus reward program, pursuant to which the Company pays certain cardmembers a reward equal to apercentage of their purchase amounts based on the type and volume of the cardmember’s purchases. The liabilityfor cardmember rewards, which is included in accrued expenses and other liabilities on the combined statementsof financial condition, is estimated on an individual cardmember basis and is accumulated as qualifiedcardmembers make progress toward earning the reward through their ongoing purchase activity. In determining
F-13
the appropriate liability for cardmember rewards, the Company estimates forfeitures of rewards accumulated butnot redeemed based on historical account closure and charge-off experience and actual cardmember purchaseactivity. In accordance with EITF Issue No. 00-22, Accounting for ‘Points’ and Certain Other Time-Based orVolume-Based Sales Incentive Offers, and Offers for Free Products or Services to Be Delivered in the Future, theCompany recognizes cardmember rewards cost as a reduction of discount and interchange revenue. For the yearsended November 30, 2006, 2005 and 2004, rewards costs amounted to $767.2 million, $659.3 million and$549.9 million, respectively. At November 30, 2006 and 2005, the liability for cardmember rewards, adjusted forestimated forfeitures, was $811.9 million and $694.9 million, respectively.
Transaction Processing Revenue. Transaction processing revenue represents fees charged to financialinstitutions and merchants for processing automated teller machine, debit and point-of-sale transactions over thePULSE Network. Transaction processing revenue is recognized in the combined statements of income at the timethe transaction is processed.
Insurance (Credit Fee Products). The Company earns revenue related to fees received for marketing creditrelated ancillary products including insurance, debt deferment/debt cancellation contracts and credit protectionservices to cardmembers. The amount of revenue recorded is based on the terms of insurance policies andcontracts with third-party providers. The Company does not retain any significant underwriting loss exposure.The Company recognizes this income over the policy or contract period as earned.
Advertising Costs. The Company expenses advertising costs as incurred. Television advertising costs areexpensed in the period in which the advertising is first aired. Advertising costs are recorded in marketing andbusiness development.
Share-based Compensation. Certain employees of the Company have received share-based compensationunder Morgan Stanley’s executive compensation programs. The cost associated with participation in theseprograms is allocated to the Company and reported in employee compensation and benefits expense. TheCompany’s compensation expense reflects the adoption by Morgan Stanley of the fair value method ofaccounting for share-based payments under Statement of Financial Accounting Standards No. 123R, Share-Based Payment (“Statement No. 123R”) using the modified prospective approach as of December 1, 2004. Priorto the adoption of Statement No. 123R, Morgan Stanley had adopted the fair value method prospectively forawards granted on or after December 1, 2002, as permitted under the transition guidance of FASB StatementNo. 148, Accounting for Stock-Based Compensation—Transition and Disclosure, an amendment of FASBStatement No. 123. For awards granted prior to December 1, 2002 (some of which remained unvested orunexercised in the periods presented in these financial statements), Morgan Stanley applied the intrinsic valuemethod prescribed by Accounting Principles Board Opinion No. 25, Accounting for Stock Issued to Employees.
Additionally, based on interpretive guidance related to Statement No. 123R, in the first quarter of 2006,Morgan Stanley changed its accounting policy for expensing the cost of anticipated 2006 year-end share-basedawards that were granted to retirement-eligible employees in the first quarter of 2007. EffectiveDecember 1, 2005, Morgan Stanley began accruing the estimated cost of these awards over the course of thecurrent year rather than expensing the awards on the date of grant.
For Morgan Stanley share-based compensation awards issued prior to the adoption of Statement No. 123R,Morgan Stanley’s accounting policy for awards granted to retirement-eligible employees was to recognizecompensation cost over the service period specified in the award terms. Morgan Stanley accelerates anyunrecognized compensation cost for such awards if and when a retirement-eligible employee leaves theCompany. For Morgan Stanley share-based compensation awards made to retirement-eligible employees of theCompany during the year ended November 30, 2005, compensation expense reflected the recognition ofcompensation expense for such awards on the date of grant.
Income Taxes. The Company’s taxable income has historically been included in the consolidated U.S.federal income tax return of Morgan Stanley and in returns filed by Morgan Stanley with certain state taxing
F-14
jurisdictions. The Company’s income tax liability has been computed and presented in these statements as if itwere a separate tax-paying entity in the periods presented. Federal and state taxes are remitted to Morgan Stanleypursuant to a tax sharing agreement between the companies.
Income tax expense is provided for using the asset and liability method, under which deferred tax assets andliabilities are determined based on the temporary differences between the financial statement and income taxbases of assets and liabilities using currently enacted tax rates. See Note 18: Income Taxes for more informationabout the Company’s income taxes.
Financial Instruments Used for Asset and Liability Management. The Company enters into derivativefinancial instruments, specifically interest rate swaps, for non-trading purposes. The Company uses interest rateswaps to manage interest rate risk arising from interest bearing deposits. Through October 2006, derivativefinancial instruments were designated and qualified as fair value hedges in accordance with Statement ofFinancial Accounting Standards No. 133, Accounting for Derivative Instruments and Hedging Activities, asamended (“Statement No. 133”). Derivative contracts having positive net fair values at November 30, 2006 and2005, inclusive of net accrued interest receipts or payments, are recorded in other assets. Derivative contractswith negative net fair values, inclusive of net accrued interest payments or receipts, are recorded in accruedexpenses and other liabilities. With regard to such derivatives hedging interest bearing deposits, through October2006, changes in both the fair value of the derivatives and the gains or losses on the hedged interest bearingdeposits relating to the risk being hedged were recorded in interest expense and provided offset to one another.Ineffectiveness related to these fair value hedges, if any, was recorded in interest expense. To the extent thatdifferences in notional amounts of the derivatives and hedged liabilities arose subsequent to the closing of thetransactions, the hedge relationship was de-designated, with the change in the fair value of the derivativesrecorded currently in other income. On November 1, 2006, the Company de-designated all of the derivativeswhich previously hedged interest bearing deposits and no longer accounts for them as fair value hedges.Beginning in November 2006, the basis adjustments to the fair value of the interest bearing deposits that arosefrom the previous hedge accounting are amortized to interest expense over the lives of the previously hedgedinterest bearing deposits using the effective yield method. Subsequent changes in the fair value of the interest rateswaps are recorded in other income.
For each interest rate swap agreement the Company entered into with the securitization trust to hedge asecuritization transaction, the Company also entered into a mirror interest rate swap agreement with equal andoffsetting terms. Net fair values of these agreements are recorded in other assets and accrued expenses and otherliabilities, as applicable for positive and negative net fair values, respectively. Changes in the fair value of theseinterest rate agreements are recorded in earnings, netting to an effect of zero as a result of the offsetting positions.See Note 22: Fair Value of Financial Instruments for further discussion concerning derivative financialinstruments.
Accumulated Other Comprehensive Income. In accordance with Statement of Financial Accounting StandardsNo. 130, Reporting Comprehensive Income (“Statement No. 130”), the Company records unrealized gains andlosses on available-for-sale securities, certain pension adjustments and foreign currency translation adjustments inaccumulated other comprehensive income on an after-tax basis. The Company presents accumulated othercomprehensive income, net of tax, in its combined statements of changes in stockholder’s equity.
Translation of Foreign Currencies. The financial statements of the Company’s combined foreignsubsidiaries have been translated into U.S. dollars in accordance with GAAP. Assets and liabilities have beentranslated using the exchange rate in effect at each year-end; income and expense amounts have been translatedusing the average exchange rate for the period in which the transactions occurred. The translation gains andlosses resulting from the change in exchange rates have been reported as a component of accumulated othercomprehensive income included in stockholder’s equity.
F-15

4. Recently Issued Accounting Pronouncements
In February 2006, the FASB issued Statement of Financial Accounting Standards No. 155, Accounting forCertain Hybrid Financial Instruments (“Statement No. 155”), which amends FASB Statement Nos. 133 and 140.Statement No. 155 clarifies which interest-only strips and principal-only strips are not subject to the requirementsof Statement No. 133, establishes a requirement to evaluate interests in securitized financial assets to identifyinterests that are freestanding derivatives or that are hybrid financial instruments that contain an embeddedderivative requiring bifurcation, clarifies that concentrations of credit risk in the form of subordination are notembedded derivatives, and amends Statement No. 140 to eliminate the prohibition on a QSPE from holding aderivative financial instrument that pertains to a beneficial interest other than another derivative financialinstrument. Statement No. 155 is effective for the Company for all financial instruments acquired or issued on orafter December 1, 2006. The adoption of Statement No. 155 did not have a material impact on the Company’scombined financial condition or results of operations.
In March 2006, the FASB issued Statement of Financial Accounting Standards No. 156, Accounting forServicing of Financial Assets, an amendment of FASB Statement No. 140 (“Statement No. 156”). StatementNo. 156 requires all separately recognized servicing assets and servicing liabilities to be initially measured at fairvalue, if practicable. The standard permits an entity to subsequently measure each class of servicing assets orservicing liabilities at fair value and report changes in fair value in the statement of income in the period in whichthe changes occur. Statement No. 156 is effective for the Company as of December 1, 2006. The adoption ofStatement No. 156 did not have a material impact on the Company’s combined financial condition, results ofoperations or cash flows.
In July 2006, the FASB issued FASB Interpretation No. 48, Accounting for Uncertainty in Income Taxes, aninterpretation of FASB Statement No. 109 (“FIN 48”). FIN 48 clarifies the accounting for uncertainty in incometaxes recognized in a company’s financial statements and prescribes a recognition threshold and measurementattribute for the financial statement recognition and measurement of a tax position taken or expected to be takenin an income tax return. FIN 48 also provides guidance on derecognition, classification, interest and penalties,accounting in interim periods, disclosure and transition. FIN 48 is effective for the Company as of December 1,2007. The Company has not determined the potential impact of adopting FIN 48.
In September 2006, the FASB issued Statement of Financial Accounting Standards No. 157, Fair ValueMeasurements (“Statement No. 157”). Statement No. 157 defines fair value, establishes a framework formeasuring fair value and expands disclosures about fair value measurements. Statement No. 157 is effectivebeginning an entity’s first fiscal year that begins after November 15, 2007, or upon early adoption of FASBStatement No. 159. Morgan Stanley early adopted FASB Statement No. 159 as of December 1, 2006, and, ineffect adopted Statement No. 157 at the same time. Accordingly, the Company adopted Statement No. 157 onDecember 1, 2006. The adoption of Statement No. 157 did not have a material impact on the Company’scombined financial condition, results of operations or cash flows.
In September 2006, the FASB issued Statement of Financial Accounting Standards No. 158, Employers’Accounting for Defined Benefit Pension and Other Postretirement Plans, an amendment of FASB StatementsNo. 87, 88, 106 and 132(R) (“Statement No. 158”). Statement No. 158 requires an employer to recognize thefunded status of defined benefit pension and other postretirement benefit plans as an asset or liability. StatementNo. 158 is effective for the Company as of November 30, 2007. Employees of the Company currently participatein Morgan Stanley’s pension and other postretirement plans. If Statement No. 158 were to be applied by MorganStanley as of November 30, 2006, based on a September 30, 2006 measurement date, the effect on MorganStanley’s consolidated statement of financial condition would be a pre-tax charge to its stockholder’s equity of$585 million. The allocable portion of that adjustment related to the Company would be a pre-tax charge tostockholder’s equity of approximately $56 million.
In September 2006, the SEC released Staff Accounting Bulletin No. 108, Considering the Effects of PriorYear Misstatements when Quantifying Misstatements in Current Year Financial Statements (“SAB 108”).
F-16
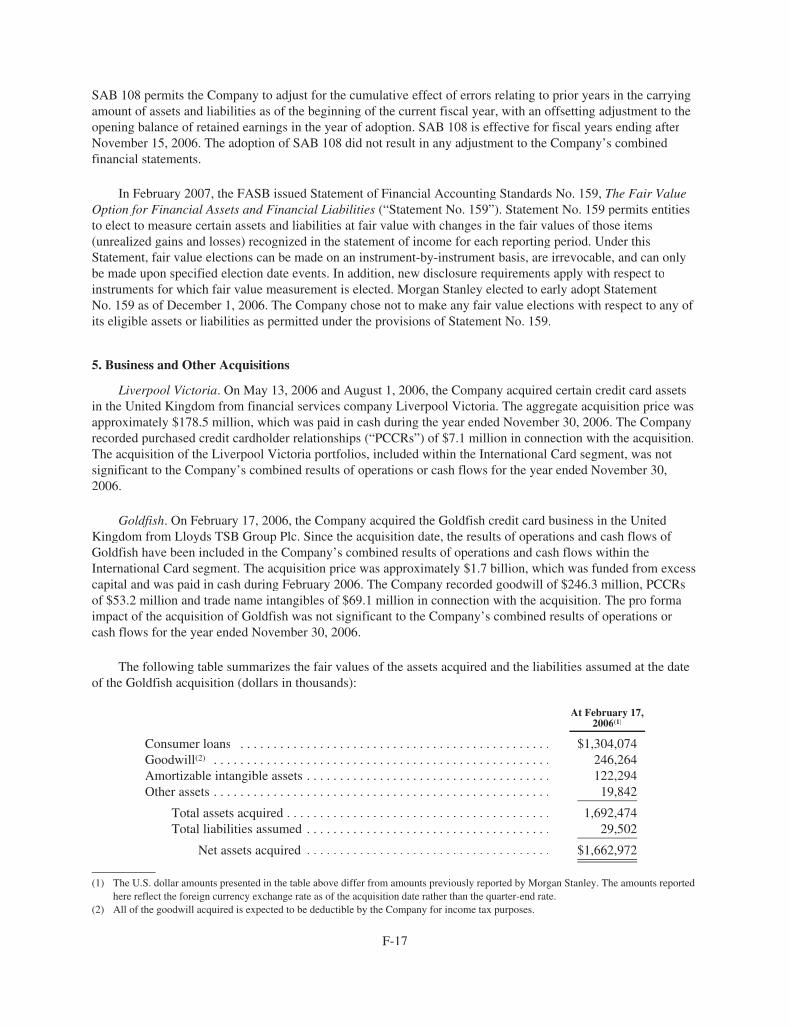
SAB 108 permits the Company to adjust for the cumulative effect of errors relating to prior years in the carryingamount of assets and liabilities as of the beginning of the current fiscal year, with an offsetting adjustment to theopening balance of retained earnings in the year of adoption. SAB 108 is effective for fiscal years ending afterNovember 15, 2006. The adoption of SAB 108 did not result in any adjustment to the Company’s combinedfinancial statements.
In February 2007, the FASB issued Statement of Financial Accounting Standards No. 159, The Fair ValueOption for Financial Assets and Financial Liabilities (“Statement No. 159”). Statement No. 159 permits entitiesto elect to measure certain assets and liabilities at fair value with changes in the fair values of those items(unrealized gains and losses) recognized in the statement of income for each reporting period. Under thisStatement, fair value elections can be made on an instrument-by-instrument basis, are irrevocable, and can onlybe made upon specified election date events. In addition, new disclosure requirements apply with respect toinstruments for which fair value measurement is elected. Morgan Stanley elected to early adopt StatementNo. 159 as of December 1, 2006. The Company chose not to make any fair value elections with respect to any ofits eligible assets or liabilities as permitted under the provisions of Statement No. 159.
5. Business and Other Acquisitions
Liverpool Victoria. On May 13, 2006 and August 1, 2006, the Company acquired certain credit card assetsin the United Kingdom from financial services company Liverpool Victoria. The aggregate acquisition price wasapproximately $178.5 million, which was paid in cash during the year ended November 30, 2006. The Companyrecorded purchased credit cardholder relationships (“PCCRs”) of $7.1 million in connection with the acquisition.The acquisition of the Liverpool Victoria portfolios, included within the International Card segment, was notsignificant to the Company’s combined results of operations or cash flows for the year ended November 30,2006.
Goldfish. On February 17, 2006, the Company acquired the Goldfish credit card business in the UnitedKingdom from Lloyds TSB Group Plc. Since the acquisition date, the results of operations and cash flows ofGoldfish have been included in the Company’s combined results of operations and cash flows within theInternational Card segment. The acquisition price was approximately $1.7 billion, which was funded from excesscapital and was paid in cash during February 2006. The Company recorded goodwill of $246.3 million, PCCRsof $53.2 million and trade name intangibles of $69.1 million in connection with the acquisition. The pro formaimpact of the acquisition of Goldfish was not significant to the Company’s combined results of operations orcash flows for the year ended November 30, 2006.
The following table summarizes the fair values of the assets acquired and the liabilities assumed at the dateof the Goldfish acquisition (dollars in thousands):
At February 17,2006(1)
Consumer loans . . . . . . . . . . . . . . . . . . . . . . . . . . . . . . . . . . . . . . . . . . . . . . . $1,304,074Goodwill(2) . . . . . . . . . . . . . . . . . . . . . . . . . . . . . . . . . . . . . . . . . . . . . . . . . . . 246,264Amortizable intangible assets . . . . . . . . . . . . . . . . . . . . . . . . . . . . . . . . . . . . . 122,294Other assets . . . . . . . . . . . . . . . . . . . . . . . . . . . . . . . . . . . . . . . . . . . . . . . . . . . 19,842
Total assets acquired . . . . . . . . . . . . . . . . . . . . . . . . . . . . . . . . . . . . . . . . 1,692,474Total liabilities assumed . . . . . . . . . . . . . . . . . . . . . . . . . . . . . . . . . . . . . 29,502
Net assets acquired . . . . . . . . . . . . . . . . . . . . . . . . . . . . . . . . . . . . . $1,662,972
(1) The U.S. dollar amounts presented in the table above differ from amounts previously reported by Morgan Stanley. The amounts reportedhere reflect the foreign currency exchange rate as of the acquisition date rather than the quarter-end rate.
(2) All of the goodwill acquired is expected to be deductible by the Company for income tax purposes.
F-17

PULSE. On January 12, 2005, the Company acquired PULSE EFT Association, a U.S.-based automatedteller machine, debit and electronic funds transfer network currently serving banks, credit unions, and savingsand other financial institutions. Since the acquisition date, the results of operations and cash flows of PULSEhave been included in the Company’s combined results of operations and cash flows. PULSE is included withinthe Third-Party Payments segment. The acquisition price was $324.1 million, which was funded from excesscapital and was paid in cash during the year ended November 30, 2005. The Company recorded goodwill of$255.4 million, other customer relationships of $69.4 million and trade name intangibles of $2.7 million inconnection with the acquisition. The pro forma impact of the acquisition of PULSE was not significant to theCompany’s combined results of operations or cash flows for the year ended November 30, 2005.
The following table summarizes the fair values of the assets acquired and the liabilities assumed at the dateof the PULSE acquisition (dollars in thousands):
At January 12,2005
Goodwill(1) . . . . . . . . . . . . . . . . . . . . . . . . . . . . . . . . . . . . . . . . . . . . . . . . . . . . $255,421Amortizable intangible assets . . . . . . . . . . . . . . . . . . . . . . . . . . . . . . . . . . . . . 72,100Other assets . . . . . . . . . . . . . . . . . . . . . . . . . . . . . . . . . . . . . . . . . . . . . . . . . . . 54,797
Total assets acquired . . . . . . . . . . . . . . . . . . . . . . . . . . . . . . . . . . . . . . . . 382,318Total liabilities assumed . . . . . . . . . . . . . . . . . . . . . . . . . . . . . . . . . . . . . . 58,200
Net assets acquired . . . . . . . . . . . . . . . . . . . . . . . . . . . . . . . . . . . . . . $324,118
(1) None of the goodwill acquired in the acquisition of PULSE is deductible by the Company for income tax purposes.
There were no acquisitions completed by the Company during the year ended November 30, 2004.
6. Investment Securities
The Company’s investment securities consist of the following (dollars in thousands):
November 30,
2006 2005
U.S. Treasury and other U.S. government agency obligations . . . . . . . $22,838 $11,065States of the U.S. and political subdivisions . . . . . . . . . . . . . . . . . . . . . 41,836 2,236Other securities . . . . . . . . . . . . . . . . . . . . . . . . . . . . . . . . . . . . . . . . . . . 19,737 3,418
Investment securities . . . . . . . . . . . . . . . . . . . . . . . . . . . . . . . . . . . $84,411 $16,719
F-18

The following table summarizes investment securities—held-to-maturity by type (dollars in thousands):
Net BookValue
UnrealizedGains
Unrealized(Losses)
FairValue
At November 30, 2006Investment Securities—Held-to-Maturity
U.S. Treasury and other U.S. government agencyobligations . . . . . . . . . . . . . . . . . . . . . . . . . . . . . . . . . . . . . . . . $ 1,466 $ — $ — $ 1,466
State and political subdivisions of states . . . . . . . . . . . . . . . . . . . 41,836 512 (462) 41,886Mortgage-backed securities . . . . . . . . . . . . . . . . . . . . . . . . . . . . . 21,372 144 (50) 21,466Other debt securities . . . . . . . . . . . . . . . . . . . . . . . . . . . . . . . . . . 17,423 — — 17,423
Total investment securities—held-to-maturity . . . . . . . . . . $82,097 $ 656 $(512) $82,241
At November 30, 2005Investment Securities—Held-to-Maturity
U.S. Treasury and other U.S. government agencyobligations . . . . . . . . . . . . . . . . . . . . . . . . . . . . . . . . . . . . . . . . $ 1,225 $ — $ — $ 1,225
State and political subdivisions of states . . . . . . . . . . . . . . . . . . . 2,236 — — 2,236Mortgage-backed securities . . . . . . . . . . . . . . . . . . . . . . . . . . . . . 9,840 21 (117) 9,744Other debt securities . . . . . . . . . . . . . . . . . . . . . . . . . . . . . . . . . . 1,056 — — 1,056
Total investment securities—held-to-maturity . . . . . . . . . . $14,357 $ 21 $(117) $14,261
During the years ended November 30, 2006, 2005 and 2004, investment securities—held-to-maturity withstate and political subdivisions of states incurred losses of $33 thousand, $3 thousand and $9 thousand (excludingany tax effects), respectively. These losses reflect the write-down of the bonds to net realizable value and arerecorded in other income. There were no other impairment charges on held-to-maturity securities recorded in theyears ended November 30, 2006, 2005 and 2004. At November 30, 2006, held-to-maturity securities with a netbook value of $3.9 million were in a loss position for a period in excess of twelve months. At November 30,2005, there were no held-to-maturity securities in a loss position in excess of twelve months. Management hasdetermined that it has the intent and ability to hold these investments until maturity.
During the years ended November 30, 2006, 2005 and 2004, tax exempt income earned on investmentsecurities of state and political subdivisions was $1.0 million, $33 thousand and $43 thousand, respectively. U.S.Treasury obligations held at the Federal Reserve Bank of Philadelphia at November 30, 2006, 2005 and 2004, of$1.5 million, $1.2 million and $1.4 million, respectively, were pledged securities to provide collateral for publicdeposits in excess of FDIC insurance limits.
Investment securities classified as available-for-sale consist of marketable equity securities, specificallystock, and are reported in the combined statements of financial condition at their fair values. Changes in the fairvalues are recognized in accumulated other comprehensive income. The following table summarizes investmentsecurities available-for-sale (dollars in thousands):
November 30,
2006 2005 2004
Amortized cost . . . . . . . . . . . . . . . . . . . . . . . . . . . . . . . . . . . . . . . . . . . . . . . . . . . . . . . . $2,000 $2,000 $2,000Fair value . . . . . . . . . . . . . . . . . . . . . . . . . . . . . . . . . . . . . . . . . . . . . . . . . . . . . . . . . . . . $2,314 $2,362 $2,603Accumulated other comprehensive income, net of tax . . . . . . . . . . . . . . . . . . . . . . . . . $ 203 $ 228 $ 382Dividend income (for the years ended November 30) . . . . . . . . . . . . . . . . . . . . . . . . . . $ 180 $ 176 $ 163
F-19

Maturities and yields of investment securities at November 30, 2006 are provided in the tables below (dollars inthousands).
One Year orLess
After OneYear ThroughFive Years
After FiveYears
Through TenYears
After TenYears Total
Held-to-maturity—Book ValuesU.S. Treasury and other U.S. government agency
obligations . . . . . . . . . . . . . . . . . . . . . . . . . . . . . . . . . . . $1,466 $ — $ — $ — $ 1,466State and political subdivisions of states . . . . . . . . . . . . . . — — — 41,836 41,836Mortgage-backed securities . . . . . . . . . . . . . . . . . . . . . . . . — — — 21,372 21,372Other debt securities . . . . . . . . . . . . . . . . . . . . . . . . . . . . . 3,171 9,380 3,431 1,441 17,423
Total investment securities—held-to-maturity . . . . . 4,637 9,380 3,431 64,649 82,097Available-for-sale
Equity securities . . . . . . . . . . . . . . . . . . . . . . . . . . . . . . . . 2,314 — — — 2,314
Total investment securities . . . . . . . . . . . . . . . . . . . . $6,951 $9,380 $3,431 $64,649 $84,411
Held-to-maturity—Fair ValuesU.S. Treasury and other U.S. government agency
obligations . . . . . . . . . . . . . . . . . . . . . . . . . . . . . . . . . . . $1,466 $ — $ — $ — $ 1,466State and political subdivisions of states . . . . . . . . . . . . . . — — — 41,886 41,886Mortgage-backed securities . . . . . . . . . . . . . . . . . . . . . . . . — — — 21,466 21,466Other debt securities . . . . . . . . . . . . . . . . . . . . . . . . . . . . . 3,171 9,380 3,431 1,441 17,423
Total investment securities—held-to-maturity . . . . . 4,637 9,380 3,431 64,793 82,241Available-for-sale
Equity securities . . . . . . . . . . . . . . . . . . . . . . . . . . . . . . . . 2,314 — — — 2,314
Total investment securities . . . . . . . . . . . . . . . . . . . . $6,951 $9,380 $3,431 $64,793 $84,555
One Year orLess
After OneYear ThroughFive Years
After FiveYears
Through TenYears
After TenYears Total
Investment securities—held-to-maturityU.S. Treasury and other U.S. government agency
obligations . . . . . . . . . . . . . . . . . . . . . . . . . . . . . . . . . 4.94% — — — 4.94%State and political subdivisions of states . . . . . . . . . . . . — — — 4.73% 4.73%Mortgage-backed securities . . . . . . . . . . . . . . . . . . . . . — — — 5.55% 5.55%Other debt securities . . . . . . . . . . . . . . . . . . . . . . . . . . . 6.79% 7.00% 6.68% 5.14% 6.74%
Total investment securities—held-to-maturity . . . 6.21% 7.00% 6.68% 5.01% 5.38%Investment securities—available-for-sale
Equity securities . . . . . . . . . . . . . . . . . . . . . . . . . . . . . . 7.78% — — — 7.78%Total investment securities . . . . . . . . . . . . . . . . . . 6.73% 7.00% 6.68% 5.01% 5.44%
The Company had no investment securities classified as trading during the years ended November 30, 2006 and2005.
In 2005, the Company acquired investment securities held-to-maturity and available-for-sale of $6.8 million and$5.5 million, respectively, with the acquisition of the PULSE business. In that same year, the Company sold theinvestment securities at a net loss of $37 thousand. There were no other investment securities sold during the yearsended November 30, 2006, 2005 and 2004.
F-20

7. Loan Receivables
Loan receivables consist of the following (dollars in thousands):November 30,
2006 2005
Loans held for sale:Domestic . . . . . . . . . . . . . . . . . . . . . . . . . . . . . . . . . . . . . . . . . . . . . . . . . . . . . . . $ 1,056,380 $ 2,437,060International . . . . . . . . . . . . . . . . . . . . . . . . . . . . . . . . . . . . . . . . . . . . . . . . . . . . — 691,480
Total loans held for sale . . . . . . . . . . . . . . . . . . . . . . . . . . . . . . . . . . . 1,056,380 3,128,540Loan portfolio:
Credit card . . . . . . . . . . . . . . . . . . . . . . . . . . . . . . . . . . . . . . . . . . . . . . . . . . . . . .Domestic . . . . . . . . . . . . . . . . . . . . . . . . . . . . . . . . . . . . . . . . . . . . . . . . . . . 19,582,675 18,000,766International . . . . . . . . . . . . . . . . . . . . . . . . . . . . . . . . . . . . . . . . . . . . . . . . 2,952,506 1,369,754
Total credit card . . . . . . . . . . . . . . . . . . . . . . . . . . . . . . . . . . . . . . . . . 22,535,181 19,370,520Commercial loansDomestic . . . . . . . . . . . . . . . . . . . . . . . . . . . . . . . . . . . . . . . . . . . . . . . . . . . . . . . 59,089 —
Total commercial loans . . . . . . . . . . . . . . . . . . . . . . . . . . . . . . . . . . . . 59,089 —
Total credit card, including consumer and commercial . . . . . . . . . . . 22,594,270 19,370,520Other consumer loansDomestic . . . . . . . . . . . . . . . . . . . . . . . . . . . . . . . . . . . . . . . . . . . . . . . . . . . . . . . 92,100 173,480International . . . . . . . . . . . . . . . . . . . . . . . . . . . . . . . . . . . . . . . . . . . . . . . . . . . . — 130,626
Total other consumer loans . . . . . . . . . . . . . . . . . . . . . . . . . . . . . . . . . . . . . . . . . 92,100 304,106
Total loan portfolio . . . . . . . . . . . . . . . . . . . . . . . . . . . . . . . . . . . . . . . 22,686,370 19,674,626
Total loan receivables . . . . . . . . . . . . . . . . . . . . . . . . . . . . . . . . . . . . . 23,742,750 22,803,166Allowance for loan losses
Domestic . . . . . . . . . . . . . . . . . . . . . . . . . . . . . . . . . . . . . . . . . . . . . . . . . . . . . . . (703,917) (795,722)International . . . . . . . . . . . . . . . . . . . . . . . . . . . . . . . . . . . . . . . . . . . . . . . . . . . . (128,566) (43,126)
Total allowance for loan losses . . . . . . . . . . . . . . . . . . . . . . . . . . . . . . (832,483) (838,848)
Net loan receivables . . . . . . . . . . . . . . . . . . . . . . . . . . . . . . . . . . . . . . $22,910,267 $21,964,318
The Company received net proceeds from loan sales, inclusive of net proceeds on credit card assetsecuritization transactions, of $9.1 billion, $7.4 billion and $4.0 billion in the years ended November 30, 2006,2005 and 2004, respectively. For the years ended November 30, 2006, 2005 and 2004, proceeds from credit cardasset securitizations were $8.7 billion, $7.2 billion and $3.7 billion, respectively; proceeds from other consumerloan sales were $0.4 billion, $0.2 billion and $0.3 billion, respectively. Other consumer loan sales werecomprised of mortgage home loan sales, with the exception of $0.1 billion in installment loan sales during theyear ended November 30, 2006.
Activity in the allowance for loan losses is as follows (dollars in thousands):For the Years Ended November 30,
2006 2005 2004
Balance at beginning of year . . . . . . . . . . . . . . . . . . . . . . . . . . . . . . . . . $ 838,848 $ 942,721 $ 1,001,656Additions:
Provision for loan losses . . . . . . . . . . . . . . . . . . . . . . . . . . . . . . . . 755,637 878,486 925,549Reserves acquired . . . . . . . . . . . . . . . . . . . . . . . . . . . . . . . . . . . . . 55,499 — —
Deductions:Charge-offs . . . . . . . . . . . . . . . . . . . . . . . . . . . . . . . . . . . . . . . . . . (1,001,430) (1,144,356) (1,119,739)Recoveries . . . . . . . . . . . . . . . . . . . . . . . . . . . . . . . . . . . . . . . . . . . 174,484 166,447 131,556
Net charge-offs . . . . . . . . . . . . . . . . . . . . . . . . . . . . . . . . . . . (826,946) (977,909) (988,183)Translation adjustments and other . . . . . . . . . . . . . . . . . . . . . . . . . . . . 9,445 (4,450) 3,699
Balance at end of year . . . . . . . . . . . . . . . . . . . . . . . . . . . . . . . . . . . . . . $ 832,483 $ 838,848 $ 942,721
F-21
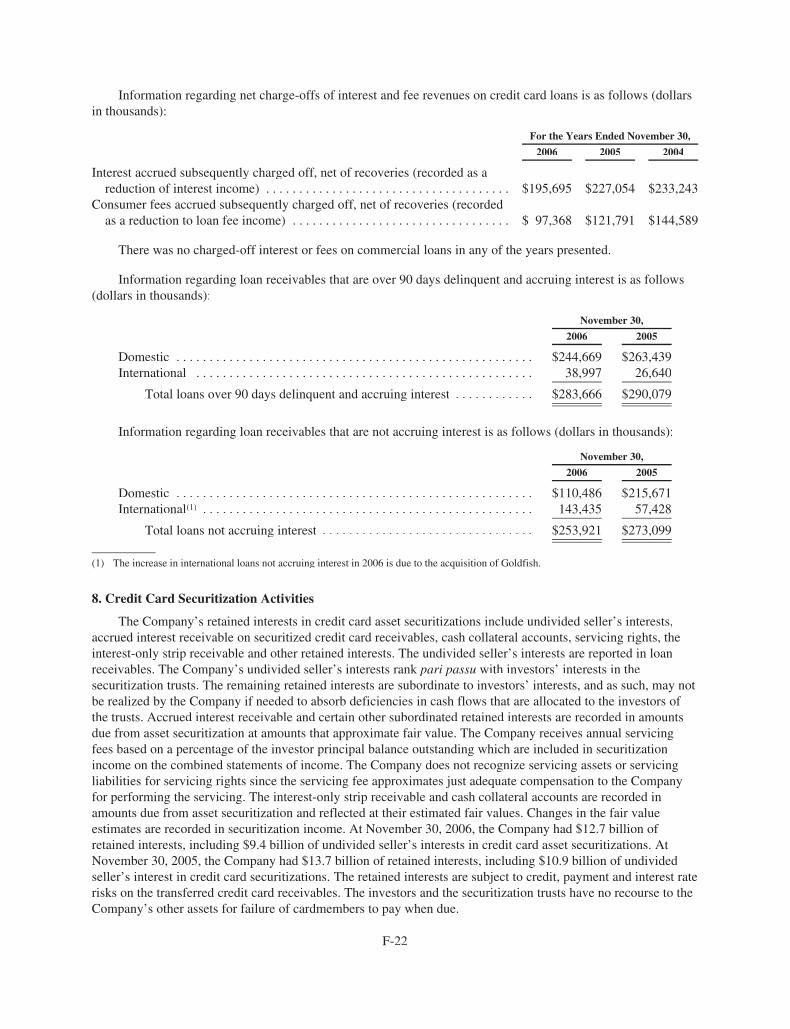
Information regarding net charge-offs of interest and fee revenues on credit card loans is as follows (dollarsin thousands):
For the Years Ended November 30,
2006 2005 2004
Interest accrued subsequently charged off, net of recoveries (recorded as areduction of interest income) . . . . . . . . . . . . . . . . . . . . . . . . . . . . . . . . . . . . . $195,695 $227,054 $233,243
Consumer fees accrued subsequently charged off, net of recoveries (recordedas a reduction to loan fee income) . . . . . . . . . . . . . . . . . . . . . . . . . . . . . . . . . $ 97,368 $121,791 $144,589
There was no charged-off interest or fees on commercial loans in any of the years presented.
Information regarding loan receivables that are over 90 days delinquent and accruing interest is as follows(dollars in thousands):
November 30,
2006 2005
Domestic . . . . . . . . . . . . . . . . . . . . . . . . . . . . . . . . . . . . . . . . . . . . . . . . . . . . . . $244,669 $263,439International . . . . . . . . . . . . . . . . . . . . . . . . . . . . . . . . . . . . . . . . . . . . . . . . . . . 38,997 26,640
Total loans over 90 days delinquent and accruing interest . . . . . . . . . . . . $283,666 $290,079
Information regarding loan receivables that are not accruing interest is as follows (dollars in thousands):
November 30,
2006 2005
Domestic . . . . . . . . . . . . . . . . . . . . . . . . . . . . . . . . . . . . . . . . . . . . . . . . . . . . . . $110,486 $215,671International(1) . . . . . . . . . . . . . . . . . . . . . . . . . . . . . . . . . . . . . . . . . . . . . . . . . . 143,435 57,428
Total loans not accruing interest . . . . . . . . . . . . . . . . . . . . . . . . . . . . . . . . $253,921 $273,099
(1) The increase in international loans not accruing interest in 2006 is due to the acquisition of Goldfish.
8. Credit Card Securitization Activities
The Company’s retained interests in credit card asset securitizations include undivided seller’s interests,accrued interest receivable on securitized credit card receivables, cash collateral accounts, servicing rights, theinterest-only strip receivable and other retained interests. The undivided seller’s interests are reported in loanreceivables. The Company’s undivided seller’s interests rank pari passu with investors’ interests in thesecuritization trusts. The remaining retained interests are subordinate to investors’ interests, and as such, may notbe realized by the Company if needed to absorb deficiencies in cash flows that are allocated to the investors ofthe trusts. Accrued interest receivable and certain other subordinated retained interests are recorded in amountsdue from asset securitization at amounts that approximate fair value. The Company receives annual servicingfees based on a percentage of the investor principal balance outstanding which are included in securitizationincome on the combined statements of income. The Company does not recognize servicing assets or servicingliabilities for servicing rights since the servicing fee approximates just adequate compensation to the Companyfor performing the servicing. The interest-only strip receivable and cash collateral accounts are recorded inamounts due from asset securitization and reflected at their estimated fair values. Changes in the fair valueestimates are recorded in securitization income. At November 30, 2006, the Company had $12.7 billion ofretained interests, including $9.4 billion of undivided seller’s interests in credit card asset securitizations. AtNovember 30, 2005, the Company had $13.7 billion of retained interests, including $10.9 billion of undividedseller’s interest in credit card securitizations. The retained interests are subject to credit, payment and interest raterisks on the transferred credit card receivables. The investors and the securitization trusts have no recourse to theCompany’s other assets for failure of cardmembers to pay when due.
F-22

The following table summarizes amounts due from asset securitizations (dollars in thousands):
November 30,
2006 2005
Cash collateral accounts . . . . . . . . . . . . . . . . . . . . . . . . . . . . . . . . . . . . . . . $1,816,003 $1,672,112Accrued interest receivable . . . . . . . . . . . . . . . . . . . . . . . . . . . . . . . . . . . . . 520,232 459,586Interest-only strip receivable . . . . . . . . . . . . . . . . . . . . . . . . . . . . . . . . . . . . 337,752 182,926Other subordinated retained interests . . . . . . . . . . . . . . . . . . . . . . . . . . . . . 439,384 420,636Other . . . . . . . . . . . . . . . . . . . . . . . . . . . . . . . . . . . . . . . . . . . . . . . . . . . . . . 56,524 49,592
Amounts due from asset securitization . . . . . . . . . . . . . . . . . . . . . . . . $3,169,895 $2,784,852
During the years ended November 30, 2006, 2005 and 2004, the Company completed consumer credit cardasset securitizations of $8.7 billion, $7.2 billion and $3.7 billion, respectively, and recognized a net revaluation oftheir subordinated retained interests, principally the interest-only strip receivable, of $159.4 million, ($78.5)million and ($8.0) million, respectively, in securitization income in the combined statements of income.Securitized consumer credit card loans outstanding at November 30, 2006 and 2005, were $26.7 billion and$24.4 billion, respectively.
Key economic assumptions used in measuring the interest-only strip receivable at the date of securitizationthat resulted from credit card securitizations completed were as follows:
For the Years Ended November 30,
2006 2005
Weighted average life (in months) . . . . . . . . . . . . . . . . . . . . . 3.7 – 4.7 4.1 – 5.9Payment rate (rate per month) . . . . . . . . . . . . . . . . . . . . . . . . 19.69% – 21.58% 18.52% – 21.14%Principal charge-offs (rate per annum) . . . . . . . . . . . . . . . . . 4.57% – 5.23% 5.60% – 6.00%Discount rate (rate per annum) . . . . . . . . . . . . . . . . . . . . . . . 11.00% 11.00% – 12.00%
Key economic assumptions and the sensitivity of the reported fair value of the interest-only strip receivableto immediate 10% and 20% adverse changes in those assumptions were as follows (dollars in millions):
November 30,
2006 2005
Interest-only receivable strip (carrying amount/fair value) . . . . . . . . . . . . . . . . . . . $ 338 $ 183Weighted average life (in months) . . . . . . . . . . . . . . . . . . . . . . . . . . . . . . . . . . . . . . 4.4 4.3Weighted average payment rate (rate per month) . . . . . . . . . . . . . . . . . . . . . . . . . . . 21.44% 21.12%
Impact on fair value of 10% adverse change . . . . . . . . . . . . . . . . . . . . . . . . . . $ (27) $ (19)Impact on fair value of 20% adverse change . . . . . . . . . . . . . . . . . . . . . . . . . . $ (50) $ (35)
Weighted average principal charge-offs (rate per annum) . . . . . . . . . . . . . . . . . . . . 4.48% 5.99%Impact on fair value of 10% adverse change . . . . . . . . . . . . . . . . . . . . . . . . . . $ (39) $ (39)Impact on fair value of 20% adverse change . . . . . . . . . . . . . . . . . . . . . . . . . . $ (78) $ (77)
Weighted average discount rate (rate per annum) . . . . . . . . . . . . . . . . . . . . . . . . . . . 11.00% 11.00%Impact on fair value of 10% adverse change . . . . . . . . . . . . . . . . . . . . . . . . . . $ (1) $ (1)Impact on fair value of 20% adverse change . . . . . . . . . . . . . . . . . . . . . . . . . . $ (3) $ (2)
The sensitivity analysis in the table above is hypothetical and should be used with caution. Changes in fairvalue based on a 10% or 20% variation in an assumption generally cannot be extrapolated because therelationship of the change in the assumption to the change in fair value may not be linear. Also, the effect of avariation in a particular assumption on the fair value of the interest-only strip receivable is calculatedindependent of changes in any other assumption; in practice, changes in one factor may result in changes in
F-23

another (for example, increases in market interest rates may result in lower payments and increased charge-offs),which might magnify or counteract the sensitivities. In addition, the sensitivity analysis does not consider anycorrective action that the Company may take to mitigate the impact of any adverse changes in the keyassumptions.
The table below summarizes certain cash flows received from the securitization master trusts (dollars inmillions):
For the Years Ended November 30,
2006 2005 2004
Proceeds from new credit card securitizations . . . . . . . . . . . . . . . . . . . . . . . . . . . . . $ 8,727 $ 7,231 $ 3,710Proceeds from collections reinvested in previous credit card securitizations . . . . . $60,947 $54,947 $61,583Contractual servicing fees received . . . . . . . . . . . . . . . . . . . . . . . . . . . . . . . . . . . . . $ 536 $ 558 $ 596Cash flows received from retained interests . . . . . . . . . . . . . . . . . . . . . . . . . . . . . . $ 2,336 $ 2,291 $ 1,845
The table below presents quantitative information about delinquencies, net principal charge-offs andcomponents of managed credit card loans, including securitized loans (dollars in millions):
November 30, 2006For the Year EndedNovember 30, 2006
LoansOutstanding
LoansDelinquent
AverageLoans
NetPrincipal
Charge-offs
Managed credit card loans . . . . . . . . . . . . . . . . . . . . . . . . . . . . . . . $50,350 $1,763 $48,216 $1,967Less: Securitized credit card loans . . . . . . . . . . . . . . . . . . . . . . . . . 26,703 1,003 26,560 1,146
Owned credit card loans . . . . . . . . . . . . . . . . . . . . . . . . . . . . . . . . . $23,647 $ 760 $21,656 $ 821
November 30, 2005For the Year EndedNovember 30, 2005
LoansOutstanding
LoansDelinquent
AverageLoans
NetPrincipal
Charge-offs
Managed credit card loans . . . . . . . . . . . . . . . . . . . . . . . . . . . . . . . $46,936 $1,867 $47,330 $2,476Less: Securitized credit card loans . . . . . . . . . . . . . . . . . . . . . . . . . 24,440 1,036 27,399 1,512
Owned credit card loans . . . . . . . . . . . . . . . . . . . . . . . . . . . . . . . . . $22,496 $ 831 $19,931 $ 964
9. Premises and Equipment
A summary of premises and equipment is as follows (dollars in thousands):
November 30,
2006 2005
Land . . . . . . . . . . . . . . . . . . . . . . . . . . . . . . . . . . . . . . . . . . . . . . . . . . . . . . . . . . . . . . . . . $ 44,531 $ 44,370Buildings and improvements . . . . . . . . . . . . . . . . . . . . . . . . . . . . . . . . . . . . . . . . . . . . . . 525,900 514,592Capitalized equipment leases . . . . . . . . . . . . . . . . . . . . . . . . . . . . . . . . . . . . . . . . . . . . . 7,924 9,774Furniture, fixtures and equipment . . . . . . . . . . . . . . . . . . . . . . . . . . . . . . . . . . . . . . . . . . 411,178 422,445Software . . . . . . . . . . . . . . . . . . . . . . . . . . . . . . . . . . . . . . . . . . . . . . . . . . . . . . . . . . . . . 275,441 178,148
Premises and equipment . . . . . . . . . . . . . . . . . . . . . . . . . . . . . . . . . . . . . . . . . . . . . 1,264,974 1,169,329Less: Accumulated depreciation . . . . . . . . . . . . . . . . . . . . . . . . . . . . . . . . . . . . . . . . . . . (454,425) (420,035)Less: Accumulated amortization of software . . . . . . . . . . . . . . . . . . . . . . . . . . . . . . . . . (149,649) (124,769)
Premises and equipment, net . . . . . . . . . . . . . . . . . . . . . . . . . . . . . . . . . . . . . . . . . . $ 660,900 $ 624,525
F-24
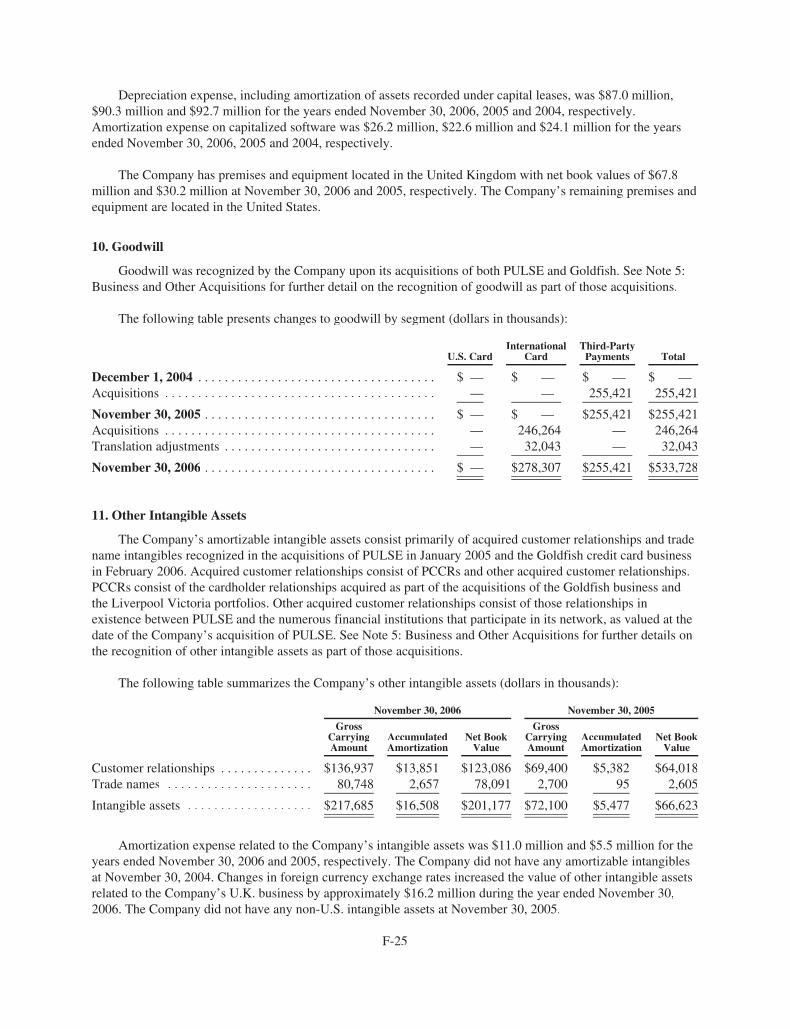
Depreciation expense, including amortization of assets recorded under capital leases, was $87.0 million,$90.3 million and $92.7 million for the years ended November 30, 2006, 2005 and 2004, respectively.Amortization expense on capitalized software was $26.2 million, $22.6 million and $24.1 million for the yearsended November 30, 2006, 2005 and 2004, respectively.
The Company has premises and equipment located in the United Kingdom with net book values of $67.8million and $30.2 million at November 30, 2006 and 2005, respectively. The Company’s remaining premises andequipment are located in the United States.
10. Goodwill
Goodwill was recognized by the Company upon its acquisitions of both PULSE and Goldfish. See Note 5:Business and Other Acquisitions for further detail on the recognition of goodwill as part of those acquisitions.
The following table presents changes to goodwill by segment (dollars in thousands):
U.S. CardInternational
CardThird-PartyPayments Total
December 1, 2004 . . . . . . . . . . . . . . . . . . . . . . . . . . . . . . . . . . . . $ — $ — $ — $ —Acquisitions . . . . . . . . . . . . . . . . . . . . . . . . . . . . . . . . . . . . . . . . . — — 255,421 255,421
November 30, 2005 . . . . . . . . . . . . . . . . . . . . . . . . . . . . . . . . . . . $ — $ — $255,421 $255,421Acquisitions . . . . . . . . . . . . . . . . . . . . . . . . . . . . . . . . . . . . . . . . . — 246,264 — 246,264Translation adjustments . . . . . . . . . . . . . . . . . . . . . . . . . . . . . . . . — 32,043 — 32,043
November 30, 2006 . . . . . . . . . . . . . . . . . . . . . . . . . . . . . . . . . . . $ — $278,307 $255,421 $533,728
11. Other Intangible Assets
The Company’s amortizable intangible assets consist primarily of acquired customer relationships and tradename intangibles recognized in the acquisitions of PULSE in January 2005 and the Goldfish credit card businessin February 2006. Acquired customer relationships consist of PCCRs and other acquired customer relationships.PCCRs consist of the cardholder relationships acquired as part of the acquisitions of the Goldfish business andthe Liverpool Victoria portfolios. Other acquired customer relationships consist of those relationships inexistence between PULSE and the numerous financial institutions that participate in its network, as valued at thedate of the Company’s acquisition of PULSE. See Note 5: Business and Other Acquisitions for further details onthe recognition of other intangible assets as part of those acquisitions.
The following table summarizes the Company’s other intangible assets (dollars in thousands):
November 30, 2006 November 30, 2005
GrossCarryingAmount
AccumulatedAmortization
Net BookValue
GrossCarryingAmount
AccumulatedAmortization
Net BookValue
Customer relationships . . . . . . . . . . . . . . $136,937 $13,851 $123,086 $69,400 $5,382 $64,018Trade names . . . . . . . . . . . . . . . . . . . . . . 80,748 2,657 78,091 2,700 95 2,605
Intangible assets . . . . . . . . . . . . . . . . . . . $217,685 $16,508 $201,177 $72,100 $5,477 $66,623
Amortization expense related to the Company’s intangible assets was $11.0 million and $5.5 million for theyears ended November 30, 2006 and 2005, respectively. The Company did not have any amortizable intangiblesat November 30, 2004. Changes in foreign currency exchange rates increased the value of other intangible assetsrelated to the Company’s U.K. business by approximately $16.2 million during the year ended November 30,2006. The Company did not have any non-U.S. intangible assets at November 30, 2005.
F-25

The following table presents expected intangible asset amortization expense for the next five years based onintangible assets at November 30, 2006 (dollars in thousands):
Year Amount
2007 . . . . . . . . . . . . . . . . . . . . . . . . . . . . . . . . . . . . . . . . . . . . . . . . . . . . . . . . . . . . . $14,0452008 . . . . . . . . . . . . . . . . . . . . . . . . . . . . . . . . . . . . . . . . . . . . . . . . . . . . . . . . . . . . . $14,7932009 . . . . . . . . . . . . . . . . . . . . . . . . . . . . . . . . . . . . . . . . . . . . . . . . . . . . . . . . . . . . . $15,0002010 . . . . . . . . . . . . . . . . . . . . . . . . . . . . . . . . . . . . . . . . . . . . . . . . . . . . . . . . . . . . . $13,8952011 . . . . . . . . . . . . . . . . . . . . . . . . . . . . . . . . . . . . . . . . . . . . . . . . . . . . . . . . . . . . . $13,793
12. Deposits
The Company’s deposits consist of brokered and direct certificates of deposits, money market depositaccounts, and, to a lesser degree, deposits payable upon demand. All interest bearing deposit accounts are derivedfrom the domestic operations. A summary of interest bearing deposit accounts is as follows (dollars inthousands):
November 30,
2006 2005
Certificates of deposit in amounts less than $100,000 . . . . . . . . . . . . . . $ 911,592 $ 1,138,199Certificates of deposit in amounts of $100,000 or greater . . . . . . . . . . . 9,393,755 14,033,299Savings deposits, including money market deposit accounts . . . . . . . . . 2,933,480 795,328
Total interest bearing deposits . . . . . . . . . . . . . . . . . . . . . . . . . . . . $13,238,827 $15,966,826
Average annual interest rate . . . . . . . . . . . . . . . . . . . . . . . . . . . . . . . . . . 4.68% 4.34%
Money market deposit accounts include amounts obtained through the Bank Deposit Program operated byMorgan Stanley. At November 30, 2006, deposits generated through the Bank Deposit Program were$1.9 billion. See Note 26: Related Party Transactions for further information on this arrangement.
At November 30, 2006 and 2005, non-interest bearing deposit accounts included $28.7 million and$16.2 million, respectively, derived from the Company’s U.K. operations.
At November 30, 2006, certificates of deposit maturing over the next five years and thereafter were asfollows (dollars in thousands):
Year Amount
2007 . . . . . . . . . . . . . . . . . . . . . . . . . . . . . . . . . . . . . . . . . . . . . . . . . . . . . . . . . . . $6,462,3752008 . . . . . . . . . . . . . . . . . . . . . . . . . . . . . . . . . . . . . . . . . . . . . . . . . . . . . . . . . . . $1,416,7812009 . . . . . . . . . . . . . . . . . . . . . . . . . . . . . . . . . . . . . . . . . . . . . . . . . . . . . . . . . . . $ 649,6462010 . . . . . . . . . . . . . . . . . . . . . . . . . . . . . . . . . . . . . . . . . . . . . . . . . . . . . . . . . . . $ 702,8162011 . . . . . . . . . . . . . . . . . . . . . . . . . . . . . . . . . . . . . . . . . . . . . . . . . . . . . . . . . . . $ 135,762Thereafter . . . . . . . . . . . . . . . . . . . . . . . . . . . . . . . . . . . . . . . . . . . . . . . . . . . . . . $ 937,967
F-26

13. Short-Term Borrowings
Borrowings from Morgan Stanley. Short-term borrowings from Morgan Stanley consist of notes payable toMorgan Stanley and Federal Funds purchased from Morgan Stanley Bank, an FDIC-regulated banking subsidiaryof Morgan Stanley, with original maturities less than one year. The following table identifies the balances andweighted average interest rates on short-term borrowings outstanding from Morgan Stanley at year-end (dollarsin thousands):
November 30, 2006 November 30, 2005
AmountWeighted Average
Interest Rate AmountWeighted Average
Interest Rate
Overnight Federal Funds purchased . . . . . . . . . . . . . . . $3,000,000 5.31% $ — — %Notes payable to Morgan Stanley
Domestic . . . . . . . . . . . . . . . . . . . . . . . . . . . . . . . . 1,811,124 5.46% 1,845,910 4.20%International . . . . . . . . . . . . . . . . . . . . . . . . . . . . . 1,828,554 5.25% 1,927,150 4.81%
Short-term borrowings from Morgan Stanley . . . . . $6,639,678 5.34% $3,773,060 4.51%
Short-term notes payable to Morgan Stanley have interest rates with spreads tied to a daily index, such asthe effective Federal Funds rate or the London Interbank Offered Rate (“LIBOR”). At November 30, 2006, theFederal Funds rate was 5.31% and LIBOR was 5.13%. The amounts represent various short-term fundingarrangements the Company has with Morgan Stanley that are payable upon demand. In 2006, 2005 and 2004,interest expense on domestic short-term notes payable to Morgan Stanley was $83.6 million, $49.2 million and$17.7 million, respectively. In 2006, 2005 and 2004, interest expense on international short-term notes payable toMorgan Stanley was $76.3 million, $44.8 million and $41.5 million, respectively.
At November 30, 2006, overnight Federal Funds purchased from Morgan Stanley Bank have maturities ofone day from the transaction date. Interest expense recorded during 2006 on overnight and term Federal Fundspurchased from Morgan Stanley was $14.2 million and $8.6 million, respectively. There were no Federal Fundspurchased from Morgan Stanley Bank in 2005 or 2004.
The Company intends to settle these short-term debt obligations prior to the Distribution from MorganStanley. See Note 26: Related Party Transactions for further disclosure concerning transactions with MorganStanley.
Borrowings with external parties. Short-term borrowings with external parties consist of term Federal Fundspurchased with original maturities less than one year. The following table identifies the balances and weightedaverage interest rates on short-term borrowings outstanding with external parties at year-end (dollars inthousands):
November 30, 2006 November 30, 2005
AmountWeighted Average
Interest Rate AmountWeighted Average
Interest Rate
Term Federal Funds purchased . . . . . . . . . . . . . . . . . . . $100,000 5.35% $ — — %
Term Federal Funds with external parties at November 30, 2006 had a remaining maturity of 169 days.There were no term Federal Funds outstanding at November 30, 2005. For the years ended November 30, 2006,2005 and 2004, interest expense on overnight Federal Funds with external parties was $1.0 million, $0.2 millionand $0.4 million, respectively. Interest expense on term Federal Funds with external parties was $10.0 million,$13.3 million and $17.0 million, respectively.
F-27

14. Long-Term Borrowings
Borrowings from Morgan Stanley. Long-term borrowings from Morgan Stanley consist of notes payable toMorgan Stanley with original maturities ranging from two to twenty years. The following table provides asummary of the Company’s long-term borrowings from Morgan Stanley (dollars in thousands):
November 30,
2006 2005
Domestic unsecured debt, with a weighted average annual interest rate of 6.18% and6.28%, respectively . . . . . . . . . . . . . . . . . . . . . . . . . . . . . . . . . . . . . . . . . . . . . . . . . . . . $ 563,579 $563,579
International unsecured debt, with a weighted average annual interest rate of 4.77% and4.82%, respectively . . . . . . . . . . . . . . . . . . . . . . . . . . . . . . . . . . . . . . . . . . . . . . . . . . . . 688,083 43,217
Total long-term debt from Morgan Stanley . . . . . . . . . . . . . . . . . . . . . . . . . . . . . . . . $1,251,662 $606,796
At November 30, 2006 and 2005, long-term notes payable to Morgan Stanley had remaining maturities ofone to sixteen years. Interest on the notes is assessed monthly and paid in the following month. For the yearsended November 30, 2006, 2005 and 2004, interest expense incurred on these notes payable to Morgan Stanleywas $62.3 million, $48.9 million and $52.3 million, respectively. The Company intends to settle these debtobligations prior to the Distribution from Morgan Stanley. See Note 26: Related Party Transactions for furtherinformation.
Other long-term debt and bank notes. Other long-term debt and bank notes consist of borrowings and capitalleases having original maturities of one year or more. The following table provides a summary of the Company’sother long-term debt and bank notes (dollars in thousands):
November 30,
2006 2005
Bank notes, with a weighted average interest rate of 5.30% and 3.42%, respectively . . . . . $249,737 $249,616Capital lease obligations, with a weighted average interest rate of 6.28% and 7.00%,
respectively . . . . . . . . . . . . . . . . . . . . . . . . . . . . . . . . . . . . . . . . . . . . . . . . . . . . . . . . . . . . 6,179 7,333
Total other long-term debt and bank notes . . . . . . . . . . . . . . . . . . . . . . . . . . . . . . . . . . $255,916 $256,949
Bank notes are issued from the Global Bank Note Program established by Discover Bank with an issuingcapacity of $5 billion. As such, they represent direct, unconditional, unsecured obligations of Discover Bank andare not subordinated to any other obligations of Discover Bank or the Company. At November 30, 2006 and2005, there were $250 million (par value) of floating-rate bank notes outstanding. Interest on the notes is paidquarterly and is assessed at 15 basis points over the three-month LIBOR, which was 5.37% at November 30,2006. The Company paid $613 thousand in brokerage commissions to Morgan Stanley & Co. Incorporated, asubsidiary of Morgan Stanley, for the sale of these bank notes in 2004. These commissions are amortized tointerest expense over the life of the notes. Unamortized commissions totaled $269 thousand and $391 thousand atNovember 30, 2006 and 2005, respectively.
The Company’s capital leases cover computers and processing equipment and are classified as directfinance leasing. See Note 9: Premises and Equipment and Note 20: Commitments, Contingencies and Guaranteesto the combined statements of financial condition for further capital lease disclosures.
F-28
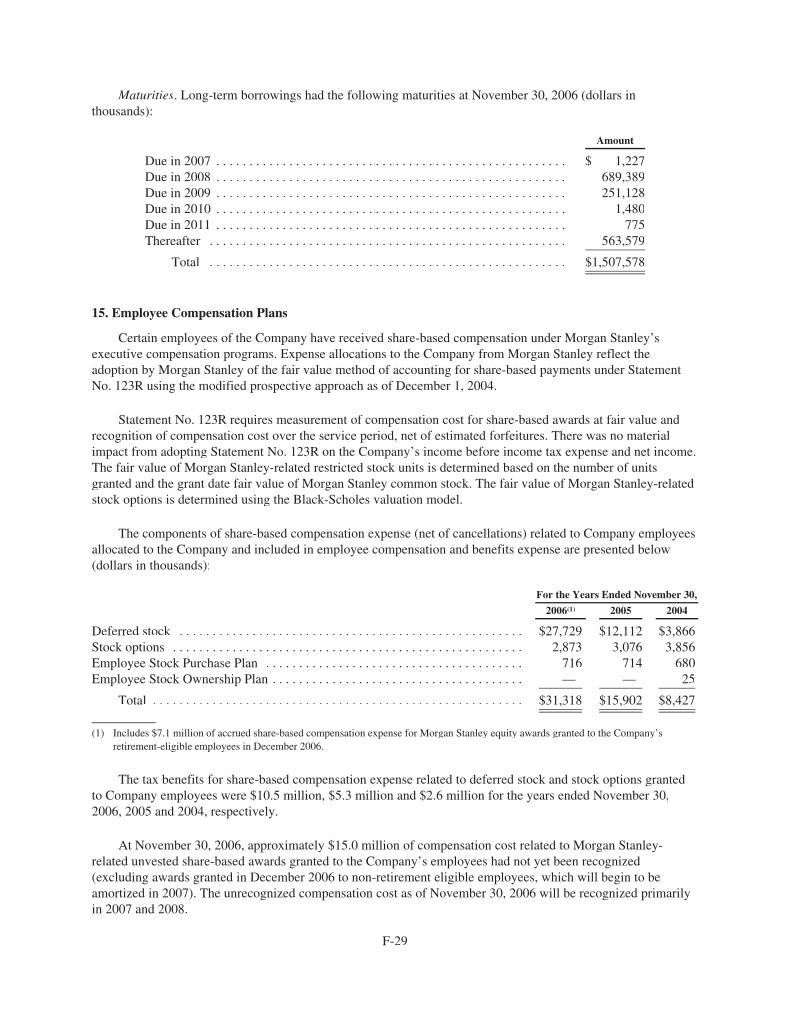
Maturities. Long-term borrowings had the following maturities at November 30, 2006 (dollars inthousands):
Amount
Due in 2007 . . . . . . . . . . . . . . . . . . . . . . . . . . . . . . . . . . . . . . . . . . . . . . . . . . . . . $ 1,227Due in 2008 . . . . . . . . . . . . . . . . . . . . . . . . . . . . . . . . . . . . . . . . . . . . . . . . . . . . . 689,389Due in 2009 . . . . . . . . . . . . . . . . . . . . . . . . . . . . . . . . . . . . . . . . . . . . . . . . . . . . . 251,128Due in 2010 . . . . . . . . . . . . . . . . . . . . . . . . . . . . . . . . . . . . . . . . . . . . . . . . . . . . . 1,480Due in 2011 . . . . . . . . . . . . . . . . . . . . . . . . . . . . . . . . . . . . . . . . . . . . . . . . . . . . . 775Thereafter . . . . . . . . . . . . . . . . . . . . . . . . . . . . . . . . . . . . . . . . . . . . . . . . . . . . . . 563,579
Total . . . . . . . . . . . . . . . . . . . . . . . . . . . . . . . . . . . . . . . . . . . . . . . . . . . . . . $1,507,578
15. Employee Compensation Plans
Certain employees of the Company have received share-based compensation under Morgan Stanley’sexecutive compensation programs. Expense allocations to the Company from Morgan Stanley reflect theadoption by Morgan Stanley of the fair value method of accounting for share-based payments under StatementNo. 123R using the modified prospective approach as of December 1, 2004.
Statement No. 123R requires measurement of compensation cost for share-based awards at fair value andrecognition of compensation cost over the service period, net of estimated forfeitures. There was no materialimpact from adopting Statement No. 123R on the Company’s income before income tax expense and net income.The fair value of Morgan Stanley-related restricted stock units is determined based on the number of unitsgranted and the grant date fair value of Morgan Stanley common stock. The fair value of Morgan Stanley-relatedstock options is determined using the Black-Scholes valuation model.
The components of share-based compensation expense (net of cancellations) related to Company employeesallocated to the Company and included in employee compensation and benefits expense are presented below(dollars in thousands):
For the Years Ended November 30,
2006(1) 2005 2004
Deferred stock . . . . . . . . . . . . . . . . . . . . . . . . . . . . . . . . . . . . . . . . . . . . . . . . . . . . $27,729 $12,112 $3,866Stock options . . . . . . . . . . . . . . . . . . . . . . . . . . . . . . . . . . . . . . . . . . . . . . . . . . . . . 2,873 3,076 3,856Employee Stock Purchase Plan . . . . . . . . . . . . . . . . . . . . . . . . . . . . . . . . . . . . . . . 716 714 680Employee Stock Ownership Plan . . . . . . . . . . . . . . . . . . . . . . . . . . . . . . . . . . . . . . — — 25
Total . . . . . . . . . . . . . . . . . . . . . . . . . . . . . . . . . . . . . . . . . . . . . . . . . . . . . . . . $31,318 $15,902 $8,427
(1) Includes $7.1 million of accrued share-based compensation expense for Morgan Stanley equity awards granted to the Company’sretirement-eligible employees in December 2006.
The tax benefits for share-based compensation expense related to deferred stock and stock options grantedto Company employees were $10.5 million, $5.3 million and $2.6 million for the years ended November 30,2006, 2005 and 2004, respectively.
At November 30, 2006, approximately $15.0 million of compensation cost related to Morgan Stanley-related unvested share-based awards granted to the Company’s employees had not yet been recognized(excluding awards granted in December 2006 to non-retirement eligible employees, which will begin to beamortized in 2007). The unrecognized compensation cost as of November 30, 2006 will be recognized primarilyin 2007 and 2008.
F-29
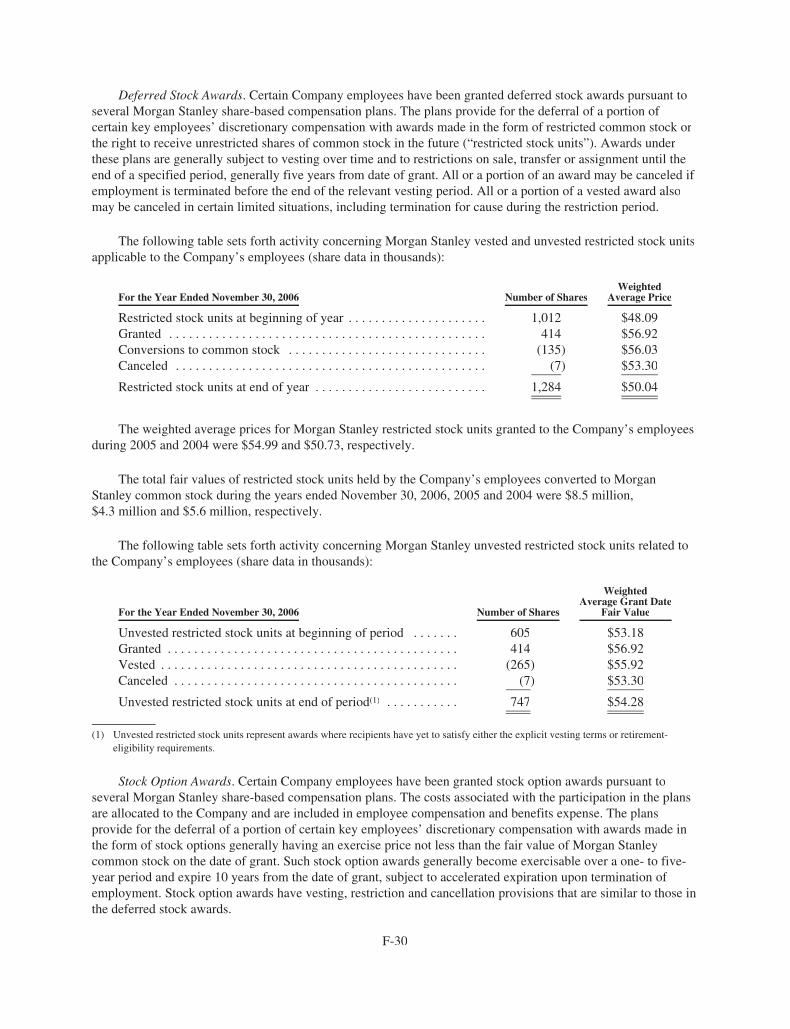
Deferred Stock Awards. Certain Company employees have been granted deferred stock awards pursuant toseveral Morgan Stanley share-based compensation plans. The plans provide for the deferral of a portion ofcertain key employees’ discretionary compensation with awards made in the form of restricted common stock orthe right to receive unrestricted shares of common stock in the future (“restricted stock units”). Awards underthese plans are generally subject to vesting over time and to restrictions on sale, transfer or assignment until theend of a specified period, generally five years from date of grant. All or a portion of an award may be canceled ifemployment is terminated before the end of the relevant vesting period. All or a portion of a vested award alsomay be canceled in certain limited situations, including termination for cause during the restriction period.
The following table sets forth activity concerning Morgan Stanley vested and unvested restricted stock unitsapplicable to the Company’s employees (share data in thousands):
For the Year Ended November 30, 2006 Number of SharesWeighted
Average Price
Restricted stock units at beginning of year . . . . . . . . . . . . . . . . . . . . . 1,012 $48.09Granted . . . . . . . . . . . . . . . . . . . . . . . . . . . . . . . . . . . . . . . . . . . . . . . . 414 $56.92Conversions to common stock . . . . . . . . . . . . . . . . . . . . . . . . . . . . . . (135) $56.03Canceled . . . . . . . . . . . . . . . . . . . . . . . . . . . . . . . . . . . . . . . . . . . . . . . (7) $53.30
Restricted stock units at end of year . . . . . . . . . . . . . . . . . . . . . . . . . . 1,284 $50.04
The weighted average prices for Morgan Stanley restricted stock units granted to the Company’s employeesduring 2005 and 2004 were $54.99 and $50.73, respectively.
The total fair values of restricted stock units held by the Company’s employees converted to MorganStanley common stock during the years ended November 30, 2006, 2005 and 2004 were $8.5 million,$4.3 million and $5.6 million, respectively.
The following table sets forth activity concerning Morgan Stanley unvested restricted stock units related tothe Company’s employees (share data in thousands):
For the Year Ended November 30, 2006 Number of Shares
WeightedAverage Grant Date
Fair Value
Unvested restricted stock units at beginning of period . . . . . . . 605 $53.18Granted . . . . . . . . . . . . . . . . . . . . . . . . . . . . . . . . . . . . . . . . . . . . 414 $56.92Vested . . . . . . . . . . . . . . . . . . . . . . . . . . . . . . . . . . . . . . . . . . . . . (265) $55.92Canceled . . . . . . . . . . . . . . . . . . . . . . . . . . . . . . . . . . . . . . . . . . . (7) $53.30
Unvested restricted stock units at end of period(1) . . . . . . . . . . . 747 $54.28
(1) Unvested restricted stock units represent awards where recipients have yet to satisfy either the explicit vesting terms or retirement-eligibility requirements.
Stock Option Awards. Certain Company employees have been granted stock option awards pursuant toseveral Morgan Stanley share-based compensation plans. The costs associated with the participation in the plansare allocated to the Company and are included in employee compensation and benefits expense. The plansprovide for the deferral of a portion of certain key employees’ discretionary compensation with awards made inthe form of stock options generally having an exercise price not less than the fair value of Morgan Stanleycommon stock on the date of grant. Such stock option awards generally become exercisable over a one- to five-year period and expire 10 years from the date of grant, subject to accelerated expiration upon termination ofemployment. Stock option awards have vesting, restriction and cancellation provisions that are similar to those inthe deferred stock awards.
F-30

The weighted average fair values of Morgan Stanley stock options related to the Company’s employeesgranted during the years ended November 30, 2006, 2005 and 2004 were $18.43, $14.07 and $15.15,respectively, utilizing the following weighted average assumptions:
For the Years Ended November 30,
2006 2005 2004
Risk-free interest rate . . . . . . . . . . . . . . . . . . . . . . . . . . . . . . . . . . . . . . . . . . . . . . . 4.6% 3.6% 3.2%Expected option life in years . . . . . . . . . . . . . . . . . . . . . . . . . . . . . . . . . . . . . . . . . . 4.4 4.3 4.8Expected stock price volatility . . . . . . . . . . . . . . . . . . . . . . . . . . . . . . . . . . . . . . . . 34.7% 33.9% 35.2%Expected dividend yield . . . . . . . . . . . . . . . . . . . . . . . . . . . . . . . . . . . . . . . . . . . . . 1.7% 2.0% 1.9%
The expected option life of stock options and the expected dividend yield of stock have been determinedbased upon Morgan Stanley’s historical experience. The expected stock price volatility has been determinedbased upon Morgan Stanley’s historical stock price data over a time period similar to the expected option life.These assumptions are not necessarily indicative of future assumptions or experience.
The following table sets forth activity concerning Morgan Stanley stock options granted to the Company’semployees for the year ended November 30, 2006 (option and dollar values in thousands, except exercise price):
Numberof Options
WeightedAverageExercisePrice
WeightedAverage
RemainingLife (Years)
AggregatedIntrinsicValue
Options outstanding at beginning of year . . . . . . . . . . . . . . . . . . . . 2,656 $45.66Granted . . . . . . . . . . . . . . . . . . . . . . . . . . . . . . . . . . . . . . . . . . 30 $64.25Exercised . . . . . . . . . . . . . . . . . . . . . . . . . . . . . . . . . . . . . . . . . (521) $32.76Canceled . . . . . . . . . . . . . . . . . . . . . . . . . . . . . . . . . . . . . . . . . (12) $62.45
Options outstanding at end of year . . . . . . . . . . . . . . . . . . . . . . . . . 2,153 $48.96 4.5 $59,207
Options exercisable at end of year . . . . . . . . . . . . . . . . . . . . . . . . . . 1,761 $47.87 3.9 $50,467
The total intrinsic values of Morgan Stanley stock options exercised by the Company’s employees duringthe years ended November 30, 2006, 2005 and 2004 were $18.5 million, $24.7 million and $14.3 million,respectively.
Employee Stock Purchase Plan. Morgan Stanley’s Employee Stock Purchase Plan (the “ESPP”) allowsemployees of the Company to purchase shares of Morgan Stanley common stock at a 15% discount from marketvalue. The Company expenses the 15% discount associated with the ESPP.
Morgan Stanley/Discover 401(k) and Profit Sharing Awards. Eligible U.S. employees of the Companyreceive 401(k) matching contributions which are invested in Morgan Stanley common stock. Morgan Stanleyalso provides discretionary profit sharing to certain employees of the Company. The pre-tax expense associatedwith the 401(k) match and profit sharing related to the Company’s employees for the years ended November 30,2006, 2005 and 2004 was $14.8 million, $14.6 million and $12.0 million, respectively.
16. Employee Benefit Plans
The Company participates in defined benefit pension and other postretirement plans sponsored by MorganStanley for eligible U.S. employees. A supplementary pension plan covering certain executives is directlysponsored by the Company. The Company also participates in a separate defined contribution pension planmaintained by Morgan Stanley that covers substantially all of its non-U.S. employees. The following discussionsummarizes these plans.
F-31

Defined Benefit Pension and Other Postretirement Plans. Substantially all of the U.S. employees of theCompany are covered by a non-contributory pension plan that is qualified under Section 401(a) of the InternalRevenue Code (the “Qualified Plan”). An unfunded supplementary plan (the “Supplemental Plan”) covers certainexecutives. These pension plans generally provide pension benefits that are based on each employee’s years ofcredited service and on compensation levels specified in the plans. For the Qualified Plan, the Company’s policyis to fund at least the amounts sufficient to meet minimum funding requirements under the Employee RetirementIncome Security Act of 1974 (“ERISA”). Liabilities for benefits payable under the Supplemental Plan areaccrued by the Company and are funded when paid to the beneficiaries.
The Company also participates in an unfunded postretirement benefit plan that provides medical and lifeinsurance for eligible U.S. retirees and their dependents.
The Company uses a measurement date of September 30 to calculate obligations under its pension andpostretirement plans.
Historically, the Company’s portion of pension and postretirement obligations and expense has beencalculated using separate actuarial valuations based on the Company’s specific demographic data and separatelytracked plan assets. Unrecognized gains/losses and unrecognized prior service costs (plan amendments) havebeen calculated and tracked separately as well based on the Company’s experience.
The following tables present information for the Company’s pension and postretirement plans on anaggregate basis:
Net Periodic Benefit Expense. Net periodic benefit expense allocated to the Company included the followingcomponents (dollars in thousands):
Pension Postretirement
For the Years Ended November 30, For the Years Ended November 30,
2006 2005 2004 2006 2005 2004
Service cost, benefits earned during theperiod . . . . . . . . . . . . . . . . . . . . . . . . . . . . . . $ 20,093 $ 18,642 $ 18,409 $1,441 $1,134 $1,324
Interest cost on projected benefit obligation . . 18,340 16,734 16,510 1,437 1,433 1,338Expected return on plan assets . . . . . . . . . . . . . (20,648) (19,363) (20,574) — — —Net amortization . . . . . . . . . . . . . . . . . . . . . . . . 4,082 2,797 618 (374) (378) (424)Net settlements and curtailments . . . . . . . . . . . — — 327 — — —
Net periodic benefit expense . . . . . . . . . . . . $ 21,867 $ 18,810 $ 15,290 $2,504 $2,189 $2,238
F-32
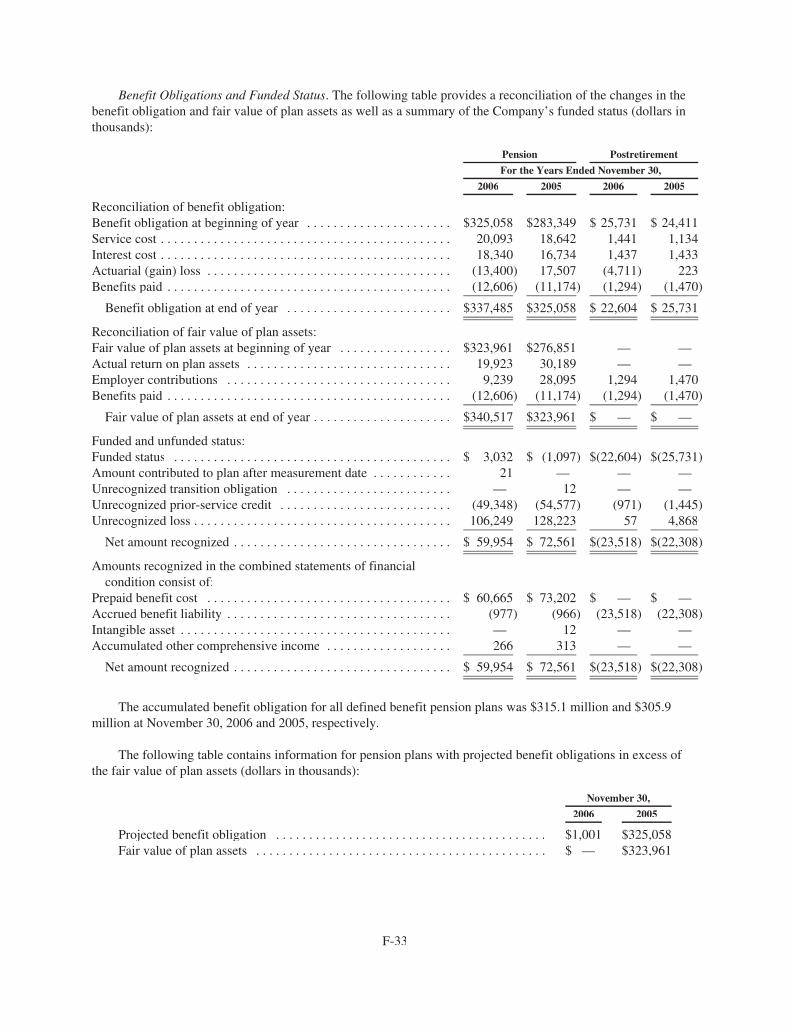
Benefit Obligations and Funded Status. The following table provides a reconciliation of the changes in thebenefit obligation and fair value of plan assets as well as a summary of the Company’s funded status (dollars inthousands):
Pension Postretirement
For the Years Ended November 30,
2006 2005 2006 2005
Reconciliation of benefit obligation:Benefit obligation at beginning of year . . . . . . . . . . . . . . . . . . . . . . $325,058 $283,349 $ 25,731 $ 24,411Service cost . . . . . . . . . . . . . . . . . . . . . . . . . . . . . . . . . . . . . . . . . . . . 20,093 18,642 1,441 1,134Interest cost . . . . . . . . . . . . . . . . . . . . . . . . . . . . . . . . . . . . . . . . . . . . 18,340 16,734 1,437 1,433Actuarial (gain) loss . . . . . . . . . . . . . . . . . . . . . . . . . . . . . . . . . . . . . (13,400) 17,507 (4,711) 223Benefits paid . . . . . . . . . . . . . . . . . . . . . . . . . . . . . . . . . . . . . . . . . . . (12,606) (11,174) (1,294) (1,470)
Benefit obligation at end of year . . . . . . . . . . . . . . . . . . . . . . . . . $337,485 $325,058 $ 22,604 $ 25,731
Reconciliation of fair value of plan assets:Fair value of plan assets at beginning of year . . . . . . . . . . . . . . . . . $323,961 $276,851 — —Actual return on plan assets . . . . . . . . . . . . . . . . . . . . . . . . . . . . . . . 19,923 30,189 — —Employer contributions . . . . . . . . . . . . . . . . . . . . . . . . . . . . . . . . . . 9,239 28,095 1,294 1,470Benefits paid . . . . . . . . . . . . . . . . . . . . . . . . . . . . . . . . . . . . . . . . . . . (12,606) (11,174) (1,294) (1,470)
Fair value of plan assets at end of year . . . . . . . . . . . . . . . . . . . . . $340,517 $323,961 $ — $ —
Funded and unfunded status:Funded status . . . . . . . . . . . . . . . . . . . . . . . . . . . . . . . . . . . . . . . . . . $ 3,032 $ (1,097) $(22,604) $(25,731)Amount contributed to plan after measurement date . . . . . . . . . . . . 21 — — —Unrecognized transition obligation . . . . . . . . . . . . . . . . . . . . . . . . . — 12 — —Unrecognized prior-service credit . . . . . . . . . . . . . . . . . . . . . . . . . . (49,348) (54,577) (971) (1,445)Unrecognized loss . . . . . . . . . . . . . . . . . . . . . . . . . . . . . . . . . . . . . . . 106,249 128,223 57 4,868
Net amount recognized . . . . . . . . . . . . . . . . . . . . . . . . . . . . . . . . . $ 59,954 $ 72,561 $(23,518) $(22,308)
Amounts recognized in the combined statements of financialcondition consist of:
Prepaid benefit cost . . . . . . . . . . . . . . . . . . . . . . . . . . . . . . . . . . . . . $ 60,665 $ 73,202 $ — $ —Accrued benefit liability . . . . . . . . . . . . . . . . . . . . . . . . . . . . . . . . . . (977) (966) (23,518) (22,308)Intangible asset . . . . . . . . . . . . . . . . . . . . . . . . . . . . . . . . . . . . . . . . . — 12 — —Accumulated other comprehensive income . . . . . . . . . . . . . . . . . . . 266 313 — —
Net amount recognized . . . . . . . . . . . . . . . . . . . . . . . . . . . . . . . . . $ 59,954 $ 72,561 $(23,518) $(22,308)
The accumulated benefit obligation for all defined benefit pension plans was $315.1 million and $305.9million at November 30, 2006 and 2005, respectively.
The following table contains information for pension plans with projected benefit obligations in excess ofthe fair value of plan assets (dollars in thousands):
November 30,
2006 2005
Projected benefit obligation . . . . . . . . . . . . . . . . . . . . . . . . . . . . . . . . . . . . . . . . . $1,001 $325,058Fair value of plan assets . . . . . . . . . . . . . . . . . . . . . . . . . . . . . . . . . . . . . . . . . . . . $ — $323,961
F-33
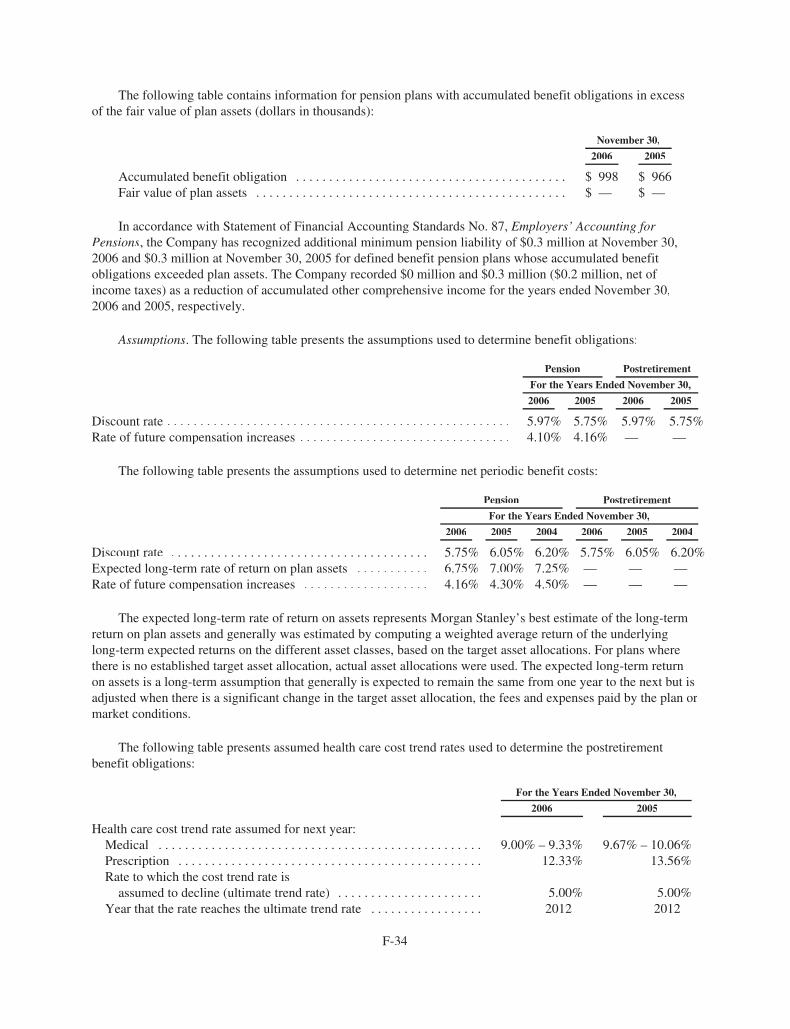
The following table contains information for pension plans with accumulated benefit obligations in excessof the fair value of plan assets (dollars in thousands):
November 30,
2006 2005
Accumulated benefit obligation . . . . . . . . . . . . . . . . . . . . . . . . . . . . . . . . . . . . . . . . . $ 998 $ 966Fair value of plan assets . . . . . . . . . . . . . . . . . . . . . . . . . . . . . . . . . . . . . . . . . . . . . . . $ — $ —
In accordance with Statement of Financial Accounting Standards No. 87, Employers’ Accounting forPensions, the Company has recognized additional minimum pension liability of $0.3 million at November 30,2006 and $0.3 million at November 30, 2005 for defined benefit pension plans whose accumulated benefitobligations exceeded plan assets. The Company recorded $0 million and $0.3 million ($0.2 million, net ofincome taxes) as a reduction of accumulated other comprehensive income for the years ended November 30,2006 and 2005, respectively.
Assumptions. The following table presents the assumptions used to determine benefit obligations:
Pension Postretirement
For the Years Ended November 30,
2006 2005 2006 2005
Discount rate . . . . . . . . . . . . . . . . . . . . . . . . . . . . . . . . . . . . . . . . . . . . . . . . . . . . 5.97% 5.75% 5.97% 5.75%Rate of future compensation increases . . . . . . . . . . . . . . . . . . . . . . . . . . . . . . . . 4.10% 4.16% — —
The following table presents the assumptions used to determine net periodic benefit costs:
Pension Postretirement
For the Years Ended November 30,
2006 2005 2004 2006 2005 2004
Discount rate . . . . . . . . . . . . . . . . . . . . . . . . . . . . . . . . . . . . . . . 5.75% 6.05% 6.20% 5.75% 6.05% 6.20%Expected long-term rate of return on plan assets . . . . . . . . . . . 6.75% 7.00% 7.25% — — —Rate of future compensation increases . . . . . . . . . . . . . . . . . . . 4.16% 4.30% 4.50% — — —
The expected long-term rate of return on assets represents Morgan Stanley’s best estimate of the long-termreturn on plan assets and generally was estimated by computing a weighted average return of the underlyinglong-term expected returns on the different asset classes, based on the target asset allocations. For plans wherethere is no established target asset allocation, actual asset allocations were used. The expected long-term returnon assets is a long-term assumption that generally is expected to remain the same from one year to the next but isadjusted when there is a significant change in the target asset allocation, the fees and expenses paid by the plan ormarket conditions.
The following table presents assumed health care cost trend rates used to determine the postretirementbenefit obligations:
For the Years Ended November 30,
2006 2005
Health care cost trend rate assumed for next year:Medical . . . . . . . . . . . . . . . . . . . . . . . . . . . . . . . . . . . . . . . . . . . . . . . . . 9.00% – 9.33% 9.67% – 10.06%Prescription . . . . . . . . . . . . . . . . . . . . . . . . . . . . . . . . . . . . . . . . . . . . . . 12.33% 13.56%Rate to which the cost trend rate is
assumed to decline (ultimate trend rate) . . . . . . . . . . . . . . . . . . . . . . 5.00% 5.00%Year that the rate reaches the ultimate trend rate . . . . . . . . . . . . . . . . . 2012 2012
F-34

Assumed health care cost trend rates can have a significant effect on the amounts reported for theCompany’s postretirement benefit plans. A one-percentage point change in assumed health care cost trend rateswould have the following effects (dollars in thousands):
One-PercentagePoint Increase
One-PercentagePoint Decrease
Effect on total of service and interest cost . . . . . . . . . . . . . . . . . . . . . . $ 21 $ (28)Effect on postretirement benefit obligation . . . . . . . . . . . . . . . . . . . . . $200 $(291)
Qualified Plan Assets. The asset allocation for the Qualified Plan at November 30, 2006 and November 30,2005 and the targeted asset allocation for 2007 by asset class is as follows:
For the Years Ended November 30,
2007Target 2006 2005
Equity securities . . . . . . . . . . . . . . . . . . . . . . . . . . . . . . . . . . . . . . . . . . . . . . . . . . . 45.0% 44.4% 47.0%Fixed income securities . . . . . . . . . . . . . . . . . . . . . . . . . . . . . . . . . . . . . . . . . . . . . 55.0% 51.4% 43.2%Other—primarily cash . . . . . . . . . . . . . . . . . . . . . . . . . . . . . . . . . . . . . . . . . . . . . . — 4.2% 9.8%
Total . . . . . . . . . . . . . . . . . . . . . . . . . . . . . . . . . . . . . . . . . . . . . . . . . . . . . . . . 100.0% 100.0% 100.0%
The Qualified Plan assets include Morgan Stanley funds that are managed by Morgan Stanley.
Qualified Pension Plan Asset Allocation. Morgan Stanley, in consultation with its independent investmentconsultants and actuaries, determined the asset allocation targets for the Qualified Plan based on its assessment ofbusiness and financial conditions, demographic and actuarial data, funding characteristics and related risk factors.Other relevant factors, including industry practices and long-term historical and prospective capital marketreturns were considered as well.
The Qualified Plan return objectives provide long-term measures for monitoring the investmentperformance against growth in the pension obligations. The overall allocation is expected to help protect theplan’s funded status while generating sufficiently stable real returns (net of inflation) to help cover current andfuture benefit payments. Total Qualified Plan portfolio performance is assessed by comparing actual returns withrelevant benchmarks, such as the S&P 500 Index, the Russell 2000 Index, the MSCI EAFE Index and, in the caseof the fixed income portfolio, the Qualified Plan’s liability profile.
Both the equity and fixed income portions of the asset allocation use a combination of active and passiveinvestment strategies and different investment styles. The fixed income asset allocation consists of longerduration fixed income securities in order to help reduce plan exposure to interest rate variation and to bettercorrelate assets with obligations. The longer duration fixed income allocation is expected to help stabilize plancontributions over the long run.
The asset mix of the Qualified Plan is reviewed by the Morgan Stanley Retirement Plan InvestmentCommittee on a regular basis. When asset class exposure reaches a minimum or maximum level, an assetallocation review process is initiated and the portfolio is automatically rebalanced back to target allocation levels,unless the Investment Committee determines otherwise.
The Investment Committee has determined to allocate no more than 10% of the Qualified Plan assets to“alternative” asset classes that provide attractive diversification benefits, absolute return enhancement and/orother potential benefit to the plan. Allocations to alternative asset classes will be made based upon an evaluationof particular attributes and relevant considerations of each asset class.
F-35
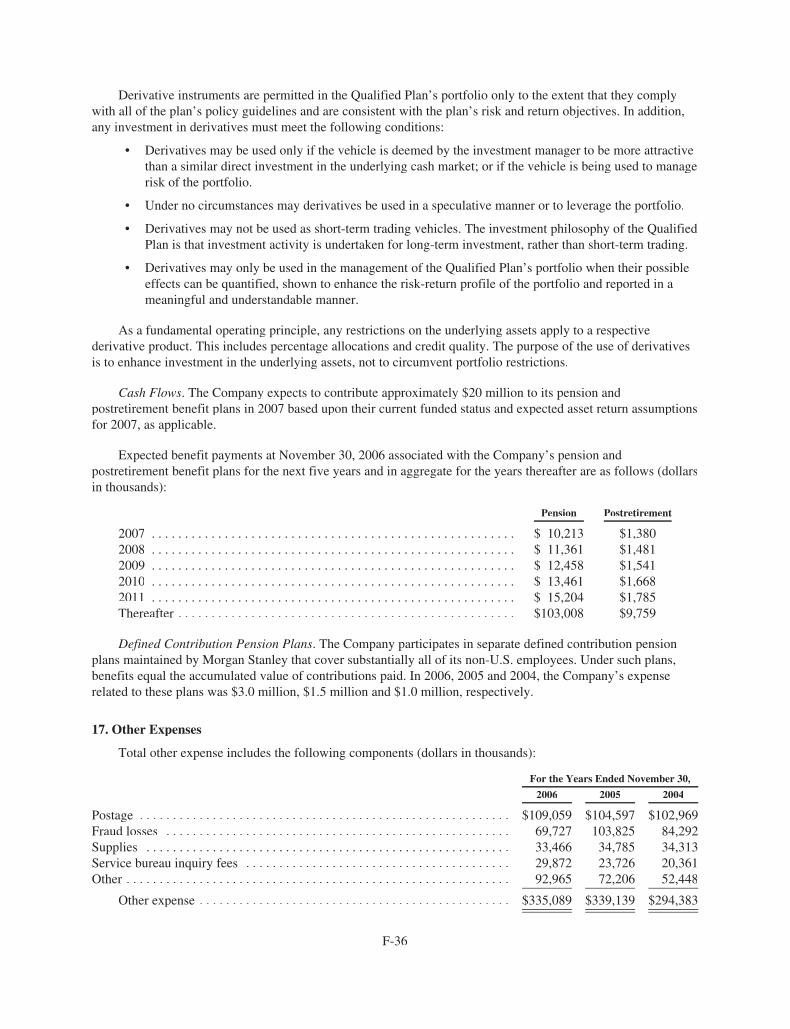
Derivative instruments are permitted in the Qualified Plan’s portfolio only to the extent that they complywith all of the plan’s policy guidelines and are consistent with the plan’s risk and return objectives. In addition,any investment in derivatives must meet the following conditions:
• Derivatives may be used only if the vehicle is deemed by the investment manager to be more attractivethan a similar direct investment in the underlying cash market; or if the vehicle is being used to managerisk of the portfolio.
• Under no circumstances may derivatives be used in a speculative manner or to leverage the portfolio.
• Derivatives may not be used as short-term trading vehicles. The investment philosophy of the QualifiedPlan is that investment activity is undertaken for long-term investment, rather than short-term trading.
• Derivatives may only be used in the management of the Qualified Plan’s portfolio when their possibleeffects can be quantified, shown to enhance the risk-return profile of the portfolio and reported in ameaningful and understandable manner.
As a fundamental operating principle, any restrictions on the underlying assets apply to a respectivederivative product. This includes percentage allocations and credit quality. The purpose of the use of derivativesis to enhance investment in the underlying assets, not to circumvent portfolio restrictions.
Cash Flows. The Company expects to contribute approximately $20 million to its pension andpostretirement benefit plans in 2007 based upon their current funded status and expected asset return assumptionsfor 2007, as applicable.
Expected benefit payments at November 30, 2006 associated with the Company’s pension andpostretirement benefit plans for the next five years and in aggregate for the years thereafter are as follows (dollarsin thousands):
Pension Postretirement
2007 . . . . . . . . . . . . . . . . . . . . . . . . . . . . . . . . . . . . . . . . . . . . . . . . . . . . . . . $ 10,213 $1,3802008 . . . . . . . . . . . . . . . . . . . . . . . . . . . . . . . . . . . . . . . . . . . . . . . . . . . . . . . $ 11,361 $1,4812009 . . . . . . . . . . . . . . . . . . . . . . . . . . . . . . . . . . . . . . . . . . . . . . . . . . . . . . . $ 12,458 $1,5412010 . . . . . . . . . . . . . . . . . . . . . . . . . . . . . . . . . . . . . . . . . . . . . . . . . . . . . . . $ 13,461 $1,6682011 . . . . . . . . . . . . . . . . . . . . . . . . . . . . . . . . . . . . . . . . . . . . . . . . . . . . . . . $ 15,204 $1,785Thereafter . . . . . . . . . . . . . . . . . . . . . . . . . . . . . . . . . . . . . . . . . . . . . . . . . . . $103,008 $9,759
Defined Contribution Pension Plans. The Company participates in separate defined contribution pensionplans maintained by Morgan Stanley that cover substantially all of its non-U.S. employees. Under such plans,benefits equal the accumulated value of contributions paid. In 2006, 2005 and 2004, the Company’s expenserelated to these plans was $3.0 million, $1.5 million and $1.0 million, respectively.
17. Other Expenses
Total other expense includes the following components (dollars in thousands):
For the Years Ended November 30,
2006 2005 2004
Postage . . . . . . . . . . . . . . . . . . . . . . . . . . . . . . . . . . . . . . . . . . . . . . . . . . . . . . . . $109,059 $104,597 $102,969Fraud losses . . . . . . . . . . . . . . . . . . . . . . . . . . . . . . . . . . . . . . . . . . . . . . . . . . . . 69,727 103,825 84,292Supplies . . . . . . . . . . . . . . . . . . . . . . . . . . . . . . . . . . . . . . . . . . . . . . . . . . . . . . . 33,466 34,785 34,313Service bureau inquiry fees . . . . . . . . . . . . . . . . . . . . . . . . . . . . . . . . . . . . . . . . 29,872 23,726 20,361Other . . . . . . . . . . . . . . . . . . . . . . . . . . . . . . . . . . . . . . . . . . . . . . . . . . . . . . . . . . 92,965 72,206 52,448
Other expense . . . . . . . . . . . . . . . . . . . . . . . . . . . . . . . . . . . . . . . . . . . . . . . $335,089 $339,139 $294,383
F-36

18. Income Taxes
Income tax expense consisted of the following (dollars in thousands):
For the Years EndedNovember 30,
2006 2005 2004
Current:U.S. federal . . . . . . . . . . . . . . . . . . . . . . . . . . . . . . . . . . . . . . . . . . . . . . . . . $414,246 $384,767 $437,149U.S. state and local(1) . . . . . . . . . . . . . . . . . . . . . . . . . . . . . . . . . . . . . . . . . (18,663) 35,292 35,443International . . . . . . . . . . . . . . . . . . . . . . . . . . . . . . . . . . . . . . . . . . . . . . . . 33,775 (9) (4,742)
Total . . . . . . . . . . . . . . . . . . . . . . . . . . . . . . . . . . . . . . . . . . . . . . . . . . 429,358 420,050 467,850Deferred:
U.S. federal . . . . . . . . . . . . . . . . . . . . . . . . . . . . . . . . . . . . . . . . . . . . . . . . . 80,819 (72,119) (21,258)U.S. state and local . . . . . . . . . . . . . . . . . . . . . . . . . . . . . . . . . . . . . . . . . . . (2,509) (1,033) (3,929)International . . . . . . . . . . . . . . . . . . . . . . . . . . . . . . . . . . . . . . . . . . . . . . . . (1,979) (557) (9)
Total . . . . . . . . . . . . . . . . . . . . . . . . . . . . . . . . . . . . . . . . . . . . . . . . . . 76,331 (73,709) (25,196)
Income tax expense . . . . . . . . . . . . . . . . . . . . . . . . . . . . . . . . . . $505,689 $346,341 $442,654
(1) In 2006, the Company had several outstanding tax matters resolved or settled in its favor that had a $60 million impact on income taxexpense.
The earnings of foreign subsidiaries encompassed in the U.K. operations have been earmarked forrepatriation at November 30, 2006 and 2005 and were not considered to be permanently reinvested. Managementanticipates reevaluating this position in subsequent years. For the years presented, any applicable foreign taxesrelated to the U.K. operations have been paid by a non-U.S. affiliate of Morgan Stanley.
The following table reconciles the Company’s effective tax rate to the U.S. federal statutory income tax rate:
For the Years Ended November 30,
2006 2005 2004
U.S. federal statutory income tax rate . . . . . . . . . . . . . . . . . . . . . . . . . . . . . . . . . . . 35.0% 35.0% 35.0%U.S state and local income taxes, net of U.S. federal income tax benefits . . . . . . . 1.8 3.7 1.7Federal examinations and settlements . . . . . . . . . . . . . . . . . . . . . . . . . . . . . . . . . . (2.4) 0.1 —State examinations and settlements . . . . . . . . . . . . . . . . . . . . . . . . . . . . . . . . . . . . (1.4) (1.3) —Other . . . . . . . . . . . . . . . . . . . . . . . . . . . . . . . . . . . . . . . . . . . . . . . . . . . . . . . . . . . . (1.0) — (0.4)
Effective income tax rate . . . . . . . . . . . . . . . . . . . . . . . . . . . . . . . . . . . . . . . . 32.0% 37.5% 36.3%
F-37
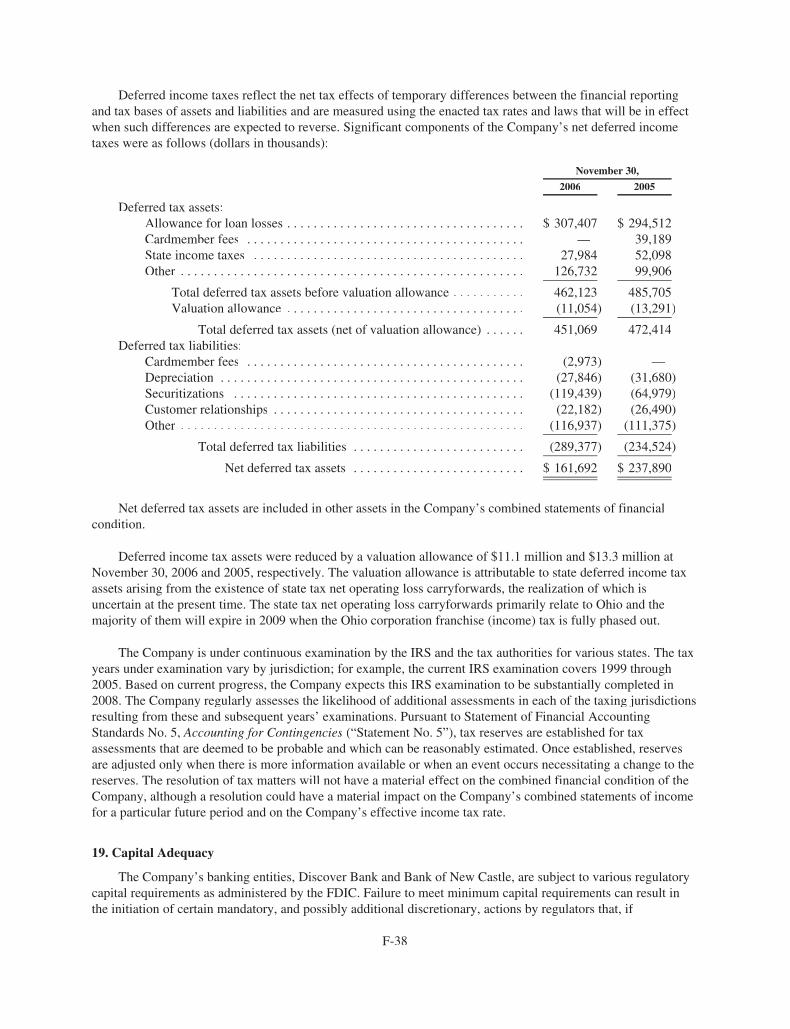
Deferred income taxes reflect the net tax effects of temporary differences between the financial reportingand tax bases of assets and liabilities and are measured using the enacted tax rates and laws that will be in effectwhen such differences are expected to reverse. Significant components of the Company’s net deferred incometaxes were as follows (dollars in thousands):
November 30,
2006 2005
Deferred tax assets:Allowance for loan losses . . . . . . . . . . . . . . . . . . . . . . . . . . . . . . . . . . . . $ 307,407 $ 294,512Cardmember fees . . . . . . . . . . . . . . . . . . . . . . . . . . . . . . . . . . . . . . . . . . — 39,189State income taxes . . . . . . . . . . . . . . . . . . . . . . . . . . . . . . . . . . . . . . . . . 27,984 52,098Other . . . . . . . . . . . . . . . . . . . . . . . . . . . . . . . . . . . . . . . . . . . . . . . . . . . . 126,732 99,906
Total deferred tax assets before valuation allowance . . . . . . . . . . . 462,123 485,705Valuation allowance . . . . . . . . . . . . . . . . . . . . . . . . . . . . . . . . . . . . (11,054) (13,291)
Total deferred tax assets (net of valuation allowance) . . . . . . 451,069 472,414Deferred tax liabilities:
Cardmember fees . . . . . . . . . . . . . . . . . . . . . . . . . . . . . . . . . . . . . . . . . . (2,973) —Depreciation . . . . . . . . . . . . . . . . . . . . . . . . . . . . . . . . . . . . . . . . . . . . . . (27,846) (31,680)Securitizations . . . . . . . . . . . . . . . . . . . . . . . . . . . . . . . . . . . . . . . . . . . . (119,439) (64,979)Customer relationships . . . . . . . . . . . . . . . . . . . . . . . . . . . . . . . . . . . . . . (22,182) (26,490)Other . . . . . . . . . . . . . . . . . . . . . . . . . . . . . . . . . . . . . . . . . . . . . . . . . . . . (116,937) (111,375)
Total deferred tax liabilities . . . . . . . . . . . . . . . . . . . . . . . . . . (289,377) (234,524)
Net deferred tax assets . . . . . . . . . . . . . . . . . . . . . . . . . . $ 161,692 $ 237,890
Net deferred tax assets are included in other assets in the Company’s combined statements of financialcondition.
Deferred income tax assets were reduced by a valuation allowance of $11.1 million and $13.3 million atNovember 30, 2006 and 2005, respectively. The valuation allowance is attributable to state deferred income taxassets arising from the existence of state tax net operating loss carryforwards, the realization of which isuncertain at the present time. The state tax net operating loss carryforwards primarily relate to Ohio and themajority of them will expire in 2009 when the Ohio corporation franchise (income) tax is fully phased out.
The Company is under continuous examination by the IRS and the tax authorities for various states. The taxyears under examination vary by jurisdiction; for example, the current IRS examination covers 1999 through2005. Based on current progress, the Company expects this IRS examination to be substantially completed in2008. The Company regularly assesses the likelihood of additional assessments in each of the taxing jurisdictionsresulting from these and subsequent years’ examinations. Pursuant to Statement of Financial AccountingStandards No. 5, Accounting for Contingencies (“Statement No. 5”), tax reserves are established for taxassessments that are deemed to be probable and which can be reasonably estimated. Once established, reservesare adjusted only when there is more information available or when an event occurs necessitating a change to thereserves. The resolution of tax matters will not have a material effect on the combined financial condition of theCompany, although a resolution could have a material impact on the Company’s combined statements of incomefor a particular future period and on the Company’s effective income tax rate.
19. Capital Adequacy
The Company’s banking entities, Discover Bank and Bank of New Castle, are subject to various regulatorycapital requirements as administered by the FDIC. Failure to meet minimum capital requirements can result inthe initiation of certain mandatory, and possibly additional discretionary, actions by regulators that, if
F-38

undertaken, could have a direct material effect on the position and results of Discover Bank and Bank of NewCastle, and ultimately those of the Company. Under capital adequacy guidelines and the regulatory frameworkfor prompt corrective action, both banks must meet specific capital guidelines that involve quantitative measuresof assets, liabilities, and certain off-balance sheet items, as calculated under regulatory accounting practices.Discover Bank and Bank of New Castle capital amounts and classification are also subject to qualitativejudgments by the regulators about components, risk weightings and other factors.
Quantitative measures established by regulation to ensure capital adequacy require Discover Bank and Bankof New Castle to maintain minimum amounts and ratios (set forth in the following table) of total and Tier Icapital (as defined in the regulations) to risk-weighted assets (as defined), and of Tier I capital (as defined) toaverage assets (as defined). Management believes that, as of November 30, 2006, both Discover Bank and Bankof New Castle met all capital adequacy requirements to which they are subject. Both banks met all capitaladequacy requirements to which they were subject at November 30, 2005.
As of November 30, 2006 and 2005, the most recent notification from the FDIC categorized both DiscoverBank and Bank of New Castle as “well-capitalized” under the regulatory framework for prompt corrective action.To be categorized as “well-capitalized,” Discover Bank and Bank of New Castle must maintain minimum totalrisk-based, Tier I risk-based, and Tier I leverage ratios as set forth in the following table. There are no conditionsor events since that notification that management believes have changed either bank’s categories.
In addition to capital adequacy requirements for Discover Bank and Bank of New Castle, actual capitalamounts and ratios are presented in the following table (dollars in thousands):
ActualFor Capital Adequacy
Purposes(1)
To Be Classified asWell-Capitalized Under PromptCorrective Action Provisions
Amount Ratio Amount Ratio Amount Ratio
November 30, 2006:Total capital (to risk-weighted assets)
Discover Bank . . . . . . . . . . . . . . $4,092,987 15.8% $2,066,732 ≥ 8.0% $2,583,416 ≥ 10.0%Bank of New Castle . . . . . . . . . . $ 14,881 96.0% $ 1,240 ≥ 8.0% $ 1,550 ≥ 10.0%
Tier I capital (to risk-weighted assets)Discover Bank . . . . . . . . . . . . . . $3,711,597 14.4% $1,033,366 ≥ 4.0% $1,550,049 ≥ 6.0%Bank of New Castle . . . . . . . . . . $ 14,881 96.0% $ 620 ≥ 4.0% $ 930 ≥ 6.0%
Tier I capital (to average assets)Discover Bank . . . . . . . . . . . . . . $3,711,597 17.2% $ 646,807 ≥ 3.0% $1,078,012 ≥ 5.0%Bank of New Castle . . . . . . . . . . $ 14,881 96.5% $ 463 ≥ 3.0% $ 771 ≥ 5.0%
November 30, 2005:Total capital (to risk-weighted assets)
Discover Bank . . . . . . . . . . . . . . $3,565,854 14.3% $1,999,618 ≥ 8.0% $2,499,523 ≥ 10.0%Bank of New Castle . . . . . . . . . . $ 14,463 106.3% $ 1,089 ≥ 8.0% $ 1,361 ≥ 10.0%
Tier I capital (to risk-weighted assets)Discover Bank . . . . . . . . . . . . . . $3,209,211 12.8% $ 999,809 ≥ 4.0% $1,499,714 ≥ 6.0%Bank of New Castle . . . . . . . . . . $ 14,463 106.3% $ 544 ≥ 4.0% $ 816 ≥ 6.0%
Tier I capital (to average assets)Discover Bank . . . . . . . . . . . . . . $3,209,211 14.3% $ 671,810 ≥ 3.0% $1,119,684 ≥ 5.0%Bank of New Castle . . . . . . . . . . $ 14,463 96.5% $ 450 ≥ 3.0% $ 749 ≥ 5.0%
(1) The minimum Tier 1 capital (to average assets) regulatory requirements can be higher, based on the Bank’s composite CAMELS ratingand growth. The components of the CAMELS rating are Capital, Asset Quality, Management, Earnings, Liquidity and Sensitivity toMarket Risk.
The amount of dividends that a bank may pay in any year is subject to certain regulatory restrictions. Underthe current banking regulations, a bank may not pay dividends if such a payment would leave the bank
F-39
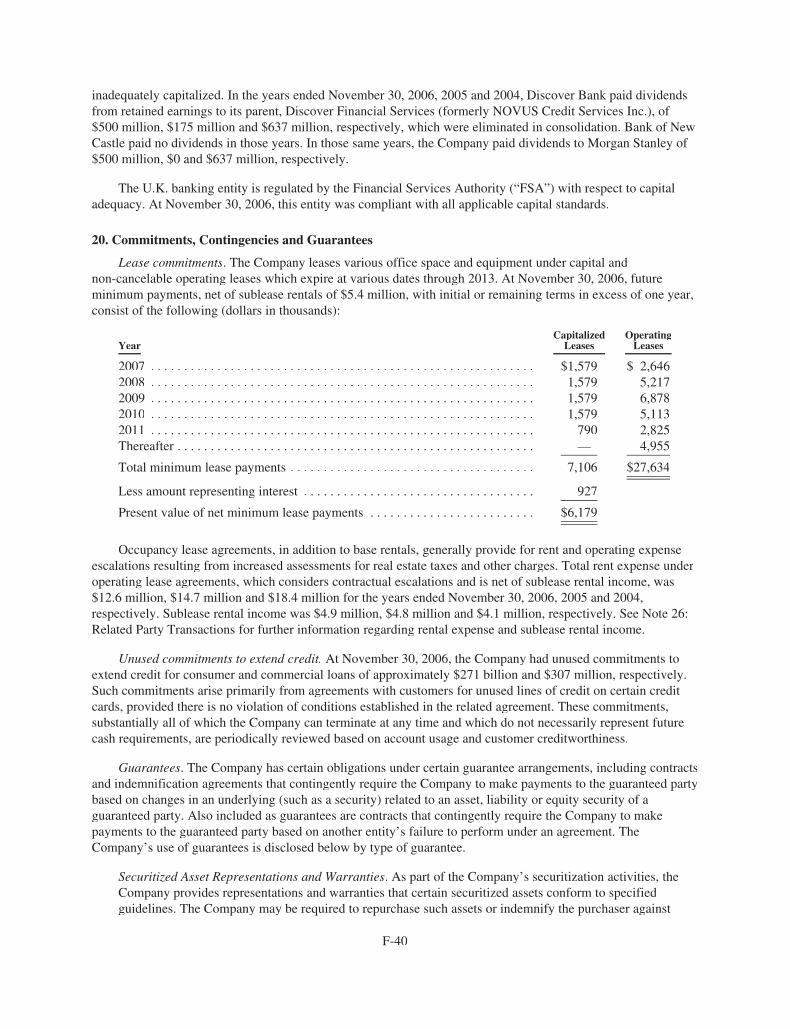
inadequately capitalized. In the years ended November 30, 2006, 2005 and 2004, Discover Bank paid dividendsfrom retained earnings to its parent, Discover Financial Services (formerly NOVUS Credit Services Inc.), of$500 million, $175 million and $637 million, respectively, which were eliminated in consolidation. Bank of NewCastle paid no dividends in those years. In those same years, the Company paid dividends to Morgan Stanley of$500 million, $0 and $637 million, respectively.
The U.K. banking entity is regulated by the Financial Services Authority (“FSA”) with respect to capitaladequacy. At November 30, 2006, this entity was compliant with all applicable capital standards.
20. Commitments, Contingencies and Guarantees
Lease commitments. The Company leases various office space and equipment under capital andnon-cancelable operating leases which expire at various dates through 2013. At November 30, 2006, futureminimum payments, net of sublease rentals of $5.4 million, with initial or remaining terms in excess of one year,consist of the following (dollars in thousands):
YearCapitalized
LeasesOperatingLeases
2007 . . . . . . . . . . . . . . . . . . . . . . . . . . . . . . . . . . . . . . . . . . . . . . . . . . . . . . . . . . $1,579 $ 2,6462008 . . . . . . . . . . . . . . . . . . . . . . . . . . . . . . . . . . . . . . . . . . . . . . . . . . . . . . . . . . 1,579 5,2172009 . . . . . . . . . . . . . . . . . . . . . . . . . . . . . . . . . . . . . . . . . . . . . . . . . . . . . . . . . . 1,579 6,8782010 . . . . . . . . . . . . . . . . . . . . . . . . . . . . . . . . . . . . . . . . . . . . . . . . . . . . . . . . . . 1,579 5,1132011 . . . . . . . . . . . . . . . . . . . . . . . . . . . . . . . . . . . . . . . . . . . . . . . . . . . . . . . . . . 790 2,825Thereafter . . . . . . . . . . . . . . . . . . . . . . . . . . . . . . . . . . . . . . . . . . . . . . . . . . . . . . — 4,955
Total minimum lease payments . . . . . . . . . . . . . . . . . . . . . . . . . . . . . . . . . . . . . 7,106 $27,634
Less amount representing interest . . . . . . . . . . . . . . . . . . . . . . . . . . . . . . . . . . . 927
Present value of net minimum lease payments . . . . . . . . . . . . . . . . . . . . . . . . . $6,179
Occupancy lease agreements, in addition to base rentals, generally provide for rent and operating expenseescalations resulting from increased assessments for real estate taxes and other charges. Total rent expense underoperating lease agreements, which considers contractual escalations and is net of sublease rental income, was$12.6 million, $14.7 million and $18.4 million for the years ended November 30, 2006, 2005 and 2004,respectively. Sublease rental income was $4.9 million, $4.8 million and $4.1 million, respectively. See Note 26:Related Party Transactions for further information regarding rental expense and sublease rental income.
Unused commitments to extend credit. At November 30, 2006, the Company had unused commitments toextend credit for consumer and commercial loans of approximately $271 billion and $307 million, respectively.Such commitments arise primarily from agreements with customers for unused lines of credit on certain creditcards, provided there is no violation of conditions established in the related agreement. These commitments,substantially all of which the Company can terminate at any time and which do not necessarily represent futurecash requirements, are periodically reviewed based on account usage and customer creditworthiness.
Guarantees. The Company has certain obligations under certain guarantee arrangements, including contractsand indemnification agreements that contingently require the Company to make payments to the guaranteed partybased on changes in an underlying (such as a security) related to an asset, liability or equity security of aguaranteed party. Also included as guarantees are contracts that contingently require the Company to makepayments to the guaranteed party based on another entity’s failure to perform under an agreement. TheCompany’s use of guarantees is disclosed below by type of guarantee.
Securitized Asset Representations and Warranties. As part of the Company’s securitization activities, theCompany provides representations and warranties that certain securitized assets conform to specifiedguidelines. The Company may be required to repurchase such assets or indemnify the purchaser against
F-40

losses if the assets do not meet certain conforming guidelines. Due diligence is performed by the Companyto ensure that asset guideline qualifications are met. The maximum potential amount of future payments theCompany could be required to make would be equal to the current outstanding balances of all assets subjectto such securitization activities. The Company has not recorded any contingent liability in the combinedfinancial statements for these representations and warranties and believes that the probability of anypayments under these arrangements is remote.
Merchant Chargeback Guarantees. The Company issues credit cards in the United States and UnitedKingdom and owns and operates the Discover Network in the United States. The Company is contingentlyliable for certain transactions processed on the Discover Network in the event of a dispute between thecardmember and a merchant. The contingent liability arises if the disputed transaction involves a merchantor merchant acquirer with whom Discover Network has a direct relationship. If a dispute is resolved in thecardmember’s favor, the Discover Network will credit or refund the disputed amount to the DiscoverNetwork card issuer, who in turn credits its cardholder’s account. Discover Network will then charge backthe transaction to the merchant or merchant acquirer. If the Discover Network is unable to collect theamount from the merchant or merchant acquirer, it will bear the loss for the amount credited or refunded tothe cardholder. In most instances, a payment requirement by the Discover Network is unlikely to arisebecause most products or services are delivered when purchased, and credits are issued by merchants onreturned items in a timely fashion. However, where the product or service is not provided until some laterdate following the purchase, the likelihood of payment by the Discover Network increases. Similarly, theCompany is also contingently liable for the resolution of cardmember disputes associated with its generalpurpose credit cards issued by its U.K. subsidiary on the MasterCard and Visa networks. The maximumpotential amount of future payments related to these contingent liabilities is estimated to be the portion ofthe total Discover Network sales transaction volume processed to date as well as the total U.K. cardmembersales transaction volume billed to date for which timely and valid disputes may be raised under applicablelaw, and relevant issuer and cardmember agreements. However, the Company believes that amount is notrepresentative of the Company’s actual potential loss exposure based on the Company’s historicalexperience. The actual amount of the potential exposure cannot be quantified as the Company cannotdetermine whether the current or cumulative transaction volumes may include or result in disputedtransactions.
The table below summarizes certain information regarding merchant chargeback guarantees:
For the Years Ended November 30,
2006 2005 2004
Losses related to merchant chargebacks (in thousands) . . . . . . . . . . . . . . . . . . . . $ 5,183 $ 5,893 $ 6,371Aggregate credit card sales volume (in millions) . . . . . . . . . . . . . . . . . . . . . . . . . $100,343 $87,165 $79,547
The amount of the liability related to the Company’s cardmember merchant guarantee was not material atNovember 30, 2006 and 2005. The Company mitigates this risk by withholding settlement from merchants orobtaining escrow deposits from certain merchant acquirers or merchants that are considered higher risk due tovarious factors such as time delays in the delivery of products or services. The table below provides informationregarding the settlement withholdings and escrow deposits (dollars in thousands):
November 30,
2006 2005
Settlement withholdings and escrow deposits . . . . . . . . . . . . . . . . . . . . . . . . . . . . . . . . $54,741 $45,804
Settlement withholdings and escrow deposits are recorded in interest bearing deposit accounts and accruedexpenses and other liabilities on the Company’s combined statement of financial condition.
21. Litigation
In the normal course of business, the Company has been named, from time to time, as a defendant in variouslegal actions, including arbitrations, class actions and other litigation, arising in connection with its activities.
F-41

Certain of the actual or threatened legal actions include claims for substantial compensatory and/or punitivedamages or claims for indeterminate amounts of damages. The Company has historically relied on the arbitrationclause in its cardmember agreements which has limited the costs and exposure to litigation. The Company is alsoinvolved, from time to time, in other reviews, investigations and proceedings (both formal and informal) bygovernmental agencies regarding the Company’s business, including, among other matters, accounting andoperational matters, certain of which may result in adverse judgments, settlements, fines, penalties, injunctions orother relief. Litigation and regulatory actions could also adversely affect the reputation of the Company.
The Company contests liability and/or the amount of damages as appropriate in each pending matter. Inview of the inherent difficulty of predicting the outcome of such matters, particularly in cases where claimantsseek substantial or indeterminate damages or where investigations and proceedings are in the early stages, theCompany often cannot reasonably estimate the loss or range of loss, if any, related to such matters, how suchmatters will be resolved, when they will ultimately be resolved, or what the eventual settlement, fine, penalty orother relief, if any, might be. Subject to the foregoing, the Company believes, based on current knowledge andafter consultation with counsel, that the outcome of the pending matters, including any judgment or settlement, inexcess of established legal reserves, will not have a material adverse effect on the combined financial conditionof the Company, although the outcome of such matters could be material to the Company’s operating results andcash flows for a particular future period, depending on, among other things, the level of the Company’s incomefor such period. For currently pending matters about which management believes it is only reasonably possiblethat a loss has been incurred, management has concluded that it cannot reasonably estimate the amount of theloss or range of loss. For matters where management has concluded that a loss is both probable and can bereasonably estimated, legal reserves have been established in accordance with Statement No. 5. Once established,reserves are adjusted when there is more information available or when an event occurs requiring a change.
22. Fair Value of Financial Instruments
In accordance with FASB Statement No. 107, Disclosures about Fair Value of Financial Instruments, theCompany is required to disclose the fair value of financial instruments for which it is practical to estimate fairvalue. To obtain fair values, observable market prices are used if available. In some instances, observable marketprices are not readily available for certain financial instrument and fair value is determined using present value orother techniques appropriate for a particular financial instrument. These techniques involve some degree ofjudgment and as a result are not necessarily indicative of the amounts the Company would realize in a currentmarket exchange. The use of different assumptions or estimation techniques may have a material effect on theestimated fair value amounts.
The following table provides the estimated fair values of financial instruments (dollars in thousands):
November 30, 2006 November 30, 2005
Carrying ValueEstimatedFair Value Carrying Value
EstimatedFair Value
Financial AssetsCash and cash equivalents . . . . . . . . . . . . . . . . . . . . $ 874,357 $ 874,357 $ 555,482 $ 555,482Interest earning deposits in other banks . . . . . . . . . . $ — $ — $ 1,688 $ 1,688Investment securities:
Available-for-sale . . . . . . . . . . . . . . . . . . . . . . . . . $ 2,314 $ 2,314 $ 2,362 $ 2,362Held-to-maturity . . . . . . . . . . . . . . . . . . . . . . . . . . $ 82,097 $ 82,241 $ 14,357 $ 14,261
Net loan receivables . . . . . . . . . . . . . . . . . . . . . . . . . $22,910,267 $22,962,899 $21,964,318 $22,029,832Amounts due from asset securitization . . . . . . . . . . $ 3,169,895 $ 3,169,895 $ 2,784,852 $ 2,784,852Derivative financial instruments . . . . . . . . . . . . . . . $ 33,339 $ 33,339 $ 7,288 $ 7,288
Financial LiabilitiesDeposits . . . . . . . . . . . . . . . . . . . . . . . . . . . . . . . . . . $13,343,859 $13,299,993 $16,065,632 $16,035,101Short-term borrowings . . . . . . . . . . . . . . . . . . . . . . . $ 6,739,678 $ 6,739,678 $ 3,773,060 $ 3,773,060Long-term borrowings . . . . . . . . . . . . . . . . . . . . . . . $ 1,507,578 $ 1,548,885 $ 863,745 $ 914,010Derivative financial instruments . . . . . . . . . . . . . . . $ 27,895 $ 27,895 $ 42,824 $ 42,824
F-42

Cash and cash equivalents. The carrying value of cash and cash equivalents approximates fair value due tomaturities of less than three months.
Interest earning deposits in other banks. The carrying values of interest earning deposits in other banksapproximate their fair values due to maturities of less than one year.
Investment securities available-for-sale. The carrying values of investment securities classified asavailable-for-sale are recorded at their fair values.
Investment securities held-to-maturity. The estimated fair values of investment securities classified asheld-to-maturity are based on quoted market prices.
Net loan receivables. The Company’s loan receivables consist of loans held for sale and the loan portfolio,which includes loans to consumers and commercial loans. The carrying value of loans held for sale, whichconsists entirely of consumer loans, approximates fair value as a result of the short-term nature of these assets.To estimate the fair value of the remaining loan receivables, loans are aggregated into pools of similar loan types,characteristics and expected repayment terms. Carrying values of loans that are tied to a market index areassumed to approximate fair values due to their automatic ability to reprice with changes in the market. The fairvalues of all other loans are estimated by discounting future cash flows using a rate at which similar loans couldbe made under current market conditions.
Amounts due from asset securitization. The carrying values of amounts due from asset securitization arerecorded at their approximate fair values.
Deposits. The carrying values of money market deposit, non-interest bearing deposits, interest bearingdemand deposits and savings accounts approximates fair value due to liquid nature of deposits. For time depositsfor which readily available market rates do not exist, fair values are estimated by discounting future cash flowsusing market rates currently offered for deposits with similar remaining maturities.
Short-term borrowings. The carrying values of short-term borrowings approximate their fair values due tothe short-term nature of these liabilities. Short-term borrowings from Morgan Stanley are payable upon demandand carry variable rates of interest. Term Federal Funds purchased have maturities of less than one year.
Long-term borrowings. The fair values of long-term borrowings from Morgan Stanley are determined bydiscounting cash flows of future interest accruals at market rates currently offered for borrowings with similarremaining maturities or repricing terms. The carrying values of bank notes approximate their fair values due tothe quarterly repricing of interest rates to current market rates.
Derivative financial instruments. The Company’s interest rate risk management program is designed toreduce the volatility of earnings resulting from changes in interest rates by having a financing portfolio thatreflects the existing repricing schedules of the managed loan receivables while also considering the Company’sright, with notice to cardmembers, to reprice certain loans to a new interest rate in the future. To the extent thatasset and related financing repricing characteristics of a particular component of the portfolio are not matchedeffectively, the Company utilizes interest rate swap agreements to achieve its objective. Interest rate swapagreements are derivative financial instruments that are entered into with institutions that are established dealersand that maintain certain minimum credit criteria established by the Company.
F-43

The Company enters interest rate swap agreements with unrelated third parties as well as with MorganStanley. The table that follows summarizes the interest rate swap agreements outstanding (dollars in thousands):
NotionalAmount
Weighted AverageYears to Maturity
Estimated FairValue
November 30, 2006Interest rate swap agreements with Morgan Stanley . . . . . . . . . . . . $3,875,470 2.4
Gross positive fair value . . . . . . . . . . . . . . . . . . . . . . . . . . . . . $ 33,339Gross negative fair value . . . . . . . . . . . . . . . . . . . . . . . . . . . . . (18,759)
Interest rate swap agreements with unrelated parties . . . . . . . . . . . 1,192,639 3.1Gross positive fair value . . . . . . . . . . . . . . . . . . . . . . . . . . . . . —Gross negative fair value . . . . . . . . . . . . . . . . . . . . . . . . . . . . . (9,136)
Total interest rate swap agreements . . . . . . . . . . . . . . . . . . . . $5,068,109 2.5 $ 5,444
November 30, 2005Interest rate swap agreements with Morgan Stanley . . . . . . . . . . . . $2,422,869 4.3
Gross positive fair value . . . . . . . . . . . . . . . . . . . . . . . . . . . . . $ 5,601Gross negative fair value . . . . . . . . . . . . . . . . . . . . . . . . . . . . . (26,757)
Interest rate swap agreements with unrelated parties . . . . . . . . . . . 1,692,369 2.9Gross positive fair value . . . . . . . . . . . . . . . . . . . . . . . . . . . . . 1,687Gross negative fair value . . . . . . . . . . . . . . . . . . . . . . . . . . . . . (16,067)
Total interest rate swap agreements . . . . . . . . . . . . . . . . . . . . $4,115,238 3.7 $(35,536)
Of the interest rate swap agreements with notional amounts outstanding of $5.1 billion at November 30,2006, $2.0 billion was entered into by the Company during 2006. Gross positive fair values of interest rate swapagreements are recorded in other assets and gross negative fair values are reported in accrued expenses and otherliabilities. For the years ended November 30, 2006, 2005 and 2004, other income included a gain of $7.1 millionand losses of $1.2 million and $0.6 million, respectively, related to the change in fair value of these contracts.Beginning November 2006, the fair value adjustment to interest bearing deposits existing prior to de-designationwas and will continue to be amortized to interest expense using the effective yield method over the remaininglives of the previously hedged interest bearing deposits. For the month of November 2006, this amortization was$0.4 million.
23. Segment Disclosures
The Company’s business activities are managed in three segments, U.S. Card, International Card, and Third-Party Payments.
• U.S. Card. The U.S. Card segment offers Discover Card-branded credit cards issued to individuals andsmall businesses over the Discover Network, which is the Company’s proprietary credit card networkin the United States. Also included within the U.S. Card segment are the Company’s other consumerproducts and services businesses, including prepaid and other consumer lending and deposit productsoffered through the Company’s subsidiary, Discover Bank.
• International Card. The International Card segment offers consumer finance products and services inthe United Kingdom, including Morgan Stanley-branded, Goldfish-branded and various affinity-branded credit cards issued on the MasterCard and Visa networks.
• Third-Party Payments. Third-Party Payments includes PULSE and the third-party payments business.
The business segment reporting provided to and used by the Company’s chief operating decision maker isprepared using the following principles and allocation conventions:
• Segment information is presented on a managed basis because management considers the performanceof the entire managed loan portfolio in managing the business.
F-44

• Other accounting policies applied to the operating segments are consistent with the accounting policiesdescribed in Note 3: Summary of Significant Accounting Policies.
• Corporate overhead is not allocated between segments; all corporate overhead is included in the U.S.Card segment.
• Discover Network fixed marketing, servicing and infrastructure costs are retained in the U.S. Cardsegment.
• Other than the domestic and international managed receivables portfolios, which relate to the U.S. Cardand International Card segments, respectively, the assets of the Company are not allocated among theoperating segments in the information reviewed by the Company’s chief operating decision maker.
• Income taxes are not specifically allocated among the operating segments in the information reviewedby the Company’s chief operating decision maker.
Because the Company’s chief operating decision maker evaluates performance in the lending businessesusing data on a managed portfolio basis for each segment, segment information is provided here on a managedbasis.
F-45

The following table presents segment data on a managed basis (dollars in thousands):
Managed basis GAAP basis
U.S.Card
InternationalCard
Third-Party
Payments TotalSecuritizationAdjustment(1) Total
Year Ended November 30, 2006
Interest income . . . . . . . . . . . . . $5,748,698 $416,986 $ 1,801 $6,167,485 $(3,708,959) $2,458,526Interest expense . . . . . . . . . . . . . 2,160,569 176,997 23 2,337,589 (1,397,549) 940,040
Net interest income . . . . . . . . 3,588,129 239,989 1,778 3,829,896 (2,311,410) 1,518,486Provision for loan losses . . . . . . 1,663,472 238,172 — 1,901,644 (1,146,007) 755,637Other income . . . . . . . . . . . . . . . 2,097,676 165,160 110,700 2,373,536 1,165,403 3,538,939Other expense . . . . . . . . . . . . . . 2,381,880 254,074 83,529 2,719,483 — 2,719,483
Income (loss) beforeincome tax expense . . . . $1,640,453 $ (87,097) $ 28,949 $1,582,305 $ — $1,582,305
Year Ended November 30, 2005
Interest income . . . . . . . . . . . . . $5,409,381 $294,343 $ 673 $5,704,397 $(3,529,586) $2,174,811Interest expense . . . . . . . . . . . . . 1,671,331 129,671 95 1,801,097 (1,024,618) 776,479
Net interest income . . . . . . . . 3,738,050 164,672 578 3,903,300 (2,504,968) 1,398,332Provision for loan losses . . . . . . 2,263,617 126,462 — 2,390,079 (1,511,593) 878,486Other income . . . . . . . . . . . . . . . 1,753,828 97,691 92,143 1,943,662 993,375 2,937,037Other expense . . . . . . . . . . . . . . 2,272,126 167,635 92,866 2,532,627 — 2,532,627
Income (loss) beforeincome tax expense . . . . $ 956,135 $ (31,734) $ (145) $ 924,256 $ — $ 924,256
Year Ended November 30, 2004(2)
Interest income . . . . . . . . . . . . . $5,441,349 $259,746 $ — $5,701,095 $(3,841,591) $1,859,504Interest expense . . . . . . . . . . . . . 1,234,400 104,766 — 1,339,166 (691,544) 647,622
Net interest income . . . . . . . . 4,206,949 154,980 — 4,361,929 (3,150,047) 1,211,882Provision for loan losses . . . . . . 2,713,115 83,107 — 2,796,222 (1,870,673) 925,549Other income . . . . . . . . . . . . . . . 1,878,558 90,454 — 1,969,012 1,279,374 3,248,386Other expense . . . . . . . . . . . . . . 2,163,246 152,566 — 2,315,812 — 2,315,812
Income before income taxexpense . . . . . . . . . . . . . $1,209,146 $ 9,761 $ — $1,218,907 $ — $1,218,907
(1) The Securitization Adjustment column presents the effect of loan securitization by recharacterizing as securitization income the portionsof the following items that relate to the securitized loans: interest income, interest expense, provision for loan losses, discount andinterchange revenue and loan fee revenues. Securitization income is reported in other income.
(2) For the year ended November 30, 2004, Third-Party Payments financial information was insignificant for the third-party paymentsbusiness and did not include PULSE, which was acquired in 2005.
F-46

24. International Activities
The Company’s international activities consist entirely of consumer lending, originating from the UnitedKingdom. Selected financial data regarding the U.K. operations is provided in the table below (dollars inthousands):
For the Years Ended November 30,
2006 2005 2004
Total assets . . . . . . . . . . . . . . . . . . . . . . . . . . . . . . . . . . . . . . . . . . . . . . . . $3,467,691 $2,260,998 $1,362,048Total income(1) . . . . . . . . . . . . . . . . . . . . . . . . . . . . . . . . . . . . . . . . . . . . . . $ 419,610 $ 256,457 $ 251,907(Loss) income before income tax . . . . . . . . . . . . . . . . . . . . . . . . . . . . . . . $ (87,097) $ (31,734) $ 9,761Net (loss) income . . . . . . . . . . . . . . . . . . . . . . . . . . . . . . . . . . . . . . . . . . . $ (56,613) $ (21,641) $ 4,426
(1) Total income is the sum of interest income and other income.
Certain estimates and assumptions with regard to funding costs and capital have been assigned to the U.K.operations. Economic capital is computed based on an internal allocation methodology and is the primary factorin the determination of funding requirements. During the years ended November 30, 2006, 2005 and 2004, costsassociated with U.K. funding levels were allocated at amounts approximating the costs incurred by MorganStanley during those periods to obtain the funding. The provision for loan losses is allocated based on specificloss experience and risk characteristics of international loan receivables. See Note 7: Loan Receivables forfurther information on international loan receivables.
25. Geographical Distribution of Loans
The Company originates credit card and other consumer loans primarily throughout the United States and toa lesser degree in the United Kingdom. The loan receivables are predominantly credit card loans. The geographicdistribution of the Company’s loan receivables was as follows (dollars in thousands):
November 30, 2006 November 30, 2005
LoanReceivables
Percentageof Total
LoanReceivables
Percentageof Total
Domestic:California . . . . . . . . . . . . . . . . . . . . . . . . . . . . . . . . . . . $ 2,027,783 8.6% $ 1,969,981 8.7%Texas . . . . . . . . . . . . . . . . . . . . . . . . . . . . . . . . . . . . . . . 1,685,358 7.1 1,746,375 7.7New York . . . . . . . . . . . . . . . . . . . . . . . . . . . . . . . . . . . 1,405,879 5.9 1,412,667 6.2Florida . . . . . . . . . . . . . . . . . . . . . . . . . . . . . . . . . . . . . . 1,216,199 5.1 1,204,987 5.3Illinois . . . . . . . . . . . . . . . . . . . . . . . . . . . . . . . . . . . . . . 1,125,900 4.8 1,112,715 4.9Pennsylvania . . . . . . . . . . . . . . . . . . . . . . . . . . . . . . . . . 981,693 4.1 967,440 4.2Ohio . . . . . . . . . . . . . . . . . . . . . . . . . . . . . . . . . . . . . . . . 918,009 3.9 900,361 3.9Michigan . . . . . . . . . . . . . . . . . . . . . . . . . . . . . . . . . . . . 787,767 3.3 775,056 3.4New Jersey . . . . . . . . . . . . . . . . . . . . . . . . . . . . . . . . . . 745,763 3.1 730,319 3.2Other States . . . . . . . . . . . . . . . . . . . . . . . . . . . . . . . . . . 9,895,893 41.7 9,791,405 42.9
Domestic . . . . . . . . . . . . . . . . . . . . . . . . . . . . . . . . 20,790,244 87.6% 20,611,306 90.4%International:
United Kingdom . . . . . . . . . . . . . . . . . . . . . . . . . . . . . . 2,952,506 12.4 2,191,860 9.6
Loan receivables . . . . . . . . . . . . . . . . . . . . . . . . $23,742,750 100.0% $22,803,166 100.0%
26. Related Party Transactions
Morgan Stanley provides a variety of products and services to the Company or on the Company’s behalf andthe Company provides certain products and services to Morgan Stanley.
F-47

In 2006 and 2005, the Company provided corporate card services to Morgan Stanley. The outstandingrelated balances of which are included in credit card loan receivables were $14.4 million and $10.6 million atNovember 30, 2006 and 2005, respectively.
In the ordinary course of business, the Company offers consumer loan products to its directors, executiveofficers and certain members of their immediate families. These products are offered on substantially the sameterms as those prevailing at the time for comparable transactions with unrelated parties, and these receivables areincluded in the loan receivables in the Company’s combined statements of financial condition. They were notmaterial to the Company’s financial position or results of operations.
In 2006, the Company began purchasing both overnight and term Federal Funds from Morgan Stanley Bank.Interest expense on overnight and term Federal Funds purchased from Morgan Stanley Bank was $14.2 millionand $8.6 million, respectively, for 2006. At November 30, 2006, the balance payable to Morgan Stanley Bankwas $3.0 billion. There were no Federal Funds purchased from Morgan Stanley Bank in 2005.
In 2006, the Company began participating in the Morgan Stanley Global Wealth Management Bank DepositProgram launched by Morgan Stanley DW Inc. (“MSDW”). Under the program, MSDW sweeps excess clientcash into interest bearing deposit accounts at FDIC-insured banks participating in the program. The Companypaid servicing and administrative fees to MSDW in 2006 of $11.0 million. At November 30, 2006, theoutstanding interest bearing deposit balance related to the Morgan Stanley Global Wealth Management BankDeposit Program was $1.9 billion.
The Company paid brokerage commissions to Morgan Stanley for the sale of certificates of deposit. Thesecommissions totaled $5.6 million, $47.0 million and $6.1 million for the years ended November 30, 2006, 2005and 2004, respectively, and are amortized to interest expense over the lives of the related certificates of deposit.For the years ended November 30, 2006 and 2005, unamortized prepaid commissions on these certificates ofdeposit were $29.2 million and $51.3 million, respectively, and are included in other assets in the combinedstatement of condition. Amortization of the prepaid commissions was $27.6 million, $32.2 million and$26.0 million for the years ended November 30, 2006, 2005 and 2004, respectively.
In 2006 and 2005, the Company had short-term and long-term debt obligations to Morgan Stanley asoutlined in Note 13: Short-term Borrowings and Note 14: Long-term Borrowings.
The Company paid $0.6 million in brokerage commissions to Morgan Stanley for the sale of bank notes in2004. These commissions are amortized to interest expense over the life of the note. Prepaid commissions totaled$269 thousand and $391 thousand at November 30, 2006 and 2005, respectively, and are included in other assetsin the combined statements of financial condition.
In 2006, 2005 and 2004, the Company paid underwriting fees on credit card securitizations to MorganStanley of $11.3 million, $8.4 million and $5.0 million, respectively. Amortization of such underwriting fees was$9.0 million, $8.9 million and $9.5 million, respectively. Deferred underwriting fees associated with theseexpenses were $19.6 million and $17.3 million, at November 30, 2006 and 2005, respectively, and are includedin other assets in the combined statements of financial condition.
At November 30, 2006 and 2005, the Company recorded $171.6 million and $58.8 million, respectively, inaccrued expenses and other liabilities for non-interest bearing amounts payable to Morgan Stanley for expensespaid by Morgan Stanley on behalf of the Company including, but not limited to 401(k) matching, amortization ofcompensation cost related to restricted stock grants, tax benefits for exercised stock options and fees formanagement of the Morgan Stanley Global Wealth Management Bank Deposit Program.
The Company has outstanding certain interest rate swap contracts with Morgan Stanley CapitalServices Inc., a wholly-owned direct subsidiary of Morgan Stanley, which serves as Morgan Stanley’s principalU.S. swaps dealer. The Company entered into each contract in the ordinary course of business, to hedge interest
F-48
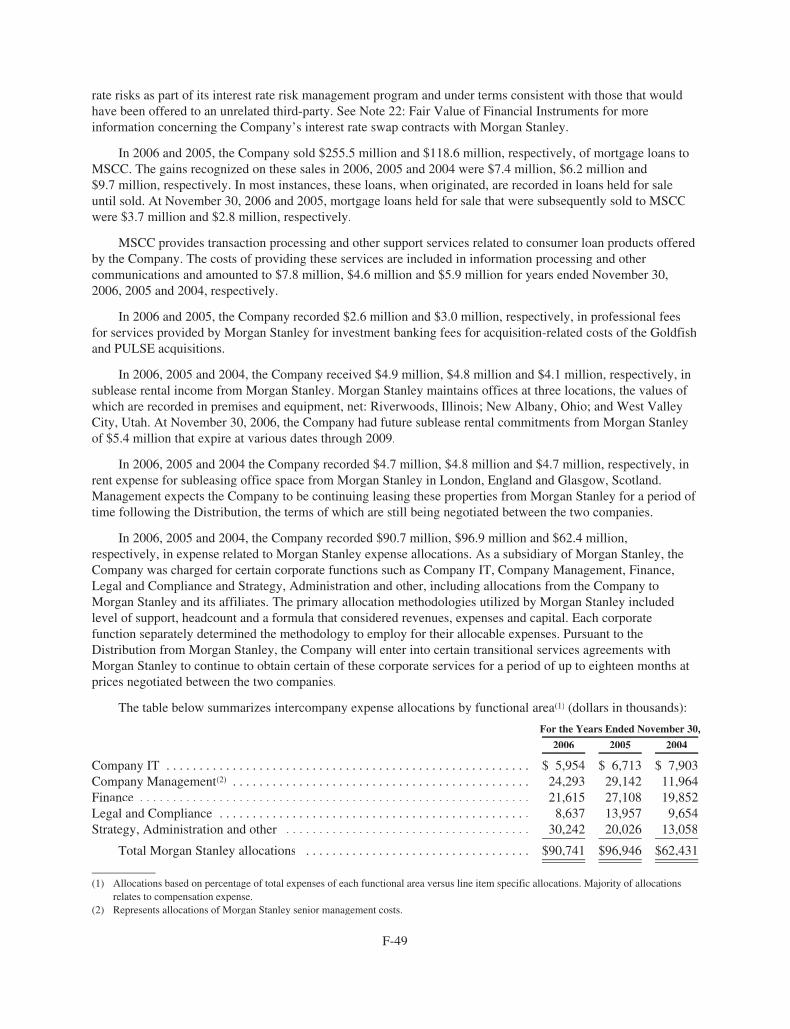
rate risks as part of its interest rate risk management program and under terms consistent with those that wouldhave been offered to an unrelated third-party. See Note 22: Fair Value of Financial Instruments for moreinformation concerning the Company’s interest rate swap contracts with Morgan Stanley.
In 2006 and 2005, the Company sold $255.5 million and $118.6 million, respectively, of mortgage loans toMSCC. The gains recognized on these sales in 2006, 2005 and 2004 were $7.4 million, $6.2 million and$9.7 million, respectively. In most instances, these loans, when originated, are recorded in loans held for saleuntil sold. At November 30, 2006 and 2005, mortgage loans held for sale that were subsequently sold to MSCCwere $3.7 million and $2.8 million, respectively.
MSCC provides transaction processing and other support services related to consumer loan products offeredby the Company. The costs of providing these services are included in information processing and othercommunications and amounted to $7.8 million, $4.6 million and $5.9 million for years ended November 30,2006, 2005 and 2004, respectively.
In 2006 and 2005, the Company recorded $2.6 million and $3.0 million, respectively, in professional feesfor services provided by Morgan Stanley for investment banking fees for acquisition-related costs of the Goldfishand PULSE acquisitions.
In 2006, 2005 and 2004, the Company received $4.9 million, $4.8 million and $4.1 million, respectively, insublease rental income from Morgan Stanley. Morgan Stanley maintains offices at three locations, the values ofwhich are recorded in premises and equipment, net: Riverwoods, Illinois; New Albany, Ohio; and West ValleyCity, Utah. At November 30, 2006, the Company had future sublease rental commitments from Morgan Stanleyof $5.4 million that expire at various dates through 2009.
In 2006, 2005 and 2004 the Company recorded $4.7 million, $4.8 million and $4.7 million, respectively, inrent expense for subleasing office space from Morgan Stanley in London, England and Glasgow, Scotland.Management expects the Company to be continuing leasing these properties from Morgan Stanley for a period oftime following the Distribution, the terms of which are still being negotiated between the two companies.
In 2006, 2005 and 2004, the Company recorded $90.7 million, $96.9 million and $62.4 million,respectively, in expense related to Morgan Stanley expense allocations. As a subsidiary of Morgan Stanley, theCompany was charged for certain corporate functions such as Company IT, Company Management, Finance,Legal and Compliance and Strategy, Administration and other, including allocations from the Company toMorgan Stanley and its affiliates. The primary allocation methodologies utilized by Morgan Stanley includedlevel of support, headcount and a formula that considered revenues, expenses and capital. Each corporatefunction separately determined the methodology to employ for their allocable expenses. Pursuant to theDistribution from Morgan Stanley, the Company will enter into certain transitional services agreements withMorgan Stanley to continue to obtain certain of these corporate services for a period of up to eighteen months atprices negotiated between the two companies.
The table below summarizes intercompany expense allocations by functional area(1) (dollars in thousands):
For the Years Ended November 30,
2006 2005 2004
Company IT . . . . . . . . . . . . . . . . . . . . . . . . . . . . . . . . . . . . . . . . . . . . . . . . . . . . . . . $ 5,954 $ 6,713 $ 7,903Company Management(2) . . . . . . . . . . . . . . . . . . . . . . . . . . . . . . . . . . . . . . . . . . . . . 24,293 29,142 11,964Finance . . . . . . . . . . . . . . . . . . . . . . . . . . . . . . . . . . . . . . . . . . . . . . . . . . . . . . . . . . . 21,615 27,108 19,852Legal and Compliance . . . . . . . . . . . . . . . . . . . . . . . . . . . . . . . . . . . . . . . . . . . . . . . 8,637 13,957 9,654Strategy, Administration and other . . . . . . . . . . . . . . . . . . . . . . . . . . . . . . . . . . . . . 30,242 20,026 13,058
Total Morgan Stanley allocations . . . . . . . . . . . . . . . . . . . . . . . . . . . . . . . . . . $90,741 $96,946 $62,431
(1) Allocations based on percentage of total expenses of each functional area versus line item specific allocations. Majority of allocationsrelates to compensation expense.
(2) Represents allocations of Morgan Stanley senior management costs.
F-49

During the second quarter of 2007, the Company reclassified the intercompany expense allocations,previously all of which were a component of “other” within other expense, to the following line items (dollars inthousands):
For the Years Ended November 30,
2006 2005 2004
Employee compensation and benefits . . . . . . . . . . . . . . . . . . . . . . . . . . . . . . . $54,445 $58,168 $38,707Marketing and business development . . . . . . . . . . . . . . . . . . . . . . . . . . . . . . . 2,722 2,908 1,873Information processing and communications . . . . . . . . . . . . . . . . . . . . . . . . . 4,537 4,847 4,370Professional fees . . . . . . . . . . . . . . . . . . . . . . . . . . . . . . . . . . . . . . . . . . . . . . . 13,611 14,542 7,492Premises and equipment . . . . . . . . . . . . . . . . . . . . . . . . . . . . . . . . . . . . . . . . . 9,982 10,664 7,492Other . . . . . . . . . . . . . . . . . . . . . . . . . . . . . . . . . . . . . . . . . . . . . . . . . . . . . . . . 5,444 5,817 2,497
Total Morgan Stanley allocations . . . . . . . . . . . . . . . . . . . . . . . . . . . . . . $90,741 $96,946 $62,431
As a result, the accompanying combined statements of income for the years ended November 30, 2006,2005, and 2004 have been reclassified from amounts previously reported to reflect the above reclassification.
At November 30, 2006, accrued expenses and other liabilities included federal and state income taxes duefrom Morgan Stanley of $19.8 million. As of November 30, 2005, accrued expenses and other liabilities includedfederal and state income taxes due to Morgan Stanley of $164.4 million. At November 30, 2006 and 2005, otherassets included $2.4 million and $12.5 million of interest due from Morgan Stanley related to the settlement ofvarious tax matters.
The Company paid dividends to Morgan Stanley during the years ended November 30, 2006, 2005 and2004. See Note 19: Capital Adequacy for further information on dividends paid. In addition, the Company alsopaid a $500 million dividend to Morgan Stanley on February 27, 2007.
The Company receives an allocation of capital from Morgan Stanley to maintain a level of capital thatmanagement believes is appropriate to support its U.K. business. For the year ended November 30, 2006 and2005, capital allocated to the Company from Morgan Stanley was $512.9 million and $42.1 million, respectively.These amounts are reflected as contributions from Morgan Stanley in the combined statements of cash flows.
At November 30, 2006, there were several contracts outstanding with third parties in which Morgan Stanleyguaranteed the performance of certain subsidiaries of the Company to specific counterparties. Each of thesecontracts involved payment by Morgan Stanley to the counterparty in the event of default by the Company’ssubsidiaries. All of these arrangements with counterparties are expected to be terminated or replaced prior to theDistribution.
27. Parent Company Condensed Financial Information
The following Parent Company financial statements are provided in accordance with Regulation S-X of theSecurities and Exchange Commission which requires all issuers or guarantors of registered securities to includeseparate annual financial statements.
F-50
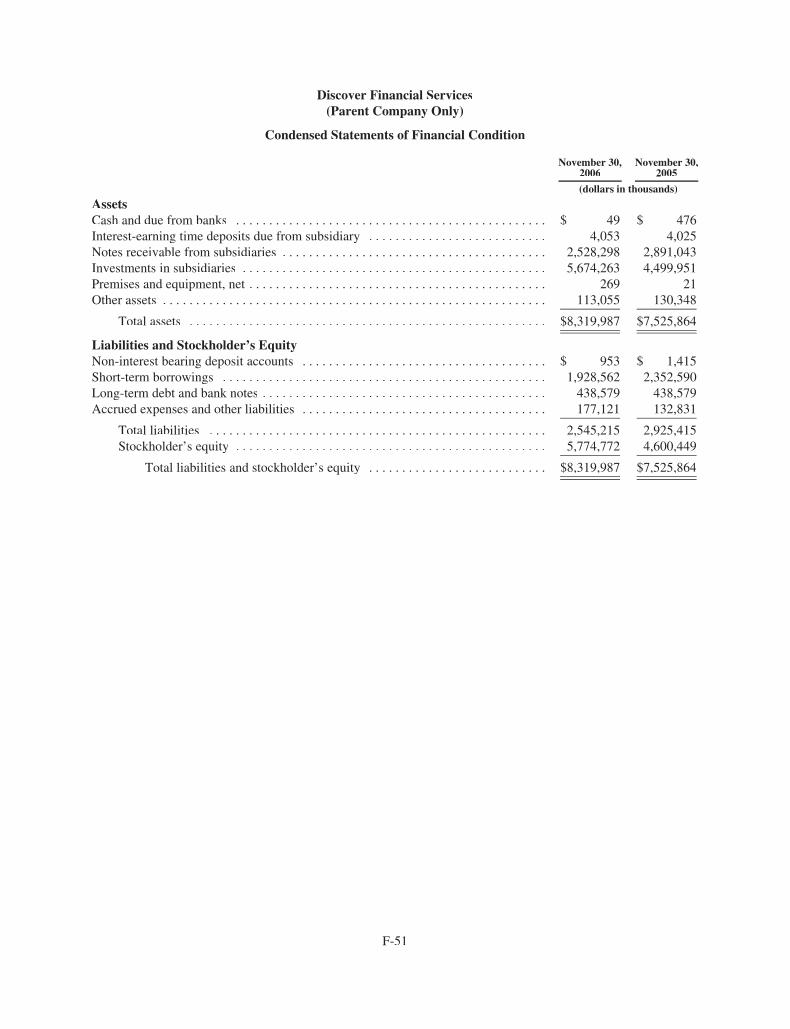
Discover Financial Services(Parent Company Only)
Condensed Statements of Financial Condition
November 30,2006
November 30,2005
(dollars in thousands)
AssetsCash and due from banks . . . . . . . . . . . . . . . . . . . . . . . . . . . . . . . . . . . . . . . . . . . . . . . $ 49 $ 476Interest-earning time deposits due from subsidiary . . . . . . . . . . . . . . . . . . . . . . . . . . . 4,053 4,025Notes receivable from subsidiaries . . . . . . . . . . . . . . . . . . . . . . . . . . . . . . . . . . . . . . . . 2,528,298 2,891,043Investments in subsidiaries . . . . . . . . . . . . . . . . . . . . . . . . . . . . . . . . . . . . . . . . . . . . . . 5,674,263 4,499,951Premises and equipment, net . . . . . . . . . . . . . . . . . . . . . . . . . . . . . . . . . . . . . . . . . . . . . 269 21Other assets . . . . . . . . . . . . . . . . . . . . . . . . . . . . . . . . . . . . . . . . . . . . . . . . . . . . . . . . . . 113,055 130,348
Total assets . . . . . . . . . . . . . . . . . . . . . . . . . . . . . . . . . . . . . . . . . . . . . . . . . . . . . . $8,319,987 $7,525,864
Liabilities and Stockholder’s EquityNon-interest bearing deposit accounts . . . . . . . . . . . . . . . . . . . . . . . . . . . . . . . . . . . . . $ 953 $ 1,415Short-term borrowings . . . . . . . . . . . . . . . . . . . . . . . . . . . . . . . . . . . . . . . . . . . . . . . . . 1,928,562 2,352,590Long-term debt and bank notes . . . . . . . . . . . . . . . . . . . . . . . . . . . . . . . . . . . . . . . . . . . 438,579 438,579Accrued expenses and other liabilities . . . . . . . . . . . . . . . . . . . . . . . . . . . . . . . . . . . . . 177,121 132,831
Total liabilities . . . . . . . . . . . . . . . . . . . . . . . . . . . . . . . . . . . . . . . . . . . . . . . . . . . 2,545,215 2,925,415Stockholder’s equity . . . . . . . . . . . . . . . . . . . . . . . . . . . . . . . . . . . . . . . . . . . . . . . 5,774,772 4,600,449
Total liabilities and stockholder’s equity . . . . . . . . . . . . . . . . . . . . . . . . . . . $8,319,987 $7,525,864
F-51
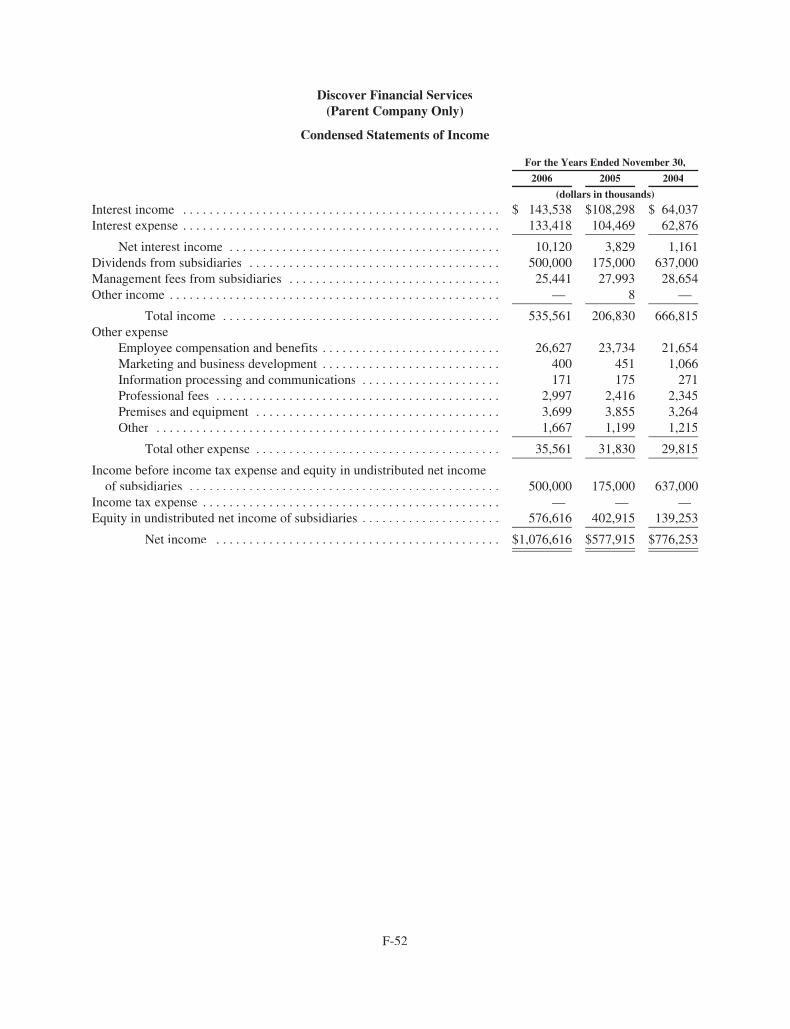
Discover Financial Services(Parent Company Only)
Condensed Statements of Income
For the Years Ended November 30,
2006 2005 2004
(dollars in thousands)
Interest income . . . . . . . . . . . . . . . . . . . . . . . . . . . . . . . . . . . . . . . . . . . . . . . . $ 143,538 $108,298 $ 64,037Interest expense . . . . . . . . . . . . . . . . . . . . . . . . . . . . . . . . . . . . . . . . . . . . . . . . 133,418 104,469 62,876
Net interest income . . . . . . . . . . . . . . . . . . . . . . . . . . . . . . . . . . . . . . . . . 10,120 3,829 1,161Dividends from subsidiaries . . . . . . . . . . . . . . . . . . . . . . . . . . . . . . . . . . . . . . 500,000 175,000 637,000Management fees from subsidiaries . . . . . . . . . . . . . . . . . . . . . . . . . . . . . . . . 25,441 27,993 28,654Other income . . . . . . . . . . . . . . . . . . . . . . . . . . . . . . . . . . . . . . . . . . . . . . . . . . — 8 —
Total income . . . . . . . . . . . . . . . . . . . . . . . . . . . . . . . . . . . . . . . . . . 535,561 206,830 666,815Other expense
Employee compensation and benefits . . . . . . . . . . . . . . . . . . . . . . . . . . . 26,627 23,734 21,654Marketing and business development . . . . . . . . . . . . . . . . . . . . . . . . . . . 400 451 1,066Information processing and communications . . . . . . . . . . . . . . . . . . . . . 171 175 271Professional fees . . . . . . . . . . . . . . . . . . . . . . . . . . . . . . . . . . . . . . . . . . . 2,997 2,416 2,345Premises and equipment . . . . . . . . . . . . . . . . . . . . . . . . . . . . . . . . . . . . . 3,699 3,855 3,264Other . . . . . . . . . . . . . . . . . . . . . . . . . . . . . . . . . . . . . . . . . . . . . . . . . . . . 1,667 1,199 1,215
Total other expense . . . . . . . . . . . . . . . . . . . . . . . . . . . . . . . . . . . . . 35,561 31,830 29,815
Income before income tax expense and equity in undistributed net incomeof subsidiaries . . . . . . . . . . . . . . . . . . . . . . . . . . . . . . . . . . . . . . . . . . . . . . . 500,000 175,000 637,000
Income tax expense . . . . . . . . . . . . . . . . . . . . . . . . . . . . . . . . . . . . . . . . . . . . . — — —Equity in undistributed net income of subsidiaries . . . . . . . . . . . . . . . . . . . . . 576,616 402,915 139,253
Net income . . . . . . . . . . . . . . . . . . . . . . . . . . . . . . . . . . . . . . . . . . . $1,076,616 $577,915 $776,253
F-52
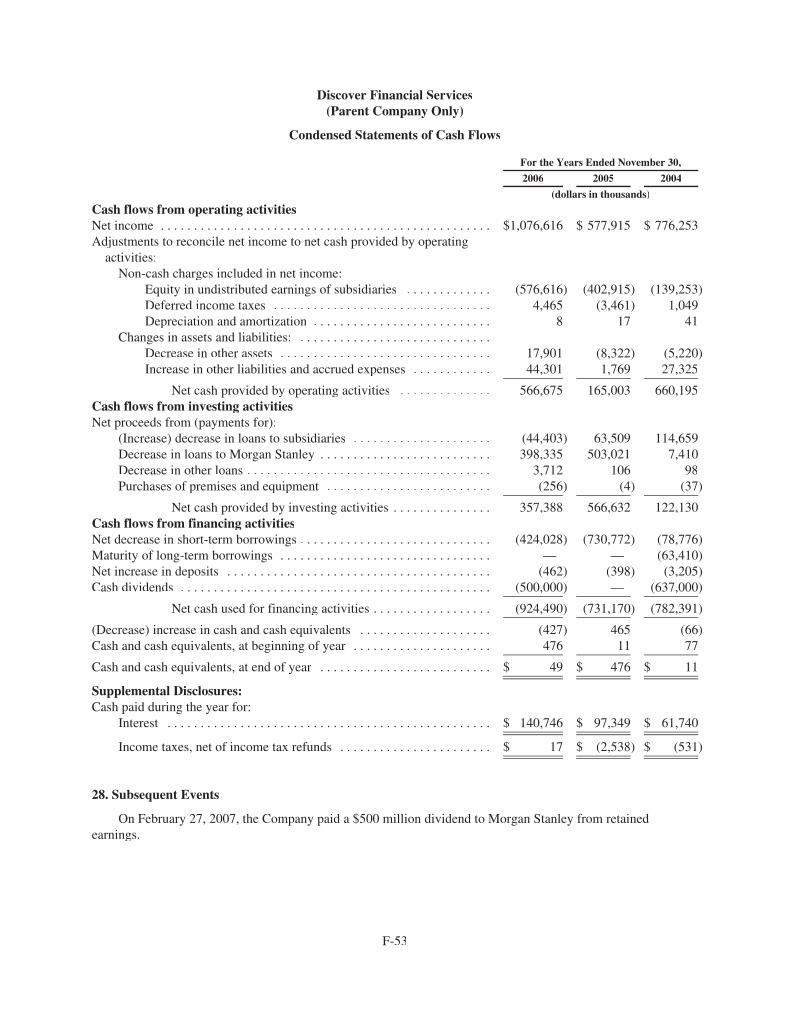
Discover Financial Services(Parent Company Only)
Condensed Statements of Cash Flows
For the Years Ended November 30,
2006 2005 2004
(dollars in thousands)
Cash flows from operating activitiesNet income . . . . . . . . . . . . . . . . . . . . . . . . . . . . . . . . . . . . . . . . . . . . . . . . . . $1,076,616 $ 577,915 $ 776,253Adjustments to reconcile net income to net cash provided by operating
activities:Non-cash charges included in net income:
Equity in undistributed earnings of subsidiaries . . . . . . . . . . . . . (576,616) (402,915) (139,253)Deferred income taxes . . . . . . . . . . . . . . . . . . . . . . . . . . . . . . . . . 4,465 (3,461) 1,049Depreciation and amortization . . . . . . . . . . . . . . . . . . . . . . . . . . . 8 17 41
Changes in assets and liabilities: . . . . . . . . . . . . . . . . . . . . . . . . . . . . .Decrease in other assets . . . . . . . . . . . . . . . . . . . . . . . . . . . . . . . . 17,901 (8,322) (5,220)Increase in other liabilities and accrued expenses . . . . . . . . . . . . 44,301 1,769 27,325
Net cash provided by operating activities . . . . . . . . . . . . . . 566,675 165,003 660,195Cash flows from investing activitiesNet proceeds from (payments for):
(Increase) decrease in loans to subsidiaries . . . . . . . . . . . . . . . . . . . . . (44,403) 63,509 114,659Decrease in loans to Morgan Stanley . . . . . . . . . . . . . . . . . . . . . . . . . . 398,335 503,021 7,410Decrease in other loans . . . . . . . . . . . . . . . . . . . . . . . . . . . . . . . . . . . . . 3,712 106 98Purchases of premises and equipment . . . . . . . . . . . . . . . . . . . . . . . . . (256) (4) (37)
Net cash provided by investing activities . . . . . . . . . . . . . . . 357,388 566,632 122,130Cash flows from financing activitiesNet decrease in short-term borrowings . . . . . . . . . . . . . . . . . . . . . . . . . . . . . (424,028) (730,772) (78,776)Maturity of long-term borrowings . . . . . . . . . . . . . . . . . . . . . . . . . . . . . . . . — — (63,410)Net increase in deposits . . . . . . . . . . . . . . . . . . . . . . . . . . . . . . . . . . . . . . . . (462) (398) (3,205)Cash dividends . . . . . . . . . . . . . . . . . . . . . . . . . . . . . . . . . . . . . . . . . . . . . . . (500,000) — (637,000)
Net cash used for financing activities . . . . . . . . . . . . . . . . . . (924,490) (731,170) (782,391)
(Decrease) increase in cash and cash equivalents . . . . . . . . . . . . . . . . . . . . (427) 465 (66)Cash and cash equivalents, at beginning of year . . . . . . . . . . . . . . . . . . . . . 476 11 77
Cash and cash equivalents, at end of year . . . . . . . . . . . . . . . . . . . . . . . . . . $ 49 $ 476 $ 11
Supplemental Disclosures:Cash paid during the year for:
Interest . . . . . . . . . . . . . . . . . . . . . . . . . . . . . . . . . . . . . . . . . . . . . . . . . $ 140,746 $ 97,349 $ 61,740
Income taxes, net of income tax refunds . . . . . . . . . . . . . . . . . . . . . . . $ 17 $ (2,538) $ (531)
28. Subsequent Events
On February 27, 2007, the Company paid a $500 million dividend to Morgan Stanley from retainedearnings.
F-53

29. Quarterly Results (unaudited) (dollars in thousands):
For the Year Ended November 30, 2006 For the Year Ended November 30, 2005
1stQuarter
2ndQuarter
3rdQuarter
4thQuarter
1stQuarter
2ndQuarter
3rdQuarter
4thQuarter
Interest income . . . . . . . . $586,431 $607,181 $642,748 $622,166 $458,010 $535,854 $593,477 $587,470Interest expense . . . . . . . 228,746 217,336 250,440 243,518 168,003 180,578 210,838 217,060
Net interestincome . . . . . . . . 357,685 389,845 392,308 378,648 290,007 355,276 382,639 370,410
Provision for loanlosses . . . . . . . . . . . . . . 154,828 129,502 231,614 239,693 135,413 208,226 224,334 310,513
Other income . . . . . . . . . 889,275 932,027 889,374 828,263 804,325 741,922 755,481 635,309Other expense . . . . . . . . . 607,235 648,034 682,537 781,677 610,164 619,521 674,828 628,114
Income beforeincome taxexpense . . . . . . . . 484,897 544,336 367,531 185,541 348,755 269,451 238,958 67,092
Net income . . . . . . . $305,423 $343,278 $241,393 $186,522 $214,560 $171,062 $149,866 $ 42,427
F-54

Discover Financial Services
Unaudited Interim Condensed Combined Financial StatementsAs of February 28, 2007 and the Quarters Ended February 28, 2007 and 2006
F-55
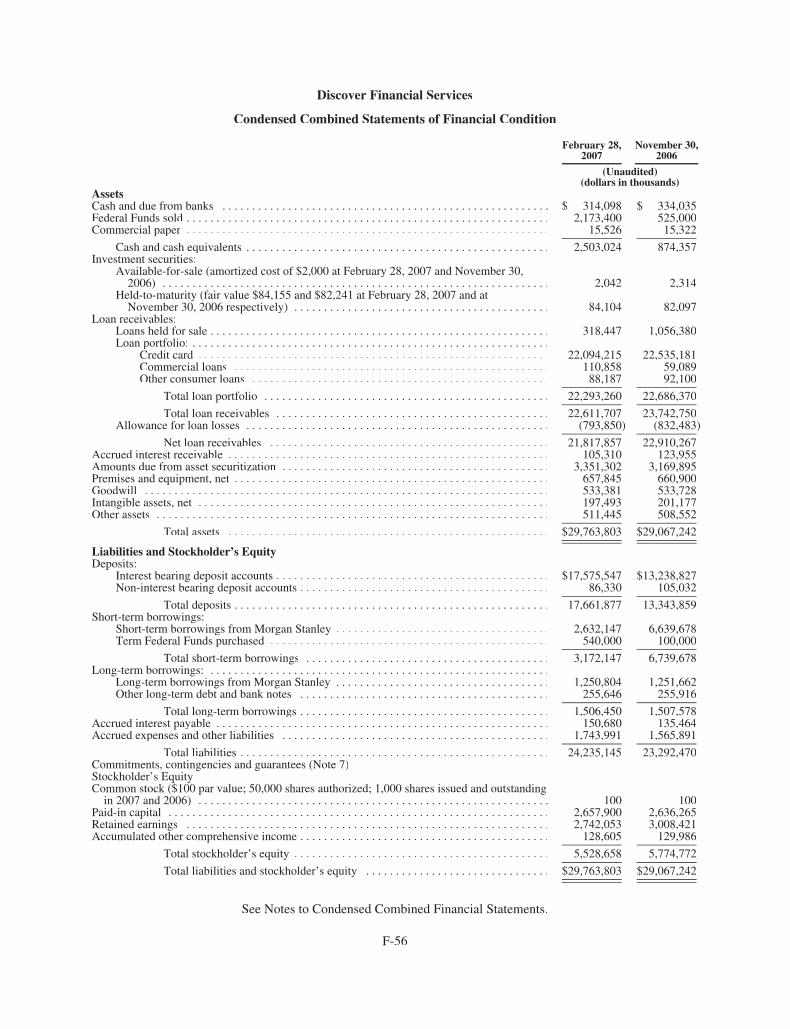
Discover Financial Services
Condensed Combined Statements of Financial Condition
February 28,2007
November 30,2006
(Unaudited)(dollars in thousands)
AssetsCash and due from banks . . . . . . . . . . . . . . . . . . . . . . . . . . . . . . . . . . . . . . . . . . . . . . . . . . . . . . . $ 314,098 $ 334,035Federal Funds sold . . . . . . . . . . . . . . . . . . . . . . . . . . . . . . . . . . . . . . . . . . . . . . . . . . . . . . . . . . . . . 2,173,400 525,000Commercial paper . . . . . . . . . . . . . . . . . . . . . . . . . . . . . . . . . . . . . . . . . . . . . . . . . . . . . . . . . . . . . 15,526 15,322
Cash and cash equivalents . . . . . . . . . . . . . . . . . . . . . . . . . . . . . . . . . . . . . . . . . . . . . . . . . . . 2,503,024 874,357Investment securities:
Available-for-sale (amortized cost of $2,000 at February 28, 2007 and November 30,2006) . . . . . . . . . . . . . . . . . . . . . . . . . . . . . . . . . . . . . . . . . . . . . . . . . . . . . . . . . . . . . . . . . 2,042 2,314
Held-to-maturity (fair value $84,155 and $82,241 at February 28, 2007 and atNovember 30, 2006 respectively) . . . . . . . . . . . . . . . . . . . . . . . . . . . . . . . . . . . . . . . . . . . 84,104 82,097
Loan receivables:Loans held for sale . . . . . . . . . . . . . . . . . . . . . . . . . . . . . . . . . . . . . . . . . . . . . . . . . . . . . . . . . 318,447 1,056,380Loan portfolio: . . . . . . . . . . . . . . . . . . . . . . . . . . . . . . . . . . . . . . . . . . . . . . . . . . . . . . . . . . . .
Credit card . . . . . . . . . . . . . . . . . . . . . . . . . . . . . . . . . . . . . . . . . . . . . . . . . . . . . . . . . . . 22,094,215 22,535,181Commercial loans . . . . . . . . . . . . . . . . . . . . . . . . . . . . . . . . . . . . . . . . . . . . . . . . . . . . . 110,858 59,089Other consumer loans . . . . . . . . . . . . . . . . . . . . . . . . . . . . . . . . . . . . . . . . . . . . . . . . . . 88,187 92,100
Total loan portfolio . . . . . . . . . . . . . . . . . . . . . . . . . . . . . . . . . . . . . . . . . . . . . . . . 22,293,260 22,686,370
Total loan receivables . . . . . . . . . . . . . . . . . . . . . . . . . . . . . . . . . . . . . . . . . . . . . . 22,611,707 23,742,750Allowance for loan losses . . . . . . . . . . . . . . . . . . . . . . . . . . . . . . . . . . . . . . . . . . . . . . . . . . . (793,850) (832,483)
Net loan receivables . . . . . . . . . . . . . . . . . . . . . . . . . . . . . . . . . . . . . . . . . . . . . . . 21,817,857 22,910,267Accrued interest receivable . . . . . . . . . . . . . . . . . . . . . . . . . . . . . . . . . . . . . . . . . . . . . . . . . . . . . . 105,310 123,955Amounts due from asset securitization . . . . . . . . . . . . . . . . . . . . . . . . . . . . . . . . . . . . . . . . . . . . . 3,351,302 3,169,895Premises and equipment, net . . . . . . . . . . . . . . . . . . . . . . . . . . . . . . . . . . . . . . . . . . . . . . . . . . . . . 657,845 660,900Goodwill . . . . . . . . . . . . . . . . . . . . . . . . . . . . . . . . . . . . . . . . . . . . . . . . . . . . . . . . . . . . . . . . . . . . 533,381 533,728Intangible assets, net . . . . . . . . . . . . . . . . . . . . . . . . . . . . . . . . . . . . . . . . . . . . . . . . . . . . . . . . . . . 197,493 201,177Other assets . . . . . . . . . . . . . . . . . . . . . . . . . . . . . . . . . . . . . . . . . . . . . . . . . . . . . . . . . . . . . . . . . . 511,445 508,552
Total assets . . . . . . . . . . . . . . . . . . . . . . . . . . . . . . . . . . . . . . . . . . . . . . . . . . . . . . $29,763,803 $29,067,242
Liabilities and Stockholder’s EquityDeposits:
Interest bearing deposit accounts . . . . . . . . . . . . . . . . . . . . . . . . . . . . . . . . . . . . . . . . . . . . . . $17,575,547 $13,238,827Non-interest bearing deposit accounts . . . . . . . . . . . . . . . . . . . . . . . . . . . . . . . . . . . . . . . . . . 86,330 105,032
Total deposits . . . . . . . . . . . . . . . . . . . . . . . . . . . . . . . . . . . . . . . . . . . . . . . . . . . . . 17,661,877 13,343,859Short-term borrowings:
Short-term borrowings from Morgan Stanley . . . . . . . . . . . . . . . . . . . . . . . . . . . . . . . . . . . . 2,632,147 6,639,678Term Federal Funds purchased . . . . . . . . . . . . . . . . . . . . . . . . . . . . . . . . . . . . . . . . . . . . . . . 540,000 100,000
Total short-term borrowings . . . . . . . . . . . . . . . . . . . . . . . . . . . . . . . . . . . . . . . . . 3,172,147 6,739,678Long-term borrowings: . . . . . . . . . . . . . . . . . . . . . . . . . . . . . . . . . . . . . . . . . . . . . . . . . . . . . . . . .
Long-term borrowings from Morgan Stanley . . . . . . . . . . . . . . . . . . . . . . . . . . . . . . . . . . . . 1,250,804 1,251,662Other long-term debt and bank notes . . . . . . . . . . . . . . . . . . . . . . . . . . . . . . . . . . . . . . . . . . 255,646 255,916
Total long-term borrowings . . . . . . . . . . . . . . . . . . . . . . . . . . . . . . . . . . . . . . . . . . 1,506,450 1,507,578Accrued interest payable . . . . . . . . . . . . . . . . . . . . . . . . . . . . . . . . . . . . . . . . . . . . . . . . . . . . . . . . 150,680 135,464Accrued expenses and other liabilities . . . . . . . . . . . . . . . . . . . . . . . . . . . . . . . . . . . . . . . . . . . . . 1,743,991 1,565,891
Total liabilities . . . . . . . . . . . . . . . . . . . . . . . . . . . . . . . . . . . . . . . . . . . . . . . . . . . . 24,235,145 23,292,470Commitments, contingencies and guarantees (Note 7)Stockholder’s EquityCommon stock ($100 par value; 50,000 shares authorized; 1,000 shares issued and outstanding
in 2007 and 2006) . . . . . . . . . . . . . . . . . . . . . . . . . . . . . . . . . . . . . . . . . . . . . . . . . . . . . . . . . . . 100 100Paid-in capital . . . . . . . . . . . . . . . . . . . . . . . . . . . . . . . . . . . . . . . . . . . . . . . . . . . . . . . . . . . . . . . . 2,657,900 2,636,265Retained earnings . . . . . . . . . . . . . . . . . . . . . . . . . . . . . . . . . . . . . . . . . . . . . . . . . . . . . . . . . . . . . 2,742,053 3,008,421Accumulated other comprehensive income . . . . . . . . . . . . . . . . . . . . . . . . . . . . . . . . . . . . . . . . . . 128,605 129,986
Total stockholder’s equity . . . . . . . . . . . . . . . . . . . . . . . . . . . . . . . . . . . . . . . . . . . 5,528,658 5,774,772
Total liabilities and stockholder’s equity . . . . . . . . . . . . . . . . . . . . . . . . . . . . . . . $29,763,803 $29,067,242
See Notes to Condensed Combined Financial Statements.
F-56
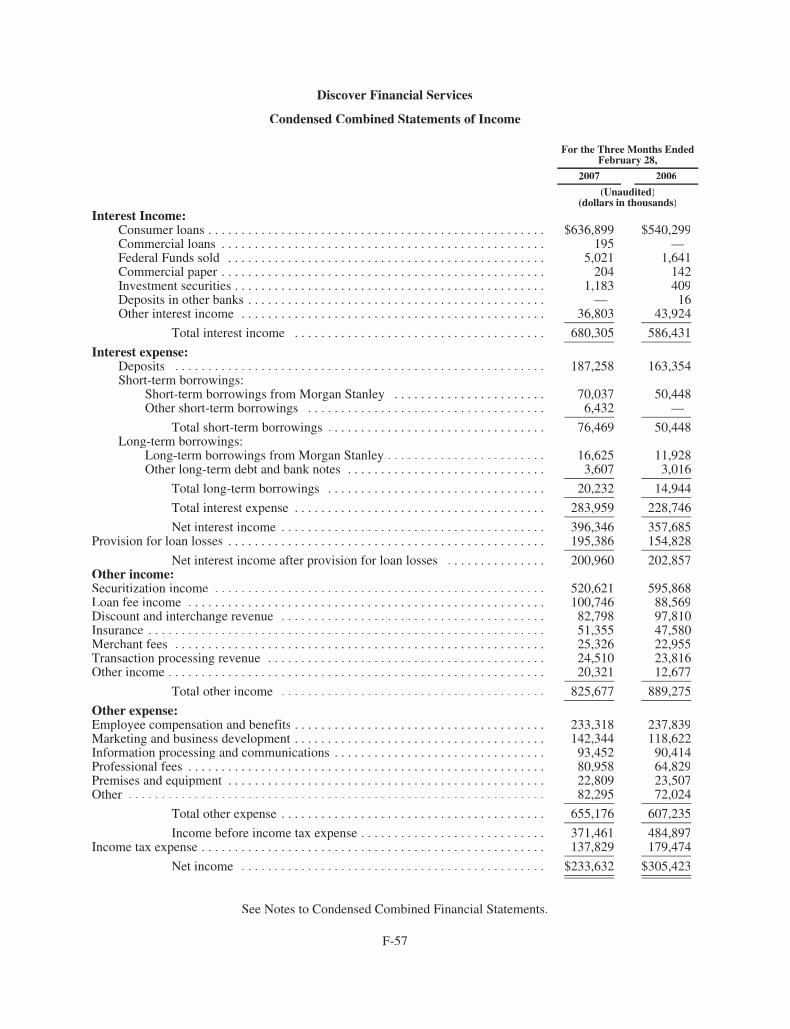
Discover Financial Services
Condensed Combined Statements of Income
For the Three Months EndedFebruary 28,
2007 2006
(Unaudited)(dollars in thousands)
Interest Income:Consumer loans . . . . . . . . . . . . . . . . . . . . . . . . . . . . . . . . . . . . . . . . . . . . . . . . . . . $636,899 $540,299Commercial loans . . . . . . . . . . . . . . . . . . . . . . . . . . . . . . . . . . . . . . . . . . . . . . . . . 195 —Federal Funds sold . . . . . . . . . . . . . . . . . . . . . . . . . . . . . . . . . . . . . . . . . . . . . . . . 5,021 1,641Commercial paper . . . . . . . . . . . . . . . . . . . . . . . . . . . . . . . . . . . . . . . . . . . . . . . . . 204 142Investment securities . . . . . . . . . . . . . . . . . . . . . . . . . . . . . . . . . . . . . . . . . . . . . . . 1,183 409Deposits in other banks . . . . . . . . . . . . . . . . . . . . . . . . . . . . . . . . . . . . . . . . . . . . . — 16Other interest income . . . . . . . . . . . . . . . . . . . . . . . . . . . . . . . . . . . . . . . . . . . . . . 36,803 43,924
Total interest income . . . . . . . . . . . . . . . . . . . . . . . . . . . . . . . . . . . . . . 680,305 586,431
Interest expense:Deposits . . . . . . . . . . . . . . . . . . . . . . . . . . . . . . . . . . . . . . . . . . . . . . . . . . . . . . . . 187,258 163,354Short-term borrowings:
Short-term borrowings from Morgan Stanley . . . . . . . . . . . . . . . . . . . . . . . 70,037 50,448Other short-term borrowings . . . . . . . . . . . . . . . . . . . . . . . . . . . . . . . . . . . . 6,432 —
Total short-term borrowings . . . . . . . . . . . . . . . . . . . . . . . . . . . . . . . . . 76,469 50,448Long-term borrowings:
Long-term borrowings from Morgan Stanley . . . . . . . . . . . . . . . . . . . . . . . . 16,625 11,928Other long-term debt and bank notes . . . . . . . . . . . . . . . . . . . . . . . . . . . . . . 3,607 3,016
Total long-term borrowings . . . . . . . . . . . . . . . . . . . . . . . . . . . . . . . . . 20,232 14,944
Total interest expense . . . . . . . . . . . . . . . . . . . . . . . . . . . . . . . . . . . . . . 283,959 228,746
Net interest income . . . . . . . . . . . . . . . . . . . . . . . . . . . . . . . . . . . . . . . . 396,346 357,685Provision for loan losses . . . . . . . . . . . . . . . . . . . . . . . . . . . . . . . . . . . . . . . . . . . . . . . . 195,386 154,828
Net interest income after provision for loan losses . . . . . . . . . . . . . . . 200,960 202,857Other income:Securitization income . . . . . . . . . . . . . . . . . . . . . . . . . . . . . . . . . . . . . . . . . . . . . . . . . . 520,621 595,868Loan fee income . . . . . . . . . . . . . . . . . . . . . . . . . . . . . . . . . . . . . . . . . . . . . . . . . . . . . . 100,746 88,569Discount and interchange revenue . . . . . . . . . . . . . . . . . . . . . . . . . . . . . . . . . . . . . . . . 82,798 97,810Insurance . . . . . . . . . . . . . . . . . . . . . . . . . . . . . . . . . . . . . . . . . . . . . . . . . . . . . . . . . . . . 51,355 47,580Merchant fees . . . . . . . . . . . . . . . . . . . . . . . . . . . . . . . . . . . . . . . . . . . . . . . . . . . . . . . . 25,326 22,955Transaction processing revenue . . . . . . . . . . . . . . . . . . . . . . . . . . . . . . . . . . . . . . . . . . 24,510 23,816Other income . . . . . . . . . . . . . . . . . . . . . . . . . . . . . . . . . . . . . . . . . . . . . . . . . . . . . . . . . 20,321 12,677
Total other income . . . . . . . . . . . . . . . . . . . . . . . . . . . . . . . . . . . . . . . . 825,677 889,275
Other expense:Employee compensation and benefits . . . . . . . . . . . . . . . . . . . . . . . . . . . . . . . . . . . . . . 233,318 237,839Marketing and business development . . . . . . . . . . . . . . . . . . . . . . . . . . . . . . . . . . . . . . 142,344 118,622Information processing and communications . . . . . . . . . . . . . . . . . . . . . . . . . . . . . . . . 93,452 90,414Professional fees . . . . . . . . . . . . . . . . . . . . . . . . . . . . . . . . . . . . . . . . . . . . . . . . . . . . . . 80,958 64,829Premises and equipment . . . . . . . . . . . . . . . . . . . . . . . . . . . . . . . . . . . . . . . . . . . . . . . . 22,809 23,507Other . . . . . . . . . . . . . . . . . . . . . . . . . . . . . . . . . . . . . . . . . . . . . . . . . . . . . . . . . . . . . . . 82,295 72,024
Total other expense . . . . . . . . . . . . . . . . . . . . . . . . . . . . . . . . . . . . . . . . 655,176 607,235
Income before income tax expense . . . . . . . . . . . . . . . . . . . . . . . . . . . . 371,461 484,897Income tax expense . . . . . . . . . . . . . . . . . . . . . . . . . . . . . . . . . . . . . . . . . . . . . . . . . . . . 137,829 179,474
Net income . . . . . . . . . . . . . . . . . . . . . . . . . . . . . . . . . . . . . . . . . . . . . . $233,632 $305,423
See Notes to Condensed Combined Financial Statements.
F-57

Discover Financial Services
Condensed Combined Statements of Changes in Stockholder’s Equity
CommonStock
AdditionalPaid-inCapital
RetainedEarnings
AccumulatedOther
ComprehensiveIncome (Loss)
TotalStockholder’s
Equity
(dollars in thousands)
Balance at November 30, 2006 . . . . . . . . . . . . . $100 $2,636,265 $3,008,421 $129,986 $5,774,772Comprehensive income:
Net income . . . . . . . . . . . . . . . . . . . . . . . . . — — 233,632 — 233,632Foreign currency translation (accumulated
amount of $128,749 at February 28,2007) . . . . . . . . . . . . . . . . . . . . . . . . . . . . — — — (1,236) (1,236)
Net unrealized losses on investmentsecurities . . . . . . . . . . . . . . . . . . . . . . . . . — — — (176) (176)
Other . . . . . . . . . . . . . . . . . . . . . . . . . . . . . . — — — 31 31
Other comprehensive loss . . . . . . . . . . — — — — (1,381)
Comprehensive income . . . . . . . — — — — 232,251Capital contribution from Morgan Stanley . . . . — 21,635 — — 21,635Cash dividends paid to Morgan Stanley . . . . . . . — — (500,000) — (500,000)
Balance at February 28, 2007 (unaudited) . . . . . $100 $2,657,900 $2,742,053 $128,605 $5,528,658
See Notes to Condensed Combined Financial Statements.
F-58

Discover Financial Services
Condensed Combined Statements of Cash FlowsFor the Three Months Ended
February 28,
2007 2006
(Unaudited)(dollars in thousands)
Cash flows from operating activitiesNet income . . . . . . . . . . . . . . . . . . . . . . . . . . . . . . . . . . . . . . . . . . . . . . . . . . . . . . $ 233,632 $ 305,423Adjustments to reconcile net income to net cash provided by operating
activities:Gains on sale of mortgages and installment loans . . . . . . . . . . . . . . . . . . . . (422) (2,126)Net principal disbursed on loans originated for sale . . . . . . . . . . . . . . . . . . (24,878) (24,383)Proceeds from sale of loans originated for sale . . . . . . . . . . . . . . . . . . . . . . 26,389 18,888Deferred income taxes . . . . . . . . . . . . . . . . . . . . . . . . . . . . . . . . . . . . . . . . . 17,368 73,861Depreciation and amortization on premises and equipment . . . . . . . . . . . . . 30,667 27,246Other depreciation and amortization . . . . . . . . . . . . . . . . . . . . . . . . . . . . . . 31,133 25,309Provision for loan losses . . . . . . . . . . . . . . . . . . . . . . . . . . . . . . . . . . . . . . . . 195,386 154,828Amortization of deferred revenues . . . . . . . . . . . . . . . . . . . . . . . . . . . . . . . . (5,450) (6,395)Changes in assets and liabilities:
Increase in amounts due from asset securitizations . . . . . . . . . . . . . . . (181,506) (591,838)(Increase) decrease in other assets . . . . . . . . . . . . . . . . . . . . . . . . . . . . (12,855) 43,773Increase in accrued expenses and other liabilities . . . . . . . . . . . . . . . . 200,184 143,427
Net cash provided by operating activities . . . . . . . . . . . . . . . . . . . . . . . . . . . . . . . . . . 509,648 168,013
Cash flows from investing activitiesNet proceeds from (payments for):
Business and other acquisitions . . . . . . . . . . . . . . . . . . . . . . . . . . . . . . . . . . — (1,674,555)Maturities of investment securities held-to-maturity . . . . . . . . . . . . . . . . . . 2,307 495Purchases of investment securities held-to-maturity . . . . . . . . . . . . . . . . . . (4,274) (32,042)Proceeds from securitization and sale of loans held for investment . . . . . . 1,576,165 6,682,777Net principal disbursed on loans held for investment . . . . . . . . . . . . . . . . . (700,288) (2,905,305)Purchases of premises and equipment . . . . . . . . . . . . . . . . . . . . . . . . . . . . . (27,997) (21,468)
Net cash provided by investing activities . . . . . . . . . . . . . . . . . . . . . . . . . . . . . . . . . . . 845,913 2,049,902
Cash flows from financing activitiesNet decrease in short-term borrowings . . . . . . . . . . . . . . . . . . . . . . . . . . . . . (3,543,737) (524,631)Proceeds from issuance of long-term debt . . . . . . . . . . . . . . . . . . . . . . . . . . — 613,566Net increase (decrease) in deposits . . . . . . . . . . . . . . . . . . . . . . . . . . . . . . . . 4,316,854 (1,570,530)Cash dividends paid to Morgan Stanley . . . . . . . . . . . . . . . . . . . . . . . . . . . . (500,000) —
Net cash provided by (used for) financing activities . . . . . . . . . . . . . . . . . . . . . . . . . . 273,117 (1,481,595)Effect of exchange rate changes on cash and cash equivalents . . . . . . . . . . . . . . . . . . (11) 50
Net increase in cash and cash equivalents . . . . . . . . . . . . . . . . . . . . . . . . . . . . . . . . . . 1,628,667 736,370Cash and cash equivalents, at beginning of period . . . . . . . . . . . . . . . . . . . . . . . . . . . . 874,357 555,482
Cash and cash equivalents, at end of period . . . . . . . . . . . . . . . . . . . . . . . . . . . . . . . . . $ 2,503,024 $ 1,291,852
SUPPLEMENTAL DISCLOSURES OF CASH FLOW INFORMATION:Cash paid during the period for
Interest expense paid . . . . . . . . . . . . . . . . . . . . . . . . . . . . . . . . . . . . . . . . . . $ 280,083 $ 233,218
Income taxes, net of income tax refunds . . . . . . . . . . . . . . . . . . . . . . . . . . . $ (52,158) $ (33,123)
Non-cash transactions:Capital contributions from Morgan Stanley . . . . . . . . . . . . . . . . . . . . . . . . . $ 21,635 $ 3,651
Capitalized leases . . . . . . . . . . . . . . . . . . . . . . . . . . . . . . . . . . . . . . . . . . . . . $ (300) $ (282)
See Notes to Condensed Combined Financial Statements.
F-59

Discover Financial Services
Notes to Condensed Combined Financial Statements
1. Basis of Presentation
The accompanying unaudited condensed combined financial statements as of February 28, 2007 and for thethree month periods ended February 28, 2007 and 2006 have been prepared in accordance with accountingprinciples generally accepted in the United States and the provisions in Article 10 of Regulation S-X. Theunaudited condensed combined financial statements as of February 28, 2007 and for the three month periodsended February 28, 2007 and 2006 have been prepared on the same basis as the combined financial statements asof November 30, 2006 and 2005 and for each of the three years in the period ended November 30, 2006 includedherein, and in the opinion of management, reflect all adjustments necessary to present fairly the Company’scombined financial position as of February 28, 2007, the combined changes in stockholder’s equity for the threemonths ended February 28, 2007, and the combined results of operations and its cash flows for the three monthperiods ended February 28, 2007 and 2006. The combined results of operations for the three months endedFebruary 28, 2007 are not necessarily indicative of the results that may be expected for the year endingNovember 30, 2007 or for any other period.
2. Loan Receivables
Loan receivables consist of the following (dollars in thousands):
February 28,2007
November 30,2006
Loans held for sale:Domestic . . . . . . . . . . . . . . . . . . . . . . . . . . . . . . . . . . . . . . . . . . . . . $ 318,447 $ 1,056,380International . . . . . . . . . . . . . . . . . . . . . . . . . . . . . . . . . . . . . . . . . . — —
Total loans held for sale . . . . . . . . . . . . . . . . . . . . . . . . . 318,447 1,056,380Loan portfolio:
Credit cardDomestic . . . . . . . . . . . . . . . . . . . . . . . . . . . . . . . . . . . . . . . . . 19,210,345 19,582,675International . . . . . . . . . . . . . . . . . . . . . . . . . . . . . . . . . . . . . . 2,883,870 2,952,506
Total credit card . . . . . . . . . . . . . . . . . . . . . . . . . . . . . . . 22,094,215 22,535,181Commercial loansDomestic . . . . . . . . . . . . . . . . . . . . . . . . . . . . . . . . . . . . . . . . . . . . . 110,858 59,089
Total commercial loans . . . . . . . . . . . . . . . . . . . . . . . . . . 110,858 59,089
Total credit card, including consumer andcommercial . . . . . . . . . . . . . . . . . . . . . . . . . . . . . . . . . 22,205,073 22,594,270
Other consumer loansDomestic . . . . . . . . . . . . . . . . . . . . . . . . . . . . . . . . . . . . . . . . . . . . . 88,187 92,100International . . . . . . . . . . . . . . . . . . . . . . . . . . . . . . . . . . . . . . . . . . — —
Total other consumer loans . . . . . . . . . . . . . . . . . . . . . . . . . . . . . . . 88,187 92,100
Total loan portfolio . . . . . . . . . . . . . . . . . . . . . . . . . . . . . 22,293,260 22,686,370
Total loan receivables . . . . . . . . . . . . . . . . . . . . . . . . . . . 22,611,707 23,742,750Allowance for loan losses
Domestic . . . . . . . . . . . . . . . . . . . . . . . . . . . . . . . . . . . . . . . . . . . . . (663,172) (703,917)International . . . . . . . . . . . . . . . . . . . . . . . . . . . . . . . . . . . . . . . . . . (130,678) (128,566)
Total allowance for loan losses . . . . . . . . . . . . . . . . . . . . (793,850) (832,483)
Net loan receivables . . . . . . . . . . . . . . . . . . . . . . . . . . . . $21,817,857 $22,910,267
F-60

The Company received net proceeds from loan sales, inclusive of net proceeds on credit card assetsecuritization transactions, of $1.6 billion and $6.7 billion in the three months ended February 28, 2007 and2006, respectively. For the three months ended February 28, 2007 and 2006, proceeds from credit card assetsecuritizations were $1.6 billion and $6.6 billion, respectively. Proceeds from mortgage loans were $0.1 billionfor the three months ended February 28, 2006.
Activity in the allowance for loan losses is as follows (dollars in thousands):
For the Three MonthsEnded February 28,
2007 2006
Balance at beginning of period . . . . . . . . . . . . . . . . . . . . . . . . . . . . . . . . . $ 832,483 $ 838,848Additions:
Provision for loan losses . . . . . . . . . . . . . . . . . . . . . . . . . . . . . . . . . . 195,386 154,828Reserves acquired . . . . . . . . . . . . . . . . . . . . . . . . . . . . . . . . . . . . . . . — 43,557
Deductions:Charge-offs . . . . . . . . . . . . . . . . . . . . . . . . . . . . . . . . . . . . . . . . . . . . (280,784) (299,881)Recoveries . . . . . . . . . . . . . . . . . . . . . . . . . . . . . . . . . . . . . . . . . . . . . 46,927 46,954
Net charge-offs . . . . . . . . . . . . . . . . . . . . . . . . . . . . . . . . . . . . . (233,857) (252,927)Translation adjustments and other . . . . . . . . . . . . . . . . . . . . . . . . . . . . . . (162) 676
Balance at end of period . . . . . . . . . . . . . . . . . . . . . . . . . . . . . . . . . . . . . . $ 793,850 $ 784,982
Information regarding net charge-off of interest and fee revenue on credit card loans is as follows (dollars inthousands):
For the Three MonthsEnded February 28,
2007 2006
Interest accrued subsequently charged off, net of recoveries (recordedas a reduction of interest income) . . . . . . . . . . . . . . . . . . . . . . . . . . . . . $53,369 $38,297
Consumer fees accrued subsequently charged off, net of recoveries(recorded as a reduction to loan fee income) . . . . . . . . . . . . . . . . . . . . $22,537 $22,066
Information regarding loan receivables that are over 90 days delinquent and accruing interest is as follows(dollars in thousands):
February 28,2007
November 30,2006
Domestic . . . . . . . . . . . . . . . . . . . . . . . . . . . . . . . . . . . . . . . . . . . . . . . . . . . $240,229 $244,669International . . . . . . . . . . . . . . . . . . . . . . . . . . . . . . . . . . . . . . . . . . . . . . . . 35,053 38,997
Total loans over 90 days delinquent and accruing interest . . . . . . . . $275,282 $283,666
Information regarding loan receivables that are not accruing interest is as follows (dollars in thousands):
February 28,2007
November 30,2006
Domestic . . . . . . . . . . . . . . . . . . . . . . . . . . . . . . . . . . . . . . . . . . . . . . . . . . . $ 96,515 $110,486International . . . . . . . . . . . . . . . . . . . . . . . . . . . . . . . . . . . . . . . . . . . . . . . . 151,200 143,435
Total loans not accruing interest . . . . . . . . . . . . . . . . . . . . . . . . . . . . $247,715 $253,921
F-61

3. Deposits
The Company’s deposits consist of brokered and direct certificates of deposits, money market depositaccounts, and, to a lesser degree, deposits payable upon demand. All interest bearing deposit accounts are derivedfrom the domestic operations. A summary of interest bearing deposit accounts is as follows (dollars in thousands):
February 28,2007
November 30,2006
Certificates of deposit in amounts less than $100,000 (1) . . . . . . . . . . . . $13,191,169 $ 911,592Certificates of deposit in amounts of $100,000 or greater . . . . . . . . . . . 686,076 9,393,755Savings deposits, including money market deposit accounts . . . . . . . . . 3,698,302 2,933,480
Total interest bearing deposits . . . . . . . . . . . . . . . . . . . . . . . . . . . . $17,575,547 $13,238,827
Average annual interest rate . . . . . . . . . . . . . . . . . . . . . . . . . . . . . . . . . . 5.04% 4.68%
(1) Effective February 28, 2007, brokered certificates of deposits issued under a master certificate of deposit in amounts greater than$100,000 and participated out in amounts less than $100,000 were reclassified from certificates of deposits in amounts of $100,000 orgreater to certificates of deposits in amounts less than $100,000. This change in classification was made in conjunction with clarifyingFFIEC regulatory guidance issued in 2006.
Money market deposit accounts include amounts obtained through the Bank Deposit Program operated byMorgan Stanley. At February 28, 2007 and November 30, 2006, deposits generated through the Bank DepositProgram were $2.6 billion and $1.9 billion, respectively. See Note 10: Related Party Transactions herein forfurther information on this arrangement.
At February 28, 2007 and November 30, 2006, non-interest bearing deposit accounts included $22.2 millionand $28.7 million, respectively, derived from the Company’s U.K. operations.
At February 28, 2007, certificates of deposit maturing over the next five years and thereafter were as follows(dollars in thousands):
Year Amount
2007 . . . . . . . . . . . . . . . . . . . . . . . . . . . . . . . . . . . . . . . . . . . . . . . . . . . . . . . . . . . $6,754,3792008 . . . . . . . . . . . . . . . . . . . . . . . . . . . . . . . . . . . . . . . . . . . . . . . . . . . . . . . . . . . $3,163,2542009 . . . . . . . . . . . . . . . . . . . . . . . . . . . . . . . . . . . . . . . . . . . . . . . . . . . . . . . . . . . $1,260,5642010 . . . . . . . . . . . . . . . . . . . . . . . . . . . . . . . . . . . . . . . . . . . . . . . . . . . . . . . . . . . $1,147,4592011 . . . . . . . . . . . . . . . . . . . . . . . . . . . . . . . . . . . . . . . . . . . . . . . . . . . . . . . . . . . $ 282,822Thereafter . . . . . . . . . . . . . . . . . . . . . . . . . . . . . . . . . . . . . . . . . . . . . . . . . . . . . . $1,268,767
4. Short-Term Borrowings
Borrowings from Morgan Stanley. Short-term borrowings from Morgan Stanley consist of notes payable toMorgan Stanley and Federal Funds purchased from Morgan Stanley Bank, an FDIC-regulated banking subsidiary ofMorgan Stanley, with original maturities less than one year. The following table identifies the balances and weightedaverage interest rates on short-term borrowings outstanding from Morgan Stanley at period end (dollars in thousands):
February 28, 2007 November 30, 2006
Amount
WeightedAverage
Interest Rate Amount
WeightedAverage
Interest Rate
Overnight Federal Funds purchased . . . . . . . . . . . . . . . . . . $ — — $3,000,000 5.31%Notes payable to Morgan Stanley
Domestic . . . . . . . . . . . . . . . . . . . . . . . . . . . . . . . . . . . 886,085 5.61% 1,811,124 5.46%International . . . . . . . . . . . . . . . . . . . . . . . . . . . . . . . . . 1,746,062 5.54% 1,828,554 5.25%
Short-term borrowings from Morgan Stanley . . . . . . . . . . . $2,632,147 5.57% $6,639,678 5.34%
F-62
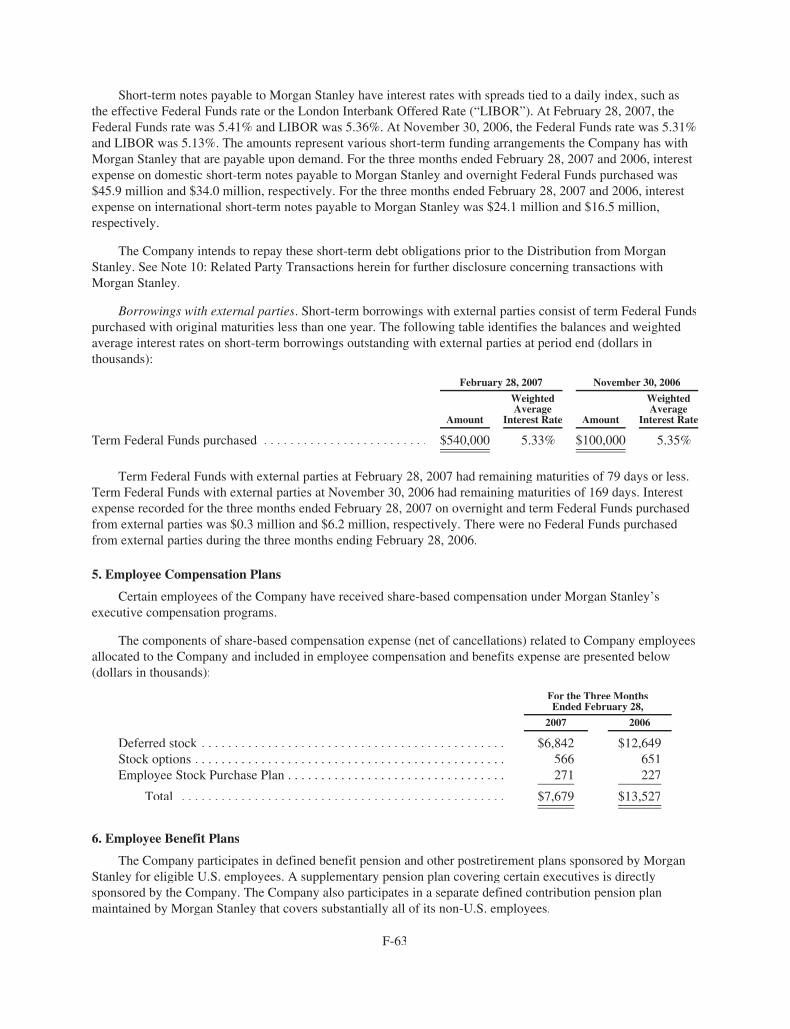
Short-term notes payable to Morgan Stanley have interest rates with spreads tied to a daily index, such asthe effective Federal Funds rate or the London Interbank Offered Rate (“LIBOR”). At February 28, 2007, theFederal Funds rate was 5.41% and LIBOR was 5.36%. At November 30, 2006, the Federal Funds rate was 5.31%and LIBOR was 5.13%. The amounts represent various short-term funding arrangements the Company has withMorgan Stanley that are payable upon demand. For the three months ended February 28, 2007 and 2006, interestexpense on domestic short-term notes payable to Morgan Stanley and overnight Federal Funds purchased was$45.9 million and $34.0 million, respectively. For the three months ended February 28, 2007 and 2006, interestexpense on international short-term notes payable to Morgan Stanley was $24.1 million and $16.5 million,respectively.
The Company intends to repay these short-term debt obligations prior to the Distribution from MorganStanley. See Note 10: Related Party Transactions herein for further disclosure concerning transactions withMorgan Stanley.
Borrowings with external parties. Short-term borrowings with external parties consist of term Federal Fundspurchased with original maturities less than one year. The following table identifies the balances and weightedaverage interest rates on short-term borrowings outstanding with external parties at period end (dollars inthousands):
February 28, 2007 November 30, 2006
Amount
WeightedAverage
Interest Rate Amount
WeightedAverage
Interest Rate
Term Federal Funds purchased . . . . . . . . . . . . . . . . . . . . . . . . . $540,000 5.33% $100,000 5.35%
Term Federal Funds with external parties at February 28, 2007 had remaining maturities of 79 days or less.Term Federal Funds with external parties at November 30, 2006 had remaining maturities of 169 days. Interestexpense recorded for the three months ended February 28, 2007 on overnight and term Federal Funds purchasedfrom external parties was $0.3 million and $6.2 million, respectively. There were no Federal Funds purchasedfrom external parties during the three months ending February 28, 2006.
5. Employee Compensation Plans
Certain employees of the Company have received share-based compensation under Morgan Stanley’sexecutive compensation programs.
The components of share-based compensation expense (net of cancellations) related to Company employeesallocated to the Company and included in employee compensation and benefits expense are presented below(dollars in thousands):
For the Three MonthsEnded February 28,
2007 2006
Deferred stock . . . . . . . . . . . . . . . . . . . . . . . . . . . . . . . . . . . . . . . . . . . . . . $6,842 $12,649Stock options . . . . . . . . . . . . . . . . . . . . . . . . . . . . . . . . . . . . . . . . . . . . . . . 566 651Employee Stock Purchase Plan . . . . . . . . . . . . . . . . . . . . . . . . . . . . . . . . . 271 227
Total . . . . . . . . . . . . . . . . . . . . . . . . . . . . . . . . . . . . . . . . . . . . . . . . . $7,679 $13,527
6. Employee Benefit Plans
The Company participates in defined benefit pension and other postretirement plans sponsored by MorganStanley for eligible U.S. employees. A supplementary pension plan covering certain executives is directlysponsored by the Company. The Company also participates in a separate defined contribution pension planmaintained by Morgan Stanley that covers substantially all of its non-U.S. employees.
F-63

Net Periodic Benefit Expense. Net periodic benefit expense allocated to the Company included the followingcomponents (dollars in thousands):
Pension Postretirement
For the ThreeMonths EndedFebruary 28,
For the ThreeMonths EndedFebruary 28,
2007 2006 2007 2006
Service cost, benefits earned during the period . . . . . . . . . . . . . . . . . . . . . . . . $ 4,825 $ 5,023 $ 274 $360Interest cost on projected benefit obligation . . . . . . . . . . . . . . . . . . . . . . . . . . . 4,951 4,585 328 359Expected return on plan assets . . . . . . . . . . . . . . . . . . . . . . . . . . . . . . . . . . . . . (5,474) (5,162) — —Net amortization . . . . . . . . . . . . . . . . . . . . . . . . . . . . . . . . . . . . . . . . . . . . . . . . 515 1,021 (138) (94)
Net periodic benefit expense . . . . . . . . . . . . . . . . . . . . . . . . . . . . . . . . . . . . . . . $ 4,817 $ 5,467 $ 464 $625
7. Commitments, Contingencies and Guarantees
Lease commitments. The Company leases various office space and equipment under capital andnon-cancelable operating leases which expire at various dates through 2013. At February 28, 2007, futureminimum payments, net of sublease rentals of $4.5 million, with initial or remaining terms in excess of one year,consist of the following (dollars in thousands):
February 28, 2007
CapitalizedLeases
OperatingLeases
2007 . . . . . . . . . . . . . . . . . . . . . . . . . . . . . . . . . . . . . . . . . . . . . . . . . . . . . . . . . . $1,185 $ 2,0332008 . . . . . . . . . . . . . . . . . . . . . . . . . . . . . . . . . . . . . . . . . . . . . . . . . . . . . . . . . . 1,579 5,1412009 . . . . . . . . . . . . . . . . . . . . . . . . . . . . . . . . . . . . . . . . . . . . . . . . . . . . . . . . . . 1,579 6,8732010 . . . . . . . . . . . . . . . . . . . . . . . . . . . . . . . . . . . . . . . . . . . . . . . . . . . . . . . . . . 1,579 4,9642011 . . . . . . . . . . . . . . . . . . . . . . . . . . . . . . . . . . . . . . . . . . . . . . . . . . . . . . . . . . 790 2,826Thereafter . . . . . . . . . . . . . . . . . . . . . . . . . . . . . . . . . . . . . . . . . . . . . . . . . . . . . . 4,955
Total minimum lease payments . . . . . . . . . . . . . . . . . . . . . . . . . . . . . . . . . . . . . 6,712 $26,792
Less amount representing interest . . . . . . . . . . . . . . . . . . . . . . . . . . . . . . . . . . . 832
Present value of net minimum lease payments . . . . . . . . . . . . . . . . . . . . . . . . . $5,880
Occupancy lease agreements, in addition to the base rentals, generally provide for rent and operatingexpense escalations resulting from increased assessments for real estate taxes and other charges. Total rentexpense under operating lease agreements, which considers contractual escalations and is net of sublease rentalincome, was $2.7 million and $3.3 million for the three months ended February 28, 2007 and 2006, respectively.Sublease rental income was $1.3 million and $1.2 million, respectively. See Note 10: Related Party Transactionsherein for further information regarding rental expense and sublease rental income.
Unused commitments to extend credit. At February 28, 2007, the Company had unused commitments toextend credit for consumer and commercial loans of approximately $270 billion and $495 million, respectively.Such commitments arise primarily from agreements with customers for unused lines of credit on certain creditcards, provided there is no violation of conditions established in the related agreement. The commitments,substantially all of which the Company can terminate at any time and which do not necessarily represent futurecash requirements, are periodically reviewed based on account usage and customer creditworthiness.
F-64

Guarantees. The Company has certain obligations under certain guarantee agreements, including contractsand indemnification agreements that contingently require the Company to make payments to the guaranteed partybased on changes in and underlying (such as a security) related to an asset, liability or equity security of aguaranteed party. Also included as guarantees are contracts that contingently require the Company to makepayments to the guaranteed party based on another entity’s failure to perform under an agreement. TheCompany’s use of guarantees is disclosed below by type of guarantee.
Securitized Asset Representations and Warranties. As part of the Company’s securitization activities,the Company provides representations and warranties that certain securitized assets conform to specifiedguidelines. The Company may be required to repurchase such assets or indemnify the purchaser againstlosses if the assets do not meet certain conforming guidelines. Due diligence is performed by the Companyto ensure that asset guideline qualifications are met. The maximum potential amount of future payments theCompany could be required to make would be equal to the current outstanding balances of all assets subjectto such securitization activities. The Company has not recorded any contingent liability in the combinedfinancial statements for these representations and warranties and believes that the probability of anypayments under these arrangements is remote.
Merchant Chargeback Guarantees. The Company issues credit cards in the United States and UnitedKingdom and owns and operates the Discover Network in the United States. The Company is contingentlyliable for certain transactions processed on the Discover Network in the event of a dispute between thecardmember and a merchant. The contingent liability arises if the disputed transaction involves a merchantor merchant acquirer with whom Discover Network has a direct relationship. If a dispute is resolved in thecardmember’s favor, the Discover Network will credit or refund the disputed amount to the DiscoverNetwork card issuer, who in turn credits its cardholder’s account. Discover Network will then charge backthe transaction to the merchant or merchant acquirer. If the Discover Network is unable to collect theamount from the merchant or merchant acquirer, it will bear the loss for the amount credited or refunded tothe cardholder. In most instances, a payment requirement by the Discover Network is unlikely to arisebecause most products or services are delivered when purchased, and credits are issued by merchants onreturned items in a timely fashion. However, where the product or service is not provided until some laterdate following the purchase, the likelihood of payment by the Discover Network increases. Similarly, theCompany is also contingently liable for the resolution of cardmember disputes associated with its generalpurpose credit cards issued by its U.K. subsidiary on the MasterCard and Visa networks. The maximumpotential amount of future payments related to these contingent liabilities is estimated to be the portion ofthe total Discover Network sales transaction volume processed to date as well as the total U.K. cardmembersales transaction volume billed to date for which timely and valid disputes may be raised under applicablelaw, and relevant issuer and cardmember agreements. However, the Company believes that amount is notrepresentative of the Company’s actual potential loss exposure based on the Company’s historicalexperience. The actual amount of the potential exposure cannot be quantified as the Company cannotdetermine whether the current or cumulative transaction volumes may include or result in disputedtransactions.
The table below summarizes certain information regarding merchant chargeback guarantees:
For the Three MonthsEnded February 28,
2007 2006
Losses related to merchant chargebacks (in thousands) . . . . . . . . . . . . . . $ 1,960 $ 554Aggregate credit card sales volume (in millions) . . . . . . . . . . . . . . . . . . . $26,393 $23,222
F-65

The amount of the liability related to the Company’s cardmember merchant guarantee was not material atFebruary 28, 2007 and November 30, 2006. The Company mitigates this risk by withholding settlement frommerchants or obtaining escrow deposits from certain merchant acquirers or merchants that are considered higherrisk due to various factors such as time delays in the delivery of products or services. The table below providesinformation regarding the settlement withholdings and escrow deposits (dollars in thousands):
February 28,2007
November 30,2006
Settlement withholdings and escrow deposits . . . . . . . . . . . . . . . . . . . . . . $61,182 $54,741
Settlement withholdings and escrow deposits are recorded in interest bearing deposit accounts and accruedexpenses and other liabilities on the Company’s combined statement of financial condition.
8. Fair Value Disclosures
In accordance with FASB Statement No. 107, Disclosures about Fair Value of Financial Instruments, theCompany is required to disclose the fair value of financial instruments for which it is practical to estimate fairvalue. To obtain fair values, observable market prices are used if available. In some instances, observable marketprices are not readily available for certain financial instrument and fair value is determined using present value orother techniques appropriate for a particular financial instrument. These techniques involve some degree ofjudgment and as a result are not necessarily indicative of the amounts the Company would realize in a currentmarket exchange. The use of different assumptions or estimation techniques may have a material effect on theestimated fair value amounts.
The following table provides the estimated fair values of financial instruments (dollars in thousands):
February 28, 2007 November 30, 2006
CarryingValue
EstimatedFair Value
CarryingValue
EstimatedFair Value
Financial AssetsCash and cash equivalents . . . . . . . . . . . . . . . . . . . . . . $ 2,503,024 $ 2,503,024 $ 874,357 $ 874,357Interest earning deposits in other banks . . . . . . . . . . . $ — $ — $ — $ —Investment securities:
Available-for-sale . . . . . . . . . . . . . . . . . . . . . . . . $ 2,042 $ 2,042 $ 2,314 $ 2,314Held-to-maturity . . . . . . . . . . . . . . . . . . . . . . . . . $ 84,104 $ 84,155 $ 82,097 $ 82,241
Net loan receivables . . . . . . . . . . . . . . . . . . . . . . . . . . $21,817,857 $21,945,841 $22,910,267 $22,962,899Amounts due from asset securitization . . . . . . . . . . . . $ 3,351,302 $ 3,351,302 $ 3,169,895 $ 3,169,895Derivative financial instruments . . . . . . . . . . . . . . . . . $ 39,114 $ 39,114 $ 33,339 $ 33,339
Financial LiabilitiesDeposits . . . . . . . . . . . . . . . . . . . . . . . . . . . . . . . . . . . . $17,661,877 $17,602,665 $13,343,859 $13,299,993Short-term borrowings . . . . . . . . . . . . . . . . . . . . . . . . $ 3,172,147 $ 3,172,147 $ 6,739,678 $ 6,739,678Long-term borrowings . . . . . . . . . . . . . . . . . . . . . . . . . $ 1,506,450 $ 1,544,719 $ 1,507,578 $ 1,548,885Derivative financial instruments . . . . . . . . . . . . . . . . . $ 27,243 $ 27,243 $ 27,895 $ 27,895
Cash and cash equivalents. The carrying value of cash and cash equivalents approximates fair value due tomaturities of less than three months.
Interest earning deposits in other banks. The carrying values of interest earning deposits in other banksapproximate their fair values due to maturities of less than one year.
Investment securities available-for-sale. The carrying values of investment securities classified asavailable-for-sale are recorded at their fair values.
F-66

Investment securities held-to-maturity. The estimated fair values of investment securities classified asheld-to-maturity are based on quoted market prices.
Net loan receivables. The Company’s loan receivables consist of loans held for sale and the loan portfolio,which includes loans to consumers and commercial loans. The carrying value of loans held for sale, whichconsists entirely of consumer loans, approximates fair value as a result of the short-term nature of these assets.To estimate the fair value of the remaining loan receivables, loans are aggregated into pools of similar loan types,characteristics and expected repayment terms. Carrying values of loans that are tied to a market index areassumed to approximate fair values due to their automatic ability to reprice with changes in the market. The fairvalues of all other loans are estimated by discounting future cash flows using a rate at which similar loans couldbe made under current market conditions.
Amounts due from asset securitization. The carrying values of amounts due from asset securitization arerecorded at their approximate fair values.
Deposits. The carrying values of money market deposit, non-interest bearing deposits, interest bearingdemand deposits and savings accounts approximates fair value due to liquid nature of deposits. For time depositsfor which readily available market rates do not exist, fair values are estimated by discounting future cash flowsusing market rates currently offered for deposits with similar remaining maturities.
Short-term borrowings. The carrying values of short-term borrowings approximate their fair values due tothe short-term nature of these liabilities. Short-term borrowings from Morgan Stanley are payable upon demandand carry variable rates of interest. Term Federal Funds purchased have maturities of less than one year.
Long-term borrowings. The fair values of long-term borrowings from Morgan Stanley are determined bydiscounting cash flows of future interest accruals at market rates currently offered for borrowings with similarremaining maturities or repricing terms. The carrying values of bank notes approximate their fair values due tothe quarterly repricing of interest rates to current market rates.
Derivative financial instruments. The Company’s interest rate risk management program is designed toreduce the volatility of earnings resulting from changes in interest rates by having a financing portfolio thatreflects the existing repricing schedules of the managed loan receivables while also considering the Company’sright, with notice to cardmembers, to reprice certain loans to a new interest rate in the future. To the extent thatasset and related financing repricing characteristics of a particular component of the portfolio are not matchedeffectively, the Company utilizes interest rate swap agreements to achieve its objective. Interest rate swapagreements are derivative financial instruments that are entered into with institutions that are established dealersand that maintain certain minimum credit criteria established by the Company.
The Company enters interest rate swap agreements with unrelated third parties as well as with MorganStanley. The table that follows summarizes the interest rate swap agreements outstanding (dollars in thousands):
NotionalAmount
Weighted AverageYears to Maturity
EstimatedFair Value
February 28, 2007Interest rate swap agreements with Morgan Stanley . . . . . . . . . . . . . . . $3,153,004 2.7
Gross positive fair value . . . . . . . . . . . . . . . . . . . . . . . . . . . . . . . . $ 39,114Gross negative fair value . . . . . . . . . . . . . . . . . . . . . . . . . . . . . . . . (18,439)
Interest rate swap agreements with unrelated parties . . . . . . . . . . . . . . 1,192,369 2.8Gross positive fair value . . . . . . . . . . . . . . . . . . . . . . . . . . . . . . . . —Gross negative fair value . . . . . . . . . . . . . . . . . . . . . . . . . . . . . . . . (8,804)
Total interest rate swap agreements . . . . . . . . . . . . . . . . . . . . . . . . . . . $4,345,373 2.7 $ 11,871
F-67
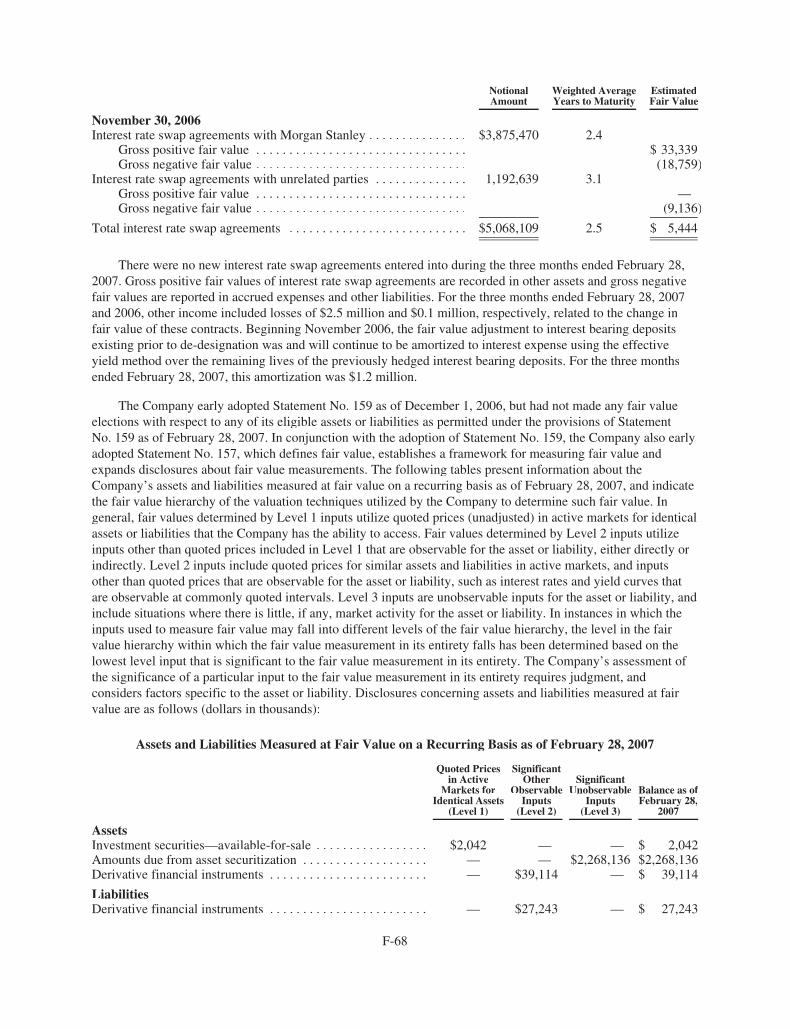
NotionalAmount
Weighted AverageYears to Maturity
EstimatedFair Value
November 30, 2006Interest rate swap agreements with Morgan Stanley . . . . . . . . . . . . . . . $3,875,470 2.4
Gross positive fair value . . . . . . . . . . . . . . . . . . . . . . . . . . . . . . . . $ 33,339Gross negative fair value . . . . . . . . . . . . . . . . . . . . . . . . . . . . . . . . (18,759)
Interest rate swap agreements with unrelated parties . . . . . . . . . . . . . . 1,192,639 3.1Gross positive fair value . . . . . . . . . . . . . . . . . . . . . . . . . . . . . . . . —Gross negative fair value . . . . . . . . . . . . . . . . . . . . . . . . . . . . . . . . (9,136)
Total interest rate swap agreements . . . . . . . . . . . . . . . . . . . . . . . . . . . $5,068,109 2.5 $ 5,444
There were no new interest rate swap agreements entered into during the three months ended February 28,2007. Gross positive fair values of interest rate swap agreements are recorded in other assets and gross negativefair values are reported in accrued expenses and other liabilities. For the three months ended February 28, 2007and 2006, other income included losses of $2.5 million and $0.1 million, respectively, related to the change infair value of these contracts. Beginning November 2006, the fair value adjustment to interest bearing depositsexisting prior to de-designation was and will continue to be amortized to interest expense using the effectiveyield method over the remaining lives of the previously hedged interest bearing deposits. For the three monthsended February 28, 2007, this amortization was $1.2 million.
The Company early adopted Statement No. 159 as of December 1, 2006, but had not made any fair valueelections with respect to any of its eligible assets or liabilities as permitted under the provisions of StatementNo. 159 as of February 28, 2007. In conjunction with the adoption of Statement No. 159, the Company also earlyadopted Statement No. 157, which defines fair value, establishes a framework for measuring fair value andexpands disclosures about fair value measurements. The following tables present information about theCompany’s assets and liabilities measured at fair value on a recurring basis as of February 28, 2007, and indicatethe fair value hierarchy of the valuation techniques utilized by the Company to determine such fair value. Ingeneral, fair values determined by Level 1 inputs utilize quoted prices (unadjusted) in active markets for identicalassets or liabilities that the Company has the ability to access. Fair values determined by Level 2 inputs utilizeinputs other than quoted prices included in Level 1 that are observable for the asset or liability, either directly orindirectly. Level 2 inputs include quoted prices for similar assets and liabilities in active markets, and inputsother than quoted prices that are observable for the asset or liability, such as interest rates and yield curves thatare observable at commonly quoted intervals. Level 3 inputs are unobservable inputs for the asset or liability, andinclude situations where there is little, if any, market activity for the asset or liability. In instances in which theinputs used to measure fair value may fall into different levels of the fair value hierarchy, the level in the fairvalue hierarchy within which the fair value measurement in its entirety falls has been determined based on thelowest level input that is significant to the fair value measurement in its entirety. The Company’s assessment ofthe significance of a particular input to the fair value measurement in its entirety requires judgment, andconsiders factors specific to the asset or liability. Disclosures concerning assets and liabilities measured at fairvalue are as follows (dollars in thousands):
Assets and Liabilities Measured at Fair Value on a Recurring Basis as of February 28, 2007
Quoted Pricesin Active
Markets forIdentical Assets
(Level 1)
SignificantOther
ObservableInputs(Level 2)
SignificantUnobservable
Inputs(Level 3)
Balance as ofFebruary 28,
2007
AssetsInvestment securities—available-for-sale . . . . . . . . . . . . . . . . . $2,042 — — $ 2,042Amounts due from asset securitization . . . . . . . . . . . . . . . . . . . — — $2,268,136 $2,268,136Derivative financial instruments . . . . . . . . . . . . . . . . . . . . . . . . — $39,114 — $ 39,114
LiabilitiesDerivative financial instruments . . . . . . . . . . . . . . . . . . . . . . . . — $27,243 — $ 27,243
F-68
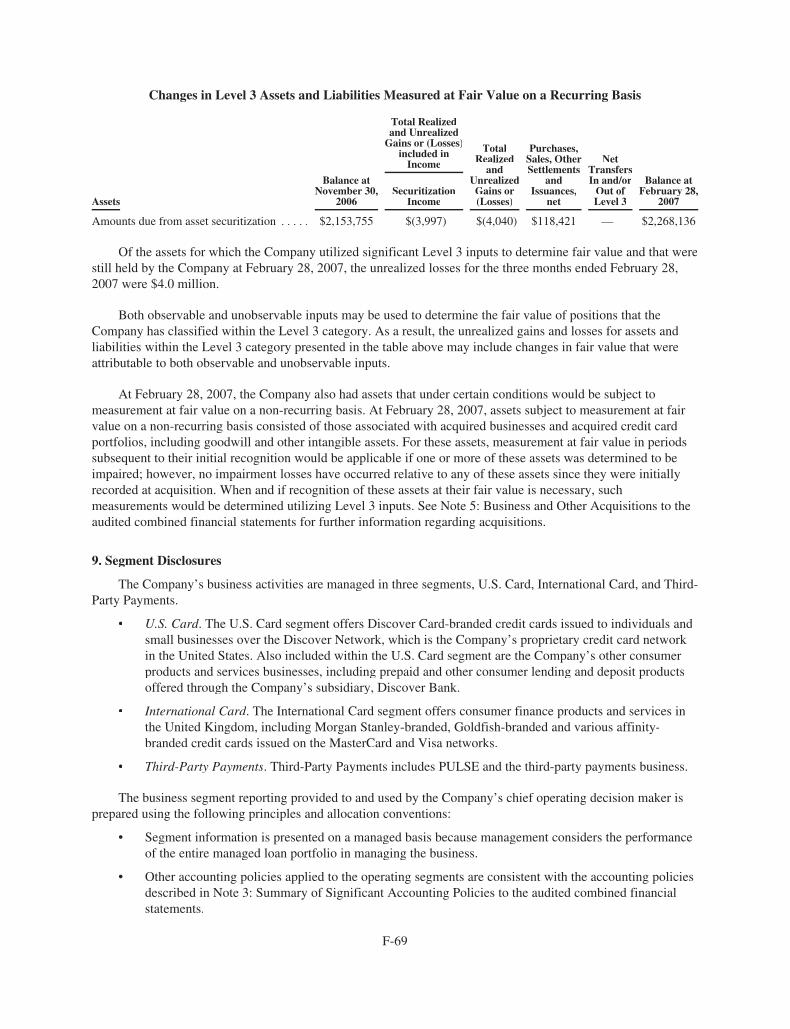
Changes in Level 3 Assets and Liabilities Measured at Fair Value on a Recurring Basis
Total Realizedand UnrealizedGains or (Losses)
included inIncome
TotalRealized
andUnrealizedGains or(Losses)
Purchases,Sales, OtherSettlements
andIssuances,
net
NetTransfersIn and/orOut ofLevel 3
Balance atFebruary 28,
2007Assets
Balance atNovember 30,
2006Securitization
Income
Amounts due from asset securitization . . . . . $2,153,755 $(3,997) $(4,040) $118,421 — $2,268,136
Of the assets for which the Company utilized significant Level 3 inputs to determine fair value and that werestill held by the Company at February 28, 2007, the unrealized losses for the three months ended February 28,2007 were $4.0 million.
Both observable and unobservable inputs may be used to determine the fair value of positions that theCompany has classified within the Level 3 category. As a result, the unrealized gains and losses for assets andliabilities within the Level 3 category presented in the table above may include changes in fair value that wereattributable to both observable and unobservable inputs.
At February 28, 2007, the Company also had assets that under certain conditions would be subject tomeasurement at fair value on a non-recurring basis. At February 28, 2007, assets subject to measurement at fairvalue on a non-recurring basis consisted of those associated with acquired businesses and acquired credit cardportfolios, including goodwill and other intangible assets. For these assets, measurement at fair value in periodssubsequent to their initial recognition would be applicable if one or more of these assets was determined to beimpaired; however, no impairment losses have occurred relative to any of these assets since they were initiallyrecorded at acquisition. When and if recognition of these assets at their fair value is necessary, suchmeasurements would be determined utilizing Level 3 inputs. See Note 5: Business and Other Acquisitions to theaudited combined financial statements for further information regarding acquisitions.
9. Segment Disclosures
The Company’s business activities are managed in three segments, U.S. Card, International Card, and Third-Party Payments.
• U.S. Card. The U.S. Card segment offers Discover Card-branded credit cards issued to individuals andsmall businesses over the Discover Network, which is the Company’s proprietary credit card networkin the United States. Also included within the U.S. Card segment are the Company’s other consumerproducts and services businesses, including prepaid and other consumer lending and deposit productsoffered through the Company’s subsidiary, Discover Bank.
• International Card. The International Card segment offers consumer finance products and services inthe United Kingdom, including Morgan Stanley-branded, Goldfish-branded and various affinity-branded credit cards issued on the MasterCard and Visa networks.
• Third-Party Payments. Third-Party Payments includes PULSE and the third-party payments business.
The business segment reporting provided to and used by the Company’s chief operating decision maker isprepared using the following principles and allocation conventions:
• Segment information is presented on a managed basis because management considers the performanceof the entire managed loan portfolio in managing the business.
• Other accounting policies applied to the operating segments are consistent with the accounting policiesdescribed in Note 3: Summary of Significant Accounting Policies to the audited combined financialstatements.
F-69

• Corporate overhead is not allocated between segments; all corporate overhead is included in the U.S.Card segment.
• Discover Network fixed marketing, servicing and infrastructure costs are retained in the U.S. Cardsegment.
• Other than the domestic and international managed receivables portfolios, which relate to the U.S. Cardand International Card segments, respectively, the assets of the Company are not allocated among theoperating segments in the information reviewed by the Company’s chief operating decision maker.
• Income taxes are not specifically allocated among the operating segments in the information reviewedby the Company’s chief operating decision maker.
Because the Company’s chief operating decision maker evaluates performance in the lending businessesusing data on a managed portfolio basis for each segment, segment information is provided here on a managedbasis.
The following table presents segment data on a managed basis (dollars in thousands):
Managed Basis GAAPBasisTotalU.S. Card
InternationalCard
Third-PartyPayments Total
SecuritizationAdjustment(1)
For the Three Months Ended February 28,2007
Interest income . . . . . . . . . . . . . . . . . $1,481,992 $117,118 $ 574 $1,599,684 $(919,379) $680,305Interest expense . . . . . . . . . . . . . . . . . 593,610 52,201 15 645,826 (361,867) 283,959
Net interest income . . . . . . . . . . . . . . 888,382 64,917 559 953,858 (557,512) 396,346Provision for loan losses . . . . . . . . . . 406,076 76,584 — 482,660 (287,274) 195,386Other income . . . . . . . . . . . . . . . . . . . 490,003 34,754 30,682 555,439 270,238 825,677Other expense . . . . . . . . . . . . . . . . . . 571,283 64,572 19,321 655,176 — 655,176
Income (loss) before income taxexpense . . . . . . . . . . . . . . . . . . . . . $ 401,026 $ (41,485) $11,920 $ 371,461 $ — $371,461
2006
Interest income . . . . . . . . . . . . . . . . . $1,397,284 $ 77,488 $ 343 $1,475,115 $(888,684) $586,431Interest expense . . . . . . . . . . . . . . . . . 503,875 35,240 13 539,128 (310,382) 228,746
Net interest income . . . . . . . . . . . . . . 893,409 42,248 330 935,987 (578,302) 357,685Provision for loan losses . . . . . . . . . . 466,573 40,631 — 507,204 (352,376) 154,828Other income . . . . . . . . . . . . . . . . . . . 600,694 35,335 27,320 663,349 225,926 889,275Other expense . . . . . . . . . . . . . . . . . . 536,894 47,754 22,587 607,235 — 607,235
Income (loss) before income taxexpense . . . . . . . . . . . . . . . . . . . . . $ 490,636 $ (10,802) $ 5,063 $ 484,897 $ — $484,897
(1) The Securitization Adjustment column presents the effect of loan securitization by recharacterizing as securitization income the portionsof the following items that relate to the securitized loans: interest income, interest expense, provision for loan losses, discount andinterchange revenue and loan fee revenues. Securitization income is reported in other income.
10. Related Party Transactions
Morgan Stanley provides a variety of products and services to the Company or on the Company’s behalf andthe Company provides certain products and services to Morgan Stanley.
The Company provided corporate card services to Morgan Stanley. The outstanding related balances ofwhich are included in credit card loan receivables were $13.3 million and $14.4 million at February 28, 2007 andNovember 30, 2006, respectively.
F-70

In the ordinary course of business, the Company offers consumer loan products to its directors, executiveofficers and certain members of their immediate families. These products are offered on substantially the sameterms as those prevailing at the time for comparable transactions with unrelated parties, and these receivables areincluded in the loan receivables in the Company’s combined statements of financial condition. They were notmaterial to the Company’s financial position or results of operations.
In 2006, the Company began purchasing Federal Funds from Morgan Stanley Bank. For the three monthsended February 28, 2007 interest expense on Federal Funds purchased from Morgan Stanley Bank was $29.5million. There was no interest expense on Federal Funds purchased from Morgan Stanley Bank for the threemonths ended February 28, 2006. At February 28, 2007, there were no Federal Funds purchased from MorganStanley Bank. At November 30, 2006, the balance payable to Morgan Stanley Bank was $3.0 billion.
In 2006, the Company began participating in the Morgan Stanley Global Wealth Management Bank DepositProgram launched by Morgan Stanley DW Inc. (“MSDW”). Under the program, MSDW sweeps excess clientcash into interest bearing deposit accounts at FDIC-insured banks participating in the program. For the threemonths ended February 28, 2007, the Company paid servicing and administrative fees to MSDW of $7.4 million.There were no servicing and administrative fees to MSDW for the three months ended February 28, 2006. AtFebruary 28, 2007 and November 30, 2006, the outstanding interest bearing deposit balance related to theMorgan Stanley Global Wealth Management Bank Deposit Program was $2.6 billion and $1.9 billion,respectively.
The Company paid brokerage commissions to Morgan Stanley for the sale of certificates of deposit. Thesecommissions totaled $12.2 million and $.4 million for the three months ended February 28, 2007 and 2006respectively, and are amortized to interest expense over the lives of the related certificates of deposit. For thethree months ended February 28, 2007 and November 30, 2006, unamortized prepaid commissions on thesecertificates of deposit were $35.0 million and $29.2 million, respectively, and are included in other assets in thecombined statement of condition. Amortization of the prepaid commissions was $6.5 million and $7.9 million forthe three months ended February 28, 2007 and 2006 respectively.
The Company had short-term and long-term debt obligations to Morgan Stanley as outlined in Note 4:Short-term Borrowings herein and Note 14: Long-term Borrowings to the audited combined financial statements.
The Company paid $0.6 million in brokerage commissions to Morgan Stanley for the sale of bank notes in2004. These commissions are amortized to interest expense over the life of the note. Prepaid commissions totaled$239 thousand and $269 thousand at February 28, 2007 and November 30, 2006, respectively, and are includedin other assets in the combined statements of financial condition.
For the three months ended February 28, 2007 and 2006, the Company paid underwriting fees on credit cardsecuritizations to Morgan Stanley of $2.1 million and $7.5 million, respectively. Amortization of suchunderwriting fees was $2.3 million for both comparative periods. Deferred underwriting fees associated withthese expenses were $19.3 million and $19.6 million, at February 28, 2007 and November 30, 2006, respectively,and are included in other assets in the combined statements of financial condition.
At February 28, 2007 and November 30, 2006, the Company recorded $205.6 million and $171.6 million,respectively, in accrued expenses and other liabilities for non-interest bearing amounts payable to MorganStanley for expenses paid by Morgan Stanley on behalf of the Company including, but not limited to accruedinterest payables, 401(k) matching, amortization of compensation cost related to restricted stock grants, taxbenefits for exercised stock options and fees for management of the Morgan Stanley Global Wealth ManagementBank Deposit Program.
The Company has outstanding certain interest rate swap contracts with Morgan Stanley Capital ServicesInc., a wholly-owned direct subsidiary of Morgan Stanley, which serves as Morgan Stanley’s principal U.S.
F-71

swaps dealer. The Company entered into each contract in the ordinary course of business, to hedge interest raterisks as part of its interest rate risk management program and under terms consistent with those that would havebeen offered to an unrelated third- party. See Note 8: Fair Value Disclosures herein for more informationconcerning the Company’s interest rate swap contracts with Morgan Stanley.
For the three months ended February 28, 2007 and 2006, the Company sold $16.3 million and $97.2 million,respectively, of mortgage loans to MSCC. The gains recognized on these sales for the three months endedFebruary 28, 2007 and 2006 were $.4 million and $2.1 million, respectively. In most instances, these loans, whenoriginated, are recorded in loans held for sale until sold. At February 28, 2007 and November 30, 2006, mortgageloans held for sale that were subsequently sold to MSCC were $2.7 million and $3.7 million, respectively.
MSCC provides transaction processing and other support services related to consumer loan products offeredby the Company. The costs of providing these services are included in information processing and othercommunications and amounted to $1.0 million and $2.1 million for the three months ended February 28, 2007and 2006, respectively.
For the three months ended February 28, 2006, the Company recorded $2.6 million for professional fees forservices provided by Morgan Stanley for investment banking fees for acquisition-related costs of the Goldfishacquisition.
For the three months ended February 28, 2007 and 2006, the Company received $1.3 million and $1.2million, respectively, in sublease rental income from Morgan Stanley. Morgan Stanley maintains offices at threelocations, the values of which are recorded in premises and equipment, net: Riverwoods, Illinois; New Albany,Ohio; and West Valley City, Utah. At February 28, 2007, the Company had future sublease rental commitmentsfrom Morgan Stanley of $4.5 million that expire at various dates through 2009.
For the three months ended February 28, 2007 and 2006, the Company recorded $1.2 million and $1.1million, respectively, in rent expense for subleasing office space from Morgan Stanley in London, England andGlasgow, Scotland. Management expects the Company to be continuing leasing these properties from MorganStanley for a period of time following the Distribution, the terms of which are still being negotiated between thetwo companies.
For the three months ended February 28, 2007 and 2006, the Company recorded $20.8 million and $29.0million, respectively, in expense related to Morgan Stanley expense allocations. As a subsidiary of MorganStanley, the Company was charged for certain corporate functions such as Company IT, Company Management,Finance, Legal and Compliance and Strategy, Administration and other, including allocations from the Companyto Morgan Stanley and its affiliates. The primary allocation methodologies utilized by Morgan Stanley includedlevel of support, headcount and a formula that considered revenues, expenses and capital. Each corporatefunction separately determined the methodology to employ for their allocable expenses. Pursuant to theDistribution from Morgan Stanley, the Company will enter into certain transitional services agreements withMorgan Stanley to continue to obtain certain of these corporate services for a period of up to eighteen months atprices negotiated between the two companies.
F-72

The table below summarizes intercompany expense allocations by functional area(1) (dollars in thousands):
For the Three MonthsEnded February 28,
2007 2006
Company IT . . . . . . . . . . . . . . . . . . . . . . . . . . . . . . . . . . . . . . . . . . . . . . . $ 1,450 $ 1,471Company Management(2) . . . . . . . . . . . . . . . . . . . . . . . . . . . . . . . . . . . . . 5,448 15,393Finance . . . . . . . . . . . . . . . . . . . . . . . . . . . . . . . . . . . . . . . . . . . . . . . . . . . 5,384 5,004Legal and Compliance . . . . . . . . . . . . . . . . . . . . . . . . . . . . . . . . . . . . . . . 2,425 2,048Strategy, Administration and other . . . . . . . . . . . . . . . . . . . . . . . . . . . . . . 6,086 5,079
Total Morgan Stanley allocations . . . . . . . . . . . . . . . . . . . . . . . . . . . $20,793 $28,995
(1) Allocations based on percentage of total expenses of each functional area versus line item specific allocations. Majority of allocationsrelates to compensation expense.
(2) Represents allocations of Morgan Stanley senior management costs.
During the second quarter of 2007, the Company reclassified the intercompany expense allocations,previously all of which were a component of “other” within other expense, to the following line items (dollars inthousands):
For the Three MonthsEnded February 28,
2007 2006
Employee compensation and benefits . . . . . . . . . . . . . . . . . . . . . . . . . . . . . . . . . $12,891 $17,397Marketing and business development . . . . . . . . . . . . . . . . . . . . . . . . . . . . . . . . . 624 870Information processing and communications . . . . . . . . . . . . . . . . . . . . . . . . . . . 1,248 1,450Professional fees . . . . . . . . . . . . . . . . . . . . . . . . . . . . . . . . . . . . . . . . . . . . . . . . . 3,119 4,349Premises and equipment . . . . . . . . . . . . . . . . . . . . . . . . . . . . . . . . . . . . . . . . . . . 2,287 3,189Other . . . . . . . . . . . . . . . . . . . . . . . . . . . . . . . . . . . . . . . . . . . . . . . . . . . . . . . . . . 624 1,740
Total Morgan Stanley allocations . . . . . . . . . . . . . . . . . . . . . . . . . . . . . . . . $20,793 $28,995
At February 28, 2007 and November 30, 2006, accrued expenses and other liabilities included federal andstate income taxes due to Morgan Stanley of $148.0 million and due from Morgan Stanley of $19.8 million,respectively. At February 28, 2007 and November 30, 2006, other assets included $1.8 million and $2.4 millionof interest due from Morgan Stanley related to the settlement of various tax matters.
The Company paid dividends to Morgan Stanley during the three months ended February 28, 2007 andNovember 30, 2006 of $500 million in each period.
The Company receives an allocation of capital from Morgan Stanley to maintain a level of capital thatmanagement believes is appropriate to support its U.K. business. At February 28, 2007 and November 30, 2006,capital allocated to the Company from Morgan Stanley was $21.6 million and $512.9 million, respectively. Theseamounts are reflected as contributions from Morgan Stanley in the unaudited condensed combined statements ofcash flows.
At February 28, 2007, there were contracts outstanding with third parties in which Morgan Stanleyguaranteed the performance of certain subsidiaries of the Company to specific counterparties, specificallyinvolving payment by Morgan Stanley to the counterparty in the event of default by the Company’s subsidiaries.These arrangements with counterparties are expected to be terminated or replaced prior to the Distribution.
At February 28, 2007 and November 30, 2006, accrued expenses and other liabilities included federal andstate income taxes due to Morgan Stanley of $148.0 million and due from Morgan Stanley of $19.8 million,respectively. At February 28, 2007 and November 30, 2006, other assets included $1.8 million and $2.4 millionof interest due from Morgan Stanley related to the settlement of various tax matters.
F-73

The Company paid dividends to Morgan Stanley during the three months ended February 28, 2007 andNovember 30, 2006 of $500 million in each period.
The Company receives an allocation of capital from Morgan Stanley to maintain a level of capital thatmanagement believes is appropriate to support its U.K. business. At February 28, 2007 and November 30, 2006,capital allocated to the Company from Morgan Stanley was $21.6 million and $512.9 million, respectively. Theseamounts are reflected as contributions from Morgan Stanley in the unaudited condensed combined statements ofcash flows.
At February 28, 2007, there were contracts outstanding with third parties in which Morgan Stanleyguaranteed the performance of certain subsidiaries of the Company to specific counterparties, specificallyinvolving payment by Morgan Stanley to the counterparty in the event of default by the Company’s subsidiaries.These arrangements with counterparties are expected to be terminated or replaced prior to the Distribution.
F-74