global imbalances or why are the poor financing the...
TRANSCRIPT

Global Imbalances or Why are the Poor financing the Rich?
Raghuram Rajan
Outline
Much has been written about global imbalances and the paradox of the poor (China) financing the rich (USA).Is this “bad”? With the world awash with capital, should developing countries not attempt to attract more of it to grow faster?Traditional view
Poor countries are starved of capital
Marginal productivity of capital should be high
Opening up to foreign capital should increase investments and increase their growth rates.
Outline contdImplications
Capital should flow from rich to poor countriesAmongst poor countries, capital should flow to the most productive
Also, for poor countries
Capital inflow should be strongly positively correlated with growth (and investment)
Is this happening? No!Why not?
Facts
Capital not flowing more to poor countries over time as they improve their financial systems. Flow reversing in recent times.
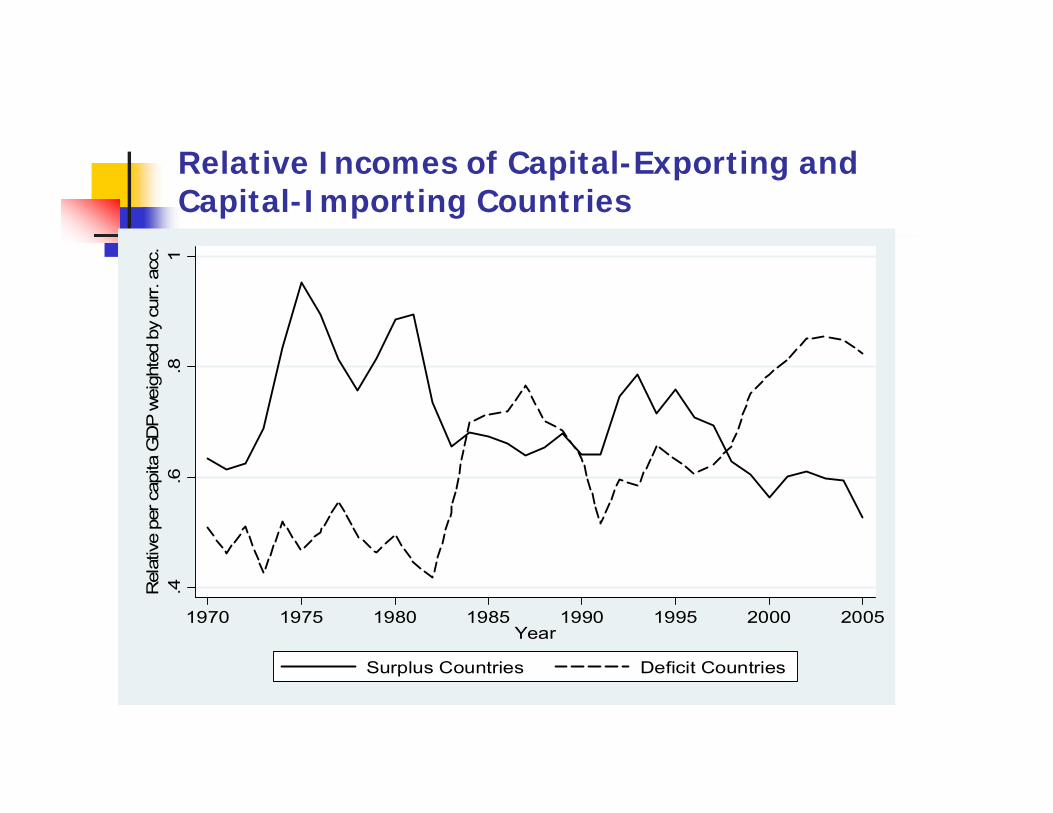
Relative Incomes of Capital-Exporting and Capital-Importing Countries
.4.6
.81
Rel
ativ
e pe
r cap
ita G
DP
wei
ghte
d by
cur
r. ac
c.
1970 1975 1980 1985 1990 1995 2000 2005Year
Surplus Countries Deficit Countries
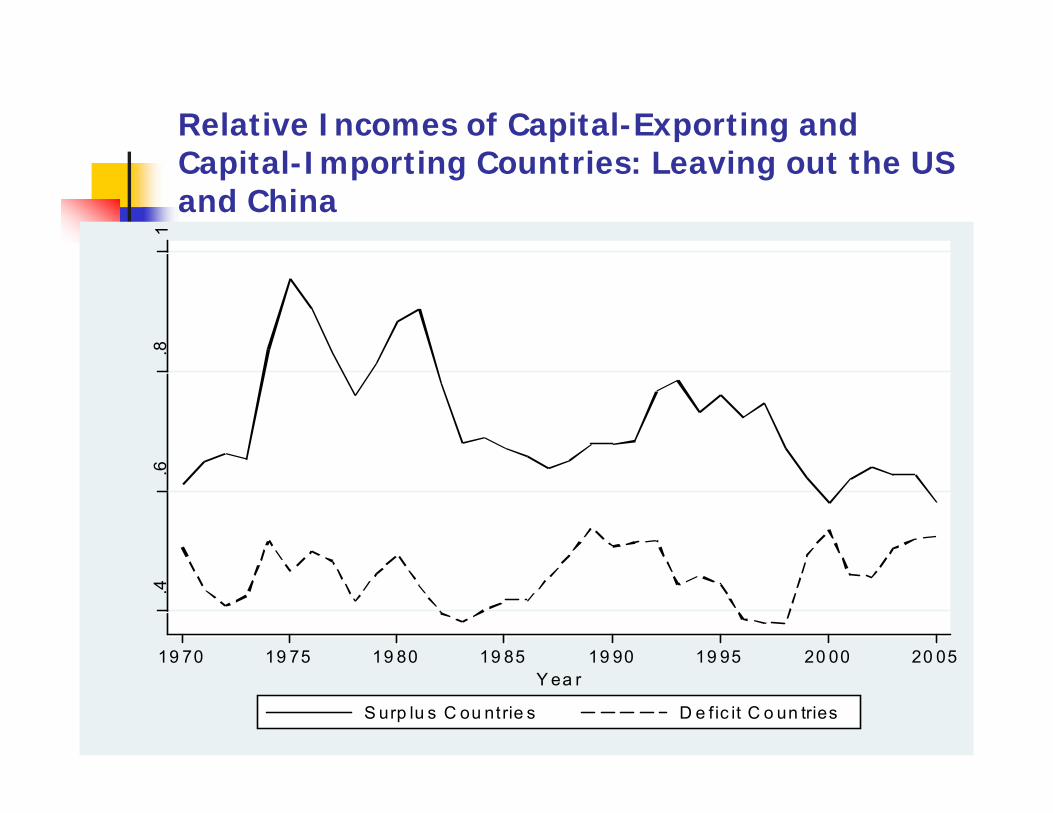
Relative Incomes of Capital-Exporting and Capital-Importing Countries: Leaving out the US and China
.4.6
.81
19 70 19 75 19 80 19 85 19 90 19 95 20 00 20 05Y ea r
S urp lu s C ou ntrie s D e fic it C o un tries
Facts contd.
Amongst the poor countries, capital has not flowed to the fastest growing amongst them (“Allocation paradox”:
Gourinchas and Jeanne, 2006).Capital inflow measured by CA deficit
= Domestic Investment-Domestic Savings= Amount financed from abroad
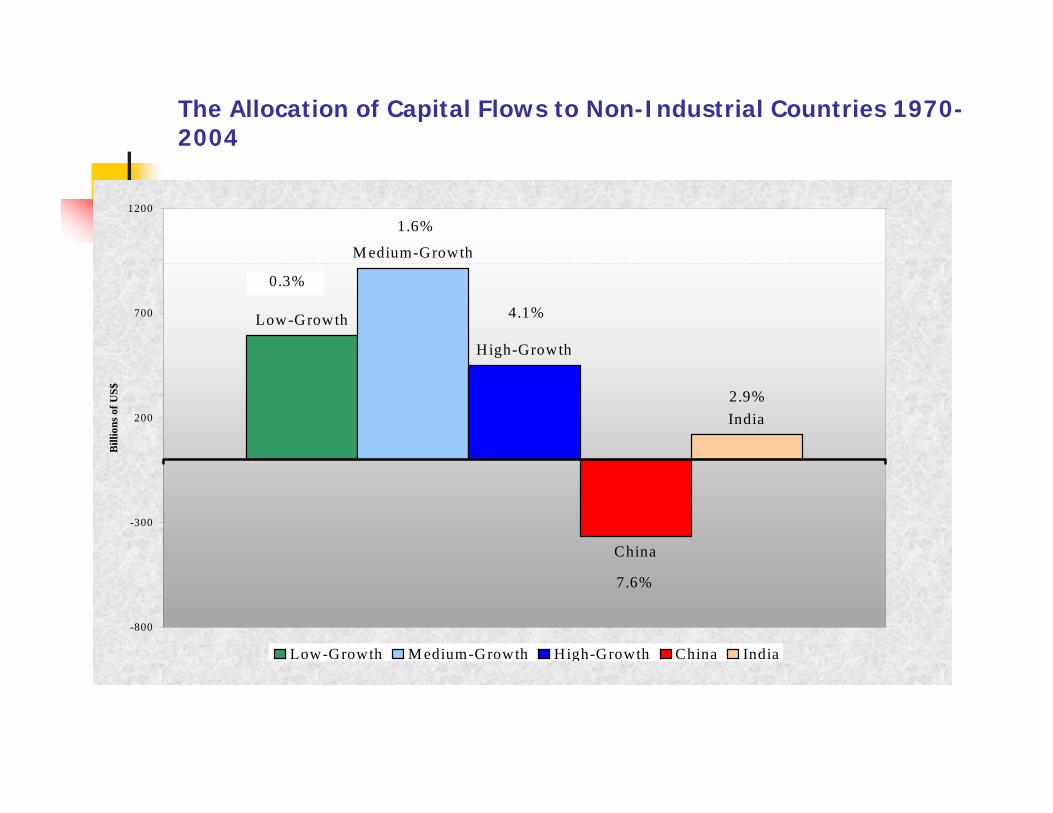
The Allocation of Capital Flows to Non-Industrial Countries 1970-2004
Low-Growth
M edium-Growth
High-Growth
China
India
-800
-300
200
700
1200
Bill
ions
of U
S$
Low-Growth M edium-Growth High-Growth China India
0.3%
1.6%
4.1%
7.6%
2.9%
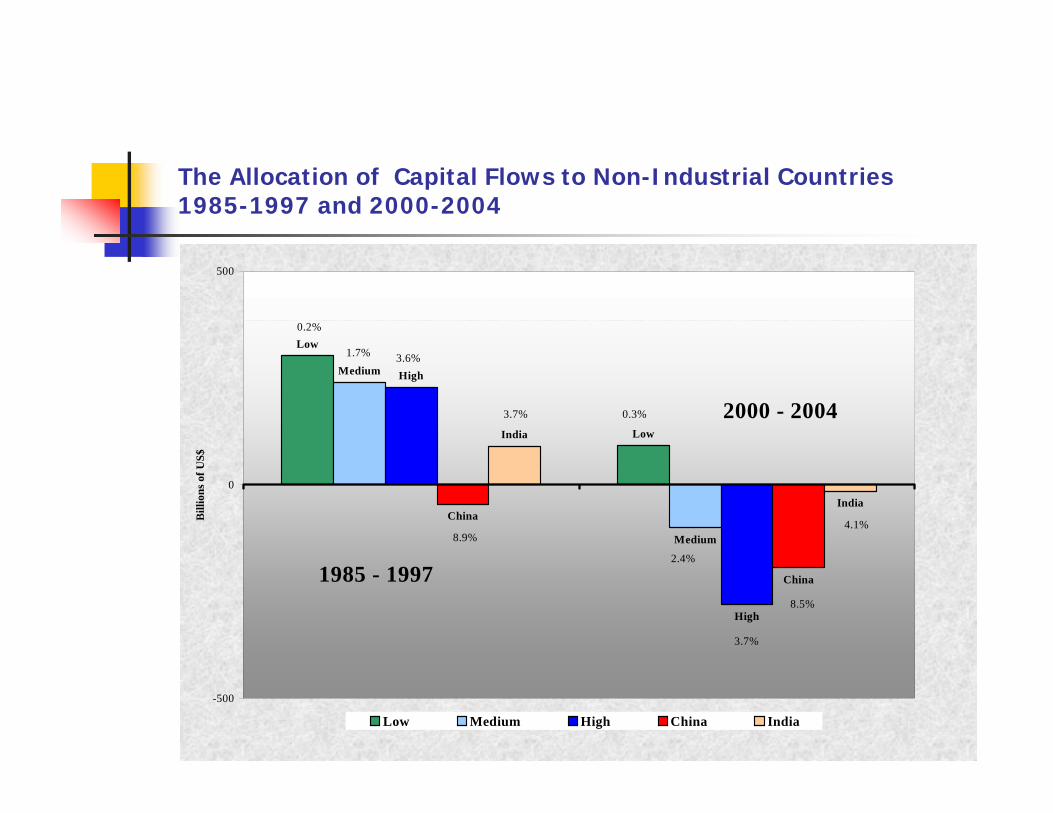
The Allocation of Capital Flows to Non-Industrial Countries1985-1997 and 2000-2004
Low
Low
Medium
Medium
High
High
China
China
India
India
-500
0
500
Bill
ions
of U
S$
Low Medium High China India
1985 - 1997
2000 - 2004
0.2%
1.7% 3.6%
8.9%
3.7% 0.3%
2.4%
3.7%
8.5%
4.1%
Not all capital flows have followed the same pattern
FDI has behaved differently in the past, going to the fastest growing countries.Even this has reversed in recent years.
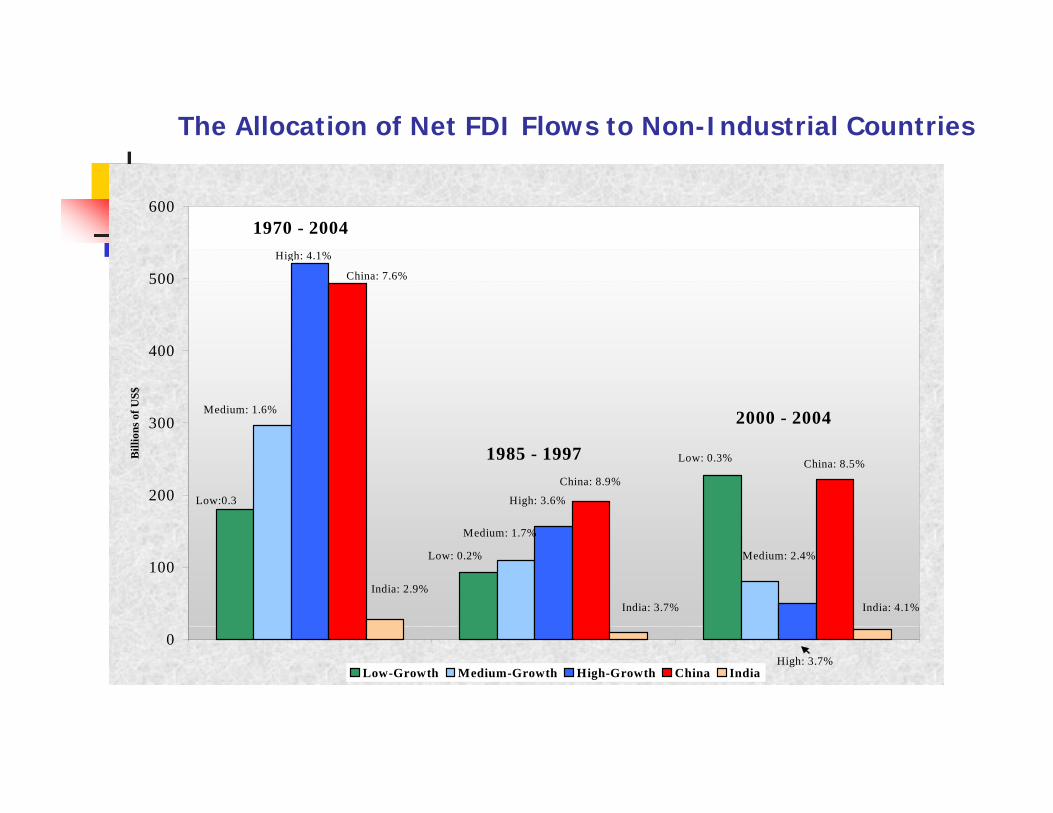
The Allocation of Net FDI Flows to Non-Industrial Countries
0
100
200
300
400
500
600
Bill
ions
of U
S$
Low-Growth Medium-Growth High-Growth China India
1970 - 2004
1985 - 1997
2000 - 2004
Low:0.3
Medium: 1.6%
High: 4.1%
China: 7.6%
India: 2.9%
Low: 0.2%
Medium: 1.7%
High: 3.6%
China: 8.9%
India: 3.7%
Low: 0.3%
Medium: 2.4%
High: 3.7%
China: 8.5%
India: 4.1%
Facts contd.
Non-industrial countries that have utilized the most foreign capital have tended to grow more slowly.
Not just a recent phenomenon.

Correlation Between average Growth and the average Current Account Balance, non-industrial countries, 1970-2004
DZA
ARG
BGD
BOL
BRA
CMR
CHL
CHN
COLCRI
CYP
CIV
DOM
ECU
EGY
SLV
ETH
GHA
GTM HTIHND
IND
IDN
IRN
ISR
JAM
JORKEN
KOR
MDG
MWI
MYS
MLI
MUS
MEXMAR
NGA
PAKPAN
PRY
PER
PHLRWA
SEN
SLE
ZAF
LKA
TZA
THA
TTO
TUN
TUR
UGA
URY
VENZMBZWE
-20
24
68
Per
cap
ita G
DP
grow
th
-10 -5 0 5Average current account balance to gdp
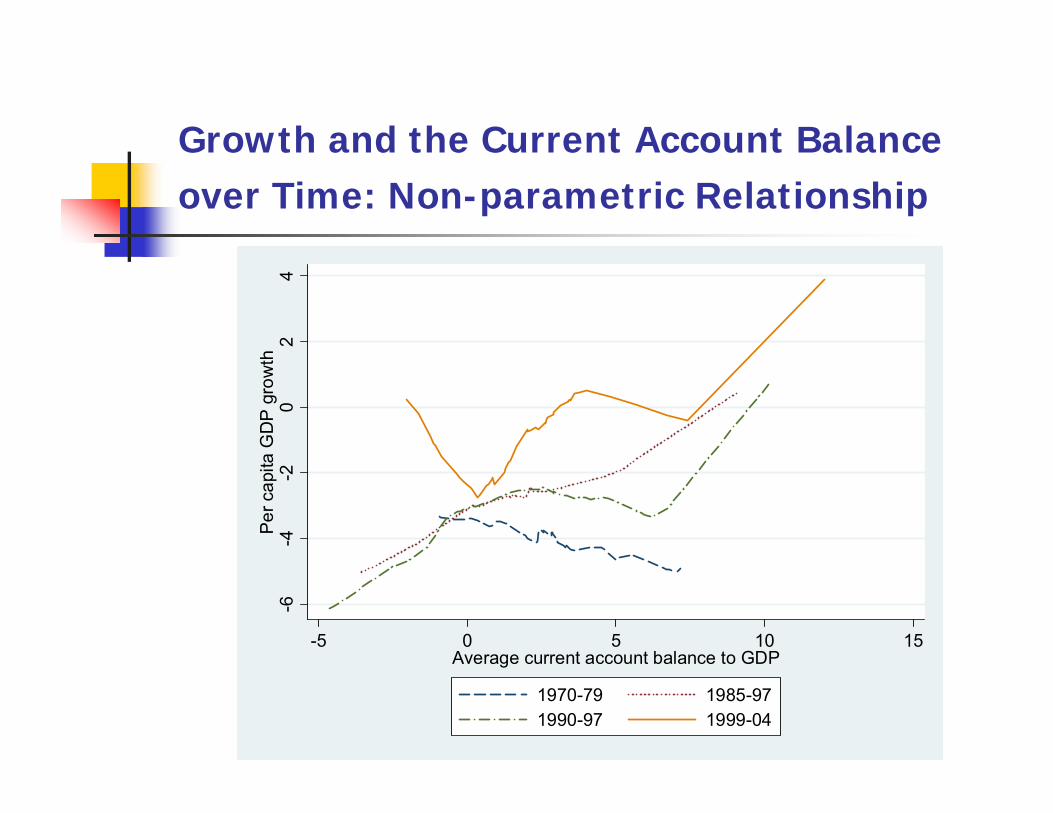
Growth and the Current Account Balance over Time: Non-parametric Relationship
-6-4
-20
24
Per
cap
ita G
DP
gro
wth
-5 0 5 10 15Average current account balance to GDP
1970-79 1985-971990-97 1999-04
Facts contd.
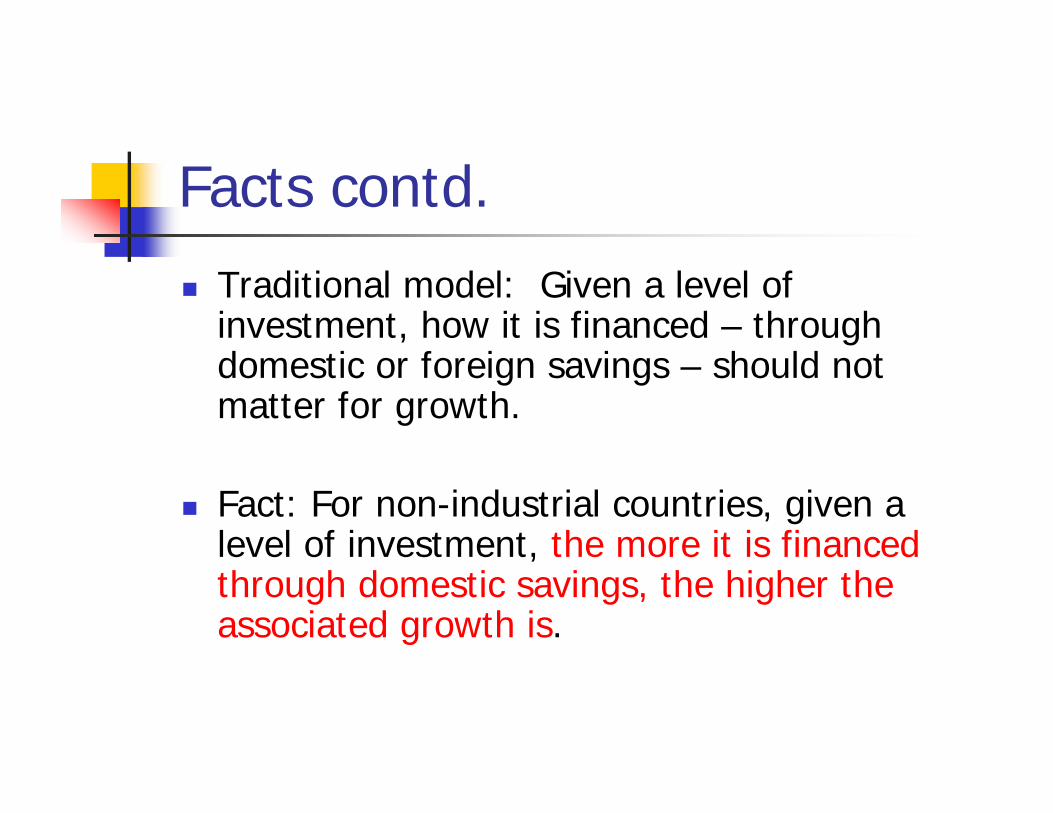
Traditional model: Given a level of investment, how it is financed – through domestic or foreign savings – should not matter for growth.
Fact: For non-industrial countries, given a level of investment, the more it is financed through domestic savings, the higher the associated growth is.

Above Median
Below Median
Below Median
Above Median
0.00
1.00
2.00
3.00
Ave
rage
Per
Cap
ita G
DP
Gro
wth
Investment/GDP
Current Account/GDP
Figure 6. Current Accounts, Investment and Growth in Developing Countries
Summarizing the facts
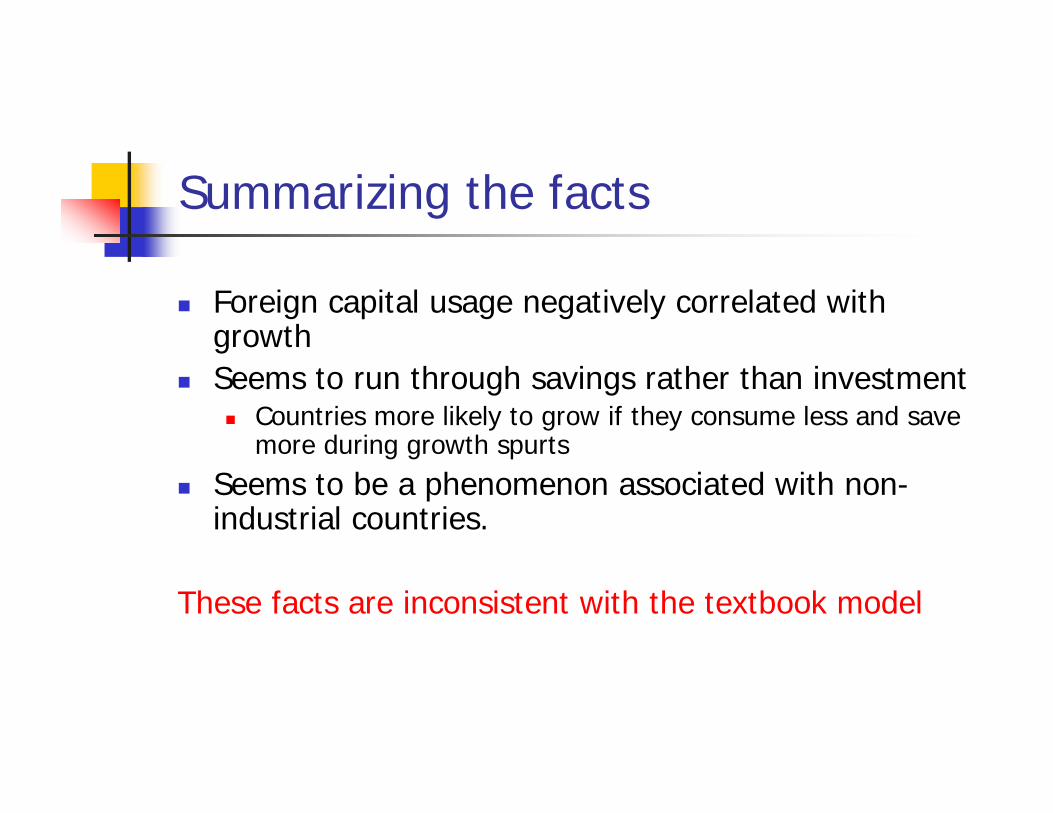
Foreign capital usage negatively correlated with growthSeems to run through savings rather than investment
Countries more likely to grow if they consume less and save more during growth spurts
Seems to be a phenomenon associated with non-industrial countries.
These facts are inconsistent with the textbook model
So what explains the facts?
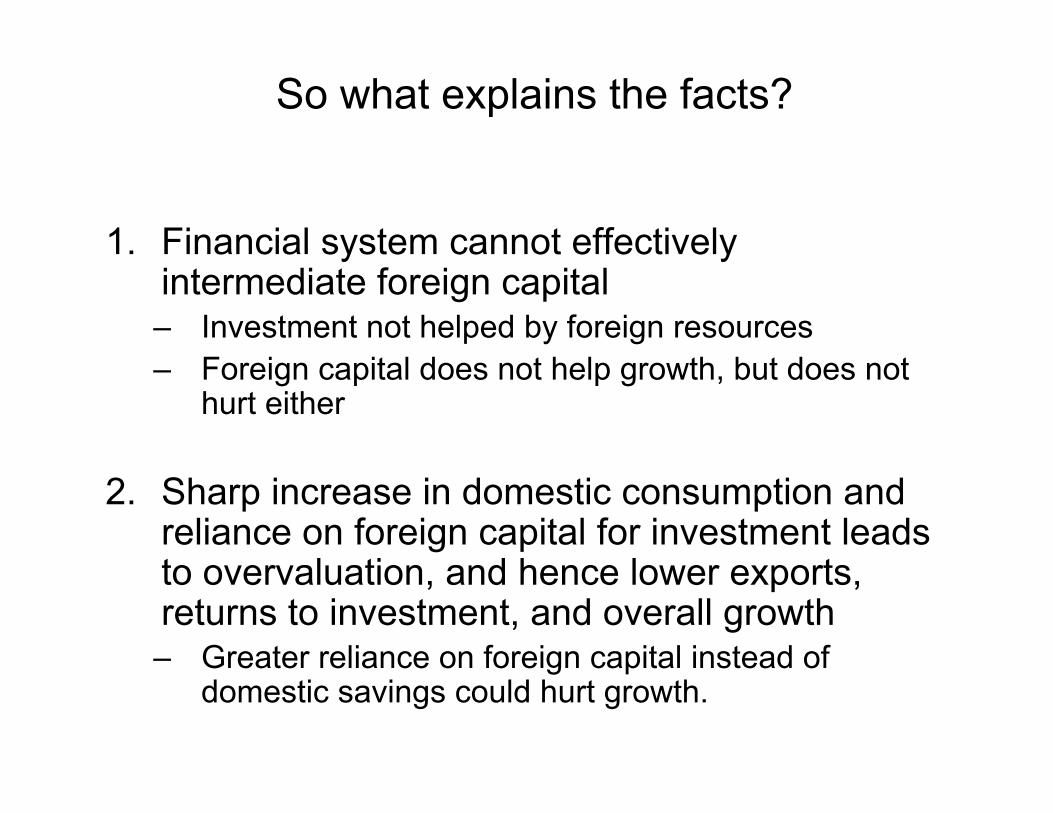
1. Financial system cannot effectively intermediate foreign capital– Investment not helped by foreign resources – Foreign capital does not help growth, but does not
hurt either
2. Sharp increase in domestic consumption and reliance on foreign capital for investment leads to overvaluation, and hence lower exports, returns to investment, and overall growth– Greater reliance on foreign capital instead of
domestic savings could hurt growth.
Testing Explanation 1: The Financial Development Channel
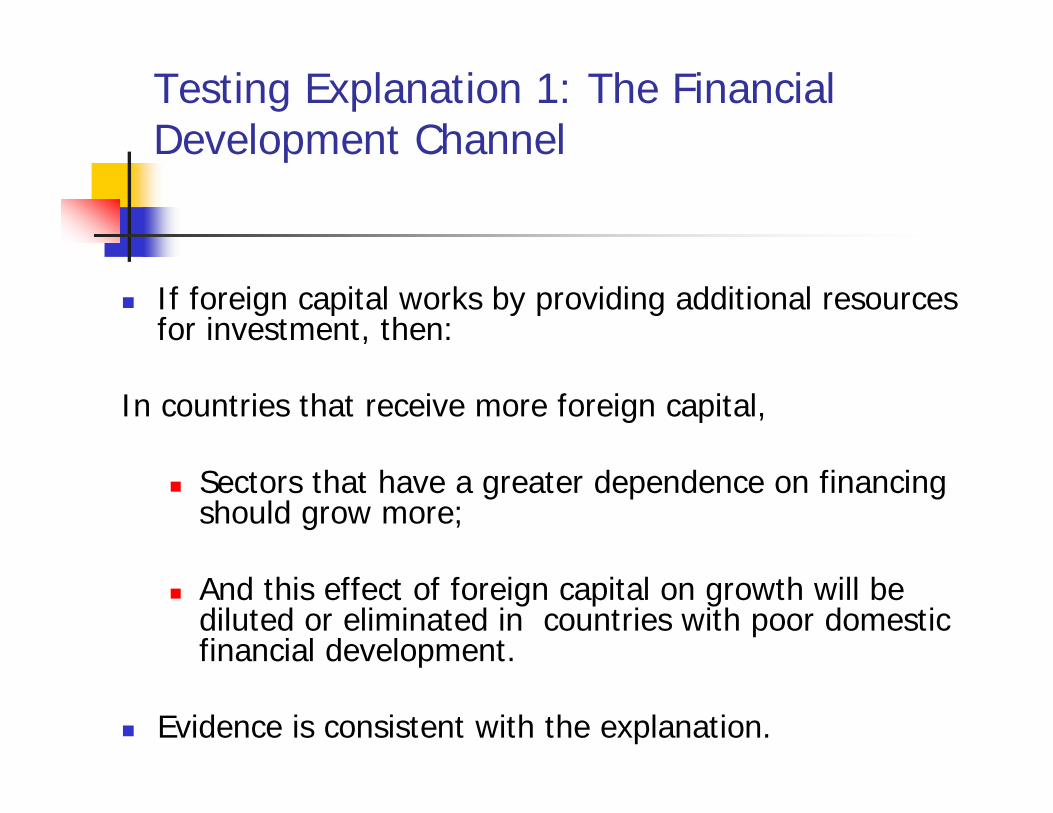
If foreign capital works by providing additional resources for investment, then:
In countries that receive more foreign capital,
Sectors that have a greater dependence on financing should grow more;
And this effect of foreign capital on growth will be diluted or eliminated in countries with poor domestic financial development.
Evidence is consistent with the explanation.
Explanation 2: Foreign Capital, Overvaluation and Growth
Too much domestic consumption leads to excessive reliance on foreign capital inflows, in order to finance investment.This leads to overvaluation and slower growth.
Three pieces of evidence:
Reliance on foreign capital→OvervaluationOvervaluation→Lower overall growthPossible channel from overvaluation to overall growth is manufacturing exports
Export intensive industries tend to grow slower in countries with overvalued exchange rates.
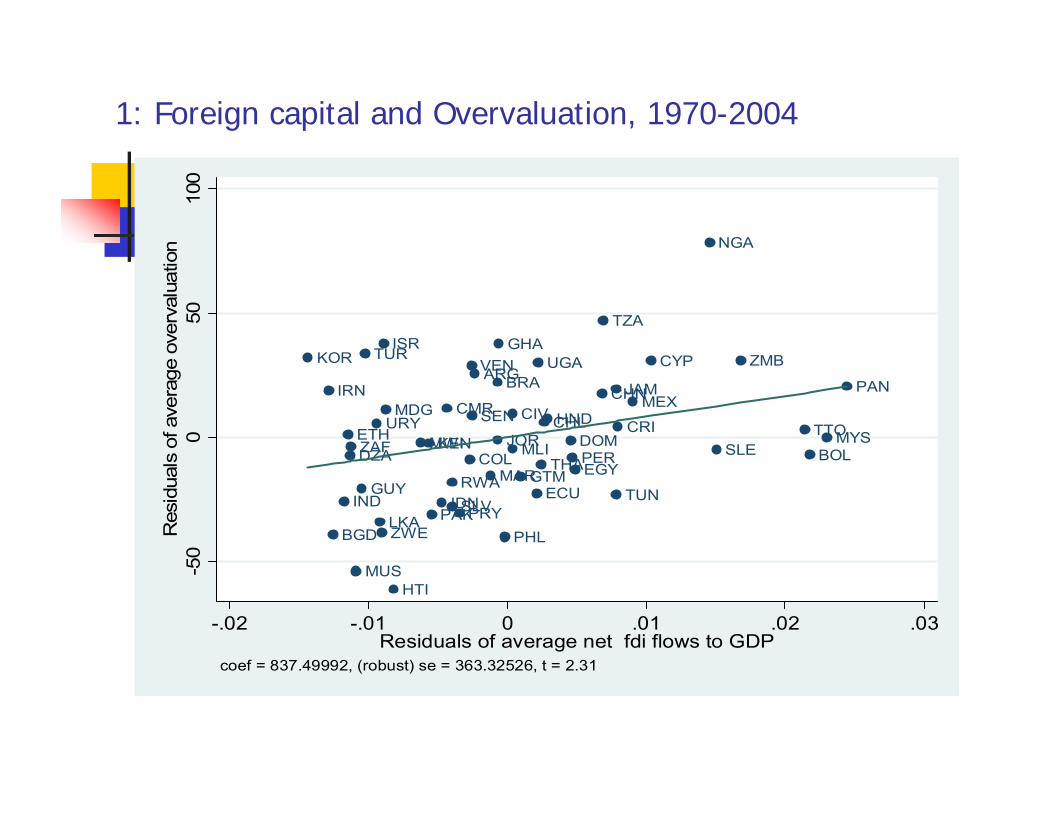
1: Foreign capital and Overvaluation, 1970-2004
KOR
IRN
BGD
IND
ETHDZAZAF
MUS
GUY
TUR
URY
LKAZWE
ISR
MDG
HTI
MWIKEN
PAKIDN
CMR
SLVRWA
PRY
COL
VEN
SEN
ARG
MAR
BRA
JOR
GHA
PHL
CIV
MLI
GTMECU
UGA
THA
CHLHNDDOMPEREGY
CHN
TZA
JAM
TUN
CRI
MEX
CYP
NGA
SLE
ZMB
TTO
BOLMYS
PAN
-50
050
100
Res
idua
ls o
f ave
rage
ove
rval
uatio
n
-.02 -.01 0 .01 .02 .03Residuals of average net fdi flows to GDP
coef = 837.49992, (robust) se = 363.32526, t = 2.31
Conclusions
Foreign capital, as a form of net financing, does not play much of a role in the growth of non-industrial countries, while it does play a role in industrial countries Our explanation: Non-industrial countries may have limited ability to absorb it
Financial sector may not be able to allocate arm’s length capital.Countries may be more prone to exchange rate overvaluation.

Given absorptive capacity, not necessarily a bad thing if capital flows from poor to rich countriesThis does not necessarily mean developing countries should closethemselves to capital flows – foreign capital could play a role in enhancing absorptive capacity.
Collateral benefitsIt does suggest, though, a greater focus on enhancing absorptivecapacity.
Enhancing the capacity of the domestic financial system.Financial infrastructure
Information acquisition and sharingInstitutions to enhance reliabilityLaws and enforcement
Enhancing other forms of domestic capacity – e.g., domestic savings and domestic human capital
Perhaps not a coincidence that rise of global imbalances has been accompanied by strong world growth. But nothing can go on forever!