global humanitarian assistance aid investments in disaster...
TRANSCRIPT

1
| Global Humanitarian Assistance
Aid investments in disaster risk reduction - rhetoric to action
Briefing Paper By Dan Sparks October 2012

2
Contents
Introduction ............................................................................................................................................ 1
Increasing focus on DRR ...................................................................................................................... 1
From rhetoric and policy to action and investment ........................................................................... 5
Donor spending on DRR ...................................................................................................................... 6
DRR funding by OECD DAC donors 2006–10 ...................................................................................... 6
Tracking DRR within international ODA .............................................................................................. 6
DAC donor spending on disaster prevention and preparedness within humanitarian aid ................ 7
DAC donor government spending on DRR reaching 10% of humanitarian budgets .......................... 9
DAC donor government DRR spending in development aid ............................................................. 11
DAC donor spending reaching 1% of development spending .......................................................... 12
The sectors within which DRR falls in donor governments’ development spending ....................... 14
Top recipients of DAC government DRR ........................................................................................... 18
Summary: Are donors investing sufficiently in DRR? ............................................................................ 20
Annex 1: Methodology for tracking DRR in the OECD DAC CRS ........................................................... 22

P a g e | 1
Aid investments in disaster risk reduction –rhetoric to action
Introduction Disaster risk reduction (DRR) is high on the policy agendas of many government donors of official
development assistance (ODA), often in conjunction with concerns around increasing investments in
emergency preparedness, climate change adaptation and the broader aspiration of building
resilience to shocks. This comes at a time when the incidence of natural disasters related to climate
change is on the up. At the same time, the impact of disasters in an increasingly populous, urban,
and globally interdependent world is set to become ever more wide-ranging and difficult to deal
with. However, there is downward pressure on many aid budgets, and the need to extract more
value from aid dollars.
In March 2012, the Global Humanitarian Assistance (GHA) programme published ‘Disaster risk
reduction: Spending where it should count’, which examined the levels of donor investment in DRR.
The report found that despite the rhetoric, just 1% (US$3.7 billion) of total ODA had been spent on
DRR in 40 of the world’s poorest and most disaster-affected countries.
Using the latest available data, this briefing paper continues this analysis of ODA investments in DRR
in the period immediately following the United Nations’ (UN) 2005 Hyogo Framework for Action
(HFA), and looks in detail at the policies and investment profiles of 241 of the leading ODA donors.
The research suggests that despite positive inroads made in promoting DRR on the global agenda,
the majority of donors are still failing to allocate significant proportions of their aid budgets to DRR.
Increasing focus on DRR Reducing risk has become an increasingly common element of donor policy following the adoption
of the HFA at the UN’s World Conference on Disaster Reduction in Kobe, Hyogo, Japan in January
2005, just three weeks after the Indian Ocean tsunami. The HFA was endorsed by 168 countries as a
strategic blueprint for the guidance of national and international efforts to reduce vulnerabilities and
risks induced by naturally-occurring hazards and man-made processes.
Following the HFA, a number of countries have written specific policy documents focusing on DRR.
Others now recognise DRR within their most recent development and humanitarian policies, and
1 This includes the 23 countries that are members of the Organisation for Economic Co-operation and
Development (OECD) Development Assistance Committee (Australia, Austria, Belgium, Canada, Denmark, Finland, France, Germany, Greece, Ireland, Italy, Japan, Korea, Luxembourg, Netherlands, New Zealand, Norway, Portugal, Spain, Switzerland, UK and the US) plus the European Institutions.

P a g e | 2
many have expressed their support at the UN International Strategy of Disaster Reduction’s
(UNISDR) three Global Platforms for Disaster Reduction (in 2007, 2009 and 2011).2 Many
governments have also demonstrated their financial support to the two main international bodies
on DRR, namely the UNISDR and the World Bank’s Global Facility for Disaster Reduction and
Recovery (GFDRR).
2 The main forum for continued and concerted emphasis on disaster reduction, providing strategic guidance and coherence for
implementing the Hyogo Framework, and for sharing experiences and expertise among all its stakeholders.
The implementation of and follow-up to the strategic goals and priorities for action set out in this
Framework for Action should be addressed by different stakeholders in a multi-sectoral approach,
including the development sector. States and regional and international organizations, including the UN
and international financial institutions, are called upon to integrate disaster risk reduction considerations
into their sustainable development policy, planning and programming at all levels. Civil society, including
volunteers and community-based organizations, the scientific community and the private sector are vital
stakeholders in supporting the implementation of disaster risk reduction at all levels.
(Hyogo Framework for Action, 2005–15)

P a g e | 3
Figure 1: Key donor actions relating to DRR following the Hyogo Framework for Action Donor Endorsed
HFA
Global Platform for
DRR statement of
support issued
Financial support
to UNISDR
2006–10
Financial
support to
GFDRR
2006–11
DRR-
specific
policy
Key action since HFA
Australia Yes Yes Yes Yes Yes Developed DRR policy ‘Investing in a Safer Future: A Disaster Risk Reduction Policy for the
Australian Aid Programme’ (2009)
Austria Yes No No No No Mentioned in current humanitarian policy
Belgium Yes No No No No Mentioned in current humanitarian policy
Canada Yes Yes Yes Yes No Financial support to UNISDR and key supporter of Caribbean Catastrophe Risk Insurance Facility
Denmark Yes Yes Yes Yes Yes Developed guidelines for DRR in Development and Humanitarian Assistance (2007)
EU
institutions
Yes Yes Yes Yes Yes DRR strongly featured in recent communication focussing on the EU’s approach to resilience ‘EU
approach to resilience: learning from food security crises’ (2012)
Finland Yes Yes Yes No No Promotes integration of risk management and emergency preparedness in aid policy
France Yes Yes Yes Yes No Expressed support of DRR during 2011 Global Platform, particularly around preparing for mega-
disasters
Germany Yes Yes Yes Yes Yes Created the German Committee for Disaster Reduction, which developed guidelines for DRR
initiatives and served as the German HFA focal point institution in 2011
Greece Yes No No No No Unknown
Ireland Yes No Yes Yes No Mentioned in current humanitarian policy
Italy Yes Yes Yes Yes No Expressed support of DRR during 2011 Global Platform
Japan Yes Yes Yes Yes Yes Japan International Cooperation Agency (JICA) produced specific guidelines for DRR: ‘Building
Disaster-Resilient Communities and Societies’ (2008)

P a g e | 4
Korea Yes Yes Yes No No Expressed support of DRR during 2011 Global Platform
Luxembourg Yes No Yes Yes No Mentioned in current humanitarian policy, with particular emphasis on issues of environmental
protection and climate change
Netherlands Yes Yes Yes Yes No Funds the Partners for Resilience programme (2011), an alliance of Dutch NGOs aimed at
strengthening resilience and capacity at local level
New
Zealand
Yes Yes No No No New Zealand Aid’s ‘Environment in International Development’ (2006) mentions the goal of
enhancing preparation for natural disasters
Norway Yes Yes Yes Yes No Norway’s polices and strategies on risk reduction are documented in several government white
papers, including ‘Norwegian Policy on the Prevention of Humanitarian Crises’ and ‘Norway’s
Humanitarian Policy’ (2007)
Portugal Yes Yes No No No Includes DRR concerns in its development and humanitarian aid policies
Spain Yes Yes Yes Yes No Master Plan for Spanish Cooperation 2009–12 emphasises the importance of risk reduction and
disaster prevention in line with Hyogo principles
Sweden Yes Yes Yes Yes No Strategy for DRR has focused bilateral humanitarian DRR support on global and regional
mechanisms; largest donor to UNISDR
Switzerland Yes Yes Yes Yes Yes Swiss Agency for Development and Cooperation (SDC) produced ‘Guidelines on DRR’ (2008). DRR
is one of four priority areas of humanitarian aid
UK Yes Yes Yes Yes Yes Department for International Development (DFID) Strategy Paper focusing on resilience:,
‘Promoting innovation and evidence-based approaches to building resilience and responding to
humanitarian crises’ (2012)
US Yes Yes Yes No No Under the leadership of the Obama administration, the US government remains committed to
strengthening its role in DRR, both at home and abroad (Global Platform statement, 2011)
Source: GFDRR, UNISDR, national government policy documents
P a g e | 5
From rhetoric and policy to action and investment While most donors seem to agree that financing measures to reduce risk can lessen impact, quicken
recovery and result in lower levels of assistance, there is continuing uncertainty as to whether this is
happening in practice. Despite the positive inroads made since the HFA in 2005 in terms of
promoting DRR on the global agenda, there still appears to be a gap between rhetoric and policy
recognition on the one hand, and action and investment on the other.
DRR International Bodies
The World Bank-managed GFDRR is the only operational fund that is solely focused on DRR and
carries out both global and country-level projects. Around 70% of its funding comes from
humanitarian aid budgets, and it has received almost US$200 million since its inception in 2006.
The top five funders of GFDRR since 2006 have been the EU institutions (US$45 million), Sweden
(US$27 million), Australia (US$17 million), the UK (US$13 million), and Japan (US$12 million); this
excludes the World Bank itself, which has contributed US$24 million. Funding to GFDRR doubled
from US$44 million in the period 2006–8 to US$88 million in 2010–11.
The UNISDR is mandated to coordinate global efforts on DRR. UNISDR also supports the creation of
national platforms that aim to coordinate the implementation of the HFA.
Sweden has been the largest contributor to UNISDR, giving US$20 million in the last five years
(2006–10). Other top donors include the EU (US$13 million) and the UK (US$10 million). Global
financial support to UNISDR increased from US$2 million in 2000 to US$29 million in 2010.
“The challenge, therefore, is moving from these compelling words to tangible and life changing
action.” (Margareta Wahlstrom, UN Secretary General’s Special Representative for DRR, 2012)
“The response to crises like the Haiti earthquake, Pakistan floods or drought and famine in the
Horn of Africa show the human consequences of a lack of sustained commitment by donor
governments for prevention, preparedness, risk reduction and long-term recovery efforts.” (DARA
Humanitarian Response Index, 2011)

P a g e | 6
Uncertainty continues as to where DRR sits within the current aid system and who should take
responsibility to lead the push for more investment and coordination. Complexity remains around
terminology, and particularly around coordination and funding mechanisms. The diversity of
activities relating to DRR means that a wide range of government departments are potentially
engaged in the process. Current efforts traceable within aid spending statistics appear to be often
tied to humanitarian budgets, coordinated by humanitarian aid departments, and often associated
with response and early-recovery programmes.
Donor spending on DRR Participants at the third session of UNISDR’s Global Platform for Disaster Reduction recommended
that the equivalent of 10% of humanitarian funding and 10% of post-disaster reconstruction funding
should be allocated towards DRR work. They also proposed that DRR should constitute at least 1% of
all development funding.
Some donors have actively earmarked a proportion of their annual humanitarian budget towards
DRR. For example, in December 2004, the UK’s DFID announced a commitment to allocate
approximately 10% of the funding it provides in response to natural disasters on DRR to lessen the
impact of future disasters.3 In 2012, the Netherlands Ministry of Foreign Affairs expressed its desire
to earmark 10% of its emergency aid budget for increasing the resilience of people in developing
countries in order to help prevent humanitarian disasters.4
The next section of this report analyses the volumes of the Organisation of Economic Cooperation
and Development’s Development Assistance Committee (OECD DAC) donors’ ODA spending towards
DRR between 2006 and 2010, and assesses the extent to which they are meeting the Global
Platform-recommended targets.
DRR funding by OECD DAC donors 2006–10
Tracking DRR within international ODA Volumes of ODA funds invested in DRR are very difficult to track and assess, and data on financing
for DRR is poor. Quantifying the total amount spent on DRR is difficult. DRR activities are commonly
hidden within wider programmes and projects, including those relating to food security, health
systems, and environmental management. Because DRR projects have emerged relatively recently,
the data on DRR funding is limited and donors are still unsure how to report it. Current donor
3 See http://reliefweb.int/report/world/reform-international-humanitarian-system-hilary-benn-dfid-uk. 4 See http://www.government.nl/news/2012/02/06/knapen-discusses-disaster-risks-with-margareta-wahlstrom.html.

P a g e | 7
reporting methods therefore fail to capture adequately the full nature and extent of financing for
DRR, and it is only on the basis of this limited data that we are currently able to examine donor
commitments to financing DRR.
DAC donor spending on disaster prevention and preparedness within humanitarian aid5 Between 2006 and 2010, US$1.5 billion of official humanitarian aid was reported as disaster
prevention and preparedness (DPP), of which 80% came from OECD DAC donor governments
(US$1.2 billion). Funding for DPP from DAC donor governments has increased considerably since
2006, rising from US$28 million to US$393 million by 2010.
5 For the purposes of this report, we consider disaster prevention and preparedness to be the humanitarian aspect of wider DRR.
DRR funding reported to OECD DAC
The OECD DAC’s Creditor Reporting System (CRS) allows particular thematic areas of aid
spending to be examined through sector codes and project descriptions. In the CRS, the sector
relevant to each individual aid activity is recorded using a five-digit purpose code. The coding is
intended to identify the specific areas of the recipient’s economic or social development that
the transfer is intended to foster.
A purpose-code for ‘Disaster prevention and preparedness’ (74010) was introduced in 2004,
within the ODA sub-category humanitarian aid. For DRR spending outside of humanitarian aid,
the long and short project descriptions may be used to search for key-words associated with
DRR activities. Naturally this method is prone to bias and omission as it depends entirely on the
quality of the project description. For a more detailed description of the methodology used for
quantifying DRR financing within the OECD DAC CRS, see Annex 1.

P a g e | 8
Figure 2: Funding reported to DPP in bilateral humanitarian aid, 2006–10
6
Source: OECD DAC
The increase in funding may be due in part to improved reporting of expenditure to DPP, with 21 of
24 donors reporting in 2010 compared with only ten in 2006. However, when considering other or
partial DRR funding which falls within other humanitarian sectors (emergency food aid, emergency
relief, reconstruction relief, and relief coordination), there is still a noticeable increase since 2006.
Despite this increase, only 3.9% of DAC donors’ bilateral humanitarian spending was allocated to
DPP in 2010, and in fact dropped slightly from the previous year (4.4% in 2009).
6 All other DPP funding includes contributions from the Global Environment Facility (GEF), the World Bank’s International Development Association (IDA), United Nations Development Programme (UNDP), United Nations Children’s fund (UNICEF), World Food Programme (WFP), World Health Organisation (WHO) among others.
0%
5%
10%
15%
20%
25%
0
100
200
300
400
500
600
2006 2007 2008 2009 2010
US$
mill
ion
(co
nst
ant
20
10
p
rice
s)
All other DPP funding
DAC donor total DPP
DPP as % of total official humanitarian aid
DPP as % of DAC donor total official humanitarian aid

P a g e | 9
Figure 3: Total DAC donor spending on DPP within bilateral humanitarian aid, 2006–10
Source: Development Initiatives based on OECD DAC
DAC donor government spending on DRR reaching 10% of humanitarian
budgets The overall share of humanitarian aid spent on DPP by DAC donors (2%), including our assessment of
spending on partial DPP activities7, is well below the 10% target recommended at the UNISDR Global
Platform for DRR in 2009.
In order to provide a more comprehensive assessment of individual donor contributions, we have
calculated the sum of donor bilateral contributions traceable in the OECD DAC Creditor Reporting
System, and added to this, the imputed the shares of each donor’s multilateral ODA contributions
spent by the major multilateral institutions investing ODA in DPP.
Just two donors, Japan and Korea, have spent more than 10% of their humanitarian budgets on DPP
between 2006 and 2010. Six donors have allocated between 6% and 8% of their budgets (Australia,
Austria, Canada, France, Germany, and the UK); six donors have allocated just over 5% (Belgium, the
EU institutions, Ireland, New Zealand, Portugal, and Spain); the remaining ten donors’ expenditure is
below 5% (Denmark, Finland, Greece, Italy, Luxembourg, Netherlands, Norway, Sweden,
Switzerland, and the US).
7 Our calculation of donor DPP funding from individual donors includes their bilateral expenditure and a calculation of their contributions
via multilateral channels. To derive these multilateral contributions, we take the DPP expenditure of multilateral institutions (the EU,
International Development Association, and World Food Programme [WFP]) and attribute to each donor that contributes un-earmarked
ODA to that agency a share of this expenditure. This is based on the share of the multilateral agency’s multilateral ODA receipts provided
by that donor in the same year.
0.7%
2%
4%
4% 4%
0.0%
1.0%
2.0%
3.0%
4.0%
5.0%
6.0%
7.0%
8.0%
9.0%
10.0%
0
100
200
300
400
500
600
2006 2007 2008 2009 2010
US$
mill
ion
(co
nst
ant
20
10
pri
ces)
DAC donor other or partial humanitarian DPP
DAC donor total DPP
Total DPP as a share of humanitarian aid
P a g e | 10
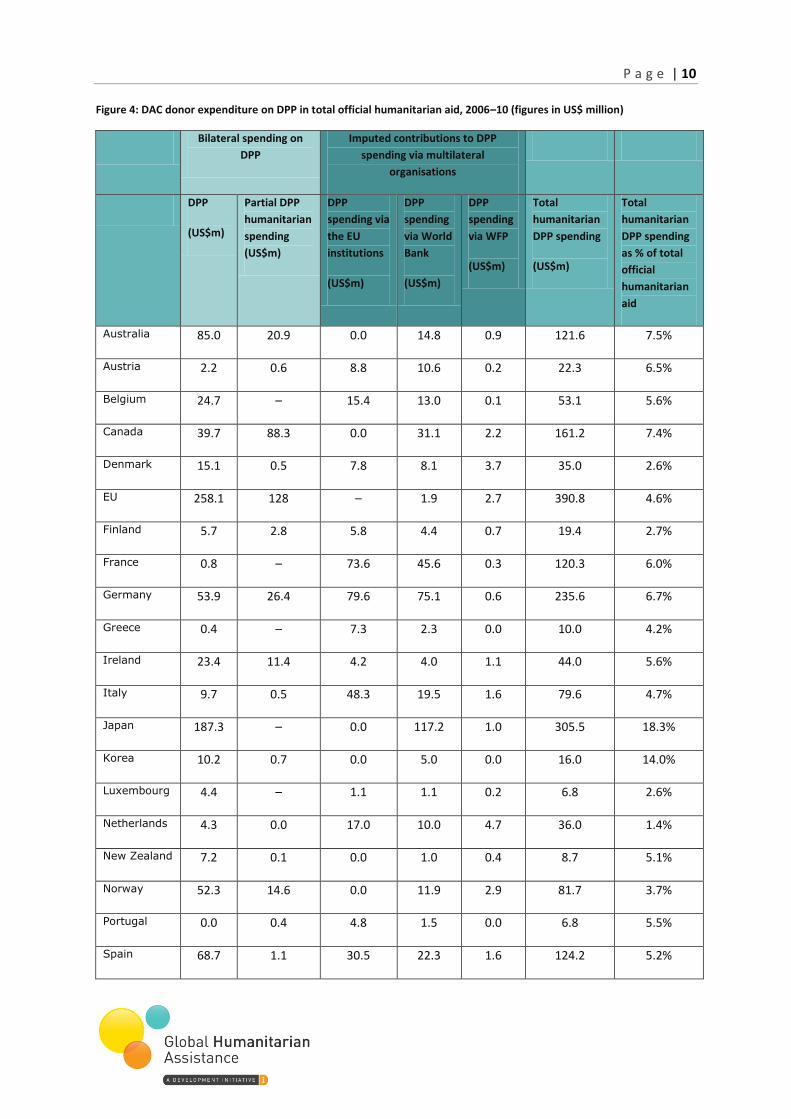
Figure 4: DAC donor expenditure on DPP in total official humanitarian aid, 2006–10 (figures in US$ million)
Bilateral spending on
DPP
Imputed contributions to DPP
spending via multilateral
organisations
DPP
(US$m)
Partial DPP
humanitarian
spending
(US$m)
DPP
spending via
the EU
institutions
(US$m)
DPP
spending
via World
Bank
(US$m)
DPP
spending
via WFP
(US$m)
Total
humanitarian
DPP spending
(US$m)
Total
humanitarian
DPP spending
as % of total
official
humanitarian
aid
Australia 85.0 20.9 0.0 14.8 0.9 121.6 7.5%
Austria 2.2 0.6 8.8 10.6 0.2 22.3 6.5%
Belgium 24.7 – 15.4 13.0 0.1 53.1 5.6%
Canada 39.7 88.3 0.0 31.1 2.2 161.2 7.4%
Denmark 15.1 0.5 7.8 8.1 3.7 35.0 2.6%
EU 258.1 128 – 1.9 2.7 390.8 4.6%
Finland 5.7 2.8 5.8 4.4 0.7 19.4 2.7%
France 0.8 – 73.6 45.6 0.3 120.3 6.0%
Germany 53.9 26.4 79.6 75.1 0.6 235.6 6.7%
Greece 0.4 – 7.3 2.3 0.0 10.0 4.2%
Ireland 23.4 11.4 4.2 4.0 1.1 44.0 5.6%
Italy 9.7 0.5 48.3 19.5 1.6 79.6 4.7%
Japan 187.3 – 0.0 117.2 1.0 305.5 18.3%
Korea 10.2 0.7 0.0 5.0 0.0 16.0 14.0%
Luxembourg 4.4 – 1.1 1.1 0.2 6.8 2.6%
Netherlands 4.3 0.0 17.0 10.0 4.7 36.0 1.4%
New Zealand 7.2 0.1 0.0 1.0 0.4 8.7 5.1%
Norway 52.3 14.6 0.0 11.9 2.9 81.7 3.7%
Portugal 0.0 0.4 4.8 1.5 0.0 6.8 5.5%
Spain 68.7 1.1 30.5 22.3 1.6 124.2 5.2%

P a g e | 11
Sweden 53.8 0.1 10.1 22.4 6.4 92.7 3.2%
Switzerland 2.4 9.3 0.0 18.8 0.2 30.7 2.8%
UK 93.5 64.3 54.5 80.0 0.4 292.7 6.2%
US 212.8 15.9 0.0 89.0 0.0 317.7 1.6%
Source: Development Initiatives based on OECD DAC
DAC donor government DRR spending in development aid DAC donor governments also fund DRR activities through development programmes. In total, DAC
donors have spent US$2.2 billion8 bilaterally on DRR within their development programmes
between 2006-10. This accounts for 0.5% of donors development aid spending9. In only two years
2007 (0.7%) and 2010 (0.6%) has the proportion of DRR spending within development programmes
exceeded 0.5%.
Figure 5: OECD DAC donor expenditure on DRR within development aid, 2006-10
Source: Development Initiatives based on OECD DAC.
8 The data relies heavily on donors’ project-level reporting practices in the CRS. This will be explored later in the report.
9 Development aid is total ODA (excluding debt relief) minus humanitarian aid
0.3% 0.7%
0.4% 0.4% 0.6%
0%
1%
2%
3%
4%
5%
0
100
200
300
400
500
600
700
2006 2007 2008 2009 2010 US$
mill
ion
(co
nst
ant
20
10
pri
ces)
Development aid DRR DRR as a proportion of development aid

P a g e | 12
DAC donor spending reaching 1% of development spending All 24 OECD DAC donors have contributed funding towards DRR within their development spending,
although the quantities vary greatly. Japan is by far the largest donor, disbursing US$1.7 billion in the
five-year period from 2006 to 2010, accounting for 3.5% of its total development ODA, and
representing 38% of all DAC donors’ development DRR spending. Other significant funders of DRR in
development financing include the UK (US$398m), Germany (US$375m), the US (US$372m), and
Canada (US$268m).
The complexity of locating DRR funding within development programmes
There is no code or marker in the OECD DAC CRS that represents DRR. We use a forensic
method to extract investments made in reducing risk from the project descriptions reported by
donors. In some instances this research has been particularly generous, since many projects
may actually include DRR as an element, perhaps as something cutting across other sectors; we
have, without further information, added the entirety of this to our data.
The data relies heavily on donors’ project-level reporting practices, which vary considerably.
Switzerland
The Swiss government has strong policies on DRR. Using our methodology for quantifying
donor DRR investments, Switzerland ranks quite low down, particularly in humanitarian
funding. This can be explained by the fact that out of 4,299 CRS entries in 2010, only 884
contained long project descriptions (21%), with limited programme detail.
Canada
Canada is unique in its reporting practices for projects that cross sectors, as it works out the
percentage breakdown for each sector. For example, a project that addresses health (50%),
education (25%), and prevention and preparedness (25%) will be reported separately under
each sector with the appropriate share of total project funding. This gives a clear picture of the
total amount of financing allocated to a specific activity within a single cross-sector project.
Canada also provides detailed project descriptions in both French and English. In 2010, for
example, 65% of Canada’s 10,674 CRS entries contained detailed long project descriptions.

P a g e | 13
The proportion of development ODA designated to DRR activities also varies considerably amongst
donors. Just three countries’ DRR spending has reached or surpassed the 1% recommendation put
forward at the UNISDR Global Platform in 2009 for development DRR expenditure (Australia,
Canada, and Japan). Five countries have allocated just under the 1% recommendation (Austria,
Finland, Germany, Switzerland, and the UK), seven have allocated 0.5% or just over (Belgium,
Denmark, Ireland, Italy, Korea, Norway, and Sweden), and the remaining nine donors’ expenditure
has been below 0.5% (the EU, France, Greece, Luxembourg, Netherlands, New Zealand, Portugal,
Spain, and the US).
Considering that just one donor, Japan (see page 16 for details of Japan’s spending), accounts for a
large proportion of DRR in development funding, and given our potentially generous calculation10,
the data suggests that the majority of governments are not meeting the recommended allocation.
Figure 6: Government expenditure on DRR within total development ODA, 2006–10 (figures in US$ million)11
Donor
DRR in
bilateral
development
(US$m)
Imputed contributions to DRR spending
via multilateral organisations
Total
development
DRR spending
(US$m)
Total
development
DRR spending
as % of total
development
ODA
DRR
spending
via the EU
institutions
(US$m)
DRR
spending
via the
World
Bank
(US$m)
DRR spending
via United
Nations
Development
Programme
(UNDP)
(US$m)
Australia 116.7 0.0 51.0 0.3 168.0 1.2%
Austria 1.1 2.8 36.5 0.2 40.6 0.9%
Belgium 0.6 4.9 44.7 0.6 50.8 0.5%
Canada 159.7 0.0 107.0 1.5 268.3 1.3%
Denmark 24.8 2.5 27.7 2.2 57.2 0.5%
EU 122.6 - 6.4 0.0 129 0.2%
10
Development DRR figures are extracted from project descriptions that include a DRR-related activity. DRR is not necessarily the entire
focus of the project. We are unable to determine exactly how much has been allocated to DRR. Thus we consider all the figures extracted
to be funding to development programmes that have an element of DRR.
11 For our assessment of individual donor contributions to financing DRR in development ODA, we have imputed their shares of
multilateral ODA from the sums that the EU, the United Nations Development Programme, and the World Bank report have been spent on
DRR.

P a g e | 14
Finland 26.7 1.8 15.1 0.7 44.3 0.9%
France 24.3 23.4 156.8 1.0 205.5 0.4%
Germany 90.1 25.3 258.6 1.0 375.0 0.8%
Greece 0.0 2.3 7.8 0.0 10.1 0.4%
Ireland 8.0 1.3 13.6 0.5 23.4 0.6%
Italy 4.7 15.3 67.3 0.5 87.8 0.6%
Japan 1,259.4 0.0 403.3 2.4 1,665.2 3.5%
Korea 7.6 0.0 17.4 0.1 25.0 0.7%
Luxembourg 2.6 0.3 3.6 0.2 6.8 0.4%
Netherlands 46.3 5.4 34.3 3.5 89.5 0.3%
New Zealand 0.9 0.0 3.4 0.2 4.5 0.3%
Norway 49.2 0.0 40.9 3.8 93.9 0.5%
Portugal 0.1 1.5 5.3 0.1 7.0 0.3%
Spain 9.2 9.7 76.6 1.7 97.1 0.4%
Sweden 26.5 3.2 77.1 3.0 109.7 0.6%
Switzerland 14.4 0.0 64.8 1.4 80.7 0.9%
UK 102.1 17.3 275.4 2.7 397.5 0.9%
US 62.4 0.0 306.3 2.9 371.6 0.3%
Source: Development Initiatives based on OECD DAC
The sectors within which DRR falls in donor governments’ development
spending As previously mentioned, DRR spreads across a wide variety of aid sectors. In total, DRR funding
from DAC donors has been reported in over 100 different sub-sectors, both development and
humanitarian, for the period 2006–10.12 Despite the large number of sectors that include an element
of DRR, just five account for nearly 80% of the entire funding. Unsurprisingly, the top-funded sectors
are DPP, and flood prevention and control. Five of the top ten sectors – flood prevention and control
(US$1bn), environmental policy (US$246m), bio-diversity (US$66m), biosphere protection (US$66m),
12
For detailed descriptions of CRS purpose/sector codes, see
http://www.oecd.org/dac/aidstatistics/purposecodessectorclassification.htm.

P a g e | 15
and environmental research (US$46m) – highlight how many donors link DRR with environmental
protection and climate change adaptation.
Figure 7: Sector breakdown of donor government DRR spending, 2006–10
Source: Development Initiatives based on OECD DAC
Figure 8: Sector breakdown of donors’ bilateral DRR spending, 2006–10 (figures in US$ million)
DRR spending
(US$m)
Top sectors of DRR funding
Japan 1,447 Flood prevention/control (61%), general budget support (18%), DPP (13%)
EU 509 DPP (51%), emergency/distress relief (16%), flood prevention (13%)
US 291 DPP (73%), biosphere protection (19%)
Canada 288 Food aid (19%), DPP (14%), public sector policy (8%), emergency relief (5%)
UK 260 DPP (36%), emergency/distress relief (19%), bio-diversity (18%)
Australia 223 DPP (38%), environment policy (22%), emergency relief (8%), flood
prevention (7%)
Germany 170 DPP (32%), environmental research (21%), emergency/distress relief (11%),
bio-diversity (11%)
Norway 116 DPP (45%), environmental policy (15%), emergency/distress relief (7%)
Sweden 80 DPP (67%), environmental policy (18%)
Spain 79 DPP (87%), environmental policy (7%)
DPP 32%
Flood prevention/control 28%
General budget support 7%
Environmental policy , administration and
managment 6%
Emergency/distress relief 6%
Emergency food aid 3%
Bio-diversity 2%
Biosphere protection
2%
Food security programmes/food aid
1%
Environmental research 1%
Remaining 90 sectors
12%

P a g e | 16
Netherlands 51 Flood prevention/control (66%), water resources policy (13%), DPP (9%)
Ireland 43 DPP (55%), reconstruction relief (17%)
Denmark 40 Environmental policy (53%), DPP (37%)
Finland 35 Development awareness (16%), DPP (16%), environmental policy (12%)
Switzerland 26 Emergency/distress relief (29%), rural development (13%), biosphere
protection (12%), housing policy (11%), DPP (11%)
Belgium 25 DPP (98%)
France 25 Flood prevention/control (54%), agricultural extension (13%), environmental
policy (11%)
Korea 19 DPP (55%), flood prevention/control (23%)
Italy 15 DPP (65%), flood prevention/control (15%)
New Zealand 8 DPP (88%)
Luxembourg 7 DPP (63%), flood prevention/control (37%)
Austria 4 DPP (57%), emergency relief (14%), flood prevention (10%)
Portugal 0.5 Emergency/distress relief (81%), research/scientific institutions (15%)
Greece 0.4 DPP (96%), flood prevention (4%)
Source: Development Initiatives based on OECD DAC

P a g e | 17
Japan top DRR donor in focus
Japan ranks as having the third-highest number of disasters of all countries over the period
2000–1113, and has suffered major catastrophes including the Kobe earthquake in 1995, the
worst flooding in a century in 2000, and the devastating tsunami in 2011. Japan has the third-
largest economy in the world, and in the past has spent up to 5% of its annual general budget
on DRR. Drawing on this knowledge and experience, Japan has played a leading role in global
and regional efforts on DRR. At the 2005 Asia-Africa Summit, for example, Japan pledged to
provide more than US$2.5 billion in aid for disaster prevention sectors in Asia, Africa and other
regions over a five-year period14.
Japan was the largest government donor of DRR funding in the last five years, reporting US$1.4
billion – five times higher than the second-largest government donor, the US (US$291 million).
61% of Japan’s DRR spending in ODA went towards flood prevention and control, a sector in
which Japan dominates, spending US$880 million between 2006 and 2010 (90% of DAC donor
government spending on flood prevention and control). Japan is also noticeably one of only
three countries whose DRR expenditure includes loans as well as grants. 66% of the DRR funding
identified from Japan was in the form of loans. This reflects Japan’s general ODA expenditure,
where it has the highest proportion of loans of all DAC members. Japan has traditionally had a
preference for loans, grounded in the belief that the requirement to pay improves the
recipient’s fiscal responsibility and encourages effective resource allocation15.
Figure 9: Japan’s DRR spending by funding flow and sector, 2006–10
Source: Development Initiatives based on OECD DAC
13. EM-DAT, Centre for Research on the Epidemiology of Disasters. See http://www.cred.be.
14. Ministry of Foreign Affairs, Japan (2005). See http://www.mofa.go.jp/policy/oda/mdg/pamph2015.pdf.
15. OECD DAC peer review (2010). See http://www.oecd.org/dac/peerreviewsofdacmembers/45470028.pdf.
197
187
106
0.1
682
255
15
4
0% 10% 20% 30% 40% 50% 60% 70% 80% 90% 100%
Flood prevention/control
General budget support
DPP
Environmental policy, administration and …
River development
SME development
Education facilities and training
ODA Grants ODA Loans

P a g e | 18
Top recipients of DAC government DRR Of the US$3.8 billion allocated to DRR from DAC donors’ combined humanitarian and development
bilateral spending, 71% was allocated to specific recipient countries. 16% of this has been reported
as ‘bilateral, unspecified’. A number of members of the OECD DAC report portions of their bilateral
ODA as bilateral, unspecified. As a result, much of their aid is not allocated geographically by
recipient or region. Bilateral unspecified allocations are made for expenditures on administrative
costs, global programmes and un-earmarked contributions to implementing partners that cannot be
allocated by recipient country. Denmark, Luxembourg, Norway, Sweden, and the UK have allocated
close to half of their DRR funding to bilateral, unspecified.
Figure 10: Distribution of DAC donor bilateral DRR spending by recipient type, 2006–10
Source: Development Initiatives based on OECD DAC
Of the top 20 recipients of DRR for 2006–10, nine were also in the top 20 recipients of humanitarian
aid, and 11 were also amongst the top recipients of total ODA.
In total 46% of DRR funding went to just four countries: Bangladesh, China, Indonesia, and the
Philippines. With the exception of Bangladesh, DRR financing for these countries – noticeably in the
same region – is heavily influenced by ODA loans from Japan for flood prevention and control
programmes.
All country allocable
71%
Bilateral, unspecified
16%
Regional spending
13%

P a g e | 19
Figure 11: Top 20 recipients of DAC donor bilateral DRR expenditure, 2006–10
Top 20 DRR recipients
Total DRR in ODA from DAC donors (US$ million)
% of total DAC DRR country-allocable funding
Official humanitarian aid rank 2006–10
Official ODA rank 2006–10
Top donors
Indonesia 558.4 21% 11 19 Japan (80%), Australia (10%)
Philippines 272.9 10% 31 53 Japan (90%), Australia (3%)
China 265.7 10% 37 17 Japan (96%), Germany (1%)
Bangladesh 137.0 5% 21 13 Japan (23%), EU (19%), UK (16%)
Ethiopia 125.8 5% 4 3 EU (38%), Canada (27%), UK (23%)
Sri Lanka 95.8 4% 15 37 Japan (74%), Canada (15%), US (7%)
Haiti 82.7 3% 7 18 US (52%), EU (11%), Canada (10%)
Vietnam 82.0 3% 69 4 Japan (32%), Australia (29%), Netherlands (11%)
India 53.3 2% 33 9 UK (29%), EU (28%), Canada (22%)
Cambodia 51.7 2% 60 35 Japan (73%), EU (11%), Australia (9%)
Kenya 49.1 2% 10 14 EU (49%), Canada (17%), Japan (11%)
Mozambique
43.2 2% 35 10 Canada (32%), Germany (25%), US (15%)
Guyana 36.6 1% 135 91 EU (81%), Canada (17%)
Afghanistan 35.4 1% 5 1 Ireland (24%), Norway (19%), US (13%)
Myanmar 35.4 1% 17 66 Australia (29%), UK (22%), Norway (18%)
Pakistan 34.7 1% 3 6 Canada (35%), Japan (26%), Switzerland (10%)
El Salvador 33.5 1% 56 80 Japan (53%), EU (18%), Spain (15%)
Ghana 31.9 1% 74 15 Canada (66%), Japan (25%),
Zimbabwe 27.4 1% 12 43 Canada (75%), EU (9%), Norway (8%)
Peru 24.0 1% 43 69 EU (28%), Canada (24%), Spain (17%)
Remaining countries
599.2 22%
Source: Development Initiatives based on OECD DAC

P a g e | 20
Summary: Are donors investing sufficiently in DRR? Some positive advances have been made since the inception of the HFA, particularly regarding the
emergence of DRR in many government donor policies, and increasing support to UNISDR and
GFDRR. However, levels of funding in international aid still appear to be relatively low,
notwithstanding the limitations in tracking investments.
The share of DAC donors’ humanitarian aid dedicated to preparing for disasters has increased, rising
from US$59 million in 2006 to over US$350 million by 2010. Despite this increase, in 2010 donor
governments’ combined DRR funding fell below 4% of their humanitarian aid expenditure, still well
below the 10% recommended at the Global Platform in 2009. In the five years preceding the HFA,
only two governments out of the 24 DAC donors have spent over 10% of their total official
humanitarian aid on DRR-related activities; six have spent between 6% and 8%, and the remaining
governments have contributed even less. Although these figures do not necessarily include all
governments’ funding to UNISDR and GFDRR (funding to these institutions is difficult to locate in the
data), levels are still significantly low.
A forensic search of the data reveals further DRR funding within governments’ development ODA
spending. While all donors revealed at least some DRR within development expenditure, quantities
and proportions of overall spending varied considerably amongst donors. A large share of this
funding comes from one donor (Japan) to one sector (flood prevention and preparedness), with just
a few recipients (China, Indonesia, the Philippines and Sri Lanka). Only three donors have
contributed more than 1% of their development spending to DRR-related activities. Despite five
additional countries coming close to the Global Platform’s 1% recommendation, the vast majority
fell well below it.
The quality of the available data highlights the complexity of quantifying DRR. This research has been
potentially generous in its estimation, since many projects may actually include an element of DRR,
perhaps as a component cutting across other sectors. There are many examples of DRR expenditure
which are only part of a larger self-contained project or programme. However, our method for
quantifying relies heavily on donor reporting, particularly in terms of coding and providing detailed
project descriptions. Given the mutually exclusive methodology employed by the DAC, donors may
potentially be committing more to DRR than is officially reported, as their interpretations of sector
definitions and reporting practices may differ. In the DAC CRS, projects are allocated one sector code
only to avoid double counting, and it is down to the reporting donor to decide on the appropriate
code.

P a g e | 21
The current data sources available do not supply a readily-available and robust tool for analysing
donor commitment to DRR. The coding structures are too weak and donor reporting to them is not
consistent. Despite inconsistencies in reporting, it is widely acknowledged that there continues to be
a pressing need to move DRR out of the realms of rhetoric and theory, and into more definite action
supported by adequate funds. Improvements in reporting to capture more DRR spending and enable
accurate tracking can provide an important tool for measuring impact and progress, drawing
attention to funding requirements and maintaining commitment.

P a g e | 22
Annex 1: Methodology for tracking DRR in the OECD DAC CRS
The use of the term ‘disaster risk reduction’ in this report is taken from UNISDR terminology:
‘systematic efforts to analyse and manage the causal factors of disasters’. Investments in DRR can be
tracked using the OECD DAC’s CRS, although this is not easy. Each funding transaction reported to
the OECD DAC CRS is allocated a five-digit purpose code, which identifies the specific sectors or
areas of the recipient’s economic or social development that the transfer is intended to foster.
However, there is no specific DRR code within the CRS database, so a forensic method has been used
to pull out relevant investments.
A purpose code for one element of DRR has existed since 2004: this falls within humanitarian aid
under DPP, and data reported under the DPP code (74010) can be easily identified. All funding
reported to the flooding prevention/control purpose code (41050) is also included in the final
estimate of DRR.
Accounting for DRR measures that are sub-components of development and humanitarian projects
not coded 74010 or 41050 is more challenging. To identify these, we search through short and long
project descriptions, referencing 30 key terms selected from recent literature on DRR and the
websites of key DRR-focused organisations (e.g. UNISDR). After each term search, the project
descriptions are scanned, and those not related to DRR removed (for example, results for
‘prevention’ include projects with a DRR focus such as flood prevention, but also HIV/AIDS
prevention, which are excluded).
When assessing individual donor contributions to financing DPP, we have imputed their shares of
multilateral ODA contributed to multilateral organisations (EU institutions, the WFP, and the World
Bank), which were subsequently spent by those organisations on DPP activities.
All our figures relate to ODA expenditure as reported to the OECD DAC aggregate tables and CRS.
The figures here exclude debt relief and our analysis is based on disbursement rather than
commitment. The majority of the data was downloaded in May 2012.

P a g e | 23
Development Initiatives, North Quay House, Quay Side , Bristol, BS1 6FL, UK
T: +44 (0)1179 272 505
W: globalhumanitarianassistance.org
Twitter: GHA_org