global hearing aid battery market: analysis by battery ... · figure 8: global hearing aid battery...
TRANSCRIPT
(c) AZOTH Analytics
Global Hearing Aid Battery Market: Analysis By Battery
Type, By Region, By Country: Trends, Opportunities,
Restraints (2018 Edition) – Forecast to 2022
• By Value (In Million USD)
• By Volume (In Million Units)
• By Type - Zinc-Air, Silver Zinc Rechargeable, Lithium-ion
Rechargeable
• By Region- N. America, S. America, Europe, MEA and APAC
• By Country – United States, Canada, Brazil, Mexico, United
Kingdom, Germany, Saudi Arabia, South Africa, China and India
1 February 2018

(c) AZOTH Analytics 2
Global Hearing Aid Device Battery
Market – By Value (in USD
Million) (2012-2022)
Global Hearing Aid Device Battery
Market – By Volume (in Million)
(2012-2022)
Breakdown: By Type (Zinc-Air,
Silver Zinc Rechargeable, Lithium-
ion Rechargeable) (2012-2022)
Global Coverage Regional Coverage
Global Hearing Aid Battery Market: Analysis By Battery Type, By Region, By Country: Trends,
Opportunities, Restraints (2018 Edition) – Forecast to 2022
Hearing Aid Device Battery
Market – By Value (in USD
Million) (2012-2022)
Hearing Aid Device Battery
Market – By Volume (in
Million) (2012-2022)
North America
South America
Europe
Asia Pacific
MEA
Country Coverage Company Coverage
Product Benchmarking
Business Overview
Product Launches
Company Shares
Rayovac
Varta AG
Zpower
Enegizer Holdings
Renata
Duracell
Siemens
ZeniPower
iCellTech
Global Coverage
Regional Coverage
Country Coverage
Scope of the Study
Start Date: 22/01/2018 End Date:
Segment Coverage
By Volume
By Type
Hearing Aid Device Battery
Market – By Value (in USD
Million) (2012-2022)
Hearing Aid Device Battery
Market – By Volume (in
Million) (2012-2022)
U.S., Canada Brazil, Mexico Germany, U.K. China, India, South Africa, Saudi Arabia

(c) AZOTH Analytics
Table of Content
3
S.No Particulars Page No.
1. Research Methodology 14
2. Executive Summary 15
3. Strategic Recommendation 16
3.1 Expand into Retail Segment 17
3.2 APAC Region Expecting Tremendous Growth 17
4. Product Overview 18
5. Global Hearing Aid Battery Market: Growth and Forecast 26
5.1 Global Hearing Aid Battery Market, By Value (2012-2022) (USD Million) 27
5.2 Global Hearing Aid Battery Market, By Volume (2012-2022) (In Million Units) 29
6. Global Hearing Aid Battery Market: Analysis By Type 30
6.1 Global Hearing Aid Battery Market Share, By Type, 2016 (%) 31
6.2 Global Hearing Aid Battery Market Share, By Type, 2022 (%) 32
7. Global Hearing Aid Battery Market: Company Market Share 33
8. Global Hearing Aid Battery Market: Regional Market Share 35
8.1 Global Hearing Aid Battery Market Share, By Region, 2016 (%) 36
8.2 Global Hearing Aid Battery Market Share, By Region, 2022 (%) 37
9. North America Hearing Aid Battery Market: Growth and Forecast 38

(c) AZOTH Analytics
Table of Content
4
S.No Particulars Page No.
9.1 North America Hearing Aid Battery Market, By Value (2012-2022) (USD Million) 39
9.2 North America Hearing Aid Battery Market, By Volume (2012-2022) (In Million Units) 40
10. US Hearing Aid Battery Market: Growth and Forecast 44
10.1 US Hearing Aid Battery Market, By Value (2012-2022) (USD Million) 45
10.2 US Hearing Aid Battery Market, By Volume (2012-2022) (In Million Units) 47
11. Canada Hearing Aid Battery Market: Growth and Forecast 48
11.1 Canada Hearing Aid Battery Market, By Value (2012-2022) (USD Million) 49
11.2 Canada Hearing Aid Battery Market, By Volume (2012-2022) (In Million Units) 51
12. South America Hearing Aid Battery Market: Growth and Forecast 52
12.1 South America Hearing Aid Battery Market, By Value (2012-2022) (USD Million) 53
12.2 South America Hearing Aid Battery Market, By Volume (2012-2022) (In Million Units) 54
13. Brazil Hearing Aid Battery Market: Growth and Forecast 58
13.1 Brazil Hearing Aid Battery Market, By Value (2012-2022) (USD Million) 59
13.2 Brazil Hearing Aid Battery Market, By Volume (2012-2022) (In Million Units) 61
14. Mexico Hearing Aid Battery Market: Growth and Forecast 62

(c) AZOTH Analytics
Table of Content
5
S.No Particulars Page No.
14.1 Mexico Hearing Aid Battery Market, By Value (2012-2022) (USD Million) 63
14.2 Mexico Hearing Aid Battery Market, By Volume (2012-2022) (In Million Units) 65
15. Rest Of South America Hearing Aid Battery Market: Growth and Forecast 66
15.1 Rest Of South America Hearing Aid Battery Market, By Value (2012-2022) (USD Million) 67
15.2 Rest Of South America Hearing Aid Battery Market, By Volume (2012-2022) (In Million Units) 69
16. Europe Hearing Aid Battery Market: Growth and Forecast 70
16.1 Europe Hearing Aid Battery Market, By Value (2012-2022) (USD Million) 71
16.2 Europe Hearing Aid Battery Market, By Volume (2012-2022) (In Million Units) 72
17. Germany Hearing Aid Battery Market: Growth and Forecast 76
17.1 Germany Hearing Aid Battery Market, By Value (2012-2022) (USD Million) 77
17.2 Germany Hearing Aid Battery Market, By Volume (2012-2022) (In Million Units) 79
18. UK Hearing Aid Battery Market: Growth and Forecast 80
18.1 UK Hearing Aid Battery Market, By Value (2012-2022) (USD Million) 81
18.2 UK Hearing Aid Battery Market, By Volume (2012-2022) (In Million Units) 83
19. Rest Of Europe Hearing Aid Battery Market: Growth and Forecast 84
(c) AZOTH Analytics
Table of Content
6
S.No Particulars Page No.
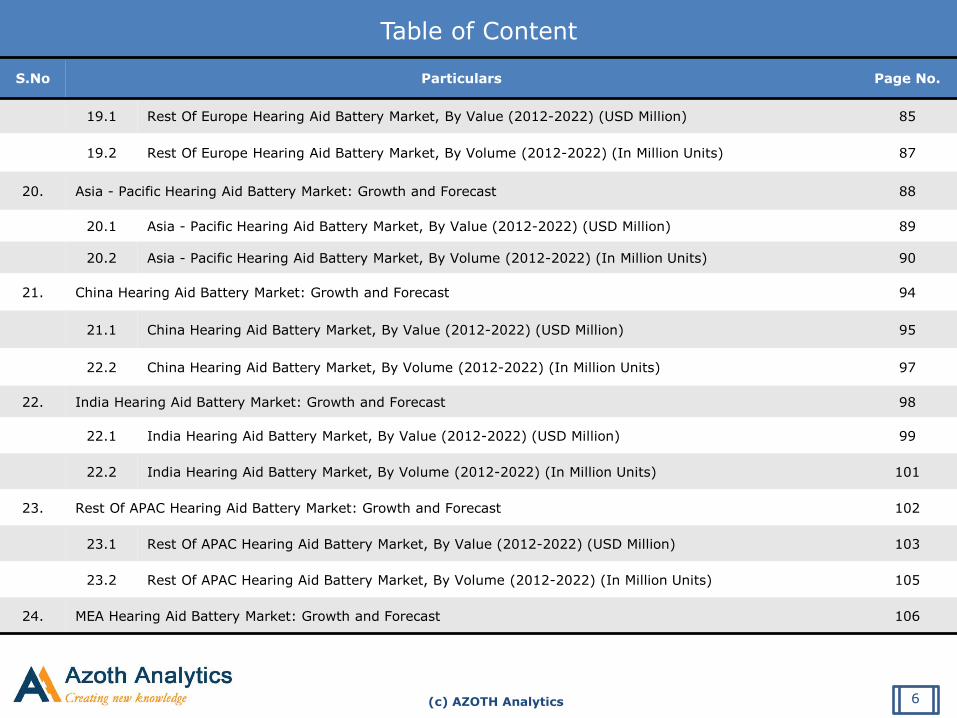
19.1 Rest Of Europe Hearing Aid Battery Market, By Value (2012-2022) (USD Million) 85
19.2 Rest Of Europe Hearing Aid Battery Market, By Volume (2012-2022) (In Million Units) 87
20. Asia - Pacific Hearing Aid Battery Market: Growth and Forecast 88
20.1 Asia - Pacific Hearing Aid Battery Market, By Value (2012-2022) (USD Million) 89
20.2 Asia - Pacific Hearing Aid Battery Market, By Volume (2012-2022) (In Million Units) 90
21. China Hearing Aid Battery Market: Growth and Forecast 94
21.1 China Hearing Aid Battery Market, By Value (2012-2022) (USD Million) 95
22.2 China Hearing Aid Battery Market, By Volume (2012-2022) (In Million Units) 97
22. India Hearing Aid Battery Market: Growth and Forecast 98
22.1 India Hearing Aid Battery Market, By Value (2012-2022) (USD Million) 99
22.2 India Hearing Aid Battery Market, By Volume (2012-2022) (In Million Units) 101
23. Rest Of APAC Hearing Aid Battery Market: Growth and Forecast 102
23.1 Rest Of APAC Hearing Aid Battery Market, By Value (2012-2022) (USD Million) 103
23.2 Rest Of APAC Hearing Aid Battery Market, By Volume (2012-2022) (In Million Units) 105
24. MEA Hearing Aid Battery Market: Growth and Forecast 106

(c) AZOTH Analytics
Table of Content
7
S.No Particulars Page No.
24.1 MEA Hearing Aid Battery Market, By Value (2012-2022) (USD Million) 107
24.2 MEA Hearing Aid Battery Market, By Volume (2012-2022) (In Million Units) 108
25. Saudi Arabia Hearing Aid Battery Market: Growth and Forecast 112
25.1 Saudi Arabia Hearing Aid Battery Market, By Value (2012-2022) (USD Million) 113
25.2 Saudi Arabia Hearing Aid Battery Market, By Volume (2012-2022) (In Million Units) 115
26. South Africa Hearing Aid Battery Market: Growth and Forecast 116
26.1 South Africa Hearing Aid Battery Market, By Value (2012-2022) (USD Million) 117
26.2 South Africa Hearing Aid Battery Market, By Volume (2012-2022) (In Million Units) 119
27. Rest Of MEA Hearing Aid Battery Market: Growth and Forecast 120
27.1 Rest Of MEA Hearing Aid Battery Market, By Value (2012-2022) (USD Million) 121
27.2 Rest Of MEA Hearing Aid Battery Market, By Volume (2012-2022) (In Million Units) 123
28. Global Hearing Aid Battery Market Dynamics 124
28.1 Global Hearing Aid Battery Market Trends 125
28.2 Global Hearing Aid Battery Market Drivers 129
28.3 Global Hearing Aid Battery Market Challenges 133

(c) AZOTH Analytics
Table of Content
8
S. No Particulars Page No.
29. SWOT Analysis: Global Hearing Aid Battery Market 136
30. Porter’s Five Forces Analysis : Global Hearing Aid Battery Market 137
31. Company Profiling 139
31.1 Rayovac 140
31.2 Varta AG 141
31.3 Zpower 143
31.4 Enegizer Holdings 144
31.5 Renata 146
31.6 Duracell 147
31.7 Siemens 148
31.8 ZeniPower 151
31.9 iCellTech 152
32. About Us 153

(c) AZOTH Analytics
List of Figures
Figure No. Figure Title Page No.
Figure 1: Global Hearing Aid Battery Market Size, By Value, 2012-2022 (USD Million) 27
Figure 2: Global population aging 65 years and above (in percentage) 28
Figure 3: Global Hearing Aid Battery Market Size, By Volume, 2012-2022 (Million Units) 29
Figure 4: Global Hearing Aid Battery Market Share, By Type, 2016 31
Figure 5: Global Hearing Aid Battery Market Share, By Type, 2022 32
Figure 6: Global Hearing Aid Battery Market Share, By Company, 2016 34
Figure 7: Global Hearing Aid Battery Market Share, By Region, 2016 36
Figure 8: Global Hearing Aid Battery Market Share, By Region, 2016 37
Figure 9: North America Hearing Aid Battery Market Size, By Value, 2012-2022 (USD Million) 39
Figure 10: North America Hearing Aid Battery Market Size, By Value, 2012-2022 (USD Million) 40
Figure 11: North America Hearing Aid Battery Market Share, By Country, 2016 42
Figure 12: North America Hearing Aid Battery Market Share, By Country, 2022 43
Figure 13: US Hearing Aid Battery Market Size, By Value, 2012-2022 (USD Million) 45
Figure 14: US Per Capita Health Expenditure, 2008-2014 (USD) 46
Figure 15: US Hearing Aid Battery Market Size, By Volume, 2012-2022 (Million Units) 47
Figure 16: Canada Hearing Aid Battery Market Size, By Value, 2012-2022 (USD Million) 49
Figure 17: Canada Population Above 65 years of Age, 2012-2016 (In Percentage) 50
Figure 18: Canada Hearing Aid Battery Market Size, By Volume, 2012-2022 (Million Units) 51
Figure 19: South America Hearing Aid Battery Market Size, By Value, 2012-2022 (USD Million) 53
9

(c) AZOTH Analytics
List of Figures
Figure No. Figure Title Page No.
Figure 20: South America Hearing Aid Battery Market Size, By Volume, 2012-2022 (Million Units) 54
Figure 21: South America Hearing Aid Battery Market Share, By Country, 2016 56
Figure 22: South America Hearing Aid Battery Market Share, By Country, 2022 57
Figure 23: Brazil Hearing Aid Battery Market Size, By Value, 2012-2022 (USD Million) 59
Figure 24: Brazil Hearing Aid Battery Market Size, By Value, 2008-2014 (USD) 60
Figure 25: Brazil Hearing Aid Battery Market Size, By Volume, 2012-2022 (Million Units) 61
Figure 26: Mexico Hearing Aid Battery Market Size, By Value, 2012-2022 (USD Million) 63
Figure 27: Mexico urban Population, 2012-2016 (Percent of Total) 64
Figure 28: Mexico Hearing Aid Battery Market Size, By Volume, 2012-2022 (Million Units) 65
Figure 29: Rest of South America Hearing Aid Battery Market Size, By Value, 2012-2022 (USD Million) 67
Figure 30: Per Capita Expenditure On Healthcare, 2008-2014 (USD) 68
Figure 31: Rest of South America Hearing Aid Battery Market Size, By Volume, 2012-2022 (Million Units) 69
Figure 32: Europe Hearing Aid Battery Market Size, By Value, 2012-2022 (USD Million) 71
Figure 33: Europe Hearing Aid Battery Market Size, By Volume, 2012-2022 (Million Units) 72
Figure 34: Europe Hearing Aid Battery Market Share, By Country, 2016 74
Figure 35: Europe Hearing Aid Battery Market Share, By Country, 2022 75
Figure 36: Germany Hearing Aid Battery Market Size, By Value, 2012-2022 (USD Million) 77
Figure 37: Germany Population Aged Above 65 Years, 2012-2016 (Percentage of Total) 78
Figure 38: Germany Per Capita Expenditure On Healthcare, 2008-2014 (USD) 78
Figure 39: Germany Hearing Aid Battery Market Size, By Volume, 2012-2022 (Million Units) 79
10
(c) AZOTH Analytics
List of Figures
Figure No. Figure Title Page No.
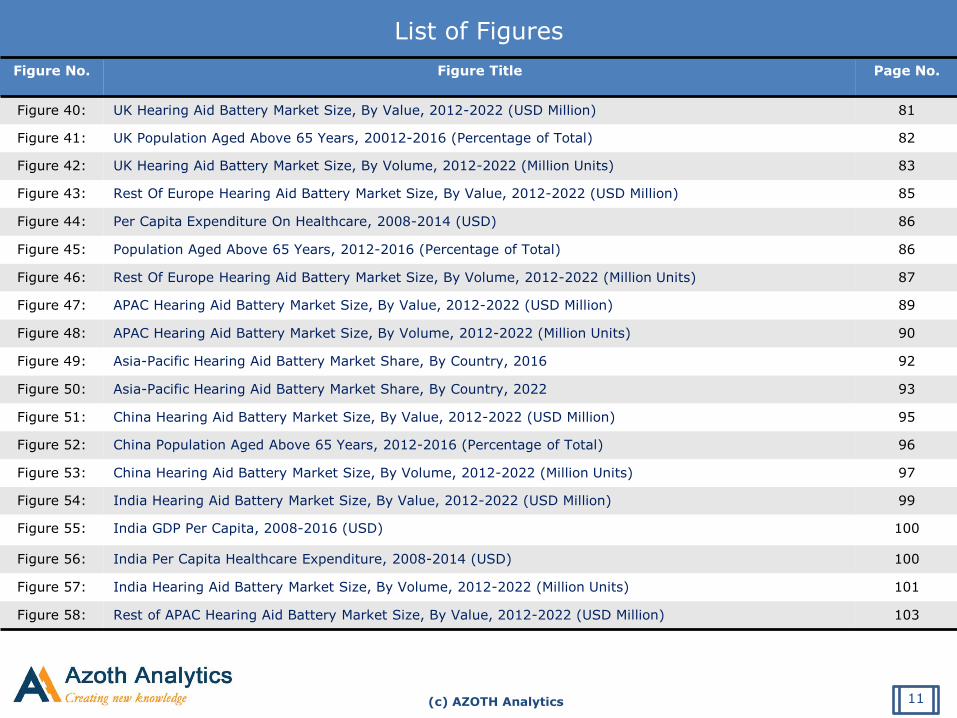
Figure 40: UK Hearing Aid Battery Market Size, By Value, 2012-2022 (USD Million) 81
Figure 41: UK Population Aged Above 65 Years, 20012-2016 (Percentage of Total) 82
Figure 42: UK Hearing Aid Battery Market Size, By Volume, 2012-2022 (Million Units) 83
Figure 43: Rest Of Europe Hearing Aid Battery Market Size, By Value, 2012-2022 (USD Million) 85
Figure 44: Per Capita Expenditure On Healthcare, 2008-2014 (USD) 86
Figure 45: Population Aged Above 65 Years, 2012-2016 (Percentage of Total) 86
Figure 46: Rest Of Europe Hearing Aid Battery Market Size, By Volume, 2012-2022 (Million Units) 87
Figure 47: APAC Hearing Aid Battery Market Size, By Value, 2012-2022 (USD Million) 89
Figure 48: APAC Hearing Aid Battery Market Size, By Volume, 2012-2022 (Million Units) 90
Figure 49: Asia-Pacific Hearing Aid Battery Market Share, By Country, 2016 92
Figure 50: Asia-Pacific Hearing Aid Battery Market Share, By Country, 2022 93
Figure 51: China Hearing Aid Battery Market Size, By Value, 2012-2022 (USD Million) 95
Figure 52: China Population Aged Above 65 Years, 2012-2016 (Percentage of Total) 96
Figure 53: China Hearing Aid Battery Market Size, By Volume, 2012-2022 (Million Units) 97
Figure 54: India Hearing Aid Battery Market Size, By Value, 2012-2022 (USD Million) 99
Figure 55: India GDP Per Capita, 2008-2016 (USD) 100
Figure 56: India Per Capita Healthcare Expenditure, 2008-2014 (USD) 100
Figure 57: India Hearing Aid Battery Market Size, By Volume, 2012-2022 (Million Units) 101
Figure 58: Rest of APAC Hearing Aid Battery Market Size, By Value, 2012-2022 (USD Million) 103
11

(c) AZOTH Analytics
List of Figures
Figure No. Figure Title Page No.
Figure 59: Per Capita Expenditure On Healthcare, 2008-2014 (USD) 104
Figure 60: Population Aged Above 65 Years, 2012-2016 (Percentage of Total) 104
Figure 61: Rest of APAC Hearing Aid Battery Market Size, By Volume, 2012-2022 (Million Units) 105
Figure 62: MEA Hearing Aid Battery Market Size, By Value, 2012-2022 (USD Million) 107
Figure 63: MEA Hearing Aid Battery Market Size, By Volume, 2012-2022 (Million Units) 108
Figure 64: MEA Hearing Aid Battery Market Share, By Country, 2016 110
Figure 65: MEA Hearing Aid Battery Market Share, By Country, 2022 111
Figure 66: Saudi Arabia Hearing Aid Battery Market Size, By Value, 2012-2022 (USD Thousand) 113
Figure 67: Saudi Arabia population above, 2012-2016 (Percentage Of Total) 114
Figure 68: Saudi Arabia Hearing Aid Battery Market Size, By Volume, 2012-2022 (Thousand Units) 115
Figure 69: South Africa Hearing Aid Battery Market Size, By Value, 2012-2022 (USD Million) 117
Figure 70: South Africa Urbanization, 2012-2016 (In Percentage) 118
Figure 71: South Africa population above, 2012-2016 (Percentage Of Total) 118
Figure 72: South Africa Hearing Aid Battery Market Size, By Volume, 2012-2022 (Million Units) 119
Figure 73: Rest Of MEA Hearing Aid Battery Market Size, By Value, 2012-2022 (USD Million) 121
Figure 74: Per Capita Expenditure on Healthcare, 2008-2016 (USD) 122
12

(c) AZOTH Analytics
List of Figures
Figure No. Figure Title Page No.
Figure 75: South Africa population above 65 Years, 2012-2016 (Percentage Of Total)
122
Figure 76: Rest Of MEA Hearing Aid Battery Market Size, By Volume, 2012-2022 (Million Units)
123
Figure 77: Projected Global Population Aged 60 Years and Above
132
Figure 78: Varta AG, Annual Sales Revenue, 2013-2017 (USD Thousands) 142
Figure 79: Varta AG, Annual Net Income, 2013-2017 (USD Thousands)
142
Figure 80: Energizer Holdings, Annual Sales Revenue, 2013-2017 (USD Million) 145
Figure 81: Energizer Holdings, Annual Net Income, 2013-2017 (USD Million)
145
Figure 82: Siemens AG, Annual Sales Revenue, 2012-2016 (USD Million)
149
Figure 83: Siemens AG, Annual Net Income/Loss, 2012-2016 (USD Thousands)
149
Figure 84: Siemens AG, Revenue Share By Region, 2012 (In %)
150
Figure 85: Siemens AG, Revenue Share By Region, 2016 (In %)
150
13
(c) AZOTH Analytics
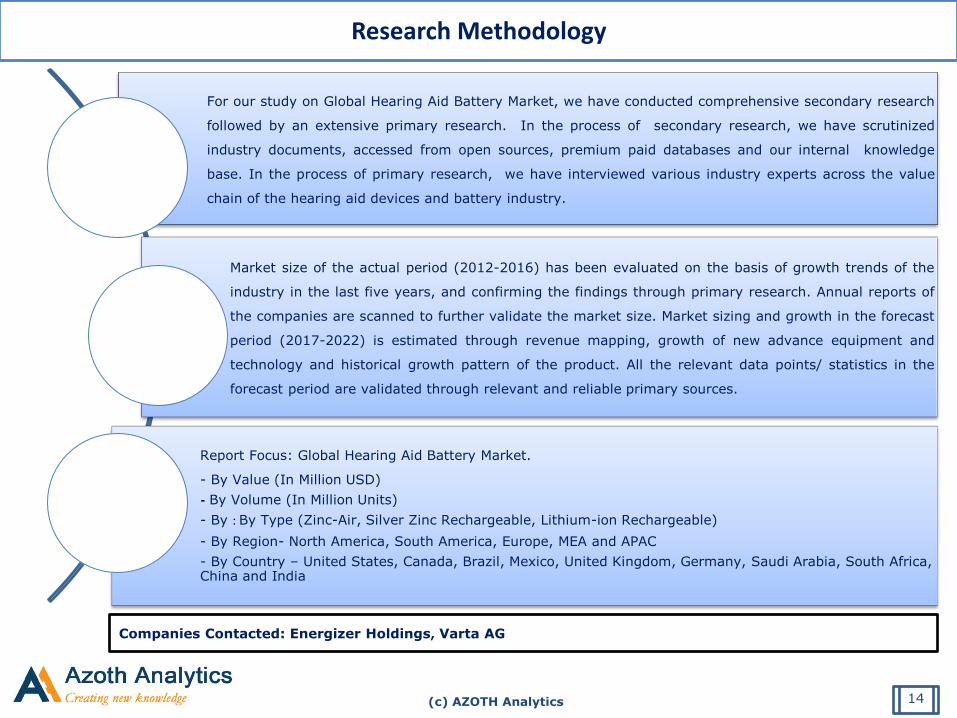
For our study on Global Hearing Aid Battery Market, we have conducted comprehensive secondary research
followed by an extensive primary research. In the process of secondary research, we have scrutinized
industry documents, accessed from open sources, premium paid databases and our internal knowledge
base. In the process of primary research, we have interviewed various industry experts across the value
chain of the hearing aid devices and battery industry.
Market size of the actual period (2012-2016) has been evaluated on the basis of growth trends of the
industry in the last five years, and confirming the findings through primary research. Annual reports of
the companies are scanned to further validate the market size. Market sizing and growth in the forecast
period (2017-2022) is estimated through revenue mapping, growth of new advance equipment and
technology and historical growth pattern of the product. All the relevant data points/ statistics in the
forecast period are validated through relevant and reliable primary sources.
Report Focus: Global Hearing Aid Battery Market.
- By Value (In Million USD)
- By Volume (In Million Units)
- By : By Type (Zinc-Air, Silver Zinc Rechargeable, Lithium-ion Rechargeable)
- By Region- North America, South America, Europe, MEA and APAC
- By Country – United States, Canada, Brazil, Mexico, United Kingdom, Germany, Saudi Arabia, South Africa, China and India
Companies Contacted: Energizer Holdings, Varta AG
Research Methodology
14

(c) AZOTH Analytics
Global Hearing Aid Battery Market Overview
Source: Azoth Analytics Estimates
Xxxxx
Xxxxx
Xxxxx
Xxxxx
Xxxxxx
Xxxxx
2012 2013 2014 2015 2016 2017 2018 2019 2020 2021 2022
Figure : Global Hearing Aid Battery Market Size, By Value, 2012-2022 (USD Million)
CAGR: xx% CAGR: xx%
Rapidly aging population around the world is driving the demand for hearing aids and hence, helping
the hearing aid battery market to grow
15
(c) AZOTH Analytics
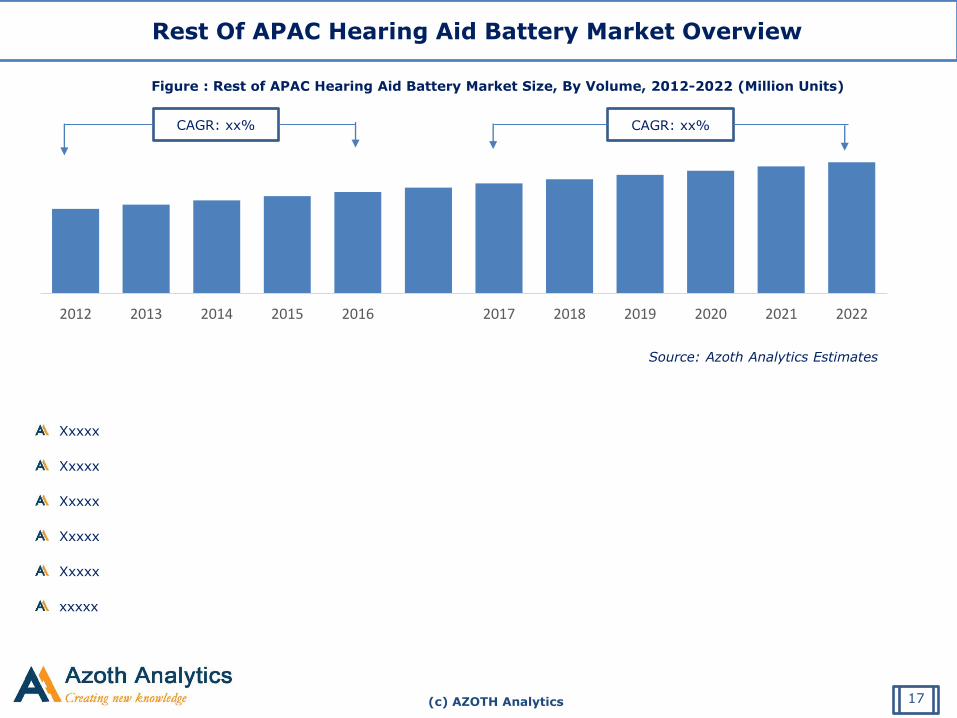
Rest Of APAC Hearing Aid Battery Market Overview
Source: Azoth Analytics Estimates
Xxxxx
Xxxxx
Xxxxx
Xxxxx
Xxxxx
xxxxx
2012 2013 2014 2015 2016 2017 2018 2019 2020 2021 2022
Figure : Rest of APAC Hearing Aid Battery Market Size, By Volume, 2012-2022 (Million Units)
CAGR: xx% CAGR: xx%
17

(c) AZOTH Analytics
Canada Hearing Aid Battery Market Overview
Source: Azoth Analytics Estimates
Xx
Xx
Xx
Xx
Xx
Xx
2012 2013 2014 2015 2016 2017 2018 2019 2020 2021 2022
Figure 16: Canada Hearing Aid Battery Market Size, By Value, 2012-2022 (USD Million)
CAGR: x% CAGR: x%
49

(c) AZOTH Analytics
Canada Hearing Aid Battery Market Overview
Source: Azoth Analytics Estimates
2012 2013 2014 2015 2016 2017 2018 2019 2020 2021 2022
Figure 18: Canada Hearing Aid Battery Market Size, By Volume, 2012-2022 (Million Units)
CAGR: x% CAGR: x%
51
Xx
Xx
Xx
Xx
Xx
Xx

About Azoth Analytics Pvt Ltd.
Azoth Analytics is a business research and analytics firm that creates in-depth research reports and provides customized research solutions and consultancy services. Verticals in which Azoth Analytics specializes include healthcare and pharmaceutical, oil and gas, retail, chemicals, automotive, FMCG, food & beverages and technology. Azoth creates comprehensive and in-depth research reports by recording, interpreting and analyzing information. Strategic market sizing and data dredging techniques include secondary research, and primary research (interviews with management personnel and industry experts).
Related Reports:
Global Hepatitis B Virus [HBV] Treatment Market - Analysis By Type (Therapeutics, Vaccine), By End User (Male, Female) - By Region, By
Country: Opportunities and Forecast (2017-2022) -- By Region (N. America, Europe, APAC, ROW), By Country (US, Canada, UK, Germany, France,
China, India, Japan)
Migraine Pipeline Drugs Market Assessment: Industry Analysis, Pipeline Review, Clinical Trials, Market Potential – Forecast to 2022
Disclaimer: Azoth Analytics report information is based mainly on interviews and therefore, is subject to fluctuation. Azoth Analytics therefore, takes no responsibility for
any incorrect information supplied to us by industry experts, manufacturers or users.. Also, analysis provided in the report are meant for customers’ internal use only and
not for general publication or disclosure to third parties.
18