global food security index 2016.pdf
TRANSCRIPT
Global foodsecurity index
2016
A report from The Economist Intelligence Unit
Sponsored by
An annual measure of the state of global food security
© The Economist Intelligence Unit Limited 20161
Global food security index 2016 An annual measure of the state of global food security
Preface 2
Acknowledgements 3
Executive summary 4
Key findings 6
2016 GFSI overall rankings table 9
Score changes 10
Affordability 11
Availability 15
Quality & Safety 19
Regional comparison 22
Five year trends and outlook 26
Conclusion 29
Appendix: Methodology 30
Contents
© The Economist Intelligence Unit Limited 20162
Global food security index 2016 An annual measure of the state of global food security
Preface
The Global Food Security Index 2016: An annual measure of the state of global food security is the fifth edition of an Economist Intelligence Unit (EIU) study, commissioned by DuPont. This report discusses the key findings from the research and the benchmarking index. Katherine Stewart, research analyst, was the project manager. Robert Smith, research analyst, provided research and analytical support. Leo Abruzzese, Global Director of
Public Policy, and Hilary Steiner, North American director of Public Policy, served as senior advisers. William Shallcross designed and constructed the benchmarking model, Peter Ouvry provided editorial support and Mike Kenny was responsible for layout and design. We would like to extend thanks to the many researchers who lent their expertise to this project. A full list of acknowledgements follows.
Note: The findings, interpretations and conclusions expressed in this study are those of the author(s) and do not necessarily reflect the views of the sponsor.
The sponsor does not guarantee the accuracy of the data included in this work. The boundaries, colours, denominations and other information shown on any map in this work or related materials do not imply any judgment on the part of the sponsor concerning the legal status of any territory or the endorsement or acceptance of such boundaries.
© The Economist Intelligence Unit Limited 20163
Global food security index 2016 An annual measure of the state of global food security
Acknowledgements
The following economists, researchers, food specialists and country analysts contributed to the report. We thank them for their participation.
Economist Intelligence Unit specialists and contributors Mohamed Abdelmeguid, Diane Alarcon, Benedict Craven, Tom Felix Joehnk, Brendan Koch, Joseph Lake and Robert Powell.
Peer panel members The following experts on food security and agricultural policy contributed significantly to shaping the index methodology and vetting the indicators. Their diverse backgrounds and extensive experience ensured that a wide variety of views were considered. The panel met as a group in February 2012 in Washington, DC to review an initial indicator list. The panel has also
provided ongoing support, as needed, throughout all five editions of the index, as well as advising on the selection of weightings.
Ademola Braimoh (World Bank); Margaret Enis (US Agency for International Development); Craig Gundersen (National Soybean Research Laboratory, University of Illinois at Urbana-Champaign); Eileen Kennedy (Friedman School of Nutrition Science and Policy, Tufts University); Samarendu Mohanty (International Rice Research Institute); Prabhu Pingali (Gates Foundation); Pedro Sanchez (Earth Institute, Columbia University); David Spielman (International Food Policy Research Institute); Robert Thompson (Chicago Council on Global Affairs); Patrick Westhoff (Food and Agricultural Policy Research Institute, University of Missouri—Columbia)
© The Economist Intelligence Unit Limited 20164
Global food security index 2016 An annual measure of the state of global food security
Global food security continues to improve. Hunger has decreased: the UN Food and Agriculture Organisation (FAO) estimates that the number of undernourished people has fallen by 176m over the past ten years.1 But almost 800m people—just over one in nine people—still remain hungry, and food security continues to be one of the major global challenges for the future.
The Economist Intelligence Unit’s Global Food Security Index (GFSI) provides a common framework for understanding the root causes of food insecurity by looking at the dynamics of food systems around the world. It seeks to answer the central question: How food-secure is a country? Food security is a complex, multi-faceted issue influenced by culture, environment and geographic location. The index cannot capture intra-country nuances, but by distilling major food-security themes down to their core elements it provides a useful approach to understanding the risks to food security in countries, regions and around the world.
By creating a common framework against which to benchmark a country’s food security, the GFSI has created a unique country-level food-security measurement tool that addresses the issues of affordability, availability and utilisation in 113 countries around the world. Since its inception, the GFSI has become a policy check for governments and a country diagnostic tool for investment. Non-governmental organisations and multilaterals have turned to
1 FAO. (2015). “State of Food Insecurity in the World: In Brief”. Available at http://www.fao.org/3/a-i4671e.pdf
the GFSI as a research tool to identify key countries in which to focus advocacy efforts for food-security policy changes and developments. The private sector uses the tool as a launch pad to make strategic decisions, explore food consumption trends and develop corporate social responsibility initiatives.
Over the past five years, the GFSI has shown improvements in food security. Overall global economic growth has led to improvements in the structural areas that are essential to improving people’s access to a wide range of affordable, nutritious foods, including more extensive food safety-net programmes, expanded food transport infrastructure and greater dietary diversity. This is particularly evident in middle-income and emerging-market countries, which have reached the economic and development threshold necessary to enable them to focus on improving government programmes to enhance food security, expand avenues of financing for farmers and promote infrastructure development, and where a burgeoning middle class is increasingly demanding access to a more diverse range of foods.
Low-income countries have not yet reached this threshold. They often lack basic infrastructure, and smaller incomes inhibit access to and affordability of nutritious food. Political risk and corruption frequently compound structural difficulties in these countries. These issues are exacerbated by the risk of future climate change. The developing nations at the bottom of the GFSI are the
Executive summary
© The Economist Intelligence Unit Limited 20165
Global food security index 2016 An annual measure of the state of global food security
countries that are most affected by weather-related loss events. Changing weather patterns, drought, increased rainfall and flooding will have a significant impact in the long term, potentially pushing up food prices and increasing production volatility. The World Bank estimates that, without any action on climate change, extreme weather events could lead to crop yield losses as high as 5% by 2030, which would drive up food prices.
In the light of current and future food-security challenges in low-income countries—risks from climate change, population growth and potential spikes in food prices, among others—the GFSI highlights the fact that focusing on advancements in these countries must be a priority. How can low-income, developing countries move ahead despite the obstacles they face? Investment in infrastructure and food systems is the key to pushing these countries forward and narrowing the gap between the low-income and middle-income countries and their food-security systems. Governments will need to invest in the development and implementation of new technologies to make countries more resilient to changing weather patterns. Private investment must also be encouraged.

© The Economist Intelligence Unit Limited 20166
Global food security index 2016 An annual measure of the state of global food security
Food security has improved around the globe over the past five years, but hunger and food insecurity still persist. Governments, multilaterals and the private sector should remain proactive in addressing food-security challenges around the world. Over three-quarters (89) of the 113 countries in the 2016 GFSI have experienced food-security improvements over the past five years. These positive developments have largely been driven by rising incomes in most countries and general improvements in the global economy. Falling food prices have also positively impacted food
security. But weather and climate change-related risks, as well as market-distorting government food policies, pose risks to food prices and food availability in the future.
For the first time since the launch of the GFSI in 2012, Europe has experienced an improvement in its food security. Geopolitical factors, average annual GDP growth of 1.4% across the region in the past year and favourable crop yields have supported Europe’s improvements. Falling oil prices have increased food affordability (via lower costs for food
Key findings
1Ireland 5
United Kingdom
=15Czech
Republic
7Sweden
12Spain
=20Bulgaria
23Romania
=20Greece
=17Hungary
=17Poland
22Russia
24Belarus
19Slovakia
10Finland
8Belgium
13Italy
25Serbia
26Ukraine9
Switzerland
14Norway
Changes in Affordability rankings in Europe, 2016
Source: Economist Intelligence Unit
Score improvement from 2015 to 2016Score deterioration from 2015 to 2016
Size of the bubble is directly related to the magnitude of the score improvement/deterioriation from 2015 to 2016
© The Economist Intelligence Unit Limited 20167
Global food security index 2016 An annual measure of the state of global food security
production inputs such as petroleum-based fertiliser, and reduced food transport costs), and economic growth has improved the region’s capacity to absorb the stresses of urbanisation. These factors have resulted in a 0.9-point rise in the region’s overall food-security score since 2015. Falling food prices and high food stocks mean that there is a positive outlook for food security in Europe over the next few years. However, an influx of refugees into cities across the region could strain food safety nets.
Between 2015 and 2016, more countries experienced declines in their scores for national nutritional standards than improvements. National nutritional standards—including national nutrition plans, national dietary guidelines and national nutritional monitoring—are critical in ensuring that both government and the private sector direct their focus towards improving food quality, safety and nutrition. Thirty-six countries in the GFSI still do not have national dietary guidelines that encourage populations to adopt a balanced, nutritious diet. Additionally, a number of countries—Bahrain, Burkina Faso, Malawi, Niger and the UAE—had national nutrition plans or strategies that expired in 2015; these countries have not yet updated their lapsed plans.
Thirty-five of the GFSI’s 40 most food-secure countries in 2016 are coastal countries. Switzerland, Austria, the Czech Republic, Hungary and Slovakia—all high-income countries that have large agricultural sectors and are in close geographic proximity to other top-performing countries—are the five landlocked countries in the top 40. The populations of landlocked countries, especially developing ones, often rely on farming as a means of subsistence, but such states usually are located in dry regions where arid conditions prevail. As a result, these countries often have less irrigated agricultural land, which makes them particularly vulnerable to the effects of climate change, such as rising temperatures and
increasing prevalence of drought.2 Their lack of direct access to the coast imposes additional costs on trade: the World Bank found that the volume of international trade of a landlocked developing country is, on average, just 60% of the trade volume of a comparable coastal country3 and that the lack of coastal access increases transport costs.4 Poor infrastructure and tariffs can introduce additional obstacles.
Developing economies that prioritise investment in agricultural storage and transport infrastructure increase their capacity to ensure food security for burgeoning populations. Sustained investment, especially by the private sector, is critical if countries are to develop the infrastructure capacity necessary to produce and transport sufficient quantities of food in the future. Sub-Saharan Africa lags behind other regions in agricultural infrastructure: although storage capacity across the region has improved, road and port infrastructure is poor. Governments have committed themselves to improving ports, roads and railways, but financing capacity remains an obstacle. Private investment and public-private partnerships (PPPs) are areas of opportunity that could be leveraged to overcome this obstacle.
Political instability exacerbates food insecurity. Functional democracies are notably absent from the bottom of the GFSI rankings, whereas countries that are experiencing armed conflict, government instability and civil unrest have experienced the largest deteriorations in food security since 2015. Civil wars in Yemen and Syria have affected government and multilateral capacity to provide food-safety net programmes and have undermined food safety: both countries
2 UN. (2015). “The Impact of Climate Change, Desertification and Land Degradation on the Development Prospects of Landlocked Developing Countries”. Available at http://unohrlls.org/custom-content/uploads/2015/11/Impact_Climate_Change_2015.pdf
3 World Bank and UN. (2014). “Improving Trade and Transport for Landlocked Developing Countries”. Available at http://unohrlls.org/custom-content/uploads/2013/09/Improving-Trade-and-Transport-for-Landlocked-Developing-Countries.pdf
4 FAO. (2015). “Landlocked states face unique food challenges”. Available at http://www.fao.org/europe/news/detail-news/en/c/273889/
© The Economist Intelligence Unit Limited 20168
Global food security index 2016 An annual measure of the state of global food security
no longer have functional agencies to ensure the safety of food. A recent coup d’état in Côte d’Ivoire, in addition to a drought that has hit cocoa production and strongly increased production volatility, has severely impacted food availability in that country.
Countries’ economic development and rising personal incomes improve the structural avenues to support food availability and affordability and strengthen governance; however, the most vulnerable populations in upper-middle-income and high-income countries remain food-insecure. As a country crosses the threshold to developed-nation status, the gap between its food-secure and food-insecure populations widens. Overall food-security successes and improvements require the government to revamp food policies that previously focused on improving the country’s overall food security, switching to policies that target the needs of its poorest people.
© The Economist Intelligence Unit Limited 20169
Global food security index 2016 An annual measure of the state of global food security
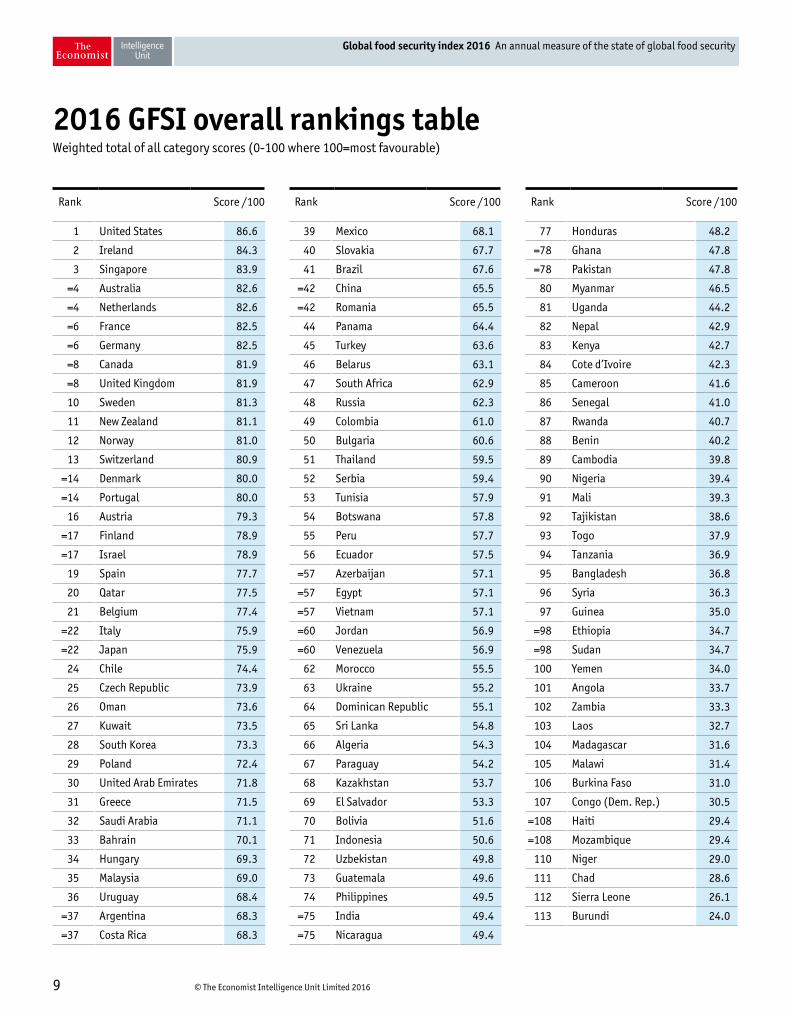
2016 GFSI overall rankings tableWeighted total of all category scores (0-100 where 100=most favourable)
Rank Score /100 Rank Score /100 Rank Score /100
1 United States 86.6
2 Ireland 84.3
3 Singapore 83.9
=4 Australia 82.6
=4 Netherlands 82.6
=6 France 82.5
=6 Germany 82.5
=8 Canada 81.9
=8 United Kingdom 81.9
10 Sweden 81.3
11 New Zealand 81.1
12 Norway 81.0
13 Switzerland 80.9
=14 Denmark 80.0
=14 Portugal 80.0
16 Austria 79.3
=17 Finland 78.9
=17 Israel 78.9
19 Spain 77.7
20 Qatar 77.5
21 Belgium 77.4
=22 Italy 75.9
=22 Japan 75.9
24 Chile 74.4
25 Czech Republic 73.9
26 Oman 73.6
27 Kuwait 73.5
28 South Korea 73.3
29 Poland 72.4
30 United Arab Emirates 71.8
31 Greece 71.5
32 Saudi Arabia 71.1
33 Bahrain 70.1
34 Hungary 69.3
35 Malaysia 69.0
36 Uruguay 68.4
=37 Argentina 68.3
=37 Costa Rica 68.3
39 Mexico 68.1
40 Slovakia 67.7
41 Brazil 67.6
=42 China 65.5
=42 Romania 65.5
44 Panama 64.4
45 Turkey 63.6
46 Belarus 63.1
47 South Africa 62.9
48 Russia 62.3
49 Colombia 61.0
50 Bulgaria 60.6
51 Thailand 59.5
52 Serbia 59.4
53 Tunisia 57.9
54 Botswana 57.8
55 Peru 57.7
56 Ecuador 57.5
=57 Azerbaijan 57.1
=57 Egypt 57.1
=57 Vietnam 57.1
=60 Jordan 56.9
=60 Venezuela 56.9
62 Morocco 55.5
63 Ukraine 55.2
64 Dominican Republic 55.1
65 Sri Lanka 54.8
66 Algeria 54.3
67 Paraguay 54.2
68 Kazakhstan 53.7
69 El Salvador 53.3
70 Bolivia 51.6
71 Indonesia 50.6
72 Uzbekistan 49.8
73 Guatemala 49.6
74 Philippines 49.5
=75 India 49.4
=75 Nicaragua 49.4
77 Honduras 48.2
=78 Ghana 47.8
=78 Pakistan 47.8
80 Myanmar 46.5
81 Uganda 44.2
82 Nepal 42.9
83 Kenya 42.7
84 Cote d’Ivoire 42.3
85 Cameroon 41.6
86 Senegal 41.0
87 Rwanda 40.7
88 Benin 40.2
89 Cambodia 39.8
90 Nigeria 39.4
91 Mali 39.3
92 Tajikistan 38.6
93 Togo 37.9
94 Tanzania 36.9
95 Bangladesh 36.8
96 Syria 36.3
97 Guinea 35.0
=98 Ethiopia 34.7
=98 Sudan 34.7
100 Yemen 34.0
101 Angola 33.7
102 Zambia 33.3
103 Laos 32.7
104 Madagascar 31.6
105 Malawi 31.4
106 Burkina Faso 31.0
107 Congo (Dem. Rep.) 30.5
=108 Haiti 29.4
=108 Mozambique 29.4
110 Niger 29.0
111 Chad 28.6
112 Sierra Leone 26.1
113 Burundi 24.0
© The Economist Intelligence Unit Limited 201610
Global food security index 2016 An annual measure of the state of global food security
Indonesia +2.7
Myanmar +2.7
United Kingdom +2.6
Ecuador +2.4
Colombia +2.2
Honduras +2.2
Benin +2.2
Ireland +2.0
Israel +2.0
Argentina +1.9
Finland +1.7
Nigeria +1. 7
Togo +1.6
Chile +1.5
Congo (Dem. Rep.) +1.4
Sweden +1.3
Portugal +1.3
Czech Republic +1.3
Panama +1.3
China +1.2
Vietnam +1.2
Rwanda +1.2
Costa Rica +1.1
Bulgaria +1.1
Algeria +1.1
Guinea +1.1
Mozambique +1.1
Qatar +1.0
Belarus +1.0
Egypt +1.0
Burkina Faso +1.0
Singapore +0.9
France +0.9
Germany +0.9
Belgium +0.9
Italy +0.9
Oman +0.9
Mexico +0.9
United States +0.8
Australia +0.8
Norway +0.8
Denmark +0.8
Spain +0.8
Greece +0.8
Hungary +0.8
Brazil +0.8
Russia +0.8
Peru +0.8
Morocco +0.8
Ukraine +0.8
Dominican Republic +0.8
Nicaragua +0.8
Bangladesh +0.8
Japan +0.7
Kuwait +0.7
Slovakia +0.7
Romania +0.7
El Salvador +0.7
Cameroon +0.7
South Africa +0.6
Tunisia +0.6
Sudan +0.6
Austria +0.5
Thailand +0.5
Guatemala +0.5
India +0.5
Zambia +0.5
Netherlands +0.4
Canada +0.4
Paraguay +0.4
Philippines +0.4
Pakistan +0.4
Tanzania +0.4
Chad +0.4
Poland +0.3
Saudi Arabia +0.3
Kazakhstan +0.3
Ethiopia +0.3
Madagascar +0.3
South Korea +0.2
Azerbaijan +0.2
Bolivia +0.2
Ghana +0.2
Kenya +0.2
Senegal +0.2
Mali +0.2
Laos +0.2
New Zealand +0.1
Switzerland +0.1
United Arab Emirates +0.1
Malaysia +0.1
Uruguay +0.1
Serbia +0.1
Uzbekistan +0.1
Uganda +0.1
Nepal +0.1
Cambodia +0.1
Yemen -4.2
Cote d’Ivoire -3.9
Haiti -2.0
Syria -1.4
Venezuela -1.3
Sierra Leone -1.1
Botswana -0.9
Burundi -0.8
Malawi -0.6
Bahrain -0.5
Turkey -0.5
Angola -0.4
Sri Lanka -0.1
No change
Jordan
Niger
Tajikistan
Score change Score change Score change Score change
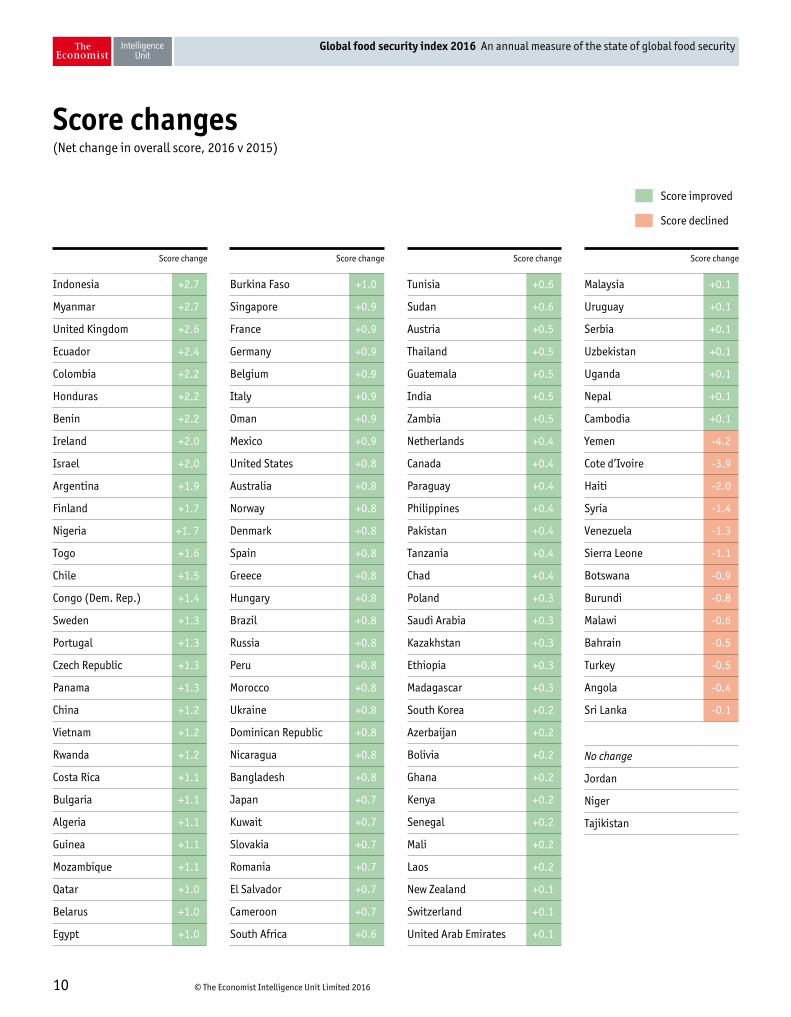
Score changes(Net change in overall score, 2016 v 2015)
Score improved
Score declined
© The Economist Intelligence Unit Limited 201611
Global food security index 2016 An annual measure of the state of global food security
Category overview The capacity to afford good-quality food without undue stress is a crucial aspect of food security. The Affordability category explores the capacity of a country’s people to pay for food, and the costs that they may face both when the food supply is stable and at times of food-related shocks. The GFSI looks at affordability through two lenses: first, whether people in a country have sufficient means to buy food, and second, the quality of the public structures that exist to respond to shocks to food security.
Affordability is measured across six indicators: l Food consumption as a share of household
expenditurel Proportion of the population under the global
poverty line (% of population with income under US$3.10/day at 2011 purchasing power parity, or PPP, exchange rates)
l GDP per head at PPP exchange ratesl Agricultural import tariffsl Presence of food safety-net programmesl Access to financing for farmers
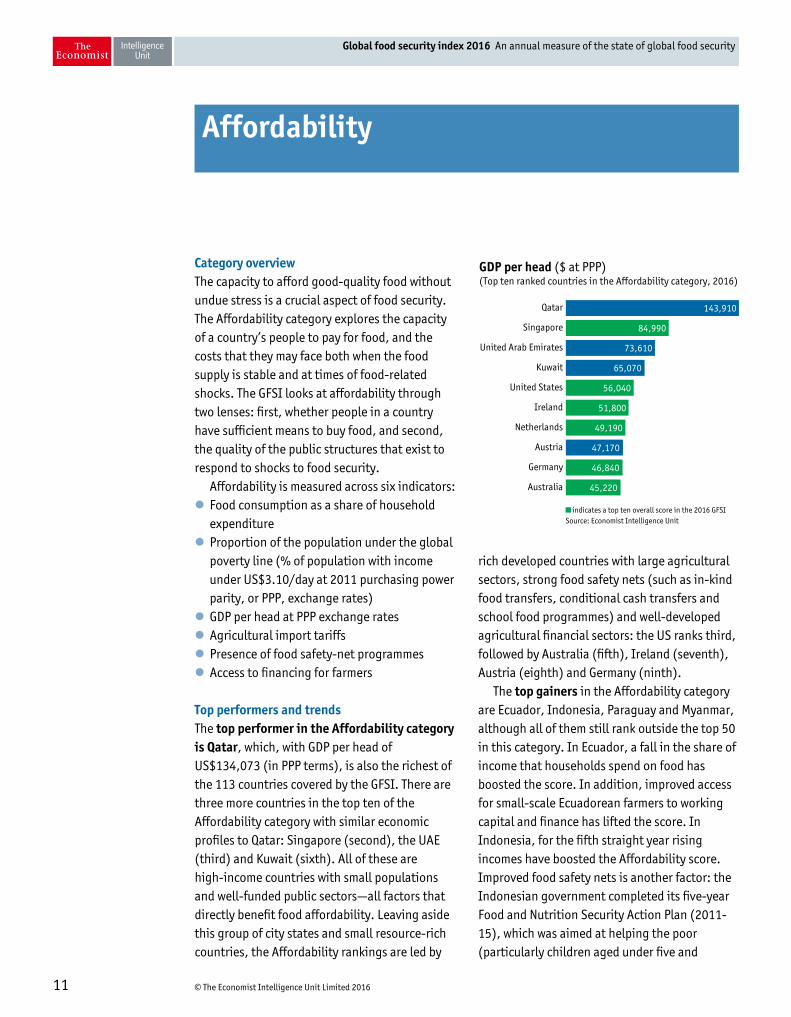
Top performers and trends The top performer in the Affordability category is Qatar, which, with GDP per head of US$134,073 (in PPP terms), is also the richest of the 113 countries covered by the GFSI. There are three more countries in the top ten of the Affordability category with similar economic profiles to Qatar: Singapore (second), the UAE (third) and Kuwait (sixth). All of these are high-income countries with small populations and well-funded public sectors—all factors that directly benefit food affordability. Leaving aside this group of city states and small resource-rich countries, the Affordability rankings are led by
rich developed countries with large agricultural sectors, strong food safety nets (such as in-kind food transfers, conditional cash transfers and school food programmes) and well-developed agricultural financial sectors: the US ranks third, followed by Australia (fifth), Ireland (seventh), Austria (eighth) and Germany (ninth).
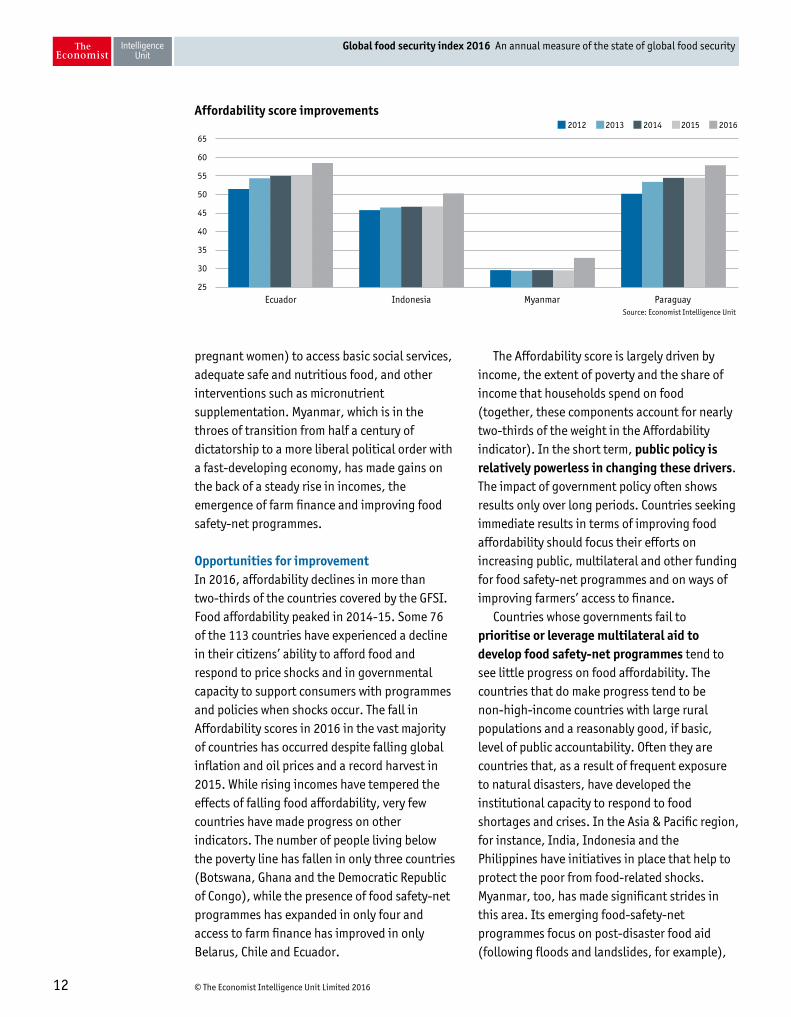
The top gainers in the Affordability category are Ecuador, Indonesia, Paraguay and Myanmar, although all of them still rank outside the top 50 in this category. In Ecuador, a fall in the share of income that households spend on food has boosted the score. In addition, improved access for small-scale Ecuadorean farmers to working capital and finance has lifted the score. In Indonesia, for the fifth straight year rising incomes have boosted the Affordability score. Improved food safety nets is another factor: the Indonesian government completed its five-year Food and Nutrition Security Action Plan (2011-15), which was aimed at helping the poor (particularly children aged under five and
Affordability
GDP per head ($ at PPP)(Top ten ranked countries in the Affordability category, 2016)
Source: Economist Intelligence Unit indicates a top ten overall score in the 2016 GFSI
Qatar
Singapore
United Arab Emirates
Kuwait
United States
Ireland
Netherlands
Austria
Germany
Australia
143,910
84,990
73,610
65,070
56,040
51,800
49,190
47,170
46,840
45,220
© The Economist Intelligence Unit Limited 201612
Global food security index 2016 An annual measure of the state of global food security
pregnant women) to access basic social services, adequate safe and nutritious food, and other interventions such as micronutrient supplementation. Myanmar, which is in the throes of transition from half a century of dictatorship to a more liberal political order with a fast-developing economy, has made gains on the back of a steady rise in incomes, the emergence of farm finance and improving food safety-net programmes.
Opportunities for improvement In 2016, affordability declines in more than two-thirds of the countries covered by the GFSI. Food affordability peaked in 2014-15. Some 76 of the 113 countries have experienced a decline in their citizens’ ability to afford food and respond to price shocks and in governmental capacity to support consumers with programmes and policies when shocks occur. The fall in Affordability scores in 2016 in the vast majority of countries has occurred despite falling global inflation and oil prices and a record harvest in 2015. While rising incomes have tempered the effects of falling food affordability, very few countries have made progress on other indicators. The number of people living below the poverty line has fallen in only three countries (Botswana, Ghana and the Democratic Republic of Congo), while the presence of food safety-net programmes has expanded in only four and access to farm finance has improved in only Belarus, Chile and Ecuador.
The Affordability score is largely driven by income, the extent of poverty and the share of income that households spend on food (together, these components account for nearly two-thirds of the weight in the Affordability indicator). In the short term, public policy is relatively powerless in changing these drivers. The impact of government policy often shows results only over long periods. Countries seeking immediate results in terms of improving food affordability should focus their efforts on increasing public, multilateral and other funding for food safety-net programmes and on ways of improving farmers’ access to finance.
Countries whose governments fail to prioritise or leverage multilateral aid to develop food safety-net programmes tend to see little progress on food affordability. The countries that do make progress tend to be non-high-income countries with large rural populations and a reasonably good, if basic, level of public accountability. Often they are countries that, as a result of frequent exposure to natural disasters, have developed the institutional capacity to respond to food shortages and crises. In the Asia & Pacific region, for instance, India, Indonesia and the Philippines have initiatives in place that help to protect the poor from food-related shocks. Myanmar, too, has made significant strides in this area. Its emerging food-safety-net programmes focus on post-disaster food aid (following floods and landslides, for example),
2012 2013 2014 2015 2016Affordability score improvements
Source: Economist Intelligence Unit
Ecuador Indonesia Myanmar Paraguay25
30
35
40
45
50
55
60
65
© The Economist Intelligence Unit Limited 201613
Global food security index 2016 An annual measure of the state of global food security
school feeding programmes and food assistance to vulnerable people displaced by armed conflict.5
There is plenty of potential in improving countries’ access to agricultural credit. More than one-half of the 113 countries covered by the GFSI lack broad farmer finance or well-developed multilateral farmer-finance programmes. In eight countries, farmers have virtually no access to government or multilateral farmer-financing programmes, while in another 26 such access is very limited. There are only four non-high-income countries—Belarus, Brazil, Bulgaria and Romania—that provide deep and broad finance for their farmers. Ecuador, Chile and Belarus have experienced improvements in 2016. Belarus is channelling significant resources from its national budget into credit to agriculture: according to the FAO, agricultural
5 UN World Food Programme (WFP). (2015). “10 Facts About Hunger In Myanmar”. Available at https://www.wfp.org/stories/10-facts-about-hunger-myanmar WFP. (2012). “WFP in Myanmar: Looking forward 2013-2017”. Available at http://www.themimu.info/sites/themimu.info/files/documents/RefDoc_UNMyanmar_WFP_Looking%20Forward%20(2013-2017).pdf
credit makes up over 20% of total credit made available in the budget in Belarus, the third-highest of the 90 countries that provide such data. Chile is another country in which market-oriented farmers are no longer credit-constrained, and is among the 36 countries with deep farm finance.
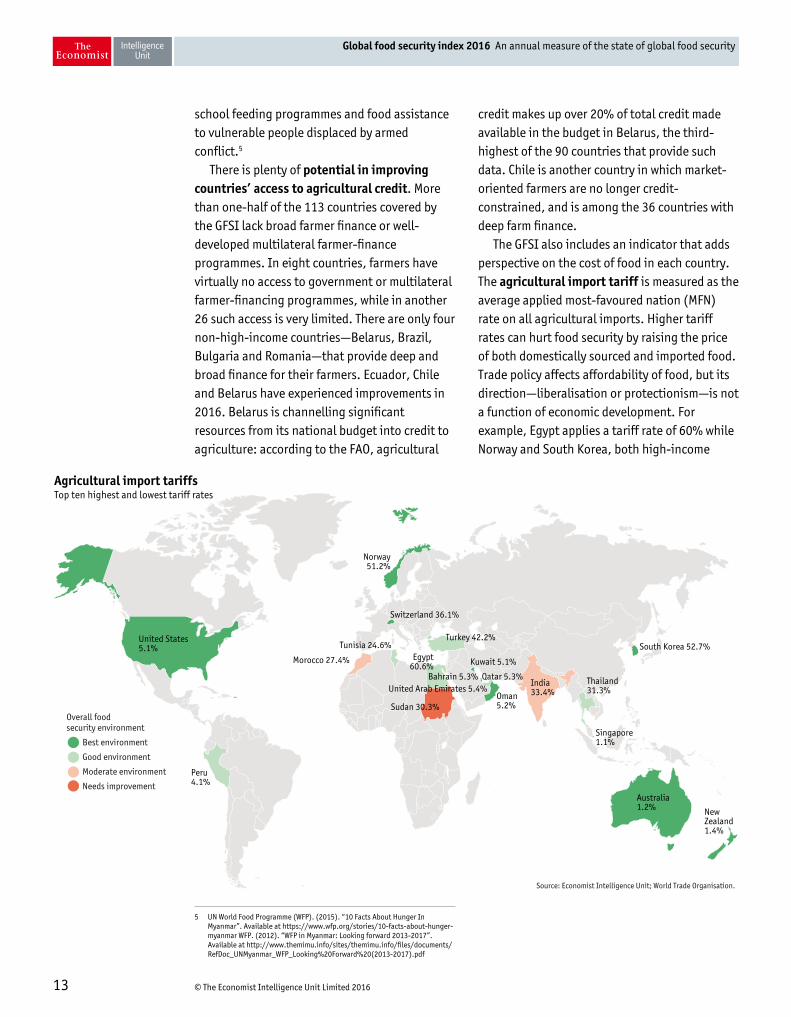
The GFSI also includes an indicator that adds perspective on the cost of food in each country. The agricultural import tariff is measured as the average applied most-favoured nation (MFN) rate on all agricultural imports. Higher tariff rates can hurt food security by raising the price of both domestically sourced and imported food. Trade policy affects affordability of food, but its direction—liberalisation or protectionism—is not a function of economic development. For example, Egypt applies a tariff rate of 60% while Norway and South Korea, both high-income
Agricultural import tariffsTop ten highest and lowest tariff rates
Overall food security environment
Best environment
Good environment
Moderate environment
Needs improvement
Source: Economist Intelligence Unit; World Trade Organisation.
Singapore1.1%
Thailand31.3%
Australia1.2%
Peru4.1%
United States5.1%
Kuwait 5.1%
Oman5.2%
India33.4%
Qatar 5.3%United Arab Emirates 5.4%
Tunisia 24.6%Egypt
60.6%Morocco 27.4%
Sudan 30.3%
Bahrain 5.3%
Switzerland 36.1%
Turkey 42.2%South Korea 52.7%
Norway51.2%
New Zealand1.4%
© The Economist Intelligence Unit Limited 201614
Global food security index 2016 An annual measure of the state of global food security
countries, apply rates of over 50%.The link between trade liberalisation and food
security is complex.6 Our data show that scores for tariffs on agricultural imports declined in 105 of the 113 countries covered. Agricultural tariffs fell and boosted short-run food affordability in only seven countries and Egypt’s agricultural import tariff score remained unchanged. The weakest performers in this category represent a variety of regions and income levels: Egypt (with tariffs of 60.6%), South Korea (52.7%) and Norway (51.2%) have the highest agricultural tariff rates. By contrast, Australia (1.2%), New Zealand (1.4%) and Singapore (1.1%) have the lowest agricultural tariff rates and are the best performers on this indicator. Angola experienced a 24-point worsening in its score as a result of a rise from 9.8% to 23.2% in its tariff rate, resulting in a 2.4-point deterioration in its overall Affordability score. Trade policy alone is unlikely to guarantee net benefits in food security. However, in combination with complementary policies that facilitate the process of adjustment to changing patterns of production, and measures that shield disadvantaged groups from fluctuations in agricultural wages, trade policy has a role to play.
Noteworthy findings The 2016 GFSI shows that average global food affordability peaked in 2015. In 2016 it has improved in only Central & South America (+0.3 points), Asia & Pacific (+0.2) and Europe (+0.1). The average Affordability score has fallen across all income categories with the exception of upper-middle-income countries. The most recent reading comes after four straight years of rises (from 2012 to 2015) in the global Affordability score.
There is a direct relationship between food
6 FAO. (2003). “Trade Reforms and Food Security”. Available at ftp://ftp.fao.org/docrep/fao/005/y4671e/y4671e00.pdf
affordability and a country’s level of economic development. The data show, however, that middle-income and upper-middle-income countries have experienced the biggest improvements in affordability, while low-income countries are being left behind. During 2012-16 the Affordability score of low-income countries has improved by only 1.9%; this compares with rises of 5.2% for middle-income countries and of 5.4% for upper-middle-income countries respectively. In the same period the Affordability score for rich countries has hardly changed, improving by just 0.1%. The average gain for all countries is 2.4%. The findings suggest that once a country reaches a certain level of development, often associated with higher income but also with improved governance, its capacity to deal with food insecurity improves rapidly and then remains high. Such capacity gains tend to be substantial when countries make the transition from low-income to middle-income status, but peter out once nations reach upper-middle-income status or become high-income countries.
The Gulf Cooperation Council (GCC) countries perform well on Affordability because of their extremely high levels of annual income per head, averaging US$67,795; this compares with an average of US$41,092 across high-income countries and US$1,424 in low-income countries, and a global average of US$18,711. Additionally, the GCC members rank consistently highly on the agricultural imports tariff indicator. To address the widening gap between consumption and production, GCC countries have steered down their agricultural imports tariffs. Some 60–90% of food consumption in the GCC countries is met by imports.7 Unlike other countries, they have steered away from notions of food self-sufficiency, in part because they do not rely on revenue from taxes on trade.
7 Houcine Boughanmi, Sarath Kodithuwakku and Jeevika Weerahewa. (2014). “Food and Agricultural Trade in the GCC: An Opportunity for South Asia?”. Available at http://www.unescap.org/sites/default/files/Food%20and%20Agricultural%20Trade%20in%20the%20GCC_Jeevika_Sept2014.pdf
© The Economist Intelligence Unit Limited 201615
Global food security index 2016 An annual measure of the state of global food security
Category overview This category assesses factors that influence the supply of food and the ease of access to food. It examines how structural aspects determine a country’s capacity to produce and distribute food, and explores elements that might create bottlenecks or risks to robust availability.
Availability is measured across eight indicators: l Sufficiency of supplyl Public expenditure on agricultural research
and development (R&D)l Agricultural infrastructurel Volatility of agricultural productionl Political stability risk l Corruptionl Urban absorption capacityl Food loss
Affordable food has less value if access to it is difficult. Economies with fewer structural restrictions on food availability and more advanced agricultural markets tend to have environments that are more conducive to food security. Such environments are often less at risk of food supply shocks and can handle shocks better when they arise.
Top performers and trends Economies with fewer structural restrictions on food availability (from both markets and government) and more advanced agricultural markets (in terms of infrastructure and public support) tend to have environments that are suited to delivering food security.
The US is the top performer in the Availability category, followed by Ireland, Germany and France. The US performs well on most of the eight indicators, especially
sufficiency of supply, public expenditure on agricultural R&D and the existence of crop storage facilities. It ranks third on food loss (only Finland and Singapore perform better). The US tops this year’s overall GFSI largely because of its strong performance in this category (it ranks joint third on Affordability and third on Quality & Safety).
Nearly all countries in the top ten of the Availability category are from Europe or North America (the sole exception is New Zealand, which ranks eighth). All of them are stable, developed economies that prioritise infrastructure investment. The top 20 countries in the Availability category are all multiparty democracies. Six countries in the top ten are also in the top ten of the EIU’s Democracy Index, which ranks the state of democracy in 165 countries.
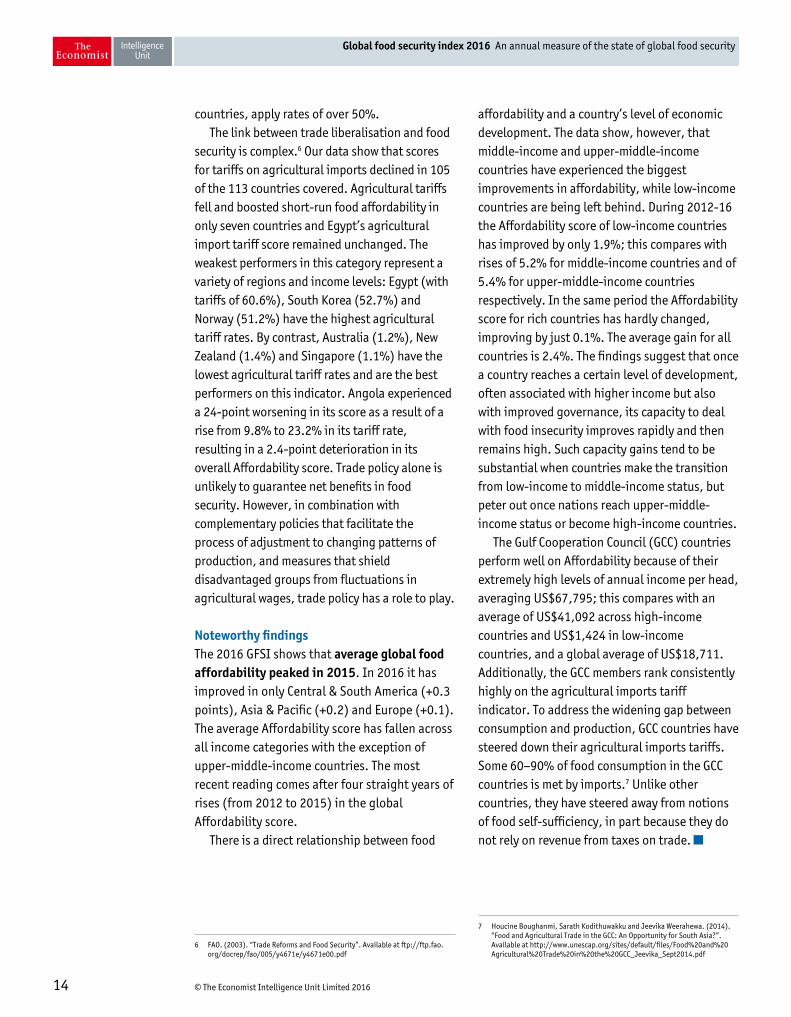
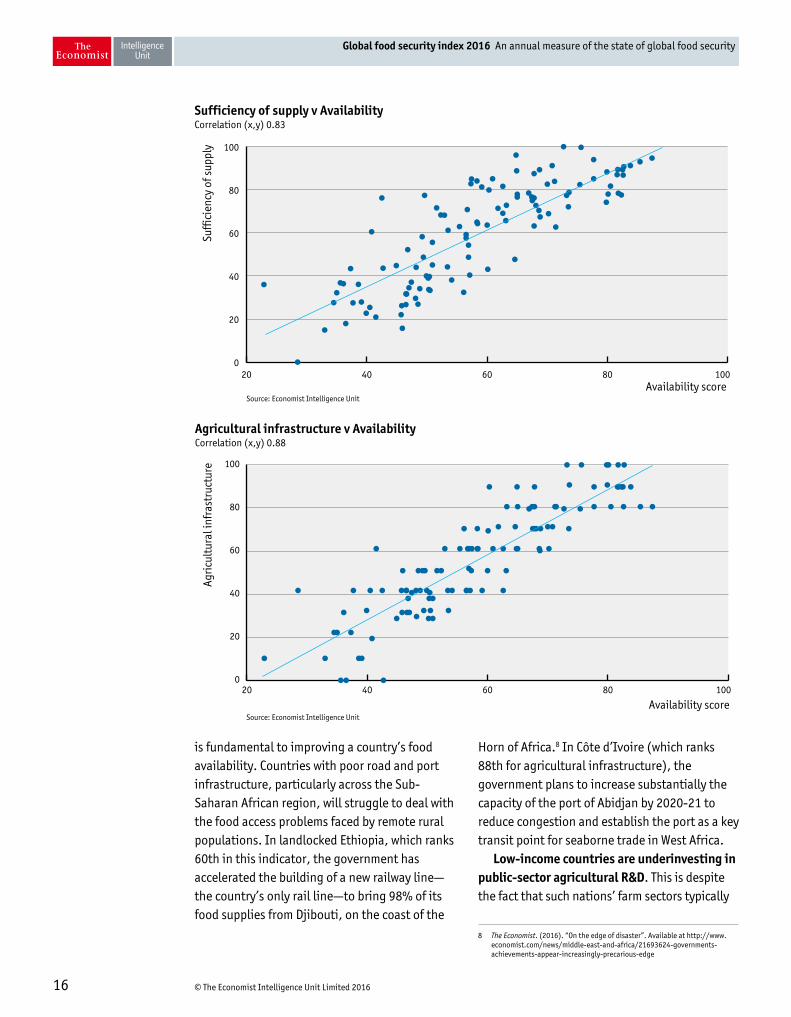
There is a strong correlation between the Availability score and the overall GFSI score (at 0.95). The closest correlation exists between the overall Availability score and sufficiency of food supply (measured by average daily calorie intake and dependency on chronic food aid); and also between overall Availability and the quality of agricultural infrastructure (namely road and port infrastructure and crop storage capacity). The level of corruption—a proxy for the quality of governance—is also highly negatively correlated with a country’s capacity to ensure food availability (at -0.77). Other indicators, such as public expenditure on agricultural R&D, display a looser link with overall availability.
Opportunities for improvement Although it requires significant investment, developing agricultural infrastructure, including crop storage facilities, roads and ports,
Availability
© The Economist Intelligence Unit Limited 201616
Global food security index 2016 An annual measure of the state of global food security
is fundamental to improving a country’s food availability. Countries with poor road and port infrastructure, particularly across the Sub-Saharan African region, will struggle to deal with the food access problems faced by remote rural populations. In landlocked Ethiopia, which ranks 60th in this indicator, the government has accelerated the building of a new railway line—the country’s only rail line—to bring 98% of its food supplies from Djibouti, on the coast of the
Horn of Africa.8 In Côte d’Ivoire (which ranks 88th for agricultural infrastructure), the government plans to increase substantially the capacity of the port of Abidjan by 2020-21 to reduce congestion and establish the port as a key transit point for seaborne trade in West Africa.
Low-income countries are underinvesting in public-sector agricultural R&D. This is despite the fact that such nations’ farm sectors typically
8 The Economist. (2016). “On the edge of disaster”. Available at http://www.economist.com/news/middle-east-and-africa/21693624-governments-achievements-appear-increasingly-precarious-edge
Agricultural infrastructure v AvailabilityCorrelation (x,y) 0.88
Source: Economist Intelligence Unit
Agri
cult
ural
infr
astr
uctu
re
Availability score20 40 60 80 100
0
20
40
60
80
100
Sufficiency of supply v AvailabilityCorrelation (x,y) 0.83
Source: Economist Intelligence Unit
Suff
icie
ncy
of s
uppl
y
Availability score20 40 60 80 100
0
20
40
60
80
100
© The Economist Intelligence Unit Limited 201617
Global food security index 2016 An annual measure of the state of global food security
account for a much larger share of incomes and employment than is the case in richer countries. As a result, many low-income countries lack the capacity to make use of advances in technology and knowledge to reduce food insecurity. They urgently need to develop this capacity so that they can raise yields, develop more climate-resilient crops and avoid environmental degradation. Much of this kind of investment is of a public-good nature, so that public funds will have to lead the way in order to secure these social gains.9 The funding of agricultural research in developing countries by the public sector and donor agencies has fallen since the 1980s, and this trend needs to be reversed. In developed countries, which tend to have the financial infrastructure and regulatory frameworks that encourage private-sector investment, shortcomings in agricultural R&D are less of an obstacle to ensuring long-term food security.
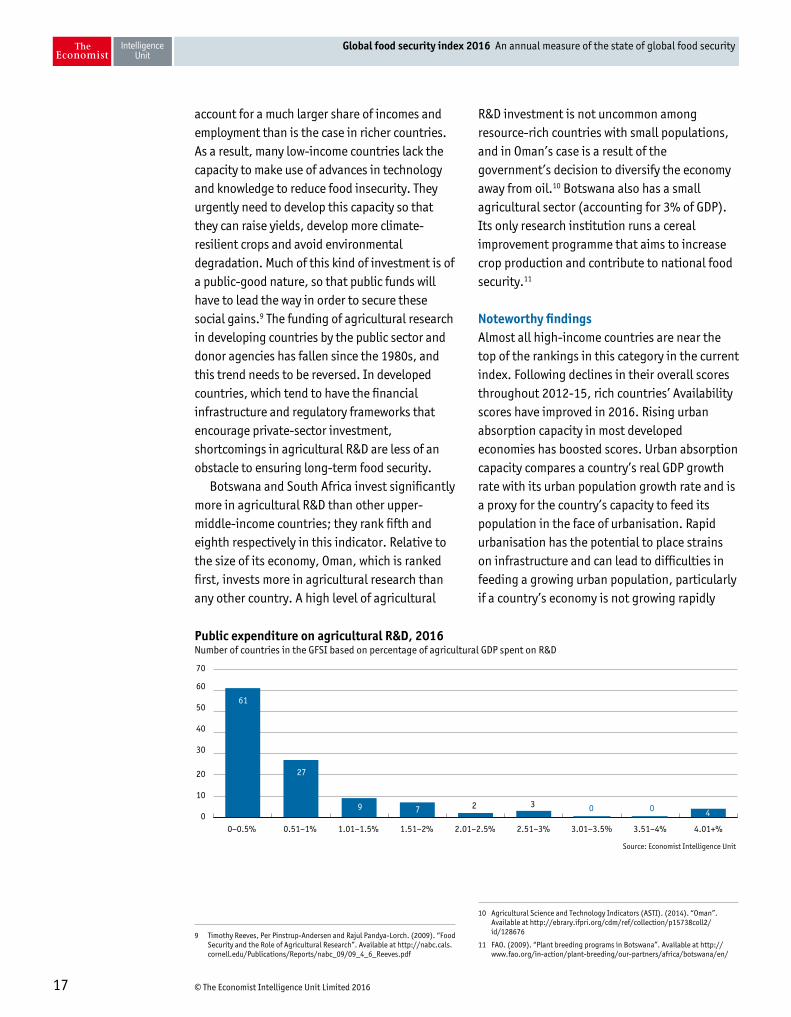
Botswana and South Africa invest significantly more in agricultural R&D than other upper-middle-income countries; they rank fifth and eighth respectively in this indicator. Relative to the size of its economy, Oman, which is ranked first, invests more in agricultural research than any other country. A high level of agricultural
9 Timothy Reeves, Per Pinstrup-Andersen and Rajul Pandya-Lorch. (2009). “Food Security and the Role of Agricultural Research”. Available at http://nabc.cals.cornell.edu/Publications/Reports/nabc_09/09_4_6_Reeves.pdf
R&D investment is not uncommon among resource-rich countries with small populations, and in Oman’s case is a result of the government’s decision to diversify the economy away from oil.10 Botswana also has a small agricultural sector (accounting for 3% of GDP). Its only research institution runs a cereal improvement programme that aims to increase crop production and contribute to national food security.11
Noteworthy findings Almost all high-income countries are near the top of the rankings in this category in the current index. Following declines in their overall scores throughout 2012-15, rich countries’ Availability scores have improved in 2016. Rising urban absorption capacity in most developed economies has boosted scores. Urban absorption capacity compares a country’s real GDP growth rate with its urban population growth rate and is a proxy for the country’s capacity to feed its population in the face of urbanisation. Rapid urbanisation has the potential to place strains on infrastructure and can lead to difficulties in feeding a growing urban population, particularly if a country’s economy is not growing rapidly
10 Agricultural Science and Technology Indicators (ASTI). (2014). “Oman”. Available at http://ebrary.ifpri.org/cdm/ref/collection/p15738coll2/id/128676
11 FAO. (2009). “Plant breeding programs in Botswana”. Available at http://www.fao.org/in-action/plant-breeding/our-partners/africa/botswana/en/
Public expenditure on agricultural R&D, 2016Number of countries in the GFSI based on percentage of agricultural GDP spent on R&D
Source: Economist Intelligence Unit
0–0.5% 0.51–1% 1.01–1.5% 1.51–2% 2.01–2.5% 2.51–3% 3.01–3.5% 3.51–4% 4.01+%0
10
20
30
40
50
60
70
61
27
9 7 2 3 0 0 4
© The Economist Intelligence Unit Limited 201618
Global food security index 2016 An annual measure of the state of global food security
enough to pay for the changes.12 With incomes rising and the rush to the cities slowing, in 2016 urban absorption capacity has improved in 108 out of 113 countries (it has declined in five and is unchanged in Sri Lanka).
Volatility of agricultural production is largely independent of the level of development; in other words, countries in all income groups and regions experience large swings in agricultural output. In 2016, Asia & Pacific displaces North America as the region with the most stable agricultural production. Central & South America comes third, followed by the GCC countries, Sub-Saharan Africa, and the Middle East and North Africa. The region that experiences the biggest swings in agricultural output, Europe, is among those best equipped to absorb them, as fairly high personal incomes and development levels counterbalance production volatility.
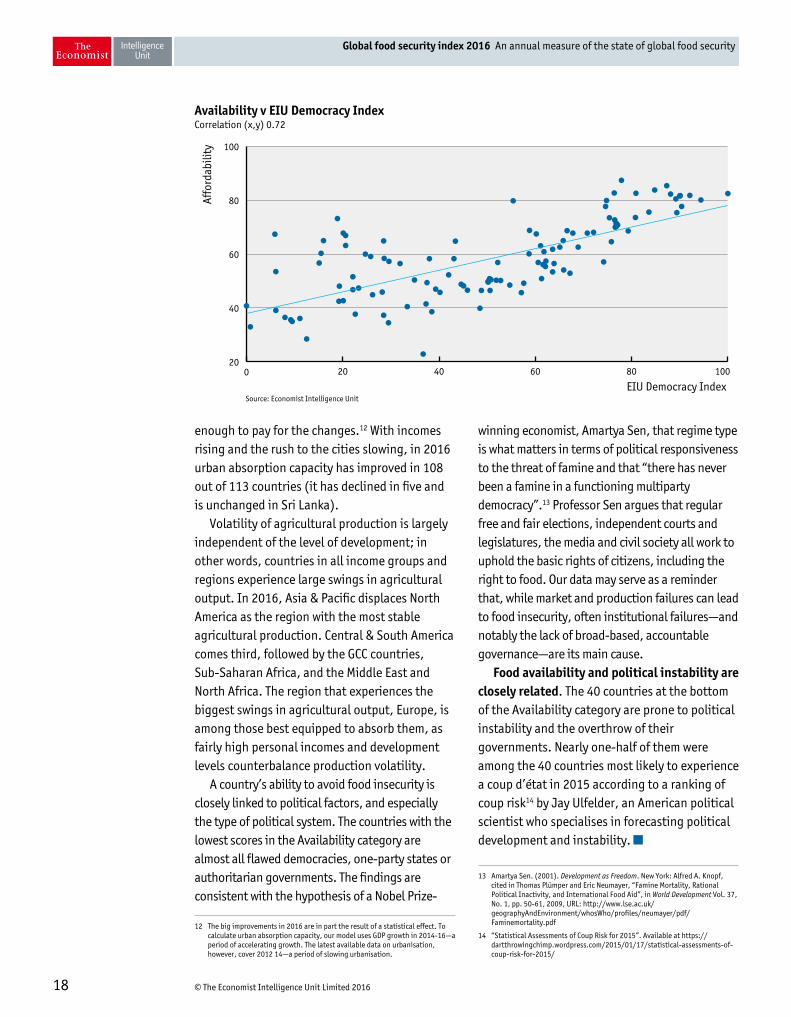
A country’s ability to avoid food insecurity is closely linked to political factors, and especially the type of political system. The countries with the lowest scores in the Availability category are almost all flawed democracies, one-party states or authoritarian governments. The findings are consistent with the hypothesis of a Nobel Prize-
12 The big improvements in 2016 are in part the result of a statistical effect. To calculate urban absorption capacity, our model uses GDP growth in 2014-16—a period of accelerating growth. The latest available data on urbanisation, however, cover 2012 14—a period of slowing urbanisation.
winning economist, Amartya Sen, that regime type is what matters in terms of political responsiveness to the threat of famine and that “there has never been a famine in a functioning multiparty democracy”.13 Professor Sen argues that regular free and fair elections, independent courts and legislatures, the media and civil society all work to uphold the basic rights of citizens, including the right to food. Our data may serve as a reminder that, while market and production failures can lead to food insecurity, often institutional failures—and notably the lack of broad-based, accountable governance—are its main cause.
Food availability and political instability are closely related. The 40 countries at the bottom of the Availability category are prone to political instability and the overthrow of their governments. Nearly one-half of them were among the 40 countries most likely to experience a coup d’état in 2015 according to a ranking of coup risk14 by Jay Ulfelder, an American political scientist who specialises in forecasting political development and instability.
13 Amartya Sen. (2001). Development as Freedom. New York: Alfred A. Knopf, cited in Thomas Plümper and Eric Neumayer, “Famine Mortality, Rational Political Inactivity, and International Food Aid”, in World Development Vol. 37, No. 1, pp. 50-61, 2009, URL: http://www.lse.ac.uk/geographyAndEnvironment/whosWho/profiles/neumayer/pdf/Faminemortality.pdf
14 “Statistical Assessments of Coup Risk for 2015”. Available at https://dartthrowingchimp.wordpress.com/2015/01/17/statistical-assessments-of-coup-risk-for-2015/
Availability v EIU Democracy IndexCorrelation (x,y) 0.72
Source: Economist Intelligence Unit
Affo
rdab
ility
EIU Democracy Index0 20 40 60 80 100
20
40
60
80
100
© The Economist Intelligence Unit Limited 201619
Global food security index 2016 An annual measure of the state of global food security
Category overview The third category in the GFSI explores the nutritional quality of average diets and the food safety environment in each country. In the literature on food security, this category is sometimes referred to as “utilisation”, because it explores the energy and nutrient intake, safe food preparation and the diversity of the diet.15
Food quality and safety is measured across five indicators: l Diet diversification l Nutritional standardsl Micronutrient availabilityl Protein qualityl Food safety
The Quality & Safety category moves beyond the traditional welfare metrics, such as poverty and issues of access and supply, and explores the overall quality of food supplies, based on the understanding that food security requires that people have access to nutritious food that meets dietary needs.
Top performers and trends High-income countries with good governance perform especially well in the Quality & Safety category. The best 27 performers are all high-income countries. They dominate the rankings for nearly all the indicators that make up the Quality & Safety category. Two non-high-income countries, Mexico and Malaysia, are present in the top 20 in the micronutrient availability indicator; Belarus and Brazil are the non-high-income countries that make the top quartile in the category that measures protein quality. In
15 FAO. (2008). “An Introduction to the Basic Concepts of Food Security”. Available at http://www.fao.org/docrep/013/al936e/al936e00.pdf
the food-safety indicator, Romania and Turkey are the only non-high-income countries that match the scores of high-income countries such as Austria, Germany and Japan. The type of political system appears to matters greatly: all the top performers in the Quality & Safety category are multiparty democracies with good governance. The best-performing authoritarian government, at 25th, is Oman.
Portugal ranks first in the Quality & Safety category, followed by France, the US, Australia and Greece. Portugal comes first for the fifth straight year on the back of high scores in the indicators relating to diet diversification, nutritional standards, food safety and protein quality. Interestingly, four countries that are outside the top ten in the overall GSFI, as well as in both the Availability and Affordability categories, make the top ten when it comes to Quality & Safety. They are Greece (fifth), Spain (sixth), Finland (eighth) and Israel (tenth)—all high-income coastal countries with big fisheries and aquaculture sectors.
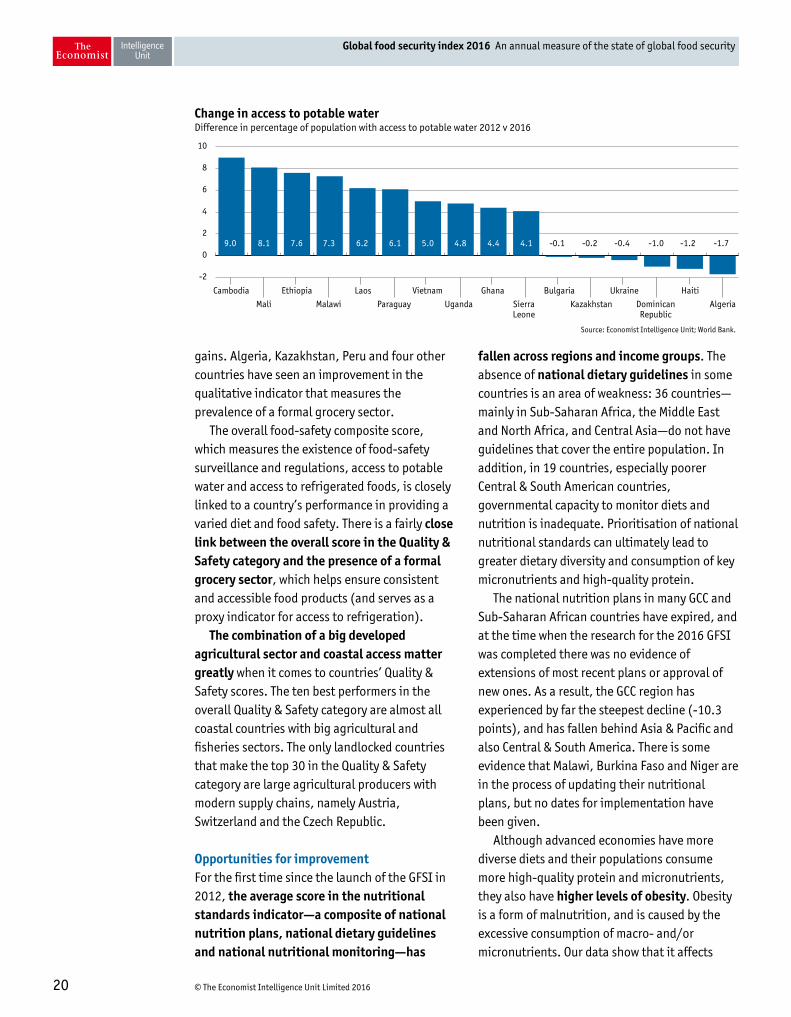
The countries that have achieved the largest improvements are led by Benin (+4.7), Philippines (+2.3), Peru (+2.2) and Venezuela (+2.1); however, most of the countries that see the biggest rises in their scores are ranked in the bottom half of both the overall index and the Quality & Safety category. The Quality & Safety score has improved for 35 countries; the main driver of this improvement is a broad rise in the percentage of the population with access to potable water, where Cambodia (+3.8), Mali (+3.5) and Malawi (+3.4) made the biggest
Quality & Safety
© The Economist Intelligence Unit Limited 201620
Global food security index 2016 An annual measure of the state of global food security
gains. Algeria, Kazakhstan, Peru and four other countries have seen an improvement in the qualitative indicator that measures the prevalence of a formal grocery sector.
The overall food-safety composite score, which measures the existence of food-safety surveillance and regulations, access to potable water and access to refrigerated foods, is closely linked to a country’s performance in providing a varied diet and food safety. There is a fairly close link between the overall score in the Quality & Safety category and the presence of a formal grocery sector, which helps ensure consistent and accessible food products (and serves as a proxy indicator for access to refrigeration).
The combination of a big developed agricultural sector and coastal access matter greatly when it comes to countries’ Quality & Safety scores. The ten best performers in the overall Quality & Safety category are almost all coastal countries with big agricultural and fisheries sectors. The only landlocked countries that make the top 30 in the Quality & Safety category are large agricultural producers with modern supply chains, namely Austria, Switzerland and the Czech Republic.
Opportunities for improvement For the first time since the launch of the GFSI in 2012, the average score in the nutritional standards indicator—a composite of national nutrition plans, national dietary guidelines and national nutritional monitoring—has
fallen across regions and income groups. The absence of national dietary guidelines in some countries is an area of weakness: 36 countries—mainly in Sub-Saharan Africa, the Middle East and North Africa, and Central Asia—do not have guidelines that cover the entire population. In addition, in 19 countries, especially poorer Central & South American countries, governmental capacity to monitor diets and nutrition is inadequate. Prioritisation of national nutritional standards can ultimately lead to greater dietary diversity and consumption of key micronutrients and high-quality protein.
The national nutrition plans in many GCC and Sub-Saharan African countries have expired, and at the time when the research for the 2016 GFSI was completed there was no evidence of extensions of most recent plans or approval of new ones. As a result, the GCC region has experienced by far the steepest decline (-10.3 points), and has fallen behind Asia & Pacific and also Central & South America. There is some evidence that Malawi, Burkina Faso and Niger are in the process of updating their nutritional plans, but no dates for implementation have been given.
Although advanced economies have more diverse diets and their populations consume more high-quality protein and micronutrients, they also have higher levels of obesity. Obesity is a form of malnutrition, and is caused by the excessive consumption of macro- and/or micronutrients. Our data show that it affects
Change in access to potable waterDifference in percentage of population with access to potable water 2012 v 2016
Source: Economist Intelligence Unit; World Bank.
-2
0
2
4
6
8
10
Cambodia Ethiopia Laos Vietnam Ghana Bulgaria Ukraine Haiti
Mali Malawi Paraguay Uganda Sierra Kazakhstan Dominican Algeria Leone Republic
9.0 8.1 7.6 7.3 6.2 6.1 5.0 4.8 4.4 4.1 -0.1 -0.2 -0.4 -1.0 -1.2 -1.7
© The Economist Intelligence Unit Limited 201621
Global food security index 2016 An annual measure of the state of global food security
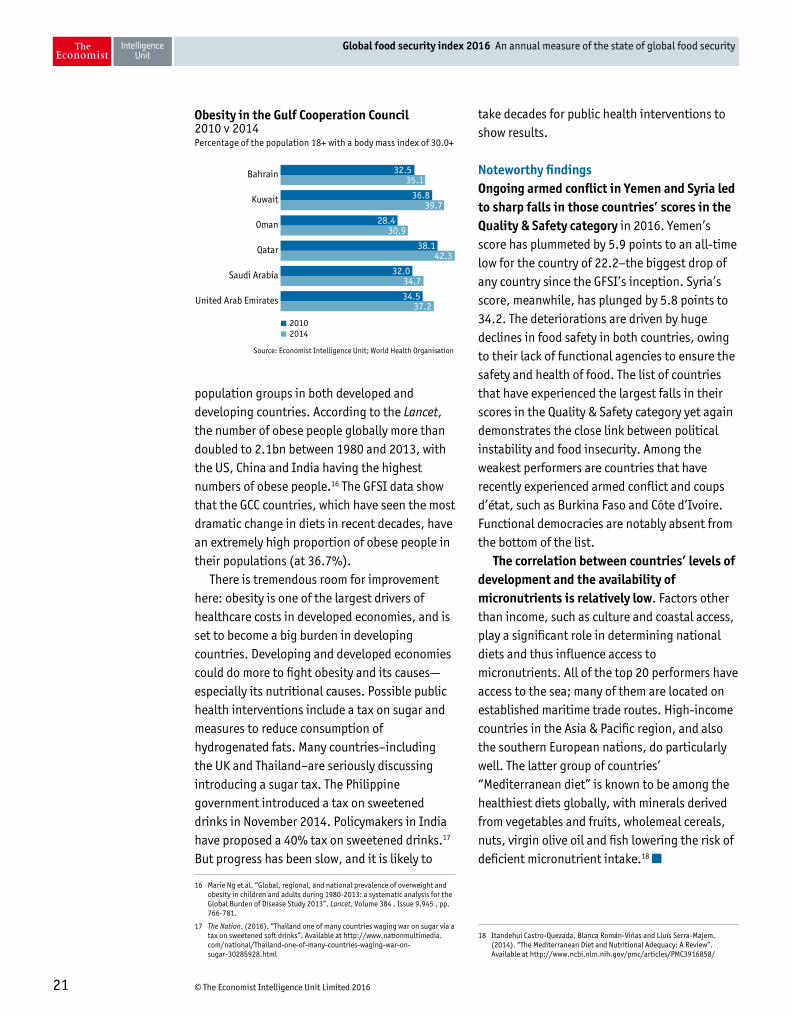
population groups in both developed and developing countries. According to the Lancet, the number of obese people globally more than doubled to 2.1bn between 1980 and 2013, with the US, China and India having the highest numbers of obese people.16 The GFSI data show that the GCC countries, which have seen the most dramatic change in diets in recent decades, have an extremely high proportion of obese people in their populations (at 36.7%).
There is tremendous room for improvement here: obesity is one of the largest drivers of healthcare costs in developed economies, and is set to become a big burden in developing countries. Developing and developed economies could do more to fight obesity and its causes—especially its nutritional causes. Possible public health interventions include a tax on sugar and measures to reduce consumption of hydrogenated fats. Many countries–including the UK and Thailand–are seriously discussing introducing a sugar tax. The Philippine government introduced a tax on sweetened drinks in November 2014. Policymakers in India have proposed a 40% tax on sweetened drinks.17 But progress has been slow, and it is likely to
16 Marie Ng et al. “Global, regional, and national prevalence of overweight and obesity in children and adults during 1980-2013: a systematic analysis for the Global Burden of Disease Study 2013”. Lancet, Volume 384 , Issue 9,945 , pp. 766-781.
17 The Nation. (2016). “Thailand one of many countries waging war on sugar via a tax on sweetened soft drinks”. Available at http://www.nationmultimedia.com/national/Thailand-one-of-many-countries-waging-war-on-sugar-30285928.html
take decades for public health interventions to show results.
Noteworthy findings Ongoing armed conflict in Yemen and Syria led to sharp falls in those countries’ scores in the Quality & Safety category in 2016. Yemen’s score has plummeted by 5.9 points to an all-time low for the country of 22.2–the biggest drop of any country since the GFSI’s inception. Syria’s score, meanwhile, has plunged by 5.8 points to 34.2. The deteriorations are driven by huge declines in food safety in both countries, owing to their lack of functional agencies to ensure the safety and health of food. The list of countries that have experienced the largest falls in their scores in the Quality & Safety category yet again demonstrates the close link between political instability and food insecurity. Among the weakest performers are countries that have recently experienced armed conflict and coups d’état, such as Burkina Faso and Côte d’Ivoire. Functional democracies are notably absent from the bottom of the list.
The correlation between countries’ levels of development and the availability of micronutrients is relatively low. Factors other than income, such as culture and coastal access, play a significant role in determining national diets and thus influence access to micronutrients. All of the top 20 performers have access to the sea; many of them are located on established maritime trade routes. High-income countries in the Asia & Pacific region, and also the southern European nations, do particularly well. The latter group of countries’ “Mediterranean diet” is known to be among the healthiest diets globally, with minerals derived from vegetables and fruits, wholemeal cereals, nuts, virgin olive oil and fish lowering the risk of deficient micronutrient intake.18
18 Itandehui Castro-Quezada, Blanca Román-Viñas and Lluís Serra-Majem. (2014). “The Mediterranean Diet and Nutritional Adequacy: A Review”. Available at http://www.ncbi.nlm.nih.gov/pmc/articles/PMC3916858/
Obesity in the Gulf Cooperation Council2010 v 2014 Percentage of the population 18+ with a body mass index of 30.0+
Source: Economist Intelligence Unit; World Health Organisation
20102014
Bahrain
Kuwait
Oman
Qatar
Saudi Arabia
United Arab Emirates
32.5 35.1
36.8 39.7
28.4 30.9
38.1 42.3
32.0 34.7
34.5 37.2
© The Economist Intelligence Unit Limited 201622
Global food security index 2016 An annual measure of the state of global food security
Category overview The regional perspective on overall food security can shed light on the commonalities that often exist between and within regions. It also offers insight into the GFSI’s individual components, their interaction, and possible solutions to food-security issues common to many countries.
Top performers and trends The best-performing regions overall in the GFSI are North America, Europe and the GCC. Unsurprisingly, their performances are closely linked to their high levels of average income per head and the positive impact of this on food affordability. The average household in North America, for instance, spends a mere 13% of its income on food, while in Europe the proportion is only slightly higher, at 17.2%. This compares with 34.9% in Asia & Pacific and 40.6% Sub-Saharan Africa. The presence of food safety-net programmes, access to farm finance and low poverty rates drive the top performers’ scores in the Affordability category. Factors that are strongly correlated with countries’ performances in the Availability and Quality & Safety categories include quality of agricultural infrastructure, micronutrient availability, and public policy regarding nutritional and food standards.
Three GCC member countries—Qatar, the UAE and Kuwait—rank highly in the Affordability category. Qatar tops the rankings, followed by the UAE (third) and Kuwait (sixth). All three are high-income countries with a low prevalence of poverty and plenty of public money flowing into their small agricultural sectors. Poor scores in the Availability and Quality & Safety categories hold back the GCC countries’ overall GFSI scores;
fluctuations in agricultural output (on account of their extreme climate and small agricultural sectors), high political stability risk and struggles with urban absorption are their main weaknesses. Most GCC countries have seen an explosion of urbanisation in recent decades.19 This unprecedented process has led to the loss or degradation of agricultural land (urban absorption capacity is particularly limited in Kuwait and Oman). In addition, the expiry of national nutrition plans in Bahrain and the UAE in 2015 has contributed to these states’ weaker performances in the Availability and Quality & Safety categories.
After years of deteriorations in its scores, in 2016 Europe has, for the first time, recorded a greater gain in the overall index than any other region. (It is followed by Central & South America and North America.) Economic recovery is one factor driving Europe’s improvement, as urban absorption capacity has risen by an average of more than 20 points in the region. All European countries see improvements, with the PIIGS (Portugal, Ireland, Italy, Greece and
19 Antar AbouKorin. (2014). “Impacts of Rapid Urbanisation in the Arab World: the Case of Dammam Metropolitan Area, Saudi Arabia”. Available at https://www.researchgate.net/publication/263847805_Impacts_of_Rapid_Urbanisation_in_the_Arab_World_the_Case_of_Dammam_Metropolitan_Area_Saudi_Arabia
Regional comparisons
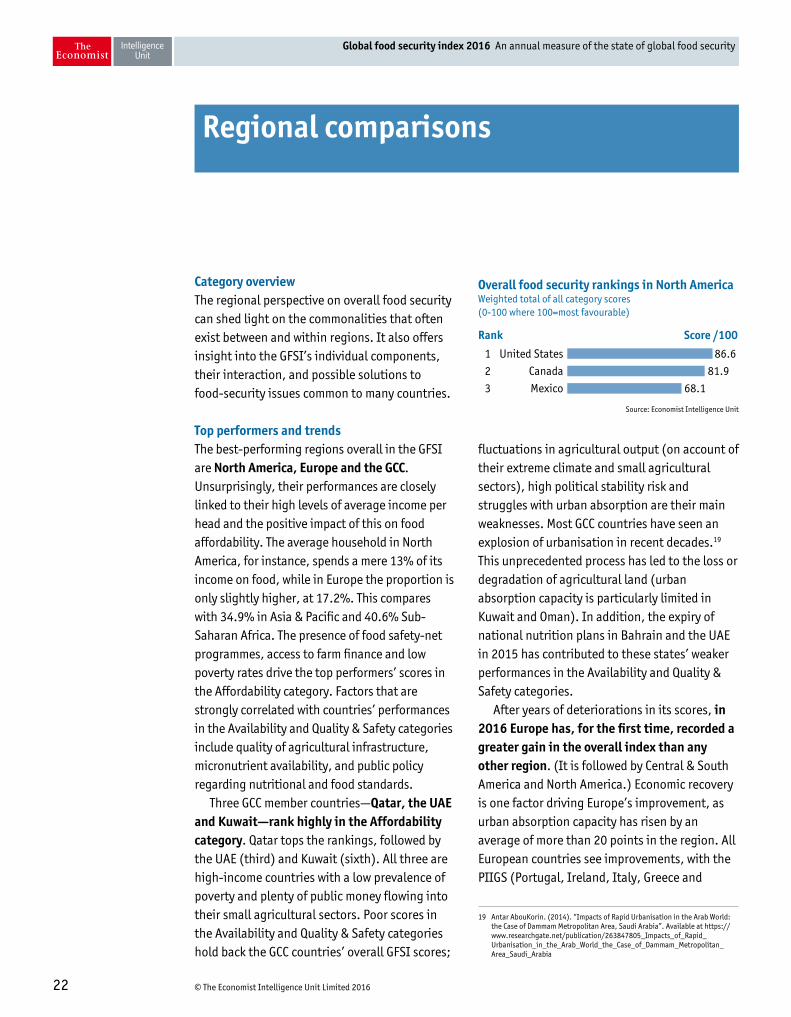
Rank Score /100
1 United States 86.6
2 Canada 81.9
3 Mexico 68.1
Overall food security rankings in North AmericaWeighted total of all category scores (0-100 where 100=most favourable)
Source: Economist Intelligence Unit
© The Economist Intelligence Unit Limited 201623
Global food security index 2016 An annual measure of the state of global food security
Spain) recording some of the biggest gains. Higher incomes have reduced the pressure in urban settings, where reliance on purchased food is a leading factor in households’ food insecurity within poor populations.
Opportunities for improvementThe public sector, multilaterals and the private sector should consider investing more heavily in infrastructure development, especially in Sub-Saharan Africa. Sub-Saharan Africa lags behind its peers—including the poorest countries in Asia & Pacific and Central & South America (the regions with the second- and third-weakest scores respectively for the infrastructure-related indicators). Road
infrastructure is an area of particular weakness, but investment in port development would also be beneficial. In many low-income countries a lack of adequate crop storage facilities still leads to massive post-harvest losses. This leaves less food for consumption, and drives up the price of food and the availability of seeds. Many storage facilities are in poor condition, are infested or their capacity is simply too small. In Sub-Saharan Africa, according to the FAO, one-third of all food produced is lost before it reaches the marketplace. Investment in storage space within the supply chain is seen as a means by which significant improvements in food
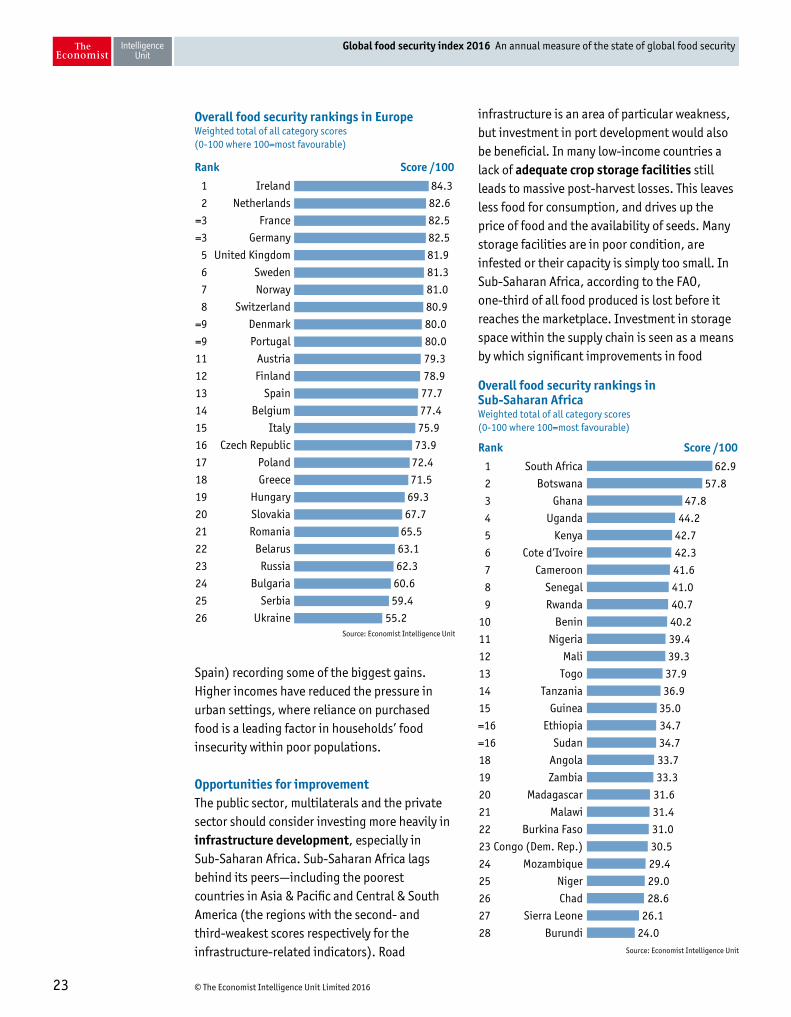
Rank Score /100
1 Ireland 84.3
2 Netherlands 82.6
=3 France 82.5
=3 Germany 82.5
5 United Kingdom 81.9
6 Sweden 81.3
7 Norway 81.0
8 Switzerland 80.9
=9 Denmark 80.0
=9 Portugal 80.0
11 Austria 79.3
12 Finland 78.9
13 Spain 77.7
14 Belgium 77.4
15 Italy 75.9
16 Czech Republic 73.9
17 Poland 72.4
18 Greece 71.5
19 Hungary 69.3
20 Slovakia 67.7
21 Romania 65.5
22 Belarus 63.1
23 Russia 62.3
24 Bulgaria 60.6
25 Serbia 59.4
26 Ukraine 55.2
Overall food security rankings in EuropeWeighted total of all category scores (0-100 where 100=most favourable)
Source: Economist Intelligence Unit
Rank Score /100
1 South Africa 62.9
2 Botswana 57.8
3 Ghana 47.8
4 Uganda 44.2
5 Kenya 42.7
6 Cote d’Ivoire 42.3
7 Cameroon 41.6
8 Senegal 41.0
9 Rwanda 40.7
10 Benin 40.2
11 Nigeria 39.4
12 Mali 39.3
13 Togo 37.9
14 Tanzania 36.9
15 Guinea 35.0
=16 Ethiopia 34.7
=16 Sudan 34.7
18 Angola 33.7
19 Zambia 33.3
20 Madagascar 31.6
21 Malawi 31.4
22 Burkina Faso 31.0
23 Congo (Dem. Rep.) 30.5
24 Mozambique 29.4
25 Niger 29.0
26 Chad 28.6
27 Sierra Leone 26.1
28 Burundi 24.0
Overall food security rankings in Sub-Saharan AfricaWeighted total of all category scores (0-100 where 100=most favourable)
Source: Economist Intelligence Unit
© The Economist Intelligence Unit Limited 201624
Global food security index 2016 An annual measure of the state of global food security
security can be made in the next few decades.20 Public expenditure on agricultural R&D is a
weakness across all regions and income groups. Only four countries (Ireland, the Netherlands, Oman and the US) spend more than 4% of their agricultural GDP on R&D, and an additional five countries spend more than 2%. Although the private sector has a substantial role to play in investing in agricultural R&D, governments need to lead the way. Many countries are resource-constrained and thus unable to fund R&D themselves, but they can prioritise developing financing structures and institutional capacity to encourage private-sector investment. Without prioritisation of innovation and technologies to increase efficiency and market access, national food-security systems will struggle to improve. Public-sector investment in technology is an important driver of countries’ ability to improve food availability by reducing food loss, developing transport networks, increasing supply, diversifying diets and widening the availability of nutrients.
For many farmers in developing countries, a lack of access to farm finance is a binding constraint on improving production efficiency and adopting better technologies. Twenty-five of the 28 countries in the Sub-Saharan region (the exceptions being Botswana, Kenya and South Africa) are positioned near the bottom of the rankings for this indicator. Governments, multilaterals and the non-governmental sector should redouble their efforts in the area of agricultural finance.
Noteworthy findings Structural elements play an important role in determining food security. In regions that include countries with differing economic systems, policy environments, agricultural infrastructure and nutritional standards, the gap between the strongest and weakest performers
20 Guardian. (2015). “Why we must invest in local food storage in sub-Saharan Africa”. Available at http://www.theguardian.com/sustainable-business/2015/jan/15/invest-local-food-storage-sub-saharan-africa
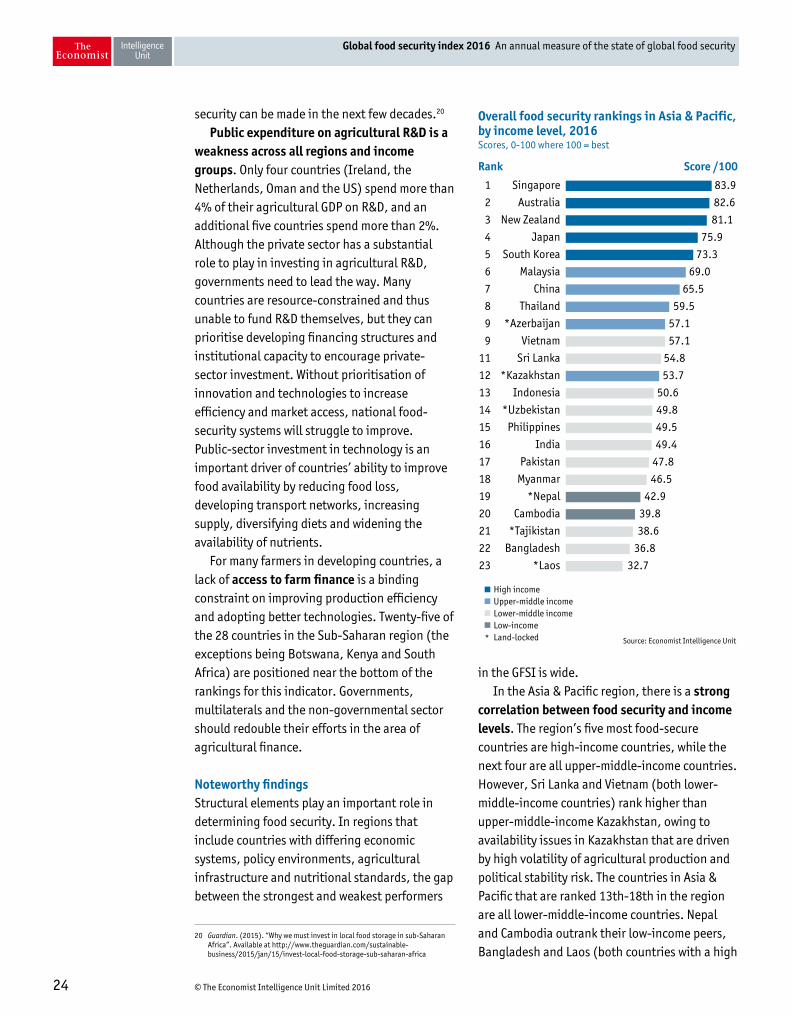
in the GFSI is wide. In the Asia & Pacific region, there is a strong
correlation between food security and income levels. The region’s five most food-secure countries are high-income countries, while the next four are all upper-middle-income countries. However, Sri Lanka and Vietnam (both lower-middle-income countries) rank higher than upper-middle-income Kazakhstan, owing to availability issues in Kazakhstan that are driven by high volatility of agricultural production and political stability risk. The countries in Asia & Pacific that are ranked 13th-18th in the region are all lower-middle-income countries. Nepal and Cambodia outrank their low-income peers, Bangladesh and Laos (both countries with a high
Rank Score /100
1 Singapore 83.9
2 Australia 82.6
3 New Zealand 81.1
4 Japan 75.9
5 South Korea 73.3
6 Malaysia 69.0
7 China 65.5
8 Thailand 59.5
9 *Azerbaijan 57.1
9 Vietnam 57.1
11 Sri Lanka 54.8
12 *Kazakhstan 53.7
13 Indonesia 50.6
14 *Uzbekistan 49.8
15 Philippines 49.5
16 India 49.4
17 Pakistan 47.8
18 Myanmar 46.5
19 *Nepal 42.9
20 Cambodia 39.8
21 *Tajikistan 38.6
22 Bangladesh 36.8
23 *Laos 32.7
Overall food security rankings in Asia & Pacific, by income level, 2016Scores, 0-100 where 100 = best
Source: Economist Intelligence Unit
High incomeUpper-middle incomeLower-middle incomeLow-incomeLand-locked*
© The Economist Intelligence Unit Limited 201625
Global food security index 2016 An annual measure of the state of global food security
incidence of poverty that struggle with food affordability), and also Tajikistan (a landlocked lower-middle-income country).
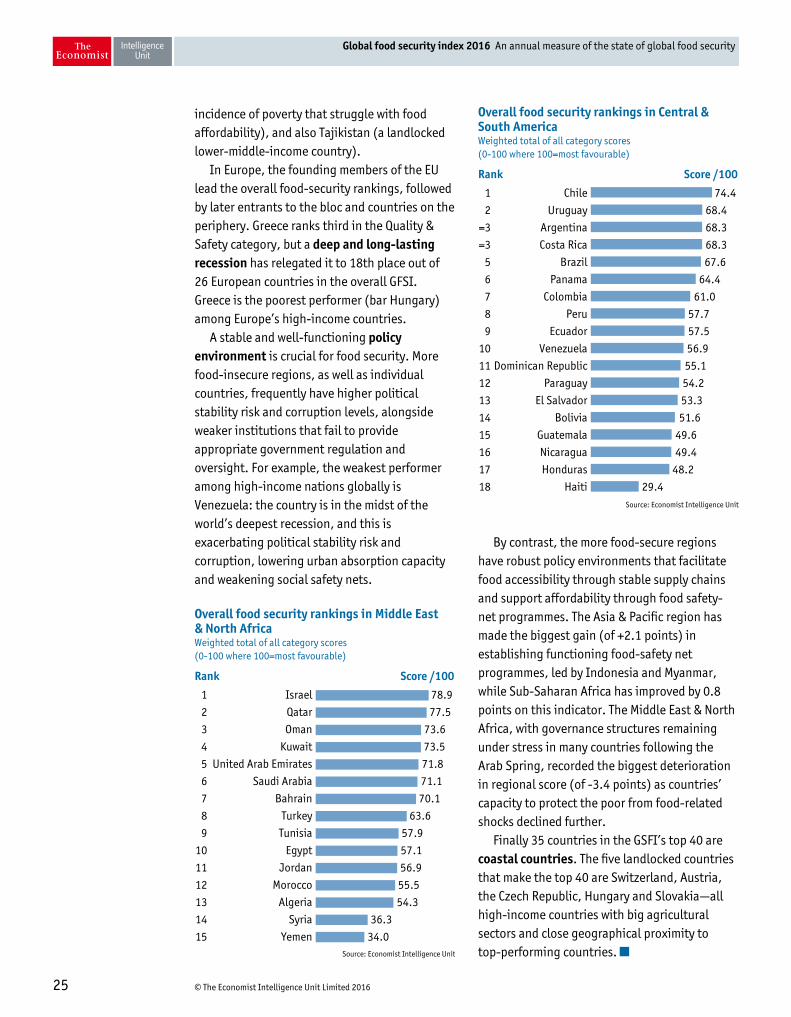
In Europe, the founding members of the EU lead the overall food-security rankings, followed by later entrants to the bloc and countries on the periphery. Greece ranks third in the Quality & Safety category, but a deep and long-lasting recession has relegated it to 18th place out of 26 European countries in the overall GFSI. Greece is the poorest performer (bar Hungary) among Europe’s high-income countries.
A stable and well-functioning policy environment is crucial for food security. More food-insecure regions, as well as individual countries, frequently have higher political stability risk and corruption levels, alongside weaker institutions that fail to provide appropriate government regulation and oversight. For example, the weakest performer among high-income nations globally is Venezuela: the country is in the midst of the world’s deepest recession, and this is exacerbating political stability risk and corruption, lowering urban absorption capacity and weakening social safety nets.
By contrast, the more food-secure regions have robust policy environments that facilitate food accessibility through stable supply chains and support affordability through food safety-net programmes. The Asia & Pacific region has made the biggest gain (of +2.1 points) in establishing functioning food-safety net programmes, led by Indonesia and Myanmar, while Sub-Saharan Africa has improved by 0.8 points on this indicator. The Middle East & North Africa, with governance structures remaining under stress in many countries following the Arab Spring, recorded the biggest deterioration in regional score (of -3.4 points) as countries’ capacity to protect the poor from food-related shocks declined further.
Finally 35 countries in the GSFI’s top 40 are coastal countries. The five landlocked countries that make the top 40 are Switzerland, Austria, the Czech Republic, Hungary and Slovakia—all high-income countries with big agricultural sectors and close geographical proximity to top-performing countries.
Rank Score /100
1 Chile 74.4
2 Uruguay 68.4
=3 Argentina 68.3
=3 Costa Rica 68.3
5 Brazil 67.6
6 Panama 64.4
7 Colombia 61.0
8 Peru 57.7
9 Ecuador 57.5
10 Venezuela 56.9
11 Dominican Republic 55.1
12 Paraguay 54.2
13 El Salvador 53.3
14 Bolivia 51.6
15 Guatemala 49.6
16 Nicaragua 49.4
17 Honduras 48.2
18 Haiti 29.4
Overall food security rankings in Central & South AmericaWeighted total of all category scores (0-100 where 100=most favourable)
Source: Economist Intelligence Unit
Rank Score /100
1 Israel 78.9
2 Qatar 77.5
3 Oman 73.6
4 Kuwait 73.5
5 United Arab Emirates 71.8
6 Saudi Arabia 71.1
7 Bahrain 70.1
8 Turkey 63.6
9 Tunisia 57.9
10 Egypt 57.1
11 Jordan 56.9
12 Morocco 55.5
13 Algeria 54.3
14 Syria 36.3
15 Yemen 34.0
Overall food security rankings in Middle East & North Africa Weighted total of all category scores (0-100 where 100=most favourable)
Source: Economist Intelligence Unit
© The Economist Intelligence Unit Limited 201626
Global food security index 2016 An annual measure of the state of global food security
Five year trends and outlook
Over the past five years, the Global Food Security Index (GFSI) has become a tool used worldwide across sectors to prioritise areas of action and improve national, regional and global food-security systems. Trends data from the index have been used to identify metrics that drive progress and systemic issues that impede it: countries that have invested in infrastructure, programmes, financing avenues and policy-based food-security and nutrition initiatives have made the greatest steps forward. However, pressures on food-security systems are growing, and both governments and the private sector must focus on addressing global food-security challenges. GFSI trends analysis not only tracks advances, but also highlights weaknesses in food-security structures that must be a focus for the future.
Economic development and food-security policy
Looking backIn the quest to improve food security, economic growth is an essential ingredient. As countries develop and most peoples’ incomes rise, food systems-related infrastructure and institutions are built and food security improves. Economic growth and development raise the incomes of the poor and improve their ability to gain access to food, health and education, while providing governments with the cash needed to make growth more equitable. The GSFI shows that in a favourable global environment in 2012-16—with historically low food prices and a recovering
global economy—most countries experienced slow but steady progress.
Remarkable transformations have taken place. As incomes rise and development occurs, the gap between children aged under five years in poor and wealthy families with regard to stunting closes, while inequalities of access to education, healthcare, water, sanitation and reproductive health also diminish. In Brazil, stunting has fallen from 37.1% to just 7.1% over the past 33 years. Despite this rising affluence in upper-middle-income countries, however, many people remain hungry. In these countries and in high-income ones, food insecurity remains rooted in disparities in ethnicity, gender, income and education.
Economic growth is no panacea. A 10% rise in GDP cuts chronic malnutrition by only 6%.21 The GFSI’s five-year trends show that once a country reaches a certain threshold of economic development, its capacity to battle food insecurity improves dramatically. Low-income countries (those with GDP per head of US$1,045 or less) have been making only very gradual progress on food security: in 2012-16 their average affordability score has risen by just 1.9%. This compares with increases of 5.2% and 5.4% respectively in the scores of middle-income and upper-middle-income countries. Rising incomes can pull countries some way up the slope towards greater food security, but they are not sufficient to enable a country to reach the point where rapid progress in reducing food insecurity occurs.
21 Maximo Torrero. (2014). “Food security brings economic growth—not the other way around”. International Food Policy Research Institute (IFPRI). Available at https://www.ifpri.org/blog/food-security-brings-economic-growth-not-other-way-around
© The Economist Intelligence Unit Limited 201627
Global food security index 2016 An annual measure of the state of global food security
Looking forwardWhat can governments do? Greater progress requires that country-based food-security policies shift from addressing the entire population to targeting the most vulnerable groups. Often, countries opt for blanket food subsidies, but targeted cash-transfer programmes can be a more effective way of ensuring food security for the neediest. Food banks, which meet the nutritional needs of vulnerable populations and redistribute surplus food, are another option. India’s school lunch programme, the world’s largest, may be imperfect, but it has largely been a success. One of the most powerful tools in terms of improving food security is to contain food price inflation.
While the absolute number of hungry people in the world is still rising, in upper-middle-income and high-income countries the poor, in particular, suffer from obesity. The battle with this common form of malnutrition underlines the importance of tax and other fiscal instruments in any sustainable food-security strategy. Food policies that make highly energy-dense foods cheaper than fruit and vegetables need to be reconsidered. Healthy foods need to be made more accessible to low-income populations. All of this requires good science, strong leadership, and evidence-based policymaking and consumer education.
Volatile food prices
Looking backSince 2012 global food security–as measured by the Global Food Security Index (GFSI)—has improved. Falling food prices, along with rising incomes, have played a major role.
Since February 2011, global food prices have plunged 30% amid oversupply, a steep fall in the price of oil, and a deceleration of the Chinese economy. A reversal has already come under way. El Niño in 2015 and 2016 pushed up food prices via floods and droughts in Southeast Asia and heavy rainfall in Brazil. Still the trends in
agricultural production remain favourable; wheat output reached 733m tonnes in fiscal year 2015/16–a record high. The GFSI mirrors these developments: Seven out of the biggest wheat production countries–China, Russia, the US, Ukraine, Australia, Pakistan and Turkey–saw improvements in the availability category in the past year. Stocks of the most consumed grain in the world, maize, are healthy too. Rice output, by contrast, declined in 2015 and this year’s drought in Southeast Asia will weigh on output and push up prices.
A decline in agricultural prices is beneficial for consumers, but it can be disastrous for countries with large rural populations that depend on food production for their incomes. Thailand, whose agricultural output exceeds that of the African continent, has been hard hit by the collapse in agricultural prices, which has been compounded by two consecutive droughts and the military government’s decision to cut agricultural subsidies put in place by an elected government it ousted in 2014.
Looking forwardIn the short term, food prices are likely to remain below their 2011 peak. Further out, however, rising global demand for food, changing weather patterns as a result of climate change and policy interventions are likely to lead to higher and more volatile food prices. This may threaten further progress on food security.
Food price hikes have devastating consequences. The Asian Development Bank estimates that an additional 112m people in Asia and the Pacific could have escaped poverty had food prices not risen in the late 2000s.22 Uncertainty around food prices tends to crowd out household spending on health and education, and also has a negative impact on investment and saving. In addition, it feeds political instability, which scuppers the prospect of sustainable food-security policies.
22 Asian Development Bank (ADB). (2013). “Food Security in Asia and the Pacific”. Available at http://www.adb.org/sites/default/files/publication/30349/food-security-asia-pacific.pdf
© The Economist Intelligence Unit Limited 201628
Global food security index 2016 An annual measure of the state of global food security
Climate change (mitigation and adaptation)
Looking backAmong the biggest challenges in the battle to ensure long-term food security are the effects of climate change. Nearly all the countries that are most severely affected by weather-related loss events measured by the Long-Term Climate Risk Index23 are in the bottom half of the GFSI food-security rankings. Changing weather patterns, drought, increased rainfall and flooding have a significant impact on food security, reducing supply and pushing up prices or making them more volatile. Climate change has an impact on the carrying capacity of food-producing ecosystems, both on land and in the oceans. Coastal zones—one-half the world’s population lives within 60 km of the sea—are particularly vulnerable.
Many countries have started to invest in climate change adaptation and mitigation measures. A transformation of the energy landscape is under way, but the GFSI shows that the level of agricultural R&D in the public sector is inadequate and needs to be vastly enhanced and supplemented by non-public-sector sources. Agricultural infrastructure will have to be improved (public-private partnerships can be an effective way of generating sufficient capital for this), and investments in new technologies will need to be made.
Looking forwardGovernments must implement mitigation and adaptation measures to reduce the impact of climate change on food security. Without rapid
23 S. Kreft et al. (2015). “Who Suffers Most From Extreme Weather Events? Weather-related Loss Events in 2013 and 1994 to 2013”. Global Climate Risk Index. Available at https://germanwatch.org/en/download/10333.pdf
and inclusive development that takes into account climate change, targeted adaptation measures, and emissions reductions efforts that protect the poor, the World Bank estimates, more than 100m people could fall into extreme poverty by 2030. Even when adaptive measures are taken into account, extreme weather events related to climate change (for instance, drought) could lead to crop yield losses as high as 5% by 2030, driving up food prices.24
Countries most vulnerable to drought (including countries across Sub-Saharan Africa and parts of Asia, and also Australia) will need to develop new technologies and invest in agricultural R&D to increase their resilience to changing weather patterns. This may include the introduction or development of drought-resistant crops (for example, expanding production of millet or certain legumes). New drought-resistant rice strains have, for instance, proved beneficial in India when the monsoon season occurs later than usual.
To alleviate future pressures on their national food-security systems, governments need to act now. Many of them are keen to encourage private investment in the overall economy, and then use the resulting income from taxes on private companies to fund increases in agricultural productivity and climate change mitigation and adaptation. Failure to tap into private capital effectively, especially in lower-income, developing countries with weak enforcement capacity and governance, will result in a reduction in food security. For governments, private investors and donors, it is essential to collaborate to drive outcomes that make people more food-secure.
24 The World Bank. (2015). “Rapid, Climate-Informed Development Needed to Keep Climate Change from Pushing More than 100 Million People into Poverty by 2030”. Available at http://www.worldbank.org/en/news/feature/2015/11/08/rapid-climate-informed-development-needed-to-keep-climate-change-from-pushing-more-than-100-million-people-into-poverty-by-2030
© The Economist Intelligence Unit Limited 201629
Global food security index 2016 An annual measure of the state of global food security
Conclusion
Five years after the first edition was launched, the GFSI continues to showcase the improving global state of food security. A five year period is a relatively short time frame to initiate and execute significant policy or structural improvements, and many of the gains in the GFSI reflect general improvements in the state of the global economy since 2012. However, it is also clear that policymakers, governments and the private sector have made progress in addressing food security over the past five years, and they must remain committed in the face of growing threats, such as climate change, economic volatility, political instability and conflict.
Affordability and access to food has improvedThe global economy has continued to strengthen since 2012, which has led to improvements in incomes in most countries. With higher incomes, people are better able to afford more nutritious foods, though not necessarily across the board or to the same extent in every country. Trends over the five-year period also show more extensive food safety-net programmes, expanded food transport infrastructure and greater dietary diversity. This is particularly evident in middle-income and emerging-market countries.
Despite progress, low-income countries lag behindProgress in many areas should not overshadow food-security issues that still require the attention of governments and other
stakeholders. Low-income countries often lack basic infrastructure, and smaller incomes inhibit access to and affordability of nutritious food. Political risk and corruption frequently compound food-security challenges. Moreover, changing weather patterns, drought, increased rainfall and flooding will have a significant impact in the long term, potentially pushing up food prices and increasing production volatility. While the impact of climate change on food security will not solely be felt in low-income countries, these countries are less equipped to deal with climate change impacts and food security challenges.
Challenges remain, requiring greater resolve from policymakers and other stakeholdersEven with slow, steady progress in improving food security around the globe, more must be done to meet the challenge of providing sufficient quantities of nutritious, safe food for burgeoning populations in the future. There are climate change risks; food prices will likely start to rise again in the future; and production needs to rise in tandem with demand. Economic gains that have fed into rising incomes and improved affordability are not guaranteed. The EIU expects economic volatility to remain the dominant economic theme of 2016. To meet these challenges, policymakers, governments and the private sector must continue to prioritise investment in food-security-related measures.
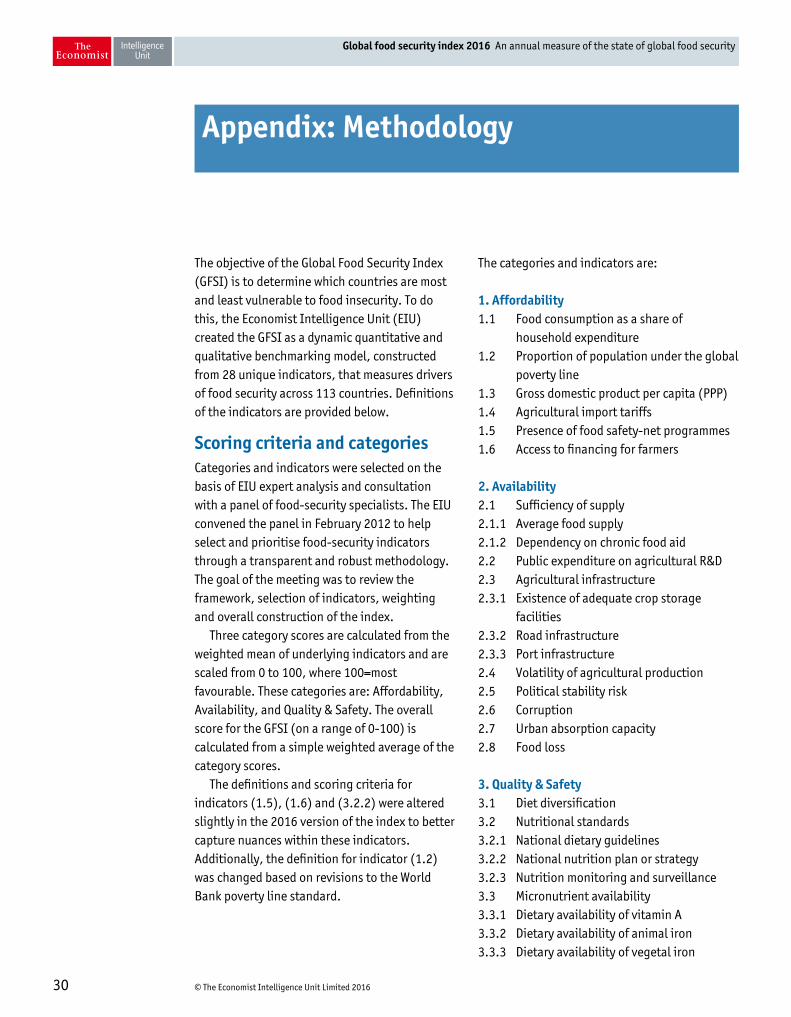
© The Economist Intelligence Unit Limited 201630
Global food security index 2016 An annual measure of the state of global food security
Appendix: Methodology
The objective of the Global Food Security Index (GFSI) is to determine which countries are most and least vulnerable to food insecurity. To do this, the Economist Intelligence Unit (EIU) created the GFSI as a dynamic quantitative and qualitative benchmarking model, constructed from 28 unique indicators, that measures drivers of food security across 113 countries. Definitions of the indicators are provided below.
Scoring criteria and categoriesCategories and indicators were selected on the basis of EIU expert analysis and consultation with a panel of food-security specialists. The EIU convened the panel in February 2012 to help select and prioritise food-security indicators through a transparent and robust methodology. The goal of the meeting was to review the framework, selection of indicators, weighting and overall construction of the index.
Three category scores are calculated from the weighted mean of underlying indicators and are scaled from 0 to 100, where 100=most favourable. These categories are: Affordability, Availability, and Quality & Safety. The overall score for the GFSI (on a range of 0-100) is calculated from a simple weighted average of the category scores.
The definitions and scoring criteria for indicators (1.5), (1.6) and (3.2.2) were altered slightly in the 2016 version of the index to better capture nuances within these indicators. Additionally, the definition for indicator (1.2) was changed based on revisions to the World Bank poverty line standard.
The categories and indicators are:
1. Affordability1.1 Food consumption as a share of
household expenditure1.2 Proportion of population under the global
poverty line1.3 Gross domestic product per capita (PPP)1.4 Agricultural import tariffs1.5 Presence of food safety-net programmes1.6 Access to financing for farmers
2. Availability2.1 Sufficiency of supply2.1.1 Average food supply2.1.2 Dependency on chronic food aid2.2 Public expenditure on agricultural R&D2.3 Agricultural infrastructure2.3.1 Existence of adequate crop storage
facilities2.3.2 Road infrastructure2.3.3 Port infrastructure2.4 Volatility of agricultural production2.5 Political stability risk2.6 Corruption2.7 Urban absorption capacity2.8 Food loss
3. Quality & Safety3.1 Diet diversification3.2 Nutritional standards3.2.1 National dietary guidelines3.2.2 National nutrition plan or strategy3.2.3 Nutrition monitoring and surveillance3.3 Micronutrient availability3.3.1 Dietary availability of vitamin A3.3.2 Dietary availability of animal iron3.3.3 Dietary availability of vegetal iron
© The Economist Intelligence Unit Limited 201631
Global food security index 2016 An annual measure of the state of global food security
3.4 Protein quality3.5 Food safety3.5.1 Agency to ensure the safety and health of
food3.5.2 Percentage of population with access to
potable water3.5.3 Presence of formal grocery sector
Data for the quantitative indicators are drawn from national and international statistical sources. Where there were missing values in quantitative or survey data, the EIU has used estimates. Estimated figures have been noted in the model workbook. Of the qualitative indicators, some have been created by the EIU, based on information from development banks and government websites, while others have been drawn from a range of surveys and data sources and adjusted by the EIU.
The main sources used in the GFSI are the EIU, the World Bank Group, the International Monetary Fund (IMF), the UN Food and Agriculture Organisation (FAO), the UN Development Programme (UNDP), the World Health Organisation (WHO), the World Trade Organisation (WTO), the World Food Programme (WFP), Agricultural Science and Technology Indicators (ASTI) and national statistical offices.
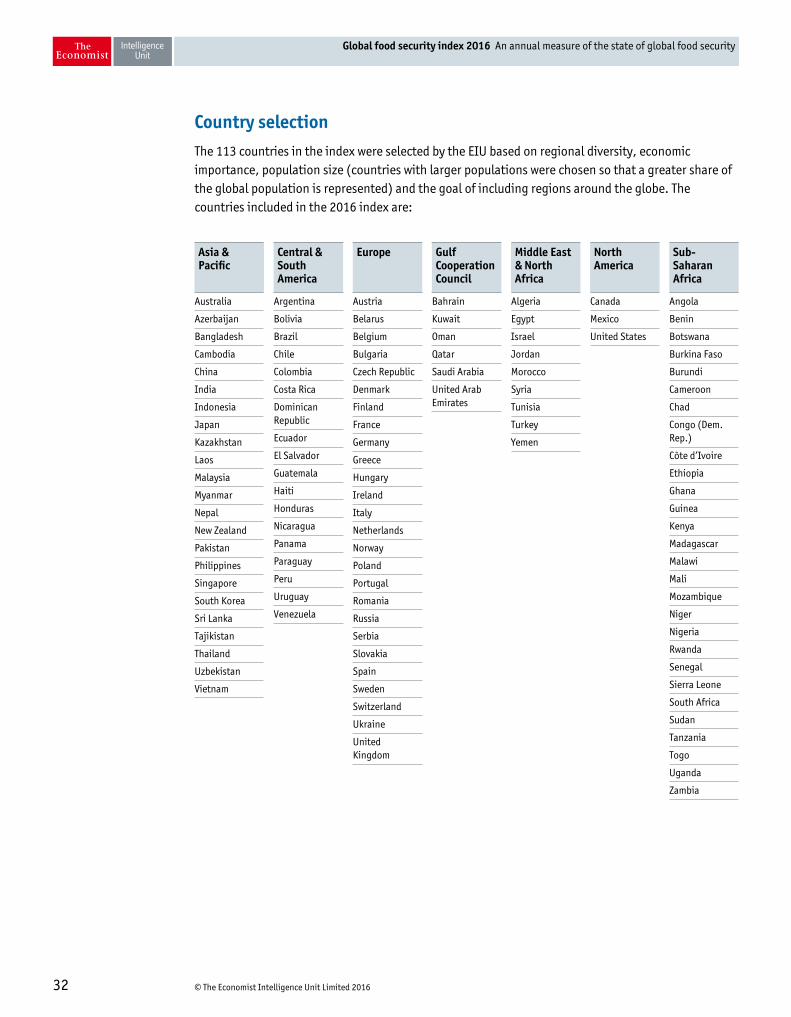
© The Economist Intelligence Unit Limited 201632
Global food security index 2016 An annual measure of the state of global food security
Country selectionThe 113 countries in the index were selected by the EIU based on regional diversity, economic importance, population size (countries with larger populations were chosen so that a greater share of the global population is represented) and the goal of including regions around the globe. The countries included in the 2016 index are:
Asia & Pacific
Australia
Azerbaijan
Bangladesh
Cambodia
China
India
Indonesia
Japan
Kazakhstan
Laos
Malaysia
Myanmar
Nepal
New Zealand
Pakistan
Philippines
Singapore
South Korea
Sri Lanka
Tajikistan
Thailand
Uzbekistan
Vietnam
Central & South America
Argentina
Bolivia
Brazil
Chile
Colombia
Costa Rica
Dominican Republic
Ecuador
El Salvador
Guatemala
Haiti
Honduras
Nicaragua
Panama
Paraguay
Peru
Uruguay
Venezuela
Europe
Austria
Belarus
Belgium
Bulgaria
Czech Republic
Denmark
Finland
France
Germany
Greece
Hungary
Ireland
Italy
Netherlands
Norway
Poland
Portugal
Romania
Russia
Serbia
Slovakia
Spain
Sweden
Switzerland
Ukraine
United Kingdom
Gulf Cooperation Council
Bahrain
Kuwait
Oman
Qatar
Saudi Arabia
United Arab Emirates
Middle East & North Africa
Algeria
Egypt
Israel
Jordan
Morocco
Syria
Tunisia
Turkey
Yemen
North America
Canada
Mexico
United States
Sub-Saharan Africa
Angola
Benin
Botswana
Burkina Faso
Burundi
Cameroon
Chad
Congo (Dem. Rep.)
Côte d’Ivoire
Ethiopia
Ghana
Guinea
Kenya
Madagascar
Malawi
Mali
Mozambique
Niger
Nigeria
Rwanda
Senegal
Sierra Leone
South Africa
Sudan
Tanzania
Togo
Uganda
Zambia
© The Economist Intelligence Unit Limited 201633
Global food security index 2016 An annual measure of the state of global food security
Weightings
The weighting assigned to each category and indicator can be changed by users to reflect different assumptions about their relative importance. Two sets of weightings are provided in the index. One possible option, known as neutral weights, assumes that all indicators are equally important and distributes weightings evenly. The second available option, known as peer panel recommendation, averages the weightings suggested by five members of an expert panel. The expert weightings are the default weightings in the model. The model workbook also enables users to create customised weightings to allow them to test their own assumptions about the relative importance of each indicator.
Data modellingIndicator scores are normalised and then aggregated across categories to enable a comparison of broader concepts across countries. Normalisation rebases the raw indicator data to a common unit so that it can be aggregated. The indicators for which a higher value indicates a more favourable environment for food security—such as GDP per capita or average food supply—have been normalised on the basis of:
x = (x - Min(x)) / (Max(x) - Min(x))
where Min(x) and Max(x) are, respectively, the lowest and highest values in the 113 economies for any given indicator. The normalised value is then transformed from a 0-1 value to a 0-100 score to make it directly comparable with other indicators. This in effect means that the country with the highest raw data value will score 100, while the lowest will score 0.
For the indicators for which a high value indicates an unfavourable environment for food security—such as volatility of agricultural production or political stability risk—the normalisation function takes the form of:
x = (x - Max(x)) / (Max(x) - Min(x))
where Min(x) and Max(x) are, respectively, the lowest and highest values in the 113 economies for any given indicator. The normalised value is then transformed into a positive number on a scale of 0-100 to make it directly comparable with other indicators.
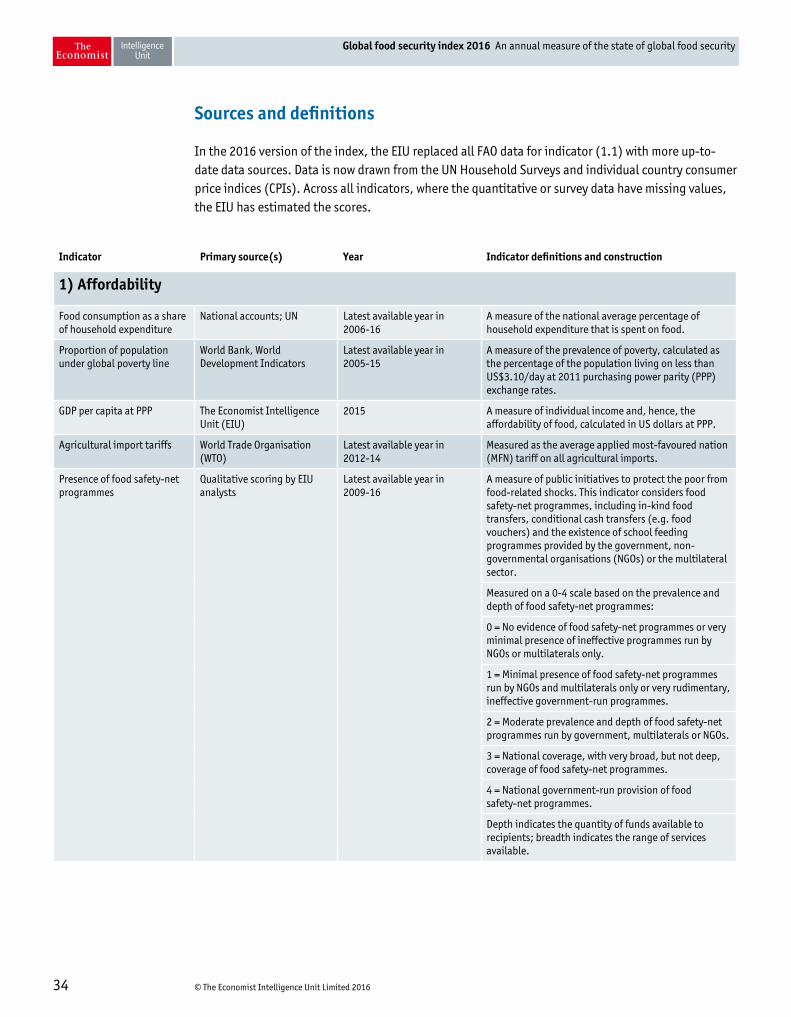
© The Economist Intelligence Unit Limited 201634
Global food security index 2016 An annual measure of the state of global food security
Sources and definitions
In the 2016 version of the index, the EIU replaced all FAO data for indicator (1.1) with more up-to-date data sources. Data is now drawn from the UN Household Surveys and individual country consumer price indices (CPIs). Across all indicators, where the quantitative or survey data have missing values, the EIU has estimated the scores.
Indicator Primary source(s) Year Indicator definitions and construction
1) Affordability
Food consumption as a share of household expenditure
National accounts; UN Latest available year in 2006-16
A measure of the national average percentage of household expenditure that is spent on food.
Proportion of population under global poverty line
World Bank, World Development Indicators
Latest available year in 2005-15
A measure of the prevalence of poverty, calculated as the percentage of the population living on less than US$3.10/day at 2011 purchasing power parity (PPP) exchange rates.
GDP per capita at PPP The Economist Intelligence Unit (EIU)
2015 A measure of individual income and, hence, the affordability of food, calculated in US dollars at PPP.
Agricultural import tariffs World Trade Organisation (WTO)
Latest available year in 2012-14
Measured as the average applied most-favoured nation (MFN) tariff on all agricultural imports.
Presence of food safety-net programmes
Qualitative scoring by EIU analysts
Latest available year in 2009-16
A measure of public initiatives to protect the poor from food-related shocks. This indicator considers food safety-net programmes, including in-kind food transfers, conditional cash transfers (e.g. food vouchers) and the existence of school feeding programmes provided by the government, non-governmental organisations (NGOs) or the multilateral sector.
Measured on a 0-4 scale based on the prevalence and depth of food safety-net programmes:
0 = No evidence of food safety-net programmes or very minimal presence of ineffective programmes run by NGOs or multilaterals only.
1 = Minimal presence of food safety-net programmes run by NGOs and multilaterals only or very rudimentary, ineffective government-run programmes.
2 = Moderate prevalence and depth of food safety-net programmes run by government, multilaterals or NGOs.
3 = National coverage, with very broad, but not deep, coverage of food safety-net programmes.
4 = National government-run provision of food safety-net programmes.
Depth indicates the quantity of funds available to recipients; breadth indicates the range of services available.
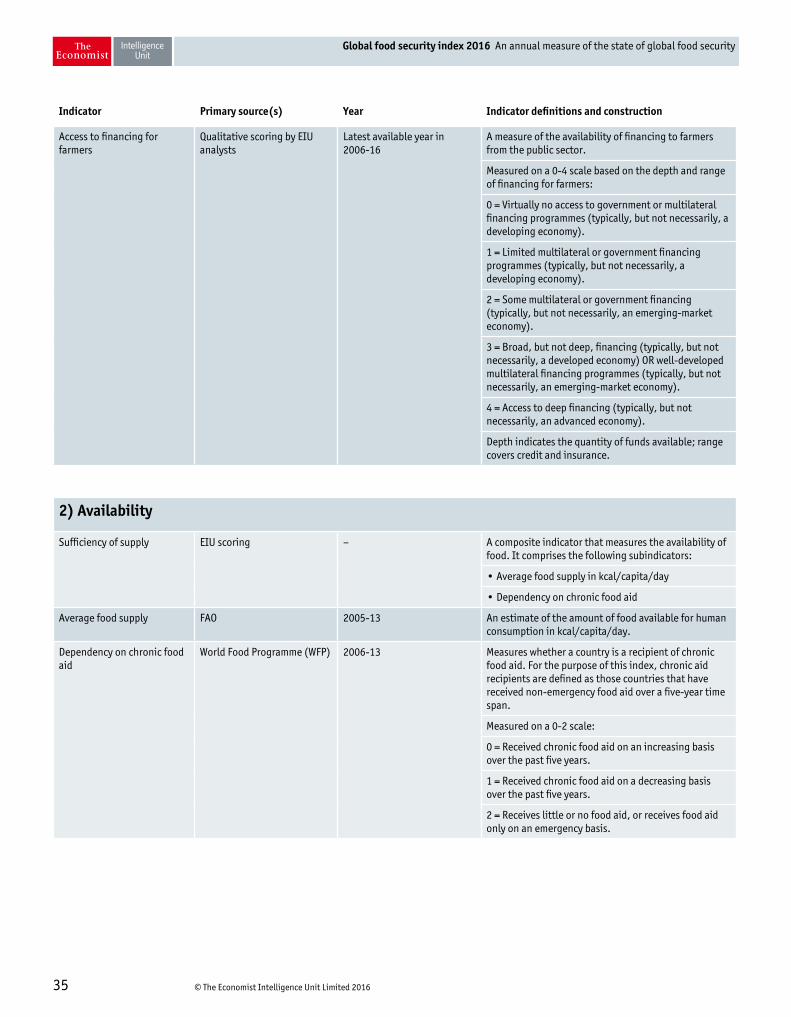
© The Economist Intelligence Unit Limited 201635
Global food security index 2016 An annual measure of the state of global food security
Indicator Primary source(s) Year Indicator definitions and construction
Access to financing for farmers
Qualitative scoring by EIU analysts
Latest available year in 2006-16
A measure of the availability of financing to farmers from the public sector.
Measured on a 0-4 scale based on the depth and range of financing for farmers:
0 = Virtually no access to government or multilateral financing programmes (typically, but not necessarily, a developing economy).
1 = Limited multilateral or government financing programmes (typically, but not necessarily, a developing economy).
2 = Some multilateral or government financing (typically, but not necessarily, an emerging-market economy).
3 = Broad, but not deep, financing (typically, but not necessarily, a developed economy) OR well-developed multilateral financing programmes (typically, but not necessarily, an emerging-market economy).
4 = Access to deep financing (typically, but not necessarily, an advanced economy).
Depth indicates the quantity of funds available; range covers credit and insurance.
2) Availability
Sufficiency of supply EIU scoring – A composite indicator that measures the availability of food. It comprises the following subindicators:
• Average food supply in kcal/capita/day
• Dependency on chronic food aid
Average food supply FAO 2005-13 An estimate of the amount of food available for human consumption in kcal/capita/day.
Dependency on chronic food aid
World Food Programme (WFP) 2006-13 Measures whether a country is a recipient of chronic food aid. For the purpose of this index, chronic aid recipients are defined as those countries that have received non-emergency food aid over a five-year time span.
Measured on a 0-2 scale:
0 = Received chronic food aid on an increasing basis over the past five years.
1 = Received chronic food aid on a decreasing basis over the past five years.
2 = Receives little or no food aid, or receives food aid only on an emergency basis.
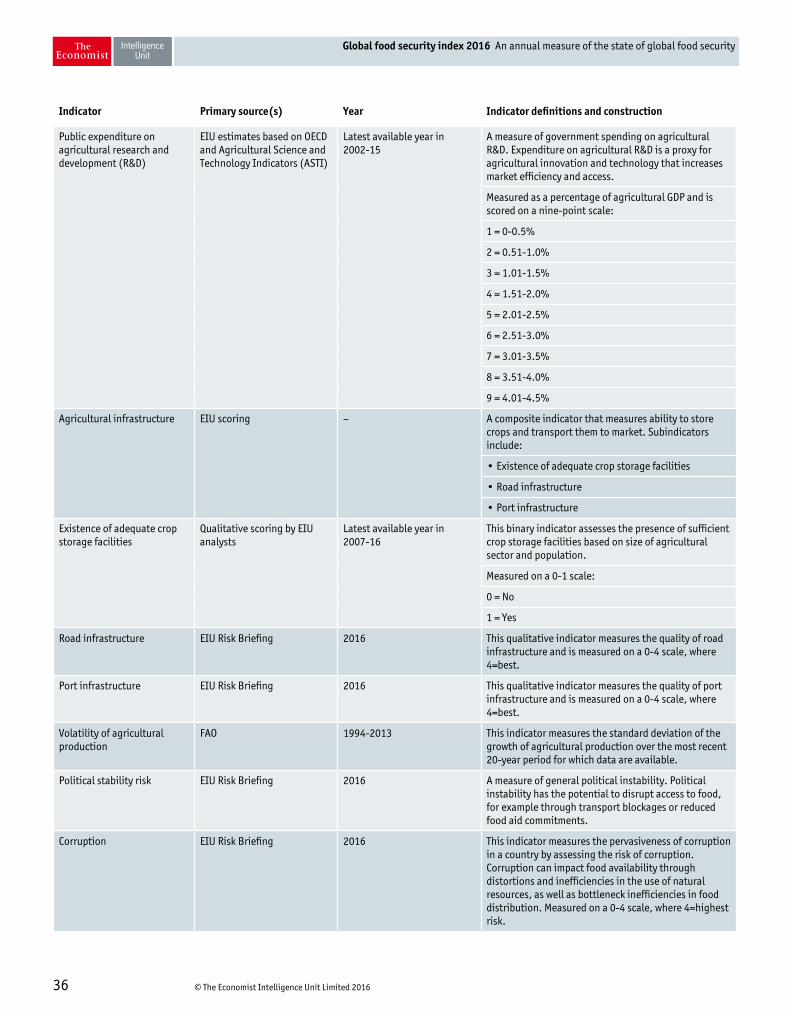
© The Economist Intelligence Unit Limited 201636
Global food security index 2016 An annual measure of the state of global food security
Indicator Primary source(s) Year Indicator definitions and construction
Public expenditure on agricultural research and development (R&D)
EIU estimates based on OECD and Agricultural Science and Technology Indicators (ASTI)
Latest available year in 2002-15
A measure of government spending on agricultural R&D. Expenditure on agricultural R&D is a proxy for agricultural innovation and technology that increases market efficiency and access.
Measured as a percentage of agricultural GDP and is scored on a nine-point scale:
1 = 0-0.5%
2 = 0.51-1.0%
3 = 1.01-1.5%
4 = 1.51-2.0%
5 = 2.01-2.5%
6 = 2.51-3.0%
7 = 3.01-3.5%
8 = 3.51-4.0%
9 = 4.01-4.5%
Agricultural infrastructure EIU scoring – A composite indicator that measures ability to store crops and transport them to market. Subindicators include:
• Existence of adequate crop storage facilities
• Road infrastructure
• Port infrastructure
Existence of adequate crop storage facilities
Qualitative scoring by EIU analysts
Latest available year in 2007-16
This binary indicator assesses the presence of sufficient crop storage facilities based on size of agricultural sector and population.
Measured on a 0-1 scale:
0 = No
1 = Yes
Road infrastructure EIU Risk Briefing 2016 This qualitative indicator measures the quality of road infrastructure and is measured on a 0-4 scale, where 4=best.
Port infrastructure EIU Risk Briefing 2016 This qualitative indicator measures the quality of port infrastructure and is measured on a 0-4 scale, where 4=best.
Volatility of agricultural production
FAO 1994-2013 This indicator measures the standard deviation of the growth of agricultural production over the most recent 20-year period for which data are available.
Political stability risk EIU Risk Briefing 2016 A measure of general political instability. Political instability has the potential to disrupt access to food, for example through transport blockages or reduced food aid commitments.
Corruption EIU Risk Briefing 2016 This indicator measures the pervasiveness of corruption in a country by assessing the risk of corruption. Corruption can impact food availability through distortions and inefficiencies in the use of natural resources, as well as bottleneck inefficiencies in food distribution. Measured on a 0-4 scale, where 4=highest risk.
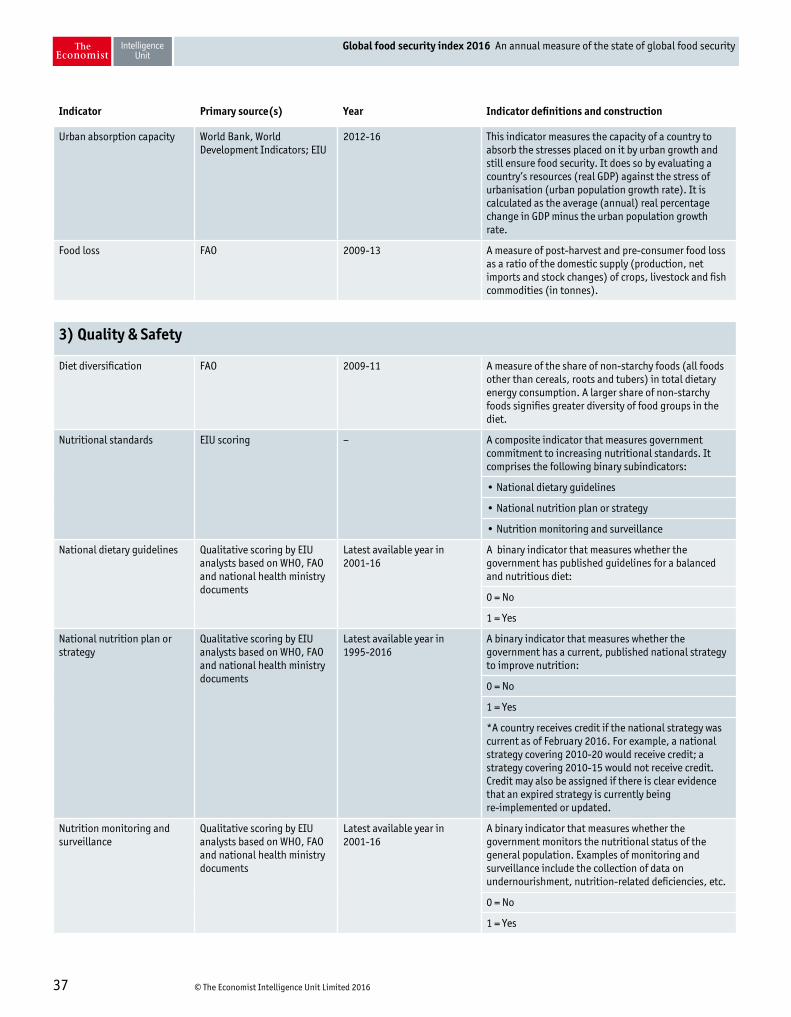
© The Economist Intelligence Unit Limited 201637
Global food security index 2016 An annual measure of the state of global food security
Indicator Primary source(s) Year Indicator definitions and construction
Urban absorption capacity World Bank, World Development Indicators; EIU
2012-16 This indicator measures the capacity of a country to absorb the stresses placed on it by urban growth and still ensure food security. It does so by evaluating a country’s resources (real GDP) against the stress of urbanisation (urban population growth rate). It is calculated as the average (annual) real percentage change in GDP minus the urban population growth rate.
Food loss FAO 2009-13 A measure of post-harvest and pre-consumer food loss as a ratio of the domestic supply (production, net imports and stock changes) of crops, livestock and fish commodities (in tonnes).
3) Quality & Safety
Diet diversification FAO 2009-11 A measure of the share of non-starchy foods (all foods other than cereals, roots and tubers) in total dietary energy consumption. A larger share of non-starchy foods signifies greater diversity of food groups in the diet.
Nutritional standards EIU scoring – A composite indicator that measures government commitment to increasing nutritional standards. It comprises the following binary subindicators:
• National dietary guidelines
• National nutrition plan or strategy
• Nutrition monitoring and surveillance
National dietary guidelines Qualitative scoring by EIU analysts based on WHO, FAO and national health ministry documents
Latest available year in 2001-16
A binary indicator that measures whether the government has published guidelines for a balanced and nutritious diet:
0 = No
1 = Yes
National nutrition plan or strategy
Qualitative scoring by EIU analysts based on WHO, FAO and national health ministry documents
Latest available year in 1995-2016
A binary indicator that measures whether the government has a current, published national strategy to improve nutrition:
0 = No
1 = Yes
*A country receives credit if the national strategy was current as of February 2016. For example, a national strategy covering 2010-20 would receive credit; a strategy covering 2010-15 would not receive credit. Credit may also be assigned if there is clear evidence that an expired strategy is currently being re-implemented or updated.
Nutrition monitoring and surveillance
Qualitative scoring by EIU analysts based on WHO, FAO and national health ministry documents
Latest available year in 2001-16
A binary indicator that measures whether the government monitors the nutritional status of the general population. Examples of monitoring and surveillance include the collection of data on undernourishment, nutrition-related deficiencies, etc.
0 = No
1 = Yes
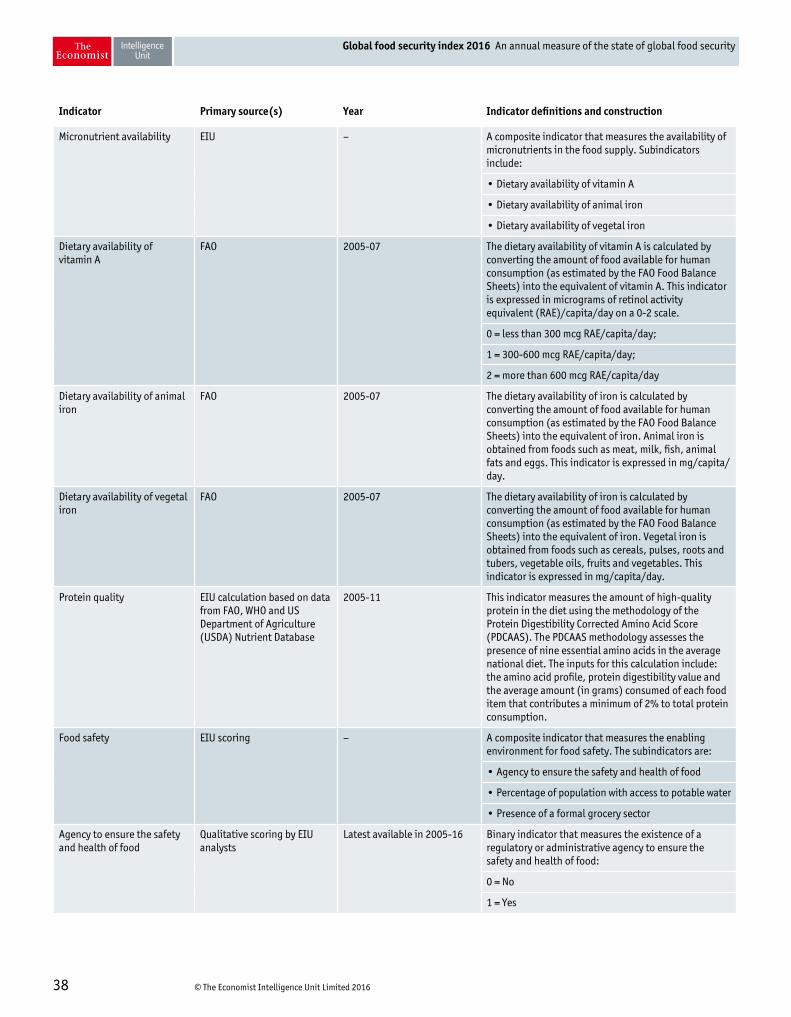
© The Economist Intelligence Unit Limited 201638
Global food security index 2016 An annual measure of the state of global food security
Indicator Primary source(s) Year Indicator definitions and construction
Micronutrient availability EIU – A composite indicator that measures the availability of micronutrients in the food supply. Subindicators include:
• Dietary availability of vitamin A
• Dietary availability of animal iron
• Dietary availability of vegetal iron
Dietary availability of vitamin A
FAO 2005-07 The dietary availability of vitamin A is calculated by converting the amount of food available for human consumption (as estimated by the FAO Food Balance Sheets) into the equivalent of vitamin A. This indicator is expressed in micrograms of retinol activity equivalent (RAE)/capita/day on a 0-2 scale.
0 = less than 300 mcg RAE/capita/day;
1 = 300-600 mcg RAE/capita/day;
2 = more than 600 mcg RAE/capita/day
Dietary availability of animal iron
FAO 2005-07 The dietary availability of iron is calculated by converting the amount of food available for human consumption (as estimated by the FAO Food Balance Sheets) into the equivalent of iron. Animal iron is obtained from foods such as meat, milk, fish, animal fats and eggs. This indicator is expressed in mg/capita/day.
Dietary availability of vegetal iron
FAO 2005-07 The dietary availability of iron is calculated by converting the amount of food available for human consumption (as estimated by the FAO Food Balance Sheets) into the equivalent of iron. Vegetal iron is obtained from foods such as cereals, pulses, roots and tubers, vegetable oils, fruits and vegetables. This indicator is expressed in mg/capita/day.
Protein quality EIU calculation based on data from FAO, WHO and US Department of Agriculture (USDA) Nutrient Database
2005-11 This indicator measures the amount of high-quality protein in the diet using the methodology of the Protein Digestibility Corrected Amino Acid Score (PDCAAS). The PDCAAS methodology assesses the presence of nine essential amino acids in the average national diet. The inputs for this calculation include: the amino acid profile, protein digestibility value and the average amount (in grams) consumed of each food item that contributes a minimum of 2% to total protein consumption.
Food safety EIU scoring – A composite indicator that measures the enabling environment for food safety. The subindicators are:
• Agency to ensure the safety and health of food
• Percentage of population with access to potable water
• Presence of a formal grocery sector
Agency to ensure the safety and health of food
Qualitative scoring by EIU analysts
Latest available in 2005-16 Binary indicator that measures the existence of a regulatory or administrative agency to ensure the safety and health of food:
0 = No
1 = Yes
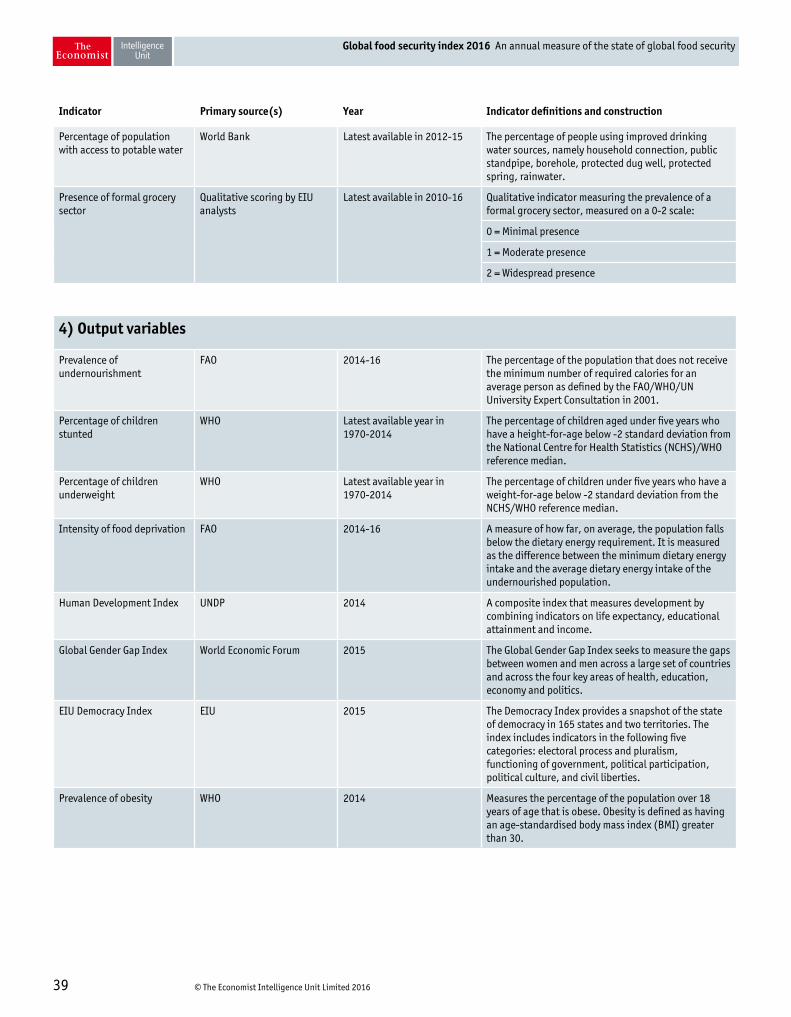
© The Economist Intelligence Unit Limited 201639
Global food security index 2016 An annual measure of the state of global food security
Indicator Primary source(s) Year Indicator definitions and construction
Percentage of population with access to potable water
World Bank Latest available in 2012-15 The percentage of people using improved drinking water sources, namely household connection, public standpipe, borehole, protected dug well, protected spring, rainwater.
Presence of formal grocery sector
Qualitative scoring by EIU analysts
Latest available in 2010-16 Qualitative indicator measuring the prevalence of a formal grocery sector, measured on a 0-2 scale:
0 = Minimal presence
1 = Moderate presence
2 = Widespread presence
4) Output variables
Prevalence of undernourishment
FAO 2014-16 The percentage of the population that does not receive the minimum number of required calories for an average person as defined by the FAO/WHO/UN University Expert Consultation in 2001.
Percentage of children stunted
WHO Latest available year in 1970-2014
The percentage of children aged under five years who have a height-for-age below -2 standard deviation from the National Centre for Health Statistics (NCHS)/WHO reference median.
Percentage of children underweight
WHO Latest available year in 1970-2014
The percentage of children under five years who have a weight-for-age below -2 standard deviation from the NCHS/WHO reference median.
Intensity of food deprivation FAO 2014-16 A measure of how far, on average, the population falls below the dietary energy requirement. It is measured as the difference between the minimum dietary energy intake and the average dietary energy intake of the undernourished population.
Human Development Index UNDP 2014 A composite index that measures development by combining indicators on life expectancy, educational attainment and income.
Global Gender Gap Index World Economic Forum 2015 The Global Gender Gap Index seeks to measure the gaps between women and men across a large set of countries and across the four key areas of health, education, economy and politics.
EIU Democracy Index EIU 2015 The Democracy Index provides a snapshot of the state of democracy in 165 states and two territories. The index includes indicators in the following five categories: electoral process and pluralism, functioning of government, political participation, political culture, and civil liberties.
Prevalence of obesity WHO 2014 Measures the percentage of the population over 18 years of age that is obese. Obesity is defined as having an age-standardised body mass index (BMI) greater than 30.
© The Economist Intelligence Unit Limited 201640
Global food security index 2016 An annual measure of the state of global food security
Whilst every effort has been taken to verify the accuracy of this
information, neither The Economist Intelligence Unit Ltd. nor the
sponsor of this report can accept any responsibility or liability for
reliance by any person on this report or any of the information,
opinions or conclusions set out in the report.
Cove
r: S
hutt
erst
ock

London20 Cabot SquareLondon E14 4QWUnited KingdomTel: (44.20) 7576 8000Fax: (44.20) 7576 8476E-mail: [email protected]
New York750 Third Avenue5th FloorNew York, NY 10017United StatesTel: (1.212) 554 0600Fax: (1.212) 586 0248E-mail: [email protected]
Hong Kong6001, Central Plaza18 Harbour RoadWanchai Hong KongTel: (852) 2585 3888Fax: (852) 2802 7638E-mail: [email protected]
GenevaBoulevard des Tranchées 161206 GenevaSwitzerlandTel: (41) 22 566 2470Fax: (41) 22 346 93 47E-mail: [email protected]