global fishmeal and fish oil supply - inputs, outputs, and markets
TRANSCRIPT
Global fishmeal and fish oil supply - inputs, outputs, and markets
C.J. Shepherd & A.J. Jackson
9 May 2012
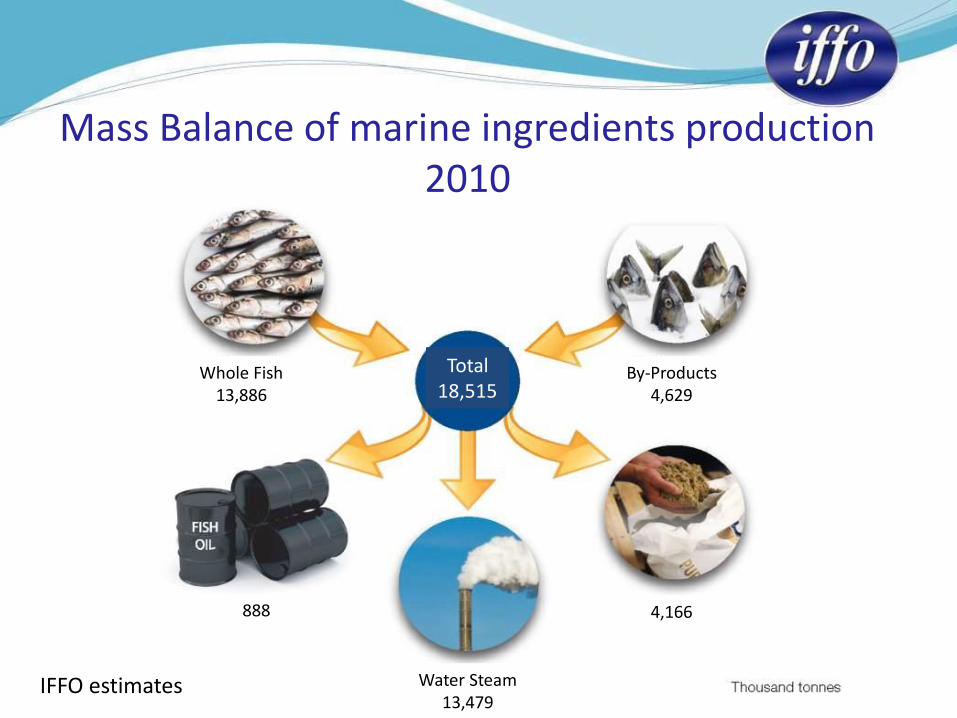
Mass Balance of marine ingredients production 2010
IFFO estimates
Total 18,515
Whole Fish 13,886
By-Products 4,629
888 4,166
Water Steam 13,479
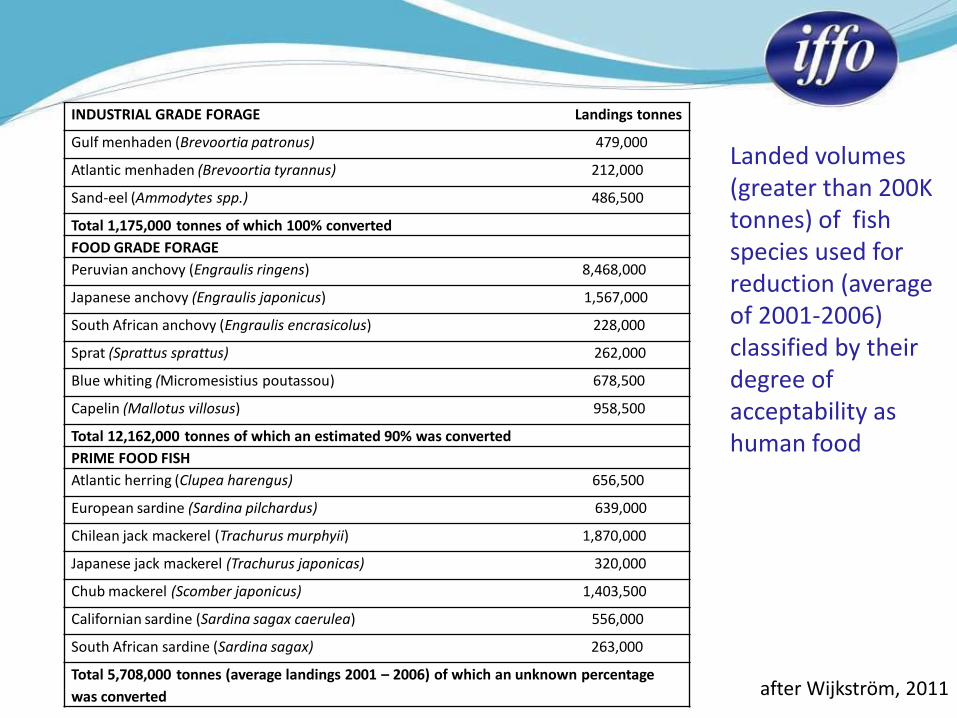
Landed volumes (greater than 200K tonnes) of fish species used for reduction (average of 2001-2006) classified by their degree of acceptability as human food
INDUSTRIAL GRADE FORAGE Landings tonnes
Gulf menhaden (Brevoortia patronus) 479,000
Atlantic menhaden (Brevoortia tyrannus) 212,000
Sand-eel (Ammodytes spp.) 486,500
Total 1,175,000 tonnes of which 100% converted
FOOD GRADE FORAGE
Peruvian anchovy (Engraulis ringens) 8,468,000
Japanese anchovy (Engraulis japonicus) 1,567,000
South African anchovy (Engraulis encrasicolus) 228,000
Sprat (Sprattus sprattus) 262,000
Blue whiting (Micromesistius poutassou) 678,500
Capelin (Mallotus villosus) 958,500
Total 12,162,000 tonnes of which an estimated 90% was converted
PRIME FOOD FISH
Atlantic herring (Clupea harengus) 656,500
European sardine (Sardina pilchardus) 639,000
Chilean jack mackerel (Trachurus murphyii) 1,870,000
Japanese jack mackerel (Trachurus japonicas) 320,000
Chub mackerel (Scomber japonicus) 1,403,500
Californian sardine (Sardina sagax caerulea) 556,000
South African sardine (Sardina sagax) 263,000
Total 5,708,000 tonnes (average landings 2001 – 2006) of which an unknown percentage
was converted after Wijkström, 2011
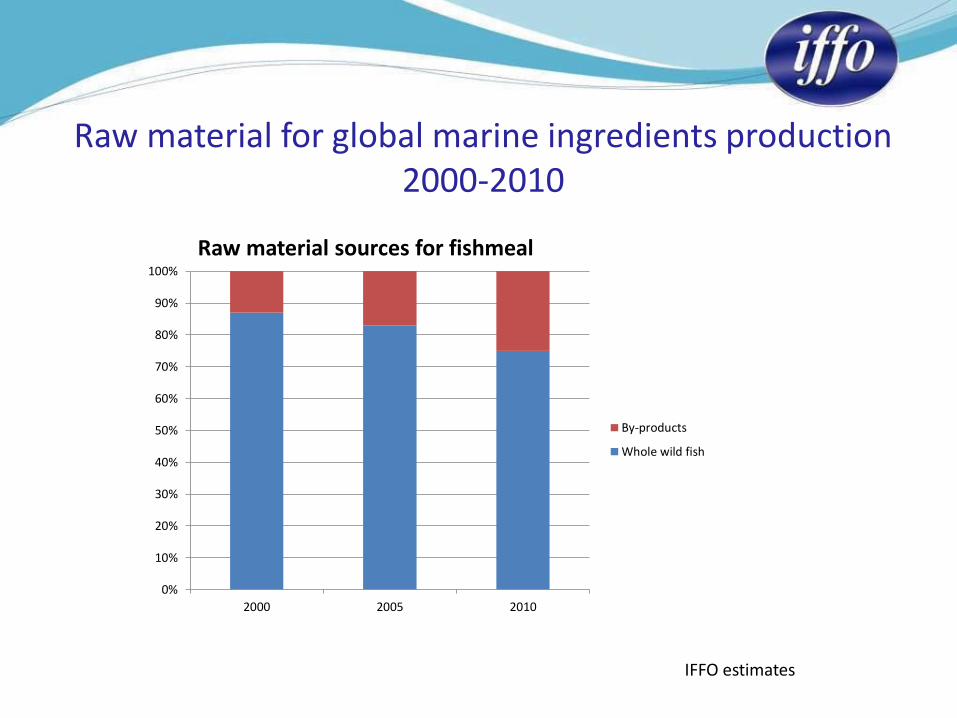
Raw material for global marine ingredients production 2000-2010
0%
10%
20%
30%
40%
50%
60%
70%
80%
90%
100%
2000 2005 2010
Raw material sources for fishmeal
By-products
Whole wild fish
IFFO estimates
0
1000
2000
3000
4000
5000
6000
7000
8000
ton
ne
s ,0
00
Fishmeal
Fish Oil
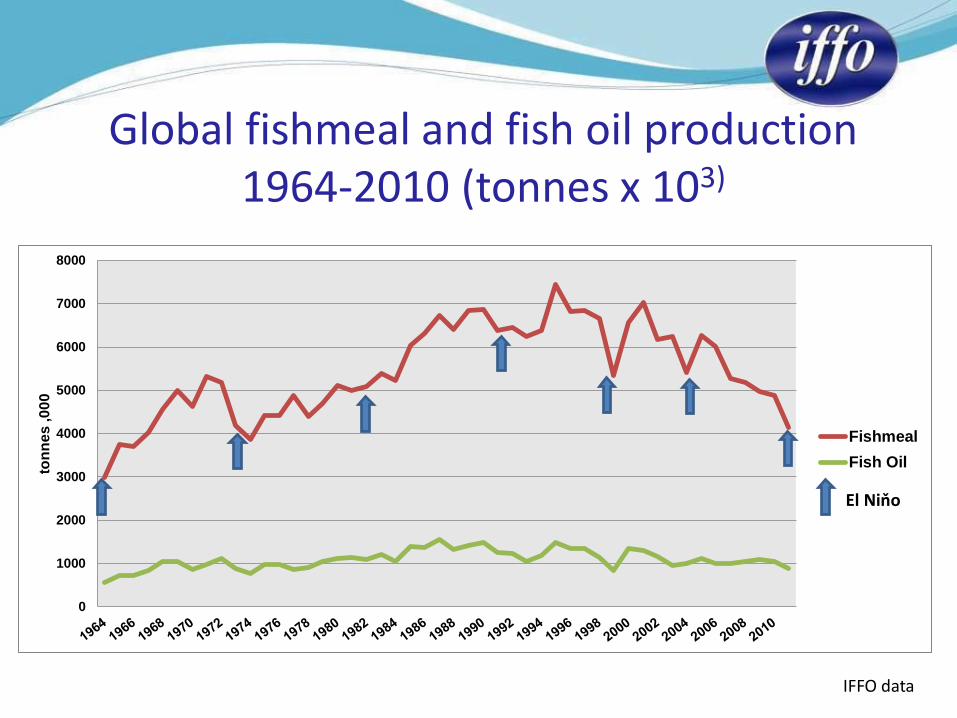
Global fishmeal and fish oil production 1964-2010 (tonnes x 103)
IFFO data
El Niňo
IFFO data
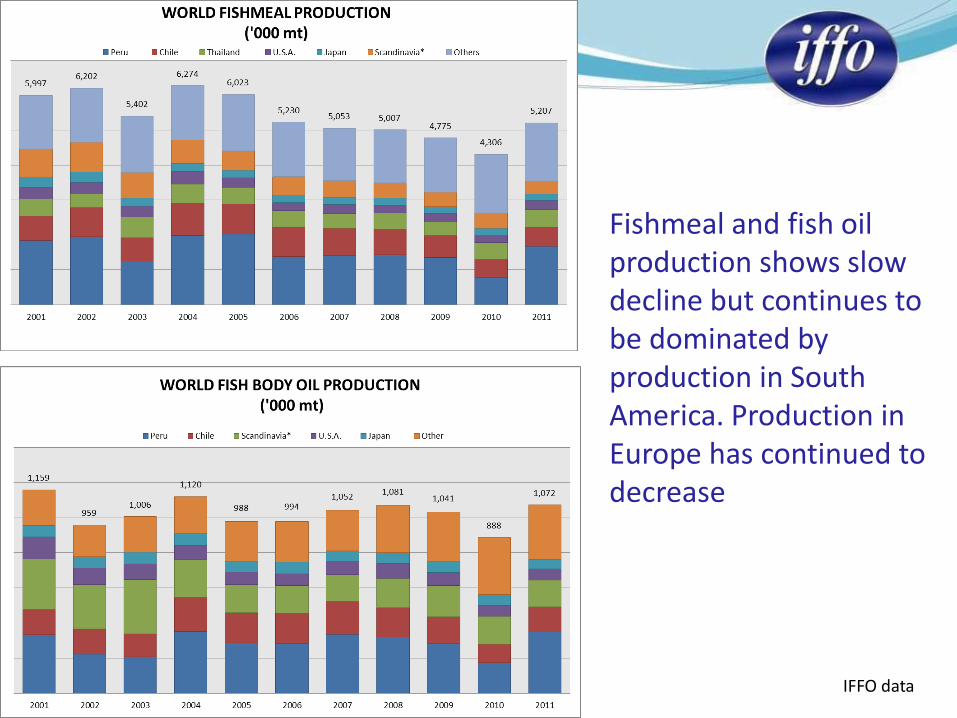
Fishmeal and fish oil production shows slow decline but continues to be dominated by production in South America. Production in Europe has continued to decrease
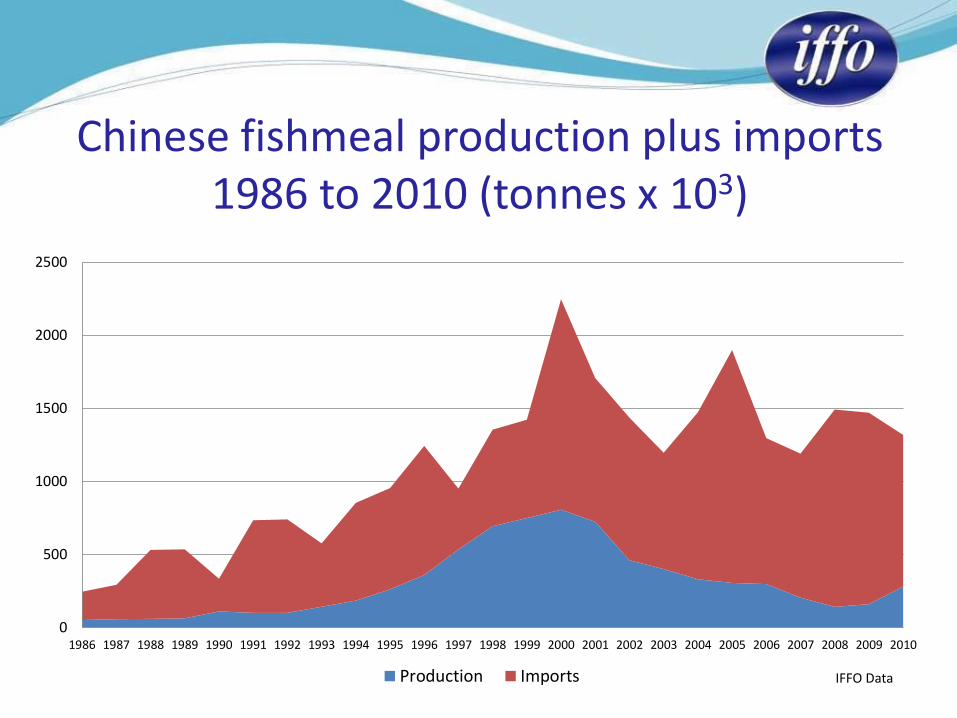
Chinese fishmeal production plus imports 1986 to 2010 (tonnes x 103)
0
500
1000
1500
2000
2500
1986 1987 1988 1989 1990 1991 1992 1993 1994 1995 1996 1997 1998 1999 2000 2001 2002 2003 2004 2005 2006 2007 2008 2009 2010
Production Imports IFFO Data
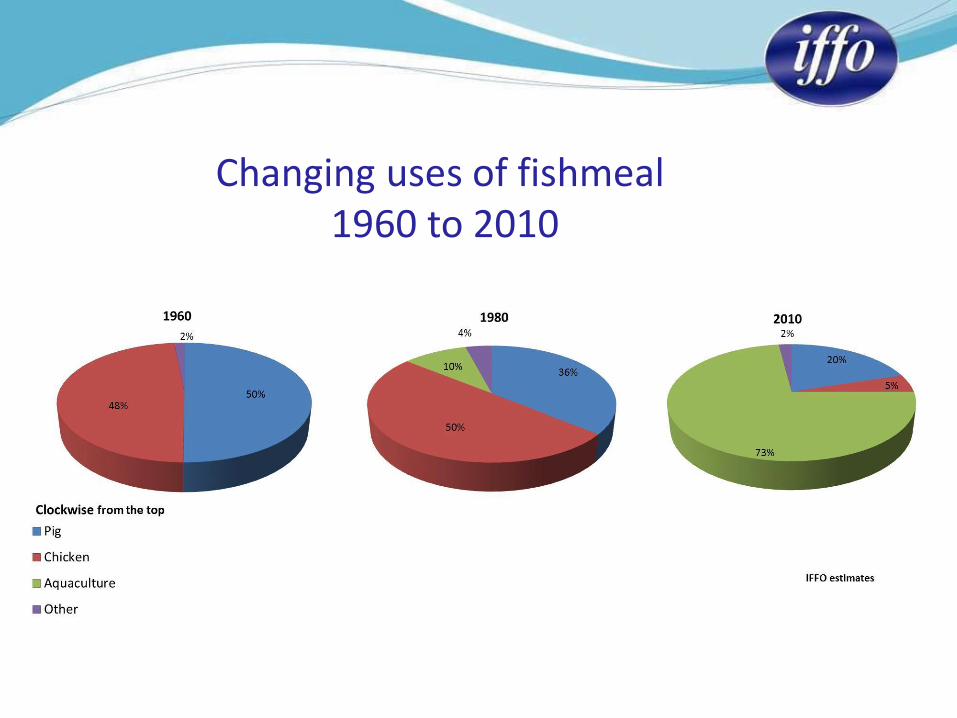
Changing uses of fishmeal 1960 to 2010
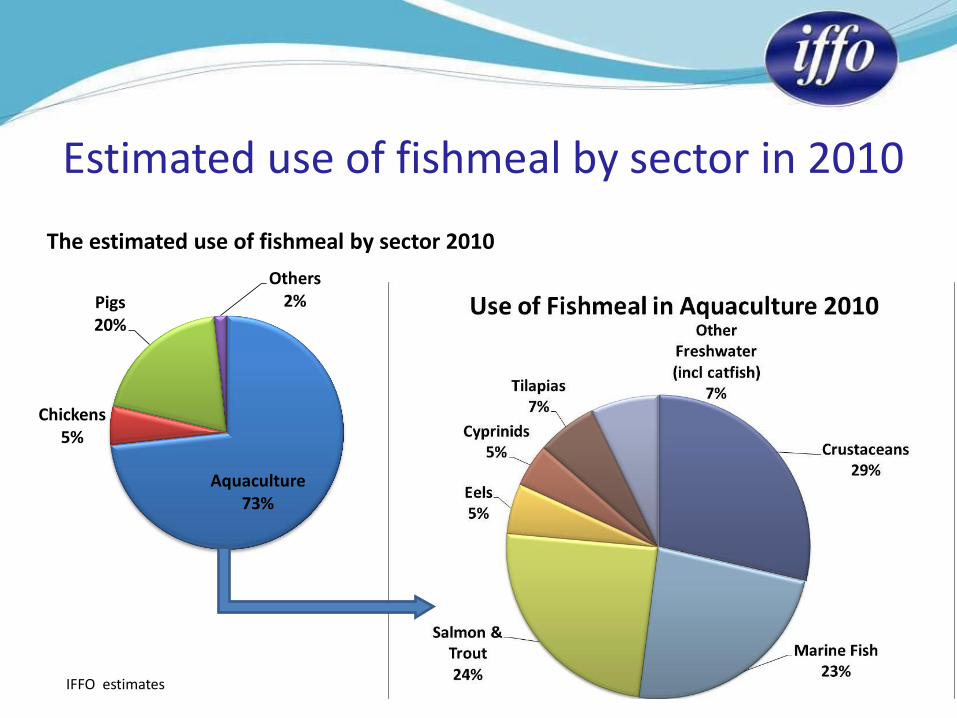
Aquaculture 73%
Chickens 5%
Pigs 20%
Others 2%
The estimated use of fishmeal by sector 2010
IFFO estimates
Estimated use of fishmeal by sector in 2010
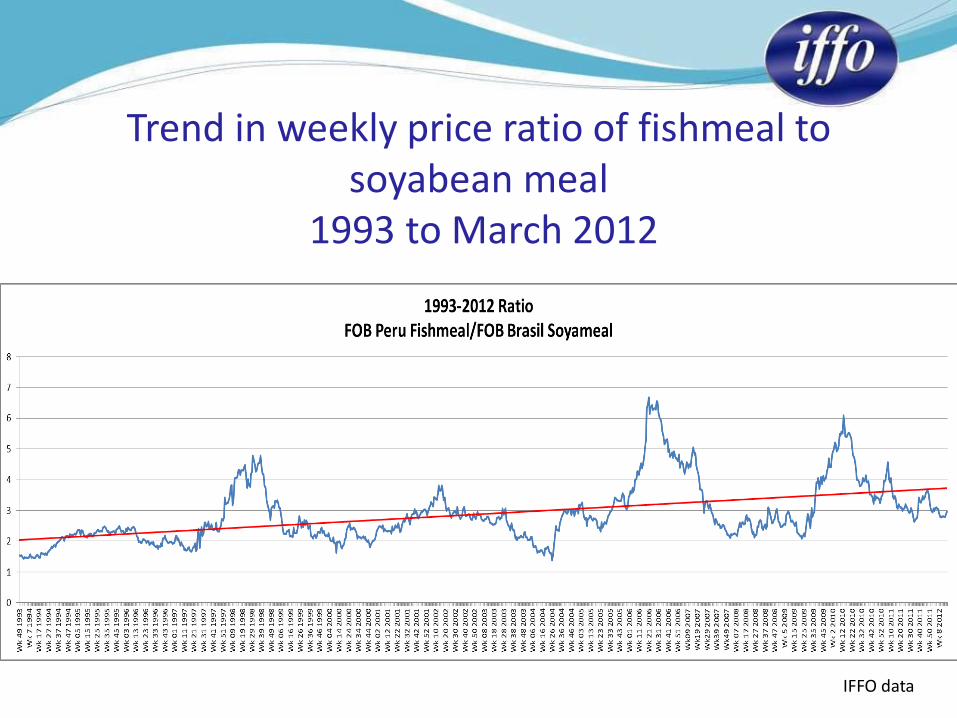
Trend in weekly price ratio of fishmeal to soyabean meal
1993 to March 2012
IFFO data
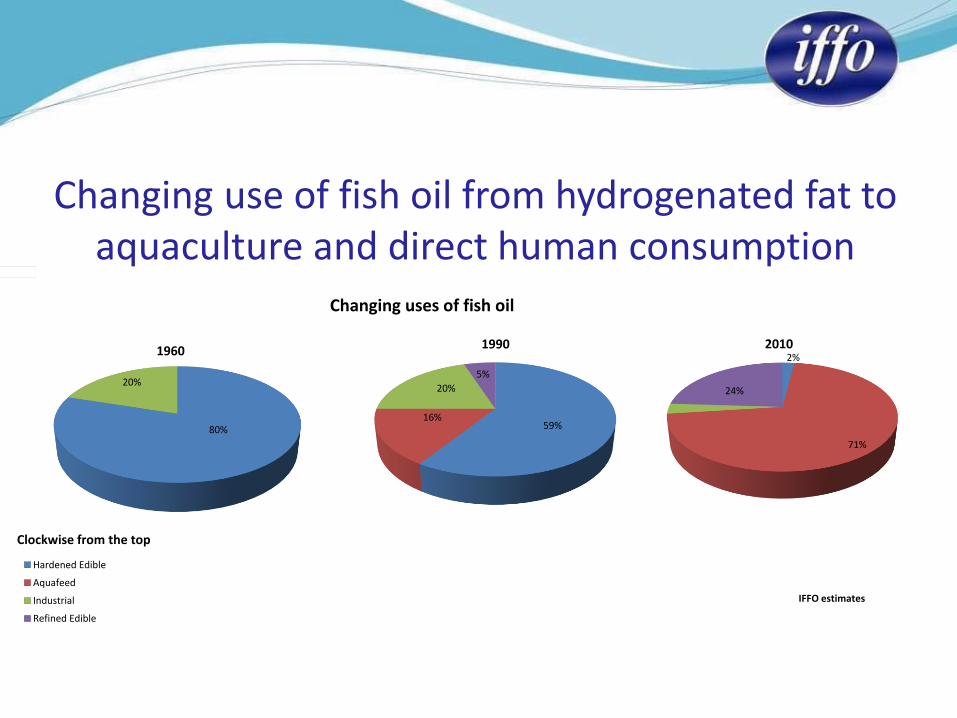
Changing use of fish oil from hydrogenated fat to aquaculture and direct human consumption
80%
20%
1960
Hardened Edible
Aquafeed
Industrial
Refined Edible
Changing uses of fish oil
Clockwise from the top
IFFO estimates
2%
71%
3%
24%
2010
59%16%
20%
5%
1990
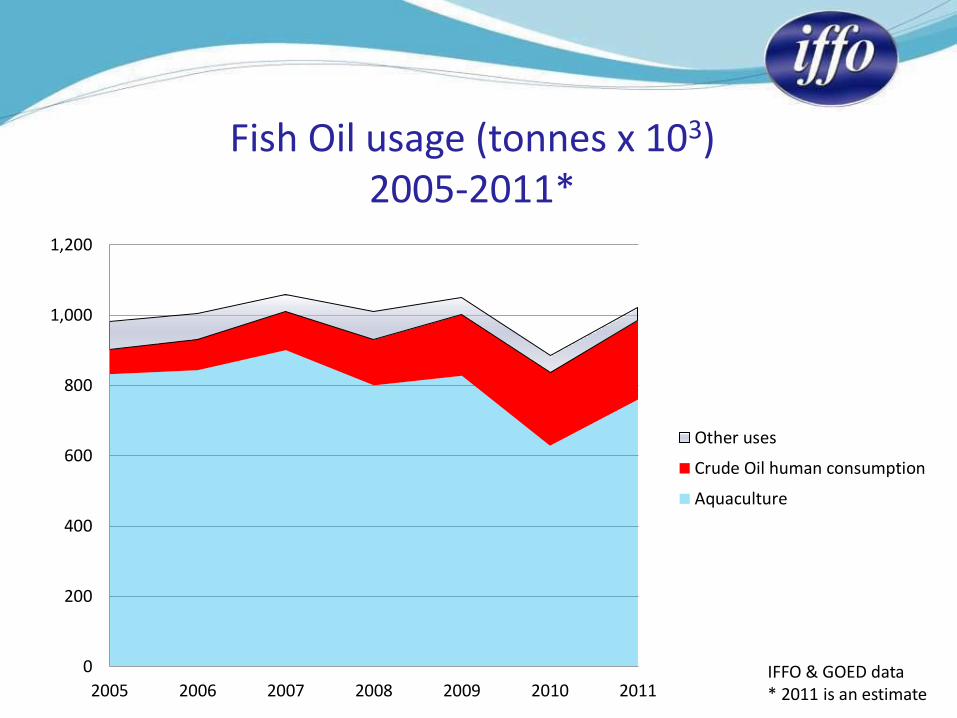
Fish Oil usage (tonnes x 103) 2005-2011*
IFFO & GOED data * 2011 is an estimate
0
200
400
600
800
1,000
1,200
2005 2006 2007 2008 2009 2010 2011
Other uses
Crude Oil human consumption
Aquaculture
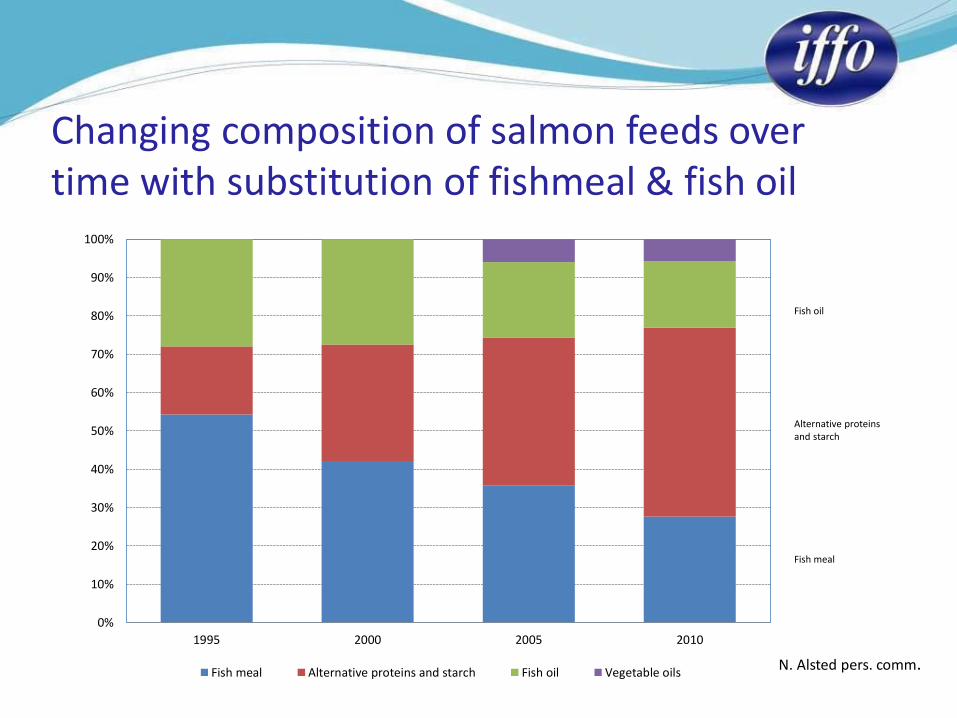
Changing composition of salmon feeds over time with substitution of fishmeal & fish oil
0%
10%
20%
30%
40%
50%
60%
70%
80%
90%
100%
1995 2000 2005 2010
Fish meal Alternative proteins and starch Fish oil Vegetable oils
Fish oil
Alternative proteins and starch
Fish meal
N. Alsted pers. comm.
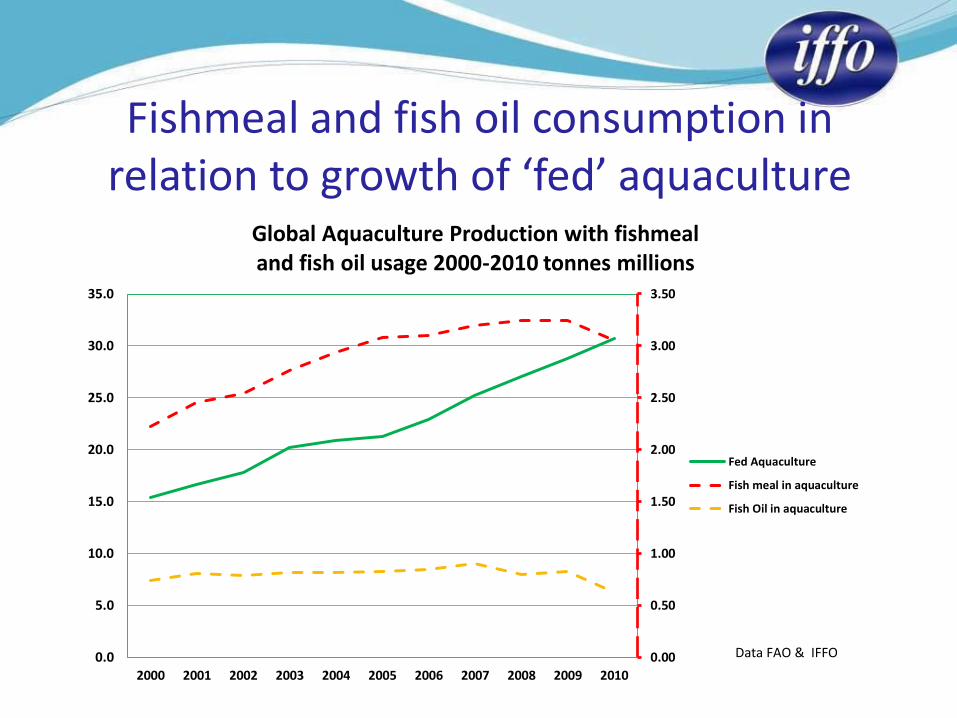
Fishmeal and fish oil consumption in relation to growth of ‘fed’ aquaculture
2000 – 2010 (tonnes x 106)
0.00
0.50
1.00
1.50
2.00
2.50
3.00
3.50
0.0
5.0
10.0
15.0
20.0
25.0
30.0
35.0
2000 2001 2002 2003 2004 2005 2006 2007 2008 2009 2010
Global Aquaculture Production with fishmeal and fish oil usage 2000-2010 tonnes millions
Fed Aquaculture
Fish meal in aquaculture
Fish Oil in aquaculture
Data FAO & IFFO
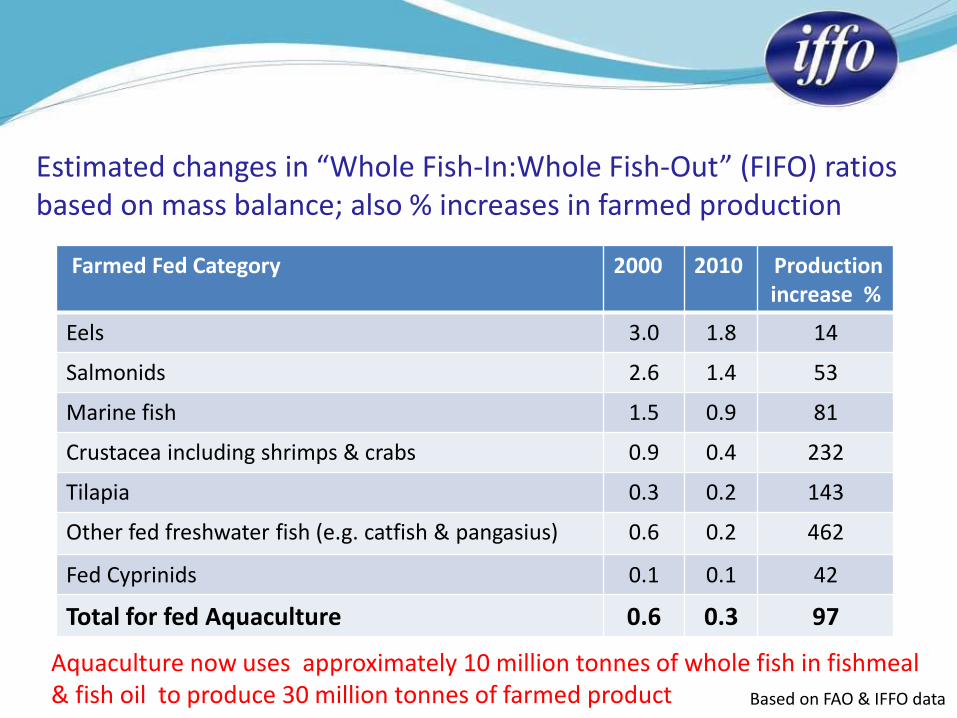
Estimated changes in “Whole Fish-In:Whole Fish-Out” (FIFO) ratios based on mass balance; also % increases in farmed production
Farmed Fed Category 2000 2010 Production increase %
Eels 3.0 1.8 14
Salmonids 2.6 1.4 53
Marine fish 1.5 0.9 81
Crustacea including shrimps & crabs 0.9 0.4 232
Tilapia 0.3 0.2 143
Other fed freshwater fish (e.g. catfish & pangasius) 0.6 0.2 462
Fed Cyprinids 0.1 0.1 42
Total for fed Aquaculture 0.6 0.3 97
Based on FAO & IFFO data
Aquaculture now uses approximately 10 million tonnes of whole fish in fishmeal & fish oil to produce 30 million tonnes of farmed product
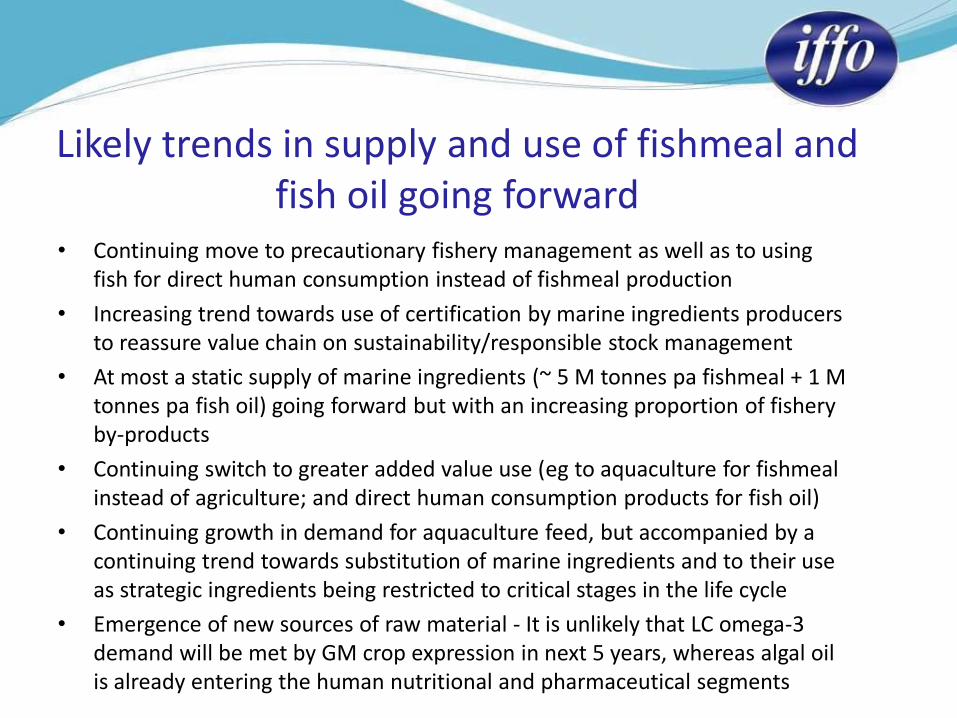
Likely trends in supply and use of fishmeal and fish oil going forward
• Continuing move to precautionary fishery management as well as to using fish for direct human consumption instead of fishmeal production
• Increasing trend towards use of certification by marine ingredients producers to reassure value chain on sustainability/responsible stock management
• At most a static supply of marine ingredients (~ 5 M tonnes pa fishmeal + 1 M tonnes pa fish oil) going forward but with an increasing proportion of fishery by-products
• Continuing switch to greater added value use (eg to aquaculture for fishmeal instead of agriculture; and direct human consumption products for fish oil)
• Continuing growth in demand for aquaculture feed, but accompanied by a continuing trend towards substitution of marine ingredients and to their use as strategic ingredients being restricted to critical stages in the life cycle
• Emergence of new sources of raw material - It is unlikely that LC omega-3 demand will be met by GM crop expression in next 5 years, whereas algal oil is already entering the human nutritional and pharmaceutical segments
Likely trends in supply and use (contd.)
• Increasing fish oil demand for direct human consumption will mean reduced availability for aquaculture which will therefore result in lower LC omega-3 levels in aquaculture products
• From 2000 to 2010 the FIFO ratio for fed aquaculture has fallen from 0.6:1 to 0.3:1
• It seems likely that even so-called ‘carnivorous’ fish will increasingly be commercially farmed so as to yield a net production of fish protein and oil
• It seems unlikely that there is a ‘fishmeal trap’ and that aquaculture growth will be limited by the availability of marine ingredients
• There are still areas for improvement – the largest being the use of low value/trash fish fed raw to aquaculture in S E Asia
• Increasing focus on micronutrients in fish raw materials to extend their availability and usefulness and create new added value products

Thank you
C.J. Shepherd & A.J. Jackson
International Fishmeal & Fish Oil Organisation
www.iffo.net