global fashion & luxury market private equity and investors survey
TRANSCRIPT

Global Fashion & Luxury marketPrivate Equity and investors survey 2016

Contents
Executive Summary 3
Key market trends 7
M&A Deal Monitor 2015 15
Private Equity and investors survey 2016 22
About Deloitte and its Fashion & Luxury practice 34

Private Equity and investors survey 2016 3
Executive summary
goods. The factors that negatively impact on the
sector performance are the drop in Leather Goods
sales, the increasingly strong competitive pressure
of Premium Fashion Brands and a slowdown in the
expansion of the Retail channel.
• Luxury jewelry is the best performing sector in the
Fashion & Luxury industry as a result of a growing
interest of high-worth consumers and thanks to
the positive performance achieved in the Branded
Jewelry segment, which offset the drop in sales
recorded in the Watches segment.
• The Cosmetics & Fragrances sector is growing,
mainly thanks to the development of cosmetics in
the Make-up category, especially for the High-End
segment. The Fragrances sector is characterized by
a positive trend driven by increasing prices.
• The Automotive industry is showing signs of
recovery; this phenomenon is particularly evident
in North America and Western Europe and is
linked to the expansion of the High-End segment
which takes away significant market shares from
the Premium segment. The recent economic
and financial turbulence has slowed down the
development of the Asian and Russian markets.
• The demand for Luxury accommodation is growing
in Europe, especially in large cities.
• Performance is stable in the Furniture sector, as
it is driven by the European market performance.
Growth opportunities have been identified in the
Asia-Pacific area and in the Middle-East, where
global players are scarcely present.
• The Private long-range Jets segment is expanding.
The North American market is recording the best
results in this segment.
• The demand for new Yachts is showing a slight
increase; the segment of custom-built yachts is
growing and the American market is showing signs
of recovery. The high-performance yacht segment
is still suffering; yacht demand shows a limited
penetration, especially in emerging markets.
• A positive performance is expected for Luxury
Cruise sector, driven by an increase in production
capacity in 2016.
Global Fashion & Luxury market: Private Equity and Investors Outlook 2016
• The “Global Fashion & Luxury Market: Private
Equity and Investors Outlook 2016” survey
conducted by Deloitte Financial Advisory analyzes
the main trends that, according to the interviewed
investors, are expected to characterize the
performance of this industry in 2016.
• In general, prospects are very good for players in
the Fashion & Luxury market; as a matter of fact,
also merger & acquisition deals show signs of
recovery in all areas of the luxury goods industry
that have been considered.
Global Fashion & Luxury market: Key market trends
• In 2015, sales in the Luxury market reached US$
~1.2 trillion, growing by 14.8% (+5% at constant
rates) over the last year mainly thanks to the Hotels
and Cars sectors.
• The Personal Luxury Goods sector, which accounts
for 28.2% of the total market, has grown by
12.9% (2.0% at constant rates).
• The average turnover of Fashion and Luxury
companies is US$ 3.6 billion, excluding the Car
sector (avg. US$ ~33 billion).
• Players in the Personal Luxury Goods sector record
average sales of around US$ 5 billion per year.
• The Personal Luxury Goods sector is the best
performing area of the Fashion & Luxury industry:
its average margins account for 22.5% of sales
compared to an average performance of 17.3%
in Fashion & Luxury. The worst-faring companies
are those operating in the Yachts sector as their
margins are far below the general average (~2.5%).
• In 2016, the four main trends that characterize
this sector and are impacting on the evolution
of the reference industry are as follows: digital
revolution, craftsmanship, contemporary fashion,
and consolidation of the new fashion capitals.
• The positive performance of the Apparel &
Accessories sector is driven by Shoes segment as
well as by the stable growth of Ready-to-Wear

4
Fashion & Luxury M&A deals in 2015
• In 2015, around 141 M&A deals focused on the
larger Fashion & Luxury industry were carried out,
of which 48% (67 deals) were finalized in the
Personal Luxury goods sector.
• The sectors that recorded the highest number
of deals are: Hotels (51), Apparel & Accessories
(33), Cosmetics & Fragrances (19) and Watches &
Jewelry (15). The remaining 23 transactions took
place in the Yachts & Private Jets and Furniture
sectors.
• In 2015, 47% of the finalized deals had an average
value below US$ 100 million, whereas it exceeded
US$ 500 million in 18% of cases. The average value
per transaction was US$ 426 million.
• The largest transactions – value above US$ 500
million – were finalized in the Private Jets, Hotels
and Cosmetics & Fragrances sectors. The average
value per transaction in the Personal Luxury Goods
sector was US$ 278 million.
• 81 deals (57%) were finalized in Europe, mainly in
the Apparel & Accessories (27 deals) and Hotels (24
deals) sectors. 35 transactions (25%) were carried
out in North America, of which 15 in the Hotels
sector. 13 transactions (9%) were finalized in the
Asia Pacific region, of which 6 in the Hotels sector
and 5 in the Watches & Jewelry sector.
• In 2015, around 70% of the acquired companies
recorded sales below US$ 100 million, whereas
10% recorded sales above US$ 500 million.
• The average sales of the companies acquired in
2015 amounted to US$ 425 million. The largest
players operated in the Apparel & Accessories (avg
US$ 663 million) and Hotels (avg US$ 572 million)
sectors, whereas the target companies operating in
the Furniture and Yachts sectors were smaller (avg
US$ 67 million and US$ 34 million, respectively).
• In 2015, 50% of the deals were executed by
Financial Investors, who are generally more inclined
to invest in the Personal Luxury Goods sector;
the remaining half of deals were carried out by
strategic investors operating in the Apparel &
Accessories, Fragrance & Cosmetics, Hotels and
Yachts sectors and more interested in consolidating
their position in their respective sectors.
• In 2015, 66% of exits were carried out by Strategic
Sellers who sold their business to investment funds;
Financial Sellers finalized 64% of transactions with
strategic investors.
• The main strategies adopted by Financial Bidders
were Growth Capital (49%) and Buyout (64%)
strategies, whereas Business Consolidation
strategies (used in 6.6% of all transactions) were
adopted almost exclusively by Strategic Investors.
• Overall, 77% of all finalized transactions resulted
in the acquisition of a majority stake in the target
company.
• 35% of the finalized deals achieved a 15x EBITDA
multiple, mostly in the Hotels sector (driven also by
the presence of property assets), whereas 20% of
the deals achieved a 5-10x EBITDA multiple.

Private Equity and investors survey 2016 5
Fashion & Luxury Private Equity and Investors Outlook 2016
• Around 60% of investors maintain they own assets
in the Fashion & Luxury industry characterized by
a majority stake and an average duration generally
below 5 years.
• In 2015, the main strategies developed to support
the creation of economic value from owned
Fashion & Luxury assets were as follows:
– development of new distribution channels - 60%;
– penetration of new geographical markets - 51%;
– improvement of operational performance through
actions to increase efficiency - 37%;
– development of new products - 29%.
• 44% of investors foresee at least one exit from
their F&L portfolio in 2016, mainly driven by
the opportunity to achieve high returns on the
investment made.
• 53% of all respondents forecast an increase of over
5% (of which 15% with double-digit growth) in
the Fashion & Luxury market in 2016, driven by the
positive trends predicted in the following sectors:
Cosmetics & Fragrances (on the increase according
to 69% of investors), Furniture (60% of investors),
Apparel & Accessories (59%), Cars (54%):
– the sectors which attract the highest percentage
of negative forecasts – although they are fewer
than positive forecasts – are as follows: Yachts
(25% predicting a decrease vs 30% predicting
an increase), Private Jets (22% - decrease vs 39%
- increase), Cruises (21% - decrease vs 41% -
increase) and Selective Retailing (21% - decrease
vs 69% - increase);
– investors with assets in the F&L industry have
better expectations, compared to potential
investors who do not own F&L assets, as regards
the Cosmetic & Fragrances and the Apparel &
Accessories sectors.
• The geographies where investors expect growth in
2016 are the Asia-Pacific region (excluding Japan),
the Middle East and North America, whereas
Europe should remain stable. Investors forecast a
negative trend for Latin America and Japan.
• In 2016, 76% of respondents plan to make at least
one investment in the Fashion & Luxury industry,
more specifically in the following sectors: Apparel &
Accessories (75%), Cosmetics & Fragrances (48%),
Furniture (39%).
• Investors interested in F&L maintain:
– in 72% of cases, that they intend to acquire
target companies with a turnover below US$ 100
million; 10% of investors plan on investing in
companies with sales above US$ 500 million;
– that they intend to carry out new transactions in
this industry through Expansion Capital strategies
(63%), Leverage buy-out strategies (61%)
and Management buy-out strategies (54%),
mainly acquiring a majority stake in the target
organization;
– that they intend to fund the investment using
mainly senior debt (80%).
• The average return expected from investments in
the Fashion & Luxury industry is very high; 70%
of respondents expect investments to have an
IRR exceeding 20%. The Personal Luxury Goods
sectors are considered as the most profitable
ones by investors, as confirmed by the business
performance of the companies analyzed.
• The highest returns are expected from large-sized
organizations; as a matter of fact, around 35%
of investors expecting an IRR above 20% plan on
acquiring companies with sales above US$ 100
million.

6
Methodological approach
Sectors covered
Apparel & Accessories | Watches & Jewelry | Cosmetics & Fragrances | Cars | Hotels | Furniture | Private Jets | Yachts | Cruises
Market segments
The survey focuses on the «Premium» segments in the sector, defined on the basis of quantitative (e.g. price point) and qualitative (e.g. interviews with industry experts) parameters.
Key market trends M&A deal monitor PE & investors survey
Main contents
Size of global market in 2015Size of M&A deals in 2015 classi-
fied by sector
Analysis of the current portfolio of
assets operating in the reference
market
Analysis of market trends by sector Analysis of target company profiles
Analysis of the main guidelines
implemented with reference to
the existing portfolio to create
economic value
State of the market in 1Q 2016 Analysis of investor profiles Analysis of the exit strategies fore-
casted for 2016
2016 market outlookAnalysis of the characteristics of
deals carried out at global level
Outlook and investment strategies
for 2016
Analysis of the business perfor-
mance of the major market players
classified by sector
Sources
Altagamma Foundation Merger Market
Online survey based on CAWI
(Computer Assisted Web Inter-
viewing)
Annual financial report and pre-
sentation of major players Thomson M&A
Interviews with executives operat-
ing in the PE sector
Interviews with opinion leaders in
the industryOne Source
Mint Global
Company press releases
Geographical footprint
Primary data level
Global scope

Private Equity and investors survey 2016 7
Key market trends
Global Luxury Market in 2015
In 2015, sales in the Luxury market reached US$ ~1.2 trillion, growing by 14.8% (+5% at constant rates) over
the last year mainly thanks to the Hotels and Cars sectors.
Key Fashion Business Trends in 2016
Four key trends are influencing the Fashion industry and consequently the strategic and operational choices of
organizations.
6.7%
Yachts
Watches & Jewelry
Furniture
Cosmetics & Fragrances
Apparel & Accessories
4.5%
1.3%
4.6%
6.0%
Cruises 7.2%
11.5%
Private Jets
Cars
9.5%
Total luxury market
10.6%
Hotels
9.1%
+7.0%
+8.0%
-1.0%
+4.0%
+2.6%
+1.0%
+4.0%
-3.0%
+5.0%
+17.3%
+15.4%
+16.7%
+14.3%
+14.7%
+13.6%
+10.3%
+8.0%
+14.8%
-1.0% +2.0%
1,188
5.6%
6.2%
2015
3.6%
16.4%
19.6%
45.2%
Cruises
Private Jets
Furniture
Yachts
Apparel & Accessories
Watches & Jewelry
Cosmetics & Fragrances
Hotels
Cars
0.2%0.8% 2,3%
Global Luxury Market 2015 (B$; %)
Luxury market trend (CAGR 12-15; %)
YoY 14-15
YoY @k 14-15
The booming of digital is modifying companies’ distribution channels for the
front-end market and business models for product development and supply
chain.
The research of quality and exclusivity from end users encourages fashion
luxury corporations to invest in craftsmanship, influencing production and
design competencies and skills.
The upsurge of “Contemporary Fashion” segment, represented by emerging
designers launching their own start-ups.
The global growth of mature and emergent fashion capitals, driven by the
economic growth of emerging markets, offering the possibility of geographical
expansion to key players in the industry.
Digital Revolution
Craftsmanship
Contemporary fashion
Fashion capitals
Key business trends Highlights
Source: Data from Altagamma Worldwide Luxury Market Monitor.

8
Global Luxury Market Outlook
Apparel & Accessories
Key attractions: This sector benefits from the positive
trend of the «shoes» category, particularly in the US
and China, which is driven by increasing consumer
demand in the high-end market segment.
Stable growth in the Ready-to-Wear sector, driven
by the by now consolidated performance of the
Womenswear segment.
«Lifestyle» and «Iconic» brands are growing strongly
and achieving positive results in all goods categories
The off-price channel continues on its development
path; it is used by industry players as a strategic tool
to differentiate their offering based on different
demand segments.
Key concerns: Leather Goods are losing market
shares because of greater consumer loyalty volatility
in the aspirational goods segment, which results
from the sharp price increases recorded over the last
few years. Increase in competitive pressure among
Premium Fashion Brands in the High-End segment.
Expansion slowdown in the Retail sector. In many
cases, players limit themselves to the acquisition
of distribution networks managed through joint
ventures in Asian markets.
Cosmetics & Fragrances
Key attractions: The ongoing development of the
Make-up category drives growth in the Cosmetics
sector, thus offsetting the poor performance
of Skincare products. The positive trend in the
Fragrances segment is supported by the good
performance of the high-end segment; especially
handcrafted products are on the increase.
What stands out is the expansion of Asian players
- that take market shares away from large groups
in the local markets - coupled with increasing
demand, therefore attracting potential private capital
investment.
Key concerns: Despite the significant role of
promotional initiatives, the main growth driver in the
Fragrances segment is represented by price increases
in mature markets, which are somewhat resistant to
product innovation.
Cars
Key attractions: Luxury Cars continue on their
growth path, driven by progressive recovery in the
automotive industry. The performance of the U.S.
market and recovery in Western Europe stand out as
particularly positive.
The high-end segment (2.2% of all automotive
sales) is strongly expanding, driven by an extension
of the range of products and services offered: new
entry-level models (bridge categories) launched to
take away market shares from premium players and
greater customer service differentiation in order to
maximize operating margins.
Key concerns: The Asian market is under scrutiny
because of its unsatisfactory results, which are
a direct consequence of economic and financial
turbulence. The Russian market has still not been
recovered.
+3.5%Outlook 2016
+8.0%Outlook 2016
+4.0%Outlook 2016
Source: Data from Altagamma Worldwide Luxury Market Monitor.

Private Equity and investors survey 2016 9
Hotels
Key attractions: The European market is driving
the sector’s performance, which is characterized
by a significant increase in the demand for luxury
accommodation in large cities.
Service differentiation according to different cultural
and generational needs may represent a potential
lever for business expansion in the future.
Key concerns: Declining performance in the United
States and the Asian market, which is struggling to
find a path towards sustainable development.
Competitive pressure is increasing in the sector as a
result of the entry of new players and the emergence
and consolidation of new online accommodation
platforms, which are becoming more and more
widespread in the high-end segment.
Private Jets
Key attractions: The long-range Jets segment (54%
of the total market) is growing and drives the
performance of the entire sector.
North America is the main market showing signs of
strong expansion.
Key concerns: The performance of the small- and
medium-sized Jets segment is stable.
Competitive pressure is increasing in strongly
developing markets, especially in Emerging Countries.
Cruises
Key attractions: The increase in production capacity
expected to take place in 2016, as a result of
the delivery of new cruise ships, will be a key
development driver for this sector.
In particular, the «slow cruises» - i.e. cruises on
smaller ships offering alternative routes to larger
ships - segment looks promising.
The expectations as to demographic and income
trends support the growth expected in this sector.
Key concerns: Potential market risk associated with
a failure to saturate the new capacity expected for
2016.
Furniture
Key attractions: This sector has a not yet fully
exploited growth potential in the Asia-Pacific and
Middle-East market.
The Living & Bedroom and Lighting categories are
showing an interesting performance, whereas the
Kitchens segment is recovering.
Key concerns: The performance of the entire sector is
influenced by the by now stable trend in Europe, i.e.
the major market worldwide
Concentration in the European market is a potential
risk factor for private capital investments.
+2.5%Outlook 2016
+5.0%Outlook 2016
+5.0%Outlook 2016
+6.0%Outlook 2016
Source: Data from Altagamma Worldwide Luxury Market Monitor.
10
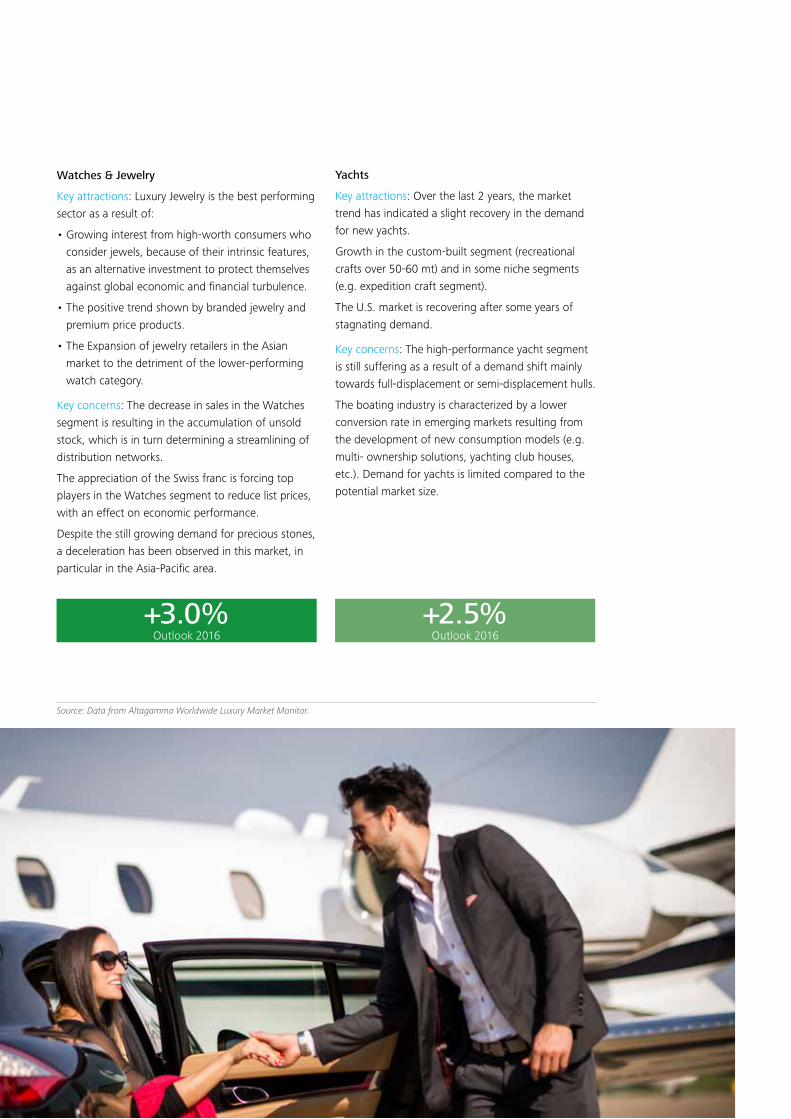
Watches & Jewelry
Key attractions: Luxury Jewelry is the best performing
sector as a result of:
• Growing interest from high-worth consumers who
consider jewels, because of their intrinsic features,
as an alternative investment to protect themselves
against global economic and financial turbulence.
• The positive trend shown by branded jewelry and
premium price products.
• The Expansion of jewelry retailers in the Asian
market to the detriment of the lower-performing
watch category.
Key concerns: The decrease in sales in the Watches
segment is resulting in the accumulation of unsold
stock, which is in turn determining a streamlining of
distribution networks.
The appreciation of the Swiss franc is forcing top
players in the Watches segment to reduce list prices,
with an effect on economic performance.
Despite the still growing demand for precious stones,
a deceleration has been observed in this market, in
particular in the Asia-Pacific area.
Yachts
Key attractions: Over the last 2 years, the market
trend has indicated a slight recovery in the demand
for new yachts.
Growth in the custom-built segment (recreational
crafts over 50-60 mt) and in some niche segments
(e.g. expedition craft segment).
The U.S. market is recovering after some years of
stagnating demand.
Key concerns: The high-performance yacht segment
is still suffering as a result of a demand shift mainly
towards full-displacement or semi-displacement hulls.
The boating industry is characterized by a lower
conversion rate in emerging markets resulting from
the development of new consumption models (e.g.
multi- ownership solutions, yachting club houses,
etc.). Demand for yachts is limited compared to the
potential market size.
+3.0%Outlook 2016
+2.5%Outlook 2016
Source: Data from Altagamma Worldwide Luxury Market Monitor.

Private Equity and investors survey 2016 11
Business Performance Analysis: Scope of Top Players
The analysis of business performance in the Fashion & Luxury industry was conducted on a panel of 73
companies.
Business Performance Analysis: Revenues of Top Players
F&L top players accounted for around 55% of the total market; Cars and Personal Luxury Goods made up 90%
of the total revenues of F&L top players.
In order to analyze the business performance of the main players in the Fashion & Luxury industry, summary economic and financial data was collected from a panel of 73 companies.
The panel has been selected considering the size of total revenues of each player and its representativeness in the analyzed sectors (covered market share). The organizations are mostly based in Europe and North America, but they generally have a global business scope.
In 2014, the total revenues recorded by the industry top players equaled around US$ 553 billion, of which 60% was represented by Luxury Cars and 32% by Personal Luxury Goods.
An analysis of the market shares held by the selected top players has highlighted the high level of concentration characterizing Fashion & Luxury sectors, where some organizations hold over 50% of the global market share. The Furniture sector appears to be highly fragmented.
Note: Consolidated data on the main corporate groups operating in the reference market are reported, segmented by business area. The collected data refer only to brands with a ‘premium’ market positioning.Source: Data from Altagamma Worldwide Luxury Market Monitor and company financial reports.
Source: Data from Altagamma Worldwide Luxury Market Monitor and company financial reports.
60% 80% 100%
20%
40%
60%
40%
20% 0%
80%
0%
100%
Apparel & Accessories
20
Watches & Jewelry
10
20.0%
30.0% 20.0%
20.0%
50.0% 60.0%
20.0%
50,0%
Furniture
87.5%
7
16.7%
5
20.0%
10
90.0%
10.0% 12.5%
Hotels Cosmetics & Fragrances
6
Yachts
14.3%
66.7%
Cruises Cars
16.7%
85.7%
Private Jets
2
50.0%
8 5
60.0%
20.0%
80.0%
Europe
North America
Asia-Pacific 7%
Break (%) 27.4% 8.2% 6.8% 11.0% 6.8% 13.7% 9.6% 13.7% 2.7%
Break %
26%
67%
73 player
Panel of top players – breakdown by sector and geographical area (# ; %)
Total revenues of top players in 2014 – breakdown by sector (B$; %)
326.7
50.9
87.8
375.8 (68%)
Furniture
Personal Luxury Goods
3.4
Yachts Total
176.7 (32%)
33.5 552.5
Cruises
1.8
Private Jets
6.1
38.1
Apparel & Accessories
Cosmetics & Fragrances
Watches & Jewelry
Cars Hotels
4.2
Other Luxury markets
Break (%)
Top players Mkt Share (%)
15.9% 9.2% 6.9% 59.1% 6.1% 0.6% 1.1% 0.8% 0.3% 100.0%
51.5% 74.5% 65.3% 70.2% 16.9% 25.6% 44.4% 8.9% 96.8% 53.4%
503B$ - 91%
Key Findings
Key Findings

12
Business Performance Analysis: Average Sales per Top Player
Average sales reported by Fashion & Luxury companies equaled US$ 3.6 billion, excluding the Cars sector (avg.
US$ ~33billion). Personal Luxury Goods players reported an average yearly turnover of around US$ 5 billion.
Business Performance Analysis: Profit Pool of Top Players
Personal Luxury Goods were the most profitable industry sector, with margins averaging 22.5% of sales. The
situation in the Yachts sector proved more difficult as players reported margins way below the general average
(2.5%).
Fashion & Luxury top players reported a turnover of US$ 7.6 billion; the average figure was significantly influenced by the size of holdings in the Cars sector, where the average turnover was US$ 32.7 billion; if this sector is excluded, then the average drops to US$ 3,6 billion.
The companies operating in the Yachts, Furniture and Cruises sectors were generally small-sized (average sales around US$ 500 million). On average, companies in the Personal Luxury Goods sector had a turnover of around US$ 5 billion.
Profitability in Personal Luxury Goods companies was around 5 percentage points higher than the general Fashion & Luxury average. The best performing sectors were Apparel & Accessories (24.8%) and Watches & Jewelry (22.5%). Yacht shipyards reported margins that were clearly lower than those reached in the other sectors, with a 2.5% average operating profit.
Source: Data from company financial reports.
Source: Data from company financial reports.
Average sales of F&L top players in 2014 – breakdown by sector (B$)
Average operating profit of F&L top players in 2014 – breakdown by sector (%)
0.40.40.6
3.1
6.7
4.45.1
6.3
Hotels
32.7
Cars Cosmetics & Fragrances
Private Jets Watches & Jewelry
Yachts Apparel & Accessories
Avg. PLG 4.9B$
Avg. F&L 3.6B$ (cars excl.)
Avg. F&L 7.6B$
Furniture Cruises
Personal Luxury Goods (PLG)
Other Luxury markets
Avg. PLG 22.5%
Avg. F&L 17.3%
Apparel & Accessories
22.5%
8.9%
Cruises Yachts Furniture Cosmetics & Fragrances
13.9% 12.4%
Watches & Jewelry
Private Jets
15.3%
2.5%
8.8%
Hotels
24.8%
Cars
16.9%
Other Luxury markets
Personal Luxury Goods (PLG)
+5 pp
Key Findings
Key Findings

Private Equity and investors survey 2016 13
Attractiveness of Fashion & Luxury Sectors
Apparel & Accessories and Watches & Jewelry are the top performing Fashion & Luxury sectors, both in terms
of average turnover growth (+7.6%) and operating margins (24%). The Cars sector is recovering; strong
growth in the Private Jets sector.
Source: Data from company financial reports.
Mapping of Luxury sectors by business performance
30%
18
3
6
0
15
9
15 10 25 20 5 0
Hotels
Cars
Cosmetics & Fragrances
Apparel & Accessories
Watches & Jewelry
Cruises
Average operating profit FY14 (Percentage | avg. 17.3%)
Turn
over
gro
wth
201
2 -
14(C
AG
R %
| av
g. 7
.3%
)
Yachts
Private Jets
Furniture
Personal Luxury Goods
Other Luxury markets
Starsmarkets
High growth markets
Mature markets
Lower performer sectors
Market size

14

Private Equity and investors survey 2016 15
M&A Deal Monitor 2015
Overview by sector
Overview by geography
Relevant deals in 2015
Global
100%141 deals
Apparel & Accessories
23%33 deals
Watches & Jewelry
11%15 deals
Yachts
6%9 deals
Furniture
5%7 deals
Cosmetics & Fragrances
13%19 deals
Hotels
36%51 deals
Private jets
5%7 deals
North America
Cos&Fra
43% Hotels
100%
17%
29% Other
11%
2015
App&Acc 35 deals (25%)
Rest of the World
Hotels
2015
100%
75%
25% Yachts
4 deals (3%)
Europe
2015
100%
33%
25%
Hotels 30%
12% Cos&Fra
App&Acc
Other
81 deals (57%)
Middle East
50%
2015
100%
Private Jets 50%
Furniture 2 deals (1%)
Japan
Cos&Fra 17% Wat&Jew
33%
2015
100%
Hotels
App&Acc 33%
16%
6 deals (5%)
Asia-Pacific
Wat&Jew
100%
Cos&Fra
46% Hotels
2015
38%
15%
13 deals (9%)
Overview of global M&A deals in Fashion & Luxury - 2015
Date November July April June June December September December March January
TargetStarwood
hotelsP&G Coroin Ltd
Center Parcs
Douglas Holding
FRHI HotelsLandmark aviation
Pepe Jeans HypermarcasThe Net-A-Porter
Group Ltd
BidderMarriot Intern.
CotyConstellation
HotelsBrookfield partners
CVC AccorBBA
aviationM1 Group Coty YOOX SpA
Value (B$) ~12 ~12 ~4.7 ~3.7 ~3 ~3 ~2 ~1 ~1 ~0.8
Note: In the «Relevant deals in 2015» list are included both announced and closed deals.

16
Size of the Main M&A Deals
In 2015, the Fashion & Luxury industry recorded around 141 M&A deals globally, of which 48% focused on
Personal Luxury Goods and 36% on the Hotels sector.
Breakdown of Deals by Average Deal Value
In 2015, 47% of deals had an average unit value below US$ 100M. The deals with a unit value above US$
500M represented 18% of all transactions, of which 2/3 with a value exceeding US$ 1B.
Note: The analysis includes the main M&A deals finalized in the Fashion & Luxury industry during 2015, excluding IPOs; the analysis takes into consideration also transactions aimed at acquiring players in the Fashion & Luxury value chain as strategic suppliers and selective retailers;(1) The analysis does not include deals having the purchase of tangible assets (real estate) as sole purposeSource: Data from Merger Market, Thomson M&A, One Source, Mint Global and company press releases.
Note: The average deal value has been calculated excluding the transactions for which no specific condition details are availableSource: Data from Merger Market, Thomson M&A, One Source, Mint Global and company press releases,
33
1519
51
Other Luxury markets
Personal Luxury Goods
Apparel & Accessories
Yachts Hotels 1 Watches & Jewelry
Cosmetics & Fragrances
67 (48%)
74 (52%)
141
Furniture Total Fashion & Luxury
Private Jets
9 77
Break (%) 23.4% 10.6% 13.5% 36.2% 6.4% 5.0% 5.0% 100.0%
Number of deals in 2015 – breakdown by sector (# ; %)
Breakdown of deals by deal value (%)
During 2015, around 141 M&A transactions focused on the larger Fashion & Luxury sector were carried out globally; 48% of these deals (67 deals) involved Personal Luxury Goods companies.
Because of the uncertainty characterizing global markets, investors turned to companies with substantial property assets, i.e. Hotels (representing 36% of total transactions), in order to protect themselves against economic and currency fluctuations. Deals were distributed as follows among the remaining sectors: Yachts 6.4% (9 deals), Private Jets 5.0% (7 deals) and Furniture 5.0% (7 deals).
In 2015, around 47% of M&A transactions had an overall value below US$ 100M. 50% of these deals focused on target companies operating in Personal Luxury Goods sectors. The deals with a unit value above US$ 500 million accounted for 18% of all transactions. In 2015, top deals – i.e. deals with value exceeding US$ 1 billion – represented 11% of transactions and were concentrated in the Hotels sector (65% of deals). The high deal value in this sector results from the very features of the transaction, which focuses on the acquisition of the business AND the purchase of the property assets owned by the target company
100%
34%
Total Fashion & Luxury
> 1B$ 500M$ - 1B$ 100-500M$ < 100M$
47%
11%
7%
Key Findings
Key Findings

Private Equity and investors survey 2016 17
Average Value of Main Deals by Sector
In 2015, the average value per deal equaled US$ 426M; the deals with a value above average were finalized in
the Private Jets (US$ 2B), Hotels (US$ 573M) and Cosmetics & Fragrances (US$ 498M) sectors.
Geographical Distribution of Deals
In 2015, 57% of deals (81) were finalized in Europe, 25% (35) in North America and 9.2% (13) in the Asia-
Pacific region.
Note: The average deal value has been calculated excluding the transactions for which no specific condition details are available; the analysis excludes some deals which represented outliers, as they would not allow a reliable analysis of sector averages.(1) The value reported for the Private Jets sector refers to a single transaction, for which economic and financial details are available.Source: Data from Merger Market, Thomson M&A, One Source, Mint Global and company press releases.
Average value per deal in 2015 – breakdown by sector (M$)
Deals finalized in 2015 – breakdown by sector and geographical area (# ; %)
In 2015, the most sizable acquisition deals were finalized in the Private Jets and Hotels sectors, with an average value per deal greater than US$ 500 million.
The average deal value in the Apparel & Accessories sector equaled US$ 297 million - i.e. 0.7 times the average value of the whole Fashion & Luxury industry; this was mainly a consequence of the strong focus of investors on small-sized (low-turnover), fast-growing target companies. The same applies to the Watches & Jewelry sector.
18
100
573
182
297
498
Avg. PLG 278M$
Avg . F&L 426M$
Yachts Cosmetics & Fragrances
Hotels
2,065
Watches & Jewelry
Furniture Apparel & Accessories
Private Jets 1
Personal Luxury Goods (PLG)
Other Luxury markets
Source: Data from Merger Market, Thomson M&A, One Source, Mint Global and company press releases.
Europe North
America
15
644
35 3 3
Deal per settore
Hotels
App & Acc Wat & Jew
Cos & Fra
27
24
10
Deal per settore
81
5
3 5
7
Asia-Pacific
6
5
213
Deal per settore
Hotels
Wat & Jew
Cos & Fra
24.8% 57.4% 9.2%
Middle East
Rest of the World
3
1
Hotels
4
Deal per settore
Yachts
1
1
Furniture
Deal per settore
2
Private Jets
Japan
2
2
1
1
Hotels
Cos & Fra
Wat & Jew
6
Deal per settore
App & Acc
2.8% 1.4% 4.3%
Hotels Furniture Yachts Private Jets
Apparel & Accessories Cosmetics & Fragrances Watches & Jewelry
App & Acc
Hotels
Cos & Fra Wat & Jew
Key Findings

18
Average Size of Target Companies
In 2015, around 70% of the acquired companies reported sales below US$ 100 million and 10% exceeded
US$ 500M.
In 2015, the average turnover reported by the acquired companies equaled US$ 425M; most deals involving
big companies were executed in the Apparel & Accessories and Hotels sectors.
Note: The analysis is based on a sample of target companies for which official turnover figures as at the end of FY 2014 were available.Source: Data from Merger Market, Thomson M&A, One Source, Mint Global and company press releases.
Note: The analysis is based on a sample of target companies for which official turnover figures as at the end of FY 2014 were available.Source: Data from Merger Market, Thomson M&A, One Source, Mint Global and company press releases.
Distribution of target companies across revenue classes (%)
Average turnover of the acquired companies by sector (M$)
In 2015, investments in the Fashion & Luxury industry were focused mainly on smaller-sized organizations: around 67% of the target companies had a turnover below US$ 100 million
Only 10% of the total number of deals involved organizations with sales exceeding US$ 500 million. The main ‘giant deals’ were as follows:
• Acquisition of Starwood Hotels by Marriot International (deal value ~12-13B$).
• Agreement between Procter&Gamble and Coty concerning the transfer of 43 haircare brands to the multinational Perfumes company (deal value ~12.5B$).
• Acquisition of the Douglas perfumery chain by the CVC Capital Partners private equity fund (deal value ~3B US$).
The average turnover reported by the companies acquired in 2015 equaled around US$ 425M, or US$ 453M if only Personal Luxury Goods companies are considered.
Large-sized target companies were concentrated in the Apparel & Accessories (avg. US$ 663M) and Hotels (avg. US$ 572M) sectors.
6.0%
9.6%
14.5%
101-250M$
32.5%
16.9%
501-1,000M$
4.8%
15.7%
51-100M$ 251-500M$ 25-50M$ <25M$ >1,000M$ Total Fashion & Luxury
100.0% 67% under 100 M$
10% over 500 M$
3467
276
572
214227
663
Furniture Watches & Jewelry
Apparel & Accessories
Cosmetics & Fragrances
Private Jets Hotels
Avg. F&L 425M$
Yachts
Avg. PLG 453M$
Other Luxury markets
Personal Luxury Goods (PLG)
Key Findings
Key Findings

Private Equity and investors survey 2016 19
Bidder Profile
In 2015, 50% of deals were executed by Financial Investors, of which around 90% were Private Equity
investors; the remaining half of deals were carried out by Corporate investors operating in the Fashion & Luxury
industry...
...in particular, an analysis of investment strategies shows that PE investors were mostly interested in Personal
Luxury Goods companies, whereas large corporations tended to invest in their own sector.
Note: A deal with undisclosed Bidder name has been excluded from this analysis.Source: Data from Merger Market, Thomson M&A, One Source, Mint Global and company press releases.
Note: The propensity index has been calculated by comparing the exit strategy mix in each sector with the general average observed in the analyzed sample, weighted according to deal concentration in that sector in 2015.Source: Data from Merger Market, Thomson M&A, One Source, Mint Global and company press releases.
Investor profile in PE exits (%)
Type of exit broken down by target company sector (propensity idx)
Investor profile in Strategic exits (%)
The analysis of acquisition strategies confirms that Private Equity funds – despite an increased focus on experiential luxury sectors (e.g. Hotels) – still show a propensity to invest in Personal Luxury Goods companies. The most significant deals included: The acquisition of Pepe Jeans, - the Spanish premium jeans brand - by M1 Group and L Capital Asia; The acquisition of Twin-Set – an Italian player in the premium App&Acc sector - by The Carlyle Group.
The remaining Fashion & Luxury sectors mainly attracted Strategic Investors adopting consolidation and/or business growth strategies.
In 2015, the main bidders in 50% of the executed deals were Financial Investors, represented by Private Equity funds in ~90% of cases. 50% of transactions were carried out by Strategic Investors, of which 25.7% were large corporate investors operating in the Apparel & Accessories sector, 10.0% were investors operating in the Fragrance & Cosmetics business, and 20.0% specialized in the Hotels sector. 8.6% of deals were executed by investors operating in sectors external to the Fashion & Luxury industry.
85.7%
10.0%
50.0%
50.0%
Financial investor
Bidder type
Venture Capital/ Private Equity
Other investors
Bidder sector
Real Estate
4.3%
Strategic investor
100.0% 100.0%
25.7%
10.0%
20.0%
10.0%
25.7%
8.6%
50.0%
50.0%
100.0%
Strategic investor
Bidder type
Apparel & Accessories
Bidder sector
Fragrances & Cosmetics
100.0%
Hotels
Other F&L sectors
Other industries
Financial investor
Yachts
Strategic investor Propensity (Idx 100)
Financial investor propensity (Idx 100)
Cruises
Furniture
Yachts
Private Jets
Hotels
Watches & Jewelry
Apparel & Accessories
Fragrances & Cosmetics
Key Findings
Key Findings

20
Exits by Seller Type
In 2015, 66% of exits were executed by Strategic Sellers selling their business to investment funds; Financial
Sellers executed 64% of transactions with strategic investors.
Main Investment Strategies of Bidders
Most finalized deals were based either on a «Growth Capital» or a «Buyout» strategy as underlying logic and
were mainly aimed at the acquisition of a majority stake.
Note: A deal with undisclosed Bidder name has been excluded from this analysis.Source: Data from Merger Market, Thomson M&A, One Source, Mint Global and company press releases.
Note: This analysis is based on a sample of 91 target companies for which information about the equity stake in the target company acquired through the transaction was available.Source: Data from Merger Market, Thomson M&A, One Source, Mint Global and company press releases.
M&A market by investor type (%)
Deal breakdown by investment strategy (%) Deal breakdown by sector and equity stake (%)
In 2015, 66% of exit transactions were executed by Strategic Sellers; in 57% of these deals, the counterparty was a Financial Investor (Strategic to Sponsor), whereas in 43% of deals the counterparty was a Strategic Investor (Strategic to Strategic). Financial Sellers executed most deals with strategic investors; 30 Sponsor-to-Strategic transactions were finalized (representing 64% of Financial Sellers).
In 2015, 64.2% of deals were based on a «growth capital» strategy, followed by 20.4% based on a «buyout» logic, of which 64% were executed by Private Equity funds. «Business consolidation» strategies accounted only for 6.6% of all deals mainly executed by Strategic Investors (around 90%). 80% of turnaround and recapitalization deals were executed by Private Equity funds.
Overall, 77% of the finalized deals were aimed at the acquisition of a majority stake in the target company; deals aimed exclusively at the acquisition of a majority stake were executed in some sectors, such as Furniture, Private Jets and Yachts.
It should be noted that 56% of the deals finalized in the Watches & Jewelry sector resulted in the acquisition of a minority stake.
Strategic Investor 66 deals
Sponsor to Sponsor 17 deals (36%)
Financial Investor 71 deals
50%
50%
Strategic to Strategic 40 deals (43%)
Sponsor to Strategic
Strategic to
Sponsor
53 deals (57%)
30 deals (64%)
Financial Seller 45 deals
Strategic Seller 92 deals
Seller Buyer
34%
66%
Weight on total deals per seller type
6.6%
3.6% 1.5% 3.6%
20.4%
64.2%
Merger
Recapitalisation
Turnaround
Consolidation
Buyout
Growth capital
% Financial investor
49%
64%
11%
80%
80%
0%
63%44%
89% 81%100% 100% 100%
77%
37%56%
11% 19% 23%
100%
Cosmetics& Fragrances
100%
Watches& Jewelry
100%
Apparel& Accessories
100%
Total Fashion& Luxury
Yachts
100%
PrivateJets
100%
Furniture
100%
Hotels
100%
Minority
Majority
Key Findings
Key Findings

Private Equity and investors survey 2016 21
Analysis of EBITDA Multiples Achieved on the Main Deals
An analysis of the EBITDA multiples achieved in this industry confirms the premium value assigned by investors
to Fashion & Luxury companies; an EBITDA multiple greater than 15x was achieved on 36% of transactions.
Note: This analysis is based on a sample of 31 companies for which information about the EV/EBITDA multiple assigned to the target company was available.Source: Data from Merger Market, Thomson M&A, One Source, Mint Global and company press releases.
Deal breakdown by EBITDA multiple in 2015 (%)
An analysis of the Enterprise value/EBITDA multiple achieved on a sample of deals for which transaction details had been disclosed, confirms the premium value assigned by investors to Fashion & Luxury players: 36% of all deals were closed with a multiple greater than 15x.
The companies operating in the Hotels sector proved to be the best performing ones in 2015. 50% of target companies were valued above 15x, mainly thanks to the mark-up associated with property assets
A 5-10x EBITDA multiple was achieved on 36% of deals.
50% inHotels sector
>15x Total Fashion & Luxury
<5x
8.0%
5-10x
20.0%
36.0%
11-15x
100.0%
36.0%
Key Findings

Private Equity and Investors Survey 2016
Private Equity and investors survey 2016 23
Profile of Survey Respondents
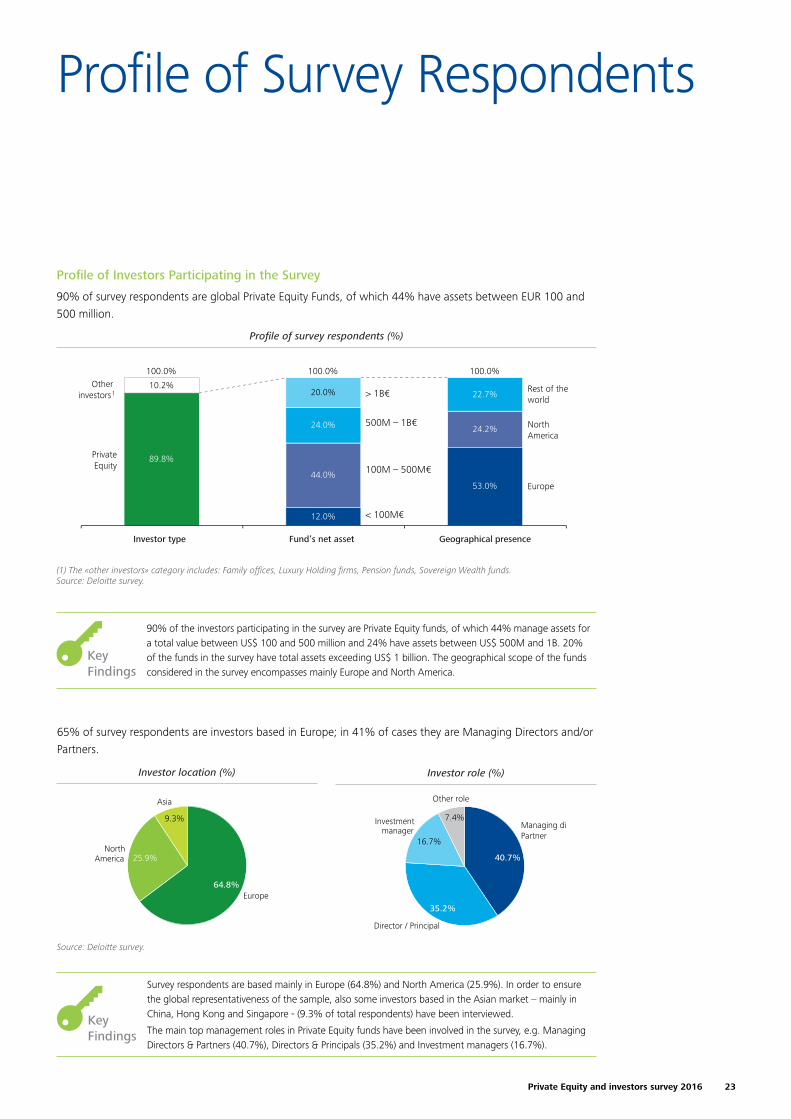
Profile of Investors Participating in the Survey
90% of survey respondents are global Private Equity Funds, of which 44% have assets between EUR 100 and
500 million.
65% of survey respondents are investors based in Europe; in 41% of cases they are Managing Directors and/or
Partners.
(1) The «other investors» category includes: Family offices, Luxury Holding firms, Pension funds, Sovereign Wealth funds.Source: Deloitte survey.
Source: Deloitte survey.
Profile of survey respondents (%)
Investor location (%) Investor role (%)
90% of the investors participating in the survey are Private Equity funds, of which 44% manage assets for a total value between US$ 100 and 500 million and 24% have assets between US$ 500M and 1B. 20% of the funds in the survey have total assets exceeding US$ 1 billion. The geographical scope of the funds considered in the survey encompasses mainly Europe and North America.
Survey respondents are based mainly in Europe (64.8%) and North America (25.9%). In order to ensure the global representativeness of the sample, also some investors based in the Asian market – mainly in China, Hong Kong and Singapore - (9.3% of total respondents) have been interviewed.
The main top management roles in Private Equity funds have been involved in the survey, e.g. Managing Directors & Partners (40.7%), Directors & Principals (35.2%) and Investment managers (16.7%).
53.0%
24.2%
22.7%
12.0%
44.0%
24.0%
20.0%
89.8%
10.2%
100.0%
North America
Other investors1
Fund’s net asset
PrivateEquity
Rest of the world
Investor type Geographical presence
100.0% 100.0%
Europe
> 1B€
500M – 1B€
100M – 500M€
< 100M€
25.9%
64.8%
North America
Asia
9.3%
Europe
7.4%
Other role
40.7%
35.2%
Director / Principal
Managing director / Partner
16.7%
Investment manager
25.9%
64.8%
North America
Asia
9.3%
Europe
7.4%
Other role
40.7%
35.2%
Director / Principal
Managing director / Partner
16.7%
Investment manager
Key Findings
Key Findings
24
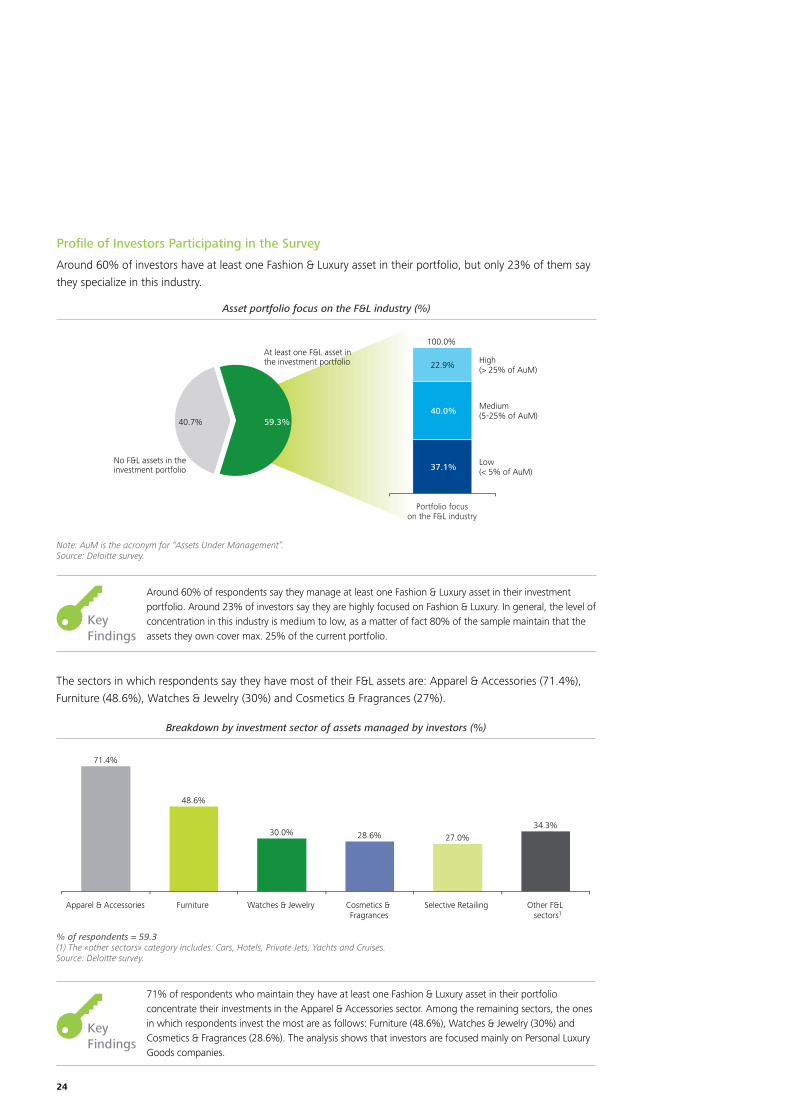
Profile of Investors Participating in the Survey
Around 60% of investors have at least one Fashion & Luxury asset in their portfolio, but only 23% of them say
they specialize in this industry.
The sectors in which respondents say they have most of their F&L assets are: Apparel & Accessories (71.4%),
Furniture (48.6%), Watches & Jewelry (30%) and Cosmetics & Fragrances (27%).
Note: AuM is the acronym for “Assets Under Management”. Source: Deloitte survey.
% of respondents = 59.3(1) The «other sectors» category includes: Cars, Hotels, Private Jets, Yachts and Cruises.Source: Deloitte survey.
Asset portfolio focus on the F&L industry (%)
Breakdown by investment sector of assets managed by investors (%)
Around 60% of respondents say they manage at least one Fashion & Luxury asset in their investment portfolio. Around 23% of investors say they are highly focused on Fashion & Luxury. In general, the level of concentration in this industry is medium to low, as a matter of fact 80% of the sample maintain that the assets they own cover max. 25% of the current portfolio.
71% of respondents who maintain they have at least one Fashion & Luxury asset in their portfolio concentrate their investments in the Apparel & Accessories sector. Among the remaining sectors, the ones in which respondents invest the most are as follows: Furniture (48.6%), Watches & Jewelry (30%) and Cosmetics & Fragrances (28.6%). The analysis shows that investors are focused mainly on Personal Luxury Goods companies.
22.9%
40.0%
100.0%
37.1%
Medium (5-25% of AuM)
Low (< 5% of AuM)
High (> 25% of AuM)
Portfolio focuson the F&L industry
59.3%
40.7%
At least one F&L asset in the investment portfolio
No F&L assets in theinvestment portfolio
Furniture
48.6%
34.3% 27.0%
Cosmetics & Fragrances
Other F&L sectors1
28.6%
Watches & Jewelry
30.0%
Apparel & Accessories
71.4%
Selective Retailing
Key Findings
Key Findings

Private Equity and investors survey 2016 25
Investors maintain that in ~72% of cases the Fashion & Luxury assets in their portfolio have sales below US$
100M, whereas 20% of them own medium-sized assets (companies with sales between US$ 100 and 250M).
% of respondents = 59.3Source: Deloitte survey.
Average turnover of Fashion & Luxury assets in investors’ portfolios (%)
71.4% of the assets in the current portfolio of investors have a turnover below US$ 100 million
Only 20% of the considered sample invests in medium-sized companies, whereas only 8% has stakes in large-sized organizations.
100.00% 2.86%
251-500M$
51-100M$
25-50M$
28.57%
<25M$
20.00%
Total F&L Investors
>500 M$
5.71%
101-250M$
20.00%
22.86%
71.4%
Key Findings

26
2016 Market Outlook
Features of the Current F&L Portfolio
Around 60% of investors say they own one Fashion & Luxury asset characterized by a majority stake and an
average duration below 5 years.
The development of distribution channels, internationalization, and performance improvement are the main
strategies adopted by investors to promote the growth of their Fashion & Luxury assets.
Source: Deloitte survey.
% of respondents = 59.3Source: Deloitte survey.
Equity stake and average duration of Fashion & Luxury assets (%)
Adoption of main key strategic drivers (%)
71.4% of respondents maintain they have a majority stake in the Fashion & Luxury companies present in their investment portfolio; this figure is in line with data referring to deals finalized in 2015 (77%).
In most cases (68.6%), the average duration of Fashion & Luxury assets present in the current portfolio of investors is below 5 years.
In 2015, the main strategies used to create economic value from the assets owned were:• «Development of new distribution channels» - 60% • «Penetration of new geographical markets» - 51%• «Improvement of operational performance through actions to increase efficiency» - 37%• «Development of new products» - 29%
Key Findings
71.4% 28.6%
Majority
Minority
> 5 years
< 5 years
68.6% 31.4%
100.0%
59.3%
40.7%
At least one F&L asset in the investment portfolio
No F&L assets in the investment portfolio
Investors with F&L assets in their portfolio
Mai
n dr
iver
s
11.4%
14.3%
20.0%
22.9%
22.9%
28.6%
37.1%
51.4%
60.0%
Value chain vertical expansion
Financial restructuringand/or leverage
Brand lineExtension
Internationalization strategy
Creation of a new distribution channel
Change inmanagement
New Product Development
Performance improvement
Brandre-positioning
Key Findings

Private Equity and investors survey 2016 27
Exit Strategy for 2016
In 2016, 44% of investors foresee at least one exit from their F&L portfolio in 2016, mainly driven by the
opportunity to achieve high returns on the investment made.
% of respondents = 58(1) The «other strategies» category includes: Change in investment strategy and Mismatch of Market Trends versus the investment thesis scenario.Source: Deloitte survey.
Exit drivers (%) Exit strategy (%) Expected multiple (%)
44% of investors maintain they intend to sell some of the Fashion & Luxury assets currently in their portfolio during 2016. Moreover, the respondents say that the possibility of maximizing the return on their investment (according to 52.6% of the sample) – as a matter of fact, 73% of investors expect to achieve EBITDA multiples above 10x – and the completion of the investment cycle (26.3%) will be the main incentives to exit in 2016. Trade sales (54.2%) and secondary buy-outs (37.5%) are likely to be the most popular exit strategies.
Key Findings
52.6%
26.3%
21.1%
44.1%
55.9%
High returns opportunity
Exit driver
Other strategies1
No exit in 2016
100.0% 100.0%
At least oneexit in 2016
Closing investment period
Divestmentsin 2016
Divestmentsin 2016
Divestmentsin 2016
54.2%
37.5%
8.3%
44.1%
55.9% Secondary buyout
100.0% 100.0%
IPO
Exit strategy
Trade sale
26.7%
73.3%
44.1%
55.9%> 10x
100.0% 100.0%
ExpectedEBITDA multiple
< 10x

28
2016 Fashion & Luxury Market Outlook by Sector
53% of respondents forecast an increase of over 5% in the Fashion & Luxury market in 2016. The best growth
expectations are observed in the Cosmetics & Fragrances and Furniture sectors.
Investors with assets in the F&L industry anticipate better results in the Apparel & Accessories, Cosmetic &
Fragrances and Cars sectors.
% of respondents = 100Source: Deloitte survey.
Note: The positive sentiment delta represents the difference expressed as a percentage between investors operating, and those not operating, in the F&L industry who expect a market growth.Fonte: Deloitte Survey.
Expected market trends in 2016 - breakdown by sector (%)
Expected market trends in 2016 - breakdown by sector (%)
53% of all respondents forecast a growth in the Fashion & Luxury market during 2016; 15% of them (i.e. 8% of all respondents) predict the increase will exceed 10%.
According to over 50% of respondents, the Cosmetics & Fragrances, Furniture, Apparel & Accessories, Cars and Hotels sectors will grow by over 5%, whereas around 10% of them forecast a double-digit trend.
Some difficulties are expected in the Yachts and Private Jets sectors, in which according to 25% of respondents a negative trend will develop over the next year.
Key Findings
16% 21% 22% 25% 21%
37%38%
27%
33%39% 43% 32%
39%45%
38%38%
49%42%
55%
40%45%
48%49%
29%23% 36%
45%
10% 14% 9% 11% 10%
9%9%
100%
Cruises
5% 100%
7%
Furniture
7%
Hotels
100% 100%
Private Jets
100% 100%
Cosmetics & Fragrances
Yachts
100%
Cars
2% 6%
7%
100%
Watches & Jewelry
100% 100%
4%
4%
Apparel & Accessories
4%
Total F&L market
100%
8%
Selective Retailing
Strong increase (>10%) Increase (5-10%)
Decrease (<0%)
Stable (0-5%)
Positive sentiment
59% 46% 69% 46% 54% 60% 39% 30% 53%41% 50%
17% 27% 23%11%
29%40%
17%
38%32% 48% 39%
36% 50%43%
52%
47%
69%
41%48%
40%39%
32%23%
38%46%
14%11%12%13%
35%
11%14%13%
100% 4% 7%
100% 100% 5% 5%
100% 100% 8%
100% 100% 100% 4%
100% 100% 3%
100%
8% 6%
35% 26% 28% 28%50%
20%
40%26%
47% 37%21%
42%39% 33%
40%
45% 35% 35% 37% 42% 58%
63%
26%22% 33%
44%
10% 15% 11% 11% 11% 16% 11%
16%10%
Total F&Lmarket
Cruises
8%
Yachts
8% 100% 100%
6% 100%
Private Jets
100% 100% 100%
5% 5%
Cosmetics& Fragrances
Cars Hotels Furniture
100% 100%
SelectiveRetailing
100%
Watches& Jewelry
5% 100% 100%
Apparel &Accessories
Investors withassets in theFashion &Luxury industry
Investors notoperating in theFashion &Luxury industry
+15% Delta positive sentiment +2% +33% -4% +3% -14% -24% -5% -6% +4% +1%
Stable (0-5%) Strong increase (>10%) Increase (5-10%) Decrease (<0%)

Private Equity and investors survey 2016 29
2016 Fashion & Luxury Market Outlook by Geographical Area
Asia, the Middle East and North America will be the main growth markets in 2016, driving the performance of
the entire industry; the trend is expected to remain mainly stable in Europe.
Investors with assets in the F&L industry anticipate better results in Europe and Latin America.
% of respondents = 100Source: Deloitte survey.
Note: The positive sentiment delta represents the difference expressed as a percentage between investors operating, and those not operating, in the F&L industry who expect a market growth.Fonte: Deloitte Survey.
Expected market trends in 2016 - breakdown by geographical area (%)
Expected market trends in 2016 - breakdown by geographical area (%)
The geographical areas that are expected to experience the strongest growth in 2016 are Asia, the Middle-East and North America: over 60% of respondents expect that growth will exceed 5% in these areas. The best performances are expected in the Asian market, where 30% of investors predict a double-digit growth. The respondents do not seem to agree on Japan: 28% of them predict a positive trend for 2016 and 24% expect a contraction of the market.
The majority of respondents expect the trend to remain stable in Europe over the next year.
Key Findings
23% 24%15% 16%
51%
36%
33%47%
11%20% 47% 38%
33%
52%
37%24%
45%44%
47%45%
12%30%
20%8%
9%14%
Middle East
Global F&L market
100% 100%
Rest of
the World
3%
3%
100%
Asia
100%
North America
Japan
2%
100% 100%
Latin America
100%
4% 7%
Europe
100%
Increase (5-10%)
Decrease (<0%)
Strong increase (>10%)
Stable (0-5%)
Positive sentiment
35% 64% 44% 28% 75% 50% 53% 64%
+33% Delta Positive sentiment
22%10%
39%
34%
36%
52%
14%29% 52% 35%
45%
52%36%
22%
52%36%
43% 46%
14% 12%24% 25%
11%11%16%13%
100% 100% 100% 100% 100% 100% 7% 4% 4%
100% 3%
100%
33% 28% 22% 24%
70%
38%
28% 39%
40% 40%
15%
52%
39% 28%
33%
59%
53% 44%
15%
12%
39%
10% 8% 100%
8%
100%
Rest ofthe World
7%
Middle East
100%
Europe Asia
100% 100% 100%
6%
Japan North America
100%
6%
6%
Latin America
100%
+4% +9% -8% +4% -10% -6% +1%
Total F&Lmarket
Stable (0-5%)Strong increase (>10%) Increase (5-10%) Decrease (<0%)
Investors withassets in theFashion &Luxury industry
Investors notoperating in theFashion &Luxury industry

30
2016 Investment Strategy
Expected Investments in F&L in 2016
In 2016, 76% of investors plan to carry out new transactions in the Fashion & Luxury industry. Personal Luxury
Goods will remain the most attractive target thanks to higher growth performance and margins than the rest
of the industry.
Propensity to invest in the various F&L sectors tends to be similar among investors with or without assets in the
F&L industry.
% of respondents = 98(1) The «other F&L sectors» category includes: Cars, Hotels, Private Jets, Yachts and Cruises.Source: Deloitte survey.
(1) The «other sectors» category includes: Cars, Hotels, Private Jets, Yachts and Cruises.Source: Deloitte survey.
Propensity to invest in Fashion & Luxury assets in 2016 and main target sectors (%)
Propensity to invest in Fashion & Luxury assets in 2016 and main target sectors (%)
The respondents who plan to invest in the Fashion & Luxury industry (76% of all respondents) will focus on the Apparel & Accessories sector (75% of respondents).
Investors show strong interest also in the Cosmetics & Fragrances sector, where around 50% of the sample plans to finalize at least one deal. The main sectors expected to attract investments over the next year include Furniture, Selective Retailing and Watches & Jewelry; the latter draws a large number of investors from different industries (other than F&L) who are attracted by the increase in sales and operating margins characterizing this sector. General propensity to invest in Personal Luxury Goods companies.
Key Findings
75.9%
24.1%
Apparel & Accessories
75.0%
Watches & Jewelry
20.5%
Other F&Lsectors 1
Furniture
38.6%
Cosmetics & Fragrances
34.1%
47.7%
Selective Retailing
25.0%
Current investorin F&L
New investorin F&L
69.7%
30.3%
71.4%
28.6%
64.7%
35.3%
66.7%
33.3%
44.4%
55.6%
54.5%
45.5%
At least one F&L asset in the investment portfolio
No F&L assets in theinvestment portfolio
76.7%
33.3%
13.3% 20.0%
50.0% 36.7%
Other F&L sectors 1Furniture Selective Retailing
Cosmetics & Fragrances
Apparel & Accessories
Watches & Jewelry
71.4%
35.7% 35.7% 35.7% 42.9% 42.9%
Other F&L sectors 1 Furniture Selective Retailing
Cosmetics & Fragrances
Apparel & Accessories
Watches & Jewelry
Investors withassets in theFashion &Luxury industry
Investors notoperating in theFashion &Luxury industry

Private Equity and investors survey 2016 31
Size of Potential Investments in F&L
Investments in the Apparel & Accessories sector will target large-sized organizations in 27% of cases, whereas
deals in the other sectors will focus mainly on mid-market companies.
Deal Characteristics: Deal Type and Equity Stake
Around 60% of investors plan to carry out new transactions in the market using Expansion Capital, Leverage
Buy-out and Management Buy-out strategies to acquire a majority stake in the target company.
% of respondents = 75(1) The «other sectors» category includes: Cars, Hotels, Private Jets, Yachts and Cruises.Source: Deloitte survey.
% of respondents = 75(1) The «other strategies» category includes: Turnarounds and Start-up Financing.Source: Deloitte survey.
Average sales of potential target companies – breakdown by sector (%)
New investments – breakdown by deal type and equity stake (%)
The survey shows an investor propensity to acquire large organizations in the Apparel & Accessories sector, which will be the main target sector in 2016; more specifically, 27% of respondents plan to invest in companies with sales over US$ 100M. 80% of respondents planning to carry out M&A deals in the Cosmetics & Fragrances, Watches & Jewelry and Furniture sectors will select small to medium-sized target companies with a turnover below US$ 100M.
Over 50% of respondents plan to finalize new acquisitions in the Fashion & Luxury industry through Expansion Capital, Leverage Buyout and Management Buyout strategies.
Investors anticipate acquiring a majority stake in the target company through most of the transactions carried out.
Key Findings
Key Findings
14%
44%21%
14%29%
20% 27%
45%33%
44% 47%
53%
9%
15%29%
13%
55%
10% 11% 7% 9%
7%12% 11%
20%
41%
19%
8%
Total F&Lmarket
100%
Furniture
100%
Watches & Jewelry
100% 100%
Apparel & Accessories
6%
6% 6%
6% 6%
Cosmetics & Fragrances
2%
Other F&LSectors
1
100% 100%
Selective Retailing
100%
25 - 50M€
101 - 250M€
500 - 1B€
< 25M€
51 - 100M€
251 - 500M€
20.5%
Support to MBO/MB
LBO or Replacement
54.5% 61.4%
Expansion capital
63.2%
18.2%
Other strategies 1
Corporate carve-out
Minority stake
Majority stake
37.0%
63.0%
18.5%
81.5%
16.7%
83.3%
33.3%
66.7%
8.3%
91.7%

32
Deal Characteristics: Financing Strategy
67.5% of respondents say they will buy a stake greater than 40%, using mainly senior debt to fund the
transaction.
% of respondents = 100(1) The «other types» category includes: Junior Debt, Unitranche and Equity.Source: Deloitte survey.
Equity stake to be acquired in the new asset (%) Funding sources (%)
~67% of transactions will result in the acquisition of a stake of more than 40% in the target company.
Senior debt will be the main funding source for acquisition deals in the Fashion & Luxury industry.
The other main funding sources mentioned by investors include Shareholders’ loans (43%), Vendor’s notes or convertible bonds (27%) and Mezzanine Financing (23%).
Key Findings
Vendor’s notes or convertible
bonds
Mezzanine financing
23%
80%
Other types 1 Shareholders’loan
43%
9%
Senior debt
27%
Total
100.0%
> 60%
23.3%
21 - 40% 41 - 60% 0 - 20%
18.6%
14.0%
44.2%
Private Equity and investors survey 2016 33
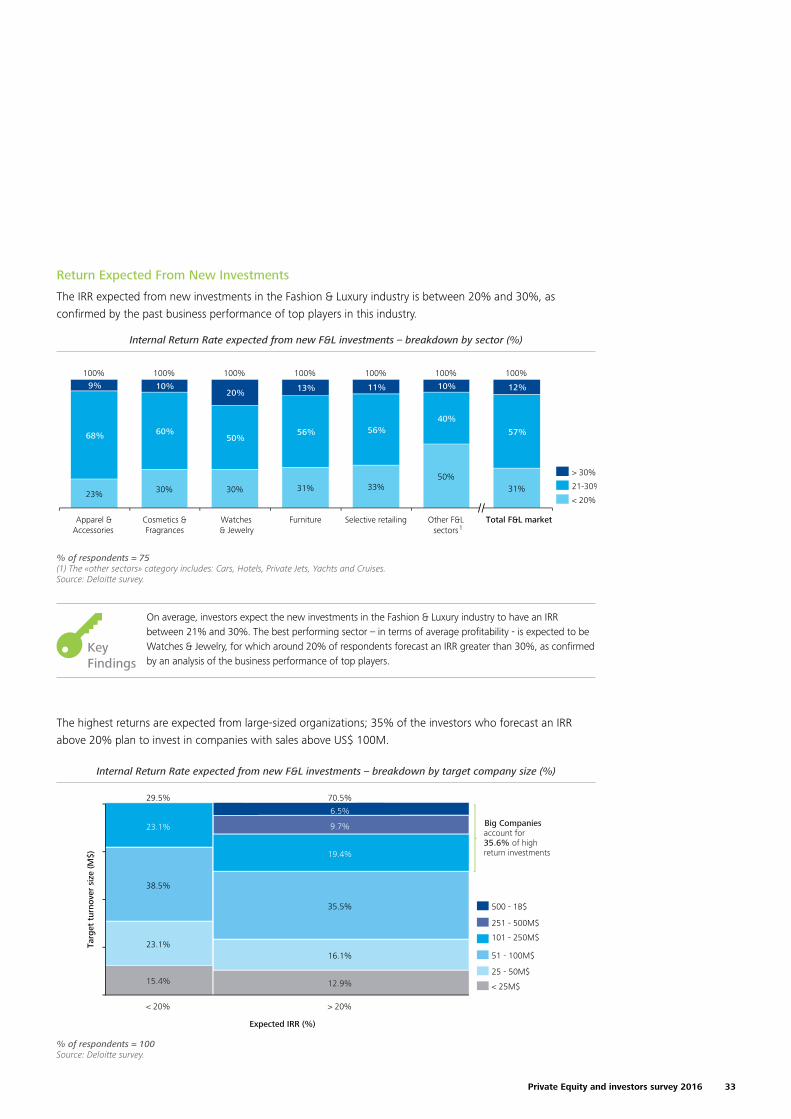
Return Expected From New Investments
The IRR expected from new investments in the Fashion & Luxury industry is between 20% and 30%, as
confirmed by the past business performance of top players in this industry.
The highest returns are expected from large-sized organizations; 35% of the investors who forecast an IRR
above 20% plan to invest in companies with sales above US$ 100M.
% of respondents = 75(1) The «other sectors» category includes: Cars, Hotels, Private Jets, Yachts and Cruises.Source: Deloitte survey.
% of respondents = 100Source: Deloitte survey.
Internal Return Rate expected from new F&L investments – breakdown by sector (%)
Internal Return Rate expected from new F&L investments – breakdown by target company size (%)
On average, investors expect the new investments in the Fashion & Luxury industry to have an IRR between 21% and 30%. The best performing sector – in terms of average profitability - is expected to be Watches & Jewelry, for which around 20% of respondents forecast an IRR greater than 30%, as confirmed by an analysis of the business performance of top players.
Key Findings
23% 30% 30% 31% 33%50%
68% 60%50%
56% 56%40%
9% 10%20% 13% 11% 10%
31%
57%
12%
100%
Total F&L market Other F&Lsectors
1
100%
Selective retailing
100% 100%
Furniture Apparel & Accessories
Watches & Jewelry
Cosmetics & Fragrances
100% 100% 100%
> 30%
< 20%
21-30%
< 20%
12.9%
35.5%
Expected IRR (%)
70.5%
16.1%
19.4%
> 20%
6.5%
Targ
et t
urno
ver
size
(M$)
9.7%
29.5%
15.4%
23.1%
38.5%
23.1% Big Companies account for35.6% of highreturn investments
51 - 100M$
< 25M$
251 - 500M$
500 - 1B$
25 - 50M$
101 - 250M$

34
About Deloitte and its Fashion & Luxury Practice
Deloitte EMEA Fashion & Luxury Center of Excellence
A Network of 65 cross-functional Subject Matter
Experts (SME) with competence in the Fashion &
Luxury industry able to suit diverse client needs.
Countries involved
France - Germany - Italy - Netherlands - Spain -
Switzerland - Turkey - United Kingdom.
Main Objective
Cross-border cooperation to leverage on specific local
expertise to deliver high level services to Fashion &
Luxury clients and targets across Europe.
Our Top Offerings
• Core business transformation & Global retail
Transformation
• CRM & Digital Transformation
• Marketing & Sales Strategy Operations
• Contract Risk and Compliance
• Risk Analytics
• Internal Controls
• Internal Audit Services
• Sustainability
• Corporate Finance Advisory
• Strategy & Business Planning
• Transaction Services
• Forensic
• Transfer prices – supply chain
• Custom duties/vat/logistic tax issues – supply chain
• Data privacy
• Personal planning for private family
Global Fashion & Luxury: Glossary
Personal Luxury Goods Personal Luxury Goods include the following
sectors: Apparel & Accessories, Cosmetics &
Fragrances and Watches & Jewelry
F&L Abbreviation for Fashion & Luxury
App&Acc Abbreviation for Apparel & Accessories
Cos&Fra Abbreviation for Cosmetics & Fragrances
Wat&Jew Abbreviation for Watches & Jewelry
PLG Acronym for Personal Luxury Goods
IRR Acronym for Internal Return Rate
PE Acronym for Private Equity
M&A Acronym for Merger & Acquisition


Il nome Deloitte si riferisce a una o più delle seguenti entità: Deloitte Touche Tohmatsu Limited, una società inglese a responsabilità limitata (“DTTL”), le member firm aderenti al suo network, e le loro entità correlate. DTTL e ciascuna delle sue member firm è un’entità giuridicamente separata e indipendente dalle altre. DTTL (descritta anche come “Deloitte Global”) non fornisce servizi ai clienti. Si invita a leggere l’informativa completa relativa alla descrizione della struttura legale di Deloitte Touche Tohmatsu Limited e delle sue member firm all’indirizzo www.deloitte.com/about.
© 2016 Deloitte Touche Tohmatsu LimitedStudio Grafico Deloitte, Italia - SG.051.16
Contacts
Deloitte Fashion & Luxury Leaders Deloitte Financial Advisory contacts
EMEA Fashion & Luxury LeaderPatrizia Arienti | [email protected]
FranceBenedicte Sabadie | [email protected]
Germany Karsten Hollasch | [email protected]
ItalyPatrizia Arienti | [email protected]
NetherlandsVictor Hoong | [email protected]
SpainJuan José Peso | [email protected] Lopez Tellez | [email protected]
SwitzerlandKarine Szegedi | [email protected]
TurkeyHakan Gol | [email protected]
UKNick Pope | [email protected]
ChinaIvan Man Kit Wong | [email protected] Fantacci | [email protected]
FranceClaire Deguerry | [email protected]
Germany Karsten Hollasch | [email protected]
ItalyElio Milantoni | [email protected] Nastasi | [email protected]
SpainRoberto Martinez Roldan | [email protected]
SwitzerlandHoward Da Silva | [email protected] Gehre | [email protected] UKRichard Lloyd-Owen | [email protected] Pacitti | [email protected]
USLorin DeMordaunt | [email protected]
SingaporeJiak See Ng | [email protected] Snyder | [email protected]