global economics | insights & views
TRANSCRIPT

1
June 14, 2018
GLOBAL ECONOMICS
| INSIGHTS & VIEWS
Visit our web site at scotiabank.com/economics or contact us by email at [email protected]
CONTACTS
Brett House, VP & Deputy Chief Economist
416.863.7463
Scotiabank Economics
Juan Manuel Herrera
416.866.6781
Scotiabank Economics
René Lalonde
416.862.3174
Scotiabank Economics
Nikita Perevalov
416.866.4205
Scotiabank Economics
NAFTA: Steeling Ourselves for the Macro Costs of
Tariffs—June Update
In light of the recent imposition of US tariffs on steel and aluminum, and
possible future US duties on autos and parts, we update our previous
model scenarios on the potential impact on North America of varying
degrees of US protectionism and retaliatory responses. The
macroeconomic implications of these tariffs are expected to be limited,
but their longer-term impact could be more substantial.
As we have previously noted, even a move to end NAFTA and revert to
MFN tariffs between the US, Canada, and Mexico would be unlikely to
trigger overall recessions in any of the three economies because the
differences between average MFN tariffs and NAFTA duties are now
much smaller than at NAFTA’s inception in 1994. Specific sectors and
communities could, however, see more significant harm.
Further moves by the US to initiate a global trade war would,
unsurprisingly, be expected to tip all three countries into recessions.
Central banks would respond with lower policy rates.
I. US TARIFFS: WHAT THEY MEAN AND WHAT THEY DON’T
The White House announced on May 31 that it would lift the temporary
exemption from tariffs on steel and aluminum products that it had provided
for two months on imports from Canada and Mexico, amongst other
sources. Although US officials nominally justify the tariffs on so-called ‘national
security’ grounds, their imposition is clearly intended to pressure both countries
into acceding to US demands for substantial changes to the North American Free
Trade Agreement (NAFTA).
Canada and Mexico have laid out plans to retaliate to the US tariffs by
imposing their own duties on steel, aluminum, and other final consumer
products selected to inflict pain on sensitive US regions while avoiding
barriers on intermediate goods that would add costs to their own industries.
Mexico began imposing tariffs on its targeted US products on June 1. Canada has
published a list of US products that could face tariffs from July 1.
The first-round macroeconomic impact of these reciprocal tariffs between
the NAFTA countries should be limited even if the stress imposed on
specific firms and communities could be acute. Steel and aluminum products
account for relatively small shares of each country’s total output: 0.5% of
Canada’s GDP and 0.7% of Mexican GDP. More importantly, the tariffs should not
have an immediate, significant impact on the volume of US steel imports and the
duties are likely to be short-lived.
It will be difficult for US industry to find immediate domestic substitutes for
most of its steel and aluminum imports from Canada and Mexico. First, it isn’t
clear that there is much slack in the US steel industry that could be quickly moved
back into operation. US steel has run at an average capacity utilization rate of
Chart 1
0
10
20
30
40
50
60
70
0
10
20
30
40
50
60
70
02 04 06 08 10 12 14 16 18
The US Relies on Aluminum Imports,Mainly from Canada
% of total volume
imports from Canada (LHS)
Sources: Scotiabank Economics, US Census Bureau, USGS.
% of domestic consumption
imports from other (LHS)
imports from Russia
(LHS)
net import reliance(RHS)

2
June 14, 2018
GLOBAL ECONOMICS
| INSIGHTS & VIEWS
Visit our web site at scotiabank.com/economics or contact us by email at [email protected]
about 75% since 2011 compared with 85% prior to 2008. Although narrowly specialized mini-mills could respond flexibly and
increase production to replace some specific imports, most of the slump in capacity utilization post-2008 has been in heavy
smelting. Idle blast furnaces take a long time and significant investment to put back in operation.
The US is even more dependent on aluminum imports: about 60% of US aluminum consumption is covered by imported
goods and more than 40% of all US aluminum imports come from Canada (chart 1). Although capacity utilization has been
flat at around two-thirds of potential output since mid-2016, compared with an average of 75% during 2011–15, the current tariffs
are unlikely to reverse this decline: instead, relatively high energy costs should keep some parts of the sector uneconomic.
US steelmakers and aluminum producers are unlikely to make a large investment in reviving or building capacity because
the US tariffs will likely be transitory. For perspective, it’s worth remembering that the George W. Bush Administration imposed
tariffs on steel imports in 2002, but they were lifted after 20 months following international pushback and mounting evidence that any
benefits to US steel producers were outweighed by losses in downstream US sectors. Some industry estimates found that the 2002
steel duties destroyed around 200,000 jobs across the US economy, more than the 180,000 or so people then-employed directly in
the steel industry. Domestic and foreign opposition to the present tariffs is more concerted than 16 years ago: even the United
Steelworkers union opposes them. The present tariffs could inflict even greater pain on US industry and consumers than during
2002–03 since North American supply chains are now more tightly integrated, which should hasten domestic lobbying to undo them.
Additionally, the current duties have even less chance of being found WTO-compliant than their 2002 counterparts.
All told, the US steel and aluminum tariffs are unlikely to reduce import volumes significantly, which implies that the pain
inflicted by these duties should fall squarely on US manufacturers and consumers. Over 19,000 applications for exemptions
from the tariffs have been filed by downstream firms in the US. Prices for raw steel and raw aluminum have climbed by 37% and
13%, respectively, so far in 2018. This price increase has begun to make its way through to rising costs for manufacturing inputs
from the steel and aluminum products industry. Not all of these price hikes have been driven by the tariffs—strong manufacturing
and construction activity have also increased demand. But pre-emptive stockpiling ahead of the tariffs’ imposition has also made
their price-impact worse.
The other consumer and food products that have been hit by Mexican tariffs or could be subjected to Canadian duties
represent only small slices of trade and output in each of the three NAFTA nations. While these tariffs would pressure
specific firms, sectors, and communities, they shouldn’t induce large changes in major macro indicators.
Threatened US tariffs on auto imports could have a more substantial impact on all three economies—and touch off a
wider trade war—although our baseline remains that they are unlikely to be imposed. The US Department of Commerce
initiated an investigation of the national security implications of automobiles and parts on May 30 under the same Section 232 of
the 1962 Trade Expansion Act that sanctions the new steel and aluminum tariffs. Compared with steel and aluminum, auto
manufacturing accounts for a larger share of value-added in each NAFTA country (i.e., 0.9% US GDP, 1.1% Canadian GDP, 3.3%
Mexican GDP) and drives more jobs in related and downstream industries. The normal Section 232 process implies that the White
House is unlikely to be in a position to impose ‘national-security’ duties on autos before spring-2019, although the US Commerce
Department has scheduled an initial hearing on the tariffs for 19–20 July that could presage an expedited process to bring in duties
later this year.
The greater longer-term danger of these tit-for-tat tariffs is that they could harden the NAFTA countries’ negotiating
stances and stretch talks beyond the next year or two. Although both domestic and foreign direct investment numbers in
Canada and Mexico remain strong, long-running doubts about NAFTA’s future could dent business investment intentions in both
countries.
This report models the potential costs of these tariffs for the US, Canada, and Mexico in four scenarios under which trade
restrictions could continue to intensify across North America and in US commercial relations with the rest of the world.
The report updates two previous papers that employed Scotiabank’s Global Macroeconomic Model (SGMM) to quantify the
macroeconomic implications of scenarios ranging from a breakdown in NAFTA to an all-out global trade war initiated by the US.
In this paper, we make a preliminary update to our last baseline forecasts that were published May 3, 2018, and we
project the likely impact of the announced steel, aluminum, and retaliatory tariffs on other products. We then model the
following trade scenarios:
3
June 14, 2018
GLOBAL ECONOMICS
| INSIGHTS & VIEWS
Visit our web site at scotiabank.com/economics or contact us by email at [email protected]
1. NAFTA talks break down and trade reverts to most-favoured nation (MFN) tariff terms between the US, Canada, and
Mexico;
2. NAFTA negotiations continue into 2019 and the US adds 25% tariffs on motor vehicles and parts in mid-2019 to the
existing steel and aluminum tariffs;
3. The US initiates a global trade war by imposing average tariffs of 20% on all imports while talks on NAFTA continue;
and
4. The US moves to a global trade war and withdraws from NAFTA.
II. UPDATED BASELINE FORECASTS EXCLUSIVE OF TARIFFS: CHILLING EFFECT ON INVESTMENT CONTINUES
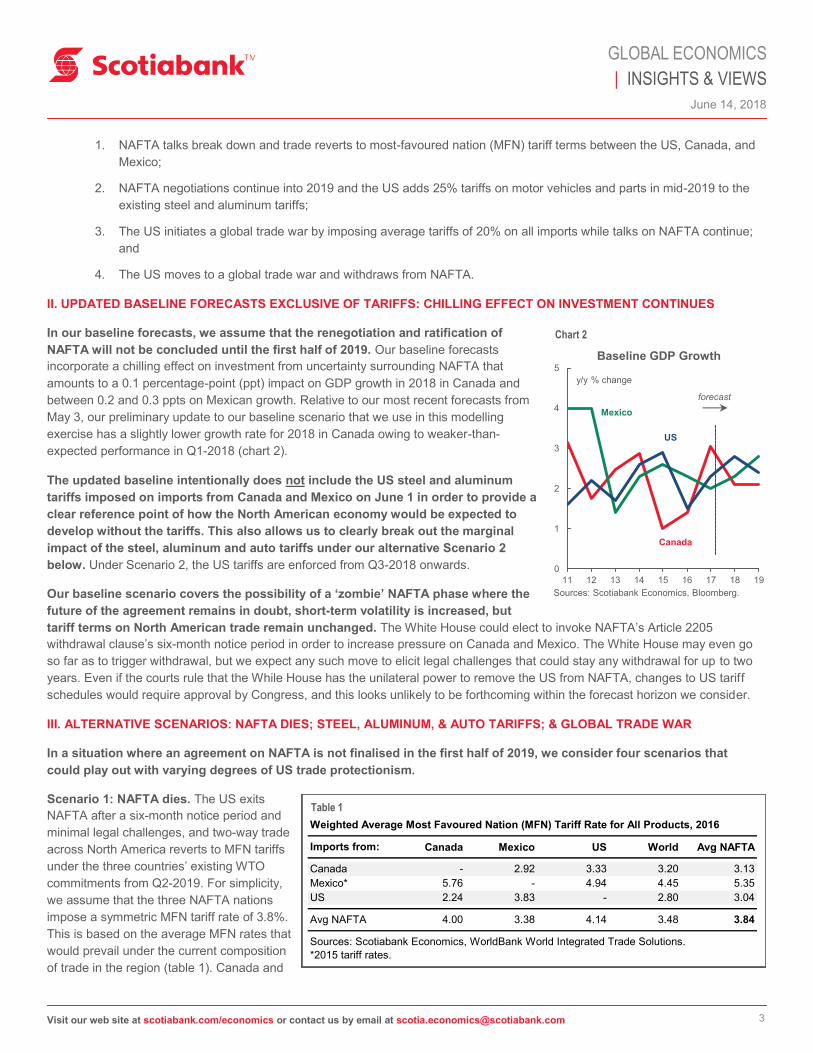
In our baseline forecasts, we assume that the renegotiation and ratification of
NAFTA will not be concluded until the first half of 2019. Our baseline forecasts
incorporate a chilling effect on investment from uncertainty surrounding NAFTA that
amounts to a 0.1 percentage-point (ppt) impact on GDP growth in 2018 in Canada and
between 0.2 and 0.3 ppts on Mexican growth. Relative to our most recent forecasts from
May 3, our preliminary update to our baseline scenario that we use in this modelling
exercise has a slightly lower growth rate for 2018 in Canada owing to weaker-than-
expected performance in Q1-2018 (chart 2).
The updated baseline intentionally does not include the US steel and aluminum
tariffs imposed on imports from Canada and Mexico on June 1 in order to provide a
clear reference point of how the North American economy would be expected to
develop without the tariffs. This also allows us to clearly break out the marginal
impact of the steel, aluminum and auto tariffs under our alternative Scenario 2
below. Under Scenario 2, the US tariffs are enforced from Q3-2018 onwards.
Our baseline scenario covers the possibility of a ‘zombie’ NAFTA phase where the
future of the agreement remains in doubt, short-term volatility is increased, but
tariff terms on North American trade remain unchanged. The White House could elect to invoke NAFTA’s Article 2205
withdrawal clause’s six-month notice period in order to increase pressure on Canada and Mexico. The White House may even go
so far as to trigger withdrawal, but we expect any such move to elicit legal challenges that could stay any withdrawal for up to two
years. Even if the courts rule that the While House has the unilateral power to remove the US from NAFTA, changes to US tariff
schedules would require approval by Congress, and this looks unlikely to be forthcoming within the forecast horizon we consider.
III. ALTERNATIVE SCENARIOS: NAFTA DIES; STEEL, ALUMINUM, & AUTO TARIFFS; & GLOBAL TRADE WAR
In a situation where an agreement on NAFTA is not finalised in the first half of 2019, we consider four scenarios that
could play out with varying degrees of US trade protectionism.
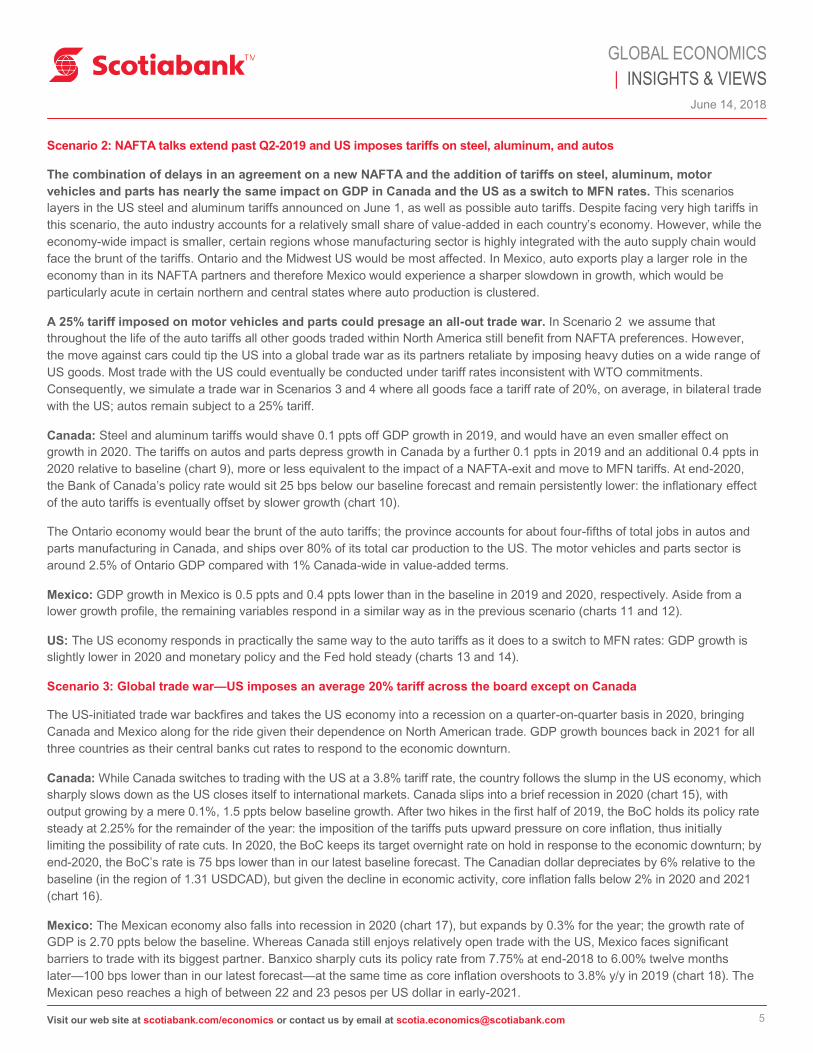
Scenario 1: NAFTA dies. The US exits
NAFTA after a six-month notice period and
minimal legal challenges, and two-way trade
across North America reverts to MFN tariffs
under the three countries’ existing WTO
commitments from Q2-2019. For simplicity,
we assume that the three NAFTA nations
impose a symmetric MFN tariff rate of 3.8%.
This is based on the average MFN rates that
would prevail under the current composition
of trade in the region (table 1). Canada and
Weighted Average Most Favoured Nation (MFN) Tariff Rate for All Products, 2016
Imports from: Canada Mexico US World Avg NAFTA
Canada - 2.92 3.33 3.20 3.13
Mexico* 5.76 - 4.94 4.45 5.35
US 2.24 3.83 - 2.80 3.04
Avg NAFTA 4.00 3.38 4.14 3.48 3.84
*2015 tariff rates.
Sources: Scotiabank Economics, WorldBank World Integrated Trade Solutions.
Table 1
0
1
2
3
4
5
11 12 13 14 15 16 17 18 19
Baseline GDP Growth
y/y % change
Sources: Scotiabank Economics, Bloomberg.
Mexico
US
Canada
forecast
Chart 2

4
June 14, 2018
GLOBAL ECONOMICS
| INSIGHTS & VIEWS
Visit our web site at scotiabank.com/economics or contact us by email at [email protected]
Mexico would, however, likely retain NAFTA as the governing structure for their bilateral trade and investment flows in the hope
that the US may one day return to the pact.
Scenario 2: NAFTA talks extend past Q2-2019 and the US imposes tariffs on steel, aluminum, and autos. The existing steel,
aluminum, and other consumer good tariffs are introduced in Q3-2018. Contrary to our baseline assumption that a revised NAFTA
is agreed upon in the first half of 2019, the US administration imposes 25% tariffs on motor vehicles and parts imports from
Canada and Mexico from Q2-2019. Both countries retaliate. Two-way trade between Canada and Mexico continues to flow under
NAFTA rules. Outside of steel, aluminum, autos, parts, and related retaliatory tariffs, other trade with the US is maintained under
NAFTA’s terms as talks continue. The tariffs on autos, however, could be the first major step in a US-initiated trade war: they
would be met by wide-ranging responses by the US’s trade partners.
Scenario 3: Global trade war—US imposes an average 20% tariff across the board except on Canada. NAFTA is abolished
in line with a pronounced push towards universal protectionism by the US. With the exception of Canadian goods (owing to
integrated supply chains), the US imposes tariffs of 20% on average on all imports from all of its trading partners; these partners
reciprocate by setting tariffs on all US products at the same 20% average rate. The US simply ‘tweaks’ its trade relationship with
Canada in line with the White House’s comments last year: the two countries impose reciprocal 3.8% MFN tariffs on each other.
Similarly, Canada and Mexico fall back to reciprocal 3.8% MFN tariffs on their bilateral trade as any hope of restoring NAFTA
evaporates..
Scenario 4: Global trade war—US imposes an average 20% tariff across the board with no exception for Canada. Canada
is subjected to the same 20% US tariffs as other countries, and Canada responds in kind.
IV. SIMULATION RESULTS: NAFTA EXIT AND US TARIFFS DAMPEN GROWTH, TRADE WAR PUSHES NORTH AMERICA
INTO RECESSION
This section presents the results of our macroeconomic simulations of the scenarios outlined above.
Tariff shocks across all four scenarios tend to reach their maximum impact on output growth and inflation in 2019 or
2020, not always simultaneously, as the tariffs’ effects take several quarters to propagate through the North American
economy. For more details on the mechanisms by which the shocks transmit into the countries’ real economies, as well as the
possible responses by monetary authorities and country-specific dynamics, please see our February trade scenarios paper.
Across all four scenarios, the impact of intensified trade restrictions falls hardest on Mexico and then Canada since trade is far
more important to both economies than it is to the US (tables 2, 3 and 4, and charts 3 through 26; see appendix for peak-to-trough
results).
Scenario 1: NAFTA lapses—3.8% MFN tariffs are imposed across the board
The end of NAFTA would result in slower growth in the initial years following the cancellation of the agreement, but the
demise of the pact would not lead to a recession in any of the three members’ economies. At 3.8%, the MFN tariffs applied
on trade across the region do not have a severe impact on the flow of goods.
Canada: The switch to a 3.8% MFN rate in its trade with the US shaves 0.2 ppts off Canadian GDP growth relative to our baseline
forecast in 2019, and 0.4 ppts off growth in 2020—the point at which the impact on growth is most severe (chart 3). In this
scenario, the Bank of Canada (BoC) would have a slower hiking path, with one less rate increase by end-2020 than in our
baseline. Core inflation and the Canadian dollar remain relatively unchanged in comparison to our baseline forecast (chart 4).
Mexico: The rate shock passes through the Mexican economy at a faster pace than in Canada (chart 5). GDP growth is 0.3 ppts
lower in each of 2019 and 2020, although it bounces back in 2021 by 0.3 ppts above our baseline. The switch to the MFN tariffs
raises core inflation by 0.1 ppts over our baseline forecast in 2019 (chart 6); however, given the slump in growth, Banxico’s rate
path does not markedly change and it remains on track to reduce its policy rate three times in 2019, as in our baseline.
US: Aside from a slightly softer growth rate in 2019 and 2020 the outlook for the US in this scenario is relatively unchanged from
our baseline projection (charts 7 and 8).
5
June 14, 2018
GLOBAL ECONOMICS
| INSIGHTS & VIEWS
Visit our web site at scotiabank.com/economics or contact us by email at [email protected]
Scenario 2: NAFTA talks extend past Q2-2019 and US imposes tariffs on steel, aluminum, and autos
The combination of delays in an agreement on a new NAFTA and the addition of tariffs on steel, aluminum, motor
vehicles and parts has nearly the same impact on GDP in Canada and the US as a switch to MFN rates. This scenarios
layers in the US steel and aluminum tariffs announced on June 1, as well as possible auto tariffs. Despite facing very high tariffs in
this scenario, the auto industry accounts for a relatively small share of value-added in each country’s economy. However, while the
economy-wide impact is smaller, certain regions whose manufacturing sector is highly integrated with the auto supply chain would
face the brunt of the tariffs. Ontario and the Midwest US would be most affected. In Mexico, auto exports play a larger role in the
economy than in its NAFTA partners and therefore Mexico would experience a sharper slowdown in growth, which would be
particularly acute in certain northern and central states where auto production is clustered.
A 25% tariff imposed on motor vehicles and parts could presage an all-out trade war. In Scenario 2 we assume that
throughout the life of the auto tariffs all other goods traded within North America still benefit from NAFTA preferences. However,
the move against cars could tip the US into a global trade war as its partners retaliate by imposing heavy duties on a wide range of
US goods. Most trade with the US could eventually be conducted under tariff rates inconsistent with WTO commitments.
Consequently, we simulate a trade war in Scenarios 3 and 4 where all goods face a tariff rate of 20%, on average, in bilateral trade
with the US; autos remain subject to a 25% tariff.
Canada: Steel and aluminum tariffs would shave 0.1 ppts off GDP growth in 2019, and would have an even smaller effect on
growth in 2020. The tariffs on autos and parts depress growth in Canada by a further 0.1 ppts in 2019 and an additional 0.4 ppts in
2020 relative to baseline (chart 9), more or less equivalent to the impact of a NAFTA-exit and move to MFN tariffs. At end-2020,
the Bank of Canada’s policy rate would sit 25 bps below our baseline forecast and remain persistently lower: the inflationary effect
of the auto tariffs is eventually offset by slower growth (chart 10).
The Ontario economy would bear the brunt of the auto tariffs; the province accounts for about four-fifths of total jobs in autos and
parts manufacturing in Canada, and ships over 80% of its total car production to the US. The motor vehicles and parts sector is
around 2.5% of Ontario GDP compared with 1% Canada-wide in value-added terms.
Mexico: GDP growth in Mexico is 0.5 ppts and 0.4 ppts lower than in the baseline in 2019 and 2020, respectively. Aside from a
lower growth profile, the remaining variables respond in a similar way as in the previous scenario (charts 11 and 12).
US: The US economy responds in practically the same way to the auto tariffs as it does to a switch to MFN rates: GDP growth is
slightly lower in 2020 and monetary policy and the Fed hold steady (charts 13 and 14).
Scenario 3: Global trade war—US imposes an average 20% tariff across the board except on Canada
The US-initiated trade war backfires and takes the US economy into a recession on a quarter-on-quarter basis in 2020, bringing
Canada and Mexico along for the ride given their dependence on North American trade. GDP growth bounces back in 2021 for all
three countries as their central banks cut rates to respond to the economic downturn.
Canada: While Canada switches to trading with the US at a 3.8% tariff rate, the country follows the slump in the US economy, which
sharply slows down as the US closes itself to international markets. Canada slips into a brief recession in 2020 (chart 15), with
output growing by a mere 0.1%, 1.5 ppts below baseline growth. After two hikes in the first half of 2019, the BoC holds its policy rate
steady at 2.25% for the remainder of the year: the imposition of the tariffs puts upward pressure on core inflation, thus initially
limiting the possibility of rate cuts. In 2020, the BoC keeps its target overnight rate on hold in response to the economic downturn; by
end-2020, the BoC’s rate is 75 bps lower than in our latest baseline forecast. The Canadian dollar depreciates by 6% relative to the
baseline (in the region of 1.31 USDCAD), but given the decline in economic activity, core inflation falls below 2% in 2020 and 2021
(chart 16).
Mexico: The Mexican economy also falls into recession in 2020 (chart 17), but expands by 0.3% for the year; the growth rate of
GDP is 2.70 ppts below the baseline. Whereas Canada still enjoys relatively open trade with the US, Mexico faces significant
barriers to trade with its biggest partner. Banxico sharply cuts its policy rate from 7.75% at end-2018 to 6.00% twelve months
later—100 bps lower than in our latest forecast—at the same time as core inflation overshoots to 3.8% y/y in 2019 (chart 18). The
Mexican peso reaches a high of between 22 and 23 pesos per US dollar in early-2021.

6
June 14, 2018
GLOBAL ECONOMICS
| INSIGHTS & VIEWS
Visit our web site at scotiabank.com/economics or contact us by email at [email protected]
US: Contrary to the Scenarios 1 and 2 where the effect of tariffs on US output was limited, the imposition of across-the-board 20%
duties grinds annual economic growth to a halt at 0.2% in 2020, with an actual contraction in three quarters (chart 19), from 2019-
Q3 to 2020-Q1. The Fed keeps its policy rate steady through 2019, and cuts once in 2020, which puts the fed funds rate 100 bps
lower than our baseline in 2020. Core inflation is a shade lower than in the baseline (chart 20), with a rise in the prices of imported
goods being countered by a slowdown in economic growth.
Scenario 4: Global trade war—US imposes an average 20% tariff across the board with no exception for Canada
In an all-out trade war, the US breaks trade ties with all its partners. The economic slump is slightly deeper for the US and Mexico,
though in this case the Canadian economy contracts on an annual basis as it no longer benefits from preferential treatment in
trade with the US.
Canada: The 20% tariff on trade with the US causes an economic recession in Canada (chart 21). Output shrinks by 1.8% in
2020, which would mark the first annual GDP contraction in Canada since 2009. The BoC cuts rates sharply to 1.75% at end-
2020, 125 bps lower than in our baseline, and core inflation reaches a low of 1.7% in 2021 (chart 2). In 2021, the economy
reverses course and expands by 2.4% followed by 3.2% in 2022.
Mexico: The spillovers from the trade war between Canada and the US lower Mexican GDP growth by an additional 0.1 ppts in
2019 and 0.2 ppts in 2020 compared to the ex. Canada scenario (Scenario 3); Banxico’s rate sits 25 bps lower at end-2019. Core
inflation is practically unchanged (charts 23 and 24).
US: The US economy contracts by 0.1% in 2020, which results in a slightly lower core inflation profile relative to the previous case
(charts 25 and 26). The Federal Reserve’s rate path also matches that in Scenario 3.
V. SUMMING UP: THE COSTS OF US PROTECTIONISM
A ramp-up in protectionism in the US results in a negative impact on growth in each of the NAFTA partners’ economies. As shown
in our scenarios, the US is affected the least of the three countries under disruptions to NAFTA, but it would pay a hefty price if it
takes on extreme protectionist measures with the rest of the world.
The end of NAFTA would impose on Canada and Mexico much greater economic losses relative to the US. Still, the negative
impact on growth would not be large enough to tip any of the three economies entirely away from the expansion in our baseline
into a deep recession.
The imposition of—and retaliation to—tariffs on steel and aluminum does not markedly alter the overall growth outlook for North
America. However, if the US adds tariffs on autos and parts to pressure its NAFTA partners towards a deal, and Canada and
Mexico retaliate, certain regional economies across the continent that are highly dependent on the auto sector may be damaged
much more than the national-level projections in these scenarios imply. A US move to impose Section 232 tariffs on Canadian and
Mexican autos would almost certainly imply identical tariffs on other industrialized-countries’ auto exports, which would likely set off
a more wide-ranging international trade war.
An all-out trade war initiated by the US Administration would push the US domestic economy into recession in 2020, which would
also take the Canadian and Mexican economies into contractionary territory. The Fed, the BoC, and Banxico would all be expected
to reduce their respective policy rates to respond to the economic crisis in the region.
Overall, our model scenarios imply that disruptions in NAFTA would not benefit the US and, similarly, a more generalized trade
war would not, as some have mused, be easy to win.

7
June 14, 2018
GLOBAL ECONOMICS
| INSIGHTS & VIEWS
Visit our web site at scotiabank.com/economics or contact us by email at [email protected]
Table 2 Canada 2018 2019 2020 2021 2022
Baseline
GDP, y/y % change period avg. 2.1 2.1 1.6 1.5 1.6
Monetary policy rate, % eop 1.75 2.50 3.00 3.00 2.83
Core CPI, y/y % change avg. 2.1 2.3 2.3 2.2 2.0
USDCAD, annual average 1.27 1.23 1.25 1.23 1.22
Scenario 1: 3.8% tariff
GDP, y/y % change period avg. 2.1 1.9 1.2 1.4 1.8
Monetary policy rate, % eop 1.75 2.47 2.83 2.80 2.73
Core CPI, y/y % change avg. 2.1 2.3 2.2 2.1 2.0
USDCAD, annual average 1.27 1.24 1.27 1.25 1.22
Scenario 2: Tariffs on Autos, Steel and Aluminium
GDP, y/y % change period avg. 2.1 1.9 1.2 1.4 1.8
Monetary policy rate, % eop 1.75 2.44 2.80 2.79 2.72
Core CPI, y/y % change avg. 2.1 2.3 2.2 2.1 2.0
USDCAD, annual average 1.27 1.24 1.27 1.25 1.22
Scenario 3: 20% US global (ex. Canada)
GDP, y/y % change period avg. 2.1 1.4 0.1 2.4 2.5
Monetary policy rate, % eop 1.75 2.21 2.23 2.42 2.70
Core CPI, y/y % change avg. 2.1 2.3 1.9 1.9 2.0
USDCAD, annual average 1.27 1.25 1.32 1.31 1.23
Scenario 4: 20% US global (all countries)
GDP, y/y % change period avg. 2.1 0.8 -1.8 2.4 3.2
Monetary policy rate, % eop 1.75 2.20 1.79 2.02 2.60
Core CPI, y/y % change avg. 2.1 2.6 1.8 1.7 2.0
USDCAD, annual average 1.27 1.26 1.40 1.40 1.25
Source: Scotiabank Economics.
8
June 14, 2018
GLOBAL ECONOMICS
| INSIGHTS & VIEWS
Visit our web site at scotiabank.com/economics or contact us by email at [email protected]
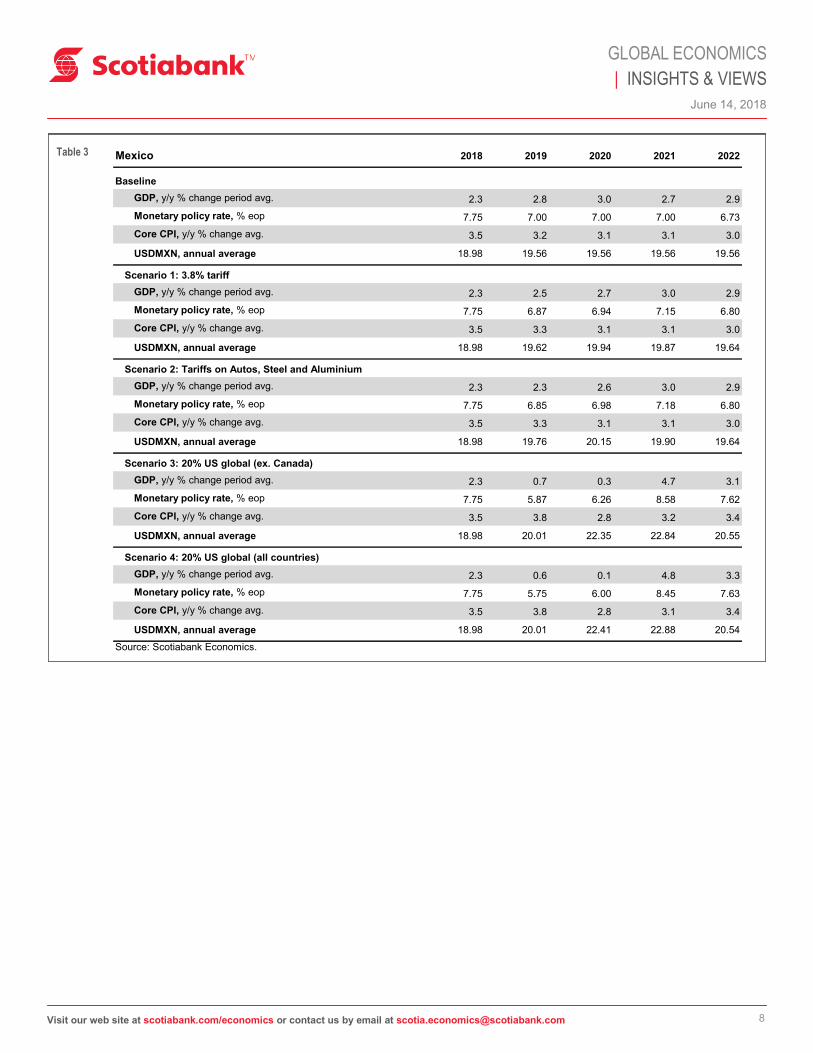
Table 3 Mexico 2018 2019 2020 2021 2022
Baseline
GDP, y/y % change period avg. 2.3 2.8 3.0 2.7 2.9
Monetary policy rate, % eop 7.75 7.00 7.00 7.00 6.73
Core CPI, y/y % change avg. 3.5 3.2 3.1 3.1 3.0
USDMXN, annual average 18.98 19.56 19.56 19.56 19.56
Scenario 1: 3.8% tariff
GDP, y/y % change period avg. 2.3 2.5 2.7 3.0 2.9
Monetary policy rate, % eop 7.75 6.87 6.94 7.15 6.80
Core CPI, y/y % change avg. 3.5 3.3 3.1 3.1 3.0
USDMXN, annual average 18.98 19.62 19.94 19.87 19.64
Scenario 2: Tariffs on Autos, Steel and Aluminium
GDP, y/y % change period avg. 2.3 2.3 2.6 3.0 2.9
Monetary policy rate, % eop 7.75 6.85 6.98 7.18 6.80
Core CPI, y/y % change avg. 3.5 3.3 3.1 3.1 3.0
USDMXN, annual average 18.98 19.76 20.15 19.90 19.64
Scenario 3: 20% US global (ex. Canada)
GDP, y/y % change period avg. 2.3 0.7 0.3 4.7 3.1
Monetary policy rate, % eop 7.75 5.87 6.26 8.58 7.62
Core CPI, y/y % change avg. 3.5 3.8 2.8 3.2 3.4
USDMXN, annual average 18.98 20.01 22.35 22.84 20.55
Scenario 4: 20% US global (all countries)
GDP, y/y % change period avg. 2.3 0.6 0.1 4.8 3.3
Monetary policy rate, % eop 7.75 5.75 6.00 8.45 7.63
Core CPI, y/y % change avg. 3.5 3.8 2.8 3.1 3.4
USDMXN, annual average 18.98 20.01 22.41 22.88 20.54
Source: Scotiabank Economics.

9
June 14, 2018
GLOBAL ECONOMICS
| INSIGHTS & VIEWS
Visit our web site at scotiabank.com/economics or contact us by email at [email protected]
Table 4 US 2018 2019 2020 2021 2022
Baseline
GDP, y/y % change period avg. 2.8 2.4 1.9 1.4 1.6
Monetary policy rate, % eop 2.25 2.75 3.11 2.83 2.65
Core PCE, y/y % change avg. 1.9 2.1 2.1 2.0 1.9
Scenario 1: 3.8% tariff
GDP, y/y % change period avg. 2.8 2.3 1.8 1.4 1.7
Monetary policy rate, % eop 2.25 2.72 3.03 2.79 2.65
Core PCE, y/y % change avg. 1.9 2.1 2.1 2.0 1.9
Scenario 2: Tariffs on Autos, Steel and Aluminium
GDP, y/y % change period avg. 2.8 2.3 1.8 1.4 1.7
Monetary policy rate, % eop 2.25 2.72 3.04 2.80 2.65
Core PCE, y/y % change avg. 1.9 2.1 2.1 2.0 1.9
Scenario 3: 20% US global (ex. Canada)
GDP, y/y % change period avg. 2.8 1.5 0.2 2.0 2.2
Monetary policy rate, % eop 2.25 2.16 2.06 2.49 2.78
Core PCE, y/y % change avg. 1.9 2.1 1.9 1.9 2.0
Scenario 4: 20% US global (all countries)
GDP, y/y % change period avg. 2.8 1.4 -0.1 2.1 2.4
Monetary policy rate, % eop 2.25 2.12 1.92 2.45 2.83
Core PCE, y/y % change avg. 1.9 2.1 1.8 1.9 2.1
Source: Scotiabank Economics.

10
June 14, 2018
GLOBAL ECONOMICS
| INSIGHTS & VIEWS
Visit our web site at scotiabank.com/economics or contact us by email at [email protected]
Scenario 1: NAFTA lapses: 3.8% MFN tariffs are imposed across the board
Chart 3
0.0
0.5
1.0
1.5
2.0
2.5
3.0
18 19 20 21 22
Baseline vs. MFN Scenario: GDP Growth in Canada
q/q % change, annualised
MFN Scenario
Source: Scotiabank Economics.
Baseline Scenario
1.5
2.0
2.5
3.0
3.5
4.0
4.5
5.0
18 19 20 21 22
Baseline vs. MFN Scenario:GDP Growth in Mexico
q/q % change, annualised
MFN Scenario
Source: Scotiabank Economics.
Baseline Scenario
1.0
1.3
1.6
1.9
2.2
2.5
2.8
3.1
18 19 20 21 22
Baseline vs. MFN Scenario: GDP Growth in the US
q/q % change, annualised
MFNScenario
Source: Scotiabank Economics.
Baseline Scenario
1.7
1.8
1.9
2.0
2.1
2.2
2.3
2.4
2.5
18 19 20 21 22
Baseline vs. MFN Scenario: Core Inflation in Canada
y/y % change
MFN Scenario
Source: Scotiabank Economics.
Baseline Scenario
2.8
3.0
3.2
3.4
3.6
3.8
4.0
18 19 20 21 22
Baseline vs. MFN Scenario: Core Inflation in Mexico
y/y % change
MFNScenario
Source: Scotiabank Economics.
Baseline Scenario
1.5
1.6
1.7
1.8
1.9
2.0
2.1
2.2
18 19 20 21 22
Baseline vs. MFN Scenario: Core Inflation in the US
y/y % change
MFNScenario
Source: Scotiabank Economics.
Baseline Scenario
CANADA Chart 4
US Chart 7 Chart 8
MEXICO Chart 6 Chart 5

11
June 14, 2018
GLOBAL ECONOMICS
| INSIGHTS & VIEWS
Visit our web site at scotiabank.com/economics or contact us by email at [email protected]
Chart 9
0
1
2
3
18 19 20 21 22
Baseline vs. US Tariffs on Autos, Steel & Aluminum:
GDP Growth in Canada
q/q % change, annualised
Tariffs on autos, steel & aluminum
Source: Scotiabank Economics.
Baseline Scenario
0
1
2
3
4
5
18 19 20 21 22
Baseline vs. US Tariffs on Autos, Steel & Aluminum:
GDP Growth in Mexico
q/q % change, annualised
Tariffs on autos, steel & aluminum
Source: Scotiabank Economics.
Baseline Scenario
1.6
1.7
1.8
1.9
2.0
2.1
2.2
2.3
2.4
2.5
18 19 20 21 22
Baseline vs. US Tariffs on Autos Steel & Aluminum: Core Inflation in Canada
y/y % change
Source: Scotiabank Economics.
Baseline Scenario
Tariffs on autos, steel & aluminum
2.6
2.8
3.0
3.2
3.4
3.6
3.8
4.0
18 19 20 21 22
Baseline vs. US Tariffs on Autos Steel & Aluminum: Core Inflation in Mexico
y/y % change
Source: Scotiabank Economics.
Baseline Scenario
Tariffs on autos, steel & aluminum
1.5
1.6
1.7
1.8
1.9
2.0
2.1
2.2
18 19 20 21 22
Baseline vs. US Tariffs on Autos Steel & Aluminum: Core Inflation in the US
y/y % change
Source: Scotiabank Economics.
Baseline Scenario
Tariffs on autos, steel & aluminum
CANADA Chart 10
US Chart 13 Chart 14
MEXICO Chart 12 Chart 11
Scenario 2: NAFTA talks extend past Q2-2019 and US imposes tariffs on steel, aluminum, and autos
0
1
2
3
4
18 19 20 21 22
Baseline vs. US Tariffs on Autos, Steel & Aluminum:
GDP Growth in the US
q/q % change, annualised
Tariffs on autos, steel &
aluminum
Source: Scotiabank Economics.
Baseline Scenario

12
June 14, 2018
GLOBAL ECONOMICS
| INSIGHTS & VIEWS
Visit our web site at scotiabank.com/economics or contact us by email at [email protected]
Scenario 3: Global trade war—US imposes 20% tariff across the board except on Canada
Chart 15
-1
0
1
2
3
18 19 20 21 22
Baseline vs. Global Trade War ex. Canada: GDP Growth in Canada
q/q % change, annualised
Global trade war ex. Canada
Source: Scotiabank Economics.
Baseline Scenario
-4
-2
0
2
4
6
8
18 19 20 21 22
q/q % change, annualised
Source: Scotiabank Economics.
Baseline Scenario
Baseline vs. Global Trade War ex. Canada: GDP Growth in Mexico
Global trade war ex. Canada
-1.5
0.0
1.5
3.0
4.5
18 19 20 21 22
q/q % change, annualised
Source: Scotiabank Economics.
Baseline Scenario
Baseline vs. Global Trade War ex. Canada: GDP Growth in the US
Global trade war ex. Canada
1.0
1.4
1.8
2.2
2.6
18 19 20 21 22
y/y % change
Source: Scotiabank Economics.
Baseline Scenario
Baseline vs. Global Trade War ex. Canada: Core Inflation in Canada
Global trade war ex. Canada
2.6
3.0
3.4
3.8
4.2
4.6
5.0
18 19 20 21 22
y/y % change
Source: Scotiabank Economics.
Baseline Scenario
Baseline vs. Global Trade War ex. Canada: Core Inflation in Mexico
Global trade war ex. Canada
1.6
1.7
1.8
1.9
2.0
2.1
2.2
2.3
18 19 20 21 22
y/y % change
Source: Scotiabank Economics.
Baseline Scenario
Baseline vs. Global Trade War ex. Canada: Core Inflation in the US
Global trade war ex. Canada
CANADA Chart 16
US Chart 19 Chart 20
MEXICO Chart 18 Chart 17

13
June 14, 2018
GLOBAL ECONOMICS
| INSIGHTS & VIEWS
Visit our web site at scotiabank.com/economics or contact us by email at [email protected]
-2
-1
0
1
2
3
4
18 19 20 21 22
Baseline vs. Global Trade War: GDP Growth in the US
q/q % change, annualised
Source: Scotiabank Economics.
Baseline Scenario
Global trade war
1.5
1.6
1.7
1.8
1.9
2.0
2.1
2.2
2.3
2.4
18 19 20 21 22
Baseline vs. Global Trade War: Core Inflation in the US
y/y % change
Source: Scotiabank Economics.
Baseline Scenario
Global trade war
-4
-3
-2
-1
0
1
2
3
4
5
6
7
18 19 20 21 22
Baseline vs. Global Trade War: GDP Growth in Mexico
q/q % change, annualised
Source: Scotiabank Economics.
Baseline Scenario
Global trade war
2.6
3.1
3.6
4.1
4.6
5.1
18 19 20 21 22
Baseline vs. Global Trade War: Core Inflation in Mexico
y/y % change
Source: Scotiabank Economics.
Baseline Scenario
Global trade war
-4
-3
-2
-1
0
1
2
3
4
5
18 19 20 21 22
Baseline vs. Global Trade War: GDP Growth in Canada
q/q % change, annualised
Global trade war
Source: Scotiabank Economics.
Baseline Scenario
1.0
1.4
1.8
2.2
2.6
3.0
3.4
18 19 20 21 22
Baseline vs. Global Trade War: Core Inflation in Canada
y/y % change
Source: Scotiabank Economics.
Baseline Scenario
Global trade war
Scenario 4: Global trade war—US imposes an average 20% tariff across the board with no exception for Canada
CANADA
US
MEXICO
Chart 21 Chart 22
Chart 25 Chart 26
Chart 24 Chart 23

14
June 14, 2018
GLOBAL ECONOMICS
| INSIGHTS & VIEWS
Visit our web site at scotiabank.com/economics or contact us by email at [email protected]
Chart A4 Chart A5 Chart A6
APPENDIX: GRAPHICAL PEAK-TO-TROUGH IMPACT OF NAFTA SHOCKS
-0.80
-0.60
-0.40
-0.20
0.00
0.20
18 19 20 21 22
Effects on Canada of Tariffs on Autos, Steel & Aluminium
ppt +/- baselineCore inflation
rate
Outputgap
Policy rate
Gross domesticproduct
.Source: Scotiabank Economics.
-1.20
-0.80
-0.40
0.00
0.40
18 19 20 21 22
Effects on Mexico of Tariffs on Autos, Steel & Aluminium
ppt +/- baseline
Core inflation rate
Outputgap
Policy rate
Gross domesticproduct
Source: Scotiabank Economics.
-0.16
-0.12
-0.08
-0.04
0.00
0.04
18 19 20 21 22
Effects on the US of Tariffs on Autos, Steel & Aluminium
ppt +/- baselineCore inflation
rate
Outputgap
Policy rate
Gross domesticproduct
Source: Scotiabank Economics.
-0.7
-0.6
-0.5
-0.4
-0.3
-0.2
-0.1
0.0
0.1
0.2
18 19 20 21 22
Effects on Canada of a 3.8% Tariff Between All NAFTA Partnersppt +/- baseline
Source: Scotiabank Economics.
Outputgap
Policy rate
Core inflation rate
Gross domesticproduct
Chart A1
-1.0
-0.8
-0.6
-0.4
-0.2
0.0
0.2
0.4
18 19 20 21 22
Effects on Mexico of a 3.8% Tariff Between All NAFTA Partnersppt +/- baseline
Source: Scotiabank Economics.
Output gap
Gross domesticproduct
Policy rateCore inflation
rate
Chart A2
-0.24
-0.18
-0.12
-0.06
0.00
0.06
18 19 20 21 22
Effects on the US of a 3.8% Tariff Between All NAFTA Partners
ppt +/- baseline
Source: Scotiabank Economics.
Outputgap
Gross domesticproduct
Policy rate
Core inflation rate
Chart A3
Scenario 1: NAFTA lapses: 3.8% MFN tariffs are imposed across the board
Scenario 2: NAFTA talks extend past Q2-2019 and US imposes tariffs on steel, aluminum, and autos

15
June 14, 2018
GLOBAL ECONOMICS
| INSIGHTS & VIEWS
Visit our web site at scotiabank.com/economics or contact us by email at [email protected]
Chart A10 Chart A11 Chart A12
-6.0
-5.0
-4.0
-3.0
-2.0
-1.0
0.0
1.0
2.0
18 19 20 21 22
Effects on Canada of a Global Trade War
ppt +/- baseline
Source: Scotiabank Economics.
Core inflation rate
Outputgap
Policy rate
Gross domesticproduct
-6.0
-5.0
-4.0
-3.0
-2.0
-1.0
0.0
1.0
2.0
18 19 20 21 22
Effects on Mexico of a Global Trade War
ppt +/- baseline
Core inflation rate
Outputgap
Policy rate
Gross domesticproduct
Source: Scotiabank Economics.
-3.5
-3.0
-2.5
-2.0
-1.5
-1.0
-0.5
0.0
0.5
18 19 20 21 22
Effects on the US of a Global Trade War
ppt +/- baseline Core inflation rate
Outputgap
Policy rate
Gross domesticproduct
Source: Scotiabank Economics.
-2.5
-2.0
-1.5
-1.0
-0.5
0.0
0.5
1.0
18 19 20 21 22
Effects on Canada of a Global Trade War ex. Canada
ppt +/- baseline
Source: Scotiabank Economics.
Core inflation rate
Outputgap
Policy rate
Gross domesticproduct
Chart A7
-6.0
-5.0
-4.0
-3.0
-2.0
-1.0
0.0
1.0
2.0
18 19 20 21 22
Effects on Mexico of a Global Trade War ex. Canada
ppt +/- baseline
Core inflation rate
Outputgap
Policy rate
Gross domesticproduct
Source: Scotiabank Economics.
Chart A8
-3.0
-2.5
-2.0
-1.5
-1.0
-0.5
0.0
0.5
18 19 20 21 22
Effects on the US of a Global Trade War ex. Canada
ppt +/- baseline Core inflation rate
Outputgap
Policy rate
Gross domesticproduct
Source: Scotiabank Economics.
Chart A9
Scenario 3: Global trade war—US imposes 20% tariff across the board except on Canada
APPENDIX (continued)
Scenario 4: Global trade war—US imposes 20% tariff across the board with no exception for Canada

June 14, 2018
Visit our web site at scotiabank.com/economics or contact us by email at [email protected]
GLOBAL ECONOMICS
| INSIGHTS & VIEWS
This report has been prepared by Scotiabank Economics as a resource for the clients of Scotiabank. Opinions, estimates and projections
contained herein are our own as of the date hereof and are subject to change without notice. The information and opinions contained herein
have been compiled or arrived at from sources believed reliable but no representation or warranty, express or implied, is made as to their
accuracy or completeness. Neither Scotiabank nor any of its officers, directors, partners, employees or affiliates accepts any liability whatsoever
for any direct or consequential loss arising from any use of this report or its contents.
These reports are provided to you for informational purposes only. This report is not, and is not constructed as, an offer to sell or solicitation of
any offer to buy any financial instrument, nor shall this report be construed as an opinion as to whether you should enter into any swap or
trading strategy involving a swap or any other transaction. The information contained in this report is not intended to be, and does not
constitute, a recommendation of a swap or trading strategy involving a swap within the meaning of U.S. Commodity Futures Trading
Commission Regulation 23.434 and Appendix A thereto. This material is not intended to be individually tailored to your needs or characteristics
and should not be viewed as a “call to action” or suggestion that you enter into a swap or trading strategy involving a swap or any other
transaction. Scotiabank may engage in transactions in a manner inconsistent with the views discussed this report and may have positions, or
be in the process of acquiring or disposing of positions, referred to in this report.
Scotiabank, its affiliates and any of their respective officers, directors and employees may from time to time take positions in currencies, act as
managers, co-managers or underwriters of a public offering or act as principals or agents, deal in, own or act as market makers or advisors,
brokers or commercial and/or investment bankers in relation to securities or related derivatives. As a result of these actions, Scotiabank may
receive remuneration. All Scotiabank products and services are subject to the terms of applicable agreements and local regulations. Officers,
directors and employees of Scotiabank and its affiliates may serve as directors of corporations.
Any securities discussed in this report may not be suitable for all investors. Scotiabank recommends that investors independently evaluate any
issuer and security discussed in this report, and consult with any advisors they deem necessary prior to making any investment.
This report and all information, opinions and conclusions contained in it are protected by copyright. This information may not be
reproduced without the prior express written consent of Scotiabank.
™ Trademark of The Bank of Nova Scotia. Used under license, where applicable.
Scotiabank, together with “Global Banking and Markets”, is a marketing name for the global corporate and investment banking and capital
markets businesses of The Bank of Nova Scotia and certain of its affiliates in the countries where they operate, including, Scotiabanc Inc.;
Citadel Hill Advisors L.L.C.; The Bank of Nova Scotia Trust Company of New York; Scotiabank Europe plc; Scotiabank (Ireland) Limited;
Scotiabank Inverlat S.A., Institución de Banca Múltiple, Scotia Inverlat Casa de Bolsa S.A. de C.V., Scotia Inverlat Derivados S.A. de C.V. – all
members of the Scotiabank group and authorized users of the Scotiabank mark. The Bank of Nova Scotia is incorporated in Canada with
limited liability and is authorised and regulated by the Office of the Superintendent of Financial Institutions Canada. The Bank of Nova Scotia is
authorised by the UK Prudential Regulation Authority and is subject to regulation by the UK Financial Conduct Authority and l imited regulation
by the UK Prudential Regulation Authority. Details about the extent of The Bank of Nova Scotia's regulation by the UK Prudential Regulation
Authority are available from us on request. Scotiabank Europe plc is authorised by the UK Prudential Regulation Authority and regulated by the
UK Financial Conduct Authority and the UK Prudential Regulation Authority.
Scotiabank Inverlat, S.A., Scotia Inverlat Casa de Bolsa, S.A. de C.V., and Scotia Derivados, S.A. de C.V., are each authorized and regulated
by the Mexican financial authorities.
Not all products and services are offered in all jurisdictions. Services described are available in jurisdictions where permitted by law.