global economic significance of business events
TRANSCRIPT

Global Economic Significance of Business EventsEvents Industry Council
November 2018

2Events Industry Council | Oxford Economics
November 2018This study on the global economic significance of business events, conducted by Oxford Economics, is unprecedented research that could only be accomplished through the collaborative efforts of the public and private sectors to qualify the value, influence, and impact that business events produce throughout the world. It further enables this dynamic industry to benchmark its current contributions and track its future growth.The data in this study provide a clear and credible statistical base on which to gain recognition for this vast and diverse industry as a vital economic driver and clearly articulates the downstream benefits to other industries and the people who work in them. Anyone who reads this report will better understand the economic significance as well as the depth and breadth of the global business events industry.While this study focuses on the value of the industry to the overall global economy, the many other benefits resulting from the business events that are held should not be overlooked. To the millions of attendees annually, these events provide an invaluable source of adult learning, continuing education for professional certifications and licensure, a forum for developing and maintaining professional contacts, an effective and efficient means of enhancing sales efforts, a medium for information exchange leading to innovation, new medical treatments and research breakthroughs, among other benefits.Assisting in this study effort was a team of industry professionals and researchers from the Events Industry Council Research Committee. We extend our thanks to them for their oversight of the project.
Sharon Moss, ASAE & The Center for Association Leadership Meredith Rollins, PCMA FoundationPaul Van Deventer, Meeting Professionals International Melissa Van Dyke, Incentive Research Foundation Andreas Weissenborn, Destinations International
Cathy Breden, International Association of Exhibitions and Events (Chair) Mark Cooper, IACCVicki Crews-Anderson, Financial and Insurance Conference Professionals Nancy Drapeau, Center for Exhibition Industry ResearchJamie Faulkner-Mageau, U.S. Travel Association
We would also like to thank our partners in this ground breaking collaboration on this unprecedented global study.
Karen Kotowski, CAE, CMPChief Executive Officer, Events Industry Council

Table of contents
3
Executive summary 4
Section 1: Business events volume and direct spending 7
Section 2: Economic impact of business events 14
Section 3: Methods 18
Section 4: Industry comparisons 25
Acknowledgements 28
Events Industry Council | Oxford Economics

Executive summary
4
OverviewTo quantify the economic significance of the global business events sector for the Events Industry Council and its stakeholders, Oxford Economics has prepared a comprehensive model of global business events activity that leverages and extends recent studies on their economic significance. The results of this study show the scope of the business events sector in terms of direct spending and jobs, as well as the total impacts of business events in the broader economy. The study represents the first-of-its-kind analysis of the global business events industry.
As part of this analysis, Oxford Economics took the following steps:
Analysed existing studies on business events impacts in 15 countries, as well as third-party industry data across more than 180 countries; Developed an econometric model of the relationship between
economic and travel-industry data sets and business events industry impacts to estimate business events activity in countries in which the business events industry has not been previously quantified; and Combined the results of existing studies and modeled
relationships to prepare global estimates.
This document presents key elements of the research and findings. It is organized in four sections:
1. Business events volume and direct spending 2. Economic impact analysis3. Methods4. Industry comparisons
Events Industry Council | Oxford Economics
What qualifies as a business event in this study?• A gathering of 10 or more participants for a minimum of four
hours in a contracted venue. This includes business events, but excludes social, educational (formal educational activities at primary, secondary, and university level education), and recreational activities, as well as consumer exhibitions.
What are the main components of economic impact?• Direct impacts consist of the direct spending and jobs that are
involved in planning and producing business events, and for participants to travel to business events, as well as other business events-related spending. Indirect impacts represent downstream supplier industry impacts, also referred to as supply chain impacts. For example, the facilities at which business events occur require inputs such as energy and food ingredients. Also, many business event venues contract with specialised service providers, such as marketing, equipment upkeep, cleaning, technology support, accounting, and legal and financial services. These are examples of indirect impacts. Induced impacts occur as employees spend their wages and salaries in the broader economy. For example, as hotel employees spend money on rent, transportation, food and beverage, and entertainment.
• Impacts are expressed in terms of economic output, which includes all business sales, GDP (gross domestic product), which is defined as business sales less intermediate inputs, and jobs.

Executive summary
5
Direct impacts of global business events (2017)
• Number of participants: Business events involved more than 1.5 billion participants across more than 180 countries.
• Direct spending (business sales): Business events generated more than $1.07 trillion of direct spending, representing spending to plan and produce business events, business events-related travel, and other direct spending, such as spending by exhibitors.
• Direct GDP (gross domestic product) and employment: Business events supported 10.3 million direct jobs globally and generated $621.4 billion of direct GDP.
• Average spending per participant: On average, $704 was spent per business event participant.
• Top countries: The top 50 countries accounted for $1.03 trillion of business events direct spending, representing 96% of the global total.
• Prior country-level studies: Previous country-level analyses of business events activity accounted for almost two-thirds of the estimated global total, providing a solid research foundation.
Total impacts of global business events (2017)
After accounting for indirect and induced impacts, business events supported a total global economic impact in 2017 of:
• $2.5 trillion of output (business sales)
• 26 million jobs
• $1.5 trillion of GDP (representing contribution to global gross domestic product)
The business events sector directly generated more output (business sales) than many large global sectors, including consumer electronics and computers and office equipment.
The $1.5 trillion of total GDP supported by global business events would rank the sector as the 13th largest economy globally, larger than the economies of countries such as Australia, Spain, Mexico, Indonesia, and Saudi Arabia. Based on its $621.4 billion direct GDP impact, the business events sector would rank as the 22nd largest economy globally.
Events Industry Council | Oxford Economics

Executive summary
6Events Industry Council | Oxford Economics
1.5 billion participants
across more than 180 countries
(gross domestic product)
$621.4 million in direct GDP
$1.07 trillion in direct spending (business sales)
representing spending to plan and produce business events, business events-related travel, and other direct spending, such as spending by exhibitors
10.3 million jobs
directly supported by global business events
Direct Impacts
including direct, indirect, and induced GDP impacts
$1.50 trillion in total GDP
$2.53 trillion in total output (business sales)
including direct, indirect, and induced output
25.9 million total jobs
directly and indirectly supported by global business events
Total Impacts
Indirect & Induced Impacts

1. Business events volume and direct spending

Overview of business events volume and direct spending
8
This section summarises the size and scope of business events sector activity worldwide. The primary measures presented are:
Amount of business events direct spending Number of business event participants Number of business event direct jobs
Business events direct spending represents spending directly incurred in the planning and production of business events, travel to business events, and accompanying business events-related activities. As a basic description this includes spending by participants to attend the business event (e.g. travel and registration), organiser-paid travel, spending by exhibitors (e.g. sponsorships, exhibit production, off-site events), spending by business event organisers and hosts, and certain other business events-related spending.
Business events direct spending provides the clearest measure of the economic significance of business events because it captures the full scope of services and goods directly provided by a range of industries. For this reason, much of our summary analysis focuses on business events direct spending and the number of business events participants.
Definition of a business eventFor the purpose of this study, the term "business event" refers to a gathering of 10 or more participants for a minimum of four hours in a contracted venue.
Business events include conventions, conferences, congresses, trade shows and exhibitions, incentive events, corporate/business events, and other business events that fit the aforementioned criteria. Business events exclude social activities (wedding receptions,
holiday parties, etc.), permanently established formal educational activities (primary, secondary or university level education), purely recreational activities (such as concerts and shows of any kind), political campaign rallies, or gatherings of consumers by a company for the purpose of presenting specific goods or services for sale (consumer shows, product launches to consumers).
Note that in some cases, definitions used on individual country-level studies may differ slightly from these overall definitions.
Events Industry Council | Oxford Economics

Business events summary data
9
Business events generated more than $1.07 trillion of direct spending and drew 1.5 billion participants globally in 2017.
Events Industry Council | Oxford Economics
Business events involved more than 1.5 billion participants across more than 180 countries in 2017. Business events generated approximately $1.07 trillion of direct spending, representing spending to plan and produce business events, business events-related travel, and other direct spending, such as spending by exhibitors. On average, each business events participant spent $704. The top 50 countries accounted for $1.03 trillion of business events direct spending, representing 96% of the global total.
Summary of business events activity, 2017
Direct spending
Partici-pants
Global total $1,071.2 1,520.7 $704 100.0% 100.0%
By regionNorth America $381.0 329.7 $1,156 35.6% 21.7%Western Europe $325.0 444.4 $731 30.3% 29.2%Asia $271.4 482.7 $562 25.3% 31.7%Latin America & the Caribbean $33.0 91.2 $362 3.1% 6.0%Central and Eastern Europe $24.6 66.0 $373 2.3% 4.3%Africa $23.4 80.6 $290 2.2% 5.3%Middle East $12.8 26.1 $488 1.2% 1.7%
Top 50 countries $1,033.7 1,409.0 $734 96.5% 92.7%
Share of totalDirect spending
(billions US$)
Partici-pants
(millions)
Average spending
(US$)

35.6%
30.3%
25.3%
3.1%2.3% 2.2% 1.2% North
America
Western Europe
Asia
Latin America &the Caribbean
Central andEastern Europe
Africa
Middle East
$381.0$325.0
$271.4
$33.0 $24.6 $23.4 $12.8
NorthAmerica
WesternEurope
Asia LatinAmerica &
theCaribbean
Centraland
EasternEurope
Africa MiddleEast
In billions, US$, 2017
Business events direct spending
10
North America and Western Europe are the top regions in terms of business events direct spending.
Events Industry Council | Oxford Economics
Business events in North America generated $381.0 billion of business events direct spending, as shown in the accompanying chart, representing 35.6% of global business events direct spending. Business events in Western Europe and Asia generated $325.0 billion and $271.4 billion in direct spending, representing 30.3% and 25.3% of global direct spending, respectively.
Business events direct spending by region

Business events participants
11
In terms of number of participants, Asia represents the largest region.
Events Industry Council | Oxford Economics
Business events participants by regionAsia was the largest market in terms of business event participants, hosting 482.7 million participants, representing nearly one-third of total participants worldwide. Western Europe ranked second, hosting 444.4 million participants (29.2% of worldwide participants) in 2017. North America ranked third with 329.7 million participants, representing 21.7% of global participants. Latin America & the Caribbean, Africa, Central and Eastern Europe, and the Middle East followed, each hosting less than 100 million business event participants.
482.7 444.4329.7
91.2 80.6 66.0 26.1
Asia WesternEurope
NorthAmerica
LatinAmerica &
theCaribbean
Africa Centraland
EasternEurope
MiddleEast
In millions, 2017
21.7%
31.7%
29.2%
6.0%
5.3%
4.3% 1.7%NorthAmericaAsia
WesternEuropeLatin America &the CaribbeanAfrica
Central andEastern EuropeMiddleEast
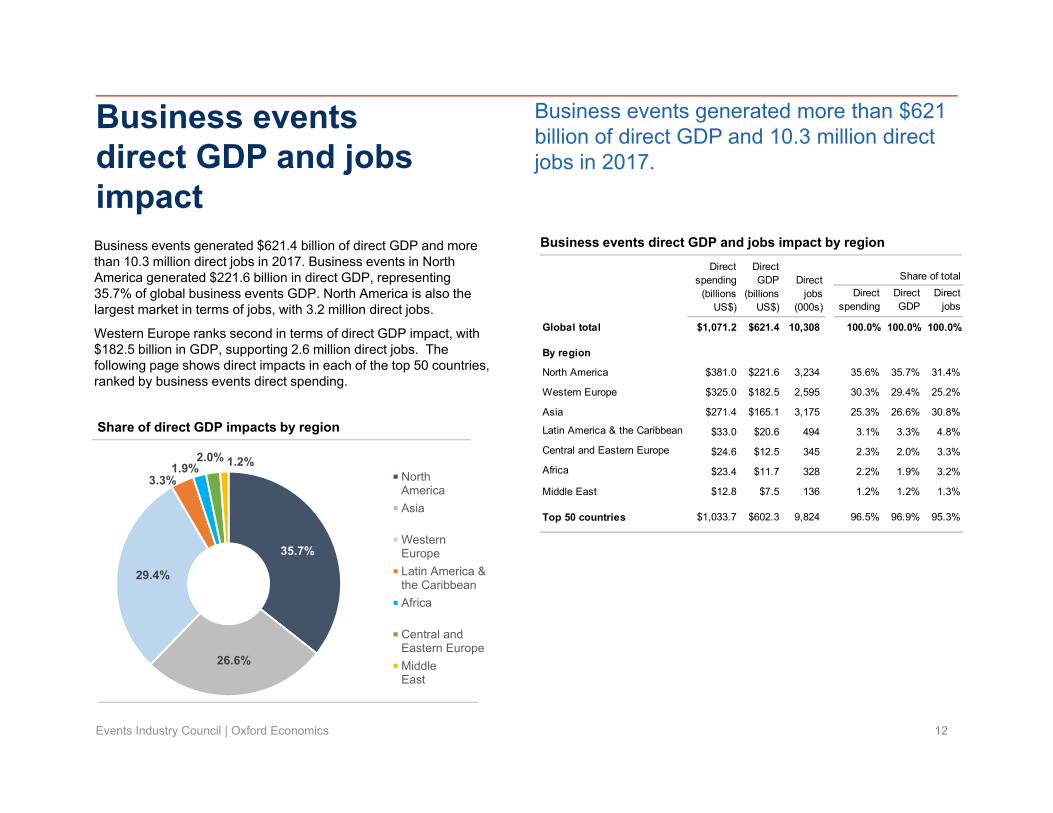
Business events direct GDP and jobs impact
12
Business events generated more than $621 billion of direct GDP and 10.3 million direct jobs in 2017.
Events Industry Council | Oxford Economics
Business events generated $621.4 billion of direct GDP and more than 10.3 million direct jobs in 2017. Business events in North America generated $221.6 billion in direct GDP, representing 35.7% of global business events GDP. North America is also the largest market in terms of jobs, with 3.2 million direct jobs.
Western Europe ranks second in terms of direct GDP impact, with $182.5 billion in GDP, supporting 2.6 million direct jobs. The following page shows direct impacts in each of the top 50 countries, ranked by business events direct spending.
Business events direct GDP and jobs impact by region
Share of direct GDP impacts by region
35.7%
26.6%
29.4%
3.3%1.9%
2.0% 1.2%NorthAmericaAsia
WesternEuropeLatin America &the CaribbeanAfrica
Central andEastern EuropeMiddleEast
Direct spending
Direct GDP
Direct jobs
Global total $1,071.2 $621.4 10,308 100.0% 100.0% 100.0%
By region
North America $381.0 $221.6 3,234 35.6% 35.7% 31.4%
Western Europe $325.0 $182.5 2,595 30.3% 29.4% 25.2%
Asia $271.4 $165.1 3,175 25.3% 26.6% 30.8%
Latin America & the Caribbean $33.0 $20.6 494 3.1% 3.3% 4.8%
Central and Eastern Europe $24.6 $12.5 345 2.3% 2.0% 3.3%
Africa $23.4 $11.7 328 2.2% 1.9% 3.2%
Middle East $12.8 $7.5 136 1.2% 1.2% 1.3%
Top 50 countries $1,033.7 $602.3 9,824 96.5% 96.9% 95.3%
Direct GDP
(billions US$)
Direct jobs
(000s)
Share of totalDirect
spending(billions
US$)

Direct impacts of top 50 countries
13Events Industry Council | Oxford Economics
Direct impacts generated by the business events sector (2017)Top 50 countries, ranked by direct spending (billions US$ and thousands of jobs)
Rank Country
Direct spending
(billions US$)
Direct GDP impact
(billions US$)
Direct jobs
(000s)
Total participants
(000s)
Average spend per participant Rank Country
Direct spending
(billions US$)
Direct GDP impact
(billions US$)
Direct jobs
(000s)
Total participants
(000s)
Average spend per participant
1 United States $325.0 $184.2 2,489 252,600 $1,287 26 Denmark $3.7 $1.5 29 7,658 $482
2 China $132.4 $87.8 1,844 213,816 $619 27 United Arab Emirates $3.3 $2.3 25 4,995 $659
3 Germany $123.7 $71.4 997 149,796 $826 28 Hong Kong, China $3.3 $2.1 27 4,545 $721
4 United Kingdom $92.6 $51.5 774 120,164 $770 29 Poland $3.4 $1.9 83 10,627 $320
5 Japan $61.1 $32.4 374 95,493 $640 30 New Zealand $2.9 $1.8 24 4,393 $656
6 Canada $33.1 $19.3 229 49,538 $668 31 Austria $2.7 $1.6 17 3,677 $738
7 Italy $32.5 $17.7 250 56,410 $576 32 Portugal $2.6 $1.1 37 5,488 $469
8 Australia $30.1 $15.2 193 41,755 $722 33 Belgium $2.4 $1.1 20 3,541 $691
9 France $28.6 $14.6 192 44,537 $642 34 Philippines $2.1 $1.4 46 7,333 $287
10 Mexico $25.4 $18.1 516 31,359 $810 35 Chile $1.8 $1.0 26 4,474 $411
11 Sweden $13.7 $9.1 90 17,191 $798 36 Peru $1.8 $0.9 47 5,630 $324
12 Spain $12.0 $7.5 83 22,151 $542 37 Pakistan $1.8 $0.9 47 6,464 $273
13 Brazil $10.9 $7.6 172 30,623 $355 38 Colombia $1.7 $0.9 32 5,277 $320
14 South Korea $10.1 $7.0 83 18,124 $557 39 Romania $1.5 $1.0 23 4,238 $364
15 Argentina $9.8 $5.9 108 24,319 $401 40 Finland $1.4 $0.6 12 1,977 $714
16 India $9.4 $4.7 143 33,879 $276 41 Norway $1.4 $0.7 11 1,521 $896
17 Indonesia $6.3 $3.9 104 21,431 $296 42 Czech Republic $1.3 $0.6 12 2,887 $462
18 Russia $5.4 $2.9 83 14,854 $367 43 Ireland $1.3 $0.5 10 1,967 $638
19 South Africa $5.4 $2.4 73 16,975 $319 44 Egypt $1.2 $0.6 22 4,421 $277
20 Turkey $4.6 $2.0 37 12,734 $363 45 Algeria $1.2 $0.9 24 4,059 $299
21 Nigeria $4.2 $2.0 52 15,224 $276 46 Switzerland $1.2 $0.7 9 1,379 $870
22 Thailand $4.2 $2.6 123 12,935 $323 47 Greece $1.1 $0.5 18 2,568 $444
23 Saudi Arabia $3.9 $2.3 40 8,363 $466 48 Kenya $1.1 $0.6 25 4,175 $273
24 Netherlands $3.8 $2.0 43 5,089 $743 49 Vietnam $1.1 $0.6 40 4,000 $280
25 Singapore $3.7 $1.8 32 4,412 $834 50 Myanmar $1.1 $0.5 35 3,913 $270

2. Economic impact of business events

Economic impact approach
15
Our analysis of business events direct spending served as an input for the economic impact model we used to estimate business events-sector direct employment and labor income, and the downstream impacts of the sector. This model is also referred to as an input-output (I-O) model.
Components of economic impact analysisThere are three main components of a sector’s overall economic impact:
Direct impacts consist of the direct spending and jobs that are involved in planning and producing business events, and for participants to travel to business events, as well as other business events-related spending. Given the characteristics of the business events sector, much of this direct activity occurs across a variety of sectors. For example, the production of a business event frequently involves employees onsite at a hotel or other venue, including banquet staff as well as audio-visual/staging and technical staff, and other third-party contracted service providers, such as entertainment/production services, décor, speakers and trainers, advertising and promotion. These employees all represent direct jobs supported by the business events sector. Meanwhile, participants’ travel to the business event, and accommodation during the event, supports direct spending and jobs across a range of service providers in the travel sector. Though this spending is occurring across businesses in a range of industry sectors, it all represents activity that is supported by business events direct spending, and is part of the business event sector’s direct impacts.
Indirect impacts represent downstream supplier industry impacts, also referred to as supply chain impacts. For example, the facilities at which business events occur require inputs such as energy and food ingredients. Also, many business event venues contract with specialized service providers, such as marketing, equipment upkeep, cleaning, technology support, accounting, and legal and financial services. These are examples of indirect impacts. Induced impacts occur as employees spend their wages and
salaries in the broader economy. For example, as hotel employees spend money on rent, transportation, food and beverage, and entertainment.
Indirect and induced impacts may also be referred to collectively as indirect effects.
To conduct the impact analysis, we used country-level economic impact multipliers from the existing business events impact studies. For countries where business events impact multipliers were either unavailable or appeared inconsistent with reference data, we used travel and tourism multipliers maintained by WTTC (World Travel and Tourism Council) and Oxford Economics. WTTC multipliers are based on input-output tables for each country and were sourced from either the OECD (Organisation for Economic Co-operation and Development), or when not available, national statistical offices. From the input-output tables, multiplier matrices were developed for each economy, detailing the flow of spending in an economy that occurs as a consequence of spending in a given industry.
Events Industry Council | Oxford Economics

Economic impacts
16
The global business events sector supported more than $2.5 trillion of total output (business sales) in 2017.
Overall, the total global economic impact of the business events sector in 2017 is summarized as follows:
$2.5 trillion of economic output (business sales) $1.5 trillion in total GDP contribution; and Nearly 26 million total jobs.
These totals represent the combination of direct impacts within the business events sector (e.g. $1.07 trillion of business events direct spending, and 10.3 million direct jobs), plus the estimated indirect and induced effects.
The resulting output multiplier for the business events sector is 2.36, implying that each $1.00 in direct business event spending generates an additional $1.36 in indirect and induced expenditures in the global economy. The following page shows estimated impacts in the top 50 countries ranked by business events direct spending.
Events Industry Council | Oxford Economics
Total output impacts by region Business events sector global economic impactsAmounts in billions of dollars, except jobs
2017
Direct business events sector impact
Output (business events direct spending) $1,071.2
Employment 10,307,794
GDP $621.4
Total business events sector impact
Output (business events direct spending) $2,526.7
Employment 25,921,359
GDP $1,495.7
$907
$678
$730
$75$63 $49 $25 North America
Asia
Western Europe
Latin America &the CaribbeanCentral andEastern EuropeAfrica
Middle East
In billions, US$, 2017

Total economic impacts of top 50 countries
17Events Industry Council | Oxford Economics
Total impacts generated by the business events sector (2017)Top 50 countries, ranked by total output impact (billions US$ and thousands of jobs)
Rank Country
Total output impact(billions US$)
Total GDP impact(billions US$)
Totaljob impact
(000s) Rank Country
Total output impact(billions US$)
Total GDP impact(billions US$)
Totaljob impact
(000s)
1 United States $787.0 $446.1 5,905 26 Saudi Arabia $6.4 $3.8 69
2 China $372.8 $247.3 5,215 27 Poland $6.4 $3.6 185
3 Germany $285.7 $165.0 1,939 28 Austria $6.1 $3.6 41
4 United Kingdom $198.9 $133.5 1,829 29 United Arab Emirates $5.8 $4.1 48
5 Japan $147.2 $78.2 1,420 30 Thailand $5.7 $3.6 308
6 Italy $70.2 $38.3 569 31 Portugal $5.5 $2.4 90
7 Canada $67.3 $42.4 493 32 Finland $5.1 $2.1 53
8 Australia $56.0 $31.1 545 33 Philippines $4.9 $3.2 154
9 France $53.6 $27.4 456 34 Belgium $4.8 $2.3 51
10 Mexico $52.8 $37.6 1,130 35 Singapore $4.2 $2.1 60
11 Sweden $46.0 $30.6 279 36 Chile $4.2 $2.3 77
12 Spain $27.4 $17.2 253 37 Switzerland $3.7 $2.3 31
13 Brazil $24.3 $17.0 484 38 Colombia $3.7 $2.0 77
14 Argentina $22.9 $13.7 303 39 Pakistan $3.5 $1.8 124
15 South Korea $22.8 $15.9 216 40 Romania $3.5 $2.2 59
16 India $19.5 $9.7 228 41 Czech Republic $3.2 $1.4 25
17 Russia $17.5 $9.3 316 42 Kenya $2.4 $1.2 66
18 South Africa $13.4 $6.0 155 43 Greece $2.3 $0.9 37
19 Indonesia $12.8 $7.8 278 44 Norway $2.3 $1.1 21
20 Turkey $10.4 $4.4 167 45 Myanmar $2.3 $1.1 78
21 Nigeria $9.0 $4.2 140 46 Algeria $2.0 $1.5 52
22 Netherlands $9.0 $4.8 67 47 Ireland $2.0 $0.8 31
23 Hong Kong, China $8.2 $5.2 80 48 Egypt $1.9 $0.9 48
24 New Zealand $7.7 $4.8 61 49 Vietnam $1.3 $0.7 65
25 Denmark $6.6 $2.7 102 50 Peru $0.8 $2.0 151

3. Methods

Research approach
19
We integrated the results of existing studies to model global business events volume and direct spending. Two-thirds of global business events direct spending was covered by country-level studies.
Our approach to the business events sector research included the following steps:
Analysed existing studies on business events impacts in 15 countries, as well as third-party industry data;
Developed an econometric model of the relationship between economic and travel-industry data sets and business events industry impacts to estimate business events activity in countries in which the business events industry has not been previously quantified; and
Combined the results of existing studies and modeled relationships to prepare global estimates.
Overall, we found that nearly two-thirds of global business events direct spending was already covered by the country-level studies we analysed. As a result, while we applied the econometric model to prepare estimates for countries that have not yet been studied at the country level, findings for many of the largest and most important countries were based on the results of existing studies. This provided a solid research foundation.
In this global analysis, we have relied broadly on the headline measures of business events activity and participants as reported by each study. In situations in which we saw clear differences such as definition differences or outliers in specific results, we excluded specific country-level report metrics from the estimation process.
Our discussion of research methods in this section follows the same order. First, we outline the research process, then we highlight the statistical modeling, and last, the conceptual framework.
Figures in this report are based on unrounded estimates. Due to rounding, the totals in certain tables may differ slightly from the sum of the individual rows or columns. The analysis was conducted in nominal US dollars based on market exchange rates.
Events Industry Council | Oxford Economics

Existing impact studiesand third-party data
20
We compiled existing studies on the impacts of business events in global markets. A comprehensive list of the 15 studies included in the analysis is outlined in the table below.
The research team collected the following metrics for each country: Direct spending Direct value-added (GDP) Direct jobs Total participants
Events Industry Council | Oxford Economics
In addition to existing impact studies, the research process also encompassed third-party industry data from the following sources:
International Congress and Convention Association
Globex (AMR International)
Global Business Travel Association
Country Study year Report title SourcesAustralia 2015 The Value of Business Events to Australia Ernst & Young, Business Events Council of AustraliaCanada 2014 The Economic Contribution of Business Events in Canada MPI Foundation Canada, Maritz Research, The Conference
Board of CanadaChina 2015 Meetings Industry: Sizing the China Market GBTA FoundationDenmark 2012 Economic Contribution of Meeting Activity in Denmark Visit DenmarkGermany 2013 Evolution of Germany's Meeting and Convention Industry German Convention BureauIndia 2017 Indian Exhibition Industry Report Indian Exhibition Industry AssociationMalaysia 2015 Investigating International Business Events Delegate Spending Patterns
in MalaysiaMalaysia Convention & Exhibition Bureau, Taylor's University, CRiT
Mexico 2016 The Economic Relevance of Meetings in Mexico SECTUR (Secretaria de Turismo), Consejo do Promocion Turistica de Mexico, STA Consultores
Peru 2014 Peru, Destination for Meetings Tourism PROMPERUPoland 2015 The Economic Impact of Poland's Meetings Industry Poland Convention Bureau, Polka Organizacja Turystyczna,
MPI Foundation, MPI Poland ChapterSingapore 2016 Study on the Economic Impact of MICE in Singapore Frost & Sullivan, Singapore Tourism BoardSwitzerland 2016 Meetings Report Sw itzerland: Analysis of Business Meetings Sw itzerland TourismThailand 2015 Economic Impact of MICE in Thailand Thailand Convention & Exhibition Bureau, Frost & SullivanUnited Kingdom 2013 The Economic Impact of the UK Meeting & Event Industry MPI FoundationUnited States 2018 Economic Signif icance of Meetings to the US Economy Oxford Economics, Events Industry Council
Existing economic impact studies

Econometric model
21
The econometric model tested the relationship between economic and travel-industry data sets and business events industry impacts
The research team developed an econometric model of the relationship between economic and travel-industry data sets and business events impacts to estimate business events activity in countries in which the business events industry has not been previously quantified. In addition to the data collected from existing business events impact studies, the table below summarizes the data we compiled to include in the modeling process.
Events Industry Council | Oxford Economics
Data description SourcesBusiness arrivals UNWTO (World Tourism Organization), various national statistical agencies
International business inbound travel spending IMF Balance of Payments
Domestic business travel spending Oxford Economics / WTTC (World Travel and Tourism Council)
GDP (gross domestic product) Haver Analytics, various national statistical agencies
Total population Haver Analytics, United Nations, various national statistical agencies
Per capita GDP Haver Analytics, United Nations, various national statistical agencies
Services industry gross output Various national statistical agencies, central banks, and ministries of finance
Whole economy gross output Various national statistical agencies, central banks, and ministries of finance
Data inputs for econometric model

Econometric model
22
The resulting model reflects the positive relationship between travel-industry measures and business events direct spending.
The resulting model reflects the relationship between travel-industry measures, such as estimated domestic and international business travel spending at the country level (based on Oxford Economics analysis for the World Travel and Tourism Council), and business events direct spending. Because studies of business events activity in more developed countries tend to show higher levels of activity relative to business travel spending, GDP per capita was also used in the model.
The resulting estimates show that business events spending tends to be correlated with broad economic activity. For example, the correlation between business events spending and economic activity as measured by GDP is shown in the accompanying chart.
Events Industry Council | Oxford Economics
0
1
2
3
4
5
6
4 5 6 7 8 9 10GDP (log)
Meetings direct spending (log)Business events direct spending and GDP by country
Source: Events Industry Council, Oxford Economics

Economic impact metrics
23
Secondary data sources were a critical part of the research.
After estimating direct business events spending based on existing impact studies and the econometric model, the research team estimated additional economic impact metrics utilizing the sources listed in the table below. For example, we used economic data on gross output and value added for both the whole economy and the travel industry to estimate direct GDP impacts for each country. In addition, we used multipliers from existing impact studies and travel and tourism multipliers maintained by Oxford Economics and WTTC to estimate the total economic impact of business events for each country.
Events Industry Council | Oxford Economics
Economic impact metric Estimation method and source
Economic impact metrics
Direct spending (direct output) Existing impact studiesEstimates from econometric model
Average spending per participant Existing impact studiesEstimates from econometric model
Total participants Existing impact studiesEstimates from econometric model
Direct GDP (gross domestic product) impactEstimates of direct spending (direct output)Economic data on whole economy & services industry gross output from national statistical agenciesEconomic data on whole economy & services industry value-added from national statistical agencies
Direct jobs
Existing impact studiesEstimates from econometric modelEconomic data on whole economy gross output from various national statistical agenciesTravel & tourism data & multipliers from Oxford Economics & WTTC (World Travel and Tourism Council)
Total economic impact, GDP, and jobs Existing impact studiesTravel & tourism data & multipliers from Oxford Economics & WTTC (World Travel and Tourism Council)

Conceptual framework
24
The conceptual framework is based on World Tourism Organization guidance.
The conceptual framework for this analysis is based on guidance developed by the World Tourism Organization, an agency of the United Nations (UNWTO).
The UNWTO has published guidance to support the measurement of the economic importance of meetings, which are synonymous with business events as referred to in this study.* This guidance includes the following definition of meetings (business events):
A meeting is a general term indicating the coming together of a number of people in one place, to confer or carry out a particular activity. The key purposes of meetings are to motivate participants and to conduct business. Frequency can be on an ad-hoc basis or according to a set pattern, as for instance annual general meetings, committee meetings, etc.
UNWTO’s Global Meetings Initiative further advised that the concept of a meeting (business event), as it pertains to the meetings (business events) sector, excludes social and economic activities such as formal education, purely recreational or political activities, and gathering of consumers or would-be customers. The UNWTO Global Meetings Initiative also advised that meetings (business events) under consideration must occur at contracted venues, and clarified that the term “meeting” should be understood to encompass the following three major areas of activity:
congresses, conventions, conferences and seminars; trade fairs and exhibitions; and, incentive activities.
Additionally, the UNWTO Global Meetings Initiative recommended that data be collected on all meetings (business events) with at least 10 participants, and that last for a minimum of four hours or half a day.
The UNWTO Global Meetings Initiative proposed the adoption of a strict definition of meetings participants as including meetings delegates and exhibitors, and excluding those strictly involved in the supply-side of business event production (e.g. staff of ancillary service providers). The Global Meetings Initiative also drew a distinction between meetings (business events) participants and persons who travel with the meeting participant (accompanying party).
In this global analysis, we have relied broadly on the headline measures of business events activity and participants as reported by each study. In situations in which we saw clear differences from the UNWTO guidance, we excluded specific country-level report metrics from the estimation process.
• World Tourism Organization. (2006) Measuring the Economic Importance of the Meetings Industry: a Tourism Satellite Account Extension. UNWTO/MPI/ICCA/Reed Travel Exhibitions.World Tourism Organization. (2008) Global Meetings Initiative, Volumes 1-3.
Events Industry Council | Oxford Economics

4. Industry comparisons

Comparison of industry output
26Events Industry Council | Oxford Economics
To put the size of the business events sector in context, we compared the sector’s direct output to the output of other global industries. These estimates are based on Oxford Economics’ analysis of industry output as reported by national statistical offices. We selected industries that are relevant for size comparisons, and which have relatively clear industry boundaries and descriptions.
As shown in the accompanying table, the business events direct spending is greater than the output of industries including medical/dental manufacturing, computers & office equipment, furniture manufacturing, and leather goods.
Industry comparisons: Direct output (business sales)Amounts in billions of dollars, 2017
Pharmaceuticals $1,765
Special purpose machinery $1,678
Paper & printing $1,570
Textiles $1,288
Beverages $1,225
Telecommunications equipment $1,121
Wood & w ood products $1,095
Business events sector $1,071Motors, generators & transformers $901
Medical/dental manufacturing $839
Repair & installation of machinery $741
Wearing apparel & furs $733
Precision & optical instruments $698
Computers & off ice equipment $680
Ships, rail, motorcycle & military vehicles $630
Furniture manufacturing $548
Printing & recorded media $523
Domestic appliances $490
Glass $469
Leather goods $428
Castings $413
Consumer electronics $407
Medical & surgical equipment $249
Machine tools $237
Agricultural machinery $132
Source: Oxford Economics (based on data from National Statistical Offices)

Comparison of the business events sector to world economies
27
The business event sector’s direct contribution to GDP of $621 billion ranks 22nd when compared to the national GDP of countries worldwide.
The business event sector’s total contribution to GDP of $1.5 trillion ranks 13th when compared to the national GDP of countries worldwide.
Events Industry Council | Oxford Economics
Industry comparisons: Direct GDP Industry comparisons: GDPAmounts in billions of dollars, 2017 Amounts in billions of dollars, 2017
Rank Country GDP Rank Country GDP
1 United States $19,391 1 United States $19,391
2 China $12,243 2 China $12,243
3 Japan $4,874 3 Japan $4,874
4 Germany $3,691 4 Germany $3,691
5 France $2,587 5 France $2,587
6 United Kingdom $2,536 6 United Kingdom $2,536
7 India $2,521 7 India $2,521
8 Brazil $2,055 8 Brazil $2,055
9 Italy $1,942 9 Italy $1,942
10 Canada $1,652 10 Canada $1,652
11 Russia 1577.51 11 Russia $1,578
12 South Korea $1,530 12 South Korea $1,530
13 Australia $1,379 13 Business events sector (total GDP impact) $1,496
14 Spain $1,321 14 Australia $1,379
15 Mexico $1,152 15 Spain $1,321
16 Indonesia $1,016 16 Mexico $1,152
17 Turkey $851 17 Indonesia $1,016
18 Netherlands $829 18 Turkey $851
19 Saudi Arabia $684 19 Netherlands $829
20 Switzerland $679 20 Saudi Arabia $684
21 Argentina $637 21 Switzerland $679
22 Business events sector (direct GDP impact) $621 22 Argentina $637
23 Sweden $539 23 Sweden $539
24 Poland $524 24 Poland $524
25 Belgium $494 25 Belgium $494
Source: Oxford Economics (based on data from National Statistical Offices)

Acknowledgements
In partnership with
29

Acknowledgements
30
Events Industry Council Research Committee
Cathy Breden, International Association of Exhibitions and Events (Chair)Mark Cooper, IACCVicki Crews-Anderson, Financial and Insurance Conference ProfessionalsNancy Drapeau, Center for Exhibition Industry ResearchJamie Faulkner-Mageau, U.S. Travel AssociationSharon Moss, ASAE & The Center for Association LeadershipMeredith Rollins, PCMA FoundationPaul Van Deventer, Meeting Professionals InternationalMelissa Van Dyke, Incentive Research Foundation Andreas Weissenborn, Destinations International
Events Industry Council Board of Directors
Tina Wehmeir, AMC Institute (Chair)Cathy Breden, International Association of Exhibitions and Events Kim Gishler, Corporate Event Marketers AssociationKimberly Miles, American Hotel & Lodging AssociationSusan Robertson, ASAE & the Center for Association LeadershipPaul Van Deventer, Meeting Professionals InternationalDon Welsh, Destinations International

EIC Members
31
Events Industry Council (EIC) MembersAMC Institute
American Hotel & Lodging Association
ASAE & The Center for Association Leadership
Association of Collegiate Conference and Events Directors International
Association of Destination Management Executives International
Convention Sales Professionals International
Corporate Event Marketing Association
Destinations International
Event Service Professionals Association
Exhibition Services & Contractors Association
Federación de Entidades Organizadoras de Congresos y Afines de América Latina
Financial & Insurance Conference Professionals
Hospitality Sales & Marketing Association International
IACC
Incentive Research Foundation
International Association of Exhibitions and Events
International Association of Professional Congress Organisers
International Association of Speakers Bureaus
International Association of Venue Managers
International Congress and Convention Association
International Live Events Association
Meeting Professionals International
National Association for Catering and Events
National Coalition of Black Meeting Planners
National Speakers Association
Professional Convention Management Association
Religious Conference Management Association
Society for Incentive Travel Excellence
Society of Government Meeting Planners
Society of Independent Show Organizers
South African Association for the Conference Industry
US Travel Association
Events Industry Council | Oxford Economics

32
About Events Industry CouncilThe Events Industry Council’s more than 30 member organisations represent over 103,500 individuals and 19,500 firms and properties involved in the events industry. The Events Industry Council promotes high standards and professionalism in the events industry with the Certified Meeting Professional (CMP) and four signature programmes – Sustainability, Industry Insights, Knowledge and Leadership—and supports research to educate on the profound economic impact of business events. Learn more at www.eventscouncil.org.
About Oxford EconomicsOxford Economics was founded in 1981 as a commercial venture with Oxford University’s business college to provide economic forecasting and modelling to UK companies and financial institutions expanding abroad. Since then, we have become one of the world’s foremost independent global advisory firms, providing reports, forecasts and analytical tools on 200 countries, 100 industrial sectors and over 3,000 cities.
Headquartered in Oxford, England, with regional centres in London, New York, and Singapore, Oxford Economics has offices across the globe. We employ over 200 full-time people, including more than 130 professional economists, industry experts and business editors—one of the largest teams of macroeconomists and thought leadership specialists.
Copyright © 2018 Events Industry Council. All rights reserved.