global economic outlook - sifm.org · u.s. outlook: no more fat pitches june 2019 constance l....
TRANSCRIPT

U.S. Outlook: No More Fat Pitches June 2019
Constance L. Hunter, CBEChief Economist @[email protected]
KPMG Economics
2© 2018 KPMG LLP, a Delaware limited liability partnership and the U.S. member firm of the KPMG network of independent member firms affiliated with KPMG International Cooperative (“KPMG International”), a Swiss entity. All rights reserved.
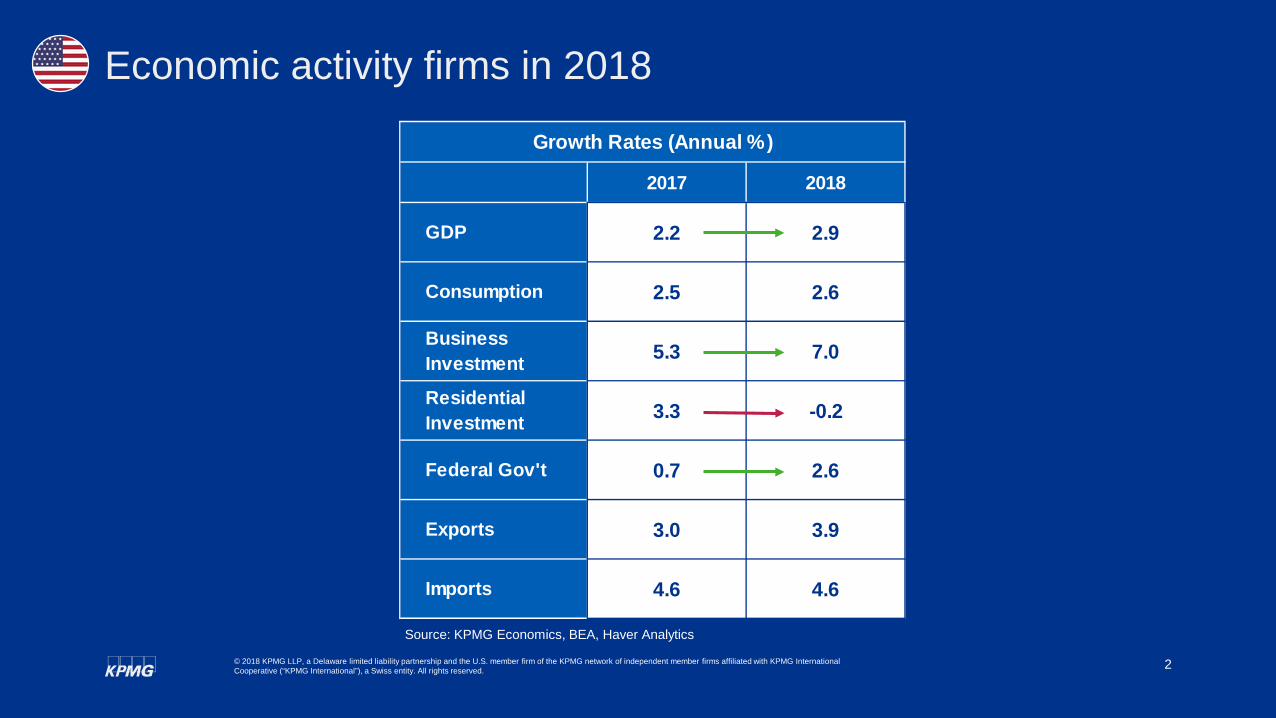
Economic activity firms in 2018
Source: KPMG Economics, BEA, Haver Analytics
2017 2018
GDP 2.2 2.9
Consumption 2.5 2.6
Business Investment 5.3 7.0
Residential Investment 3.3 -0.2
Federal Gov't 0.7 2.6
Exports 3.0 3.9
Imports 4.6 4.6
Growth Rates (Annual %)

3© 2019 KPMG LLP, a Delaware limited liability partnership and the U.S. member firm of the KPMG network of independent member firms affiliated with KPMG International Cooperative (“KPMG International”), a Swiss entity. All rights reserved.
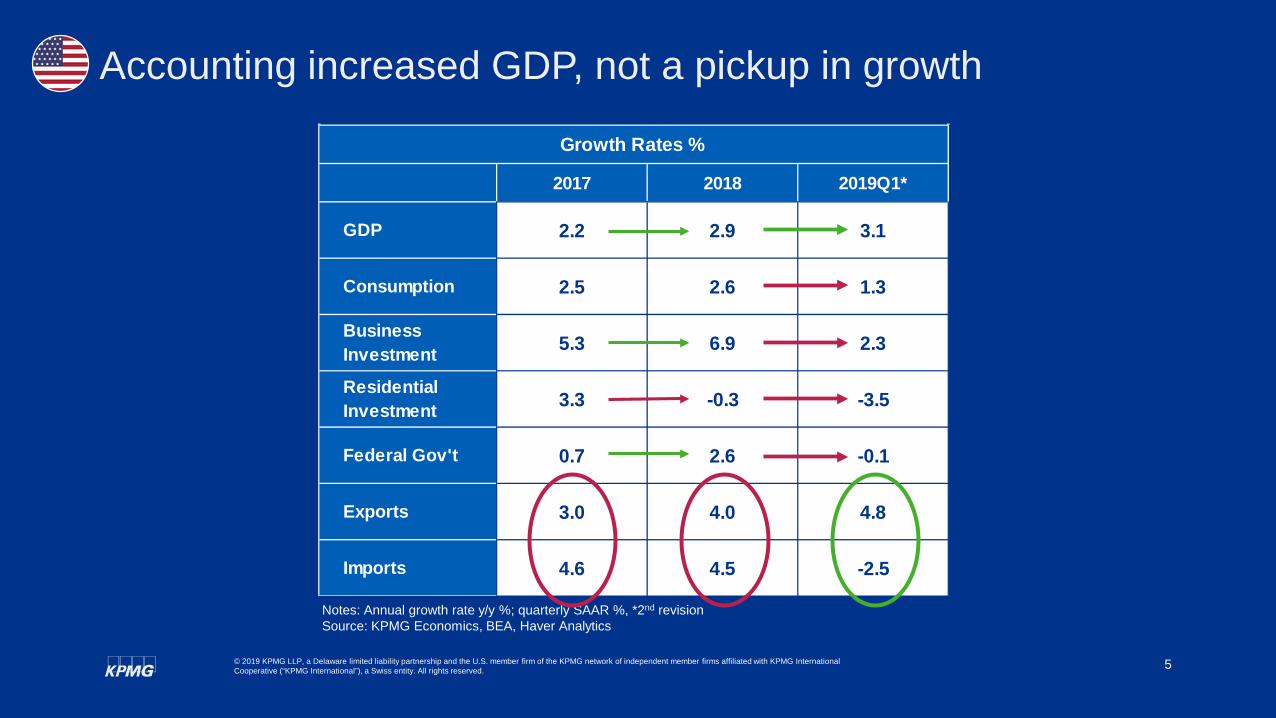
2017 2018 2019Q1*
GDP 2.2 2.9 3.1
Consumption 2.5 2.6 1.3
Business Investment 5.3 6.9 2.3
Residential Investment 3.3 -0.3 -3.5
Federal Gov't 0.7 2.6 -0.1
Exports 3.0 4.0 4.8
Imports 4.6 4.5 -2.5
Growth Rates %
Slower growth in Q1 2019 despite headline number
Notes: Annual growth rate y/y %; quarterly SAAR %, *2nd revisionSource: KPMG Economics, BEA, Haver Analytics

4© 2019 KPMG LLP, a Delaware limited liability partnership and the U.S. member firm of the KPMG network of independent member firms affiliated with KPMG International Cooperative (“KPMG International”), a Swiss entity. All rights reserved.
Notes: Annual growth rate y/y %; quarterly SAAR %, *2nd revisionSource: KPMG Economics, BEA, Haver Analytics
2017 2018 2019Q1*
GDP 2.2 2.9 3.1
Consumption 2.5 2.6 1.3
Business Investment 5.3 6.9 2.3
Residential Investment 3.3 -0.3 -3.5
Federal Gov't 0.7 2.6 -0.1
Exports 3.0 4.0 4.8
Imports 4.6 4.5 -2.5
Growth Rates %
Trade developments added to GDP but are not good news
5© 2019 KPMG LLP, a Delaware limited liability partnership and the U.S. member firm of the KPMG network of independent member firms affiliated with KPMG International Cooperative (“KPMG International”), a Swiss entity. All rights reserved.
Notes: Annual growth rate y/y %; quarterly SAAR %, *2nd revisionSource: KPMG Economics, BEA, Haver Analytics
2017 2018 2019Q1*
GDP 2.2 2.9 3.1
Consumption 2.5 2.6 1.3
Business Investment 5.3 6.9 2.3
Residential Investment 3.3 -0.3 -3.5
Federal Gov't 0.7 2.6 -0.1
Exports 3.0 4.0 4.8
Imports 4.6 4.5 -2.5
Growth Rates %
Accounting increased GDP, not a pickup in growth
6© 2019 KPMG LLP, a Delaware limited liability partnership and the U.S. member firm of the KPMG network of independent member firms affiliated with KPMG International Cooperative (“KPMG International”), a Swiss entity. All rights reserved.
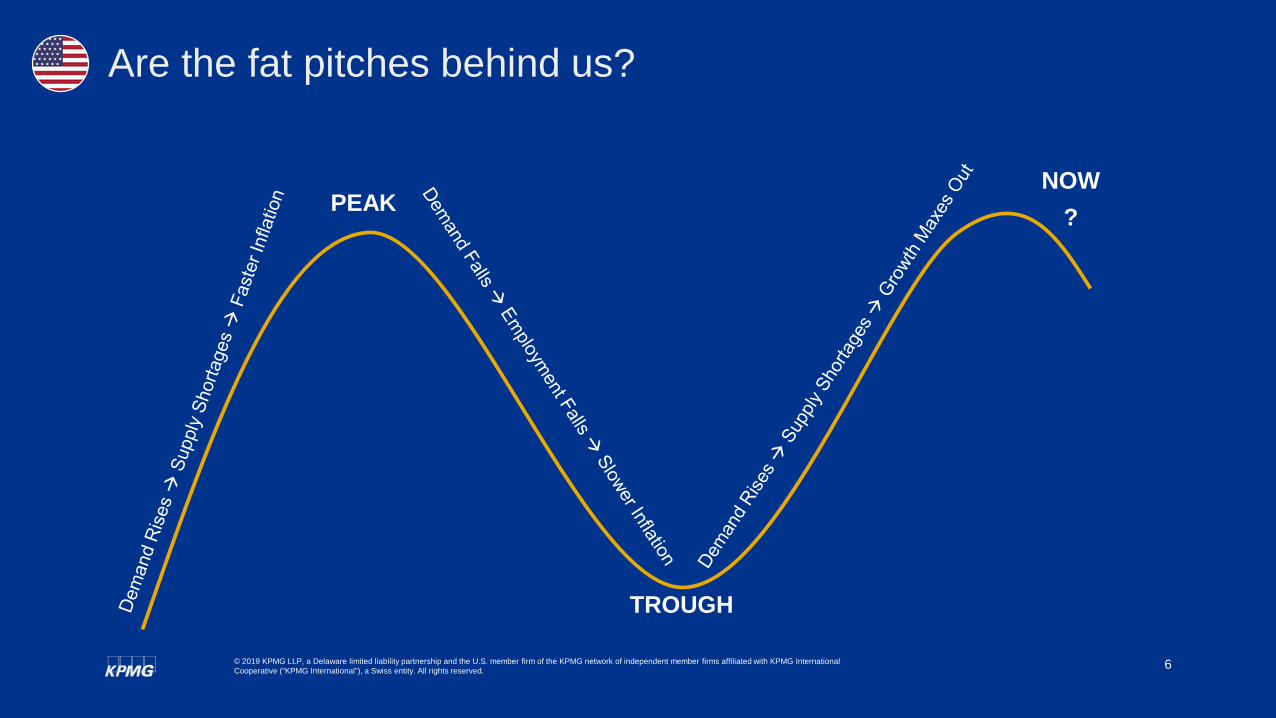
Are the fat pitches behind us?
PEAK
TROUGH
NOW?

7© 2019 KPMG LLP, a Delaware limited liability partnership and the U.S. member firm of the KPMG network of independent member firms affiliated with KPMG International Cooperative (“KPMG International”), a Swiss entity. All rights reserved.
Bond market signaling a recession is on the way
Recession
Source: KPMG Economics, Federal Reserve Board (June 7, 2019), Haver Analytics
8© 2019 KPMG LLP, a Delaware limited liability partnership and the U.S. member firm of the KPMG network of independent member firms affiliated with KPMG International Cooperative (“KPMG International”), a Swiss entity. All rights reserved.
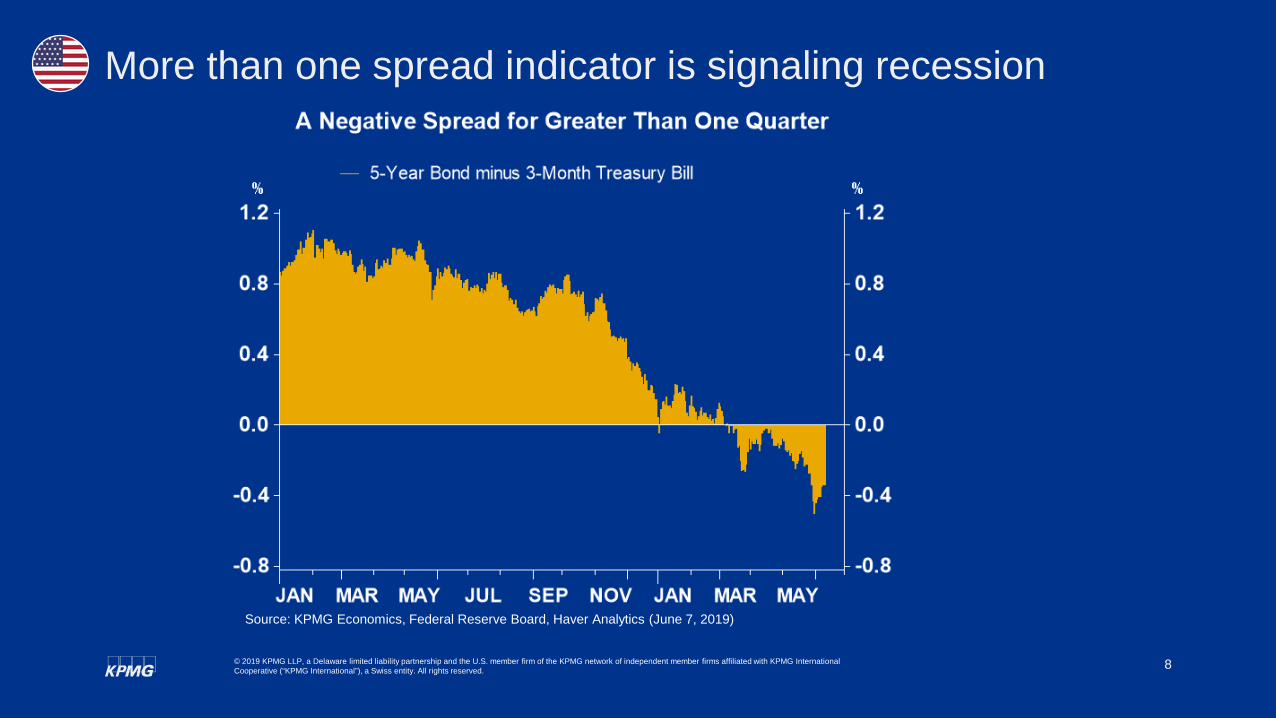
More than one spread indicator is signaling recession
Source: KPMG Economics, Federal Reserve Board, Haver Analytics (June 7, 2019)
9© 2019 KPMG LLP, a Delaware limited liability partnership and the U.S. member firm of the KPMG network of independent member firms affiliated with KPMG International Cooperative (“KPMG International”), a Swiss entity. All rights reserved.
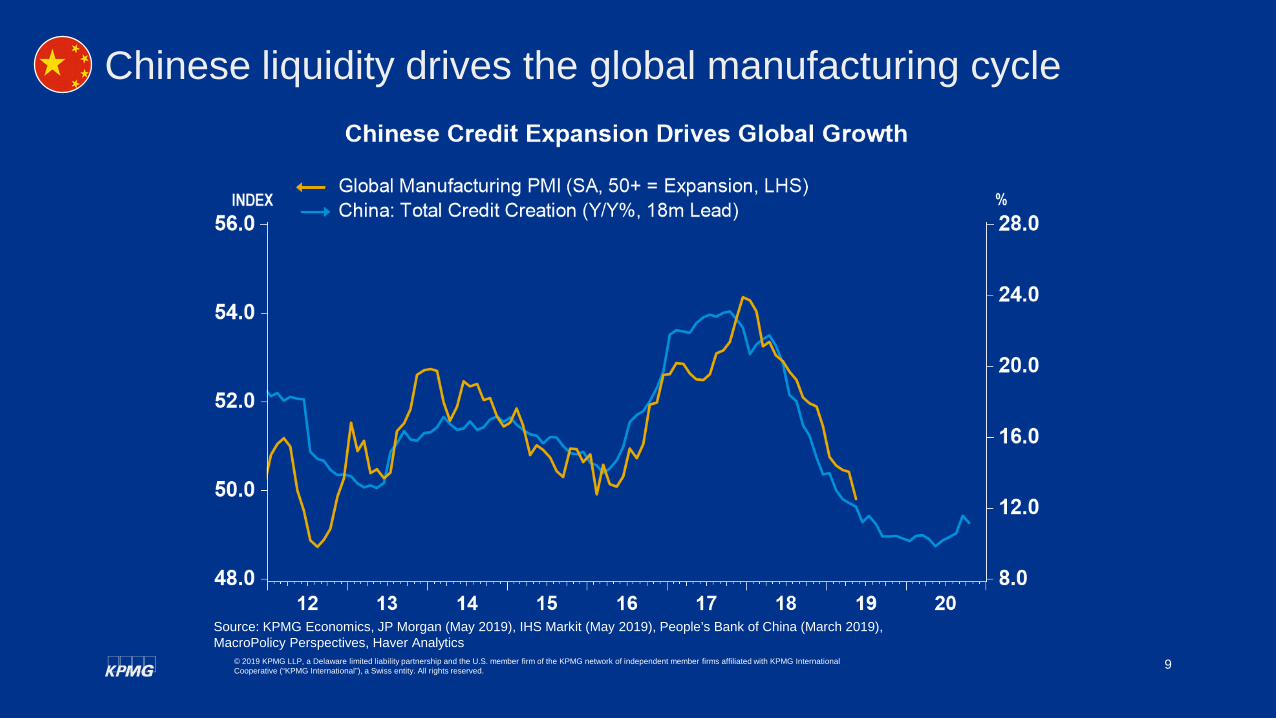
Chinese liquidity drives the global manufacturing cycle
Source: KPMG Economics, JP Morgan (May 2019), IHS Markit (May 2019), People’s Bank of China (March 2019), MacroPolicy Perspectives, Haver Analytics

10© 2019 KPMG LLP, a Delaware limited liability partnership and the U.S. member firm of the KPMG network of independent member firms affiliated with KPMG International Cooperative (“KPMG International”), a Swiss entity. All rights reserved.
The global manufacturing cycle is under stress
PMIDeveloped Markets Sep-18 Oct-18 Nov-18 Dec-18 Jan-19 Feb-19 Mar-19 Apr-19 May-19Australia 54.0 54.5 54.6 54.0 53.9 52.9 52.0 50.9 51.0Canada 54.8 53.9 54.9 53.6 53.0 52.6 50.5 49.7 49.1France 52.5 51.2 50.8 49.7 51.2 51.5 49.7 50.0 50.6Germany 53.7 52.2 51.8 51.5 49.7 47.6 44.1 44.4 44.3Greece 53.6 53.1 54.0 53.8 53.7 54.2 54.7 56.6 54.2Ireland 56.3 54.9 55.4 54.5 52.6 54.0 53.9 52.5 50.4Italy 50.0 49.2 48.6 49.2 47.8 47.7 47.4 49.1 49.7Japan 52.5 52.9 52.2 52.6 50.3 48.9 49.2 50.2 49.8Korea 51.3 51.0 48.6 49.8 48.3 47.2 48.8 50.2 48.4Spain 51.4 51.8 52.6 51.1 52.4 49.9 50.9 51.8 50.1UK 53.7 51.1 53.3 54.3 52.8 52.1 55.1 53.1 49.4US 55.6 55.7 55.3 53.8 54.9 53.0 52.4 52.6 50.5Emerging MarketsChina 50.0 50.1 50.2 49.7 48.3 49.9 50.8 50.2 50.2Brazil 50.9 51.1 52.7 52.6 52.7 53.4 52.8 51.5 50.2India 52.2 53.1 54.0 53.2 53.9 54.3 52.6 51.8 52.7Mexico 51.7 50.7 49.7 49.7 50.9 52.6 49.8 50.1 50.0Source: KPMG Economics, IHS Markit (May 2019), Haver Analytics

11© 2019 KPMG LLP, a Delaware limited liability partnership and the U.S. member firm of the KPMG network of independent member firms affiliated with KPMG International Cooperative (“KPMG International”), a Swiss entity. All rights reserved.
Slow car sales suggests a weaker consumer in the EU
Source: KPMG Economics, Verban der Automobilindustrie (May 2019), Asociacion Espanola de Fabricanes de Automoviles y Camiones (April 2019), Associazione Nazionale Fra Industrie Automobilistiche (April 2019), Haver Analytics
12© 2019 KPMG LLP, a Delaware limited liability partnership and the U.S. member firm of the KPMG network of independent member firms affiliated with KPMG International Cooperative (“KPMG International”), a Swiss entity. All rights reserved.
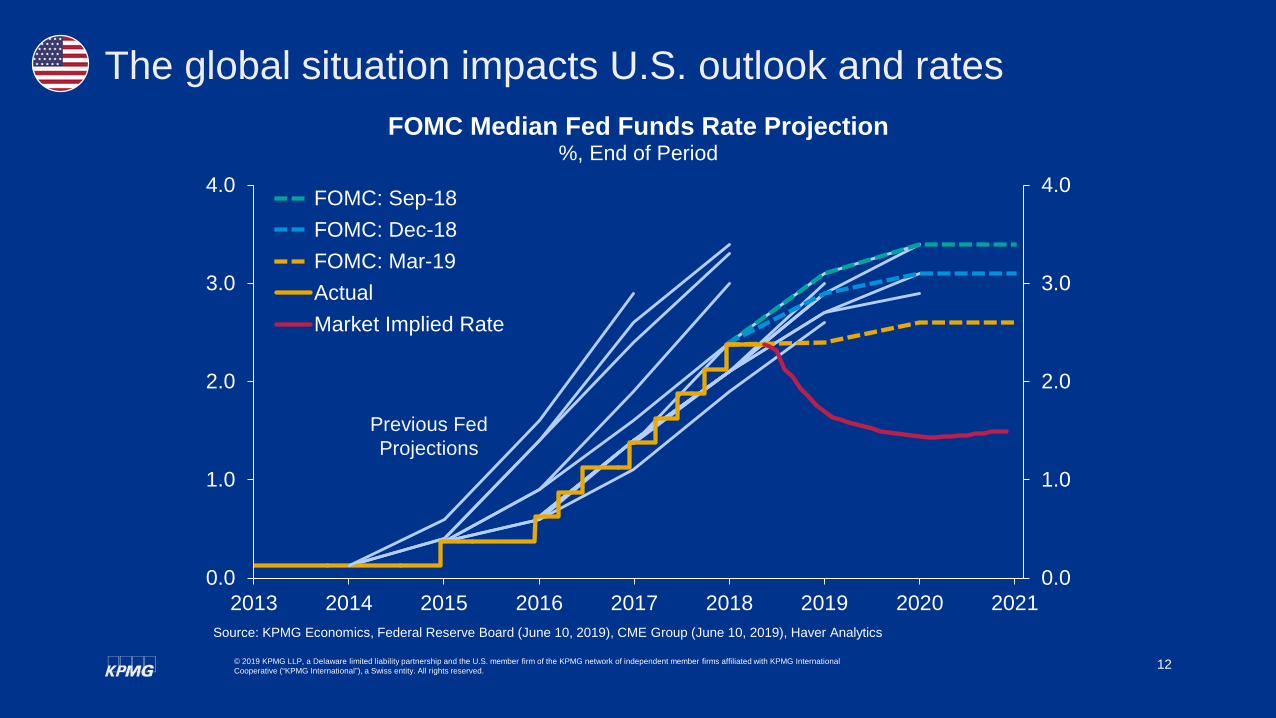
The global situation impacts U.S. outlook and rates
0.0
1.0
2.0
3.0
4.0
0.0
1.0
2.0
3.0
4.0
2013 2014 2015 2016 2017 2018 2019 2020 2021
FOMC Median Fed Funds Rate Projection%, End of Period
FOMC: Sep-18FOMC: Dec-18FOMC: Mar-19ActualMarket Implied Rate
Source: KPMG Economics, Federal Reserve Board (June 10, 2019), CME Group (June 10, 2019), Haver Analytics
Previous Fed Projections
13© 2019 KPMG LLP, a Delaware limited liability partnership and the U.S. member firm of the KPMG network of independent member firms affiliated with KPMG International Cooperative (“KPMG International”), a Swiss entity. All rights reserved.
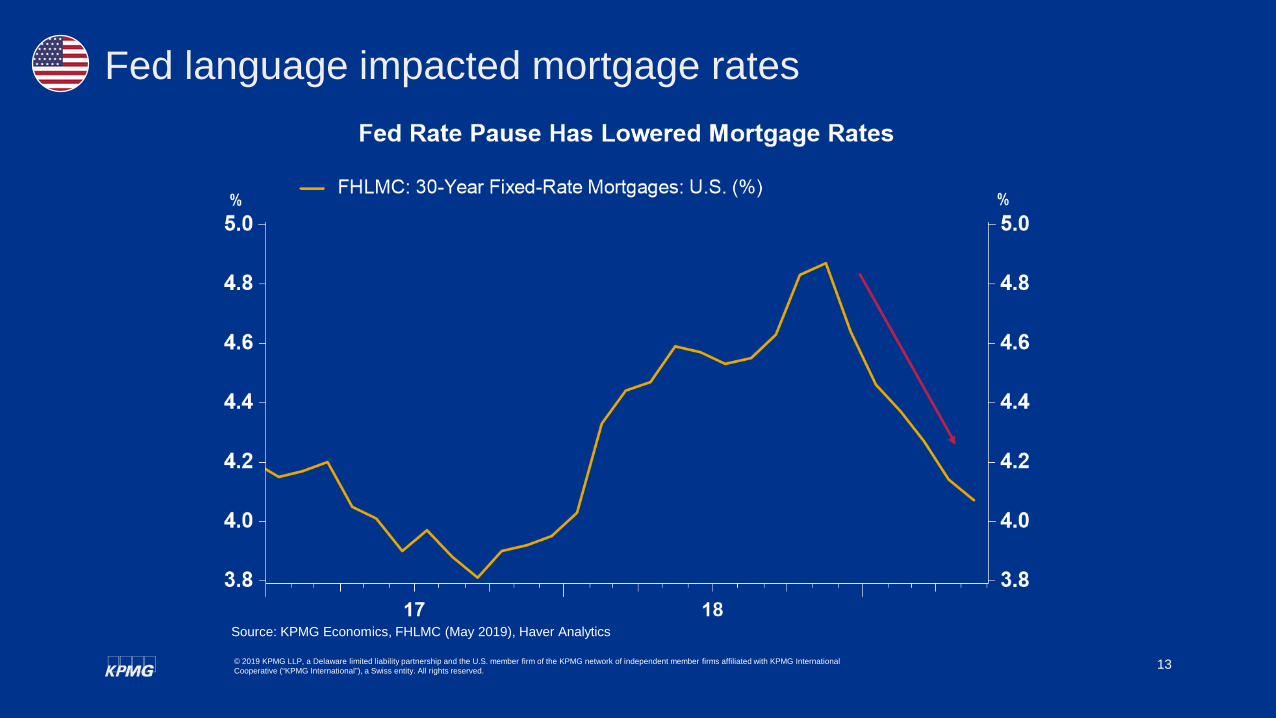
Fed language impacted mortgage rates
Source: KPMG Economics, FHLMC (May 2019), Haver Analytics
14© 2019 KPMG LLP, a Delaware limited liability partnership and the U.S. member firm of the KPMG network of independent member firms affiliated with KPMG International Cooperative (“KPMG International”), a Swiss entity. All rights reserved.
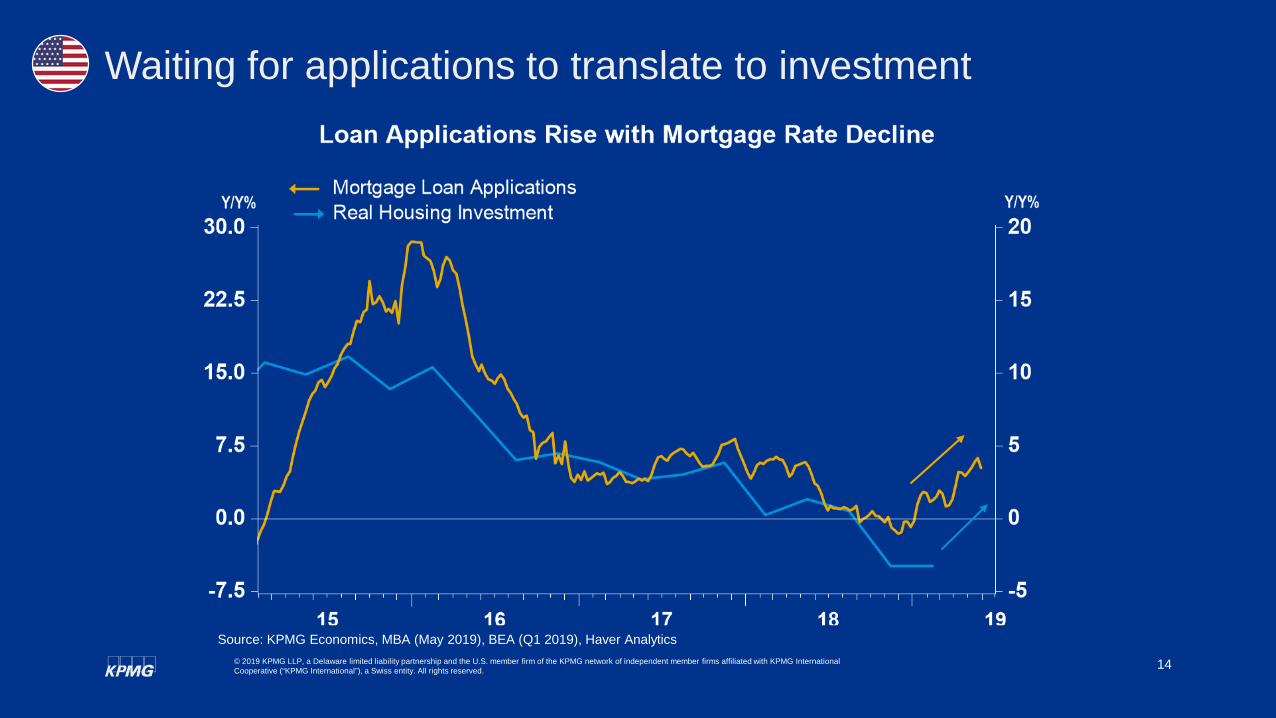
Waiting for applications to translate to investment
Source: KPMG Economics, MBA (May 2019), BEA (Q1 2019), Haver Analytics
15© 2019 KPMG LLP, a Delaware limited liability partnership and the U.S. member firm of the KPMG network of independent member firms affiliated with KPMG International Cooperative (“KPMG International”), a Swiss entity. All rights reserved.
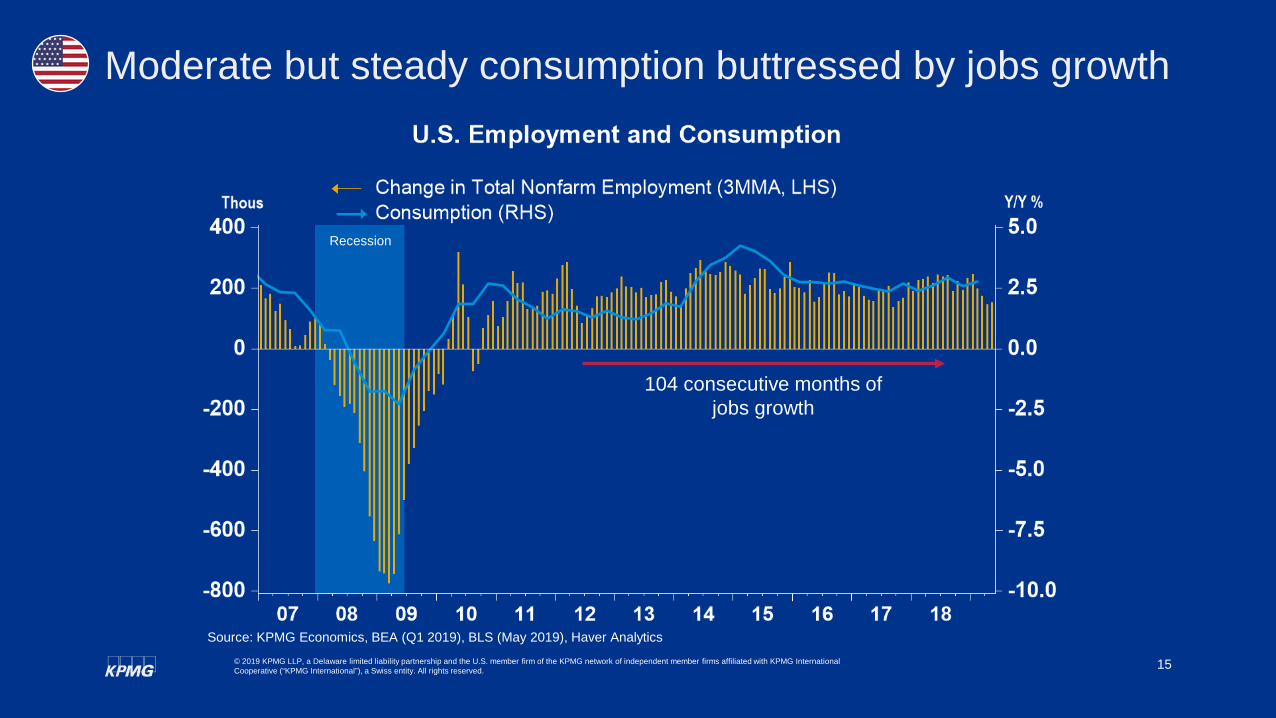
Moderate but steady consumption buttressed by jobs growth
Recession
104 consecutive months of jobs growth
Source: KPMG Economics, BEA (Q1 2019), BLS (May 2019), Haver Analytics

16© 2019 KPMG LLP, a Delaware limited liability partnership and the U.S. member firm of the KPMG network of independent member firms affiliated with KPMG International Cooperative (“KPMG International”), a Swiss entity. All rights reserved.
Inflation persistently low despite long expansion and jobs growth
Recession Target Rate
Source: KPMG Economics, Bureau of Economic Analysis (May 2019), Haver AnalyticsNote: Core PCE Index is smoothed using a 3-month moving average of the year to year growth rate
17
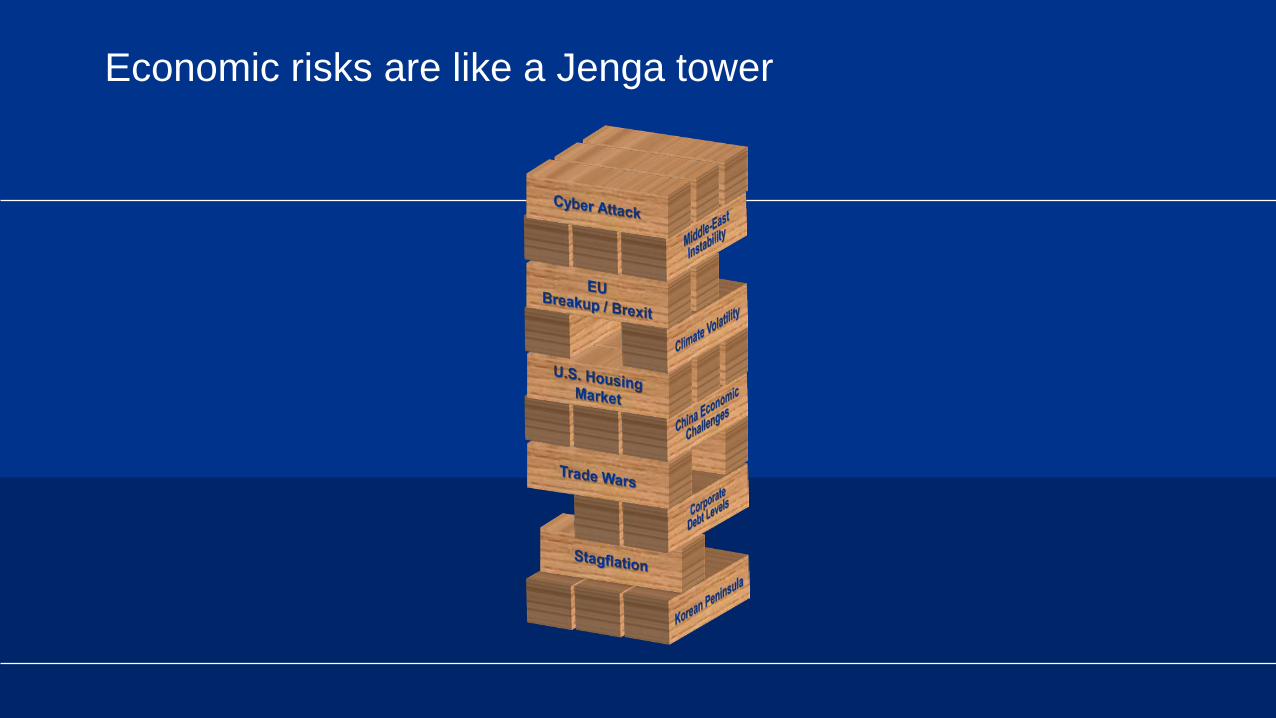
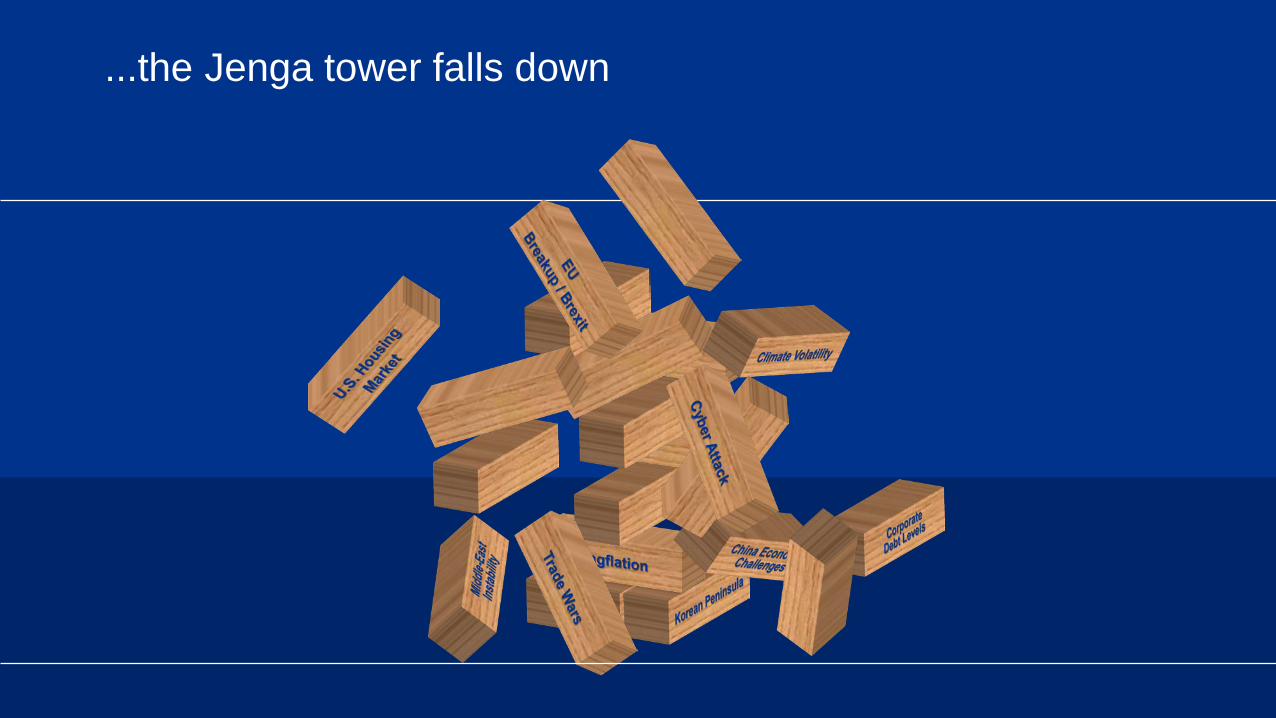
Economic risks are like a Jenga tower
18
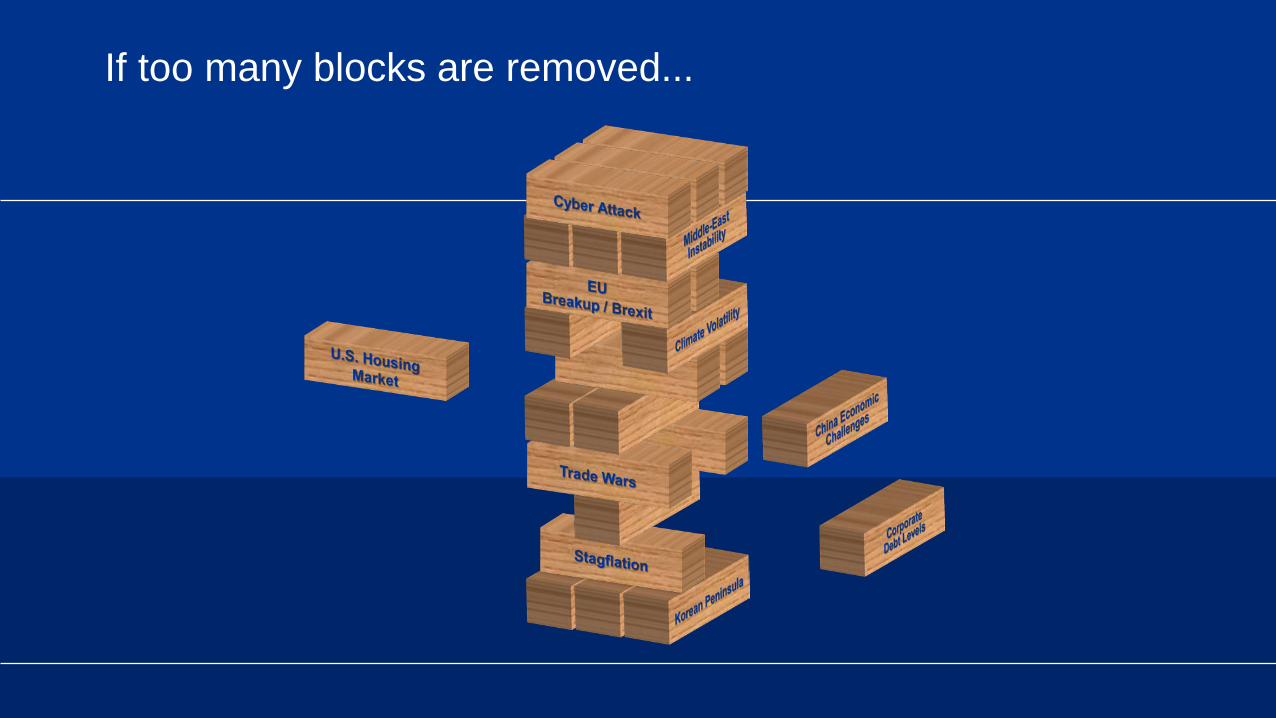
If too many blocks are removed...
19
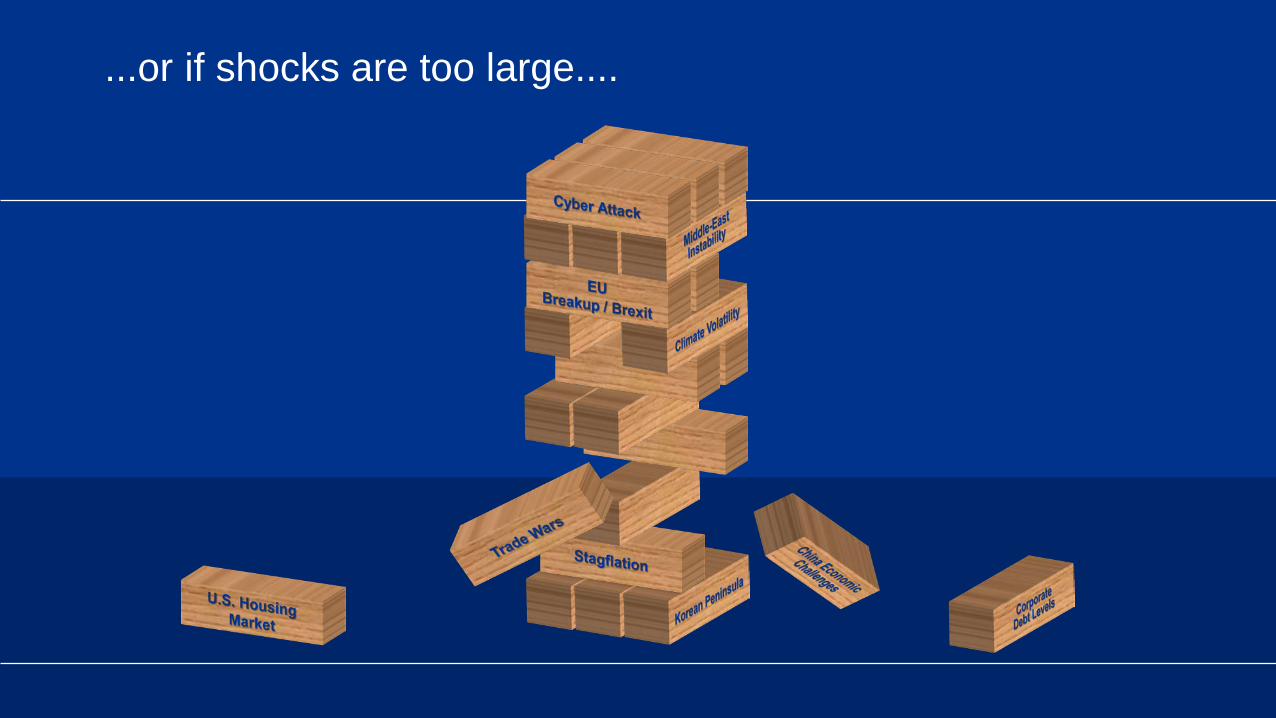
...or if shocks are too large....
20
...the Jenga tower falls down

21© 2019 KPMG LLP, a Delaware limited liability partnership and the U.S. member firm of the KPMG network of independent member firms affiliated with KPMG International Cooperative (“KPMG International”), a Swiss entity. All rights reserved.
-1
0
1
2
3
4
5
2016 2017 2018 2019 2020
%
Real GDP% Change, Annual Rate
Soft Landing Mild Recession
Historical Data Forecast
Near term growth outlook – a tale of two scenarios
Source: KPMG Economics, Macroeconomic Advisers by IHS (April 2019), BEA (Q1 2019)Note: Real GDP is GDP adjusted for inflation; Real GDP reported at a seasonally adjusted annualized rate

22© 2019 KPMG LLP, a Delaware limited liability partnership and the U.S. member firm of the KPMG network of independent member firms affiliated with KPMG International Cooperative (“KPMG International”), a Swiss entity. All rights reserved.
Consumption can keep growing during normal recessions
Source: KPMG Economics, BEA (Q1 2019), Haver Analytics

23© 2019 KPMG LLP, a Delaware limited liability partnership and the U.S. member firm of the KPMG network of independent member firms affiliated with KPMG International Cooperative (“KPMG International”), a Swiss entity. All rights reserved.
Consumption has changed with millennial influences
Source: KPMG Economics, BEA (Q1-2019), UN Population Statistics, Haver Analytics
24© 2019 KPMG LLP, a Delaware limited liability partnership and the U.S. member firm of the KPMG network of independent member firms affiliated with KPMG International Cooperative (“KPMG International”), a Swiss entity. All rights reserved.
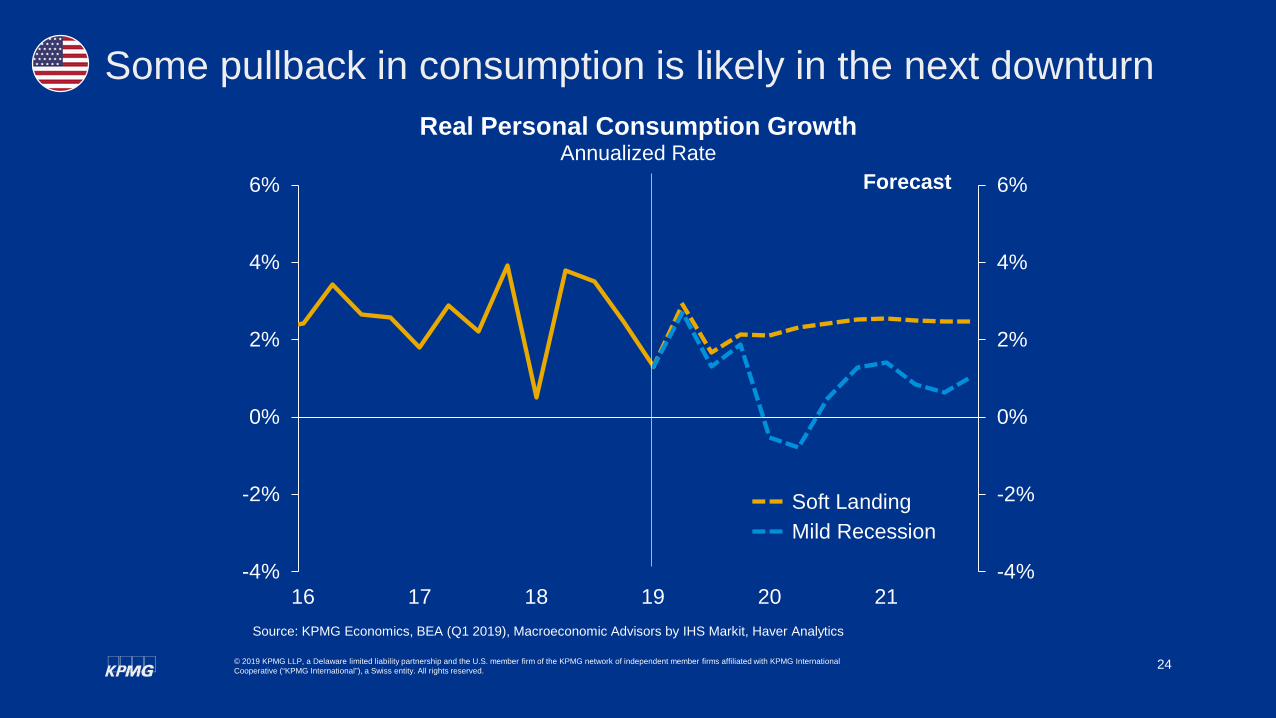
Some pullback in consumption is likely in the next downturn
-4%
-2%
0%
2%
4%
6%
-4%
-2%
0%
2%
4%
6%
16 17 18 19 20 21
Real Personal Consumption GrowthAnnualized Rate
Soft LandingMild Recession
Forecast
Source: KPMG Economics, BEA (Q1 2019), Macroeconomic Advisors by IHS Markit, Haver Analytics
25© 2019 KPMG LLP, a Delaware limited liability partnership and the U.S. member firm of the KPMG network of independent member firms affiliated with KPMG International Cooperative (“KPMG International”), a Swiss entity. All rights reserved.
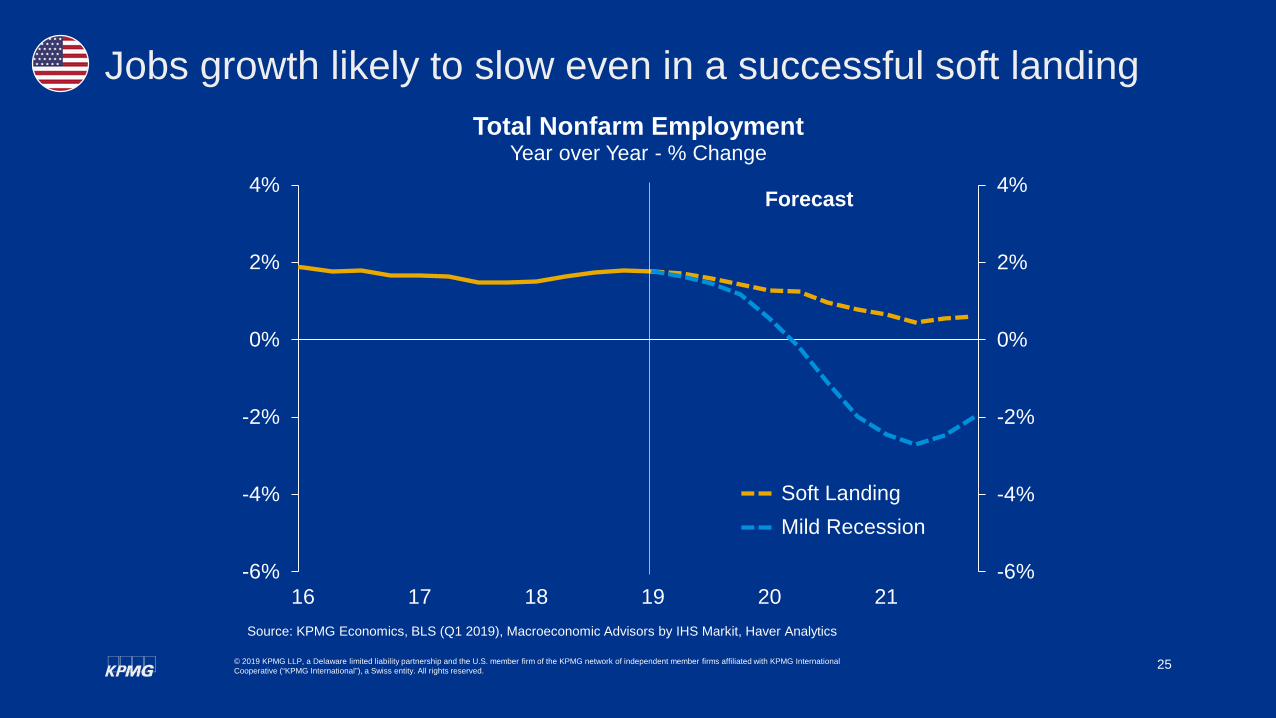
Jobs growth likely to slow even in a successful soft landing
-6%
-4%
-2%
0%
2%
4%
-6%
-4%
-2%
0%
2%
4%
16 17 18 19 20 21
Total Nonfarm EmploymentYear over Year - % Change
Soft LandingMild Recession
Forecast
Source: KPMG Economics, BLS (Q1 2019), Macroeconomic Advisors by IHS Markit, Haver Analytics

26© 2019 KPMG LLP, a Delaware limited liability partnership and the U.S. member firm of the KPMG network of independent member firms affiliated with KPMG International Cooperative (“KPMG International”), a Swiss entity. All rights reserved.
• A slowdown in growth is likely even with a soft landing
• A normal business cycle recession is not as severe as 2008/2009
• A dip in consumption is to be expected
• A decline in jobs growth will impact the insurance industry
• Rates are unlikely to rise until after the trough of the next recession
Concluding Thoughts

Thank you
© 2019 KPMG LLP, a Delaware limited liability partnership and the U.S. member firm of the KPMG network of independent member firms affiliated with KPMG International Cooperative (“KPMG International”), a Swiss entity. All rights reserved.
The KPMG name and logo are registered trademarks or trademarks of KPMG International.
The information contained herein is of a general nature and is not intended to address the circumstances of any particular individual or entity. Although we endeavor to provide accurate and timely information, there can be no guarantee that such information is accurate as of the date it is received or that it will continue to be accurate in the future. No one should act on such information without appropriate professional advice after a thorough examination of the particular situation.
kpmg.com/socialmedia
Some or all of the services described herein may not be permissible for KPMG audit clients and their affiliates.