global economic outlook - finance.si -
TRANSCRIPT

GLOBAL ECONOMIC OUTLOOK
GRZEGORZ SIELEWICZEconomist Central & Eastern Europe
Country Risk Conference
Ljubljana, 5th June 2019

INDUSTRY IN THE EUROZONE: THE END OF A VERY LONG EXPANSION CYCLE
COFACE, THE MOST AGILE GLOBAL TRADE CREDIT PARTNER IN THE INDUSTRY2
Euro Area: Industrial Production(3 month moving average, year-over-year change in percent)
-25%
-20%
-15%
-10%
-5%
0%
5%
10%
15%
1992 1994 1996 1998 2000 2002 2004 2006 2008 2010 2012 2014 2016 2018
growth period industrial production
60 months22
months56
months27
months30
months25
months
Source: Eurostat, Datastream, Coface

GLOOMY OUTLOOK IN BUSINESS SURVEYS
COFACE, THE MOST AGILE GLOBAL TRADE CREDIT PARTNER IN THE INDUSTRY3
Business confidence (Manufacturing Purchasing Manager Index in points)
Source: Markit

COFACE. THE MOST AGILE GLOBAL TRADE CREDIT PARTNER IN THE INDUSTRY4
UK: POLITICAL UNCERTAINTIES AFFECT BUSINESSES
19,485
17,709
16,293
14,58814,716 14,631
16,090
-12%
-9%
-6%
-3%
0%
3%
6%
9%
12%
11,000
12,000
13,000
14,000
15,000
16,000
17,000
18,000
19,000
20,000
2012 2013 2014 2015 2016 2017 2018
Company insolvencies
Underlying company insolvencies
Growth (rhs)
Source: Insolvency Service's National Statistics
-2%
1%
9%
12%
18%
24%
10%
-5% 0% 5% 10% 15% 20% 25% 30%
Manufacturing
ICT
Retail trade
Construction
Food services
Personal services (excl. foodservices)
Total insolvencies
Growth in insolvencies in 2018
Source: Insolvency Service's National Statistics
5
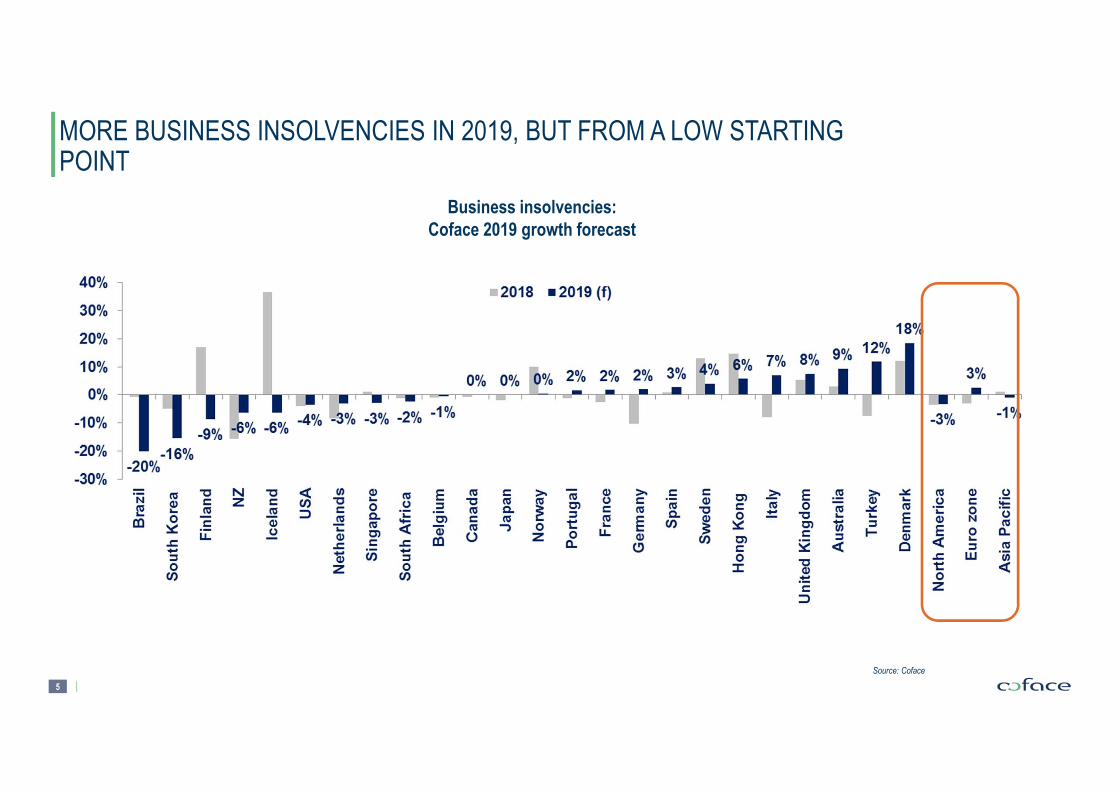
MORE BUSINESS INSOLVENCIES IN 2019, BUT FROM A LOW STARTING POINT
Business insolvencies:
Coface 2019 growth forecast
Source: Coface

6
UNITED STATES: BUSINESS INVESTMENT WILL SLOW DOWN IN A LESS FAVOURABLE FISCAL AND EXTERNAL ENVIRONMENT
43
45
47
49
51
53
55
57
59
61
63
65
67
69
2016 2017 2018 2019
ISM Manufacturing PMI
New orders New export orders Manufacturing PMI
Source: ISM
2.2%
1.8%
2.5%
2.9%
1.4%
2.2%
2.9%
2.5%
-2%
-1%
0%
1%
2%
3%
4%
2012 2013 2014 2015 2016 2017 2018 2019f
Contribution to GDP growth
Household consumption Government spending
GFCG Net exports
Inventories GDP
Sources: BEA,Coface forecast

7
PROTECTIONISM AND THE INDUSTRY CYCLE BOTH CAUSE GLOBAL TRADE DOWNTURN
Emerging markets: GDP growth tracker
(quarter on quarter SAAR, %)
World trade
(year on year % change)
Sources: IIF, Coface
f: forecast
Source: Coface
-8
-6
-4
-2
0
2
4
6
8
10
12
2007
2008
2009
2010
2011
2012
2013
2014
2015
2016
2017
2018

COFACE, THE MOST AGILE GLOBAL TRADE CREDIT PARTNER IN THE INDUSTRY8
EMERGING MARKETS – RISK #1: RISING CORPORATE CREDIT RISK IN CHINA
Coface’s Corporate Payment Survey:
China’s GDP growth will increase in 2019
China: Coface Corporate Payment Survey
(credit terms, number of days)
Sources: Bloomberg, Coface Source: Coface
60
55
5957 56
68
76
86
40
60
80
100
2011 2012 2013 2014 2015 2016 2017 2018

COFACE, THE MOST AGILE GLOBAL TRADE CREDIT PARTNER IN THE INDUSTRY9
EMERGING MARKETS – RISK #2: CAPITAL FLOWS AND EXTERNAL VULNERABILITY
-30
-20
-10
0
10
20
30
40
50
60
70
01/0
1/15
01/0
1/16
01/0
1/17
01/0
1/18
01/0
1/19
Net non-resident purchases of EM stocks and bonds (in USD bn, source: IIF)
Local currency versus USD (YTD in %, 17 May 2019, source: Reuters)

COFACE, THE MOST AGILE GLOBAL TRADE CREDIT PARTNER IN THE INDUSTRY10
EMERGING MARKETS – RISK #3: OIL PRICES
157%
118%
9%
261%
114%
57%
154%
64%
125%
Angola Kuwait Nigeria SaudiArabia
UAE Russia OPEC Non-OPEC10
Total
Compliance to 2019 output deal(in % of pledged cut)
Source: OPEC, IEA, Coface
0,0
0,5
1,0
1,5
2,0
2,5
3,0
Mb/
d
OPEC: Unplanned production outages
Source: EIA
11
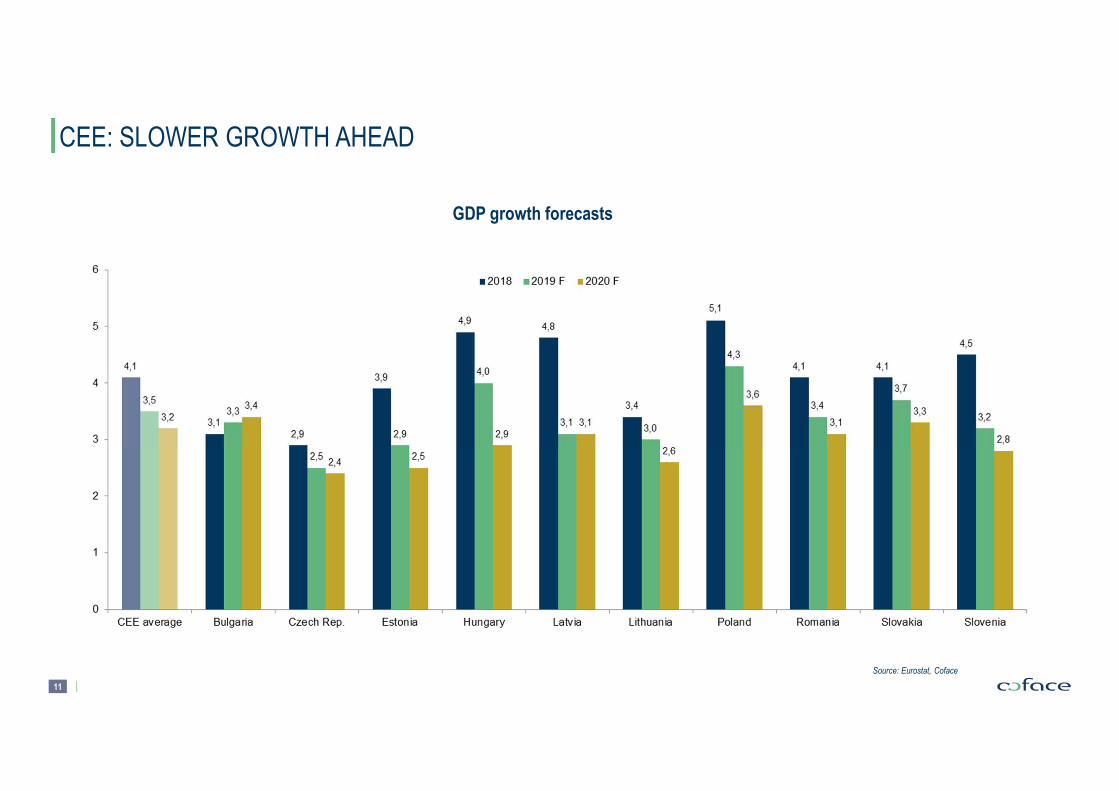
CEE: SLOWER GROWTH AHEAD
GDP growth forecasts
Source: Eurostat, Coface

12
CEE: HOUSEHOLD CONSUMPTION REMAINS GROWTH DRIVER
Source: Eurostat
Labour shortages as a factor
limiting the production (business survey)
Unemployment rate (%)
Source: Eurostat

13
WHO’S AFRAID OF GLOBAL SLOWDOWN?
Exports of goods and services as % of GDP (%, 2018)
Source: Eurostat

14
RUSSIA: WEAK ECONOMIC ACTIVITY
Source: Rostat
Industrial production (y/y changes)Dynamics of retail sales and disposable income
(%, y/y changes)
Source: Rostat

15
COFACE COUNTRY RISK ASSESSMENTS
16
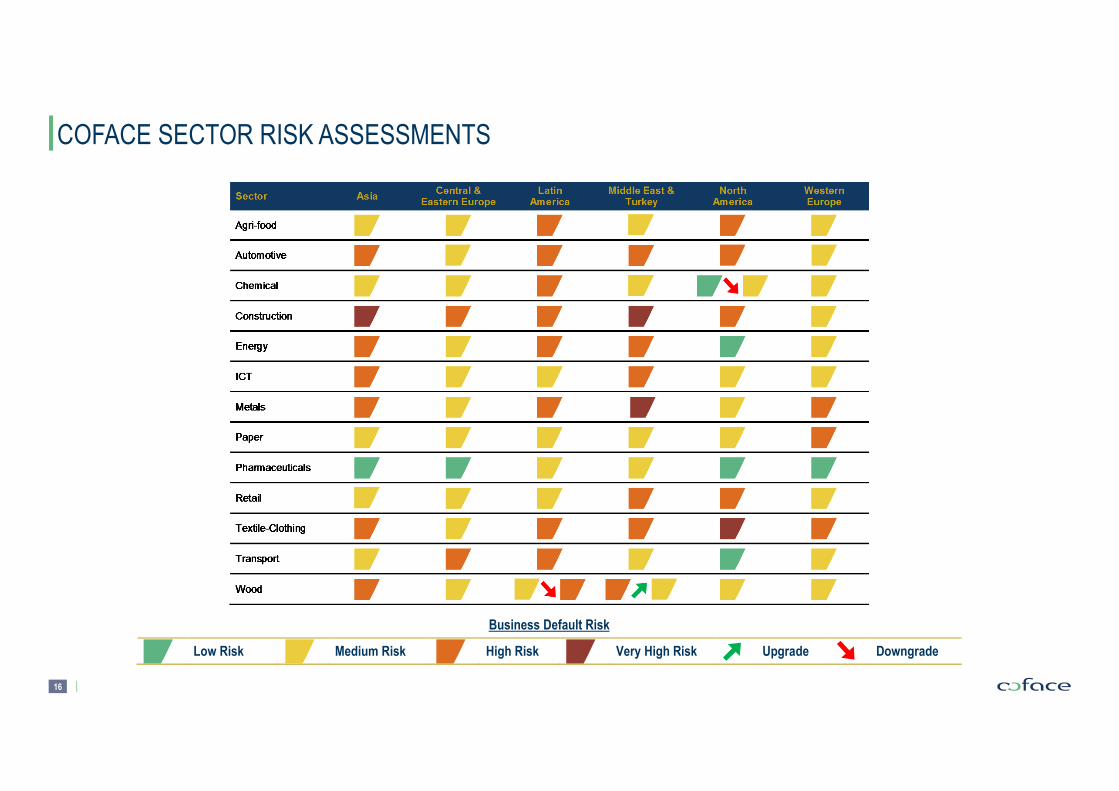
COFACE SECTOR RISK ASSESSMENTS
Low Risk
Medium Risk
High Risk
Very High Risk
Upgrade
Downgrade
Business Default Risk