global economic integration and global · pdf fileglobal economic integration and global ......
TRANSCRIPT
9Global Economic Integration and Global Inequality
Global Economic Integration and GlobalInequality
David Dollar1
Gaps between the poorest and the richest people and countries have continuedto widen…This continues the trend of two centuries. Some have predicted
convergence, but the past decade has shown increasing concentration of incomeamong people, corporations, and countries.
– UN Human Development Report 1999
…globalization has dramatically increased inequalitybetween and within nations.
– Jay Mazur, Foreign Affairs
…inequality is soaring through the globalization period, within countries andacross countries. And that’s expected to continue.
– Noam Chomsky
…all the main parties support nonstop expansion in world trade and servicesalthough we all know it…makes rich people richer and poor people poorer…
– Walter Schwarz, The Guardian
The evidence strongly suggests that global income inequalityhas risen in the last twenty years.
– Robert Wade
We are convinced that globalization is good and it’s good when you do yourhomework…keep your fundamentals in line on the economy, build up high levelsof education, respect rule of law…when you do your part, we are convinced that
you get the benefit.
– President Vicente Fox of Mexico
There is no way you can sustain economic growth without accessing a big andsustained market.
� President Yoweri Museveni of Uganda
We take the challenge of international competition in a level playing field asan incentive to deepen the reform process for the overall sustained development
of the economy. WTO membership works like a wrecking ball, smashingwhatever is left in the old edifice of the former planned economy.
� Jin Liqun, Vice Minister of Finance of China
1. Development Research Group, World Bank. Views expressed are those of the author and do notnecessarily reflect official views of the World Bank, its Executive Directors, or its membercountries.

10 David Dollar
There is an odd disconnect between debates about globalisation in the North andthe South. Among intellectuals in the North one often hears the claim that globaleconomic integration is leading to rising global inequality – that is, that it benefitsthe rich proportionally more than the poor. In the extreme claims, the poor areactually made out to be worse-off absolutely (as in the quote from Walter Schwarz).In the South, on the other hand, intellectuals and policy-makers often view globalisationas providing good opportunities for their countries and their people. To be sure, theyare not happy with the current state of globalisation. President Museveni’s quoteabove, for example, comes in the midst of a speech in the US where he blasts the richcountries for their protectionism against poor countries and lobbies for better marketaccess. But the point of such critiques is that integration – through foreign trade,foreign investment, and immigration – is basically a good thing for poor countriesand that the rich countries could do a lot more to facilitate this integration – that is,make it freer. The claims from anti-globalisation intellectuals of the North, on theother hand, lead inescapably to the conclusion that integration is bad for poorcountries and that therefore trade and other flows should be more restricted.
The main goal of this essay is to link growing economic integration (‘globalisation’)with trends in growth, poverty, and inequality in the developing world. The phrase‘global inequality’ is used to mean different things in different discussions –distribution among all the citizens of the world, distribution within countries,distribution among countries, distribution among wage earners – and the paper takesup all the different meanings.
The first half of the essay looks at the link between heightened integration andeconomic growth of developing countries. The opening-up of big developingcountries such as China and India is arguably the most distinctive feature of the waveof globalisation that started around 1980. Individual cases, cross-country statisticalanalysis, and micro evidence from firms all suggest that this opening-up to trade anddirect investment has been a good strategy for such developing countries as China,India, Mexico and Uganda.
How have the economic benefits of globalisation been distributed and what hashappened as a result to global poverty and inequality? These are the questionsaddressed in the second half of this essay. In particular, Section 2 presents evidencein support of five trends in inequality and poverty since 1980:
• Trend #1 – Poor country growth rates have accelerated.
• Trend #2 – The number of poor people in the world has declined significantly, thefirst such decline in history.
• Trend #3 – Global inequality (among citizens of the world) has declined –modestly – reversing a 200-year-old trend toward higher inequality.
• Trend #4 – There is no general trend toward higher inequality within countries;in particular, among developing countries inequality has decreased in about asmany cases as it has increased.
• Trend #5 – Wage inequality is rising worldwide (which may seem to contradictTrend #4, but it does not because wages are a small part of household income in

11Global Economic Integration and Global Inequality
developing countries, which make up the bulk of the world in terms of countriesand population).
The conclusions for policy from this review of globalisation and global inequalityare very much in the spirit of the comments from Presidents Fox and Museveni.Developing countries have a lot of ‘homework’ to do in order to develop in generaland to make effective use of integration as part of their development strategy. Richcountries could do a lot more with foreign aid to help with that homework. And, asMuseveni indicates, access to rich country markets is important. There remains a lotof protection in OECD markets against the goods and people of the developingworld, and globalisation would do more for developing country growth if developingcountries and their people had freer access to those rich country markets.
1. Is there a Link from Integration to Growth?To keep track of the wide range of explanations that are offered for persistent
poverty in developing nations, it helps to keep two extreme views in mind. The firstis based on an object gap: Nations are poor because they lack valuable objects likefactories, roads, and raw materials. The second view invokes an idea gap: Nationsare poor because their citizens do not have access to the ideas that are used inindustrial nations to generate economic value…
Each gap imparts a distinctive thrust to the analysis of development policy. Thenotion of an object gap highlights saving and accumulation. The notion of an ideagap directs attention to the patterns of interaction and communication between adeveloping country and the rest of the world. (Romer 1993, p 544)
Many developing countries have become more integrated with the global economyin the past two decades, and at the same time their growth rates have accelerated(examples would be Bangladesh, China, India, Mexico, Uganda and Vietnam). Anatural question to ask is whether there is a link. In other words, could countries suchas Bangladesh, China, India, and Vietnam have grown as rapidly as they have, if theyhad remained as closed to foreign trade and investment as they were in 1980? Thisis not the kind of question that can be answered with scientific certainty, but thereare several different types of evidence that we can bring to bear on it.
It is useful to begin with what one would expect from economic theory. Assuggested by the quote from Paul Romer, traditional growth theory focused onaccumulation and the ‘object gap’ between poor countries and rich ones. If theimportant thing is just to increase the number of factories and workplaces, then itdoes not matter if this is done in a closed environment or a state-dominatedenvironment. That was the model followed in the extreme by China and the SovietUnion, and to a lesser extent by most developing countries, who followedimport-substituting industrialisation strategies throughout the 1960s and 1970s. Itwas the disappointing results from that approach that led to new thinking both frompolicy-makers in developing countries as well as from economists studying growth.Romer was one of the pioneers of the new growth theory that put more emphasis onhow innovation occurs and is spread and the role of technological advance inimproving the standard of living. Different aspects of integration – sending students

12 David Dollar
abroad to study, connecting to the internet, allowing foreign firms to open plants,purchasing the latest equipment and components – can help overcome the ‘idea gap’that separates poor and rich nations.
What is the evidence on integration spurring growth? There are a large numberof case studies that show how this process can work in particular countries. Amongthe countries that were very poor in 1980, China, India, Vietnam and Uganda providean interesting range of examples.
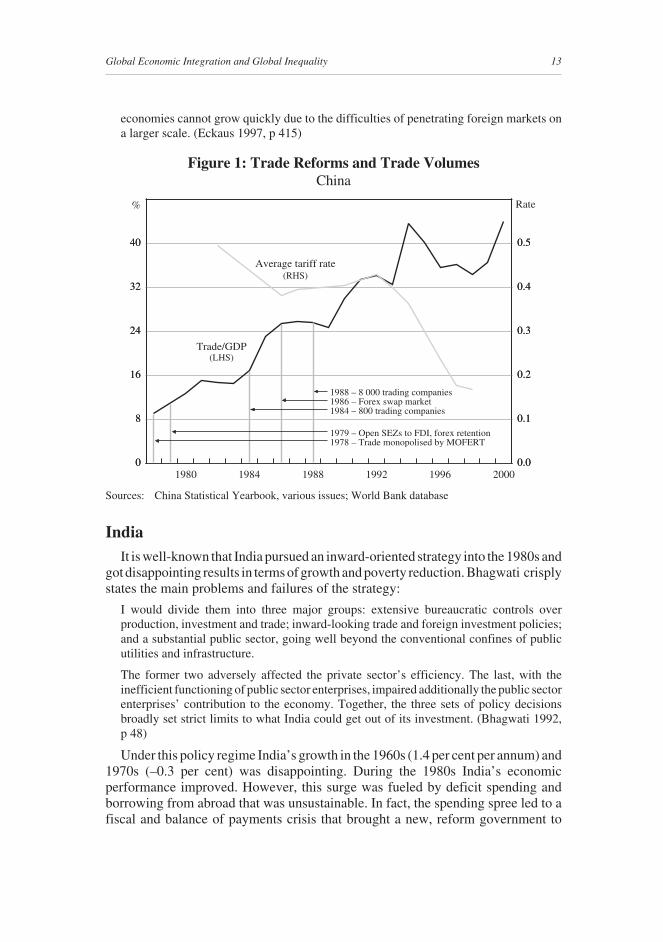
ChinaChina’s initial reforms in the late 1970s focused on the agricultural sector and
emphasised strengthening property rights, liberalising prices, and creating internalmarkets. As indicated in Figure 1, liberalising foreign trade and investment were alsopart of the initial reform program. In the 1980s China removed administrativebarriers to trade, before turning to major tariff reductions in the 1990s. The role ofinternational linkages is described in this excerpt from a case study by RichardEckaus:
After the success of the Communist revolution and the founding of the People’s Republicof China, the nation’s international economic policies were dominated for at least thirtyyears by the goal of self-reliance. While this was never interpreted as complete autarky,the aspiration for self-reliance profoundly shaped trade policy, especially with the marketeconomies.
China’s foreign trade began to expand rapidly as the turmoil created by the CulturalRevolution dissipated and new leaders came to power. Though it was not done withoutcontroversy, the argument that opening of the economy to foreign trade was necessary toobtain new capital equipment and new technology was made official policy.
The creation of an ‘open door’ policy did not mean the end of foreign trade planning.Although Chinese policy became committed to the expansion of its international trade, thedecision-making processes and international trade mechanisms of the pre-reform periodcontinued in full force for several years, to a modified degree for several more years, andstill continue to be evident in the licensing controls. At the same time, internationaltransactions outside of the state planning system have been growing. Most obviously,enterprises created by foreign investors have been exempt from the foreign trade planningand control mechanisms. In addition, substantial amounts of other types of trade,particularly the trade of the township and village enterprises and private firms, have beenrelatively free.
The expansion of China’s participation in international trade since the beginning of thereform movement in 1978, has been one of the most remarkable features of its remarkabletransformation.
While GNP was growing at 9 percent from 1978 to 1994, exports grew at about 14 percentand imports at an average of 13 percent per year.
The successes contradict several customary generalisations about transition economiesand large developing countries – for example, that the transition from central planning tomarket orientation cannot be made without passing through a difficult period of economicdisorganization and, perhaps decline; and that the share of international trade in very large
13Global Economic Integration and Global Inequality
economies cannot grow quickly due to the difficulties of penetrating foreign markets ona larger scale. (Eckaus 1997, p 415)
Figure 1: Trade Reforms and Trade VolumesChina
Sources: China Statistical Yearbook, various issues; World Bank database
IndiaIt is well-known that India pursued an inward-oriented strategy into the 1980s and
got disappointing results in terms of growth and poverty reduction. Bhagwati crisplystates the main problems and failures of the strategy:
I would divide them into three major groups: extensive bureaucratic controls overproduction, investment and trade; inward-looking trade and foreign investment policies;and a substantial public sector, going well beyond the conventional confines of publicutilities and infrastructure.
The former two adversely affected the private sector’s efficiency. The last, with theinefficient functioning of public sector enterprises, impaired additionally the public sectorenterprises’ contribution to the economy. Together, the three sets of policy decisionsbroadly set strict limits to what India could get out of its investment. (Bhagwati 1992,p 48)
Under this policy regime India’s growth in the 1960s (1.4 per cent per annum) and1970s (–0.3 per cent) was disappointing. During the 1980s India’s economicperformance improved. However, this surge was fueled by deficit spending andborrowing from abroad that was unsustainable. In fact, the spending spree led to afiscal and balance of payments crisis that brought a new, reform government to
0
8
16
24
32
40
0.0
0.1
0.2
0.3
0.4
0.5
0
8
16
24
32
40
0.0
0.1
0.2
0.3
0.4
0.5
Average tariff rate
(LHS)
2000
Trade/GDP
(RHS)
19961992198819841980
1979 – Open SEZs to FDI, forex retention1978 – Trade monopolised by MOFERT
1988 – 8 000 trading companies1986 – Forex swap market1984 – 800 trading companies
% Rate
14 David Dollar
power in 1991. Srinivasan describes the key reform measures and their results asfollows:
In July 1991, the government announced a series of far reaching reforms. These includedan initial devaluation of the rupee and subsequent market determination of its exchangerate, abolition of import licensing with the important exceptions that the restrictions onimports of manufactured consumer goods and on foreign trade in agriculture remained inplace, convertibility (with some notable exceptions) of the rupee on the current account;reduction in the number of tariff lines as well as tariff rates; reduction in excise duties ona number of commodities; some limited reforms of direct taxes; abolition of industriallicensing except for investment in a few industries for locational reasons or for environmentalconsiderations, relaxation of restrictions on large industrial houses under the Monopoliesand Restrictive Trade Practices (MRTP) Act; easing of entry requirements (includingequity participation) for direct foreign investment; and allowing private investment insome industries hitherto reserved for public sector investment. (Srinivasan 2001, p 245)
In general, India has gotten good results from its reform program, with per capitaincome growth above 4 per cent per annum in the 1990s. Growth and povertyreduction have been particularly strong in states that have made the most progressliberalising the regulatory framework and providing a good environment fordelivery of infrastructure services (Goswami et al 2002).
VietnamThe same collection that contains Eckaus’s study of China also has a case study
of Vietnam:
Vietnam has made a remarkable turnaround during the past decade. In the mid-1980s thecountry suffered from hyperinflation and economic stagnation; it was not able to feed itspopulation; and hundreds of thousands of people were signaling their dissatisfaction byfleeing in unsafe boats. A decade later, the government had restored macroeconomicstability; growth had accelerated to the 8–9 per cent range; the country had become thesecond largest rice exporter in the world; and overseas Vietnamese were returning withtheir capital to take advantage of expanding investment opportunities. During this periodthere has also been a total transformation of Vietnam’s foreign trade and investment, withthe economy now far more open than ten years ago.
That Vietnam was able to grow throughout its adjustment period can be attributed to thefact that the economy was being increasingly opened to the international market. As partof its overall effort to stabilize the economy, the government unified its various controlledexchange rates in 1989 and devalued the unified rate to the level prevailing in the parallelmarket. This was tantamount to a 73 per cent real devaluation; combined with relaxedadministrative procedures for imports and exports, this sharply increased the profitabilityof exporting.
This…policy produced strong incentives for export throughout most of the 1989–94period. During these years real export growth averaged more than 25 per cent per annum,and exports were a leading sector spurring the expansion of the economy. Rice exportswere a major part of this success in 1989; and in 1993-94 there was a wide range of exportson the rise, including processed primary products (e.g., rubber, cashews, and coffee),labour-intensive manufactures, and tourist services.

15Global Economic Integration and Global Inequality
The current account deficit declined from more than 10 per cent of GDP in 1988 to zeroin 1992. Normally, the collapse of financing in this way would require a sharp cutback inimports. However, Vietnam’s export growth was sufficient to ensure that imports couldgrow throughout this adjustment period. It is also remarkable that investment increasedsharply between 1988 and 1992, while foreign aid [from the Soviet Union] was drying up.In response to stabilization, strengthened property rights, and greater openness to foreigntrade, domestic savings increased by twenty percentage points of GDP, from negativelevels in the mid 1980s to 16 per cent of GDP in 1992. (Dollar and Ljunggren 1997, p 455)
UgandaUganda has been one of the most successful reformers in Africa during this recent
wave of globalisation, and its experience has interesting parallels with Vietnam’s.It too was a country that was quite isolated economically and politically in the early1980s. The role of trade reform in its larger reform is described in Collier andReinikka:
Trade liberalization has been central to Uganda’s structural reform program. During the1970s, export taxation and quantitative restrictions on imports characterized trade policyin Uganda. Exports were taxed, directly and implicitly at very high rates. All exportsexcept for coffee collapsed under this taxation. For example, tea production fell from apeak of 20,000 tons in the early 1970s to around 2,000 tons by the early 1980s, and cottonproduction fell from a peak of 87,000 tons, to 2,000 tons. By contrast, coffee exportsdeclined by around one-third.
Part of the export taxation was achieved through overvaluation of the exchange rate, whichwas propelled by intense foreign exchange rationing, but mitigated by an active illegalmarket. Manufacturing based on import substitution collapsed along with the export sectoras a result of shortages, volatility, and rationing of import licenses and foreign exchange.President Amin’s policy toward foreign investment was dominated by confiscationwithout compensation, and he expelled more than 70,000 people from the Asian community.
In 1986 the NRM government inherited a trade regime that included extensive nontariffbarriers, biased government purchasing, and high export taxes, coupled with considerablesmuggling. The nontariff barriers have gradually been removed since the introduction in1991 of automatic licensing under an import certification scheme. Similarly, centralgovernment purchasing was reformed and is now subject to open tendering without apreference for domestic firms over imports.
By the mid 1990s, the import tariff schedule had five ad valorem rates between 0 and60 per cent. For more than 95 per cent of imported items the tariff was between 10 and30 per cent. During the latter half of the 1990s, the government implemented a major tariffreduction program. As a result, by 1999 the tariff system had been substantially rationalizedand liberalized, which gave Uganda one of the lowest tariff structures in Africa. Themaximum tariff is now 15 per cent on consumer goods, and there are only two other tariffbands: zero for capital goods and 7 per cent for intermediate imports.
The average real GDP growth rate was 6.3 per cent per year during the entire recoveryperiod (1986–99) and 6.9 per cent in the 1990s. The liberalization of trade has had amarked effect on export performance. In the 1990s export volumes grew (at constantprices) at an annualized rate of 15 per cent , and import volumes grew at 13 per cent . Thevalue of noncoffee exports increased fivefold between 1992 and 1999. (Collier andReinikka 2001)

16 David Dollar
These cases provide persuasive evidence that openness to foreign trade andinvestment – coupled with complementary reforms – can lead to faster growth indeveloping countries. However, individual cases always beg the question, howgeneral are these results? Does the typical developing country that liberalises foreigntrade and investment get good results? Cross-country statistical analysis is useful forlooking at the general patterns in the data. Cross-country studies generally find acorrelation between trade and growth. Among developing countries, some have hadlarge increases in trade integration (measured as the ratio of trade to nationalincome), while others have had small increases or even declines over the past20 years (Figure 2). In general, the countries that have had large increases in trade,have also had accelerations in growth. This relationship persists after controlling forreverse causality from growth to trade and for changes in other institutions andpolicies (Dollar and Kraay 2001b). All of the cross-country studies suffer frompotential problems of omitted variables and mis-specification, but they are nonethelessuseful for summarising patterns in the data.
Figure 2: Change in Trade/GDP1977–1997, selected countries
A final piece of evidence about integration and growth comes from firm-levelstudies and links us back to the quote from Paul Romer. Developing countries oftenhave large productivity dispersion across firms making similar things:high-productivity and low-productivity firms co-exist and in small markets there isoften insufficient competition to spur innovation. A consistent finding of firm-levelstudies is that openness leads to lower productivity dispersion (Haddad 1993;Haddad and Harrison 1993; Harrison 1994). High-cost producers exit the market asprices fall; if these firms were less productive, or were experiencing falling
-100 -80 -60 -40 -20 0 20 40 60 80 100
China
Percentage change
Bangladesh
Philippines
Malaysia
Mexico
Argentina
ThailandIndia
Brazil
Pakistan
Kenya
Togo
Honduras
Senegal
Nigeria
EgyptZambia

17Global Economic Integration and Global Inequality
productivity, then their exits represent productivity improvements for the industry.While the destruction and creation of new firms is a normal part of a well-functioningeconomy, too often attention is simply paid to the destruction of firms, missing halfof the picture. The increase in exits is only part of the adjustment. Granted, it is thefirst and most painful part of the adjustment. However, if there are not significantbarriers to factor mobility or other barriers to entry, the other side is that there are newentrants. The exits are often front-loaded, but the net gains over time can besubstantial.
Wacziarg (1998) uses 11 episodes of trade liberalisation in the 1980s to look atthe issue of competition and entry. Using data on the number of establishments ineach sector, he calculates that entry rates were 20 per cent higher among countriesthat liberalised compared to ones that did not. This estimate may reflect otherpolicies that accompanied trade liberalisation such as privatisation and deregulation,so this is likely to be an upper bound of the impact of trade liberalisation. However,it is a sizable effect and indicates that there is plenty of potential for new firms torespond to the new incentives. The evidence also indicates that while exit rates maybe significant, net turnover rates are usually very low. Thus, entry rates are usuallyof a comparable magnitude to the exit rates. Using plant-level data from Morocco,Chile and Columbia spanning several years in the 1980s, when these countriesinitiated trade reforms, indicates that exit rates range from 6 to 11 per cent a year, andentry rates from 6 to 13 per cent. Over time, the cumulative turnover is quiteimpressive, with a quarter to a third of firms having turned over in four years (Robertsand Tybout 1996, p 6).
The higher turnover of firms is an important source of the dynamic benefit ofopenness. In general, dying firms have falling productivity and new firms tend toincrease their productivity over time (Liu and Tybout 1996; Roberts andTybout 1996; Aw, Chung and Roberts 2000). In Taiwan, Aw et al (2000) find thatwithin a five-year period, the replacement of low-productivity firms with new,higher-productivity entrants accounted for half or more of the technological advancein many Taiwanese industries.
While these studies shed some light on why open economies are more innovativeand dynamic, they also remind of us why integration is controversial. There will bemore dislocation in an open, dynamic economy – with some firms closing and othersstarting up. If workers have good social protection and opportunities for developingnew skills, then everyone can benefit. But without such policies there can be somebig losers.
I want to close this section with a nice point from the economic historians PeterLindert and Jeffrey Williamson (2001) concerning the different pieces of evidencelinking integration to growth: ‘The doubts that one can retain about each individualstudy threaten to block our view of the overall forest of evidence. Even though noone study can establish that openness to trade has unambiguously helped therepresentative Third World economy, the preponderance of evidence supports thisconclusion’. They go on to note the ‘empty set’ of ‘countries that chose to be lessopen to trade and factor flows in the 1990s than in the 1960s and rose in the globalliving-standard ranks at the same time. As far as we can tell, there are no anti-global

18 David Dollar
victories to report for the postwar Third World. We infer that this is because freertrade stimulates growth in Third World economies today, regardless of its effectsbefore 1940.’ (pp 29–30)
2. Accelerated Growth and Poverty Reduction in theNew Globalisers
Much of the debate about globalisation concerns its effects on poor countries andpoor people. In the introduction I quoted a number of sweeping statements assertingthat global economic integration is leading to growing poverty and inequality in theworld. The reality of what is happening with poverty and inequality is far morecomplex, and to some extent runs exactly counter to what is being claimed byanti-globalists. Hence in this section I am going to focus on the trends in globalpoverty and inequality. Let’s get the facts straight, and then we can have a morefruitful debate about what is causing the trends. The trends that I want to highlightin this section are that: (1) growth rates of the poorest countries have accelerated inthe past 20 years and are higher than rich-country growth rates; (2) there was a largenet decline in the number of poor in the world between 1980 and 2000, the first suchdecline in history; (3) measures of global inequality (such as the global Ginicoefficient) have declined modestly since 1980, reversing a long historical trendtoward greater inequality; (4) there is no pattern of rising inequality within countries,though there are some notable cases in which inequality has risen; and (5) there isa general pattern of rising wage inequality (larger wage increases for skilled workersrelative to those of unskilled workers). It may seem that Trend #5 runs counter toTrend #4, but I will explain why it does not. Nevertheless, Trend #5 is important andhelps explain some of the anxiety about globalisation in the industrial countries.
2.1 Trend #1: Poor country growth rates have acceleratedWe have reasonably good data on economic growth going back to 1960 for about
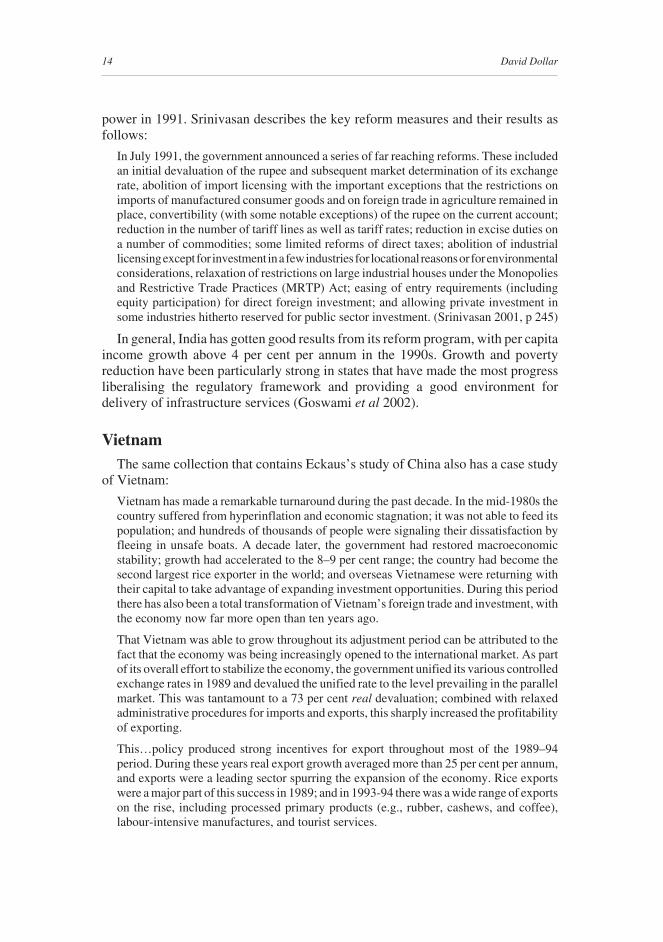
125 countries, which make up the vast majority of world population. If you take thepoorest one-fifth of countries in 1980 (that is, about 25 countries), thepopulation-weighted growth rate of this group was 4 per cent per capita from 1980to 1997, while the richest-fifth of countries grew at 1.7 per cent (Figure 3). Thisphenomenon of the fastest growth occurring in the poorest countries is newhistorically; the growth rates of these same countries for the prior two decades(1960–1980) were 1.8 per cent for the poor group and 3.3 per cent for the rich group.Data going back further in time are not as good, but there is evidence that richerlocations have been growing faster than poorer locations for a long time.
Now, the adjective ‘population-weighted’ is very important. If you ignoredifferences in population and just take an average of poor-country growth rates, youwill find average growth of about zero for poor countries. Among the poorest quintileof countries in 1980 you have both China and India, and you also have quite a fewsmall countries, particularly in Africa. Ignoring population, the average growth ofChad and China is about zero, and the average growth of Togo and India is about
19Global Economic Integration and Global Inequality
zero. Taking account of differences in population, on the other hand, one would saythat the average growth of poor countries has been very good in the past 20 years.China obviously carries a large weight in any such calculation about the growth ofcountries that were poor in 1980. But it is not the only poor country that did well.India, Bangladesh and Vietnam have also had accelerated growth and grown fasterthan rich countries in the recent period. A number of African economies, notablyUganda, have also had accelerated growth.
Figure 3: Growth Rates of the Poorest andRichest Quintiles of Countries
Population-weighted
2.2 Trend #2: The number of poor people in the world hasdeclined
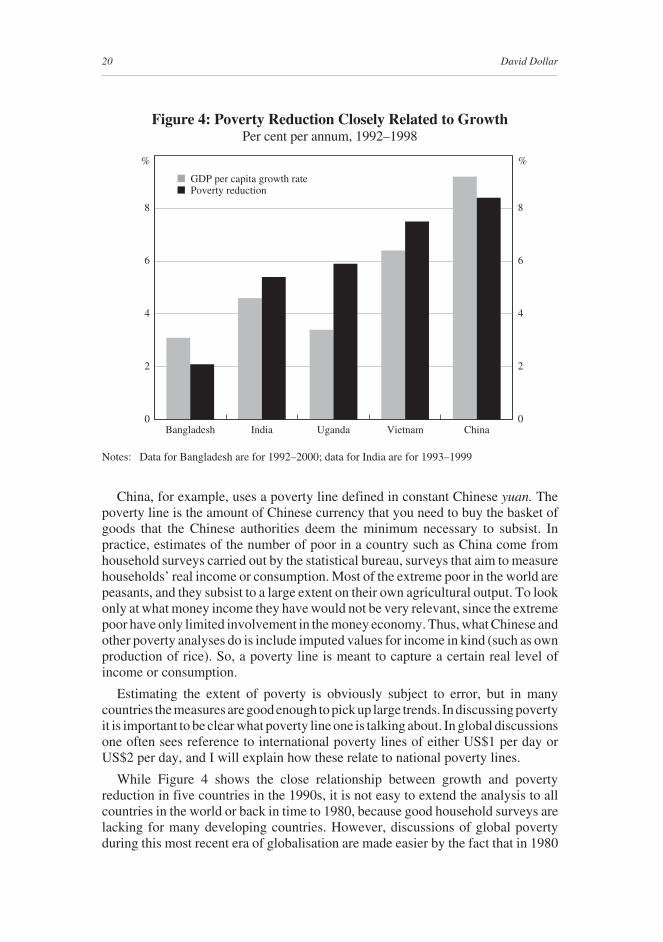
The most important point that I want to get across in this section is that povertyreduction in low-income countries is very closely related to the growth rate in thesecountries. Hence, the accelerated growth of low-income countries has led tounprecedented poverty reduction. By poverty, we mean subsisting below someabsolute threshold. Most poverty analysis is carried out with countries’ own povertylines, which are set in country context and naturally differ. In the 1990s we have moreand more countries with reasonably good household surveys and their own povertyanalysis. Figure 4 shows five poor countries that have benefited from increasedintegration, and in each case significant poverty reduction has gone hand-in-handwith faster growth. Poverty reduction here is the rate of decline of the poverty rate,based on the country’s own poverty line and analysis.
0
1
2
3
4
0
1
2
3
4
Richest countries
■ 1960–1980■ 1980–1997
Poorest countries
% %
20 David Dollar
Figure 4: Poverty Reduction Closely Related to GrowthPer cent per annum, 1992–1998
Notes: Data for Bangladesh are for 1992–2000; data for India are for 1993–1999
China, for example, uses a poverty line defined in constant Chinese yuan. Thepoverty line is the amount of Chinese currency that you need to buy the basket ofgoods that the Chinese authorities deem the minimum necessary to subsist. Inpractice, estimates of the number of poor in a country such as China come fromhousehold surveys carried out by the statistical bureau, surveys that aim to measurehouseholds’ real income or consumption. Most of the extreme poor in the world arepeasants, and they subsist to a large extent on their own agricultural output. To lookonly at what money income they have would not be very relevant, since the extremepoor have only limited involvement in the money economy. Thus, what Chinese andother poverty analyses do is include imputed values for income in kind (such as ownproduction of rice). So, a poverty line is meant to capture a certain real level ofincome or consumption.
Estimating the extent of poverty is obviously subject to error, but in manycountries the measures are good enough to pick up large trends. In discussing povertyit is important to be clear what poverty line one is talking about. In global discussionsone often sees reference to international poverty lines of either US$1 per day orUS$2 per day, and I will explain how these relate to national poverty lines.
While Figure 4 shows the close relationship between growth and povertyreduction in five countries in the 1990s, it is not easy to extend the analysis to allcountries in the world or back in time to 1980, because good household surveys arelacking for many developing countries. However, discussions of global povertyduring this most recent era of globalisation are made easier by the fact that in 1980
0
2
4
6
8
0
2
4
6
8
China
■ GDP per capita growth rate■ Poverty reduction
VietnamUgandaIndiaBangladesh
% %
21Global Economic Integration and Global Inequality
a large majority of the world’s poor lived in China and India, both of which havereasonably good national data on poverty. Bourguignon and Morrisson (2002)estimate that there were 1.4 billion people in the world subsisting on less thanUS$1 per day in 1980. Take this as a rough estimate around which there is a lot ofuncertainty. Still, it is clear that at least 60 per cent of these poor were in China andIndia. So, what has happened to global poverty is going to depend to a veryconsiderable extent on these two countries.
The Chinese statistical bureau estimates that the number of people with incomesbelow their national poverty line has declined from 250 million in 1978 to 34 millionin 1999 (Figure 5).2 Now, this Chinese poverty line is defined in constant Chineseyuan and it is possible to translate this into US dollars for the purpose of comparisonwith other countries. This conversion is best done with a purchasing power parity(PPP) exchange rate. This is the exchange rate between the Chinese yuan and theUS dollar that would lead to the same price in the US and China for a representativebasket of consumer goods. It is the normal basis for making international comparisonsof living standards. Evaluated at PPP in this way, the Chinese poverty line isequivalent to about 70 US cents per day – quite a low poverty line. Using informationon the distribution of income in China, it is possible to make a rough estimate of thenumber of people with income under a higher poverty line – for example,US$1 per day at PPP. A rough estimate of the number of people in China in 1978consuming less than US$1 per day would be in the ballpark of 600 million.3 It maybe surprising that the number is so much larger than the estimate of 250 million livingon less than 70 US cents per day. But in 1978 a large mass of the population wasconcentrated in the range between 70 US cents and US$1.
India’s official poverty data also show a marked drop in poverty over the pasttwo decades. India’s consumption-based poverty line translates to about 85 US centsper day at PPP. By that line, the Indian statistical bureau estimates that there were330 million poor people in India in 1977, and the number declined to 259 million in1999. We can make a similar rough estimate of the number of poor living under ahigher poverty line of US$1 per day, using information on the distribution of incomein Indian surveys.
2. This estimate is only for the rural population of China. However, the available survey data show thatthere were almost no urban families living under this poverty line, either in 1980 or today. So, theestimate can be taken as a reasonable approximation of overall extreme poverty in China.
3. The mean income in the rural household survey in China, converted into 1993 US dollars with theSummers and Heston PPP exchange rate, is about US$200 per year in 1978. Using the informationon the distribution of income in the 1981 sample, the earliest available, the estimated number ofpeople in China with income less than US$1 per day would be as high as 750 million. The numberconsuming less than US$1 per day would be smaller, since even the very poor have some savingsin China. Also, the early surveys may not have done a good job with imputed consumption fromhousing and other durables. For these reasons I take 600 million as a rough but conservative estimateof the number of poor (consuming less than US$1 per day) at the beginning of China’s economicreform.

22 David Dollar
Figure 5: Poverty has Declined According to China’ and India’sNational Poverty Lines
Number of people
Notes: India’s national poverty line – roughly US$0.85 per day; China’s national poverty line – roughlyUS$0.70 per day.
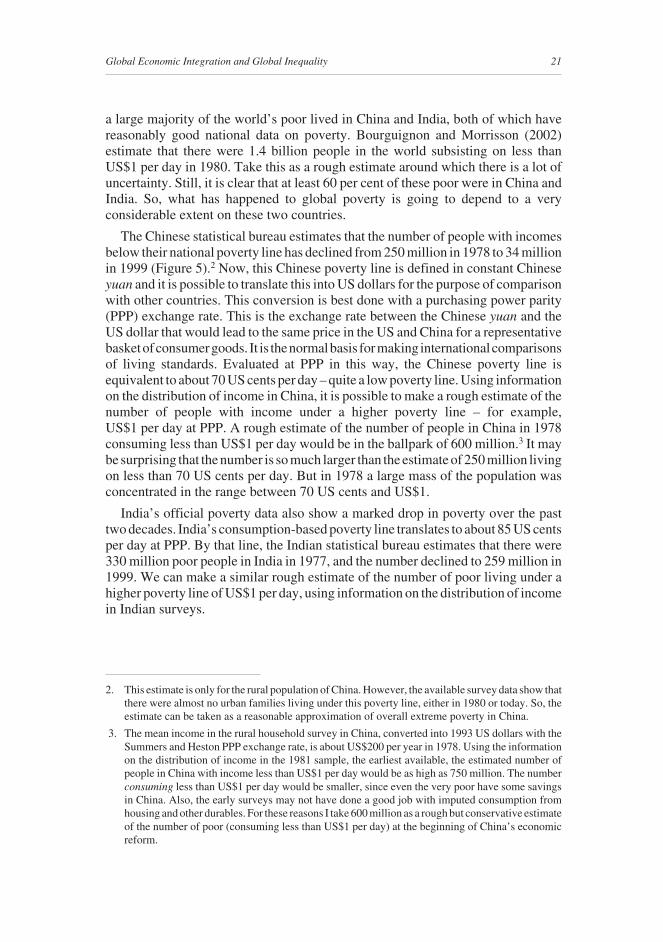
In Figure 6, I combine rough estimates of US$1 per day poverty in China andIndia. In 1977–78 there were somewhere around 1 billion people in these two giantcountries who were subsisting on less than US$1 per day at PPP; by 1997–98 theestimated number had fallen to about 650 million (according to the estimates of Chenand Ravallion (2001)). This poverty reduction is all the more remarkable, becausetheir combined population increased by nearly 700 million people over this period.
It is easy to quibble about specific numbers, but no amount of quibbling can getaround the fact that there has been massive poverty reduction in China and India.These countries’ own data and poverty analysis show large poverty reduction, usinglines that are below US$1 per day. The poverty reduction using a commoninternational line of US$1 per day would be larger.
While there has clearly been poverty reduction in Asia, it is also clear that povertyhas been rising in Africa, where most economies have been growing slowly or notat all for the past 20 years. Chen and Ravallion (2001) estimate that the number ofpoor (consuming less than US$1 per day) in Sub-Saharan Africa increased from217 million in 1987 to 301 million in 1998. There is not comparably good data for1980, but we know that the region was not doing well in the 1980–1987 period. Ifthe rate of increase of poverty was about the same in the 1980–1987 period, as in1987–1993, then the increased poverty in Africa during the 1980–1998 period wouldbe about 170 million people.
0
50
100
150
200
250
300
0
50
100
150
200
250
300
1999199319871977–1978
■ China■ India
M M
23Global Economic Integration and Global Inequality
Figure 6: Rough Estimates of US$1 per Day Povertyfor China and India Combined
Number of people
Any careful estimate of worldwide poverty is going to depend primarily on trendsin China, India, and Sub-Saharan Africa. Putting together these trends reveals a largenet decline in the number of poor since 1980. This is an important historical shift.Bourguignon and Morrisson (2002) estimate that the number of very poor people inthe world (US$1 per day line) increased up through 1980 (Figure 7). Between 1960and 1980 the number of poor grew by about 100 million. Between 1980 and 1992,however, the number of poor fell by about 100 million in their estimate. Chen andRavallion (2001) use a different methodology to estimate a further decline ofabout 100 million between 1993 and 1998. The same study found an increasein global poverty between 1987 and 1993, which may seem at odds with theBourguignon-Morrisson results. However, a look back at Figures 5 and 6 reveals thatthe poor in China and India combined have done well over the past 20 years, exceptfor the period from 1987 to 1993, when poverty in China and India temporarily rose.During that period India had a macroeconomic crisis and a sharp recession, and inChina the growth of rural incomes slowed significantly.
Indian data for 1999/2000 show further declines that have not been incorporatedin the global estimates for 1997/98. Based on the well-documented poverty reductionin China and India, and their weight in world poverty, we can be confident that200 million is a conservative estimate of the poverty reduction since 1980. In manyways, however, adding up the good experiences and the bad experiences concealsmore than it reveals. Certainly it is good news that large poor countries in Asia havedone well (not just China and India, but Bangladesh and Vietnam as well). But thatis no consolation to the growing number of poor in Africa, where economiescontinue to languish (with the occasional bright spot such as Uganda).
1997–19981977–1978 1987 1993
1 000
800
600
400
200
0
1 000
800
600
400
200
0
M M

24 David Dollar
Figure 7: Number of Very Poor has Fallen since 1980Number of people living on less than US$1 per day
Sources: Bourguignon and Morrison (2001, 2002); Chen S and M Ravallion, ‘How Did the World’sPoorest Fare in the 1990s?’, World Bank Development Research Group Working PaperNo 2409, 2000.
2.3 Trend #3: Global inequality has declined (modestly)People use the phrase ‘global inequality’ casually to mean a number of different
things. But the most sensible definition would be the same one we use for a country:line up all the people in the world from the poorest to the richest and calculate ameasure of inequality among their incomes. There are a number of possiblemeasures, of which the Gini coefficient is the best known. Xavier Sala-i-Martin(2002) finds in a new paper that any of the standard measures of inequality show adecline in global inequality since 1980. Subjectively, I would describe this as amodest decline, and one about which we do not have a lot of statistical confidence.But, even if global inequality is flat, it represents an important reverse of a longhistorical pattern of rising global inequality and contradicts the frequent claims thatinequality is rising.
Bourguignon and Morrisson (2002) calculate the global Gini measure of inequalitygoing back to 1820. Obviously we do not have a lot of confidence in theseearly estimates, but they illustrate a point that is not seriously questioned: globalinequality has been on the rise throughout modern economic history.TheBourguignon-Morrisson estimates of the global Gini have it rising from 0.50 in 1820to about 0.65 around 1980 (Figure 8). Sala-i-Martin estimates that the global Gini hassince declined to 0.61. Other measures of inequality such as the Theil index or themean log deviation show a similar decline. The latter measures have the advantagethat they can be decomposed into inequality among countries (differences in
Bourguignon-Morrisson
1997–1998
Chen-Ravallion
1993199219871980197019601 000
1 100
1 200
1 300
1 400
1 000
1 100
1 200
1 300
1 400
M M

25Global Economic Integration and Global Inequality
Figure 8: Bourguignon-Morrison and Sala-i-Martin –Global Gini Coefficient
Figure 9: Inequality Decomposition – Theil Index
Sources: Bourguignon and Morrison (2002, Table 1); Sala-i-Martin (2002, Figure 7)
Source: Sala-i-Martin (2002, Table 2)
per capita income across countries) and inequality within countries. What thisdecomposition shows is that most of the inequality in the world can be attributed toinequality among countries (Figure 9). Global inequality rose from 1820 to 1980
Sala-i-Martin
18200.40
0.45
0.50
0.55
0.60
0.65
0.40
0.45
0.50
0.55
0.60
0.65
0.40
0.45
0.50
0.55
0.60
0.65
Bourguignon-Morrisson
1850 1870 1890 1910 1929 1950 1960 19971977 1987
0.0
0.2
0.4
0.6
0.8
0.0
0.2
0.4
0.6
0.8
0.0
0.2
0.4
0.6
0.8
0.0
0.2
0.4
0.6
0.8Global
1998
Across
Within
19931988198319781973
Index Index
26 David Dollar
primarily because regions already relatively rich in 1820 (Europe, North America)subsequently grew faster than poor locations. As noted above (Trend #1), that patternof growth was reversed starting around 1980, and the faster growth in poor locationssuch as China, India, Bangladesh and Vietnam accounts for the modest decline inglobal inequality since then. (Slow growth in Africa tended to increase inequality,faster growth in low-income Asia tended to reduce it, and the latter outweighed theformer, modestly.)4
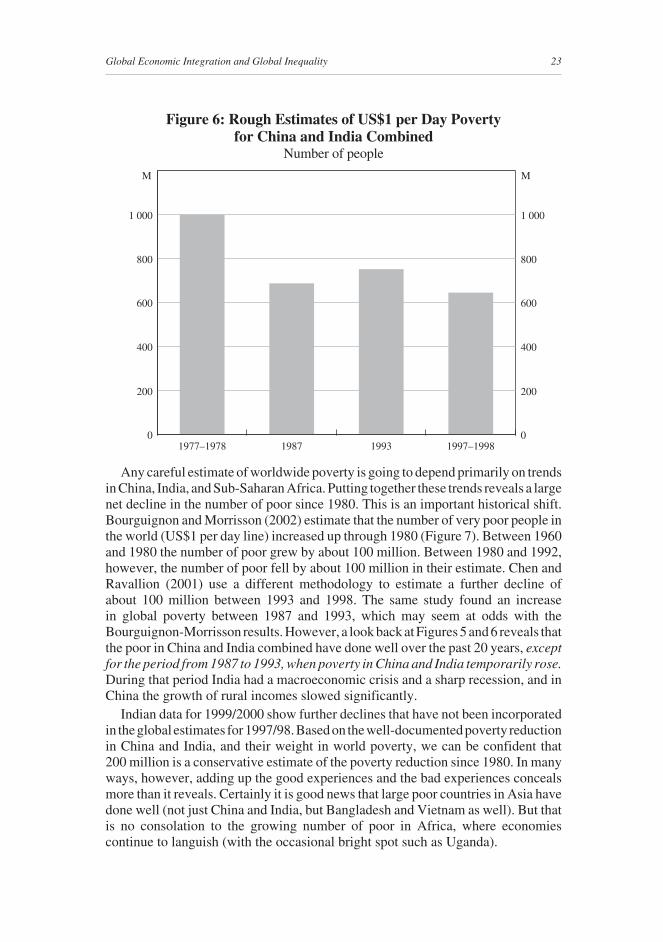
Thinking about the different experiences of Asia and Africa, as in the last section,helps give a clearer picture of what is likely to happen in the future. Rapid growthin Asia has been a force for greater global equality because that is where the majorityof the world’s extreme poor lived in 1980 and they benefited from the growth.However, if the same growth trends persist, they will not continue to be a force forequality. Sala-i-Martin projects future global inequality if the growth rates of1980–1998 persist: global inequality will continue to decline until the year 2015 or2020 (depending on the measure of inequality), after which global inequality willrise sharply (Figure 10). A large share of the world’s poor still live in India and other
4. Milanovic (2002) estimates an increase in the global Gini coefficient for the short period between1988 and 1993. How can this be reconciled with the Sala-i-Martin findings? Global inequality hasdeclined over the past two decades primarily because poor people in China and India have seenincreases in their incomes relative to incomes of rich people (that is, OECD populations). If you referback to Figure 6, you will see that the period from 1988 to 1993 was the one period in the past20 years that was not good for poor people in China and India.
Source: Sala-i-Martin (2002, Figure 17)
0.4
0.5
0.6
0.7
0.8
0.9
1.0
0.4
0.5
0.6
0.7
0.8
0.9
1.0
Mean logarithmicdeviation
2050
Theil
1975 2035202020051990
Index Index
Figure 10: Global Projections if Same Growth as 1980–1998

27Global Economic Integration and Global Inequality
Asian countries, so that continued rapid growth there will be equalising for anotherdecade or so. But more and more, poverty will be concentrated in Africa, so that ifits slow growth persists, global inequality will eventually rise again.
2.4 Trend #4: There is no general trend toward higherinequality within countries; in particular, amongdeveloping countries inequality has decreased in about asmany cases as it has increased
The analysis immediately above shows that inequality within countries plays arelatively small role in measures of global income inequality. Nevertheless, peoplecare about trends in inequality in their own societies (arguably more than they careabout global inequality and poverty). So, a different issue is, what is happening toincome inequality within countries? One of the common claims about globalisation(see the quotes in the introduction) is that it is leading to greater inequality withincountries and hence fostering social and political polarisation.
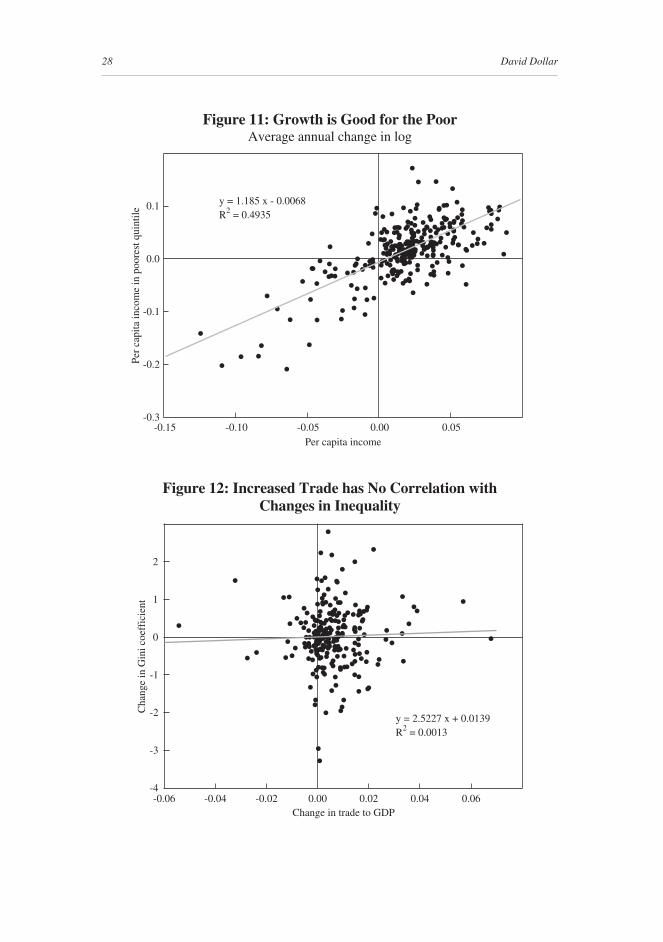
To assess this claim Aart Kraay and I (Dollar and Kraay 2001a) collected incomedistribution data from over 100 countries, in some cases going back decades. Wefound first of all that there is no general trend toward higher or lower inequalitywithin countries. One way to show this is to look at the growth rate of income of thepoorest 20 per cent of the population, relative to the growth rate of the wholeeconomy. In general, growth rate of income of the poorest quintile is the same as theper capita growth rate (Figure 11). This is equivalent to showing that the bottomquintile share (another common measure of inequality) does not vary with per capitaincome. We found that this relationship has not changed over time (it is the same forthe 1990s as for earlier decades). In other words, some countries in the 1990s hadincreases in inequality (China and the US are two important examples), while othercountries had decreases. We also divided the sample between rich and poor countriesto explore a Kuznets-type relationship (or, equivalently, included a quadratic term)and found that income of the poor tends to rise proportionately to per capita incomein developing countries, as well as in rich ones.
Most important for the debate about globalisation, we tried to use measures ofintegration to explain the changes in inequality that have occurred. But changes ininequality are not related to any of these measures of integration. For example,countries in which trade integration has increased show rises in inequality in somecases and declines in inequality in others (Figure 12). So too for other measures suchas tariff rates or capital controls. Figure 4 showed five good examples of poorcountries that have integrated actively with the world economy: in two of these(Uganda and Vietnam) income distribution has shifted in favour of the poor duringintegration, which is why poverty reduction has been so strong in these cases. Inlow-income countries in particular much of the import protection was benefitingrelatively rich and powerful groups, so that integration with the global market cango hand-in-hand with declines in income inequality.
28 David Dollar
Figure 11: Growth is Good for the PoorAverage annual change in log
Figure 12: Increased Trade has No Correlation withChanges in Inequality
●
●
●
●
● ●
●
●
●
●
●
●
●
●
●
●
●
●●
● ●
●
●
●
●●
●●●
●
●●
●
●
●
●
●
●
●
●
●
●
●
●●
● ●
●
●
●
●
●●
●●
●
●
●
● ●
●
●
●
●●
●●
●
●
●
●
●
●
●
●
●
●●
●
●
●
●
●
●
●●●
●
●
●
●
● ●●
●
●
●
●●
●
●●
●
●
●
●
●
●
●
●
●
●
●
●
●
●
●
●
●●
●
●●
●
●
●
●●
●
●
●●
●
●
●●
● ●
●
●
●
●
●
●
●
●
●
●
●
●
● ●
●
●
●
●
●
●
●
●●
●
●
●
●
●
●
●
●
●
●
●
●
● ●
●
●
●
●
●
●
●
●
●
●
●
●
●
●●
●
●
●●
●
●
●
●
●
●
●
●●
●
●●
●
●●
●●●●
● ●
●
●
●●
●
●
●
●
●
●
●
●
●
●
●
●
●
●
●
●
●
●
●●
●
●
●
● ●●
●●
●
●●
●
●
●●
● ●●
●
●
●
●
●
●●
●
●
●
●
●
●
● ●
●
●
●
●
●
●
●
●
●
●
●
●
●
-0.3
-0.2
-0.1
0.0
0.1
-0.15 -0.10 -0.05 0.00 0.05
y = 1.185 x - 0.0068R2 = 0.4935
Per capita income
Per
capi
ta in
com
ein
poo
rest
qui
ntile
●
●
●
●
●
●
●●
●
●
●
●
●
●
● ●
●
●
●
●●
●
●●
●
●
●
●
●
●
●
●
●
●
●
● ●
●
●
●
●
●
●
●●
●
●
●
●
●●●
●
●
●
●
●
●
●
●
●
●
●
●
●
●
●
●
●
●● ●
●
●●
●
●● ●
●
●
●
●
●
●
●
●
●●
●
●●
●
●●
● ●●●●
●
●
●●
●●
●
●
●
●
● ●
●●
●
●
●
●
●
●
●
●
●
●
●
●
●
●
●
●
● ●
●
●
●
●
●
●
●
●
●
●
●
●
●
●
●
●●
●
●
●
●
●
●
●
●
●
●
●
●
● ●●
●
●●●
●
●
●●
●
●
●●
●
●
●
●
●
●●
●
●●
●
●
●
●
●
●
●
●
●
●
●
●
●
●
●
●
●
●●
●
●●
●
●
●
●
●
●
● ●●
●
●●●
●
●
●
●
●
●
●
●
-4
-3
-2
-1
0
1
2
-0.06 -0.04 -0.02 0.00 0.02 0.04 0.06Change in trade to GDP
Cha
nge
in G
ini c
oeff
icie
nt
y = 2.5227 x + 0.0139R2 = 0.0013

29Global Economic Integration and Global Inequality
While it is true that there is no general trend toward higher inequality withincountries when looking at all the countries of the world, the picture is not sofavourable if one looks only at rich countries and only at the last decade. TheLuxembourg Income Study (LIS) has produced comparable, high-quality incomedistribution data for most of the rich countries. This work finds no obvious trends ininequality up through the mid to late 1980s. Over the past decade, on the other hand,there have been increases in inequality in most of the rich countries. Becauselow-skilled workers in these countries are now competing more with workers in thedeveloping world, it is certainly plausible that global economic integration createspressures for higher inequality in rich countries, while having effects in poorcountries that often go the other way. The good news from the LIS studies is that‘[g]lobalisation does not force any single outcome on any country. Domesticpolicies and institutions still have large effects on the level and trend of inequalitywithin rich and middle-income nations, even in a globalising world...’ (Smeeding,this volume, p 179). In other words, among rich countries some have managed tomaintain stable income distributions in this era of globalisation through their socialand economic policies (on taxes, education, welfare).
2.5 Trend #5: Wage inequality is rising worldwideMuch of the concern about globalisation in rich countries relates to workers and
what is happening to wages and other labour issues. The most comprehensive examination of globalisation and wages used International Labour Organisation data on very detailed occupational wages going back two decades (Freeman, Oostendorp and Rama 2001). These data look across countries at what is happening to wages for very specific occupations (bricklayer, primary school teacher, nurse, auto worker). What the study found is that wages have generally been rising faster in globalising developing countries than in rich ones, and faster in rich ones than in non-globalising developing countries (Figure 13).5 However, their detailed findings are far more complex. First, there is a timing issue. Trade liberalisation is often associated with reduced wages initially, followed by increases past the initial level. Second, foreign direct investment (FDI) is very strongly related to wage increases, while trade has a weaker relationship. Locations that are able to attract FDI are the ones that have had the clearest gains for workers (examples would be northern Mexico, China, Vietnam), whereas countries that liberalise trade and get little foreign investment see weaker benefits. Finally, the gains are relatively larger for skilled workers. This finding is consistent with other work showing that there has been a worldwide trend toward greater wage inequality – that is, a larger gap between pay for educated workers and pay for less educated/skilled workers.
5. Dollar and Kraay (2001b) divide developing countries into more globalised and less globalised; themore globalised are the top one-third of developing countries in terms of increases in trade to GDPbetween the late 1970s and the late 1990s. The Freeman, Oostendorp and Rama study uses thisclassification.

30 David Dollar
Figure 13: Poor Countries that Globalised Have Seenthe Fastest Growth in Wages
Wage growth between 1980s and 1990s
If wage inequality is going up worldwide, how can it be that income inequality isnot rising in most countries? There are several reasons why these two trends are notinconsistent. Most important, in the typical developing country wage earners are atiny fraction of the population. Even unskilled wage workers are a relatively elitegroup. Take Vietnam as an example, a low-income country where we have a surveyof the same representative sample of households early in liberalisation (1993) andfive years later. The majority of households in the sample and in the country arepeasants. What we see in the household data is that the price of the main agriculturaloutput (rice) went up dramatically while the price of the main purchased input(fertiliser) actually went down. These price movements are directly related toglobalisation, because over this period Vietnam became a major exporter of rice(supporting its price) and a major importer of fertiliser from cheaper producers(lowering its price). The typical poor family got a much bigger ‘wedge’ between itsinput price and output price, and their real income went up dramatically (Benjaminand Brandt 2002). So, one of the most important forces acting on income distributionin this low-income country has nothing to do with wages.
Quite a few rural households also sent a family member to a nearby city to workin a factory for the first time. I worked on Vietnam for the World Bank from 1989to 1995, and one of the issues that I covered was the manufacturing sector. When Ifirst started visiting factories in the summer of 1989, the typical wage in localcurrency was the equivalent of US$9 per month. Now, factory workers makingcontract shoes for US brands often make US$50 per month or more. So, the wage for
0
5
10
15
20
25
30
0
5
10
15
20
25
30
More globalised countries
%%
Rich countriesLess globalised countries

31Global Economic Integration and Global Inequality
a relatively unskilled worker has gone up something like five-fold. But wages forsome of the skilled occupations – say, computer programmer or English interpreter –may have gone up 10 times or even more. Thus, a careful study of wage inequalityis likely to show rising inequality. However, how wage inequality translates intohousehold inequality is very complex. For a surplus worker from a large ruralhousehold who gets one of the newly created jobs in a shoe factory, earnings go fromzero to US$50 per month. Thus, if a large number of new wage jobs are created andif these typically pay a lot more than people earn in the rural or informal sector, thena country can have rising wage inequality but stable or even declining incomeinequality (in Vietnam the Gini coefficient for household income inequality actuallydeclined between 1993 and 1998). In rich countries, on the other hand, where mostpeople are wage earners, the higher wage inequality is likely to translate into higherhousehold income inequality, which is what we have seen over the past decade.
A third point about wage inequality and household income inequality that isrelevant for rich countries is that measures of wage inequality are often made pre-tax.If the country has a strongly progressive income tax, then inequality measures fromhousehold data (which are often post-tax) do not have to follow wage inequality,pre-tax. Tax policy can offset some of the trends in the labour market.
Finally, there is the important issue that households can respond to increased wageinequality by investing more in the education of their children. A higher economicreturn to education is not a bad thing, provided that there is fair access to educationfor all. In Vietnam, there has been a tremendous increase in the secondary schoolenrolment rate in the 1990s (from 32 to 56 per cent). This increase partly reflects thesociety’s and the government’s investment in schools (supported by aid donors), butmore children going to school also reflects households’ decisions. If there is little orno perceived return to education, it is much harder to get families in poor countriesto send their children to school. Where children have decent access to education, ahigher skill premium stimulates a shift of the labour force from low-skill tohigher-skill occupations.
From this discussion it is easy to see why some labour unions in rich countries areconcerned about integration with the developing world. It is difficult to prove thatthe integration is leading to this greater wage inequality, but it seems likely thatintegration is one factor. Concerning the immigration side of integration, Borjas,Freeman and Katz (1997) estimate that flows of unskilled labour into the US havereduced wages for such labour by 5 per cent from where they would be otherwise.The immigrants who find new jobs earn a lot more than they did before (10 times asmuch in one study), but their competition reduces wages of the US workers who werealready doing such jobs. Similarly, imports of garments and footwear from countriessuch as Vietnam and Bangladesh create jobs for workers there that pay far more thanother opportunities in those countries, but put pressure on unskilled wages in the richcountries.
Thus, overall the era of globalisation has seen unprecedented poverty reductionand probably a modest decline in global inequality. However, it has put real pressureon less-skilled workers in rich countries, and this competitive pressure is a key

32 David Dollar
reason why the growing integration is controversial in the industrial countries andwhy there is a significant political movement to restrict the opportunities of poorcountries. More generally, the integration causes disruption in both rich countriesand poor ones. Some people are thrown out of work, some capitalists lose theirinvestments; in the short run there are clearly winners and losers. To some extent theextreme claims of anti-globalists that integration is leading to higher inequalityacross and within countries – claims that are not borne out by the evidence – distractattention from the real issues. Globalisation is disruptive, it produces relativewinners and losers, and there are public policies that can mitigate these bad effects(social protection, investment in education). The key policy issue is whether to tryto mitigate the bad effects of integration or to roll back integration.
3. Making Globalisation Work Better for the PoorWhat are the implications of these findings – for developing countries, for rich
countries, and for non-government organisations that care about global poverty? Sofar, the most recent wave of globalisation starting around 1980 has been a powerfulforce for equality and poverty reduction. But it would be naïve to think that this willinevitably continue.
Whether global economic integration continues to be an equalising force willdepend on the extent to which poor locations participate in this integration, and thatin turn will depend on both their own policies and the policies of the rich world. Trueintegration requires not just trade liberalisation, but also wide-ranging reforms ofinstitutions and policies. If we look at some of the countries that are not participatingvery strongly in globalisation, many of them have serious problems with the overallinvestment climate: Kenya, Pakistan, Burma and Nigeria would all be examples.Some of these countries also have restrictive policies toward trade, but even if theyliberalise trade not much is likely to happen without other measures. It is not easyto predict the reform paths of these countries. (If you think about some of the relativesuccesses that I have cited – China, India, Uganda, Vietnam – in each case theirreform was a startling surprise.) As long as there are locations with weak institutionsand policies, people living there are going to fall further and further behind the restof the world in terms of living standards.
Building a coalition for reform in these locations is not easy, and what outsiderscan do to help is limited. But one thing that the rich countries can do is to make it easyfor developing countries that do choose to open up, to join the club. Unfortunately,in recent years the rich countries have been making it harder for countries to join theclub of trading nations. The GATT was originally built around agreements concerningtrade practices. Now, however, a certain degree of institutional harmonisation isrequired to join the World Trade Organisation (WTO) (for examples, on policiestoward intellectual property rights). The proposal to regulate labour standards andenvironmental standards through WTO sanctions would take this requirement forinstitutional harmonisation much farther. Power in the WTO is inherently unbalanced:size matters in the important area of dispute settlement where only larger countriescan effectively threaten to retaliate against illegal measures. If the US wins an unfair

33Global Economic Integration and Global Inequality
trade practices case against Bangladesh it is allowed to impose punitive duties onBangladeshi products. Owing to the asymmetry in the size of these economies thepenalties are likely to impose a small cost on US consumers and a large one onBangladeshi producers. Now, suppose the situation is reversed and Bangladesh winsa judgment against the US. For Bangladesh to impose punitive duties on US productsis likely to hurt its own economy much more than the US. Thus, developing countriessee the proposal to regulate their labour and environmental standards through WTOsanctions as inherently unfair and as a new protectionist tool that rich countries canwield against them.
So, globalisation will proceed more smoothly if the rich countries make it easy fordeveloping countries to benefit from trade and investment. Reciprocal tradeliberalisations have worked well throughout the post-war period. There still areserious protections in OECD countries against agricultural and labour-intensiveproducts that are important to developing nations. It would help substantially toreduce these protections. At the same time, developing countries would benefit fromfurther openings of their own markets. They have a lot to gain from more trade inservices. Also, 70 per cent of the tariff barriers that developing countries face arefrom other developing countries. So, there is a lot of potential to expand trade amongdeveloping countries, if trade restrictions were further eased. However, the trend touse trade agreements to try to impose an institutional model from the OECDcountries on Third World countries makes it more difficult to reach trade agreementsthat benefit poor countries.
Another reason to be pessimistic concerns geography. There is no inherent reasonwhy coastal China should be poor – or southern India, or Vietnam, or northernMexico. These locations historically were held back by misguided policies, and withpolicy reform they can grow very rapidly and take their natural place in the worldincome distribution. However, the same reforms are not going to have the sameeffect in Mali or Chad. Some countries have poor geography in the sense that theyare far from markets and have inherently high transport costs. Other locations facechallenging health and agricultural problems. So, it would be naïve to think that tradeand investment can alleviate poverty in all locations. Much more could be done withforeign aid targeted to developing medicines for malaria, AIDS, and other healthproblems of poor areas and to building infrastructure and institutions in theselocations. The promises for greater aid from the US and Europe at the MonterreyConference were encouraging, but it remains to be seen if these promises arefulfilled.
The importance of geography also raises the issue of migration – the missing flowin today’s globalisation. Migration from locations that are poor because of eitherweak institutions and/or difficult physical geography could make a large contributionto reducing poverty in the lagging regions. Most migration from South to North iseconomically motivated. This migration raises the living standard of the migrant andbenefits the sending country in three ways – reducing the labour force raises wagesfor those who remain behind, migrants typically send a large volume of remittancesback home, and their presence in the OECD economy can support the developmentof trade and investment networks. These benefits are strongest if the migrant is

34 David Dollar
relatively unskilled, since this is the part of the labour force that is in over-supply inmuch of the developing world.
Each year 83 million people are added to world population, 82 million of these inthe developing world. Furthermore, populations in Europe and Japan are ageing andthe labour forces there will begin to shrink without more migration. So, there areclear economic benefits to more migration of unskilled workers from the South tothe North, and yet this flow remains highly restricted and very controversial becauseof its impact on society and culture. Because the economic pressures are so strong,however, growing volumes of illegal immigration are taking place – and some of theworst abuses of ‘globalisation’ occur because we are not globalised when it comesto labour flows.
Realistically, none of the OECD countries is going to adopt open migration. Butthere is a good case to be made to revisit migration policies. Some of the OECDcountries have a strong bias in their immigration policies toward highly skilledworkers, spurring ‘brain drain’ from the developing world. This policy pushes muchof the unskilled flow into the illegal category. If OECD countries would accept –legally – more unskilled workers, it should help with their own looming labourshortages, improve living standards in sending countries, and reduce the growingillegal human trade with all of its abuses.
So, integration of poor economies with richer ones has provided many opportunitiesfor poor people to improve their lives. Examples of the beneficiaries of globalisationwill be found among Mexican migrants, Chinese factory workers, Vietnamesepeasants and Ugandan farmers. Lots of non-poor in developing and rich countriesalike also benefit, of course. But much of the current debate about globalisationseems to ignore the fact that it has provided many poor people in the developingworld unprecedented opportunities. After all of the rhetoric about globalisation isstripped away, many of the practical policy questions come down to whether we aregoing to make it easy for poor communities that want to integrate with the worldeconomy to do so, or whether we are going to make it difficult. The world’s poor havea large stake in how the rich countries answer these questions.

35Global Economic Integration and Global Inequality
ReferencesAw BY, S Chung and MJ Roberts (2000), ‘Productivity and Turnover in the Export Market:
Micro-Level Evidence from Taiwan (China) and The Republic of Korea’, World BankEconomic Review, 14(1), pp 65–90.
Benjamin D and L Brandt (2002), ‘Agriculture and Income Distribution in Rural Vietnamunder Economic Reforms: A Tale of Two Regions’, World Bank Policy ResearchWorking Paper, forthcoming.
Bhagwati J (1992), India’s Economy: The Shackled Giant, Clarendon Press, Oxford.
Borjas GJ, RB Freeman and LF Katz (1997), ‘How Much Do Immigration and Trade AffectLabor Market Outcomes’, Brookings Papers on Economic Activity, 1, pp 1–67.
Bourguignon F and C Morrisson (2001), ‘Inequality among World Citizens: 1820–1992’,DELTA Working Paper 2001-25.
Bourguignon F and C Morrisson (2002), ‘Inequality among World Citizens: 1820–1992’,The American Economic Review, forthcoming.
Chen S and M Ravallion (2001), ‘How did the World’s Poorest Fare in the 1990s?’, Reviewof Income and Wealth, 47(3), pp 283–300.
Collier P and R Reinikka (2001), ‘Reconstruction and Liberalization: An Overview,’ inP Collier and R Reinikka (eds), Uganda’s Recovery: The Role of Farms, Firms, andGovernment, Regional and Sectoral Studies, World Bank, Washington DC, pp 30–39.
Dollar D and A Kraay (2001a), ‘Growth is Good for the Poor’, World Bank Policy ResearchWorking Paper No 2587.
Dollar D and A Kraay (2001b), ‘Trade, Growth, and Poverty’, World Bank Policy ResearchWorking Paper No 2199.
Dollar D and B Ljunggren (1997), ‘Going Global: Vietnam’, in P Desai (ed), Going Global:Transition from Plan to Market in the World Economy, MIT Press, Cambridge,pp 439–471.
Eckaus R (1997), ‘Going Global: China’,’ in P Desai (ed), Going Global: Transition fromPlan to Market in the World Economy, MIT Press, Cambridge, pp 415–437.
Freeman R, R Oostendorp and M Rama (2001), ‘Globalization and Wages’, World Bank,Washington DC, processed.
Goswami O, AK Arun, S Gantakolla, V More, A Mookherjee (CII) and D Dollar,T Mengistae, M Hallward-Driemier, G Larossi (World Bank) (2002), ‘Competitivenessof Indian Manufacturing: Results from a Firm-Level Survey’, Research Report byConfederation of Indian Industry (CII) and The World Bank.
Haddad M (1993), ‘The Link Between Trade Liberalization and Multi-Factor Productivity:The Case of Morocco’, World Bank Discussion Paper No 4.
Haddad M and A Harrison (1993), ‘Are There Spillovers from Direct Foreign Investment?Evidence from Panel Data for Morocco’, Journal of Development Economics, 42(1),pp 51–74.
Harrison A (1994), ‘Productivity, Imperfect Competition, and Trade Reform: Theory andEvidence’, Journal of International Economics, 36(1/2), pp 53–73.
Lindert P and J Williamson (2001), ‘Does Globalization Make the World More Unequal?’,NBER Working Paper No 8228.

36 David Dollar
Liu L and J Tybout (1996), ‘Productivity Growth in Chile and Columbia: The Role of Entry,Exit, and Learning’, in MJ Roberts and JR Tybout (eds), Industrial Evolution inDeveloping Countries: Micro Patterns of Turnover, Productivity and Market Structure,Oxford University Press, New York, pp 73–103.
Milanovic B (2002), ‘True World Income Distribution, 1988 and 1993: First CalculationsBased on Household Surveys Alone’, Economic Journal, 112(476), pp 51–92.
Roberts M and J Tybout (1996), Industrial Evolution in Developing Countries: MicroPatterns of Turnover, Productivity and Market Structure, Oxford University Press,New York.
Romer P (1993), ‘Idea Gaps and Object Gaps in Economic Development’, Journal ofMonetary Economics, 32(3), pp 543–573.
Sala-i-Martin X (2002), ‘The Disturbing “Rise” of Global Income Inequality’, NBERWorking Paper No 8904.
Srinivasan TN (2001), ‘Indian Economic Reforms: Background, Rationale, Achievements,and Future Prospects’, in NSS Narayana (ed), Economic Policy and State Intervention:Selected Papers of TN Srinivasan, Oxford University Press, New York, pp 230–270.
Wacziarg R (1998), ‘Measuring Dynamic Gains from Trade’, World Bank Policy ResearchWorking Paper No 2001.