global data and analytical challenges in the 21 century
TRANSCRIPT

Global Data and Analytical Challenges
in the 21st Century CAS Spring Meeting, Vancouver 2013
1
Property
2
Agenda • Need for Benchmarking • Adjusting US Data for Use in Other Countries
• Property Per Risk Example • Establish strong US benchmark
o Validation to external sources • Explicitly adjust for differences between US and target countries
o Using COPE (ARM) adjustments
• International Data Collection • Global Benchmarking • Collecting carrier specific data
• “Tripod” Approach – Integrating Multiple Applications • Ground-Up Loss Costs • Excess Layers for Non-Cat Business • Cat modeling
3
4
Need for Benchmarking
• Supplements Individual Company Experience • Helps to place Individual Company Experience in a Broader Context • Enhances the Credibility and Stability of the Analyses • Provides Greater Knowledge about Very Large Events
o May be Under-estimated/Mis-estimated in Smaller Views of Experience
• Regulatory (e.g. Solvency II) pressures to establish benchmarking framework
Source: CARe-IT1 – June 2012; Perspectives from America – May 2012 by John Buchanan

Adjusting US Data for International Use
5
Basic Steps in Adjusting US Excess Loss Curves for International
Step 1: Validate US Curves – Want Strong Proxy Anchor o US Commercial Property market is 1.5 x size of 7 initial target countries combined o Evaluate credibility of US original and fitted data – in total and by component o Validate using actual vs. expected large losses (from 25mm to 250mm; NFPA 20 years)
6
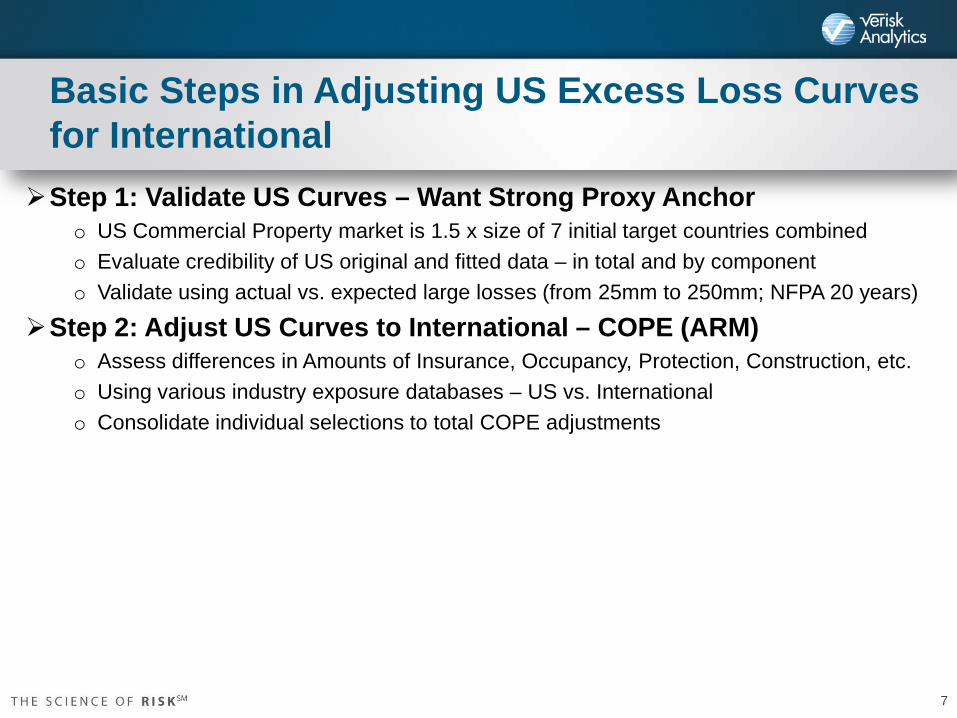
Basic Steps in Adjusting US Excess Loss Curves for International
Step 1: Validate US Curves – Want Strong Proxy Anchor o US Commercial Property market is 1.5 x size of 7 initial target countries combined o Evaluate credibility of US original and fitted data – in total and by component o Validate using actual vs. expected large losses (from 25mm to 250mm; NFPA 20 years)
Step 2: Adjust US Curves to International – COPE (ARM) o Assess differences in Amounts of Insurance, Occupancy, Protection, Construction, etc. o Using various industry exposure databases – US vs. International o Consolidate individual selections to total COPE adjustments
7

Basic Steps in Adjusting US Excess Loss Curves for International
Step 1: Validate US Curves – Want Strong Proxy Anchor o US Commercial Property market is 1.5 x size of 7 initial target countries combined o Evaluate credibility of US original and fitted data – in total and by component o Validate using actual vs. expected large losses (from 25mm to 250mm; NFPA 20 years)
Step 2: Adjust US Curves to International – COPE (ARM) o Assess differences in Amounts of Insurance, Occupancy, Protection, Construction, etc. o Using various industry exposure databases – US vs. International o Consolidate individual selections to total COPE adjustments
Step 3: Validate Proxy Curves with Industry Data (First Level )
o Industry large loss information (FPA-UK, other sources) o Compare actual vs. expected claim counts at various attachment points o Cross country comparisons – counts and occupancy differences
8

Basic Steps in Adjusting US Excess Loss Curves for International
Step 1: Validate US Curves – Want Strong Proxy Anchor o US Commercial Property market is 1.5 x size of 7 initial target countries combined o Evaluate credibility of US original and fitted data – in total and by component o Validate using actual vs. expected large losses (from 25mm to 250mm; NFPA 20 years)
Step 2: Adjust US Curves to International – COPE (ARM) o Assess differences in Amounts of Insurance, Occupancy, Protection, Construction, etc. o Using various industry exposure databases – US vs. International o Consolidate individual selections to total COPE adjustments
Step 3: Validate Proxy Curves with Industry Data (First Level )
o Industry large loss information (FPA-UK, other sources) o Compare actual vs. expected claim counts at various attachment points o Cross country comparisons – counts and occupancy differences
Step 4: Further Validate with Participant Data Collection (Second Level)
o Submissions: individual large claims o Aggregated exposure information
9

Establish Credibility of Collected Claim Information Growth In Claims – 2002 to 2012
10

Review Granularity – Results by Occupancy Paired Average Severity Relativities
Underlying actual average severities by Rating Group range from 9k (Billboards), to over 500k (Petro) 11
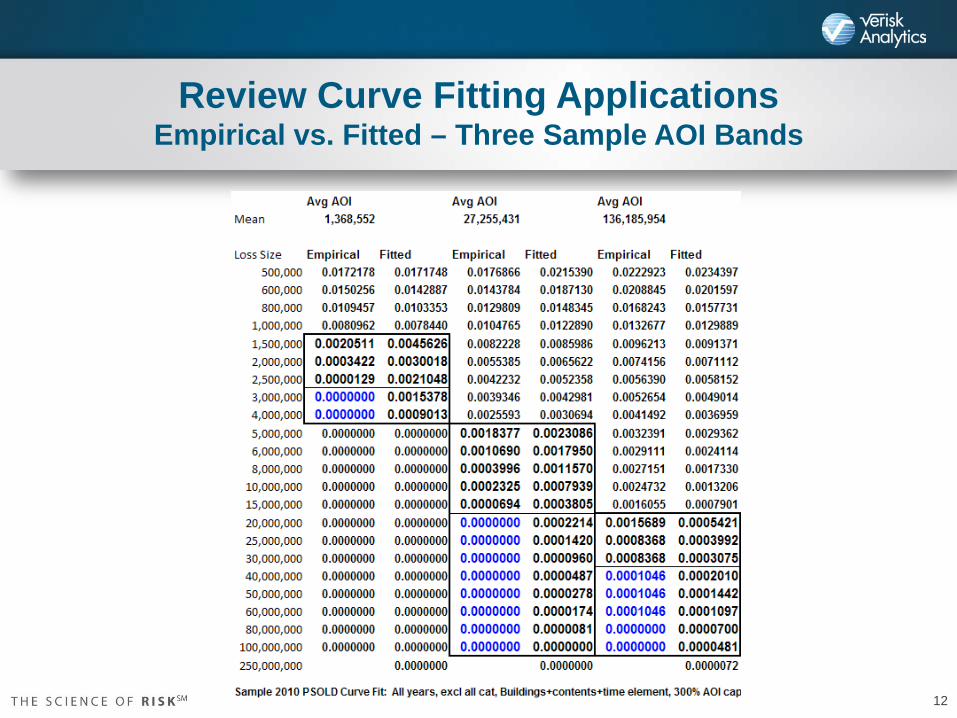
Review Curve Fitting Applications Empirical vs. Fitted – Three Sample AOI Bands
12
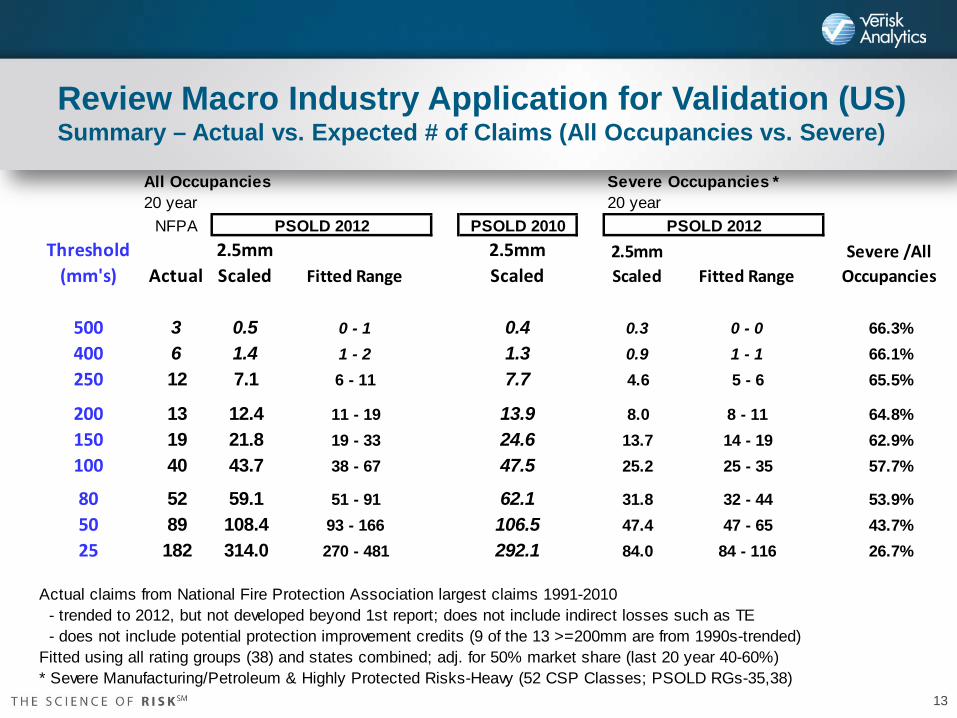
Review Macro Industry Application for Validation (US) Summary – Actual vs. Expected # of Claims (All Occupancies vs. Severe)
All Occupancies Severe Occupancies *20 year 20 year
NFPA PSOLD 2010Threshold
(mm's) Actual2.5mm Scaled Fitted Range
2.5mm Scaled
2.5mm Scaled Fitted Range
Severe /All Occupancies
500 3 0.5 0 - 1 0.4 0.3 0 - 0 66.3%400 6 1.4 1 - 2 1.3 0.9 1 - 1 66.1%250 12 7.1 6 - 11 7.7 4.6 5 - 6 65.5%
200 13 12.4 11 - 19 13.9 8.0 8 - 11 64.8%150 19 21.8 19 - 33 24.6 13.7 14 - 19 62.9%100 40 43.7 38 - 67 47.5 25.2 25 - 35 57.7%
80 52 59.1 51 - 91 62.1 31.8 32 - 44 53.9%50 89 108.4 93 - 166 106.5 47.4 47 - 65 43.7%25 182 314.0 270 - 481 292.1 84.0 84 - 116 26.7%
Actual claims from National Fire Protection Association largest claims 1991-2010 - trended to 2012, but not developed beyond 1st report; does not include indirect losses such as TE - does not include potential protection improvement credits (9 of the 13 >=200mm are from 1990s-trended)Fitted using all rating groups (38) and states combined; adj. for 50% market share (last 20 year 40-60%)* Severe Manufacturing/Petroleum & Highly Protected Risks-Heavy (52 CSP Classes; PSOLD RGs-35,38)
PSOLD 2012 PSOLD 2012
13

1.Start with a list of potential differences between the US and target countries o Standard in Property Underwriting is COPE – Construction, Occupancy, Protection, and
Exposure o To this list, we add ARM: Amounts of Insurance, Rebuilding costs, Miscellaneous
2.Assess whether each item would favorably or unfavorably impact expected loss results compared to the US
o e.g. expected to reduce (positive) or increase (negative) the excess losses, no impact or unknown
3.Attempt to evaluate magnitude of the impact of each item o Low, Medium, High, or unknown
4.Tally the expected cumulative effect of each of the COPE (ARM) items o Include direction and magnitude of all items o Could vary for example by groups of occupancies (e.g. Facilities)
5.Reconcile total impact assessment to historical excess loss layers vs. US o Review actual number of large claims to US, using exposure base such as $B of subject
premium o Review cross country comparisons
6.Can do the same for Ground-up Loss Costs as proxy outside the US
US to International Property Risk Excess Loss Factors COPE Assessment Matrix – Steps

15
US to International Property Risk Excess Loss Factors COPE Assessment Matrix (for illustration only)
Same procedure can be applied for Ground-up Loss Costs
16
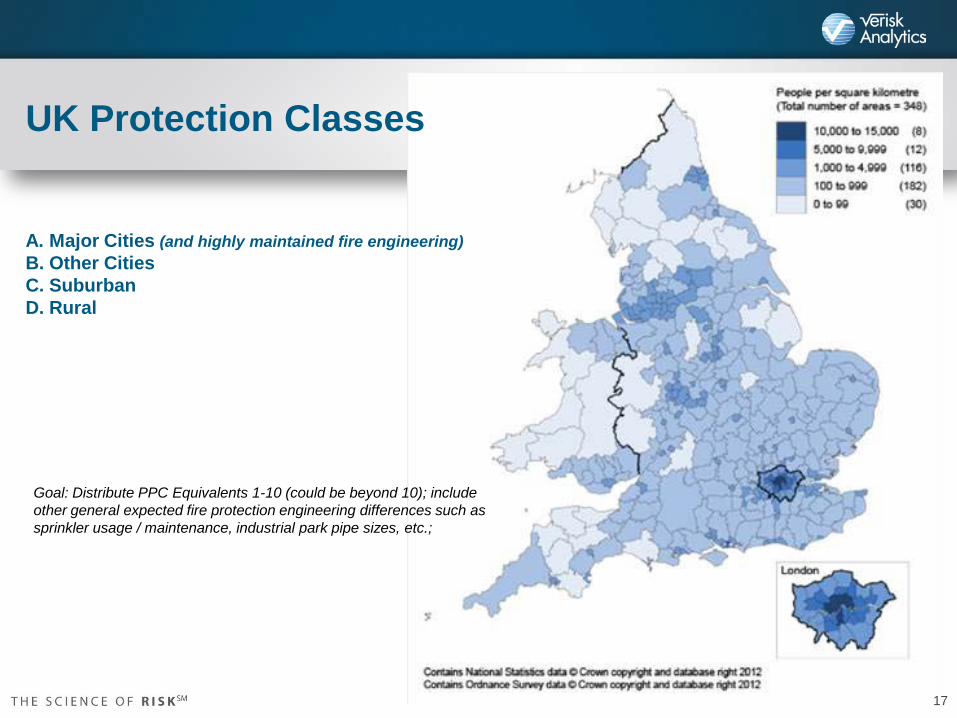
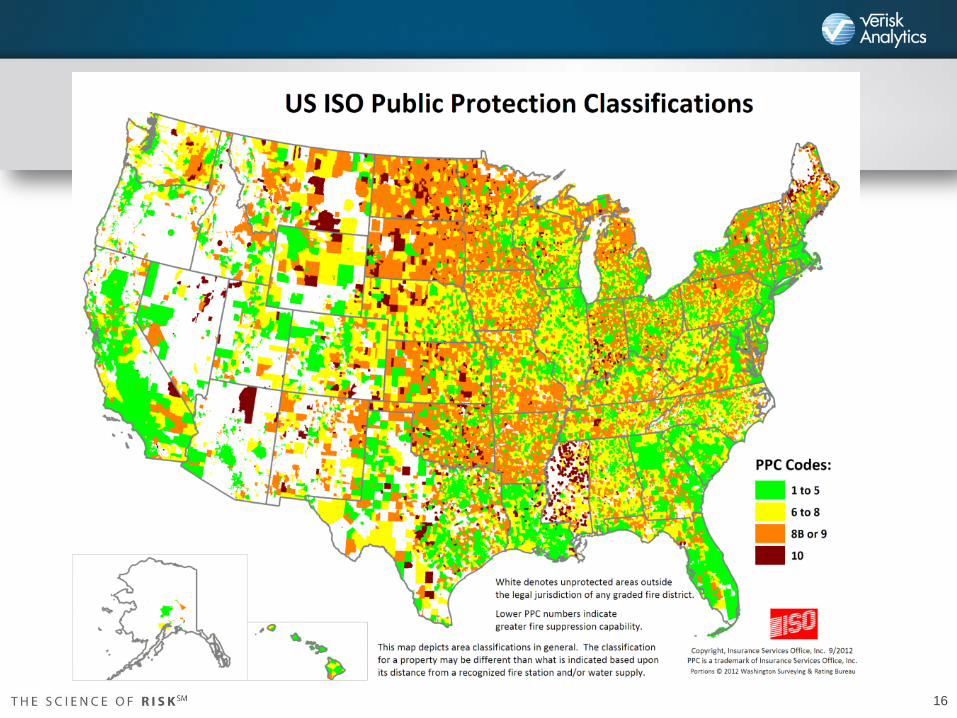
UK Protection Classes A. Major Cities (and highly maintained fire engineering) B. Other Cities C. Suburban D. Rural
Goal: Distribute PPC Equivalents 1-10 (could be beyond 10); include other general expected fire protection engineering differences such as sprinkler usage / maintenance, industrial park pipe sizes, etc.;
17

PSOLD – Adjustments for Construction ISO Manual – Sample Loss Cost Page by Construction
18

Further Validate Proxied Curves to Actual Claims Summary – Actual vs. Expected # of Claims (All Occupancies) (Illustrative)
19

PSOLD International Cross Country Comparison (Illustrative)
0.00
0.10
0.20
0.30
0.40
0.50
0.60
0.70
$25.0 $30.0 $50.0 $100.0 $150.0 $200.0 $250.0
PSOLD International - Comparison of Large Claims by Country - Illustrative# of Large Claims Per $Bn of Subject Premium (Thresholds in $mm)
Country A Country B Country C US - 5 yr US - 20 yr
20

International Data - Global Benchmarking
21

Global Benchmarking – Data Collection
22
Further Validate with Company Data Collection o Market Size / concentration o Submissions: individual large claims o Aggregated exposure information o Estimate actual and expected claim counts and ratios for various
layers o These ratios could be used to further scale up or down the US
Proxy curves

PSOLD International – Countries
2013 Target Lines / Countries
• Further validate initial countries: • 3 initial: UK, Germany, France • Others in process: Australia, Brazil, Japan, Netherlands
• Other potential targets: • Belgium, China, Hong Kong, Ireland, Italy, Japan,
Mexico, Switzerland, Turkey
23

“Tripod” Approach Integrating Multiple
Applications
24
Overall Approach • Steps to Price – Case Study • Ground-up Loss Costs • Excess Pricing • Linkage – PCImport Macro Facility oExpansion of LOI’s larger than 10M
• Using Portal – for non-admitted business o 6 month updates oCan also use as proxy to estimate non-US class based loss costs, using
similar COPE and LOI scaling procedure used in PSOLD International • Cat / Noncat – Tripod - 2014
25

Illustrative Case Study: Large U.S. Hotels
• A hypothetical hotel chain needs insurance on 50 hotels spread over 17 states • Individual property values range from $6M to $120M; aggregate value: $2.6B • Coverage: “All Risks of Direct Physical Loss, Damage, or Destruction….”; terrorism exclusion • Layers starting: $5M xs $5M, …, $200M xs $100M • Sublimit of $100M for California earthquake peril only
26

Illustration of Excess Layering: $5M excess of $5M What are the expected cat and noncat losses for this layer?
California Hotel AOI = $20M; Construction =
Modified Fire Resistive
Georgia Hotel AOI = $6M; Construction =
Joisted Masonry
Total value for 50 hypothetical hotels = $2.6B
Total expected ground-up loss costs = $7.1M (cat = $3.6M, non-cat = $3.6M)
27

Step 1: Will Want to Estimate Ground-up Loss Costs
• ISO’s advisory loss costs o Licensed by 1,500 U.S. insurers — 90% of the Commercial Lines market
and 45% of Personal Lines market oBroad database with credible data at a very detailed level oUseful benchmark for underwriting, pricing, and compliance with solvency
regulations • Can be used to estimate
oGround-up loss costs on class basis in absence of other information oComparison to actual charged or expiring premiums
28
Portal to ISO US Information
• Provides ISO’s advisory loss costs and Rating Factors o Full Detail Available oState/National Averages Also Available oAvailable in level of detail used in CAT Modeling
• Primarily for Non-Admitted Market oUpdated twice yearly
• Ease of Use oQuick Access to Information oMay be downloaded/exported
29
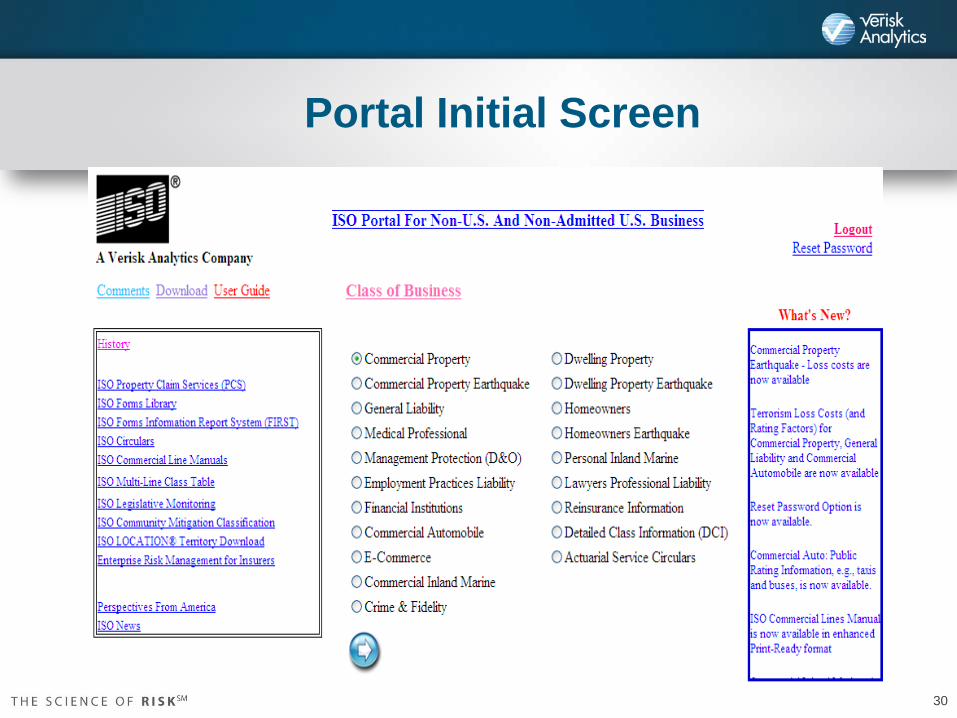
Portal Initial Screen
30

Portal Sample Heat Map
31

Loss Cost Table: Sample (Basic Group 1)
32

Step 2: Estimate Excess Layer Expected Losses
• ISO’s Property Size of Loss Database (PSOLD) oPSOLD curves based on 20 years of U.S. claims data reported to ISO
with loss detail linked to exposure information by amount of insurance, state, occupancy, coverage, peril, etc.
oCombines very detailed distributions in appropriate mix reflecting location-level ground-up losses
o Linkage to primary CSP industry and AIR cat model occupancies • Macro industry validation for working and high excess layers
oValidation to NFPA data on all-industry basis to 200M • PSOLD has over 1 million individual curves
o 60 AOI bands, 38 occupancies, 50 states, 4 sets of perils, etc.
33

AOI = $20,000,000 (insured value)
60% of losses are less than or equal to 25% of AOI. Therefore, 60% of the total ground-up loss costs pays for losses related to the first $5,000,000 of building value [$5,000,000= 25% x 20,000,000]
75% of the ground-up losses pays the losses for the first $10,000,000 of building value [$10,000,000 = 50% x 20,000,000]
Therefore, would want to collect 15% (75.0%-60.0%) of the total ground-up expected loss costs for the $5M excess of $5M layer
* PSOLD has over 1 million individual curves for 60 AOI bands, 38 occupancies, 50 states, 4 sets of perils, etc.
Property Excess Rating: Noncatastrophe Losses First Loss Scale Illustration — $5M Excess of $5M
34

Understanding Risk
AIR Cat Modeling
PSOLD Excess Layer
Analysis
Non-cat Ground-Up Loss Cost
Tripod Concepts Cat / Noncat - Verisk (ISO / AIR) Solution
35

Case Study: 50 U.S. Location Results: By Peril
About 50% of GULC
are Noncat About 43% of 1st Layer
LC are Noncat
About 80% of 3rd Layer LC are cat , mostly EQ
and HU
36

View both Cat/Non-cat analyses results in tandem By Location
Location ID Cat Expected Losses Non-Cat Expected Losses
Full Cover 5xs5 … Full Cover 5xs5 …
33
999 88 … 25,000 1,422 …
69
16,828 467 … 12,075 1,111 …
1
1,759 252 … 14,140 1,417 …
35
1,959 452 … 12,425 1,280 …
64
2,559 254 … 7,210 744 …
61
154,302 22,923 … 11,655 1,400 …
3
1,510 141 … 27,510 2,939 …
70
7,597 709 … 32,235 3,857 …
… … … … … … … Total 50
Hotels
3,581,188 480,391 3,566,510 382,389 … 37
Application to International Risks
• Start with ISO’s advisory loss costs oMay be Used in ISO Occupancy Class Code Detail oMay be Aggregated --- Mapped to AIR Level of Detail oDetailed Starting Point Available for US
• Match Attributes of Risk
• Employ COPE Adjustments oUse Adjustments based on Comparisons with Other Countries
• Supplement with Local/Risk Specific Knowledge • Use Country-Specific PSOLD Curves (as previously described) • Run Country-Specific CAT Model
38

Case Study: 50 European Locations
About 90% of GU and 1st Layer LC are Noncat in UK
and FR 39

Excess Layer Validation Illustration Cross Country Comparison
0.00
0.10
0.20
0.30
0.40
0.50
0.60
0.70
$25.0 $30.0 $50.0 $100.0 $150.0 $200.0 $250.0
PSOLD International - Comparison of Large Claims by Country - Illustrative# of Large Claims Per $Bn of Subject Premium (Thresholds in $mm)
Country A Country B Country C US - 5 yr US - 20 yr
40

Ongoing Development • Enhanced Integration of Ground Up Loss Costs and Excess Layers
o Linkage of GULC and PSOLD excess factors o Extend GULC threshold from 10M up to 100M – 200M
• Enhanced Scale Adjustment Factors (US and International application) o Protection / Occupancies comparisons to defaults when using PCImport Facility o COPE and LOI enhancements o PSOLD and Ground Up Loss Costs
• Integration with AIR Cat Models (2014) o Combined Cat/Non-cat information o Location specific information on a combined basis
• Portal to ISO US Information o Updated twice a year o State and National Averages
41

Questions ?
42