global contraceptive commodity gap analysis 2018 · commodity gap analysis 2018 4 if total funding...
TRANSCRIPT

Global Contraceptive Commodity Gap Analysis 2018
MARCH 2018

Copyright © 2018 Reproductive Health Supplies Coalition Brussels: Reproductive Health Supplies Coalition. March 2018. Global Contraceptive Commodity Gap Analysis 2018
ACKNOWLEDGEMENTS
The Reproductive Health Supplies Coalition extends its thanks to the authors of the Global Contraceptive Commodity Gap Analysis 2018: Nina Miller, Michelle Weinberger, and John Skibiak. We are grateful to Emily Sonneveldt and Track20 for partnering with us in acquiring data from IQVIA, and to IQVIA’s Peter Stephens, who generously shared his expertise and insights. We thank Lester Coutinho for challenging us to better understand the nuances of the private sector, and Chris Purdy for sharing data and guidance on social marketing organizations. We also express our gratitude to our colleagues at FP2020 and to John Stover, Jacqui Darroch, Vladimira Kantorova, Jennie Greaney, and Desmond Koroma for sharing data and contributing to our analysis. We thank our partners who have turned to the CGA for data to help in their own planning and advocacy efforts, including DfID, the Bill and Melinda Gates Foundation, the Global Financing Facility, UNFPA, and USAID. Finally, we thank RHSC Secretariat member Lucian Alexe for his skillful design and layout of this publication.

1COMMODITY GAP ANALYSIS 2018
Section 1
Key Findings
Readers Guide
Section 2
Four Key Questions and Answers: 135 LMI Countries
Four Key Questions and Answers: 69 FP2020 Countries
Section 3
Discussion
New Data on Private Sector Prices
Annex
2
4
6
8
9
17
26
27
32
40

2COMMODITY GAP ANALYSIS 2018
1S E C T I O N
Introduction

3COMMODITY GAP ANALYSIS 2018
This edition of Global Contraceptive Commodity Gap Analysis 2018 (CGA 2018) is the Reproductive Health Supplies Coalition’s fourth report to highlight disparities between the growing demand for family planning services and the resource base required to provide the supplies on which services depend.
The first two reports, published in 2001 and 2009, examined funding shortfalls in the public sector alone. Our third report, the Global Contraceptive Commodity Gap Analysis 2016 (CGA 2016), broadened the scope of analysis to include the private as well as the public sector. It expanded the range of countries to include 135 low-and middle-income countries, and it projected two growth scenarios: one based on historical trajectory, the other on the achievement of the FP2020 goal of 120 million additional users of family planning in 2020. It also drew on input from the reproductive health community to identify four key questions to guide the analysis:
› How much is spent on contraceptive supplies, and what are the relative contributions of donors, governments, and individuals?
› How many women use each method of contraception, and what volume of supplies do they consume? How much will these figures change by 2020?
› What is the cost of the volume of supplies currently consumed by all users of contraception? How much greater will the cost be in 2020?
› Will funding gaps emerge as we move closer to 2020? If public sector funding does not increase, what burden will shift to individual users of contraception?
In this edition of the CGA, we follow the broad outlines set out in 2016. We project growth in contraceptive use along each country’s historical trajectory and revisit the four key questions. We also, for the first time, probe more deeply into the division between the public and private sectors. We draw on updated data from the diverse sources we used last year, and introduce entirely new data – particularly data on private sector pricing and procurement. We also reflect, in a more nuanced way, the implications of declining public sector funding for the role of the private sector, in terms of the latter’s absorptive capacity, equity, and contraceptive availability.
The results of this analysis suggest that by 2020, there will be 493 million users of contraception in the 135 low- and middle-income countries, of whom 337 million will live in the 69 FP2020 countries.
Meeting their contraceptive consumption needs over the next three years will require $8.45 billion across the 135 countries, and $3.5 billion in the FP2020 countries alone. In both cases, out of pocket expenditures will account for the vast majority of that financing. The new data have also allowed us to see an inverse relationship between cost and users across the public and private sectors. Among the 69 FP2020 countries, for example, we found that while the public sector contributed only 37% to total spending, it actually supported 58% of users.
Many of the findings and observations contained in this report have already been shared at public fora and our analysis has benefitted immensely from the feedback to emerge from these exchanges. This has been especially true with respect to our analysis of private sector pricing, which now carefully applies both full market price retail sales (based on newly acquired pricing and sales data from IQVIA) and subsidized products sold by social marketing and other non-public organizations.
Through this insight and a richer array of data, we can better appreciate the differences not only between the public and private sectors, but also within the sectors themselves. The data reveal dramatic price variations for core contraceptive commodities, and they document how these variations manifest themselves, both geographically and by product.
As our community increasingly turns its attention to operationalizing the Sustainable Development Goals, understanding better the role of donors, national governments, and the private sector will be critical. Commodity financing over the next decade will see a declining donor resource base – about that, there is little debate. Out of pocket expenditures will increase, as will the contributions of national governments. But as we plan for the coming decade, the real challenge will be to figure how to make the most of our existing resource base; how to allocate resources that maximize both comparative advantages and manageable interests. This report goes a long way to providing the evidence that will help answer these pressing questions. It reminds us, as the saying goes, to mind the gap.

4COMMODITY GAP ANALYSIS 2018
If total funding for supplies remains at the current level, while the consumption cost grows…
Over the next three years (2018 through 2020), women will. . .
Total annual spending on contraceptive supplies across 135 LMI countries is currently $2.55 billion.*
International donors spent $267 million on supplies, or 10% of total spending.
Country governments spent $196 million on supplies, or 8% of total spending.
Individuals spent $2.09 billion on supplies sold by the private sector, or 82% of total spending.
For every $1.00 the public sector (international donors and country governments) spent on supplies, individuals spent $4.50 to purchase their supplies from private sector retailers.
In 2017, there were 461 million users of contraception living in 135 LMI countries.
The likely addition of 31.4 million users of contraception over the next three years will raise the number of users of contraception to 493 million in 2020.
Consume 3.58 billion cycles of contraceptive pills
Receive 1.11 billion doses of injectable contraceptives
Receive 30.5 million IUDs Receive 21.2 million implants
The cumulative funding gap over three years (2018 through 2020) will be $793 million.
The cumulative cost of all supplies consumed over the next three years will be $8.45 billion.
The funding gap will be $290 million in 2020, for that year alone.
In 2020, the total volume of supplies consumed by all users will cost $2.84 billion.
A funding gap of $238 million will emerge in 2018.
In 2017, the total volume of supplies consumed by users of contraception cost $2.76 billion.
$ 2.55 bn
$ 267 mn
$ 196 mn
$ 2.09 bn
1:4.5
461 mn
493 mn
$ 793 mn
$ 8.45 bn
$ 290 mn
$ 2.84 bn
$ 238 mn
$ 2.76 bn
KEY FINDINGS FOR 135 LMI COUNTRIES
$2.55 bntotal
82% Private Sector-Individuals
8%10% Public Sector-Donors
Public Sector-Governments
Two long-acting and permanent (sterilization and implant) and two short-term (injectable, male condom) methods of contraception will gain users over the next three years.
There will be slight declines in the number of users of pills and IUDs over the next three years.
*Total spending on supplies is the annual average calculated from three years of data (2014–2016).
3.58 bn 1.11 bn 30.5 mn 21.2 mn

5COMMODITY GAP ANALYSIS 2018
If total funding for supplies remains at the current level, while the consumption cost grows…
Over the next three years (2018 through 2020), women will. . .
Total annual spending on contraceptive supplies in the 69 FP2020 countries is currently $1.03 billion.*
International donors spent $247 million on supplies, or 24% of total spending.
Country governments spent $136 million on supplies, or 13% of total spending.
Individuals who bought supplies from the private sector spent $650 million, or 63% of total spending.
Two-thirds of all spending came from individuals who bought supplies from private sector retailers.
In 2017, there were 309 million users of contraception living in the 69 FP2020 countries.
The likely addition of 28.1 million users of contraception over the next three years will raise the number of users of contraception to 337 million in 2020.
Consume 2.05 billion cycles of contraceptive pills
Receive 846 million doses of injectable contraceptives
Receive 20.6 million IUDs Receive 18.2 million implants
The cumulative funding gap over three years (2018 through 2020) will be $402 million.
The cumulative cost of all supplies consumed over the next three years will be $3.5 billion.
The funding gap will be $175 million in 2020, for that year alone.
In 2020, the total volume of supplies consumed by all users will cost $1.21 billion.
A funding gap of $93.1 million will emerge in 2018.
In 2017, the total volume of supplies consumed by users of contraception cost $1.09 billion.
$ 1.03 bn
$ 247 mn
$ 136 mn
$ 650 mn
2/3
309 mn
337 mn
$ 402 mn
$ 3.50 bn
$ 175 mn
$ 1.21 bn
$ 93.1 mn
$ 1.09 bn
KEY FINDINGS FOR THE 69 FP2020 COUNTRIES
$1.03 bntotal
63% Private Sector-Individuals
13%24% Public Sector-Donors
Public Sector-Governments
Two long-acting and permanent (sterilization and implant) and two short-term (injectable, male condom) methods of contraception will gain users over the next three years.
There will be fewer users of pills, and the number of IUD users will remain level over the next three years.
*Total spending on supplies is the annual average calculated from three years of data (2014–2016).
2.05 bn 846 mn 20.6 mn 18.2 mn

6COMMODITY GAP ANALYSIS 2018
Reader’s Guide
Scope
The CGA 2018 report presents findings for 135 countries categorized by the World Bank as low- and middle-income (LMI).1 China and Venezuela, both of which are categorized as middle-income, are not included in our analysis. The report also shows findings for the sub-group of 69 FP2020 countries.2
Users of each method of contraception
Our estimate of the total number of users of modern contraception comprises individual estimates for each of the 135 LMI countries. Estimates for the 69 FP2020 countries were calculated using the FPET3 model, which uses data collected by DHS4, MICs5, PMA20206, and national and subnational health, socio-economic, and fertility surveys, as well as high-quality service statistics. Estimates for the 66 non-FP2020 countries were calculated using UN Population Division model-based estimates.7 Data from DHS, MICs, and similar surveys were used to identify the number of users of each contraceptive method, and where they obtained their supplies (from either the public or private sectors).8
Change over time
Projections of the total number of users for the years 2018 through 2020 were produced using the FPET model and UN Population Division data.
The median projections were used from these sources, representing our best estimates of how contraceptive use will change in the coming years.
Projected changes in the number of users of each method, including shifts in method mix, were developed for this report based on sub-regional patterns of change seen in recent survey data.
Method mix by use and cost
The CGA 2018 report analyzes method mix in two ways: by use and by cost. The user method mix shows the percentage of all users of modern contraception that use each method. The cost method mix shows the relative cost of the quantity of supplies consumed by the users of each method. Method use and cost are disaggregated by the six most prevalent contraceptive methods and a seventh category representing the least used methods, called other9:
Long-term and permanent methods (LAPMs)
› Sterilization (male and female)
› Implant
› IUD
Short-term methods
› Injectable
› Pill
› Condom (male; for contraception only)
› Other
Consumption quantity
The consumption quantity is the amount of supplies that a user of contraception must personally consume over the course of a year to avoid becoming pregnant, multiplied by the number of users. Different approaches were used to estimate consumption quantities for short-term versus long-term and permanent methods. Users of short-term methods must consume multiple products each year to obtain a full year of coverage. By contrast, a subset of users of implants, IUDs, and sterilizations will have no need to consume any supplies in the current year. Consumption quantities were attributed to either the public or private sector using data that indicates whether a user of contraception obtained her supplies from a public or private sector source.
Please note that consumption quantities are different from procurement volumes bought by institutional purchasers, which may be above or below the quantities needed for user consumption.10

7COMMODITY GAP ANALYSIS 2018
Consumption cost
The consumption cost reflects the consumption quantity of supplies multiplied by their price. This includes both the cost of the contraceptive commodity itself as well as associated clinical supplies. The consumption cost does not include other cost factors like fees paid for necessary medical services or required visits, taxes, freight, or tariffs, nor does it capture the effects of inflation or fluctuations in currency exchange rates.
To produce our public sector consumption cost estimates, we used the country-specific analysis of commodity and associated clinical supply prices produced by the Guttmacher Institute for their annual Adding It Up11 report. The Guttmacher analysis takes into account variations in the price paid in the public sector for contraceptive commodities and associated clinical supplies in a country, as well as the mix of different products (e.g. types of implants) used, to
produce an average cost per method for each country. In addition, for eight LAC countries, we used information obtained through an RHSC survey that asked governments to identify the prices of contraceptive commodities they procure.12
To represent the mix of subsidized and non-subsidized products sold by the private sector, private sector consumption costs were calculated from two sources of price data. We multiplied commercial price data provided by IQVIA for implants, doses of injectables, and pill cycles by the corresponding volumes of each. We applied public sector prices to volumes of commodities and supplies sold by social marketing organizations (as indicated in data collected by DKT International).13 Where data were insufficient to make volume estimates, we took a conservative approach: IQVIA prices were applied only to implants, doses of injectables, and pill cycles purchased from private sector pharmacies and medical practices.
Public Sector
Public sector spending is the average of three-years’ (2014-2016) of international donor and country government expenditures. We believe that using an average allows us to even out the year-to-year fluctuations that occur due to the timing and size of procurement orders. This also allows us to maximize the available data, since not all sources provide estimates for all years.
International Donor
This category captures direct spending on supplies, monetary contributions used to underwrite supply procurement, the value of in–kind contributions of supplies, basket funds provided by donors and used by governments to procure supplies, and World Bank loan funds used to procure supplies across LMI countries.
Government
This category comprises spending by the governments of 135 LMI countries using non-donor, non-basket fund, and non-World Bank loan revenue to procure contraceptive supplies for domestic use.
Private Sector
This category represents the average annual consumption cost over the three year period (2014-2016) for all users of contraception who obtained their supplies from a private sector source, as well as a small amount of spending by corporate entities.
We assume that supplies obtained from the private sector are paid for out-of-pocket by individuals (mainly women). We recognize, however, that in some cases cost may be borne by an employer or insurer.
Types of spending
Total spending on supplies includes expenditures by public sector entities that may have procured volumes above or below user consumption quantities.14

8COMMODITY GAP ANALYSIS 2018
2S E C T I O N
Four Key Questions and Answers

9COMMODITY GAP ANALYSIS 2018
Aggregated across 135 LMI countries, the CGA 2018 analysis suggests donors, governments, and individuals currently spend $2.55 billion annually on commodities and supplies for all modern methods of contraception (Figures 1.1, 1.2).
Donors contributed 10% ($267 million) of the total amount spent on supplies.
The governments of the 135 LMI countries spent $196 million in non-donor funds to purchase contraceptive supplies for domestic use, which represents just 8% of total spending.
The public sector (donors and governments combined) accounts for 18% of total spending on supplies, or $463 million.
Public sector spending was calculated from three years of data (2014 – 2016) on expenditures by international donors and governments. This methodology is different from that used for the CGA 2016 report, which presented an estimate of public sector spending based on a single year of data (2014). Due to this change, the CGA 2016 and CGA 2018 estimates are not truly comparable.
Individual women spent $2.09 billion out-of-pocket to purchase their supplies from private sector retailers. This estimate, which we refer to in this report as “private sector-individual” spending, is more than double the estimate published in the CGA 2016 report. The increase is largely the result of applying new data on the private sector price of supplies for three methods (implant, injectable, and pill).15
FIGURE 1.1
FIGURE 1.2. CURRENT SPENDING ON CONTRACEPTIVE SUPPLIES | 135 LMI COUNTRIES
How much is spent on contraceptive supplies, and what are the relative contributions of international donors, country governments, and individuals?
RESULTS FOR 135 LMI COUNTRIES
TOTAL SPENDING ON SUPPLIES
PUBLIC SECTOR SPENDING
DONOR GOVERNMENT
PRIVATE - INDIVIDUAL SPENDING
$2,550,000,000
18% $463,000,000 82% $2,090,000,000
10% | $267,000,000 8% | $196,000,000
$2.55 bntotal
82% Private Sector-Individuals
8%10% Public Sector-Donors
Public Sector-Governments
1

10COMMODITY GAP ANALYSIS 2018
There were 461 million users of contraception living in the 135 LMI countries in 2017 (Table 1.1). This number will grow by 31.4 million, or 7%, over the next three years. Growth will not be distributed equally among all methods of contraception; some methods will gain more users than
others, and the use of two methods (IUDs and contraceptive pills) will diminish. As the number of users of each method changes, so will the distribution of the user method mix (Table 1.2).16
Implants will have the greatest percentage increase in use over the next three years (37%); in 2020, there will be an additional 5.46 million women using implants. This does not mean, however, that there will be 5.46 million implant insertions from 2018 through 2020, as the total number of users includes women who had implants inserted in prior years. There are currently far fewer users of implants than there are of most other methods, so despite the growth in use, implants will represent only 4% of the user method mix in 2020.
Injectable contraceptives will have the largest net increase in use. By 2020, 14.1 million additional women will bring the total number of users of injectables to 92.5 million. Injectables are currently the fourth most prevalent method in the 135 LMI countries; in 2020, it will be the second most prevalent method, with a 19% share of the overall user method mix.
How many women use each method of contraception, and what volume of supplies do they consume? How much will these figures change by 2020?
RESULTS FOR 135 LMI COUNTRIES
TABLE 1.1. NUMBER OF USERS OF CONTRACEPTION
135 LMI COUNTRIES, 2017 - 2020
Change
2017 2018 2019 2020 2017 vs. 2020
Total users 461,000,000 472,000,000 483,000,000 493,000,000 31,400,000 7%
Sterilization 149,000,000 150,000,000 152,000,000 153,000,000 4,100,000 3%
Implant 14,700,000 16,400,000 18,200,000 20,100,000 5,460,000 37%
IUD 45,300,000 44,800,000 44,200,000 43,600,000 (1,740,000) -4%
Injectable 78,500,000 83,100,000 87,800,000 92,500,000 14,100,000 18%
Pill 86,600,000 85,900,000 85,200,000 84,300,000 (2,300,000) -3%
Condom 82,600,000 86,200,000 89,900,000 93,600,000 11,100,000 13%
Other 4,860,000 5,100,000 5,350,000 5,650,000 785,000 16%
TABLE 1.2. USE OF CONTRACEPTION - METHOD MIX
135 LMI COUNTRIES, 2017 - 2020
2017 2018 2019 2020
Sterilization 32% 32% 31% 31%
Implant 3% 3% 4% 4%
IUD 10% 9% 9% 9%
Injectable 17% 18% 18% 19%
Pill 19% 18% 18% 17%
Condom 18% 18% 19% 19%
Other 1% 1% 1% 1%
2
11COMMODITY GAP ANALYSIS 2018
RESULTS FOR 135 LMI COUNTRIES
The number of women who use contraceptive pills, by contrast, will decrease by 2.3 million (-3%), from 86.6 million in 2017 to 84.3 million in 2020. Pills were the second most prevalent method of contraception in 2017. Due to its decline in use and gains by other methods, it will be the fourth most prevalent method in 2020.
Sterilization will remain the most prevalent method of contraception in 2020. There will be 4.1 million additional sterilized men and women of reproductive age in 2020; despite this increase, there will be a one percentage point decline in the relative use of sterilization due to gains made by other methods.
In the aggregate, it is difficult to generalize future trends for LAPMs or short-term methods as a whole. Two LAPMs (sterilization, implant) will gain users, as will two short-term methods (injectable, condom). There will be fewer users of one LAPM and one short-term method (IUD and pill, respectively).
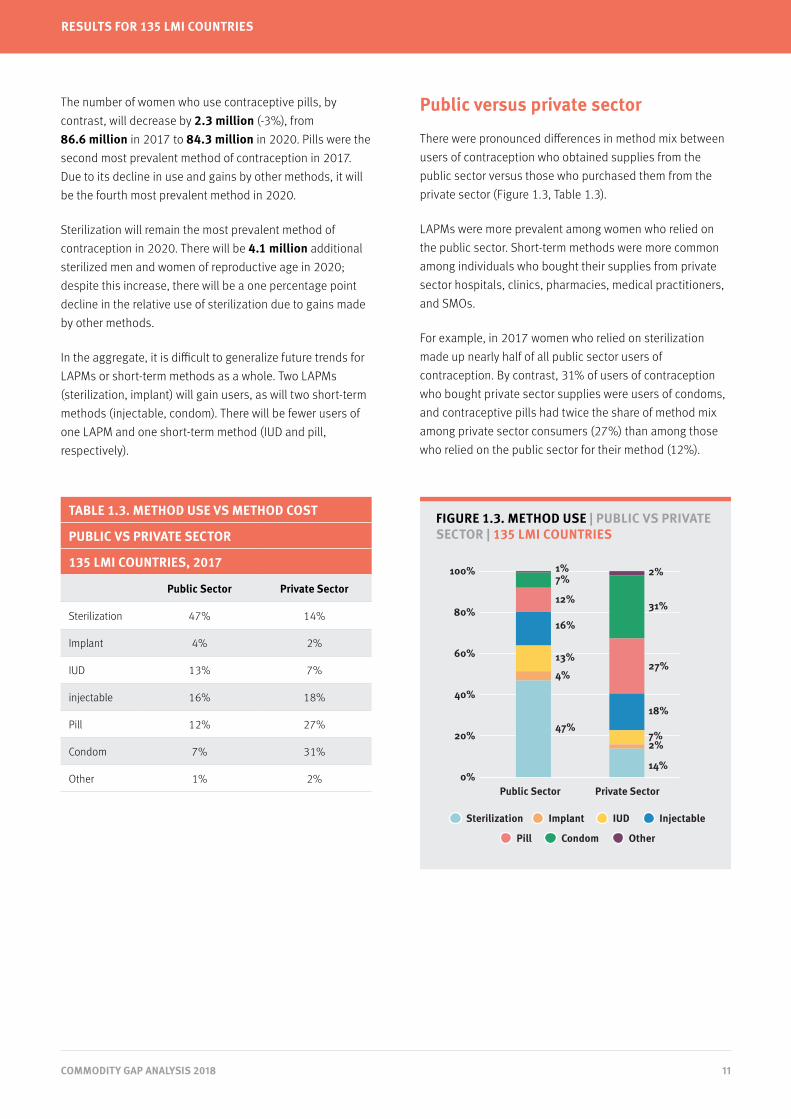
Public versus private sector
There were pronounced differences in method mix between users of contraception who obtained supplies from the public sector versus those who purchased them from the private sector (Figure 1.3, Table 1.3).
LAPMs were more prevalent among women who relied on the public sector. Short-term methods were more common among individuals who bought their supplies from private sector hospitals, clinics, pharmacies, medical practitioners, and SMOs.
For example, in 2017 women who relied on sterilization made up nearly half of all public sector users of contraception. By contrast, 31% of users of contraception who bought private sector supplies were users of condoms, and contraceptive pills had twice the share of method mix among private sector consumers (27%) than among those who relied on the public sector for their method (12%).
FIGURE 1.3. METHOD USE | PUBLIC VS PRIVATE SECTOR | 135 LMI COUNTRIES
0%
20%
40%
60%
80%
100%
Sterilization
Public Sector Private Sector
Pill Condom Other
Implant IUD Injectable
47%
4%
13%
16%
12%
7%1%
14%
2%7%
18%
27%
31%
2%
TABLE 1.3. METHOD USE VS METHOD COST
PUBLIC VS PRIVATE SECTOR
135 LMI COUNTRIES, 2017
Public Sector Private Sector
Sterilization 47% 14%
Implant 4% 2%
IUD 13% 7%
injectable 16% 18%
Pill 12% 27%
Condom 7% 31%
Other 1% 2%

12COMMODITY GAP ANALYSIS 2018
RESULTS FOR 135 LMI COUNTRIES
Consumption of supplies
As the total number of users of contraception grows each year, so too will the volume of supplies they consume. To quantify these volumes, we estimate the amount of supplies the users of each method must consume to obtain a year of protection from unintended pregnancy.17 We refer to these volumes as the consumption quantity of each method.18
Over the next three years, the volume of supplies consumed in the 135 LMI countries will grow; however, projected shifts in method mix indicate the consumption of some methods will grow faster than others, and some will decline. (Table 1.4).
For example, women will consume 1.94 million more contraceptive implants and 57.7 million more doses of injectable contraceptives in 2020 than they did in 2017. By contrast, 32.2 million fewer contraceptive pill cycles will be consumed and 476 thousand fewer IUDs will be inserted in 2020 than in 2017.
Over the next three years (cumulatively), women will consume 3.58 billion pill cycles, and they will receive 1.11 billion doses of injectables, 30.5 million IUDs, and 21.2 million implants. Women and men will rely on 20.8 billion condoms for contraception, and male and female sterilization procedures will require 38.1 million kits.
TABLE 1.4. USER CONSUMPTION QUANTITIES OF SUPPLIES FOR EACH CONTRACEPTIVE METHOD
135 LMI COUNTRIES, 2017 - 2020
Cumulative Change
2017 2018 2019 2020 2018 to 2020 2017 vs. 2020
Sterilization 12,500,000 12,600,000 12,700,000 12,800,000 38,100,000 345,000 3%
Implant 5,790,000 6,420,000 7,070,000 7,730,000 21,200,000 1,940,000 33%
IUD 10,500,000 10,400,000 10,200,000 10,000,000 30,500,000 (476,000) -5%
Injectable 331,000,000 349,000,000 369,000,000 388,000,000 1,110,000,000 57,700,000 17%
Pill 1,210,000,000 1,200,000,000 1,190,000,000 1,180,000,000 3,580,000,000 (32,200,000) -3%
Condom 6,360,000,000 6,630,000,000 6,920,000,000 7,210,000,000 20,800,000,000 853,000,000 13%
Other 64,600,000 69,100,000 73,800,000 79,500,000 222,000,000 14,800,000 23%

13COMMODITY GAP ANALYSIS 2018
What is the cost of the volume of supplies currently consumed by all users of contraception? How much greater will the cost be in 2020?
RESULTS FOR 135 LMI COUNTRIES
In 2017, users of contraception in the 135 LMI countries consumed $2.76 billion worth of supplies at current prices (Table 1.5).
We calculated this value – which we refer to as the supply consumption cost — by multiplying the consumption quantity for each method by the price of the requisite commodity or clinical supply.19 Public sector prices were applied to supplies users receive from public sector providers.20 For the private sector, a mix of public and private sector prices were applied to implants, injectable doses, and pill cycles to represent the mix of subsidized and non-subsidized products estimated to be sold in the private sector. All other private supplies were costed with public sector prices.21
As the number of users of contraception grows, and the consumption quantities of supplies become greater, the consumption cost also increases from year to year. In 2020, the total consumption cost for supplies of all methods will be $80.5 million greater than it was in 2017. The cumulative consumption cost of supplies over the next three years (2018 through 2020) will be $8.45 billion.
The market for implants will show the greatest percentage growth in value (26%). The consumption cost of implants will grow from $78.3 million in 2017 to $98.7 million in 2020.
Injectable supplies will produce the largest net growth in cost. The consumption cost of all injectables consumed in 2017 was $582 million; by 2020, it will be $688 million, a difference of $106 million.
By contrast, the slowly diminishing number of users of pills will reduce that method’s annual consumption cost by 4% over the next three years; in 2020, the consumption cost of pills will be $73 million less than it was in 2020. Nevertheless, it is the method with the greatest three-year cumulative cost ($5.03 billion). The cumulative consumption cost of pills and injectables combined adds up to nearly $7 billion over the next three years; this amount is four-fifths (83%) of the total cumulative consumption cost for all methods of contraception.
TABLE 1.5. USER CONSUMPTION COST OF SUPPLIES FOR EACH CONTRACEPTIVE METHOD
135 LMI COUNTRIES, 2017 - 2020
Cumulative Change
2017 2018 2019 2020 2018 to 2020 2020 minus 2017
Total cost $ 2,760,000,000 $ 2,790,000,000 $ 2,820,000,000 $ 2,840,000,000 $ 8,450,000,000 $ 80,500,000 3%
Sterilization $ 84,500,000 $ 85,300,000 $ 86,100,000 $ 86,800,000 $ 258,000,000 $ 2,330,000 3%
Implant $ 78,300,000 $ 85,000,000 $ 91,800,000 $ 98,700,000 $ 276,000,000 $ 20,500,000 26%
IUD $ 51,500,000 $ 48,400,000 $ 45,300,000 $ 42,100,000 $ 136,000,000 $ (9,420,000) -18%
Injectable $ 582,000,000 $ 617,000,000 $ 652,000,000 $ 688,000,000 $ 1,960,000,000 $ 106,000,000 18%
Pill $ 1,730,000,000 $ 1,700,000,000 $ 1,680,000,000 $ 1,650,000,000 $ 5,030,000,000 $ (73,000,000) -4%
Condom $ 223,000,000 $ 233,000,000 $ 243,000,000 $ 254,000,000 $ 730,000,000 $ 30,200,000 14%
Other $ 16,700,000 $ 17,800,000 $ 19,000,000 $ 20,300,000 $ 57,100,000 $ 3,640,000 22%
3

14COMMODITY GAP ANALYSIS 2018
RESULTS FOR 135 LMI COUNTRIES
Method mix: use versus cost in the public and private sectors
Method mix as manifested in the number of users of each contraceptive method looks quite different from method mix as manifested in the consumption cost of supplies (Table 1.6).
For example, in 2017, pills represented just one-fifth (19%) of all method use, but well more than half of the consumption cost (62%). IUDs represented 10% of method use, but just 2% of method consumption cost.
The differences in method use and method consumption cost are due to several factors, including the price differences among the products required for each method, the duration of protection offered by each method, and the volume of commodities needed per year.
Disaggregating public and private sector method use and consumption cost revealed several significant insights (Figure 1.4). As previously shown, there are significant differences in the user method mix between the public and private sectors. The disparities by sector are even more pronounced in the case of the consumption cost method mixes, due to two factors. Some methods are more expensive than others due to the frequency with which one must purchase or acquire the required commodity and/or supply. Also, public sector and private consumers may pay different prices for supplies of the same method.
As shown on the left side of Figure 1.4, injectables dominate the consumption cost method mix (46%) in the public sector, despite representing only 16% of method use. In the private sector, pills account for the vast majority of the total consumption cost (75%). In fact, in 2017, the consumption cost of pills purchased from the private sector accounted for 57% of the entire (public and private sectors) consumption cost of supplies of all methods across the 135 LMI countries. This is due to two reasons: more women obtain pills from the private sector than the public sector, and the private sector purchase price of pill cycles is, on average, five times higher than the public sector price.
TABLE 1.6. METHOD MIX: USE VS COST
135 LMI COUNTRIES, 2017
Use Cost
Sterilization 32% 3%
Implant 3% 3%
IUD 10% 2%
Injectable 17% 21%
Pill 19% 62%
Condom 18% 8%
Other 1% 1%
FIGURE 1.4. METHOD USE VS METHOD COST | PUBLIC SECTOR & PRIVATE SECTOR | 135 LMI COUNTRIES, 2017
100%
80%
60%
40%
20%
0%
Sterilization
Pill Condom Other
Implant IUD Injectable Sterilization
Pill Condom Other
Implant IUD Injectable
100%
80%
60%
40%
20%
0%
47%
10%
9%
5%
46%
23%
7%1%
4%
13%
16%
12%
7%1%
14%
1%1%1%13%
75%
8%1%
2%7%
18%
27%
31%
2%
Public Sector Private Sector

15COMMODITY GAP ANALYSIS 2018
Will funding gaps emerge as we move closer to 2020? If public sector funding does not increase, what burden will shift to individual users of contraception?
RESULTS FOR 135 LMI COUNTRIES
If the amount spent annually on contraceptive supplies remains at the current level while the number of women who need supplies continues to grow, a funding gap of $238 million will emerge in 2018 (Table 1.7).
The gap will continue to increase each year as the discrepancy grows between the funding spent on supplies
and the consumption cost. In the year 2020, the funding gap will be $290 million. The cumulative gap over three years (2018 through 2020), will be $793 million.
A funding gap of this size could have devastating consequences for women who wish to prevent or delay pregnancy.
Donor funding currently accounts for roughly 10% of total spending on supplies (Table 1.8). For donors to maintain this share of the supplies consumption cost, they must scale up the absolute amount they spend. By the year 2020, the donor share of the annual consumption cost will be over
$311 million.22 This is $43.4 million more than their current spending level. Cumulatively over the next three years (2018 through 2020), donors must spend $903 million to maintain their share of the consumption cost burden.
TABLE 1.7. PROJECTED FUNDING GAP | COMBINED PUBLIC + PRIVATE SECTORS (100%)
135 LMI COUNTRIES, 2017 - 2020
Cumulative
2017 2018 2019 2020 2018 to 2020
Total Cost $ 2,760,000,000 $ 2,790,000,000 $ 2,820,000,000 $ 2,840,000,000 $ 8,450,000,000
Total Spending $ 2,550,000,000 $ 2,550,000,000 $ 2,550,000,000 $ 2,550,000,000 $ 7,660,000,000
Total Gap $ 209,000,000 $ 238,000,000 $ 265,000,000 $ 290,000,000 $ 793,000,000
TABLE 1.8. PROJECTED FUNDING GAP | DONOR SHARE (10%)
135 LMI COUNTRIES, 2017 - 2020
Cumulative
2017 2018 2019 2020 2018 to 2020
Cost share $ 282,000,000 $ 292,000,000 $ 301,000,000 $ 311,000,000 $ 903,000,000
Spending share $ 267,000,000 $ 267,000,000 $ 267,000,000 $ 267,000,000 $ 802,000,000
GAP $ 14,600,000 $ 24,200,000 $ 33,800,000 $ 43,400,000 $ 101,000,000
4

16COMMODITY GAP ANALYSIS 2018
RESULTS FOR 135 LMI COUNTRIES
The LMI country governments currently spend $196 million annually to purchase contraceptive supplies for domestic use (Table 1.9). This is 8% of the total amount spent on supplies across the 135 LMI countries. In order to maintain this share, governments must scale their spending each year
until it reaches $224 million in 2020.23 This is $27.6 million more than they currently spend. Cumulatively over the next three years (2018 through 2020), governments must spend $656 million to maintain their share of the consumption cost burden.
The public sector as a whole (donors and governments combined) currently accounts for nearly 20% of total spending (Table 1.10). To maintain their share, the public sector would have to scale up funding each year until it
reaches $534 million in 202024; this is $71 million more than their current spending level. In total, the public sector must spend a cumulative total of $1.56 billion to maintain its share of the consumption cost burden.
Women purchasing their own contraceptive supplies from private sector retailers account for 82% of total spending (Table 1.11). If the number of users of contraception grows as expected, in 2020 women will purchase $2.31 billion
worth of supplies from the private sector25. This is $219 million more than their current spending level. Cumulative spending over the next three years (2018-2020) would be $6.89 billion.
TABLE 1.9. PROJECTED FUNDING GAP | GOVERNMENT SHARE (8%)
135 LMI COUNTRIES, 2017 - 2020
Cumulative
2017 2018 2019 2020 2018 to 2020
Cost share $ 209,000,000 $ 214,000,000 $ 219,000,000 $ 224,000,000 $ 656,000,000
Spending share $ 196,000,000 $ 196,000,000 $ 196,000,000 $ 196,000,000 $ 588,000,000
GAP $ 13,100,000 $ 18,000,000 $ 22,800,000 $ 27,600,000 $ 68,300,000
TABLE 1.10. PROJECTED FUNDING GAP | COMBINED PUBLIC SECTOR SHARE (18%)
135 LMI COUNTRIES, 2017 - 2020
Cumulative
2017 2018 2019 2020 2018 to 2020
Cost share $ 491,000,000 $ 505,000,000 $ 520,000,000 $ 534,000,000 $ 1,560,000,000
Spending share $ 463,000,000 $ 463,000,000 $ 463,000,000 $ 463,000,000 $ 1,390,000,000
GAP $ 27,700,000 $ 42,100,000 $ 56,500,000 $ 71,000,000 $ 170,000,000
TABLE 1.11. PROJECTED FUNDING GAP | PRIVATE SECTOR-INDIVIDUAL SHARE (82%)
135 LMI COUNTRIES, 2017 - 2020
Cumulative
2017 2018 2019 2020 2018 to 2020
Cost share $ 2,270,000,000 $ 2,280,000,000 $ 2,300,000,000 $ 2,310,000,000 $ 6,890,000,000
Spending share $ 2,090,000,000 $ 2,090,000,000 $ 2,090,000,000 $ 2,090,000,000 $ 6,270,000,000
GAP $ 182,000,000 $ 195,000,000 $ 208,000,000 $ 219,000,000 $ 623,000,000

17COMMODITY GAP ANALYSIS 2018
Total spending on supplies for all modern methods of contraception across the 69 FP2020 countries currently amounts to $1.03 billion (Figure 2.1, 2.2).
Ninety-three percent of donor funding for supplies across the 135 LMI countries was spent in the subset of 69 FP2020 countries. This amount – $247 million – represents 24% of total spending on contraceptive supplies in these countries.
The governments of the 69 FP2020 countries spent $136 million in non-donor funds to purchase contraceptive supplies for domestic use. This represents 13% of total spending on supplies.26
The public sector (donors and governments combined) contributed a much larger share of supplies funding in the 69 FP2020 countries than in the 135 LMI countries (37% vs. 18%).
Despite the public sector’s more pronounced role, individuals who obtained their supplies from private sector retailers made up the largest share of spending (63%): $650 million.
This estimate is $203 million greater than the amount published in the CGA 2016 report. The increase is largely the result of applying new data on the private sector price of supplies for three methods (implant, injectable, and pill) to a subset of private sector consumption.
FIGURE 2.1
FIGURE 2.2. CURRENT SPENDING ON CONTRACEPTIVE SUPPLIES | 69 FP2020 COUNTRIES
How much is spent on contraceptive supplies, and what are the relative contributions of donors, governments, and individuals?
RESULTS FOR 69 FP2020 COUNTRIES
TOTAL SPENDING ON SUPPLIES
PUBLIC SECTOR SPENDING
DONOR GOVERNMENT
PRIVATE - INDIVIDUAL SPENDING
$1,030,000,000
37% $383,000,000 63% $650,000,000
24% | $247,000,000 13% | $136,000,000
$1.03 bntotal
63% Private Sector-Individuals
13%24% Public Sector-Donors
Public Sector-Governments
1

18COMMODITY GAP ANALYSIS 2018
More than two-thirds of all users of contraception in the 135 LMI countries live in the subset of 69 FP2020 countries. Over the next three years, the number of users of contraception in the 69 FP2020 countries will grow by 9%, from 309 million (2017) to 337 million (2020) (Table 2.1).
Growth in the total number of users of contraception does not mean there will more users of every method. For example, the number of users of implants will grow over the next three years, while the number of pill users will decline.
How many women use each method of contraception, and what volume of supplies do they consume? How much will these figures change by 2020?
RESULTS FOR 69 FP2020 COUNTRIES
TABLE 2.1. NUMBER OF USERS OF CONTRACEPTION
69 FP2020 COUNTRIES, 2017 - 2020
Change
2017 2018 2019 2020 2017 vs. 2020
Total users 309,000,000 319,000,000 328,000,000 337,000,000 28,100,000 9%
Sterilization 114,000,000 115,000,000 116,000,000 117,000,000 3,030,000 3%
Implant 12,300,000 13,800,000 15,500,000 17,200,000 4,940,000 40%
IUD 29,700,000 29,800,000 29,900,000 29,900,000 238,000 1%
Injectable 60,200,000 64,600,000 69,100,000 73,600,000 13,400,000 22%
Pill 49,400,000 49,200,000 48,900,000 48,600,000 (842,000) -2%
Condom 40,200,000 42,300,000 44,500,000 46,800,000 6,620,000 16%
Other 3,670,000 3,890,000 4,140,000 4,400,000 722,000 20%
Method mix
Despite a small decline in method mix share, from 37% in 2017 to 35% in 2020, sterilization will remain the most prevalent method in the 69 FP2020 countries (Table 2.2).
Injectable contraception was the second most prevalent method in 2017 with a 19% share of the method mix. Over the next three years, its share will increase, reaching 22% in 2020.
Despite a three year decline in the number of users and in share of the method mix, contraceptive pills will remain the third most prevalent method in 2020.
The number of users of male condoms will increase by 16% over the next three years, reaching 46.8 million in 2020. This growth give condoms and pills nearly equal shares of the user method mix in 2020 (14%).
TABLE 2.2. USE OF CONTRACEPTION - METHOD MIX
69 FP2020 COUNTRIES, 2017 - 2020
2017 2018 2019 2020
Sterilization 37% 36% 35% 35%
Implant 4% 4% 5% 5%
IUD 10% 9% 9% 9%
Injectable 19% 20% 21% 22%
Pill 16% 15% 15% 14%
Condom 13% 13% 14% 14%
Other 1% 1% 1% 1%
2

19COMMODITY GAP ANALYSIS 2018
Public sector versus private sector method mix
Method mix among individuals who obtained their supplies from the public sector has pronounced differences from method mix among those who purchased their supplies from private sector sources (Figure 2.3, Table 2.3).
Collectively, LAPMs made up 69% of the public sector method mix, while short-term methods made up 75% of the private sector method mix in 2017.
Sterilization was the predominant method used by public sector consumers. It was used by 52% of public sector users, compared to only 16% of private sector users.
Among private sector consumers, the most prevalent methods in 2017 were pills and condoms; combined, they made up 50% of the private sector user method mix.
The use of pills had nearly three times the share of the private sector method mix (25%) than of the public sector method mix (9%).
Implants represented a slightly larger share of the method mix among public sector consumers (5%) than among private sector ones (2%). In terms of absolute numbers of implant users, there were nearly 4 times as many women using an implant received by a provider in the public sector than the private sector (9.62 million and 2.67 million, respectively).
TABLE 2.3. METHOD USE | PUBLIC VS PRIVATE SECTOR | 69 FP2020 COUNTRIES, 2017
TABLE 2.3. METHOD USE VS METHOD COST
PUBLIC VS PRIVATE SECTOR
69 FP2020 COUNTRIES, 2017
Public Sector Private Sector
Sterilization 52% 16%
Implant 5% 2%
IUD 11% 7%
injectable 17% 23%
Pill 9% 25%
Condom 4% 25%
Other 1% 2%
RESULTS FOR 69 FP2020 COUNTRIES
Sterilization
Public Sector Private Sector
Pill Condom Other
Implant IUD Injectable
52%
5%
11%
17%
9%4%1%
16%
2%7%
23%
25%
25%
2%
0%
20%
40%
60%
80%
100%

20COMMODITY GAP ANALYSIS 2018
Consumption of supplies
The consumption quantity27 is the amount of supplies that a user of contraception must personally consume over the course of a year to avoid becoming pregnant, multiplied by the number of users. Different approaches were used to estimate consumption quantities for short-term versus long-term and permanent methods. Users of short-term methods must consume multiple products each year to obtain a full year of coverage. By contrast, a subset of users of implants, IUDs, and sterilizations will have no need to consume any supplies in the current year.28
As noted on the preceding section, the number of women in the 69 FP2020 countries who use implants will grow by 40% over the next three years, from 12.3 million in 2017 to 17.2 million in 2020. This is an increase of 4.94 million implant users (Table 2.4).
However, over this same period, the number of implant insertions will grow from 4.89 million insertions in 2017 to 6.65 million insertions in 2020, an increase of just 1.75 million. The smaller increase in consumption compared to users is due to the subset of women using implants received in previous years.
There will be 842,000 fewer women using pills in 2020 than there were in 2017. The quantity of pill cycles consumed by women will decrease as well, from 692 million in 2017 to 680 million in 2020. Despite the decline, there will still be a cumulative total of 2.05 billion pill cycles consumed from 2018 to 2020.
TABLE 2.4. USER CONSUMPTION QUANTITIES OF SUPPLIES FOR EACH CONTRACEPTIVE METHOD
69 FP2020 COUNTRIES, 2017 - 2020
Cumulative Change
2017 2018 2019 2020 2018 to 2020 2017 vs. 2020
Sterilization 8,960,000 9,050,000 9,130,000 9,200,000 27,400,000 237,000 3%
Implant 4,890,000 5,460,000 6,050,000 6,650,000 18,200,000 1,750,000 36%
IUD 6,830,000 6,880,000 6,870,000 6,850,000 20,600,000 21,800 0%
Injectable 246,000,000 263,000,000 282,000,000 300,000,000 846,000,000 54,700,000 22%
Pill 692,000,000 689,000,000 685,000,000 680,000,000 2,050,000,000 (11,800,000) -2%
Condom 3,090,000,000 3,250,000,000 3,420,000,000 3,600,000,000 10,300,000,000 510,000,000 16%
Other 50,700,000 55,500,000 60,700,000 66,200,000 182,000,000 15,500,000 30%
RESULTS FOR 69 FP2020 COUNTRIES

21COMMODITY GAP ANALYSIS 2018
Across the 69 FP2020 countries, the total cost of the supplies consumed by all users of contraception in 2017 was $1.09 billion (Table 2.5). The consumption cost – the quantity of supplies users consume in a year multiplied by the price of the required commodity or associated supply – will increase each year, and will amount to $1.21 billion in 2020.
While the number of users of contraception living in the 69 FP2020 countries will grow by 9% over the next three years, the supply consumption cost will increase by 11% due to projected changes in the user method mix. The cumulative cost of supplies for 2018 through 2020 will be $3.5 billion.
Implants will show the greatest percentage growth in value. The consumption cost of implants will grow 35%, from $50.3 million in 2017 to $67.9 million in 2020.
Injectables will produce the greatest increase in absolute value. The value of all units of injectables consumed in 2017 was $387 million; by 2020, it will be $486 million, an increase of $99.4 million. The cumulative cost of all doses of injectables received over three years (2018 through 2020) will be $1.36 billion.
The volume of pill cycles required by users in 2020 will cost $17 million less than it did in 2017. Nevertheless, the cumulative consumption cost of pills over three years (2018 through 2020) will be $1.29 billion, which makes it the second largest market (after injectables).
Together, the cumulative consumption cost of pills and injectables over the next three years will represent 76% of the total consumption cost of supplies of all methods.
TABLE 2.5. USER CONSUMPTION COST OF SUPPLIES FOR EACH CONTRACEPTIVE METHOD
69 FP2020 COUNTRIES, 2017 - 2020
Cumulative Change
2017 2018 2019 2020 2018 to 2020 2020 minus 2017
Total Cost 1,090,000,000 1,130,000,000 1,170,000,000 1,210,000,000 3,500,000,000 123,000,000 11%
Sterilization $ 60,700,000 $ 61,300,000 $ 61,800,000 $ 62,300,000 $ 185,000,000 $ 1,610,000 3%
Implant $ 50,300,000 $ 56,000,000 $ 61,900,000 $ 67,900,000 $ 186,000,000 $ 17,600,000 35%
IUD $ 23,500,000 $ 23,200,000 $ 22,800,000 $ 22,400,000 $ 68,400,000 $ (1,190,000) -5%
Injectable $ 387,000,000 $ 419,000,000 $ 452,000,000 $ 486,000,000 $ 1,360,000,000 $ 99,400,000 26%
Pill $ 440,000,000 $ 436,000,000 $ 430,000,000 $ 423,000,000 $ 1,290,000,000 $ (17,000,000) -4%
Condom $ 112,000,000 $ 118,000,000 $ 124,000,000 $ 130,000,000 $ 372,000,000 $ 18,500,000 17%
Other $ 12,300,000 $ 13,400,000 $ 14,600,000 $ 15,900,000 $ 44,000,000 $ 3,680,000 30%
What is the cost of the volume of supplies currently consumed by all users of contraception? How much greater will the cost be in 2020?
RESULTS FOR 69 FP2020 COUNTRIES
3

22COMMODITY GAP ANALYSIS 2018
Method mix: use versus cost in the public and private sectors
The method mix based on contraceptive use in the 69 FP2020 countries looks very different from the method mix based on consumption cost (Table 2.6). While sterilization made up the largest share of the user method mix (37%), it represented only 6% of the consumption cost in 2017. On the other hand, pills and injectables represented about one-third of users (35%) but more than three-quarters (76%) of the consumption cost.
The differences in method use and method consumption cost are due to several factors, including the price differences among the products required for each method, the duration of protection offered by each method, and the volume of commodities a user consumes per year (Figure 2.4).
TABLE 2.6. METHOD MIX: USE VS COST
69 FP2020 COUNTRIES, 2017
Use Cost
Sterilization 37% 6%
Implant 4% 5%
IUD 10% 2%
Injectable 19% 36%
Pill 16% 41%
Condom 13% 10%
Other 1% 1%
As noted earlier, in 2017, 67% of all users of contraception in the 135 LMI countries resided in the subgroup of 69 FP2020 countries. However, the supplies consumption cost for users of contraception in these countries was only 39% of the cost across all 135 LMI countries.
This divergence was caused by several related factors. The method mixes in the 69 FP2020 countries and the 66 non-FP2020 countries are different. For example, sterilization, the method with the lowest cost per user, is more prevalent in the FP2020 countries. By contrast, pills and condoms are more prevalent in the 66 non-FP2020 countries. In countries in the latter group, most of which are classified as middle-income, women frequently obtain their pill and condom supplies from the private sector, which in the aggregate charges higher prices.
Comparing consumption costs by method in the 135 LMI Countries and the 69 FP2020 countries revealed several insights. The vast majority of pill consumption cost comes from the 66 non-FP2020 countries; the 69 FP2020 countries account for just 26% of the total cost. The opposite is true for injectables. Two-thirds of the total injectable consumption cost comes from the 69 FP2020 countries.
RESULTS FOR 69 FP2020 COUNTRIES
Sterilization Pill Condom OtherImplant IUD Injectable
0%
10%
20%
30%
40%
50%
60%
70%
80% 72%
64%
46%
66%
26%
50%
73%
FIGURE 2.4. % OF 135 LMI COUNTRY CONSUMPTION WITHIN THE 69 FP2020 COUNTRIES

23COMMODITY GAP ANALYSIS 2018
Disaggregating public and private sector method use and consumption cost revealed several insights. As previously shown, there are significant differences in the user method mix between the public and private sectors. The disparities by sector are even more pronounced in the case of the consumption cost method mixes, due to two factors. Some methods are more expensive than others due to the frequency with which one must use the required commodity and/or supply. Also, public and private sector consumers may pay different prices for supplies of the same method.
In the public sector, injectables represent just 17% of the user method mix, but make up 48% of the consumption cost (Figure 2.5). This is due to the relatively higher cost of supplying injectable users over the course of a year. Within the private sector, pills represent only 25% of the user method mix, but 52% of the consumption cost. The contraceptive pill has the highest cost per user of all methods: in the public sector, the annual consumption cost per pill user is $4.84, and in the private sector, the cost is $11.01.
RESULTS FOR 69 FP2020 COUNTRIES
FIGURE 2.5. METHOD USE VS METHOD COST | PUBLIC & PRIVATE SECTOR | 69 FP2020 COUNTRIES, 2017
100%
80%
60%
40%
20%
0%
Sterilization
Pill Condom Other
Implant IUD Injectable Sterilization
Pill Condom Other
Implant IUD Injectable
100%
80%
60%
40%
20%
0%
52%
13%
9%
4%
48%
21%
5%1%
5%
11%
17%
9%4%1%
16%
2%2%1%
29%
52%
13%1%
2%7%
23%
25%
25%
2%
Public Sector Private Sector

24COMMODITY GAP ANALYSIS 2018
Will funding gaps emerge as we move closer to 2020? If public sector funding does not increase, what burden will shift to individual users of contraception?
If the amount spent annually on contraceptive supplies remains at the current level while the number of women who need supplies continues to grow, a $93.1 million funding gap will emerge this year (2018) across the 69 FP2020 countries (Table 2.7).
The gap will continue to increase each year as the discrepancy grows between the funding spent on supplies and the consumption cost. In the year 2020, the funding gap
will be $175 million. The cumulative gap over three years (2018 through 2020), will be $402 million.
A funding gap of this size could have devastating consequences for women who wish to prevent or delay pregnancy.
RESULTS FOR 69 FP2020 COUNTRIES
Donor funding currently accounts for 24% of all spending on supplies across the 69 FP2020 countries (Table 2.8). For donors to maintain this share of the consumption cost, they must scale up the absolute amount they spend.
By the year 2020, the donor share of the annual consumption cost will be $289 million. This is $41.9 million more than their current spending level. Cumulatively over the next three years (2018 through 2020), donors must spend $839 million to maintain their share of the consumption cost burden.
TABLE 2.7. PROJECTED FUNDING GAP | COMBINED PUBLIC + PRIVATE SECTORS (100%)
69 FP2020 COUNTRIES, 2017 - 2020
Cumulative
2017 2018 2019 2020 2018 to 2020
Total Cost $ 1,090,000,000 $ 1,130,000,000 $ 1,170,000,000 $ 1,210,000,000 $ 3,500,000,000
Total Spending $ 1,030,000,000 $ 1,030,000,000 $ 1,030,000,000 $ 1,030,000,000 $ 3,100,000,000
Total Gap $ 52,300,000 $ 93,100,000 $ 134,000,000 $ 175,000,000 $ 402,000,000
TABLE 2.8. PROJECTED FUNDING GAP | DONOR SHARE (24%)
69 FP2020 COUNTRIES, 2017 - 2020
Cumulative
2017 2018 2019 2020 2018 to 2020
Cost share $ 260,000,000 $ 270,000,000 $ 280,000,000 $ 289,000,000 $ 839,000,000
Spending share $ 247,000,000 $ 247,000,000 $ 247,000,000 $ 247,000,000 $ 742,000,000
GAP $ 12,500,000 $ 22,300,000 $ 32,000,000 $ 41,900,000 $ 96,200,000
4

25COMMODITY GAP ANALYSIS 2018
The 69 FP2020 country governments spend $136 million annually to purchase supplies (Table 2.9); this is 13% of total spending. To maintain this share, governments must scale up spending each year until it reaches $159 million in
2020, which is $23 million more than they currently spend. Cumulatively over the next three years (2018-2020), they must spend $460 million to maintain their share of the consumption cost.
The public sector as a whole (donors and governments combined) currently accounts for 37% of total spending (Table 2.10). To maintain this percentage, it would have to scale up funding each year until it reaches $448 million in 2020; this is $64.9 million more than their current
spending level. In total, the public sector must spend a cumulative total of $1.3 billion over the next three years (2018 through 2020) to maintain its share of the consumption cost burden.
Individuals who purchase supplies from the private sector spend $650 million annually, or 63% of total spending (Table 2.11). If contraceptive use grows in keeping with each country’s trend, individual spending will reach $760 million
in 2020, an increase of $110 million. Over three years (2018-2020), cumulative spending (2018 through 2020) by individuals will total $2.2 billion.
TABLE 2.9. PROJECTED FUNDING GAP | GOVERNMENT SHARE (13%)
69 FP2020 COUNTRIES, 2017 - 2020
Cumulative
2017 2018 2019 2020 2018 to 2020
Cost share $ 143,000,000 $ 148,000,000 $ 153,000,000 $ 159,000,000 $ 460,000,000
Spending share $ 136,000,000 $ 136,000,000 $ 136,000,000 $ 136,000,000 $ 408,000,000
GAP $ 6,880,000 $ 12,200,000 $ 17,600,000 $ 23,000,000 $ 52,800,000
TABLE 2.10. PROJECTED FUNDING GAP | COMBINED PUBLIC SECTOR SHARE (37%)
69 FP2020 COUNTRIES, 2017 - 2020
Cumulative
2017 2018 2019 2020 2018 to 2020
Cost share $ 403,000,000 $ 418,000,000 $ 433,000,000 $ 448,000,000 $ 1,300,000,000
Spending share $ 383,000,000 $ 383,000,000 $ 383,000,000 $ 383,000,000 $ 1,150,000,000
GAP $ 19,400,000 $ 34,500,000 $ 49,600,000 $ 64,900,000 $ 149,000,000
TABLE 2.11. PROJECTED FUNDING GAP | PRIVATE SECTOR-INDIVIDUAL SHARE (63%)
69 FP2020 COUNTRIES, 2017 - 2020
Cumulative
2017 2018 2019 2020 2018 to 2020
Cost share $ 683,000,000 $ 708,000,000 $ 734,000,000 $ 760,000,000 $ 2,200,000,000
Spending share $ 650,000,000 $ 650,000,000 $ 650,000,000 $ 650,000,000 $ 1,950,000,000
GAP $ 32,900,000 $ 58,500,000 $ 84,100,000 $ 110,000,000 $ 253,000,000
RESULTS FOR 69 FP2020 COUNTRIES

26COMMODITY GAP ANALYSIS 2018
3S E C T I O N
Discussion

27COMMODITY GAP ANALYSIS 2018
Projected gaps in public sector funding for contraceptive supplies threaten to slow down,
or even stop, growth in the number of users of contraception in the world’s lowest income
countries.
In 2017, 461 million users of contraception living in 135 LMI countries consumed $2.76 billion worth of supplies. Compared to the amount currently spent on supplies annually ($2.55 billion), this finding suggests that a gap between the cost of and funding for supplies has already emerged.
If total spending on supplies does not increase above the current level while the number of users of contraception grows as we project, the cumulative funding gap over the next three years (2018 – 2020) will be $793 million.
The situation is no different in the subset of 69 FP2020 countries. If spending on supplies remains at the current level ($1.03 billion) while the consumption cost of supplies grows, the cumulative gap over the next three years will be $402 million.
The landscape of donor funding for supplies is growing increasingly perilous. The CGA 2016 report assumed a worst-case scenario of level funding for supplies – a scenario that many might view as optimistic in today’s political environment.
Across the 135 LMI countries, we currently attribute 18% of total spending to the public sector; in the 69 FP2020 countries, the public sector share of spending is twice as large (37%). As a global community committed to ensuring that every woman can use the contraceptive method of her choice, it behooves us to ask what the impact of level funding for supplies will be, and who it will likely affect.
Projections of growth in the number of users of contraception between now and 2020 presume that funding for supplies will keep pace with demand. In this chapter, we ask what would happen if the public sector – to borrow a term from ecology - reaches its carrying capacity in the number of users to whom it could provide supplies.
How many users would be affected? Could they shift to buying supplies from the private sector? Is public sector spending currently serving the clients most in need of assistance? Does the private sector have the capacity to serve this many additional consumers?

28COMMODITY GAP ANALYSIS 2018
The public and private sectors have different method landscapes
In general, long-acting and permanent methods were more prevalent among women who relied on the public sector, while short-acting methods were more common among private sector consumers.
As noted earlier in this report, sterilization dominated the public-sector method mix (Figures 3.1, 3.2) in both the 135 LMI countries and the subset of 69 FP2020 countries. Among private sector consumers, pill and injectable use combined made up at least 50% of the method mix in both sets of countries.
The disparity in method coverage between the sectors becomes even more obvious when we look at each method individually (Figures 3.3, 3.4).
› 80% and 82% of users of sterilization in the 135 LMI countries and 69 FP2020 countries, respectively, obtained their procedure from the public sector.
› 77% of women in the 135 LMI countries, and 78% of women in the 69 FP2020 countries, received implants from public sector providers.
› The reverse is true of users of male condoms; 78% and 82% of condom users purchased them from the private sector in the 135 LMI and 69 FP2020 countries, respectively.
› 66% of pill users in both country sets purchased their pill cycles from the private sector.
And finally, in the case of injectables, distribution across the private and public sectors is roughly the same in both country sets.
FIGURE 3.1. METHOD USE | PUBLIC VS PRIVATE SECTOR | 135 LMI COUNTRIES, 2017
0%
20%
40%
60%
80%
100%
Sterilization
Public Sector Private Sector
Pill Condom Other
Implant IUD Injectable
47%
4%13%
16%
12%7%1%
14%2%7%
18%
27%
31%
2%
FIGURE 3.4. SHARE OF USE BY METHOD | PUBLIC VS PRIVATE SECTOR | 69 FP2020 COUNTRIES, 2017
0% 20% 40% 60% 80% 100%
Sterilization
Implant
IUD
Injectable
Pill
Condom
Other
0% 20% 40% 60% 80% 100%
Sterilization
Implant
IUD
Injectable
Pill
Condom
Other
Public sector Private Sector Public sector Private Sector
80% 20% 82% 18%78% 22%
68% 32%50% 50%
34% 66%18% 82%
32% 68%
77% 23%70% 30%
53% 47%34% 66%
22% 78%36% 64%
FIGURE 3.2. METHOD USE | PUBLIC VS PRIVATE SECTOR | 69 FP2020 COUNTRIES, 2017
0%
20%
40%
60%
80%
100%
Sterilization
Public Sector Private Sector
Pill Condom Other
Implant IUD Injectable
52%
5%11%
17%
9%4%1%
16%2%7%
23%
25%
25%
2%
FIGURE 3.3. SHARE OF USE BY METHOD | PUBLIC VS PRIVATE SECTOR | 135 LMI COUNTRIES, 2017
0% 20% 40% 60% 80% 100%
Sterilization
Implant
IUD
Injectable
Pill
Condom
Other
0% 20% 40% 60% 80% 100%
Sterilization
Implant
IUD
Injectable
Pill
Condom
Other
Public sector Private Sector Public sector Private Sector
80% 20% 82% 18%78% 22%
68% 32%50% 50%
34% 66%18% 82%
32% 68%
77% 23%70% 30%
53% 47%34% 66%
22% 78%36% 64%

29COMMODITY GAP ANALYSIS 2018
Can public sector users of contraception find their supplies in the private sector?
As shown in the preceding examples, the public and private sectors each have distinctive method landscapes. Each sector is positioned to deliver some methods more effectively than others.
Contraceptive methods that require a service, like sterilization procedures and implant insertions, are more common in the public sector health system, where there are doctors and nurses trained to provide services and a user of contraception will likely find the cost of the service and supply subsidized or provided free of charge.
By contrast, retail locations in the private sector tend to provide supplies that don’t require an accompanying service, such as pills and condoms. While our analysis did not segment the private sector into types of private sources, other analyses have shown that private pharmacies and drug retailers make up a large proportion of private sector family planning use, especially in sub-Saharan Africa.29, 30
If the public sector were unable to serve additional users of contraception, it would seem that every additional user would have to obtain their contraceptive method from a private sector source in order to maintain the current trajectory of growth in contraceptive use.
But does the private sector have the capacity to serve additional users of contraception who would otherwise seek supplies and services from the public sector? And would these women be able to obtain the methods they prefer?
The following examples point to one way a freeze in public sector funding for contraceptive supplies could disrupt or distort the current trajectory of growth in the number of users of contraception.
A sudden influx of users of contraception turned away from the public sector might be unable to find the method they use, or would prefer to use, in the private sector. Such women might stop using contraception, or never start using it in the first place; or they might switch to a method or a brand they like less, which could put them at risk of discontinuing use of contraception altogether.
The private sector would have to invest in additional inventory, personnel, training, and facilities to meet the demand for certain methods – if it saw an incentive to do so. But even if the supplies and services required for all methods were readily available in the private sector, it is unclear how many women could afford to pay for their method out-of-pocket at private sector prices, as we will explore later in this chapter.

30COMMODITY GAP ANALYSIS 2018
Table 3.1 juxtaposes two scenarios of growth in the number of users of contraception living in the 135 LMI countries.
The first numerical column shows the number of users of each method of contraception who obtained their supplies from the public and private sectors in 2017.
The second column shows the number of users of each method that will be added or lost over three years (2018 through 2020), without allocating the gains and losses to either sector.
The third column shows the projected number of users of each method in the year 2020. The gains and losses have been allocated to each sector based on current trends.
The fourth column shows the total number of users of each method in 2020 if public sector funding for supplies reached its carrying capacity in 2017, and all additional users of contraception are channeled to the private sector over the next three years. (For methods projected to decline in use between 2018 and 2020, there is no shift from the public to the private sector).
As the table shows, if additional users of contraception are shut out of the public sector after 2017, maintaining our current projections of growth in contraceptive use would require the private sector to accommodate 5.46 million additional implant users, 14.1 million additional users of injectables, and 11.1 million additional users of male condoms over the next three years.
TABLE 3.1. ADDITIONAL USERS OF EACH METHOD, 2018 - 2020
ALLOCATED TO BOTH SECTORS vs. PRIVATE SECTOR ONLY | 135 LMI COUNTRIES
2017 2018-2020 2020 2020
Method SectorAll users of
contraception (Public + Private)
Gain/Loss (Public + Private)
Additional users allocated to both
sectors
All additional users added to private
sector
ImplantPublic 11,300,000
5,460,000 15,600,000 11,300,000
Private 3,370,000 4,560,000 8,830,000
IUDPublic 31,700,000
(1,745,000) 30,500,000 30,500,000
Private 13,600,000 13,100,000 13,100,000
InjectablePublic 41,300,000
14,100,000 47,600,000 41,300,000
Private 37,200,000 44,900,000 51,300,000
PillPublic 29,700,000
(2,304,000) 29,400,000 29,400,000
Private 56,900,000 54,900,000 54,900,000
CondomPublic 18,600,000
11,100,000 20,900,000 18,600,000
Private 64,000,000 72,700,000 75,100,000
OtherPublic 1,740,000
785,000 1,950,000 1,740,000
Private 3,130,000 3,700,000 3,910,000

31COMMODITY GAP ANALYSIS 2018
Table 3.2 represents a similar scenario as that presented in Table 3.1, only in this case for the 69 FP2020 countries.
The first numerical column shows the number of users of each method of contraception who obtained their supplies from the public and private sectors in 2017. For example, the public sector supported 9.62 million users of implants, while the private sector supported 2.67 million implant users.
The second column shows the number of users of each method that will be added or lost over three years (2018 through 2020), without allocating the gains and losses to either sector. For example, we estimate there will be 4.93 million additional users of implants by 2020.
The third column shows the projected number of users of each method in the year 2020. The gains and losses have been allocated to each sector based on current trends. 3.87 million implant users will be added in the public sector, bringing the total to 13.5 million; 1.06 million implant users will be added in the private sector, bringing that total to 3.73 million.
The fourth column shows the number of users of each method in 2020 if all users added over the next three years are channeled to the private sector (as stated earlier, for methods projected to decline in use, there is no shift to the private sector). For example, the number of users of implants supported by the private sector would grow to 7.61 million. This is an increase of 185%, far more than the current private sector growth projection of 40%.
If no additional users of injectables were added to the public sector, the private sector would have to adapt to serving 43.6 million users in 2020 (compared to 30.2 million in 2017).
These staggering figures beg a question of great importance: could the current infrastructure of private sector retailers support such a large influx of additional consumers (or even a partial influx), or would users of contraception shut out of the public system lose access to their preferred method?
TABLE 3.2. ADDITIONAL USERS OF EACH METHOD, 2018 - 2020
ALLOCATED TO BOTH SECTORS vs. PRIVATE SECTOR ONLY | 69 FP2020 COUNTRIES
2017 2018-2020 2020 2020
Method SectorAll users of contra-ception (Public +
Private)
Gain/Loss (Public + Private)
Additional users allocated to both
sectors
All additional users added to private
sector
ImplantPublic 9,620,000
4,930,000 13,500,000 9,620,000
Private 2,670,000 3,730,000 7,610,000
IUDPublic 20,200,000
238,200 20,400,000 20,200,000
Private 9,550,000 9,590,000 9,790,000
InjectablePublic 30,000,000
13,360,000 36,000,000 30,000,000
Private 30,200,000 37,600,000 43,600,000
PillPublic 16,900,000
(842,000) 16,900,000 16,900,000
Private 32,600,000 31,700,000 31,700,000
CondomPublic 7,080,000
6,630,000 8,270,000 7,080,000
Private 33,100,000 38,500,000 39,700,000
OtherPublic 1,190,000
722,000 1,370,000 1,190,000
Private 2,480,000 3,030,000 3,200,000

32COMMODITY GAP ANALYSIS 2018
New data on the retail price of contraceptive commodities in the private sector
In the CGA 2016 report, we valued all contraceptive commodities and supplies at public sector prices.31 Given the diversity of supply sources, profit margins, retail outlets, and most of all, the lack of data, we chose not to estimate typical supply prices in the private sector. Instead, we acknowledged that we were likely underestimating the true size of consumption costs and supplies spending, as public sector prices are generally assumed to be lower than those at the retail level.
For the CGA 2018 analysis, we obtained private sector price and volume data from IQVIA.32 The data show the prices paid by consumers at the retail level for implants, doses of injectables, and pill cycles, as well as the volumes of these commodities sold at the country level.
By applying these new data to the volumes of these commodities purchased by users from private sector retailers, we revealed $1.33 billion in value across the 135 LMI countries (and $227 million in the subset of 69 FP2020 countries) that was previously undetected in the CGA 2016 report.
As shown in Figure 3.4, private sector retail prices for implants, doses of injectables, and pill cycles vary widely across countries. In almost all cases, the IQVIA price is higher than the average public sector price for the same commodity. There are only a few exceptions, such as Bangladesh and Indonesia, where the public sector prices for doses of injectables are higher than the IQVIA prices. This may be due to the availability of less expensive locally or regionally produced products.
How we used the new private sector price data
In order to avoid overestimating private sector spending and consumption cost in Chapter one, we applied the IQVIA private sector prices to only a subset of all implant, injectable, and pill commodities sold by private sector entities.
The data obtained from IQVIA reflects commodity prices tracked by wholesalers and retailers. We know, however, that in some countries these prices do not
apply to all implants, injectables, and pills sold outside of the public sector. In many countries, large-scale social marketing programs distribute products at lower, sometimes subsidized, prices that are closer to public sector prices than those charged by for-profit retailers. There may also be other commodities sold in the private sector at lower prices; these products may have been acquired through leakage from the public sector, or across national borders, or by access to other brands. As noted for Bangladesh and Indonesia, local or regional manufacturers may bring products to the market at public sector (or lower) price levels.
To determine the appropriate volumes of commodities to cost with public sector versus IQVIA prices, we used multiple data sources to determine what shares of supplies consumed by private sector users were sold at subsidized versus non-subsidized prices. This included data on the volumes of commodities sold by social marketing organizations that were provided by DKT International33, and data from IQVIA on the volumes sold at the prices they tracked.
Where volume data was insufficient to make these estimates, we took a conservative approach: IQVIA prices were applied only to commodities purchased from private sector pharmacies and medical practices; all other commodities and supplies provided by the private sector were costed with public sector prices.
The figures in Table 3.3 show the percentage of private sector commodities consumed by users of contraception in 2017 to which IQVIA prices were applied, first for the 135 LMI countries, and then for the 69 FP2020 countries. For example, in the 135 LMI countries, IQVIA prices were applied to 44% of pill cycles consumed by private sector users. The rest were valued at public sector prices.
TABLE 3.3. PERCENTAGE OF PRIVATE SECTOR COMMODITIES CONSUMED BY USERS THAT WERE VALUED WITH IQVIA PRICES
135 LMI Countries
69 FP2020 Countries
Implants 8% 9%
Injectables 23% 24%
Pills 44% 37%

33COMMODITY GAP ANALYSIS 2018
0 5 10 15 20 25
0 5 10 15 20
0 50 100 150 200 250 300 350
GuatemalaCosta RicaHonduras
MexicoUzbekistan
Russian FederationPanama
South AfricaEl Salvador
ColombiaNicaraguaBotswana
KazakhstanBosnia and Herzegovina
TurkeyBelarus
Dominican RepublicBulgariaArmenia
PeruMalaysia
Republic of MoldovaKyrgyzstan
BrazilEcuador
ParaguaySerbia
GeorgiaJordan
LebanonRomaniaThailand
AzerbaijanKenya
ChadMorocco
GabonNiger
CameroonViet Nam
AlgeriaCongo
PhilippinesTogoIndiaMali
BeninBurkina Faso
GuineaZambia
Sri LankaTunisia
EgyptBangladesh
PakistanIndonesia
SenegalNamibia
Côte d'Ivoire
RomaniaMexico
Costa RicaDominican Republic
AzerbaijanGuatemala
ColombiaPanama
El SalvadorGeorgia
GabonHonduras
EcuadorIndia
BrazilPeru
MalaysiaBelarusTurkey
NicaraguaMorocco
BotswanaParaguay
SenegalSouth Africa
NamibiaRepublic of Moldova
Russian FederationZambia
PhilippinesSri LankaPakistan
TogoThailandViet Nam
IndonesiaEgypt
Bangladesh
BrazilMexico
BotswanaRussian Federation
South AfricaNamibiaLebanon
PeruMalaysia
TurkeyAlgeria
Viet NamPhilippines
ColombiaThailandEcuador
IndonesiaKenya
Donor Price
Pakistan
Togo
Thailand
Viet Nam
Indonesia
Egypt
Bangladesh
PILL
FIGURE 3.4. IQVIA UNIT PRICES PER COMMODITY COMPARED TO THE AVERAGE DONOR PRICES (2017)
INJECTABLE
IMPLANT
In general, the IQVIA prices far exceed the average prices donors pay to procure these three commodities. LAC and Eastern European countries tend to have the highest prices.
In a few countries, including Bangladesh and Indonesia, the IQVIA price for injectables was lower than the average donor price.

34COMMODITY GAP ANALYSIS 2018
Can public sector users of contraception afford to buy their supplies in the private sector?
Our projections of growth in the total number of users of contraception assume there will be increases in the absolute number of users who obtain supplies from both the public and the private sectors.
However, if we suppose that the total number of users of contraception will grow while public sector funding remains level, then both the percentage as well as the number of private sector users must increase.
The source – public or private – from which users of contraception obtain their supplies has implications for who pays and how much they are charged. The public sector generally charges little or nothing to users, while a person who obtains supplies from the private sector tends to pay the retail price out-of-pocket. Some of these users will be charged a much higher price than what the public sector pays to purchase the supplies they distribute to users.
Can users shut out of the public sector afford to pay private sector prices out-of-pocket? To explore this issue, we estimated the percentage of users of contraception who live above and below the international poverty line. Living below the poverty line is also referred to as living in extreme poverty.34, 35
As shown in Figure 3.5, 11% of users of contraception in the 135 LMI countries lived in extreme poverty (below the global poverty line) in 2017. In the subset of 69 FP2020 countries, 16% of users of contraception lived in extreme poverty (Figure 3.6).
Women living below the global policy line make up only a small share of all users of contraception in the 135 LMI countries (11%) and subset of 69 FP2020 countries (16%).
In both groups of countries, however, 75% of the women living below the poverty line obtain their method from the public sector. While the number of women living in extreme poverty seems relatively low, the public sector plays a large role in enabling these women to use modern methods of contraception.
FIGURE 3.5. PERCENTAGE OF USERS OF CONTRACEPTION ABOVE AND BELOW POVERTY LINE | 135 LMI COUNTRIES, 2017
FIGURE 3.6. PERCENTAGE OF USERS OF CONTRACEPTION ABOVE AND BELOW POVERTY LINE | 69 FP2020 COUNTRIES, 2017
Below poverty line
89%
11%
Above poverty line
Below poverty line
84%
16%
Above poverty line
Below poverty line
89%
11%
Above poverty line
Below poverty line
84%
16%
Above poverty line

35COMMODITY GAP ANALYSIS 2018
Looking even more closely at the relationship between poverty and sector, Figure 3.7 illustrates the percentage of women living below (and by extension, above) the global poverty line who accessed the public and private sectors for their supplies in 2017.
The orange segments represent those who obtained supplies from the public sector while the blue bars represent those who purchased supplies from the private sector.
Within each bar, the darker segments represent users of contraception who lived below the global poverty line, while the lighter segments represent those who lived above the poverty line.
The percentages are relatively similar for both the 135 LMI countries and the 69 FP2020 countries. For example, in 2017, in the 135 LMI countries,
› 9% of all users of contraception lived below the poverty line and obtained supplies from the public sector;
› 46% of all users of contraception lived above the poverty line and obtained supplies from the public sector;
› 3% of all users of contraception lived below the poverty line and obtained supplies from the private sector; and
› 42% of all users of contraception lived above the poverty line and obtained supplies from the private sector.
FIGURE 3.7. USERS OF CONTRACEPTION LIVING ABOVE AND BELOW THE POVERTY LINE | PUBLIC VS PRIVATE SECTOR, 2017
0% 20% 40% 60% 80% 100%
Public Sector:Below poverty line
Public Sector:Above poverty line
Private Sector:Below poverty line
Private Sector:Above poverty line
135 LMI TOTAL
69 FP2020 TOTAL
Western Africa
Eastern Africa
Southern Asia
South America
9%
12% 46% 4% 38%
46% 3% 42%
13%
12%
1% 1% 70%28%
50% 34%4%
32% 40% 6% 21%
37% 8% 42%
We see greater variation among different regions than we do between the 135 LMI and 69 FP2020 country groups. These variations are driven by several factors: the number of women living below the poverty line in each region; different levels of contraceptive prevalence among regions; and the size of each region’s public and private sector markets. For example, in Eastern Africa, we see the largest percentage of below-poverty-line users of contraception served by the public sector. In South America, the percentages of below-poverty-line users of contraception in both sectors are far smaller, because most countries in this region have very few women living below the poverty line. Western Africa has the largest percentage of women living below the poverty line who obtain supplies from the private sector; it should be noted that many countries in Western Africa charge user fees to access public sector services.

36COMMODITY GAP ANALYSIS 2018
Market segmentation models often make the case for shifting those with the ability to pay to the private sector, thereby creating greater opportunities within the public sector to serve those who cannot. But given the differences between the public and private sector method mixes, the ability to pay may not be a sufficient criterion for understanding the relationship between the two.
The reality is that a woman with the ability to pay private sector prices might not find private sources of her preferred method or brand of supplies, thereby requiring her to either switch to a different (and possibly less liked) method, or stop using contraception altogether. And of course, the international poverty line is not necessarily a reliable indicator of the ability to pay private sector prices. It merely designates the threshold for living in extreme poverty; those who live above it may still be poor. In addition, because we have only costed commodities and supplies, and not associated services, some methods may be undervalued in our analysis in terms of the full private sector price a user would pay to use her chosen method.
The greatest difference between the public and private sector annual supplies cost per user is for pills. In the 135 LMI countries, the average annual cost per year to the public sector is $5.10 per pill user (Figure 3.8). In the private sector, the average annual cost is $27.66.
If a pill user is shifted or diverted from the public sector, the $5.10 annual cost of supplies can be spent elsewhere. From the pill user’s perspective, this would mean going from paying little or nothing for supplies to paying on average $27.66 per year.
FIGURE 3.8. SHIFTING THE COST BURDEN: THE COST OF PILLS IN THE PUBLIC VS PRIVATE SECTOR TO A USER OF CONTRACEPTION
$5.10
Public Private
$27.66
In this example, the price a public sector entity is
charged for a year's supply of pill cycles is
$5.10.
A woman who obtains her supplies from the public sector may be
charged some or none of that cost.
The average retail price of a year's supply of pill cycles in the private sector is $27.66.
A woman purchasing her supplies from the private sector is likely to pay the entire price herself.

37COMMODITY GAP ANALYSIS 2018
As noted earlier, in 2017, 67% of all users of contraception in the 135 LMI countries resided in the subgroup of 69 FP2020 countries. However, the supplies consumption cost for users of contraception in these countries was only 39% of the cost across all 135 LMI countries.
This divergence was caused by the differences between the group of 69 FP2020 countries and the 66 non-FP2020 countries that make up the set of 135 LMI countries. The 66 non-FP2020 countries are for the most part classified as middle-income, while the 69 FP2020 countries are mainly low-income. The user method mixes in each set of countries are quite different. Variations in the supply cost per user of each method and the sectors in which the supplies or services were obtained drive the different shares of total consumption cost generated by each group of countries.
The following graphs bring together different analyses presented in this report. In the first graph (Figure 3.9), the sum of all bars is the 461 million users of contraception in the 135 LMI countries.
Each set of two bars shows the total number of users of that particular method across the 135 LMI countries, divided into the number who lived in the 69 FP2020 countries (left bar) and the number who lived in the 66 non-FP2020 countries (right bar).
Each individual bar divides the number of users it represents into those supported by the public sector (orange) and those supported by the private sector (blue). Thus, the first bar in the graph shows the number of users of sterilization living in the 69 FP2020 countries, divided by the sector in which they obtained their procedure.
The second graph (Figure 3.10) is structured the same as the first, but the bars sum to the total consumption cost of supplies in the 135 LMI countries in 2017 ($2.76 billion).
Bringing these different elements together illustrates the complexity and nuance that can be masked when we analyze data in isolation.
Figure 3.9 shows the enormous role the public sector plays in serving individual users of contraception. The number of users of sterilization whose procedures were provided by the public sector dwarfs the number of users of any method provided by the private sector in either group of countries. The public sector also serves a significant number of women using injectables and pills.
By contrast, Figure 3.10 shows that the consumption cost for private sector pill users living in the 66 non-FP2020 countries ($1.21 billion) represents 44% of the total supplies consumption cost across all 135 countries.
Comparing these two graphs points to the importance of unmasking the complexities that sit behind contraceptive use and consumption cost patterns, in order to ensure that resources and efforts match the needs of women.

38COMMODITY GAP ANALYSIS 2018
FIGURE 3.9. USERS OF EACH METHOD OF CONTRACEPTION|PUBLIC AND PRIVATE SECTORS69 FP2020 COUNTRIES COMPARED TO 66 NON-FP2020 COUNTRIES | 135 LMI COUNTRIES, 2017
FIGURE 3.10. CONSUMPTION COST FOR EACH METHOD OF CONTRACEPTION | PUBLIC AND PRIVATE SECTORS69 FP2020 COUNTRIES COMPARED TO 66 NON-FP2020 COUNTRIES | 135 LMI COUNTRIES, 2017
FP2020
Non-
FP2020
FP2020
Non-
FP2020
FP2020
Non-
FP2020
FP2020
Non-
FP2020
FP2020
Non-
FP2020
FP2020
Non-
FP2020
FP2020
Non-
FP2020
Sterilization Implant IUD Injectable Pill Condom Other
0
20
40
60
80
100
120Millions
0
0.3
0.6
0.9
1.2
1.5
FP2020
Non-
FP2020
FP2020
Non-
FP2020
FP2020
Non-
FP2020
FP2020
Non-
FP2020
FP2020
Non-
FP2020
FP2020
Non-
FP2020
FP2020
Non-
FP2020
Sterilization Implant IUD Injectable Pill Condom Other
Public Sector Private Sector
Public Sector Private Sector
Billions
FP2020
Non-
FP2020
FP2020
Non-
FP2020
FP2020
Non-
FP2020
FP2020
Non-
FP2020
FP2020
Non-
FP2020
FP2020
Non-
FP2020
FP2020
Non-
FP2020
Sterilization Implant IUD Injectable Pill Condom Other
0
20
40
60
80
100
120Millions
0
0.3
0.6
0.9
1.2
1.5
FP2020
Non-
FP2020
FP2020
Non-
FP2020
FP2020
Non-
FP2020
FP2020
Non-
FP2020
FP2020
Non-
FP2020
FP2020
Non-
FP2020
FP2020
Non-
FP2020
Sterilization Implant IUD Injectable Pill Condom Other
Public Sector Private Sector
Public Sector Private Sector
Billions

39COMMODITY GAP ANALYSIS 2018
Conclusion
This chapter offers new insights into the potential consequences of failing to scale up public sector funding to keep pace with users’ increasing consumption of contraceptive supplies. Thus far, we have identified a number of potential negative repercussions for individual users of contraception who might find themselves unable to access low or no-cost supplies.
A woman shut out of the public sector may not be able to find a private sector provider of her method or brand of choice; as a result, she might stop (or never start) using contraception, or she might choose a different method or brand. If she likes the new method or brand less than the one she originally sought, she might eventually discontinue using contraception.
Alternatively, a woman who is shut out of the public sector might find a provider or source of her method in the private sector, but might not be able to pay for it out- of- pocket. As in the previous example, she might stop using contraception altogether, or never begin. She might switch to a less expensive, but less liked, method or brand. She might switch to a method that has a low entry cost, like pills, but a higher cost over months or years of use. And if she were to pay for her preferred supplies or services out- of- pocket, it could potentially divert resources from other important needs.
Given the plethora of obstacles that might influence a woman to stop – or never start – using contraception, it seems possible the current trajectory of growth in the number of users of contraception could be disrupted or distorted by stagnation in the level of public sector funding.
While our analysis shows that the private sector already holds a significant share of consumption costs, the public sector continues to play a key role, both in terms of the range of methods offered, and, the affordability of these methods. Ensuring that all women continue to have access to the methods that they want and prices they can afford will require close coordination and planning.

40COMMODITY GAP ANALYSIS 2018
4S E C T I O N
Annex

41COMMODITY GAP ANALYSIS 2018
Endnotes
1 | The World Bank defines middle-income countries as those that have a gross national per capita income (GNI) between $1,006 and $12,235; the low-income countries have a GNI less than or equal to $1,005.
2 | The 69 FP2020 countries are those countries that had a gross national per capita income less than or equal to $2,500 in 2012.
3 | The Family Planning Estimation Tool (FPET) was designed to produce annual estimates of the contraceptive prevalence rate (CPR) and other indicators using statistical modeling that incorporates survey data and service statistics. For more information, see Technical Brief: Family Planning Estimation Tool at https//goo.gl/OKOim2.
4 | Demographic and Health Surveys (DHS)
5 | Multiple Indicator Cluster surveys (MICs)
6 | See www.PMA2020.org for more information.
7 | United Nations, Department of Economic and Social Affairs, Population Division (2016). Model-Based Estimates and Projections of Family Planning Indictors 2016. New York: United Nations.
8 | For the purpose of this analysis all non-public sources are classified as private. This includes a small number of sources such as shops and acquaintances that may not otherwise be considered private sector.
9 | “Other” methods of contraception include, where data are available, female condom, emergency contraception, Standard Days Method, LAM, spermicide, and other barrier methods.
10 | Procurement volume may reflect a number of factors in addition to user consumption, such as the volume necessary to fill supply pipelines and maintain adequate inventory levels from central warehouses to individual service delivery points. Procurement volumes may take into account the volume of supplies already present or on order, inventory holding policies along the supply chain, and wastage or “leakage” of supplies at various levels.
11 | Jacqueline E. Darroch, Singh S., Weissman E. Adding it Up: The Costs and Benefits of Investing in Sexual and Reproductive Health in 2014. Guttmacher Institute, 2016
12 | RHSC LAC survey of Honduras, El Salvador, Guatemala, Nicaragua, Mexico, Paraguay, Bolivia, Peru
13 | DKT’s compilation of social marketing statistics were used to estimate the volume of private sector commodity consumption that were socially marketed products (https://www.dktinternational.org/contraceptive-social-marketing-statistics/)
14 | Multiple data sources are available providing estimates of public sector spending on commodities by both donors and governments. In some cases, data sources overlap (e.g. multiple estimates for the same country and year); however, these estimates frequently don’t match. Generally, we look at an average of all the available data (multiple sources plus multiple years of data). However, in some cases, some data was excluded in favor of other data deemed more reliable. Our estimate of current spending on contraceptive commodities within the public sector was based on the following sources:
› UNFPA Donor Support Database for 128 countries (2014-2015)
› NIDI data on NGO spending on contraceptives in 11 countries (2015 and 2016) where not overlapping with donor reports
› Contraceptive Security Indicator data on government spending in 44 countries (2014-2015). Some spending was classified as donor if it came from basket funding or loans
› UNFPA Country Survey of government spending in 45 countries (2014-2016)
› LAC RHSC Survey on government expenditures in 8 countries (2015-2016)
› NIDI data on government expenditures in 25 countries (2014 and 2016) where not overlapping with other estimates
15 | See Reader’s Guide, “Consumption cost” for explanation.
16 | “User” method mix reflects the number of users of each contraceptive method. In this report we present findings on shifts in user method mix as well as “cost” method mix, which is determined by the relative cost of the quantity of supplies consumed by the users of each method.
17 | Different approaches were used to estimate consumption quantities for short-term versus long-term and permanent methods. Users of short-term methods must consume multiple products each year to obtain a full year of coverage. By contrast, a fraction of users of will rely on implants or IUDs inserted or sterilizations performed in a prior year, and thus have no need to consume any supplies the current year.
18 | Please note that the concept of consumption quantity differs from that of procurement quantity. The calculation of procurement quantity may reflect additional factors that institutional purchasers must consider, such as the volume necessary to fill supply pipelines and maintain adequate inventory levels from central warehouses to individual service delivery points.

42COMMODITY GAP ANALYSIS 2018
19 | Please see the explanation of how we costed contraceptive commodities and clinical supplies in the Reader’s Guide section of this report.
20 | Please see the description of public sector prices in the Reader’s Guide section of this report.
21 | Please see description in the Reader’s Guide section of this report.
22 | This figure is not exactly 10% of the total due to differences in the share of donor funding and projected growth in consumption costs between the 69 FP200 countries and the non-FP2020 countries.
23 | This figure is not exactly 8% of the total due to differences in the share of Government funding and projected growth in consumption costs between the 69 FP200 countries and the non-FP2020 countries.
24 | This figure is not exactly 18% of the total due to differences in the share of Public Sector funding and projected growth in consumption costs between the 69 FP200 countries and the non-FP2020 countries.
25 | This figure is not exactly 82% of the total due to differences in the share of Private Sector funding and projected growth in consumption costs between the 69 FP200 countries and the non-FP2020 countries.
26 | The CGA 2016 report provided an estimate of $126 million spent by the governments of the 69 FP2020 countries in 2014. That estimate used annual spending data from two sources: the Contraceptive Security Indicators database, and the Netherlands Interdisciplinary Demographics Institute (NIDI). The estimate of spending by the 69 FP2020 government spending in the CGA 2018 report incorporates an additional source of data, a survey conducted by RHSC of eight LAC governments, and represents the average of three years of spending data.
27 | Please note that the concept of consumption quantity differs from that of procurement quantity. The calculation of procurement quantity may reflect additional factors that institutional purchasers must consider, such as the volume necessary to fill supply pipelines and maintain adequate inventory levels from central warehouses to individual service delivery points.
28 | Different approaches were used to estimate consumption quantities for short-term versus long-term and permanent methods. Users of short-term methods must consume multiple products each year to obtain a full year of coverage. By contrast, a fraction of users of will rely on implants or IUDs inserted or sterilizations performed in a prior year, and thus have no need to consume any supplies the current year.
29 | Campbell, O. M. R., Benova, L., Macleod, D., Goodman, C., Footman, K., Pereira, A. L. and Lynch, C. A. (2015), Who, What, Where: an analysis of private sector family planning provision in 57 low- and middle-income countries. Trop Med Int Health, 20: 1639–1656. doi:10.1111/tmi.12597
30 | Weinberger, Michelle and Sean Callahan. 2017. The Private Sector: Key to Achieving Family Planning 2020 Goals. Brief. Bethesda, MD: Sustaining Health Outcomes through the Private Sector Project, Abt Associates.
31 | Our use of public sector prices is discussed in Chapter One. See also: Jacqueline E. Darroch, Singh S., Weissman E. Adding it Up: The Costs and Benefits of Investing in Sexual and Reproductive Health in 2014. Guttmacher Institute, 2016
32 | IQVIA, formerly Quintiles IMS Holdings, Inc., serves the combined industries of health information technologies and clinical research. See https://www.iqvia.com for more information.
33 | DKT Contraceptive Social Marketing Statistics. See https://www.dktinternational.org/contraceptive-social-marketing-statistics/
34 | The global poverty line reflects the line below which a person’s minimum nutritional, clothing, and shelter needs cannot be met in that country. This is referred to as “extreme poverty.” The current global poverty line is $1.90 per day in purchasing power parity. http://www.worldbank.org/en/topic/poverty/brief/global-poverty-line-faq
35 | DHS datasets were reanalyzed to create a “below the poverty line” versus “above the poverty line” variable using the wealth index and the country specific poverty line. Analysis was then conducted of use, by method and source, to estimate the share of each method users who fell into one of 4 groups: below poverty line public source, below poverty line private source, above poverty line public source, above poverty line private source.

43COMMODITY GAP ANALYSIS 2018
List of 135 LMI Countries
Albania El Salvador Malawi* Serbia
Algeria Equatorial Guinea Malaysia Sierra Leone*
Angola Eritrea* Maldives Solomon Islands*
Armenia Ethiopia* Mali* Somalia*
Azerbaijan Fiji Marshall Islands South Africa
Bangladesh* Gabon Mauritania* South Sudan*
Belarus Gambia* Mauritius Sri Lanka*
Belize Georgia Mexico St. Lucia
Benin* Ghana* Moldova St. Vincent & Grenadines
Bhutan* Grenada Mongolia* Sudan*
Bolivia* Guatemala Montenegro Suriname
Bosnia & Herzegovina Guinea* Morocco Swaziland
Botswana Guinea-Bissau* Mozambique* Syria
Brazil Guyana Myanmar* Tajikistan*
Bulgaria Haiti* Namibia Tanzania*
Burkina Faso* Honduras* Nauru Thailand
Burundi* India* Nepal* Timor-Leste*
Cabo Verde Indonesia* Nicaragua* Togo*
Cambodia* Iran Niger* Tonga
Cameroon* Iraq* Nigeria* Tunisia
Central African Republic* Jamaica Pakistan* Turkey
Chad* Jordan Palau Turkmenistan
Colombia Kazakhstan Palestine, State of* Tuvalu
Comoros* Kenya* Panama Uganda*
Congo* Kiribati Papua New Guinea* Ukraine
Congo, DR* Korea PKR* Paraguay Uzbekistan*
Costa Rica Kyrgyzstan* Peru Vanuatu
Côte d'Ivoire* Lao PDR* Philippines* Vietnam*
Cuba Lebanon Romania Western Sahara*
Djibouti* Lesotho* Russian Federation Yemen*
Dominica Liberia* Rwanda* Zambia*
Dominican Republic Libya Samoa Zimbabwe*
Ecuador Macedonia São Tomé & Principe*
Egypt* Madagascar* Senegal*
*69 FP2020 Focus Countries


The Reproductive Health Supplies Coalition
The Coalition is a global partnership of public, private, and non-governmental organizations dedicated to ensuring that everyone in low- and middle-income countries can access and use affordable, high-quality supplies for their better reproductive health. It brings together agencies and groups with critical roles in providing contraceptives and other reproductive health supplies. These include multilateral and bilateral organizations, private foundations, governments, civil society, and private sector representatives.
Rue Marie-Thérèse 211000 BrusselsBelgium
Tel: +32 2 210 0222Fax: +32 2 219 3363E-mail: [email protected]