global atmospheric aerosol modeling - nasa · global atmospheric aerosol modeling requirements are...
TRANSCRIPT

Global atmospheric aerosol modeling
Johannes Hendricks, Mattia Righi, Valentina Aquila
Abstract
Global aerosol models are used to study the distribution and properties of atmospheric aerosol particles as well as their effects on clouds, atmospheric chemistry, radiation, and climate. The present article provides an overview of the basic concepts of global atmospheric aerosol modeling and shows some examples from a global aerosol simulation. Particular emphasis is placed on the simulation of aerosol particles and their effects within global climate models.
1. Introduction
Atmospheric aerosol is defined as the population of small, levitating liquid or solid particles dispersed in the air. The sizes of these particles typically range from a few nanometers to about ten micrometers. The major aerosol constituents are mineral dust, sea salt, black and organic carbon, sulfate, nitrate, ammonium, and water. Atmospheric aerosol particles result from natural sources such as sea spray, the wind-driven release of desert dust, or volcanoes, as well as anthropogenic sources such as the combustion of fuels. Furthermore, aerosol particles are released by biomass burning, that is, forest and grassland fires, which can be caused by lightning or human activity such as fire clearance. Aerosol particles are either directly emitted into the atmosphere or formed indirectly by the conversion of emitted precursor gases.
Increases in the amount of atmospheric aerosol resulting from anthropogenic emissions can strongly affect air quality, with adverse effects on human health. Anthropogenic aerosol particles are also important agents in climate change since they scatter and absorb solar and terrestrial radiation. They can further affect climate indirectly via the interaction with clouds and the chemistry of some greenhouse gases, particularly ozone.
Many activities in the field of atmospheric research focus on aerosol particles and their roles in air pollution and climate change. In addition to aerosol measurements in the atmosphere or laboratories, numerical models are applied to simulate the chemical and microphysical properties of atmospheric aerosol particles as well as their spatial and temporal distributions. They are used to analyze aerosol budgets and life cycles and to study specific aerosol-related effects such as aerosol-induced changes in clouds, radiation, and atmospheric chemistry, as well as the resulting climate impacts. Also the roles of specific aerosol types or individual aerosol sources in the climate system can be studied. Models allow simulation of the impact of anthropogenic aerosol on air quality and climate not only for past and present-day conditions but also for future scenarios, enabling studies of the efficiency of mitigation strategies to reduce future anthropogenic aerosol emissions and the related atmospheric impact. Models can provide consistent, temporally and spatially resolved information about atmospheric aerosol properties and aerosol-related effects in an entirety which, in many cases, is not accessible by observations. Measurements, however, cannot be replaced by simulations. They are essential to provide information from the real atmosphere which is crucial to evaluate the quality of models and to define model parameters which cannot be calculated solely from theory.
Atmospheric aerosol models are available for different spatial scales. Global models resolve aerosol properties on large scales and typically have spatial resolutions between about ten and several hundred kilometers. Low resolutions are typically applied in global models that are used to simulate the climate impacts of aerosols, since such simulations can be very expensive and low resolutions reduce the
costs. resolutions typical for global models only large-scale mean aerosol local
- 1 -
https://ntrs.nasa.gov/search.jsp?R=20120011689 2019-07-07T03:43:17+00:00Z

els which simulate aerosol transformations within an individual air parcel. Derivatives of such models can be used, for instance, to study the aerosol within expanding exhaust plumes.
Many recent studies focus on modeling the global atmospheric aerosol, its anthropogenic perturbations, and the resulting effects on climate. At the DLR Institute of Atmospheric Physics many efforts have been directed at the development and application of global atmospheric aerosol models and their integration in global climate models (Lauer et al. 2005, 2007; Aquila et al. 2011). Besides general characterization of the global atmospheric aerosol (Lauer and Hendricks 2006), a particular focus of the institute has been modeling global aerosol perturbations induced by emissions of the transport sector (aviation, land-based transport, and shipping) as well as simulating the resulting changes in clouds, radiation, and climate (Kohler et al. 2001; Hendricks et al. 2004, 2005, 2011; Lauer et al. 2007; Righi et al. 201 1).
The present chapter introduces technical aspects of global aerosol models (Sections 2-4) and discusses an example of a global aerosol simulation performed at the Institute of Atmospheric Physics (Section 5). It further suggests possibilities for future model improvements (Section 6). Particular emphasis is placed on the simulation of aerosol particles and their atmospheric effects within global climate models. The major focus is modeling tropospheric aerosol since aerosol particles in the troposphere are particularly relevant for air pollution and climate. The intention of the chapter is to provide a brief overview of global aerosol modeling concepts. For more details on the subject, the reader is referred to Ghan and Schwartz (2007) and references therein.
2. Representation of aerosol in global models
2.1 Aerosol types and size distribution
Global atmospheric aerosol modeling requirements are governed by several aspects. The models should provide information about the atmospheric mass concentration (mass per volume of air) of different aerosol constituents as well as the aerosol particle number concentration (number of particles per volume of air). Information on the particle size distribution is also important, since many processes controlling aerosol life cycles and climate impacts are size dependent. The aerosol constituents can show different degrees of mixing. For instance, black carbon particles can occur as pure particles or they may have acquired a coating composed of other constituents. The degree of mixing can affect the atmospheric impact of the particles, particularly their effects on clouds and radiation. Therefore, it is also desirable to resolve different mixing states in different size ranges. Global aerosol modeling also requires a proper description of all processes that control the formation and life cycles of aerosol particles. If aerosol effects on climate are to be quantified, effects of aerosol particles on clouds, radiation, and atmospheric chemistry have to be considered as well. In addition, for climate applications the model needs to be capable of simulating climatically relevant time periods, lasting from a few decades to centuries or even longer. A common way to analyze the effects of different aerosol types (e.g., anthropogenic aerosol) on air quality and climate is to conduct sets of different simulations including a reference simulation and, for comparison, model runs where specific aerosol types or processes are neglected. Hence, a possibly large number of model runs is necessary. These requirements imply the need for huge computing resources.
Long-term global simulations with comprehensive aerosol-climate models mostly require the use of very expensive supercomputing facilities. In order to reduce the computational burden, simplifications in the model representation of aerosol particles are necessary. The first generation of global aerosol models considered only the mass concentration of some aerosol constituents. With increasing computer power, more comprehensive schemes have been implemented. Many current global aerosol models also enable the simulation of particle number concentration and size distribution, in addition to particle composition. State-of-the-art size resolving box or process models consider large numbers of individual size bins (bin schemes) or even track the size and composition of individual particles (parti-
Application of approaches in global models, would require very resources, particularly when simulations on relevant
aerosol those in climate and
As a common simplification, the aerosol size distribution is approximated by a superposition of several so-called size modes. In many global models, each mode is represented by a log-normal distribution, that is, a bell-shaped function in a coordinate system with a logarithmic abscissa:
n(lnD) = dN = Nt exp[- (lnD -l~Dmed J ]. dlnD .J21i Ina 21n a
(1)
Here, Nt is the total particle number concentration of the mode, D is the particle diameter, (J is the geometric standard deviation describing the width of the mode, and Dilled is the median diameter, which for a log-normal distribution coincides with the geometric mean diameter (whose logarithm corresponds to the arithmetic mean of InD) and the diameter where the function shows its maximum value. The log-normal function in the form of Equation 1 represents a number size distribution n(lnD) which expresses the differential number concentration dN of particles present within a differential size range corresponding to the coordinate interval between InD and InD + d InD. Comprehensive numerical schemes to simulate aerosol microphysical processes with the log-normal approach have been developed, for instance by Whitby and McMurry (1997).
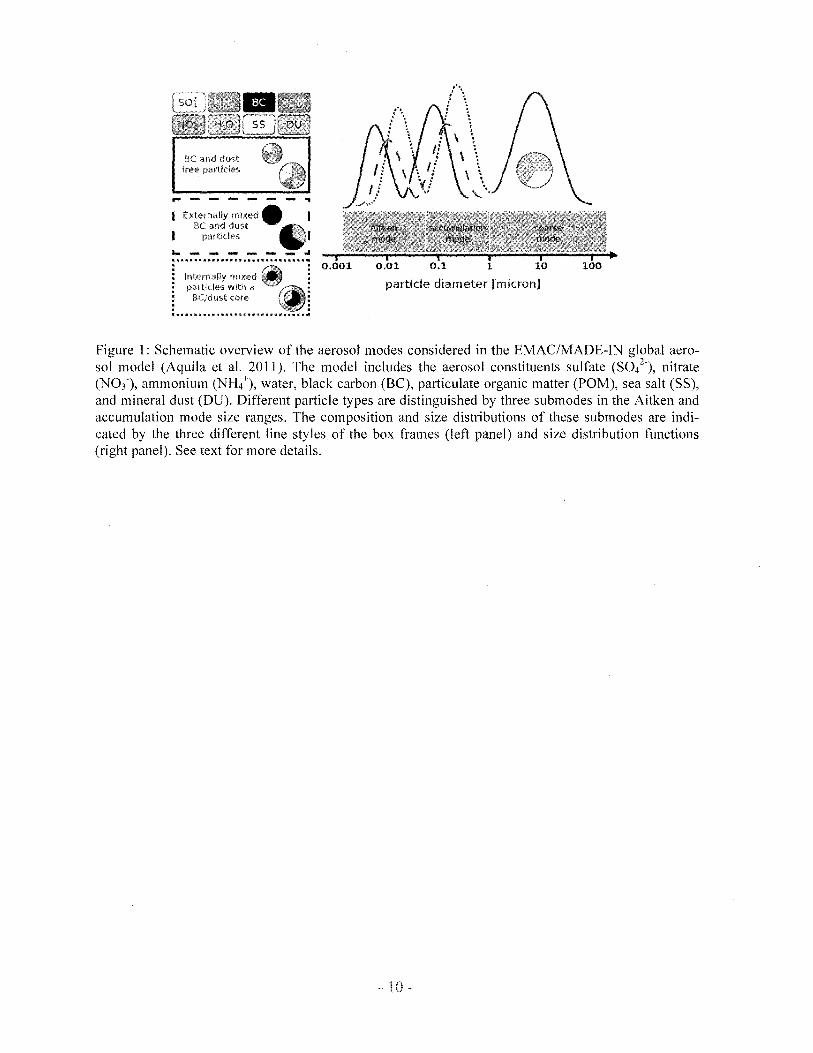
The applicability of the modal approach and the log-normal approximation to atmospheric aerosol has been demonstrated by Whitby (1978), who showed that the size distribution of tropospheric aerosol particles can be approximated by a superposition of three log-normal size modes covering the particle size ranges of a few nanometers (nm) to about 100 nm (Aitken mode), about 100 nm to 1 /lm (accumulation mode), and about 1 /lm to several 10 /lm (coarse mode). Most current global aerosol models that apply the log-normal approach consider more than three modes. According to measured size distributions, some models include an additional mode, called the nucleation mode, to separate very fine particles in the size range of a few nanometers from the Aitken mode. Additional modes are also included to distinguish between different particle types in the same size range. Figure 1 exemplarily shows the modal concept of the global aerosol model EMAC/MADE-IN (Aquila et al. 2011; Section 5) developed at the Institute of Atmospheric Physics. In the size ranges of the Aitken and accumulation modes, the model considers separate modes for insoluble particles (black carbon and mineral dust) with and without a liquid coating as well as particles without insoluble inclusions.
As a further simplification, the standard deviations (J of the modes are kept constant in most aerosol models that apply the log-normal approach. This results in only two free parameters being necessary for describing the size distribution of each mode: Nt and Dmed (Equation 1). With these parameters, the total volume concentration of the mode (total aerosol volume per volume of air) can be derived assuming spherical particles:
(2)
The total volume concentration Vt can also be derived from the mass concentrations of the different aerosol constituents present in the mode, taking into account the constituents' specific densities. Hence, if the mass concentrations of the individual species and the total particle number concentration Nt are known for each mode, the median diameters Dmed of the modes can be derived (Equation 2) and the particle size distribution is fully specified. Therefore, the models simulate the constituents' mass concentrations as well as the particle number concentration for each individual mode as basic prognostic quantities.
2.2 Aerosol life cycle
Atmospheric aerosol is influenced by particle sources, transport due to atmospheric motion, chemical and microphysical transformations, as well as particle sinks. Global aerosol models usually include a number of submodels to represent the different processes affecting atmospheric aerosol. Microphysical processes which affect the aerosol distribution on the microscale, particularly aerosol-aerosol and
subsumed within a In such modules. Particle
of the
submodels. Processes usually considered in global aerosol models as well as their technical representations in modal schemes are described in the following.
2.2.1. Aerosol microphysical processes
Nucleation: Under specific conditions, gas molecules aggregate to form molecule clusters. Further growth of these clusters leads to the formation of very fine aerosol particles. This nucleation process is commonly simulated in large-scale atmospheric models by means of empirical parameterizations describing the particle nucleation rate dependent on a set of key parameters such as temperature, humidity, and the concentrations of the involved trace gases. Parameterizations applied in global models usually describe the nucleation of particles containing sulfuric acid (H2S04) and water. Nucleation results in increases in particle number and mass concentration which, in modal models, are assigned to the finest-sized mode.
Condensation/evaporation: The surface of liquid aerosol particles experiences a permanent exchange of molecules with the gas phase. After condensation, compounds with low volatility, such as sulfuric acid, predominantly remain in the particulate phase. Large amounts of condensed compounds with higher volatility, such as nitric acid (HN03), can re-evaporate to the gas phase. In global models, it is usually assumed that evaporation of low-volatile compounds is negligible. The condensation of these species is mostly simulated by applying particle-size-dependent physical descriptions of the gas fluxes to the particle surfaces. For sulfuric acid, the competition between condensation and nucleation is also considered. In the case of constituents with higher volatility, the partitioning between gas and particles is often simulated by assuming that condensation and evaporation reach equilibrium within the time step used in the model to discretize time. This has the advantage that only the equilibrium partitioning has to be determined and an explicit physical description of the fluxes of condensing/evaporating mass and their temporal change can be avoided. In many cases, however, such fluxes are explicitly calculated. This is required, for instance, if the time scales to reach equilibrium are larger than the model time step. Global atmospheric models operate with time steps typically in the range of a few minutes to an hour. Especially for larger particles in the accumulation or coarse mode size range, the equilibrium time scales can be considerably larger.
Coagulation: The process of collision and sticking of aerosol particles, which results in the formation of larger particles, is called coagulation. Coagulation of atmospheric aerosol is mainly driven by the Brownian motion of the particles. Modal models consider coagulation of particles from the same mode (intramodal coagulation) as well as coagulation of particles from different modes (intermodal coagulation). The total coagulation rates are usually calculated by integration over the whole size distribution considering coagulation efficiencies (coagulatiQn kernels) dependent on the sizes of the interacting particles. Intramodal coagulation leads to a reduction of the particle number concentration in the respective mode. Intermodal coagulation results in a reduction of the particle number concentration in the smaller-sized mode and a corresponding transfer of mass of the involved aerosol constituents from the smaller-sized to the larger-sized mode.
The uptake of mass due to condensation and coagulation can lead to changes in particle size and composition. Such changes can also be induced by the uptake of aerosol particles in cloud droplets (Sections 2.2.2 and 2.2.3). If a cloud droplet evaporates, an aggregate of all aerosol particles taken up by the droplet remains, including also additional aerosol mass generated within the droplet. These changes can necessitate a reassignment of particles to other modes of the model. Hence, aerosol models rearrange particle mass and number accordingly at each time step.
2.2.2 Emissions and chemical transformations
Emissions: Aerosol particles can be emitted directly, like in the case of the wind-driven release of dust at the earth's surface or due to the generation of black carbon particles during combustion processes. Aerosol matter can also be formed in the atmosphere by the transformation of emitted trace gases, called aerosol precursors representation of emissions of aeroso! and its precur-sors in global on the "",?,-,-"l-,,,
form
- 4-
or calculated during the simulation by taking into account meteorological parameters such as wind speed. The latter approach results in a higher consistency of emissions and meteorology.
Chemical transformation of aerosol precursors: Chemical processes in the atmosphere lead to the conversion of highly volatile species into condensable vapors which contribute to the nucleation of new particles or to the condensation of aerosol mass on pre-existing aerosol. As an example, photochemical processes can convert gaseous sulfur dioxide (S02) into gaseous H2S04, which is then transformed into aerosol sulfate. S02 can also be converted into sulfate by liquid phase chemistry within cloud droplets. If the cloud droplet evaporates, sulfate is released in the form of aerosol residues. These conversion processes can be simulated with the aid of gas and liquid phase chemistry schemes. Since these schemes are computationally expensive, many global aerosol models consider only simplified aerosol precursor chemistry based on a limited number of species and reactions. Some models consider pre-calculated data sets of the concentrations of relevant trace gases. Important conversion processes to be taken into account are, for instance, the oxidation cycles of S02 into H2S04 and of NO x
(NO + N02) into HNO j .
2.2.3 Transport and deposition
Atmospheric transport: To simulate the transport of aerosol, its precursor gases, and other quantities relevant for the aerosol simulation, global models include transport schemes. Different schemes are applied to represent transport by large-scale wind systems (advection), small-scale vertical motions driven by local heating of air masses (convection), and small-scale turbulent motion (diffusion). The winds and other parameters relevant for these calculations are either prescribed or calculated by the model. While an online calculation of these parameters enables effects of aerosols on weather and climate to be quantified in complex aerosol-climate simulations, prescribed meteorology simplifies the model system but enables only passive aerosol transport.
Wet deposition: Aerosol particles can be included in cloud droplets or ice particles either by acting as nuclei for cloud particle formation or by colliding with pre-existing cloud particles. When cloud particles are transformed into precipitation (rain or snow), the included aerosol mass is either 'washed out' of the atmosphere or released at lower altitudes in case of evaporation or sublimation of rain or snow, respectively. Falling rain droplets or snowflakes collect additional aerosol particles, increasing the amount of aerosol that is removed from the atmosphere. Global models simulate these important aerosol sinks, called wet deposition, by coupling aerosol modules to cloud and precipitation schemes. The aerosol modules provide information about the relevant aerosol properties, and the cloud and precipitation schemes calculate the cloud coverage and cloud microphysical properties as well as the precipitation formation rates and precipitation fluxes. By combining this information, global models calculate the amount of aerosol removed from the atmosphere through wet deposition.
Dry deposition: Aerosol particles can also be deposited on the earth's surface in the absence of precipitation (dry deposition). Collisions of particles with the surface and possible sticking can occur due to diffusive transport by turbulent air motion in combination with the Brownian motion of fine particles or gravitational settling of larger particles. In global models, dry deposition is commonly expressed in terms of a deposition velocity which is calculated as a function of particle size and composition as well as local aerodynamic and surface properties.
3. Simulation of aerosol effects on atmosphere and climate
Effects on radiation: Anthropogenic or natural aerosol perturbations can change the earth'~ radiation budget and consequently affect weather and climate. Global climate models include submodels to simulate the transfer of shortwave (solar) and longwave (terrestrial) radiation through the atmosphere. Among other processes, these submodels consider the scattering and absorption of radiation by aerosol particles. This requires information about the optical properties of the aerosol, that is, its specific char
the interaction with radiation at different wavelengths. Such infonnation can be the microphysical chemical size
calculated
Effects on clouds: Aerosol particles have important effects on clouds. On the one hand, they serve as nuclei in the formation of cloud droplets and ice crystals. On the other hand, aerosol effects on radiation can induce dynamical and thermodynamical changes that can affect cloud properties and lifetime. The latter effects are implicitly simulated by the model, provided aerosol-radiation interactions are considered. Aerosol-induced cloud particle formation is commonly described by means of parameterizations driven by the simulated aerosol parameters which characterize the particle size distribution and composition, as well as dynamical and thermodynamical parameters such as temperature, relative humidity, and the cooling rate or updraft velocity. Since cloud formation frequently occurs on spatial scales which cannot be resolved by global models, many of these parameterizations include assumptions on the small-scale variation of the input parameters within the grid-boxes of the global model. The parameterizations return information about the properties of the formed cloud, particularly the cloud particle number concentration, which is used as a basis for further calculations of cloud development in the cloud schemes of the models. This enables the simulation of the impact of aerosol changes on clouds and the resulting radiative and climate effects. At the Institute of Atmospheric Physics, particular efforts have been directed at developing parameterizations to describe aerosolinduced cirrus cloud formation (Karcher et al. 2006).
Effects on atmospheric chemistry: Aerosol particles have important effects on atmospheric gas phase chemistry affecting, for instance, ozone concentration. Gas phase chemistry is influenced by direct interactions of aerosol particles with gas molecules. Aerosol particles can take up condensable species like HN03, which reduces their gas-phase concentrations. This affects the concentrations and chemistry of other important trace gases. For instance, a reduction in gas phase HN03 can change the concentration of NOx and HOx (OH + H02), which play key roles in ozone chemistry. In addition, several gas-phase compounds are converted to other gases by heterogeneous reactions on aerosol particle surfaces. For instance, heterogeneous reactions can lead to an efficient activation of chlorine radicals and subsequent ozone destruction in the stratosphere. Such effects are simulated in the gas phase chemistry schemes of the models by considering the loss and possible transformation of gases due to interactions with aerosol particles. In addition to their direct chemical impacts, aerosol particles also have indirect effects on atmospheric chemistry since their effects on radiation and clouds, which are simulated as described above, influence the photolysis, transport, and deposition of gaseous compounds.
4. Model evaluation
To evaluate a model's capability to simulate atmospheric aerosol, the simulation results need to be compared to observations. Measurements from different kinds of observation platforms, such as ground based stations, aircraft, or satellites, provide a vast range of information about the mass concentrations of different aerosol constituents, particle number concentrations for different size ranges, composition of individual particles, optical aerosol properties, and other quantities. An example of a comparison of model results with observations is discussed below.
5. Exemplary results from aerosol model simulations
5.1 Model description
Different versions of global atmospheric aerosol models have been developed and applied at the institute (Lauer et al. 2005, 2007; Lauer and Hendricks 2006; Righi et al. 2011). The latest version is the EMAC/MADE-IN model system (Aquila et al. 2011) developed by coupling the aerosol module MADE-IN (modal aerosol dynamics model including insoluble modes) with the global climatechemistry-model system EMAC (ECHAM/MESSy atmospheric chemistry model; Jockel et al. 2005, 2006). MADE-IN follows the log-normal approach to simulate the aerosol size distribution (Section
The different modes as well as the aerosol constituents considered by MADE-IN are shown in ure 1 2.). the from a
et 1 ) with for
results
- 6-
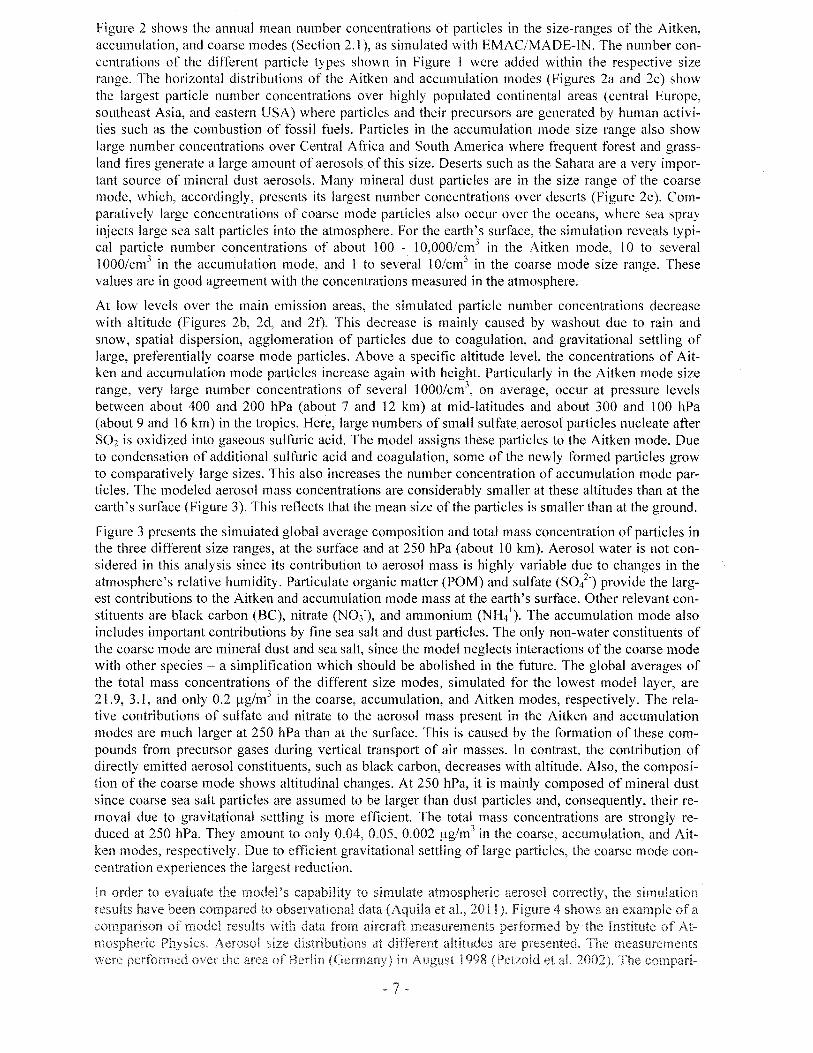
Figure 2 shows the annual mean number concentrations of particles in the size-ranges of the Aitken, accumulation, and coarse modes (Section 2.1), as simulated with EMAC/MADE-IN. The number concentrations of the different particle types shown in Figure 1 were added within the respective size range. The horizontal distributions of the Aitken and accumulation modes (Figures 2a and 2c) show the largest particle number concentrations over highly populated continental areas (central Europe, southeast Asia, and eastern USA) where patiicles and their precursors are generated by human activities such as the combustion of fossil fuels. Particles in the accumulation mode size range also show large number concentrations over Central Africa and South America where frequent forest and grassland fires generate a large amount of aerosols of this size. Deserts such as the Sahara are a very important source of mineral dust aerosols. Many mineral dust particles are in the size range of the coarse mode, which, accordingly, presents its largest number concentrations over deselis (Figure 2e). Comparatively large concentrations of coarse mode particles also occur over the oceans, where sea spray injects large sea salt particles into the atmosphere. For the earth's surface, the simulation reveals typical particle number concentrations of about 100 - 10,000/cm3 in the Aitken mode, 10 to several 1000/cm3 in the accumulation mode, and I to several 10/cm3 in the coarse mode size range. These values are in good agreement with the concentrations measured in the atmosphere.
At low levels over the main emission areas, the simulated particle number concentrations decrease with altitude (Figures 2b, 2d, and 2t). This decrease is mainly caused by washout due to rain and snow, spatial dispersion, agglomeration of particles due to coagulation, and gravitational settling of large, preferentially coarse mode particles. Above a specific altitude level, the concentrations of Aitken and accumulation mode particles increase again with height. Particularly in the Aitken mode size range, very large number concentrations of several 1000/cm3
, on average, occur at pressure levels between about 400 and 200 hPa (about 7 and 12 km) at mid-latitudes and about 300 and 100 hPa (about 9 and 16 km) in the tropics. Here, large numbers of small sulfate aerosol particles nucleate after S02 is oxidized into gaseous sulfuric acid. The model assigns these particles to the Aitken mode. Due to condensation of additional sulfuric acid and coagulation, some of the newly formed particles grow to comparatively large sizes. This also increases the number concentration of accumulation mode particles. The modeled aerosol mass concentrations are considerably smaller at these altitudes than at the earth's surface (Figure 3). This reflects that the mean size of the particles is smaller than at the ground.
Figure 3 presents the simulated global average composition and total mass concentration of particles in the three different size ranges, at the surface and at 250 hPa (about 10 km). Aerosol water is not considered in this analysis since its contribution to aerosol mass is highly variable due to changes in the atmosphere's relative humidity. Particulate organic matter (POM) and sulfate (Sot) provide the largest contributions to the Aitken and accumulation mode mass at the earth's surface. Other relevant constituents are black carbon (BC), nitrate (N03-), and ammonium (NH/). The accumulation mode also includes important contributions by fine sea salt and dust particles. The only non-water constituents of the coarse mode are mineral dust and sea salt, since the model neglects interactions of the coarse mode with other species - a simplification which should be abolished in the future. The global averages of the total mass concentrations of the different size modes, simulated for the lowest model layer, are 21.9,3.1, and only 0.2 Ilg/m3 in the coarse, accumulation, and Aitken modes, respectively. The relative contributions of sulfate and nitrate to the aerosol mass present in the Aitken and accumulation modes are much larger at 250 hPa than at the surface. This is caused by the formation of these compounds from precursor gases during vertical transport of air masses. In contrast, the contribution of directly emitted aerosol constituents, such as black carbon, decreases with altitude. Also, the composition of the coarse mode shows altitudinal changes. At 250 hPa, it is mainly composed of mineral dust since coarse sea salt particles are assumed to be larger than dust particles and, consequently, their removal due to gravitational settling is more efficient. The total mass concentrations are strongly reduced at 250 hPa. They amount to only 0.04, 0.05, 0.002 Ilg/m3 in the coarse, accumulation, and Aitken modes, respectively. Due to efficient gravitational settling oflarge particles, the coarse mode concentration experiences the largest reduction.
the simulation ofa At-
son reveals that the model is mostly able to reproduce the shape of the aerosol size distribution as well as the particle number concentrations at all altitudes. Discrepancies can be caused, for instance, by deficiencies in the size distribution representation of the aerosol module or by specific meteorological conditions during the campaign which cannot be reproduced by the simulation.
6. Outlook
A number of model improvements should be implemented to further enhance the quality of global aerosol-climate model simulations. These include the application of more detailed aerosol modules that, on the one hand, enable higher resolution of the particle size distribution, for instance, by the application of bin schemes (Section 2.1). On the other hand, the number of different particle types, mixing states, and aerosol constituents considered in the modules should be increased. For instance, a more detailed representation of organic aerosol constituents would be an impoliant improvement, since most current global aerosol models subsume the whole suite of different types of particulate organic matter within one species. Particle-resolved schemes would dramatically increase the level of details in the description of aerosol, but they still require too high computational expense to be applied in global climate simulations. Some global aerosol models still apply simplified representations of atmospheric chemistry. Hence, a coupling of aerosol modules to more comprehensive gas and liquid phase chemistry schemes is desirable. Also, the representation of aerosol effects on clouds needs to be further improved. Particular progress is required, for instance, in simulating aerosol interactions with ice and mixed-phase clouds. In addition to these modifications, increases in the spatial and temporal resolution of the models can contribute to enhancing the level of detail in future global aerosol simulations.
Aerosol simulations would also benefit from further research on still existing gaps in fundamental knowledge about several aerosol-related processes. Further in-situ and laboratory measurements supported by theoretical analysis are desirable to increase understanding of these processes. To give some prominent examples, further research should focus on the formation and properties of organic aerosols, the interactions of aerosols with liquid, mixed-phase and ice clouds, and on chemical transformations within or on the surfaces of aerosols.
References
Aquila V., J. Hendricks, A. Lauer, N. Riemer, H. Vogel, D. Baumgardner, A. Minikin, A. Petzold, J. P. Schwarz, J. R. Spackman, B. Weinzierl, M. Righi, and M. DaIl'Amico, 2011: MADE-in: a new aerosol microphysics submodel for global simulation of insoluble particles and their mixing state. Geosci. Model Dev., 4, 325-355, doi: I 0.5 I 94/gmd-4-325-20 11.
Ghan, J. S. and E. S. Schwartz, 2007: Aerosol properties and processes - a path from field and laboratory measurements to global climate models. Bull. Am. Meteorol. Soc., 88, 1059-1083.
Hendricks, J., 8. Karcher, A. Dopelheuer, J. Feichter, U. Lohmann, and D. Baumgardner, 2004: Simulating the global atmospheric black carbon cycle: A revisit to the contribution of aircraft emissions. Atmos. Chern. Phys., 4, 2521-2541.
Hendricks, J., 8. Karcher, U. Lohmann, and M. Ponater, 2005: Do aircraft black carbon emissions affect cirrus clouds on the global scale? Geophys.Res. Lett., 32, L128l4, doi:IO.102912005GL022740.
Hendricks, J., B. Karcher, and U. Lohmann, 20 II: Effects of ice nuclei on cirrus clouds in a global climate model. J. Geophys. Res., 116, Dl8206, doi: I 0.1029/201010015302.
lockel, P., R. Sander, A. Kerkweg, H. Tost, and 1. Lelieveld, 2005: Technical Note: The Modular Earth Submodel System (MESSy) - a new approach towards Earth System Modeling. Almos. Chern. Phys., 5, 433-444, doi: 10.5194/acp-5-433-2005.
Jockel, P., H. Tost, A. Pozzer, C. Brilhl, J. Buchholz, L. Ganzeveld, P. Hoor, A. Kerkweg, M. G. Lawrence, R. Sander, B. Steil, G. Stiller, M. Tanarhte, D. Taraborrelli, J. van Aardenne, and 1. Lelieveld, 2006: The atmospheric chemistry general circulation model ECHAM5/MESSy I: consistent simulation of ozone from the surface to the mesosphere. Atmos. Chern. Phys., 6, 5067-5104, doi:10.5J94/acp-6-5067-2006.
8., J. 2006: of cirrus cloud formation for use in doi: I 0.1 029/200510006219.
M. 200 I: Contribution of road traffic emissions to the atmos-17997-18014.

Lauer, A. and 1. Hendricks, 2006: Simulating aerosol microphysics with the ECHAM4/MADE GCM - Part II: Results from a first multiannual simulation of the submicrometer aerosol. Almas. Chern. Phys., 6, 5495-5513, doi: 10.5194/acp-6-5495-2006.
Lauer, A., J. Hendricks, I. Ackermann, B. Schell, B., H. Hass, and S. Metzger, 2005: Simulating aerosol microphysics with the ECHAM/MADE GCM - Part I: Model description and comparison with observations. Almas. Chern. Phys., 5, 3251-3276, doi:10.5194/acp-5-3251-2005.
Lauer, A., V. Eyring, 1. Hendricks, P. Jockel, and U. Lohmann, 2007: Global model simulations of the impact of ocean-going ships on aerosols, clouds, and the radiation budget. Almas. Chern. Phys., 7, 5061-5079, doi: 10.5 I 94/acp-7-506 1-2007.
Petzold, A., M. Fiebig, H. Flentje, A. Keil, U. Leiterer, F. SchrOder, A. Stifter, M. Wendisch, and P. Wendling, 2002: Veltical variability of aerosol properties observed at a continental site during the Lindenberg Aerosol Characterization Experiment (LACE 98). J. Geophys. Res., ]07,8128, doi: 10.1 029/20011000 1043.
Righi, M., K. Klinger, V. Eyring, J. Hendricks, A. Lauer, and A., Petzold, 20 II: Climate impact of biofuels in shipping: Global model studies of the aerosol indirect effect. Environ. Sci. Technol., 45, 3519-3525.
Whitby, K.T., 1978: The physical characteristics of sulfur aerosols. Armas. Environ., 12, 135-159.
Whitby, E., and P. McMurry, 1997: Modal Aerosol Dynamics Modelling. Aerosol Sci. Tech., 27, 673-688.
Be and dust free pa rtic!es
,-------""1 .1 particles Cn
1.------.1 III" """"" III .. "'" III •• " '"'''' "."." •••••• "" .. · . · . : IntemaHy mixed : with · · · · . ••• 011 •• " •••• 11111 ••••••••••••••••••
partide diameter [micron)
Figure 1: Schematic overview of the aerosol modes considered in the EMAC/MADE-IN global aerosol model (Aquila et al. 2011). The model includes the aerosol constituents sulfate (S042-), nitrate (N03-), ammonium (NH/), water, black carbon (BC), particulate organic matter (POM), sea salt (SS), and mineral dust (DU). Different particle types are distinguished by three submodes in the Aitken and accumulation mode size ranges. The composition and size distributions of these submodes are indicated by the three different line styles of the box frames (left panel) and size distribution functions (right panel). See text for more details.
- 10-

a) Aitken mode
BON
30N
o
30S
60S
100 300 1000 3000 10000
c) [ 1/cm3
]
180 150W 120W 90W 60W 30W 0 30E 60E 90E 120E 150E 180
30 100 300 1000 3000
e) [ 1/cm3
]
Coarse mode
SON
30N
a
30$
60S
180 60W SOW 0 JOE 6DE 90E 120E 150E 180
0.3 3 10 30 [ 1!Cm3
]
b)
150
(i;j' 200
~ 250
~ 300
'" '" '" 400 l!. SOO
700
850 1000 ..J...,l..,.,;;""
d)
100
150
<0 200
~ 250
~ 300
~ 400
a.. SOD
700
850
60S 30S 0 30N 60N
[ 1/cm3]
1000 ...L.,....,...~
f)
150
200
'l £. 250
~ 300
'" ~ ~ 400
a.. 500
700
850 1000
60S 30S 0 30N 60N
500
60S 30S a 30N 60N
[ 1/Cm3]
Figure 2: Annual mean simulated horizontal global distribution of the aerosol particle number concentration in the atmosphere at the earth's surface (left) and its zonal mean (average along circle of latitude) vertical distribution (right). A distinction is made between the concentrations of particles in the Aitken (a, b), accumulation (c, d), and coarse mode (e, f) size ranges. Pressure is used as the vertical
b, d, and f Pressures of 500, and 100 approximately cor-of 5, 0, 6 the
- 1

a)
Aerosol cOlnposition at 250 hPa
b) Aitken mode· 250 hPa (0.002 J.lg/m')
~43.6 S04
Accumulation mode· 250 hPa (0.048 J.lg/m' )
1.1 BC
3.9 POM ~12.1 N03 1.0 BC
14.6 NH4 53.9 S04
Aerosol cOlnposition at ground level
d) e) f)
c) Coarse mode· 250 hPa (0.043 J.lg/m')
96.2 Dust
Sea-salt
Aitken mode· Surface level (0.197 J.lg/m') Accumulation mode· Surface level (3.1421!g/m') Coarse mode· Surface level (21.908I!g/m')
12.6 NH4
35.2 POM
<1/37.6 Sea-salt
Figure 3: Average composition (contribution of different constituents in % of mass) and total dry mass concentration (water content not considered) of the global aerosol in the Aitken (a, d), accumulation (b, e), and coarse mode (c, f) size ranges. Results are shown for the lowest model layer located just above the earth's surface (bottom row) as well as for the 250 hPa pressure level, which corresponds to an altitude of about 10 km (top row). The simulation was performed with the EMAC/MADE-IN global aerosol model (Aquila et al. 2011). See Figure 1 for an explanation of the aerosol constituents considered.
2-

IOWEn boundary layer (300 ml
10000 1000
100 10
'0' j • E' I :!;l 0.1 . Z 0011 y
0.01
d[uml
upper boundary layer (1100 m)
10000
100O
100 10
0.1
0.1)1
O.Q1 0.1 dhtmJ
1L 10000 I-
1000 (j)
100
10 :§: c: 3? 0.1 Z 0.01 u
0.Q1 0.1 d
0.1, 0.Q1 .
0.01
troposphere (4.0 I<:m)
0.1 d[flmj
Figure 4: Aerosol size distribution, i.e., number concentration per logarithmic size interval versus particle diameter, at different altitudes measured by Petzold et al. (2002) during the LACE campaign (Lindenberg Aerosol Characterization Experiment) over central Europe in August 1998 and simulated with the EMAC/MADE-IN global aerosol model. The number concentrations were converted to standard temperature and pressure (STP) conditions (273 K, 1013 hPa). Particle diameters correspond to dry aerosol (water content not considered). The dotted lines indicate size distributions measured during different flights. The solid line and shaded areas indicate the median, the 25 % and 75 %, and the 10 % and 90 % percentiles ofthe model results. The figure is adapted from Aquila et al. (2011).
- 3-