global and planetary change - universitetet i oslofolk.uio.no/chongyux/papers_sci/global_3.pdf ·...
TRANSCRIPT
Contents lists available at ScienceDirect
Global and Planetary Change
journal homepage: www.elsevier.com/locate/gloplacha
Development of a new IHA method for impact assessment of climate changeon flow regime
Tao Yanga,b,⁎, Tong Cuia, Chong-Yu Xuc, Philippe Ciaisd, Pengfei Shia
a State Key Laboratory of Hydrology-Water Resources and Hydraulic Engineering, Hohai University, Nanjing 210098, Chinab State Key Laboratory of Desert and Oasis Ecology, Xinjiang Institute of Ecology and Geography, Chinese Academy of Sciences, Urumqi, Chinac Department of Geosciences, University of Oslo, P.O. Box 1047, Blindern, 0316 Oslo, Norwayd Laboratorie des Sciences du Climat et de l'Environnement, Commissariat a L'Energie Atomique, 91191 Gif sur Yvette, France
A R T I C L E I N F O
Keywords:Flow regime alterationClimate changeUpper Niger RiverIHARepresentative-IHA method
A B S T R A C T
The Indicators of Hydrologic Alteration (IHA) based on 33 parameters in five dimensions (flow magnitude,timing, duration, frequency and change rate) have been widely used in evaluation of hydrologic alteration inriver systems. Yet, inter-correlation seriously exists amongst those parameters, therefore constantly under-estimates or overestimates actual hydrological changes. Toward the end, a new method (Representative-IHA,RIHA) is developed by removing repetitions based on Criteria Importance Through Intercriteria Correlation(CRITIC) algorithm. RIHA is testified in evaluating effects of future climate change on hydro-ecology in the NigerRiver of Africa. Future flows are projected using three watershed hydrological models forced by five generalcirculation models (GCMs) under three Representative Concentration Pathways (RCPs) scenarios. Results showthat: (1) RIHA is able to eliminate self-correlations amongst IHA indicators and identify the dominant char-acteristics of hydrological alteration in the Upper Niger River, (2) March streamflow, September streamflow,December streamflow, 30-day annual maximum, low pluses duration and fall rates tends to increase over theperiod 2010–2099, while July streamflow and 90-day annual minimum streamflow shows decrease, (3) theNiger River will undergo moderate flow alteration under RCP8.5 in 2050s and 2080s and low alteration otherscenarios, (4) future flow alteration may induce increase water temperatures, reduction dissolved oxygen andfood resources. Consequently, aquatic biodiversity and fish community of Upper Niger River would becomemore vulnerable in the future. The new method enables more scientific evaluation for multi-dimensional hy-drologic alteration under the context of climate change.
1. Introduction
Aquatic ecosystems provide valuable services such as fish produc-tion, water purification and recreation, and protection from hydro-logical hazards (Grizzetti et al., 2016). Changes in streamflow (i.e.velocity, flow depth and volume) have altered the integrity of ecosys-tems and biological diversity (Poff et al., 1997; Hart and Finelli, 1999;Bunn and Arthington, 2002) and have been detected around the world(Yang et al., 2010a, 2010b; Mackay et al., 2014; Puig et al., 2016).Climate changes are regarded as the major driving factors of flow al-teration (Lobanova et al., 2015). Future changes in climate have beenwidely researched (Yang et al., 2011, 2012a, 2012b, 2015; Wang et al.,2012, 2013; Singh and Goyal, 2016). Analysis of potential influence inhydrological regime shows that many regions are expected to experi-ence significant changes (Mittal et al., 2016). Furthermore, some
hydrologists (Döll and Zhang, 2010) reported that climate change maybe more important in altering river flow regimes than dams and humanwater withdrawals. In the Niger River basin, climate observations sincethe late 1960s show severe drought hazards (Gaston, 2013; Angelinaet al., 2015; Tarhule et al., 2015; Mascaro et al., 2015). The regime ofNiger River has been modified from one flood peak hydrograph to dualpeak hydrograph (Descroix et al., 2012). Annual flow changes at threestations on the Niger River ranging from - 34% to −17% between thepre-1970 and post-1970 periods (Abrate et al., 2013). Oguntunde andAbiodun (2013) and Aich et al. (2014) provided a broad assessment ofchange of climate and streamflow in 21st century for the Niger basin.Results show that the Niger basin will become warmer with a meantemperature increase from 0.5 to 3 °C in 2031–2050 under A1B scenario(Oguntunde and Abiodun, 2013). Precipitation is projected to decreaseover catchment headwaters, and increase over eastern part (Aich et al.,
http://dx.doi.org/10.1016/j.gloplacha.2017.07.006Received 21 March 2017; Received in revised form 11 May 2017; Accepted 10 July 2017
⁎ Corresponding author at: State Key Laboratory of Hydrology-Water Resources and Hydraulic Engineering, Center for Global Change and Water Cycle, Hohai University, Nanjing210098, China.
E-mail address: [email protected] (T. Yang).
Global and Planetary Change 156 (2017) 68–79
Available online 12 July 20170921-8181/ © 2017 Elsevier B.V. All rights reserved.
MARK
2014). Future discharge indicates shifts from up to 500% increase to a50% decrease (Aich et al., 2014), thus highlighting a big uncertainty. Itshould be noted that the focus of those studies has been mainly onstreamflow changes, while less attention has been paid to under-standing of changes in streamflow regimes and their potential ecolo-gical impacts. This motivates us to explore changes in Niger River flowand potential implications for aquatic ecosystems in the future.
Hydrological alteration and its impacts on ecosystems play a vitalrole for a sustainable development of water resources, and changes ofdifferent hydrological variables result in complex set impacts.Assessment of flow regime alteration is therefore a basic step calling forappropriate indicators. To date, numerous multivariable approacheshave already been developed to quantify ecologically-relevant hydro-logical alteration (Poff and Ward, 1989; Poff and Allan, 1995; Clausenand Biggs, 2000; Pettit et al., 2001; Magilligan and Nislow, 2005). TheIndicators of Hydrological Alteration (IHA) were developed based on 33parameters in five groups (i.e. flow magnitude, timing, duration, fre-quency and change rate) (Richter et al., 1996). Olden and Poff (2003)compared more than 170 hydrological indicators and found that IHAindicators are representative enough to describe the statistical altera-tion in the complete set of hydrologic indices. Thus, IHA indicators arewidely used with a range of variability (RVA) to establish statistics offlow regime alterations in many rivers (Yang et al., 2008; Zhang et al.,2009; Lee et al., 2014). Notwithstanding, inter-correlations sig-nificantly exist amongst the 33 parameters included in IHA. As for ex-amples, mean monthly flow exhibit a high degree of inter-correlation(Olden and Poff, 2003). Most IHA indicators have strong correlationwith one or two eco-flow metrics (Gao et al., 2012), for instance,parameters related to the duration of annual minimum flow were foundto be strongly correlated with winter eco-flow metrics. This has resultedinto statistical repetition and inaccurate assessment of flow changes andpotential impacts on ecological systems (Arthington et al., 2006). Al-though scientific efforts have addressed the relationships between animpacted variable of interest and hydrologic indicators, the inter-cor-relations amongst the IHA have not been analyzed comprehensivelystill (Gao et al., 2009). More importantly, new IHAs eliminating self-correlations and characterizing dominant properties of hydrologicchanges have not been reported so far. Therefore, updated hydrologicalindicators without inter-correlations are called for to precisely evaluatehydrologic alteration and provide beneficial insights into sustainabledevelopment of water resources and ecological systems (Vogel et al.,2007).
Recognizing the above concerns, this study aims to: (1) develop anupdated version of IHA indicators (Representative-IHA, RIHA), (2)address changes in RIHA indicators induced by climate change, (3)project the occurrence probability of hydrological alterations (differentlevels) in the Upper Niger River, and (4) explore possible implicationsof hydrological alteration on aquatic ecosystems to develop knowledgefor sustainable water resource and eco-environmental managementunder climate change.
2. Study area and data
2.1. Study area
Being the largest river in West Africa, the Niger River (Fig. 1) sup-plies water for more than 100 million people in nine countries, in-cluding Benin, Burkina Faso, Cameroon, Guinea, Ivory Coast, Mali,Nigeria, Chad and Niger. The river also supports fishing, navigation andirrigated agriculture. Severe droughts started in the 1970s led to de-gradation in the flora of river-floodplain system and numerous fishspecies habitats (Morand and Mikolasek, 2005). Future climate changewill continue to impact the flow regime and exacerbate existing eco-logical problems. Given its peculiar arch shape across Sahel and theGuinean coast of Africa, the Niger river is dominated by a large range ofclimatic zones (Abrate et al., 2013).
This study is focused on the Upper Niger River Basin, the majorwatershed of the Niger river with an area of 120,000 km2, located be-tween latitudes 8°N-13°N and longitudes 12°W–7°W (Fig. 1), whoseoutlet is Koulikoro station. The upper Niger stream crosses Ivory Coast,Guinea and Mali with the mean elevation of 462 m. The climate of thisarea is characterized by a rainy season from July to September and awet season from October to June (Picouet et al., 2009). Mean annualprecipitation is 1500 mm and annual average river discharge is1348 m3/s. Upper Niger is home to 130 to 140 fish species, belonging to62 genera and 26 families. From 1969 to 1986, the area of floodplainsin the Central Delta was reduced by 15,000 km2 (75%) and fish pro-duction decreased to 45,000 t (Fig. 2, Morand and Mikolasek, 2005). Asa consequence of big droughts, loss of floodplains and other factors,some fish species (e.g. Polypterus senegalus and Gymnarchus niloticus)were very rare in the Central Delta and others disappeared (e.g. Ci-tharidium ansorgii and Alestes macrolepidotus) from catches (Fig. 3).Other aquatic species (e.g. Cyperus distans, Nymphaea lotus) emergedrecently in some regions.
2.2. Data
Daily discharge at Koulikoro station (1907–2006) was collectedfrom the Global Runoff Data Center (Fekete et al., 1999). Other datasetsused in this study are Digital Elevation Model (DEM), the land coverand the soil map. DEM with a resolution of 90 m × 90 m was providedby the Shuttle Radar Topography Mission (SRTM). Land cover datasetwas obtained from the EC Joint Research Centre for an epoch centeredaround the year (http://bioval.jrc.ec.europa.eu/products/glc2000/products.php). The Soil information data, collected from the Harmo-nized World Soil Database (HWSD) derived by the Food and AgricultureOrganization of the United Nations, were represented by1000 m× 1000 m resolution.
Historical climate forcing data for driving hydrological models in-cluding daily precipitation, temperature (maximum, mean, minimum),solar radiation, relative humidity and wind velocity were gathered fromthe Water and Global Change (WATCH) dataset over the period from1957 to 2001 with a spatial resolution of 0.5°. Future climate scenariosare from bias-corrected Earth System Models (ESMs) from the CoupledModel Intercomparison Project Phase 5 (CMIP5) at a grid resolution of0.5° provided by the Inter-Sectoral Impact Model IntercomparisonProject (ISI-MIP, Warszawski et al., 2014), namely, GFDL-ESM2M,HadGEM2-ES, IPSL-5CM5A-LR, MIROC-ESM-CHEM and NorESM1-M.Future emissions and radiative forcing is included by considering threeRepresentative Concentration Pathways (RCPs) (i.e. RCP2.6, RCP4.5and RCP8.5) with 5 ESMs, leading to a matrix of 15 future climatetrajectories.
3. Methodology
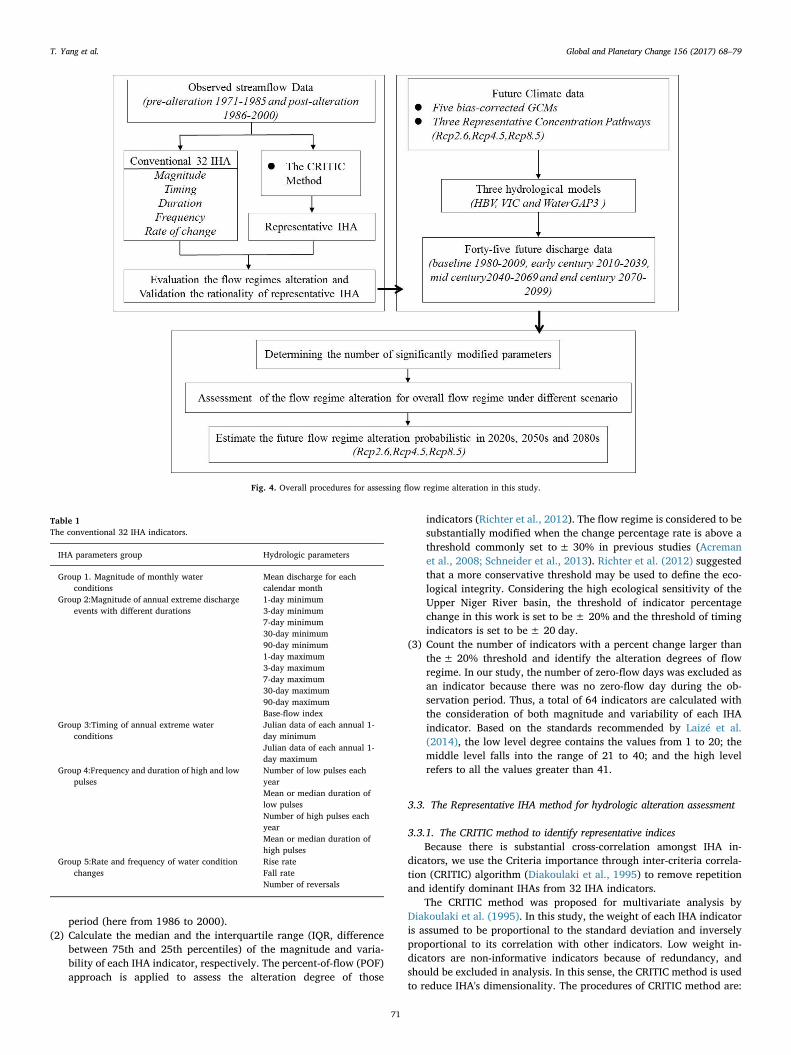
The framework of this study is presented in Fig.4. It consists of threesteps: (1) construct and verify RIHA based on the Criteria ImportanceThrough Intercriteria Correlation (CRITIC) method using streamflowobservations during 1971–2000; (2) project future flows from 2010 to2099 by using three hydrological models (HBV, VIC, WaterGap3) forcedby future climate scenarios derived from GCMs; (3) evaluate future flowregime alteration and potential ecological implications under differentscenarios with the RIHA method.
3.1. Hydrological models
We used the HBV, VIC and WaterGAP3 hydrological models for si-mulation and projection. These models have been extensively applied inclimate research worldwide (Menzel et al., 2006; Christensen andLettenmaier, 2006; Schneider et al., 2013). Two accuracy criteria(Nash-Sutcliffe efficiency (NSE) and percent bias (PBIAS)) were used toevaluate simulation performance with the monthly time step. Further
T. Yang et al. Global and Planetary Change 156 (2017) 68–79
69

details of the description of NSE and PBIAS can be referred to Nash andSutcliffe (1970) and Gupta et al. (1999). The model performance can beconsidered satisfactory if NSE≥ 0.7 and PBIAS ≤ ± 15%.The highand low percentiles of river discharges at the daily time step were alsochecked. The hydrologic model calibration and validation details can befound in Huang et al. (2016).
3.2. The IHA method for hydrologic alteration assessment
The IHA approach (Richter et al., 1997) has been extensively used toevaluate eco-hydrological effects of flow regime alteration caused byriver management and climate change. The IHA is based on a set of 33indicators classified into five groups, related to magnitude, duration,timing, frequency and change rate (Table 1). Generally, the IHA iscalculated following the steps below:
(1) Divide daily discharge data into two parts, a baseline pre-impactperiod (here from 1971 to 1985) and a perturbed post-impact
Fig. 1. Map of the Upper Niger River Basin.
Fig. 2. Plots of Niger River discharge at Koulikoro upstream and fish production (metrictons) in the central delta of the Niger (Morand and Mikolasek, 2005).
Fig. 3. Endangered species and species that have dis-appeared (a) Polypterus senegalus(b) Gymnarchus niloticus(c) Alestes macrolepidotus (d) Cyperus distans.
T. Yang et al. Global and Planetary Change 156 (2017) 68–79
70
period (here from 1986 to 2000).(2) Calculate the median and the interquartile range (IQR, difference
between 75th and 25th percentiles) of the magnitude and varia-bility of each IHA indicator, respectively. The percent-of-flow (POF)approach is applied to assess the alteration degree of those
indicators (Richter et al., 2012). The flow regime is considered to besubstantially modified when the change percentage rate is above athreshold commonly set to± 30% in previous studies (Acremanet al., 2008; Schneider et al., 2013). Richter et al. (2012) suggestedthat a more conservative threshold may be used to define the eco-logical integrity. Considering the high ecological sensitivity of theUpper Niger River basin, the threshold of indicator percentagechange in this work is set to be± 20% and the threshold of timingindicators is set to be± 20 day.
(3) Count the number of indicators with a percent change larger thanthe± 20% threshold and identify the alteration degrees of flowregime. In our study, the number of zero-flow days was excluded asan indicator because there was no zero-flow day during the ob-servation period. Thus, a total of 64 indicators are calculated withthe consideration of both magnitude and variability of each IHAindicator. Based on the standards recommended by Laizé et al.(2014), the low level degree contains the values from 1 to 20; themiddle level falls into the range of 21 to 40; and the high levelrefers to all the values greater than 41.
3.3. The Representative IHA method for hydrologic alteration assessment
3.3.1. The CRITIC method to identify representative indicesBecause there is substantial cross-correlation amongst IHA in-
dicators, we use the Criteria importance through inter-criteria correla-tion (CRITIC) algorithm (Diakoulaki et al., 1995) to remove repetitionand identify dominant IHAs from 32 IHA indicators.
The CRITIC method was proposed for multivariate analysis byDiakoulaki et al. (1995). In this study, the weight of each IHA indicatoris assumed to be proportional to the standard deviation and inverselyproportional to its correlation with other indicators. Low weight in-dicators are non-informative indicators because of redundancy, andshould be excluded in analysis. In this sense, the CRITIC method is usedto reduce IHA's dimensionality. The procedures of CRITIC method are:
Fig. 4. Overall procedures for assessing flow regime alteration in this study.
Table 1The conventional 32 IHA indicators.
IHA parameters group Hydrologic parameters
Group 1. Magnitude of monthly waterconditions
Mean discharge for eachcalendar month
Group 2:Magnitude of annual extreme dischargeevents with different durations
1-day minimum3-day minimum7-day minimum30-day minimum90-day minimum1-day maximum3-day maximum7-day maximum30-day maximum90-day maximumBase-flow index
Group 3:Timing of annual extreme waterconditions
Julian data of each annual 1-day minimumJulian data of each annual 1-day maximum
Group 4:Frequency and duration of high and lowpulses
Number of low pulses eachyearMean or median duration oflow pulsesNumber of high pulses eachyearMean or median duration ofhigh pulses
Group 5:Rate and frequency of water conditionchanges
Rise rateFall rateNumber of reversals
T. Yang et al. Global and Planetary Change 156 (2017) 68–79
71

Step 1: Calculate the CRITIC labels
∑= −=
C σ r(1 )j jj
m
ij1 (1)
where σj represents the standard deviation of the jth indicator; rij de-notes correlation coefficient between vectors ri and rj.
Step 2: Calculate a weight for the jth indicator:
∑==
w C Cj jj
m
j1 (2)
In the study, the CRITIC method is used to identify weights for in-dicators based on the variability and cross-correlations of the 32 in-dicators (Table 1) during the baseline period (1971 to 2000). TheCRITIC method allows us to reduce the dimensionality of IHA in-dicators.
3.3.2. Verification of the representative IHA method
(1) Method thresholdThe conventional IHA approach defines 31% and 62% as thethresholds to distinguish low, medium and high alteration.Indicators that have changed during the perturbed period by0%–31%, 31%–62% and 62%–100% represent low, medium andhigh alteration, respectively. The number of significantly modifiedindicators (21 and 41) is obtained by multiplying the maximumindicator number (64) by 31% and 62%, respectively. Here thesame thresholds are applied for the Representative-IHA method. Wefound that the total number of significantly modified indicators is
36 (18 medians and 18 IQR), therefore 11 and 22 are obtained asthe lower and upper alteration thresholds (36 multiplied by 31%and 36 multiplied by 62%), respectively. Accordingly, when thenumber of significantly modified indicators is 0, 1–11, 12–22 and23–36, the class of alteration is considered to be no level degree,low level degree, medium level degree and high level degree, re-spectively.
(2) Method validationWe compared RIHA results with IHA results during the historicalperiod (1971–2000). A high agreement (100%) is found betweentwo IHA methods, therefore RIHA method is reasonable.
3.4. Projection of flow regime alteration in the Niger River under climatechange
Daily discharges during the period 1980 to 2099 were simulated bythe three hydrological models. Five general circulation models (GCMs)under three major Representative Concentration Pathways (RCPs) areused to force the hydrological models to generate the future daily dis-charges. The whole period (1980–2099) is divided into four periods: thebaseline period (1980–2009), early-Century (2020s, 2010–2039), mid-Century (2050s, 2040–2069), end-Century (2080s, 2070–2099).
Following the classes of overall flow regime alteration described inSection 3.3.2, the magnitude and variability of each non-redundantRIHA indicator during the four periods 1980–2009, 2010–2039,2040–2069 and 2070–2099 are calculated. Since we have fifteen modeldischarge series (3 hydrological models × 5 GCMs) for each RCP sce-nario and time period in the future, the flow regime alteration degree isconsidered to be affected most significantly by the one with the largest
Table 2The weights of 32 IHA indicators calculated by the CRITIC method and their effects on aquatic organisms (Richter et al., 1998) and the selected of indicators.
Hydrologic Parameters Weight Effects on aquatic organisms The selected ofindicators
October mean flow 0.02233 Provide availability of habitat, soil moisture, water and food; access by predators to nesting sites;functional link to water temperature, oxygen levels, photosynthesis
Base-flow indexNumber of low pulseFall rateNumber of high pulseLow pulse durationJuly mean flowRise rateNumber of reversals30-day maximum90-day minimum1-day minimumMarch mean flowSeptember mean flow1-day maximumHigh pulse durationJulian data of minimumDecember mean flowJulian date of maximum
November mean flow 0.02298December mean flow 0.02195January mean flow 0.02385February mean flow 0.03131March mean flow 0.03118April mean flow 0.02951May mean flow 0.0251June mean flow 0.03524July mean flow 0.03108August mean flow 0.02996September mean flow 0.027821-day minimum 0.03233 Creation of sites for plant colonization; structuring of river channel morphology and physical habitat
conditions; nutrient exchanges between rivers and floodplains; distribution of plant communities inlakes, ponds, floodplains
3-day minimum 0.03147-day minimum 0.0312430-day minimum 0.0322490-day minimum 0.032531-day maximum 0.029543-day maximum 0.029357-day maximum 0.0290630-day maximum 0.0338690-day maximum 0.03056Base-flow index 0.04627Julian data of 1-day minimum 0.02499 Provide special habitats during reproduction or to avoid predation; influences spawning for migratory
fish, evolution of life history strategiesJulian data of 1-day maximum 0.02073Number of low pulses 0.04463 Connection to soil moisture and anaerobic stress for plants;
Provide floodplain habitats; ensure nutrient and organic matter exchanges between river and floodplain,soil mineral availabilityInfluences bedload transport, channel sediment textures, and duration of substrate disturbance (highpulses)
Mean or median duration of lowpulses
0.03928
Number of high pulses 0.04012Mean or median duration of
high pulses0.02693
Rise rate 0.03479 Drought stress on plants (falling levels)Entrapment of organisms on islands, floodplains (rising levels)Desiccation stress on low-mobility stream edge (varial zone) organisms
Fall rate 0.04375Number of reversals 0.03407
The sum of all 32 weights is equal to 1.The indexes in fourth column, according to the weight from high to low, are selected as representative IHA indices.
T. Yang et al. Global and Planetary Change 156 (2017) 68–79
72

probability. The probability of each alteration category is defined by.
= =P n m j( 1, 2, 3, 4)j j (3)
Wherem is the total number (m = 15) of model discharge series in agiven time period. P1 ,P2 , P3 and P4 represent the occurrence prob-ability of no alteration, low alteration degree, median alteration degreeand high alteration degree, respectively. nj is the number of modeldischarge series in the jth alteration category.
4. Results and discussions
4.1. Validation of the representative IHA method during historical period
Based on observed daily discharges at the Koulikoro station, theweights of each IHA indicator calculated by the CRITIC method arepresented in Table 2. Those indicators with high weights (includingbase flow index, low pulse count, fall rate, high pulse count, low pulseduration, July, rise rate and number of reversals) are identified as re-presentative indicators. Each of these indicators corresponds to a cer-tain type of ecological influence reported by Richter et al. (1996). Withrespect to the indicators with low weights value, high pulse duration,date of minimum and date of maximum indicators are selected as wellbecause each of them exerts particular facets of the flow regime andessential functional link to the aquatic ecosystem. For example, date ofminimum and date of maximum link to spawning for migratory, fishevolution of life history strategies, etc. Four representative indicators ingroup 2 include two (1-day minimum and1-day minimum) that mea-sure the short term of annual extreme conditions, two (30-day max-imum and 90-day minimum) that measure the long term duration ofannual extreme conditions. In addition, owing to the local climate in-fluence (rainfall seasonality: dry between January to March, dry-wettransition between April to June, wet between July to September andwet-dry transition between October to December) (Oguntunde et al.,2013; Mascaro et al., 2015), the runoff in the Niger Basin has a seasonalpattern with a month delay following the rainfall seasonality. Thus,March, July and December mean streamflow are picked out as the re-presentative of flow seasonality because they have the highest CRITICweight of a season. September mean streamflow, rather than August, isselected for the wet season usually with a single peak in September.Consequently, 18 indicators are selected (Table 2) and constitute RIHAindicators.
Subsequently, RIHA and IHA are used to assess the flow regimealteration for inter-comparison. The results show that 44 indicatorsexceed a significant alteration threshold (20% or 20 days) in the con-ventional IHA method, suggesting a high hydrological alteration in theUpper Niger River Basin during the baseline period (1971–2000). ForRIHA, the number of significantly altered indicators is 25 (within thehigh degree interval 23–36), also indicating a high level alterationdegree. Results of alteration degree by two IHA methods are consistent.Hence, RIHA can be used to assess flow regime alteration in the UpperNiger River. Note that, RIHA indicators vary with the catchment(catchment characteristics, e.g. climate type).
Compared with IHA that is commonly used approach in assessmentof flow alteration worldwide, RIHA reduces the dimension and cross-correlations amongst IHA indicators when compared with IHA. Theeco-deficit and eco-surplus metrics developed by Vogel et al. (2007) aregood overall measure for the evaluation of streamflow alteration. Tofurther understand the representative of selected indicators, the corre-lation coefficient between eco-flow indicators and all 32 indicatorswere calculated (Table 3). As shown in Table 3, different indicators ofmonthly streamflow or extreme flow of RIHA showed strong correla-tions with different eco-flow indicators. For example, mean flow inDecember showed strong correlations with spring eco-flow and Sep-tember shows strong correlations with autumn's. This implies that theRIHA could provide a good representations of the of streamflow al-teration. In contrast, monthly streamflow and magnitude of the extreme
flow indicators for traditional IHA had strongly correlation with one ortwo eco-flow indicators, indicating the inter-correlation of the IHAmetrics. Besides, previous studies show that the eco-flow might losesome flow regime information without account for the timing orduration of particular flow event (Gao et al., 2012). For RIHA, eachindicator connecting to a certain type of ecological characteristics andkey characteristics on flow regime are considered. Thus, it provides arobust and simpler representation than the IHA approach based on anumber of repetitive indicators and can capture the crucial flow char-acteristics of hydrological alteration for the Upper Niger River.
RIHA proposed in this study can minimize statistical redundancyand reduces the complexity associated with formulating conservationpolicies and practical water management strategy for vulnerableaquatic systems. In addition, compared with the conventional IHAmethod, RIHA method is less CPU intensive (about 65.7%; see supple-mentary material). This advantage allows for a time-consuming com-putation and analysis in climate impact research.
4.2. Projection of flow regime alteration under future climate change
Hydrological projections during 2010–2099 are used to project thefuture flow regime alteration based on the Representative-IHA method.Here, we first evaluate the median changes of each indicator of hy-drological alteration (RIHA) by whisker plots (the median, 25th and75th percentile values and minimum and maximum values) from the 15model discharge series (3 hydrological models × 5 GCMs) for2010–2039, 2040–2069 and 2070–2099 relative to the baseline period(1980–2009) under three RCPs. Then, projection of the overall flowregime alteration is conducted.
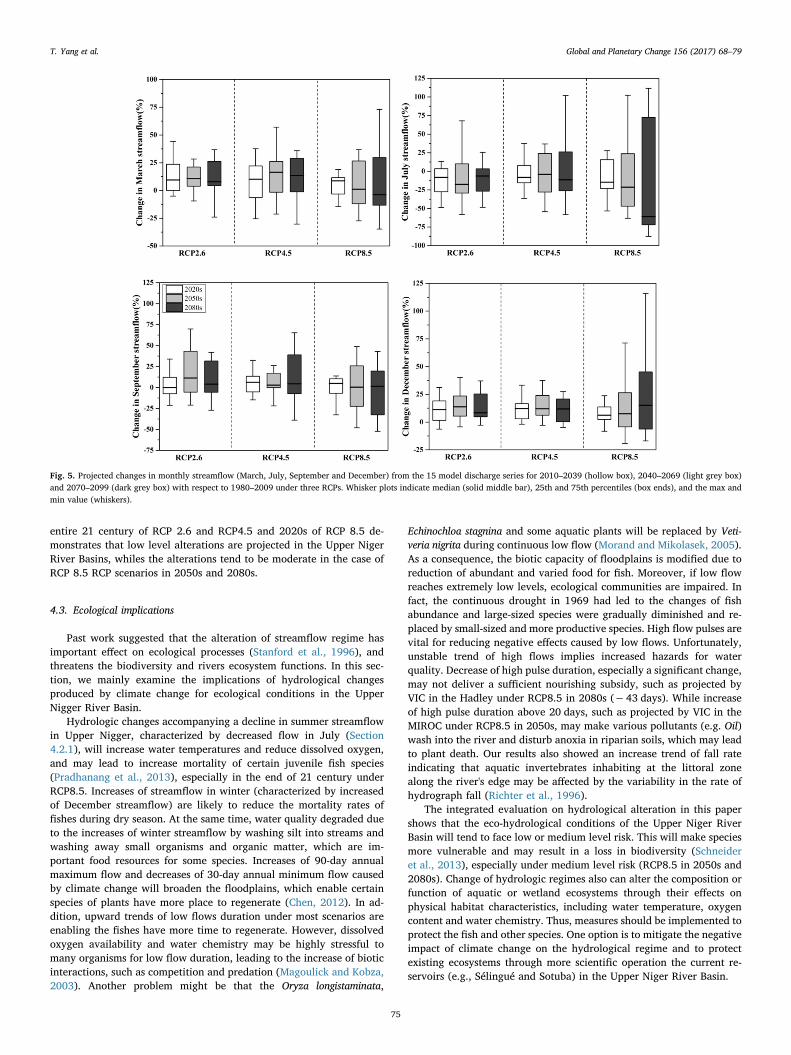
4.2.1. Projection of the representative-IHA indicators alteration4.2.1.1. Alteration of monthly streamflow. The simulated alterations ofstreamflow in months (March, July, September and December) for theperiod 2010–2099 are presented in Fig.5. Increasing trends are found inthe medians for December streamflow for the entire century underthree RCPs, ranging from 8.4% to 15.2%. The medians of Marchstreamflow show the same trends as December in most scenariosexcept under RCP8.5 in 2080s, with increase between 1.1% and16.4%. For September streamflow, all scenarios agree on anincreasing trend, which is less than 12%. In contrast, decreased trendof monthly streamflow can be observed in the July. Specially, thechange in July discharge under RCP8.5 is remarkably lower than thebaseline period, which decreases in 2050s by 21.3% and in the endcentury even by 60.8%.
4.2.1.2. Alteration of magnitude of annual extreme streamflow. Fig.6illustrates the alteration of magnitude of annual extreme streamflow.For the 1-day annual minimum flows, the positive trends under RCP2.6and RCP4.5 are rather minor, which are less than 4%. Only underRCP8.5, the changes are partly significant, particularly for the 2080swith decrease of −25%. In view of the 90-day annual minimum flow, adecline trend is detected except in the 2020s under RCP4.5. However, asignificant change of the medians for 90-day annual minimum flow isdetected under RCP8.5 scenario in the 2080s, with a decrease of up to26.7%. For the 30-day annual maximum flow, increasing trends arefound for RCP2.6 and RCP 4.5 in future, fluctuating around 4%. UnderRCP 8.5, a 3% increase trend is presented in 2020s, whereas decreasetrends are detected in 2050s and 2080s. Furthermore, slight increases ofthe 1-day annual maximum flows and slight decreases of the base-flowindex are found in most scenarios.
4.2.1.3. Alteration of timing of annual extreme streamflowoccurring. Fig.7 displays the predictions of the date of annualminimum and maximum flow. The date of annual minimum flow islikely to shift backward with a time shift betwween 0.5 and 12 days.Furthermore, these changes show different trend for different RCPs. For
T. Yang et al. Global and Planetary Change 156 (2017) 68–79
73

RCP2.6, more days delay in time of annual minimum flow appears inthe 2020s than in 2050s and 2080s, while opposite results are shownfor the scenarios in RCP4.5 and RCP8.5. The date of annual maximumtends to be marginally impacted, ranging from −0.5 to 2.5 days.
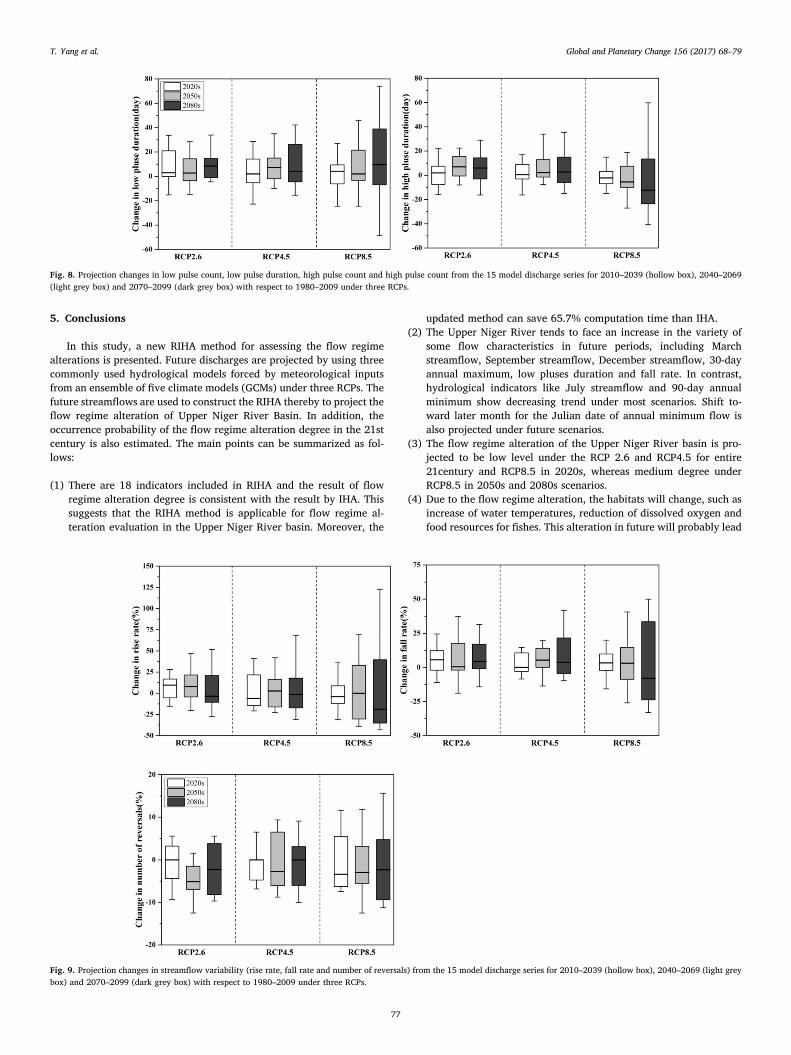
4.2.1.4. Alteration of frequency and duration of high and low pulses. Nochanges of the median values of low and high pulse count are detectedacross the three RCPs and the two indicators therefore are not listed.Duration of high and low pulses is shown in Fig.8.The median values oflow pulse duration generally present increasing trends, ranging from2.0% to 9.7%. However, it is hard to project how the trend of high pulseduration changes in future. Under RCP 2.6, moderate extending timesare seen in the 2050s and 2080s. The modeling results show an oppositetrend for RCP8.5: a moderate decrease in high pulse duration in 2050sand 2080s in comparison to the baseline. Under RCP 4.5, high pulseduration is likely to extend in 2050s and 2080s while unchanged in2020s.
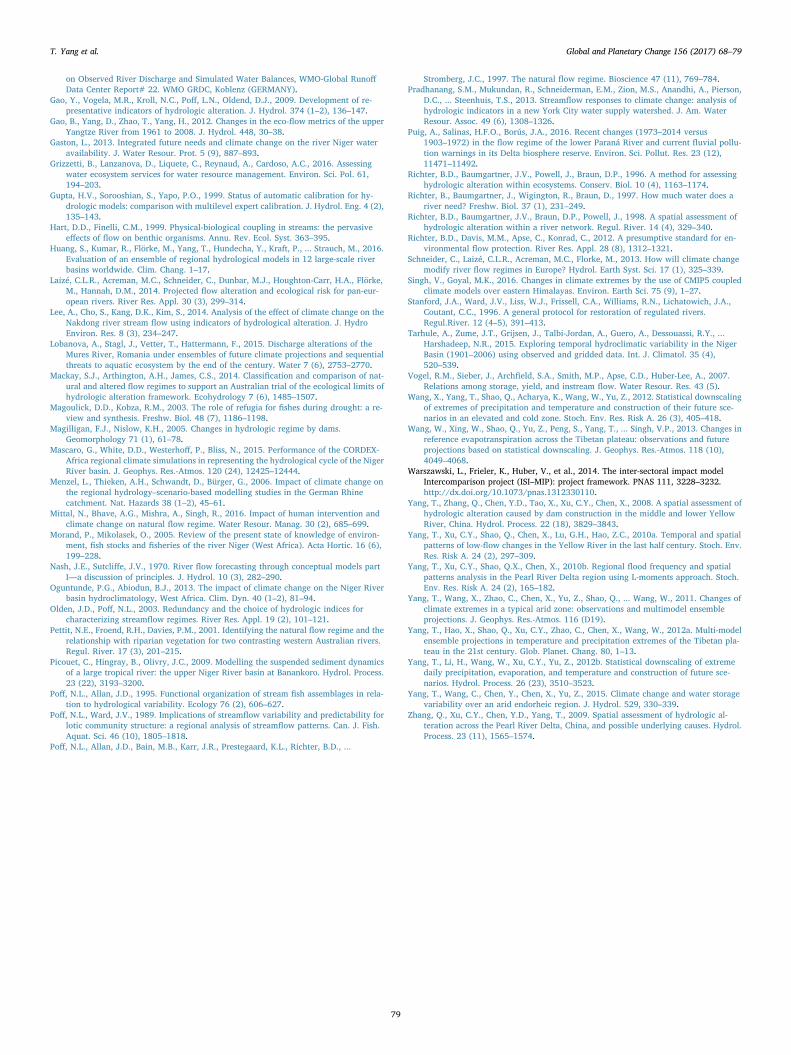
4.2.1.5. Alteration of streamflow variability. As can be seen in Fig.9, thetrends of uncertainty for rise rate across RCP are very high. Forexample, in RCP 2.6, rise rate stands for increase in 2020s and 2050swhile decrease in 2080s, while decreases are detected in 2020s and2080s and increase in 2050s under RCP 4.5. For fall rates, the mediansincrease throughout the 21st century in most scenarios fluctuate around3%. In addition, the projected results agree on the decrease trend innumber of reversals.
4.2.2. Projection of the overall flow regime alterationBased on the significantly modified indicators, the assessments of
the overall flow regime alterations are conducted for different projec-tions. The number of significantly modified indicators and
corresponding flow alteration degrees in the 2020s, 2050s and 2080ssimulated by different hydrological models and GCMs are shown inFig.10. The ranges of the number of substantially modified indicatorsvary significantly for different model experiments under the same RCPs.For instance, in the 2050s, the number of substantially modified in-dicators for RCP2.6 ranges from 7 to 15 and from 4 to 18 for RCP4.5.Only the scenario driven by MIROC using VIC in 2080s under RCP8.5shows a high alteration degree, which corresponds to 26 substantiallymodified indicators. Compared with the HBV and VIC model, the resultsprojected by WaterGAP3 model show the less substantially modifiednumber of indicators in most scenarios. Meanwhile, the number ofsubstantially modified indicators produced with the MIROC climateprojections is higher than that driven by other climate models. Fur-thermore, according to Fig.10, the effects by hydrologic models are lessthan GCMs. On the other hand, it is observed that the number of sub-stantially modified indicators in RCP 8.5 is larger than that in RCP 2.6and RCP 4.5.
The projection probabilities of flow regime alteration degree in theUpper Niger River Basin for the future periods (2020s, 2050s and2080s) under different RCPs are calculated on the basis of the RIHA(Fig. 11). The dominant flow regime alteration degree is determined byits largest occurrence probability. Within approximately a small percentof the occurrence probability for the alteration of the medium change, agiant percent in low degree was observed, as presented in Fig.11,suggesting that low change degree will occur under RCP 2.6 in 2020s,2050s and 2080s. Similarly, low alteration degree will occur under RCP4.5 for the entire 21st century. Of all cases, flow regime alterationdegree under RCP8.5 is the most sensitive case to climate change,where medium level impacts dominate in 2050s (nine out of fifteenprojections) and 2080s (fourteen out of fifteen projections).
On the whole, the result of hydrological variables changes in the
Table 3The comparison between the eco-flow metrics and the 32 indicators.
Hydrologic parameters Spring Summer Autumn Winter
ED ES ED ES ED ES ED ES
October mean flow −0.66 0.59 0 0.07 −0.44 0.25 −0.61 0.45November mean flow −0.55 0.83 0.13 −0.02 −0.27 0.12 −0.36 0.14December mean flow −0.71 0.72 0.22 −0.05 −0.40 0.18 −0.44 0.19January mean flow −0.74 0.82 0.16 −0.09 −0.21 0.05 −0.32 0.10February mean flow −0.75 0.95 −0.15 0.23 0.10 −0.21 −0.19 −0.03March mean flow −0.36 0.60 −0.55 0.53 0.43 −0.46 0.03 −0.08April mean flow −0.16 0.35 −0.61 0.56 0.46 −0.41 0.05 −0.08May mean flow −0.09 0.20 −0.76 0.72 0.36 −0.39 0.01 −0.13June mean flow −0.15 0.04 −0.61 0.82 −0.18 −0.12 −0.17 0.05July mean flow 0.05 −0.19 −0.29 0.16 −0.58 0.46 −0.41 0.34August mean flow −0.05 −0.28 0.27 −0.23 −0.77 0.86 −0.59 0.36September mean flow −0.13 0.00 0.31 −0.12 −0.90 0.78 −0.76 0.381-day minimum −0.09 0.34 −0.61 0.58 0.46 −0.42 0.17 −0.153-day minimum −0.08 0.34 −0.61 0.58 0.47 −0.42 0.18 −0.167-day minimum −0.08 0.33 −0.61 0.59 0.46 −0.41 0.18 −0.1430-day minimum −0.11 0.34 −0.63 0.62 0.43 −0.40 0.15 −0.1190-day minimum −0.22 0.41 −0.68 0.65 0.41 −0.42 0.03 −0.071-day maximum −0.31 0.21 0.19 −0.04 −0.81 0.59 −0.86 0.683-day maximum −0.30 0.20 0.20 −0.05 −0.82 0.59 −0.86 0.677-day maximum −0.30 0.20 0.21 −0.08 −0.83 0.60 −0.85 0.6830-day maximum −0.26 0.22 0.34 −0.22 −0.87 0.68 −0.81 0.5890-day maximum −0.24 0.23 0.32 −0.21 −0.86 0.77 −0.73 0.42Base-flow index 0.19 0.07 −0.53 0.40 0.77 −0.52 0.51 −0.30Julian data of 1-day minimum −0.50 0.51 0.19 −0.07 −0.32 0.12 −0.55 0.34Julian data of 1-day maximum −0.05 0.57 −0.34 0.33 0.28 −0.30 −0.04 0.13Number of low pulses 0.23 −0.14 −0.29 0.14 0.36 −0.29 0.30 0.00Mean or median duration of low pulses −0.07 −0.18 0.62 −0.51 −0.47 0.49 −0.18 0.08Number of high pulses −0.16 0.14 −0.02 −0.12 −0.02 −0.14 0.00 0.01Mean or median duration of high pulses 0.04 −0.12 0.20 −0.13 −0.84 0.67 −0.72 0.56Rise rate −0.37 0.27 0.28 −0.19 −0.67 0.34 −0.58 0.45Fall rate 0.61 −0.60 0.27 −0.47 0.12 0.08 0.49 −0.31Number of reversals 0.29 0.01 −0.39 0.16 0.46 −0.35 0.34 −0.04
The indicators in bold are selected RIHA indices. ES means eco-surplus, ED means eco-deficit.
T. Yang et al. Global and Planetary Change 156 (2017) 68–79
74
entire 21 century of RCP 2.6 and RCP4.5 and 2020s of RCP 8.5 de-monstrates that low level alterations are projected in the Upper NigerRiver Basins, whiles the alterations tend to be moderate in the case ofRCP 8.5 RCP scenarios in 2050s and 2080s.
4.3. Ecological implications
Past work suggested that the alteration of streamflow regime hasimportant effect on ecological processes (Stanford et al., 1996), andthreatens the biodiversity and rivers ecosystem functions. In this sec-tion, we mainly examine the implications of hydrological changesproduced by climate change for ecological conditions in the UpperNigger River Basin.
Hydrologic changes accompanying a decline in summer streamflowin Upper Nigger, characterized by decreased flow in July (Section4.2.1), will increase water temperatures and reduce dissolved oxygen,and may lead to increase mortality of certain juvenile fish species(Pradhanang et al., 2013), especially in the end of 21 century underRCP8.5. Increases of streamflow in winter (characterized by increasedof December streamflow) are likely to reduce the mortality rates offishes during dry season. At the same time, water quality degraded dueto the increases of winter streamflow by washing silt into streams andwashing away small organisms and organic matter, which are im-portant food resources for some species. Increases of 90-day annualmaximum flow and decreases of 30-day annual minimum flow causedby climate change will broaden the floodplains, which enable certainspecies of plants have more place to regenerate (Chen, 2012). In ad-dition, upward trends of low flows duration under most scenarios areenabling the fishes have more time to regenerate. However, dissolvedoxygen availability and water chemistry may be highly stressful tomany organisms for low flow duration, leading to the increase of bioticinteractions, such as competition and predation (Magoulick and Kobza,2003). Another problem might be that the Oryza longistaminata,
Echinochloa stagnina and some aquatic plants will be replaced by Veti-veria nigrita during continuous low flow (Morand and Mikolasek, 2005).As a consequence, the biotic capacity of floodplains is modified due toreduction of abundant and varied food for fish. Moreover, if low flowreaches extremely low levels, ecological communities are impaired. Infact, the continuous drought in 1969 had led to the changes of fishabundance and large-sized species were gradually diminished and re-placed by small-sized and more productive species. High flow pulses arevital for reducing negative effects caused by low flows. Unfortunately,unstable trend of high flows implies increased hazards for waterquality. Decrease of high pulse duration, especially a significant change,may not deliver a sufficient nourishing subsidy, such as projected byVIC in the Hadley under RCP8.5 in 2080s (−43 days). While increaseof high pulse duration above 20 days, such as projected by VIC in theMIROC under RCP8.5 in 2050s, may make various pollutants (e.g. Oil)wash into the river and disturb anoxia in riparian soils, which may leadto plant death. Our results also showed an increase trend of fall rateindicating that aquatic invertebrates inhabiting at the littoral zonealong the river's edge may be affected by the variability in the rate ofhydrograph fall (Richter et al., 1996).
The integrated evaluation on hydrological alteration in this papershows that the eco-hydrological conditions of the Upper Niger RiverBasin will tend to face low or medium level risk. This will make speciesmore vulnerable and may result in a loss in biodiversity (Schneideret al., 2013), especially under medium level risk (RCP8.5 in 2050s and2080s). Change of hydrologic regimes also can alter the composition orfunction of aquatic or wetland ecosystems through their effects onphysical habitat characteristics, including water temperature, oxygencontent and water chemistry. Thus, measures should be implemented toprotect the fish and other species. One option is to mitigate the negativeimpact of climate change on the hydrological regime and to protectexisting ecosystems through more scientific operation the current re-servoirs (e.g., Sélingué and Sotuba) in the Upper Niger River Basin.
Fig. 5. Projected changes in monthly streamflow (March, July, September and December) from the 15 model discharge series for 2010–2039 (hollow box), 2040–2069 (light grey box)and 2070–2099 (dark grey box) with respect to 1980–2009 under three RCPs. Whisker plots indicate median (solid middle bar), 25th and 75th percentiles (box ends), and the max andmin value (whiskers).
T. Yang et al. Global and Planetary Change 156 (2017) 68–79
75

Fig. 6. Projected changes in magnitude of annual extreme streamflow (1-day/90-day annual minimum, 1-day/30-day annual maximum and base-flow index) from the 15 model dischargeseries for 2010–2039 (hollow box), 2040–2069 (light grey box) and 2070–2099 (dark grey box) with respect to 1980–2009 under three RCPs.
Fig. 7. Projection of the Julian data of annual minimum flow and the Julian data of annual maximum flow from the 15 model discharge series for 2010–2039 (hollow box), 2040–2069(light grey box) and 2070–2099 (dark grey box) with respect to 1980–2009 under three RCPs.
T. Yang et al. Global and Planetary Change 156 (2017) 68–79
76
5. Conclusions
In this study, a new RIHA method for assessing the flow regimealterations is presented. Future discharges are projected by using threecommonly used hydrological models forced by meteorological inputsfrom an ensemble of five climate models (GCMs) under three RCPs. Thefuture streamflows are used to construct the RIHA thereby to project theflow regime alteration of Upper Niger River Basin. In addition, theoccurrence probability of the flow regime alteration degree in the 21stcentury is also estimated. The main points can be summarized as fol-lows:
(1) There are 18 indicators included in RIHA and the result of flowregime alteration degree is consistent with the result by IHA. Thissuggests that the RIHA method is applicable for flow regime al-teration evaluation in the Upper Niger River basin. Moreover, the
updated method can save 65.7% computation time than IHA.(2) The Upper Niger River tends to face an increase in the variety of
some flow characteristics in future periods, including Marchstreamflow, September streamflow, December streamflow, 30-dayannual maximum, low pluses duration and fall rate. In contrast,hydrological indicators like July streamflow and 90-day annualminimum show decreasing trend under most scenarios. Shift to-ward later month for the Julian date of annual minimum flow isalso projected under future scenarios.
(3) The flow regime alteration of the Upper Niger River basin is pro-jected to be low level under the RCP 2.6 and RCP4.5 for entire21century and RCP8.5 in 2020s, whereas medium degree underRCP8.5 in 2050s and 2080s scenarios.
(4) Due to the flow regime alteration, the habitats will change, such asincrease of water temperatures, reduction of dissolved oxygen andfood resources for fishes. This alteration in future will probably lead
Fig. 8. Projection changes in low pulse count, low pulse duration, high pulse count and high pulse count from the 15 model discharge series for 2010–2039 (hollow box), 2040–2069(light grey box) and 2070–2099 (dark grey box) with respect to 1980–2009 under three RCPs.
Fig. 9. Projection changes in streamflow variability (rise rate, fall rate and number of reversals) from the 15 model discharge series for 2010–2039 (hollow box), 2040–2069 (light greybox) and 2070–2099 (dark grey box) with respect to 1980–2009 under three RCPs.
T. Yang et al. Global and Planetary Change 156 (2017) 68–79
77

to negative impacts on the river ecosystem of the Upper Niger RiverBasin and induces a loss in biodiversity. Existing operation rules ofthe reservoirs should be optimized to minimize the negative eco-logical impacts.
Although we have proposed a non-redundant IHA method andtested the applicability of this method in evaluating Upper Niger RiverBasin overall flow regime alteration, more researches, particularly
selecting the objectives hydrological parameters related to the hydro-logical alteration, are needed for a more profound understanding of thehydrological changes. In addition, higher resolution discharges of eachriver in Upper Niger River Basin need to be further investigated in ourfuture work.
Acknowledgements
The work was jointly supported by grants from the National NaturalScience Foundation of China (41371051, 51421006, 41561134016), akey grant of Chinese Academy of Sciences (KZZD-EW-12), and a grantfrom Ministry of Water Resources (201501032).
Appendix A. Supplementary data
Supplementary data to this article can be found online at http://dx.doi.org/10.1016/j.gloplacha.2017.07.006.
References
Abrate, T., Hubert, P., Sighomnou, D., 2013. A study on hydrological series of the NigerRiver. Hydrol. Sci. J. 58 (2), 271–279.
Acreman, M., Dunbar, M., Hannaford, J., Mountford, O., Wood, P., Holmes, N., ... King, J.,2008. Developing environmental standards for abstractions from UK rivers to im-plement the EU water framework directive. Hydrol. Sci. J. 53 (6), 1105–1120.
Aich, V., Liersch, S., Vetter, T., Huang, S., Tecklenburg, J., Hoffmann, P., ... Hattermann,F.F., 2014. Comparing impacts of climate change on streamflow in four large Africanriver basins. Hydrol. Earth Syst. Sci. 18 (4), 1305–1321.
Angelina, A., Gado Djibo, A., Seidou, O., Seidou Sanda, I., Sittichok, K., 2015. Changes toflow regime on the Niger River at Koulikoro under a changing climate. Hydrol. Sci. J.60 (10), 1709–1723.
Arthington, A.H., Bunn, S.E., Poff, N.L., Naiman, R.J., 2006. The challenge of providingenvironmental flow rules to sustain river ecosystems. Ecol. Appl. 16 (4), 1311–1318.
Bunn, S.E., Arthington, A.H., 2002. Basic principles and ecological consequences of al-tered flow regimes for aquatic biodiversity. Environ. Manag. 30 (4), 492–507.
Chen, H., 2012. Assessment of hydrological alterations from 1961 to 2000 in the YarlungZangbo River, Tibet. Ecohydrol. Hydrobiol. 12 (2), 93–103.
Christensen, N., Lettenmaier, D.P., 2006. A multimodel ensemble approach to assessmentof climate change impacts on the hydrology and water resources of the ColoradoRiver basin. Hydrol. Earth Syst. Sci. 3 (6), 3727–3770.
Clausen, B., Biggs, B.J.F., 2000. Flow variables for ecological studies in temperatestreams: groupings based on covariance. J. Hydrol. 237 (3), 184–197.
Descroix, L., Genthon, P., Amogu, O., Rajot, J.L., Sighomnou, D., Vauclin, M., 2012.Change in Sahelian rivers hydrograph: the case of recent red floods of the Niger Riverin the Niamey region. Glob. Planet. Chang. 98, 18–30.
Diakoulaki, D., Mavrotas, G., Papayannakis, L., 1995. Determining objective weights inmultiple criteria problems: the CRITIC method. Comput. Oper. Res. 22 (7), 763–770.
Döll, P., Zhang, J., 2010. Impact of climate change on freshwater ecosystems: a global-scale analysis of ecologically relevant river flow alterations. Hydrol. Earth Syst. Sci.14 (5), 783–799.
Fekete, B.M., Vörösmarty, C.J., Grabs, W., 1999. Global, Composite Runoff Fields Based
Fig. 10. The number of prominent modified indicators and the flow alteration degree forvarious model and climate scenarios in the Upper Niger River Basin under RCP2.6,RCP4.5, RCP8.5 (The orange dotted line and red dotted line respectively represent thethreshold of low(11) and medium(22) degree). (For interpretation of the references tocolour in this figure legend, the reader is referred to the web version of this article.)
Fig. 11. Projection of flow regime alteration occurrence probability of the Upper NigerRiver Basin by the Representative-IHA method in 2020s, 2050s and 2080s under RCP2.6,RCP4.5 and RCP8.5.
T. Yang et al. Global and Planetary Change 156 (2017) 68–79
78
on Observed River Discharge and Simulated Water Balances, WMO-Global RunoffData Center Report# 22. WMO GRDC, Koblenz (GERMANY).
Gao, Y., Vogela, M.R., Kroll, N.C., Poff, L.N., Oldend, D.J., 2009. Development of re-presentative indicators of hydrologic alteration. J. Hydrol. 374 (1–2), 136–147.
Gao, B., Yang, D., Zhao, T., Yang, H., 2012. Changes in the eco-flow metrics of the upperYangtze River from 1961 to 2008. J. Hydrol. 448, 30–38.
Gaston, L., 2013. Integrated future needs and climate change on the river Niger wateravailability. J. Water Resour. Prot. 5 (9), 887–893.
Grizzetti, B., Lanzanova, D., Liquete, C., Reynaud, A., Cardoso, A.C., 2016. Assessingwater ecosystem services for water resource management. Environ. Sci. Pol. 61,194–203.
Gupta, H.V., Sorooshian, S., Yapo, P.O., 1999. Status of automatic calibration for hy-drologic models: comparison with multilevel expert calibration. J. Hydrol. Eng. 4 (2),135–143.
Hart, D.D., Finelli, C.M., 1999. Physical-biological coupling in streams: the pervasiveeffects of flow on benthic organisms. Annu. Rev. Ecol. Syst. 363–395.
Huang, S., Kumar, R., Flörke, M., Yang, T., Hundecha, Y., Kraft, P., ... Strauch, M., 2016.Evaluation of an ensemble of regional hydrological models in 12 large-scale riverbasins worldwide. Clim. Chang. 1–17.
Laizé, C.L.R., Acreman, M.C., Schneider, C., Dunbar, M.J., Houghton-Carr, H.A., Flörke,M., Hannah, D.M., 2014. Projected flow alteration and ecological risk for pan-eur-opean rivers. River Res. Appl. 30 (3), 299–314.
Lee, A., Cho, S., Kang, D.K., Kim, S., 2014. Analysis of the effect of climate change on theNakdong river stream flow using indicators of hydrological alteration. J. HydroEnviron. Res. 8 (3), 234–247.
Lobanova, A., Stagl, J., Vetter, T., Hattermann, F., 2015. Discharge alterations of theMures River, Romania under ensembles of future climate projections and sequentialthreats to aquatic ecosystem by the end of the century. Water 7 (6), 2753–2770.
Mackay, S.J., Arthington, A.H., James, C.S., 2014. Classification and comparison of nat-ural and altered flow regimes to support an Australian trial of the ecological limits ofhydrologic alteration framework. Ecohydrology 7 (6), 1485–1507.
Magoulick, D.D., Kobza, R.M., 2003. The role of refugia for fishes during drought: a re-view and synthesis. Freshw. Biol. 48 (7), 1186–1198.
Magilligan, F.J., Nislow, K.H., 2005. Changes in hydrologic regime by dams.Geomorphology 71 (1), 61–78.
Mascaro, G., White, D.D., Westerhoff, P., Bliss, N., 2015. Performance of the CORDEX-Africa regional climate simulations in representing the hydrological cycle of the NigerRiver basin. J. Geophys. Res.-Atmos. 120 (24), 12425–12444.
Menzel, L., Thieken, A.H., Schwandt, D., Bürger, G., 2006. Impact of climate change onthe regional hydrology–scenario-based modelling studies in the German Rhinecatchment. Nat. Hazards 38 (1–2), 45–61.
Mittal, N., Bhave, A.G., Mishra, A., Singh, R., 2016. Impact of human intervention andclimate change on natural flow regime. Water Resour. Manag. 30 (2), 685–699.
Morand, P., Mikolasek, O., 2005. Review of the present state of knowledge of environ-ment, fish stocks and fisheries of the river Niger (West Africa). Acta Hortic. 16 (6),199–228.
Nash, J.E., Sutcliffe, J.V., 1970. River flow forecasting through conceptual models partI—a discussion of principles. J. Hydrol. 10 (3), 282–290.
Oguntunde, P.G., Abiodun, B.J., 2013. The impact of climate change on the Niger Riverbasin hydroclimatology, West Africa. Clim. Dyn. 40 (1–2), 81–94.
Olden, J.D., Poff, N.L., 2003. Redundancy and the choice of hydrologic indices forcharacterizing streamflow regimes. River Res. Appl. 19 (2), 101–121.
Pettit, N.E., Froend, R.H., Davies, P.M., 2001. Identifying the natural flow regime and therelationship with riparian vegetation for two contrasting western Australian rivers.Regul. River. 17 (3), 201–215.
Picouet, C., Hingray, B., Olivry, J.C., 2009. Modelling the suspended sediment dynamicsof a large tropical river: the upper Niger River basin at Banankoro. Hydrol. Process.23 (22), 3193–3200.
Poff, N.L., Allan, J.D., 1995. Functional organization of stream fish assemblages in rela-tion to hydrological variability. Ecology 76 (2), 606–627.
Poff, N.L., Ward, J.V., 1989. Implications of streamflow variability and predictability forlotic community structure: a regional analysis of streamflow patterns. Can. J. Fish.Aquat. Sci. 46 (10), 1805–1818.
Poff, N.L., Allan, J.D., Bain, M.B., Karr, J.R., Prestegaard, K.L., Richter, B.D., ...
Stromberg, J.C., 1997. The natural flow regime. Bioscience 47 (11), 769–784.Pradhanang, S.M., Mukundan, R., Schneiderman, E.M., Zion, M.S., Anandhi, A., Pierson,
D.C., ... Steenhuis, T.S., 2013. Streamflow responses to climate change: analysis ofhydrologic indicators in a new York City water supply watershed. J. Am. WaterResour. Assoc. 49 (6), 1308–1326.
Puig, A., Salinas, H.F.O., Borús, J.A., 2016. Recent changes (1973–2014 versus1903–1972) in the flow regime of the lower Paraná River and current fluvial pollu-tion warnings in its Delta biosphere reserve. Environ. Sci. Pollut. Res. 23 (12),11471–11492.
Richter, B.D., Baumgartner, J.V., Powell, J., Braun, D.P., 1996. A method for assessinghydrologic alteration within ecosystems. Conserv. Biol. 10 (4), 1163–1174.
Richter, B., Baumgartner, J., Wigington, R., Braun, D., 1997. How much water does ariver need? Freshw. Biol. 37 (1), 231–249.
Richter, B.D., Baumgartner, J.V., Braun, D.P., Powell, J., 1998. A spatial assessment ofhydrologic alteration within a river network. Regul. River. 14 (4), 329–340.
Richter, B.D., Davis, M.M., Apse, C., Konrad, C., 2012. A presumptive standard for en-vironmental flow protection. River Res. Appl. 28 (8), 1312–1321.
Schneider, C., Laizé, C.L.R., Acreman, M.C., Florke, M., 2013. How will climate changemodify river flow regimes in Europe? Hydrol. Earth Syst. Sci. 17 (1), 325–339.
Singh, V., Goyal, M.K., 2016. Changes in climate extremes by the use of CMIP5 coupledclimate models over eastern Himalayas. Environ. Earth Sci. 75 (9), 1–27.
Stanford, J.A., Ward, J.V., Liss, W.J., Frissell, C.A., Williams, R.N., Lichatowich, J.A.,Coutant, C.C., 1996. A general protocol for restoration of regulated rivers.Regul.River. 12 (4–5), 391–413.
Tarhule, A., Zume, J.T., Grijsen, J., Talbi-Jordan, A., Guero, A., Dessouassi, R.Y., ...Harshadeep, N.R., 2015. Exploring temporal hydroclimatic variability in the NigerBasin (1901–2006) using observed and gridded data. Int. J. Climatol. 35 (4),520–539.
Vogel, R.M., Sieber, J., Archfield, S.A., Smith, M.P., Apse, C.D., Huber-Lee, A., 2007.Relations among storage, yield, and instream flow. Water Resour. Res. 43 (5).
Wang, X., Yang, T., Shao, Q., Acharya, K., Wang, W., Yu, Z., 2012. Statistical downscalingof extremes of precipitation and temperature and construction of their future sce-narios in an elevated and cold zone. Stoch. Env. Res. Risk A. 26 (3), 405–418.
Wang, W., Xing, W., Shao, Q., Yu, Z., Peng, S., Yang, T., ... Singh, V.P., 2013. Changes inreference evapotranspiration across the Tibetan plateau: observations and futureprojections based on statistical downscaling. J. Geophys. Res.-Atmos. 118 (10),4049–4068.
Warszawski, L., Frieler, K., Huber, V., et al., 2014. The inter-sectoral impact modelIntercomparison project (ISI–MIP): project framework. PNAS 111, 3228–3232.http://dx.doi.org/10.1073/pnas.1312330110.
Yang, T., Zhang, Q., Chen, Y.D., Tao, X., Xu, C.Y., Chen, X., 2008. A spatial assessment ofhydrologic alteration caused by dam construction in the middle and lower YellowRiver, China. Hydrol. Process. 22 (18), 3829–3843.
Yang, T., Xu, C.Y., Shao, Q., Chen, X., Lu, G.H., Hao, Z.C., 2010a. Temporal and spatialpatterns of low-flow changes in the Yellow River in the last half century. Stoch. Env.Res. Risk A. 24 (2), 297–309.
Yang, T., Xu, C.Y., Shao, Q.X., Chen, X., 2010b. Regional flood frequency and spatialpatterns analysis in the Pearl River Delta region using L-moments approach. Stoch.Env. Res. Risk A. 24 (2), 165–182.
Yang, T., Wang, X., Zhao, C., Chen, X., Yu, Z., Shao, Q., ... Wang, W., 2011. Changes ofclimate extremes in a typical arid zone: observations and multimodel ensembleprojections. J. Geophys. Res.-Atmos. 116 (D19).
Yang, T., Hao, X., Shao, Q., Xu, C.Y., Zhao, C., Chen, X., Wang, W., 2012a. Multi-modelensemble projections in temperature and precipitation extremes of the Tibetan pla-teau in the 21st century. Glob. Planet. Chang. 80, 1–13.
Yang, T., Li, H., Wang, W., Xu, C.Y., Yu, Z., 2012b. Statistical downscaling of extremedaily precipitation, evaporation, and temperature and construction of future sce-narios. Hydrol. Process. 26 (23), 3510–3523.
Yang, T., Wang, C., Chen, Y., Chen, X., Yu, Z., 2015. Climate change and water storagevariability over an arid endorheic region. J. Hydrol. 529, 330–339.
Zhang, Q., Xu, C.Y., Chen, Y.D., Yang, T., 2009. Spatial assessment of hydrologic al-teration across the Pearl River Delta, China, and possible underlying causes. Hydrol.Process. 23 (11), 1565–1574.
T. Yang et al. Global and Planetary Change 156 (2017) 68–79
79