global 3-d simulation of reactive bromine chemistry t. canty, q. li, r.j. salawitch jet propulsion...
Post on 21-Dec-2015
218 views
TRANSCRIPT
Global 3-D simulation of reactive bromine chemistry
T. Canty, Q. Li, R.J. Salawitch
Jet Propulsion Laboratory, Caltech, Pasadena CA
Title

Measurements of column BrO from GOMEmuch higher than standard stratospheric modeled values
What’s the problem?
Tropospheric BrO ?Missing stratospheric BrO?
due to Arctic BL spring bloom
Hypotheses
• Discrepancy resolved by global, ubiquitous, background level of ~2 ppt of tropospheric BrO (Platt and Hönninger, Chemosphere, 2003 & references therein)
– But: Schofield et al. (JGR, 2004) report upper limit of 0.9 ppt for tropospheric BrO over Lauder, NZ
• Discrepancy may be resolved by: ~ 1 ppt of tropospheric BrO (perhaps consistent with UL of Schofield et al., JGR, 2004) ~ 8 ppt of stratospheric of Bry in the lowermost stratosphere
(Salawitch et al., GRL, 2005)
• Stratospheric bromine supplied by decomposition of VSL (very short lived) organics not considered in most global models as well as tropospheric BrO (Salawitch et al., GRL, 2005) • Excess bromine in UT and LS has important consequences for: – mid-latitude ozone trends (Salawitch et al., GRL, 2005) – tropospheric ozone photochemistry (Boucher et al., ACP, 2003; von Glasow et al., ACP, 2004; Lary, ACP, 2004) – polar ozone loss (Salawitch and Canty, in preparation, 2005) – chemistry - climate coupling (Carpenter and Liss, JGR, 2000; Hollwedel et al., ACP, 2004; Quack et al., GRL, 2004)
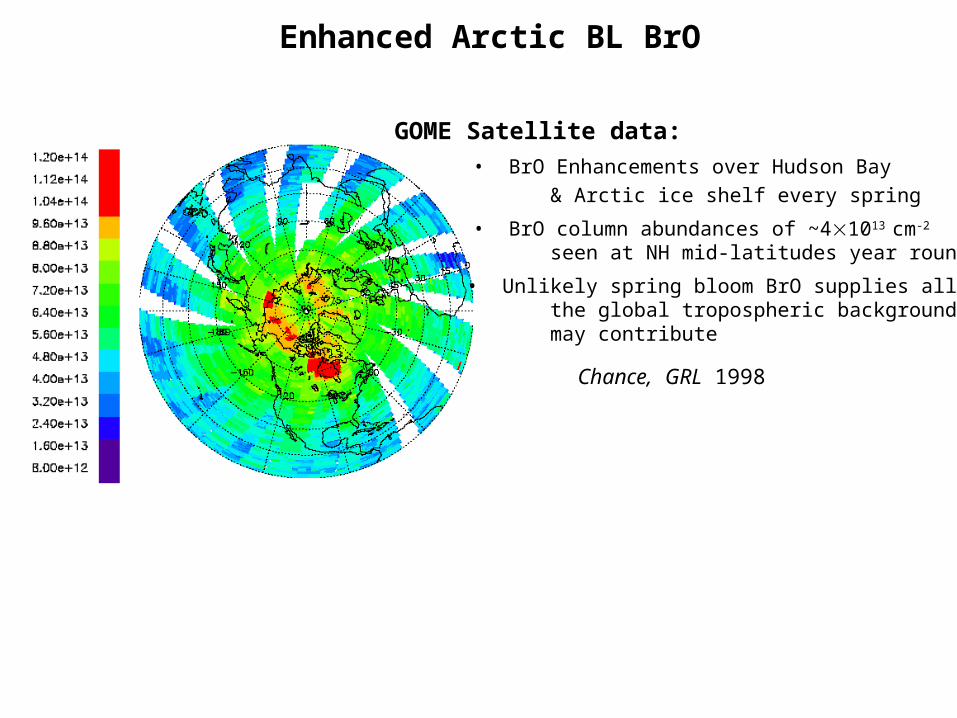
Enhanced Arctic BL BrO
GOME Satellite data:
• BrO Enhancements over Hudson Bay
& Arctic ice shelf every spring
• BrO column abundances of ~41013 cm-2
seen at NH mid-latitudes year round
• Unlikely spring bloom BrO supplies all of the global tropospheric background, but may contribute
Chance, GRL 1998

BryTROP = 0 ppt Bry
TROP = 8 ppt
AER Model Time Slice: 47°N, March 1993
Implications for Stratospheric Ozone Photochemistry
Enhanced Bromine: lower stratospheric ozone depletion due to BrO+ClO cycle BrO+HO2 cycle becomes significant O3 sink below 16 km, extending into upper troposphere (BrO+HO2 does not drive O3 depletion because VSL source is assumed constant over time)
Salawitch et al., GRL 2005

• Tropospheric ozone: – zonal mean 6 to 18% for a high-latitude VSL source
– local up to 40%, maxim. in SH free trop during summer (von Glasow et al., ACP, 2004)
• DMS: – DMS + BrO becomes significant sink
– DMS to SO2 conversion efficiency dramatically (von Glasow et al., ACD, 2003) (Boucher et al., ACP, 2003)• NOx: – BrONO2 hydrolysis significant source of HNO3
(Lary, ACP, 2004)
Implications for Tropospheric Ozone Photochemistry

MacroalgealOceanSource VMR Surface Lifetime Main Loss
(ppt) (days) Process
CHBr3 Bromoform 2.0 – 20 26 JCH2Br2 Dibromomethane 0.8 – 3.4 120 OHCH2BrCl Bromochloromethane 0.1 – 0.3 150 OHC3H7Br n-propyl bromide 0.1 – 1.0 13 OHC2H5Br Ethyl bromide 0.0 – 2.0 48 OHCHBr2Cl Dibromochloro- 0.1 – 0.5 69 OH & J methaneC2H4Br2 Ethylene dibromide 0.1 – 1.0 84 OH
Possible VSL organic sources

Location Surface Water(mean;median)
pmol/L
Atmosphere(mean;median)
ppt
Global near shore(<2 km from shore)
934; 946 25; 3.3
Global shelf 71.7; 40 5.4; 2.2
Global open ocean 18.3; 16.6 1.9; 1.2
Global ocean Range0.6 - 2770
Range0.2 - 460
mostly Atlantic ocean mostly Pacific ocean
Oceanic and atmospheric bromoform
from Quack et al., JGR, 2003
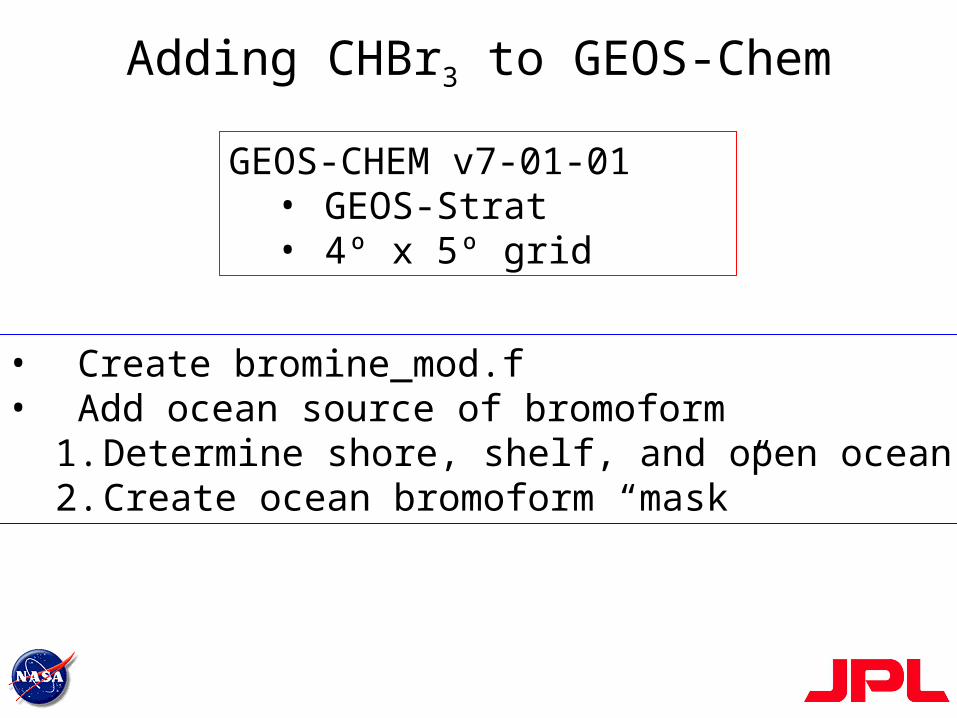
Adding CHBr3 to GEOS-Chem
• Create bromine_mod.f• Add ocean source of bromoform
1. Determine shore, shelf, and open ocean2. Create ocean bromoform “mask”
GEOS-CHEM v7-01-01• GEOS-Strat• 4º x 5º grid

Land Ocean
NearShore
CoastalShelf
OpenOcean
300 m
2 km
LowCHBr3
Ocean graph
HighCHBr3
Use U.S. Navy bathymetry measurements of ocean depth (5x5 min.)Use focean to determine near shore region Create a “mask” file of ocean bromoform

Adding CHBr3 to GEOS-CHEM
• Create bromine_mod.f• Add ocean source of bromoform
1. Determine shore, shelf, and open ocean2. Create ocean bromoform “mask”
• Add bromoform chemistry1. Photolysis2. Reaction with OH

Bromoform Chemistry
RO2, NO
CHBr3
CBr3
OH
O2
HOOCBr3
HO2
OH
hv
OOCBr3
OCBr3
C(O)Br2
O2NOOCBr3
NO2
, hv
hv
C(O)Br2
RO2, HO2
RO2, NO
CHBr3
CHBr2
hv
O2
HOOCHBr2
HO2
OH
hv
OOCHBr2
OCHBr2
C(O)HBr
O2NOOCHBr2
NO2
, hv
hv
C(O)HBrRO2, HO2
1/3 of the time 100 days
2/3 of the time 36 days
“Fast J”
Little or no kinetic studies
total 26 daysFig. 2-6, WMO 2003

PEM Tropics-A results
Lat = 18ºSLon = 145ºW
Need to understand CHBr3
as prerequisite forunderstanding BrO

PEM Tropics-A results
Lat = 18ºSLon = 145ºW
“Perfect World Scenario”
Woohoo! Everything compares well.

Lat = 18ºSLon = 145ºW
PEM Tropics-A results
D’Oh! Model does not seem to be affected by the ocean source.
“Real World Scenario”

Conclusions
• Evidence for global, ubiquitous ~1 to 2 ppt of tropospheric BrO• Potential important consequences for tropospheric:
– O3
– DMS oxidation – HNO3 production
• Tropospheric BrO likely supplied by VSL organics • Have begun to examine link between tropospheric BrO and biogenic, VSL organics using the GEOS-CHEM model – much work remains!!!

Future work
• Determine why modeled CHBr3 is so low – identify and remove bugs
• Implement full CHBr3 chemistry:
– agreement between measured and modeled CHBr3
– how much BrO is supplied to UT/LS by CHBr3
– fate of decomposition products: aerosol uptake, heterog rxns
• Incorporate other VSL species

