glauber modeling in high-energy nuclear collisions
TRANSCRIPT

ANRV326-NS57-08 ARI 14 September 2007 15:14
Glauber Modeling inHigh-Energy NuclearCollisionsMichael L. Miller,1 Klaus Reygers,2
Stephen J. Sanders,3 and Peter Steinberg4
1Laboratory for Nuclear Science, Massachusetts Institute of Technology, Cambridge,Massachusetts 02139; email: [email protected] for Nuclear Physics, University of Munster, D-48149 Munster, Germany;email: [email protected] of Physics and Astronomy, University of Kansas, Lawrence, Kansas,66045; email: [email protected] Department, Brookhaven National Laboratory, Upton, New York 11973;email: [email protected]
Annu. Rev. Nucl. Part. Sci. 2007. 57:205–43
First published online as a Review in Advance onMay 9, 2007
The Annual Review of Nuclear and Particle Science isonline at http://nucl.annualreviews.org
This article’s doi:10.1146/annurev.nucl.57.090506.123020
Copyright c© 2007 by Annual Reviews.All rights reserved
0163-8998/07/1123-0205$20.00
Key Words
heavy ion physics, number of participating nucleons, number ofbinary collisions, impact parameter, eccentricity
AbstractWe review the theoretical background, experimental techniques, andphenomenology of what is known in relativistic heavy ion physicsas the Glauber model, which is used to calculate geometric quan-tities. A brief history of the original Glauber model is presented,with emphasis on its development into the purely classical, geo-metric picture used for present-day data analyses. Distinctions aremade between the optical limit and Monte Carlo approaches, whichare often used interchangeably but have some essential differencesin particular contexts. The methods used by the four RHIC ex-periments are compared and contrasted, although the end resultsare reassuringly similar for the various geometric observables. Fi-nally, several important RHIC measurements are highlighted thatrely on geometric quantities, estimated from Glauber calculations,to draw insight from experimental observables. The status and fu-ture of Glauber modeling in the next generation of heavy ion physicsstudies is briefly discussed.
205
Ann
u. R
ev. N
ucl.
Part
. Sci
. 200
7.57
:205
-243
. Dow
nloa
ded
from
ww
w.a
nnua
lrev
iew
s.or
gby
Uni
vers
ity o
f C
alif
orni
a -
Dav
is o
n 11
/22/
11. F
or p
erso
nal u
se o
nly.

ANRV326-NS57-08 ARI 14 September 2007 15:14
Contents
1. INTRODUCTION . . . . . . . . . . . . . . . . . . . . . . . . . . . . . . . . . . . . . . . . . . . . . . . . 2062. THEORETICAL FOUNDATIONS OF GLAUBER MODELING. . 207
2.1. A Brief History of the Glauber Model . . . . . . . . . . . . . . . . . . . . . . . . . . . 2072.2. Inputs to Glauber Calculations . . . . . . . . . . . . . . . . . . . . . . . . . . . . . . . . . . 2082.3. Optical-Limit Approximation . . . . . . . . . . . . . . . . . . . . . . . . . . . . . . . . . . . 2102.4. The Glauber Monte Carlo Approach . . . . . . . . . . . . . . . . . . . . . . . . . . . . 2122.5. Differences between Optical and Monte Carlo Approaches . . . . . . . 2132.6. Glauber Model Systematics . . . . . . . . . . . . . . . . . . . . . . . . . . . . . . . . . . . . . 215
3. RELATING THE GLAUBER MODEL TO EXPERIMENTALDATA . . . . . . . . . . . . . . . . . . . . . . . . . . . . . . . . . . . . . . . . . . . . . . . . . . . . . . . . . . . . . 2163.1. Methodology. . . . . . . . . . . . . . . . . . . . . . . . . . . . . . . . . . . . . . . . . . . . . . . . . . . 2163.2. Experimental Details . . . . . . . . . . . . . . . . . . . . . . . . . . . . . . . . . . . . . . . . . . . 2203.3. Acceptance Biases . . . . . . . . . . . . . . . . . . . . . . . . . . . . . . . . . . . . . . . . . . . . . . 2263.4. Estimating Geometric Quantities . . . . . . . . . . . . . . . . . . . . . . . . . . . . . . . 226
4. GEOMETRIC ASPECTS OF P+A AND A+A PHENOMENA . . . . . 2314.1. Inclusive Charged-Particle Yields (Total and Midrapidity) . . . . . . . . 2314.2. Hard Scattering: TAB Scaling . . . . . . . . . . . . . . . . . . . . . . . . . . . . . . . . . . . . 2324.3. Eccentricity and Relation to Elliptic Flow . . . . . . . . . . . . . . . . . . . . . . . 2354.4. Eccentricity Fluctuations . . . . . . . . . . . . . . . . . . . . . . . . . . . . . . . . . . . . . . . 2374.5. J/ψ Absorption in Normal Nuclear Matter . . . . . . . . . . . . . . . . . . . . . . 237
5. DISCUSSION AND THE FUTURE . . . . . . . . . . . . . . . . . . . . . . . . . . . . . . . 240
1. INTRODUCTION
Ultrarelativistic collisions of nuclei produce the highest multiplicities of outgoingparticles of all subatomic systems known in the laboratory. Thousands of particlesare created when two nuclei collide head-on, generating event images of dramaticcomplexity compared with proton-proton collisions. The latter is a natural point ofcomparison, as nuclei are themselves made up of nucleons, that is, protons and neu-trons. Thus, it is natural to ask just how many nucleons are involved in any particularcollision, or, more reasonably, in a sample of selected collisions. It is also interesting toconsider other ways to characterize the overlapping nuclei, for example, their shape.
Although this problem may seem intractable—with the femtoscopic length scalesinvolved precluding direct observation of the impact parameter (b), number of par-ticipating nucleons (Npart), or binary nucleon-nucleon collisions (Ncoll)—theoreticaltechniques have been developed to allow estimation of these quantities from exper-imental data. These techniques, which consider the multiple scattering of nucleonsin nuclear targets, are generally referred to as Glauber models, after Roy Glauber.Glauber pioneered the use of quantum-mechanical scattering theory for compositesystems, describing nontrivial effects discovered in cross sections for proton-nucleus(p+A) and nucleus-nucleus (A+B) collisions at low energies.
206 Miller et al.
Ann
u. R
ev. N
ucl.
Part
. Sci
. 200
7.57
:205
-243
. Dow
nloa
ded
from
ww
w.a
nnua
lrev
iew
s.or
gby
Uni
vers
ity o
f C
alif
orni
a -
Dav
is o
n 11
/22/
11. F
or p
erso
nal u
se o
nly.

ANRV326-NS57-08 ARI 14 September 2007 15:14
Over the years, workers developed a variety of methods for calculating geometricquantities relevant for p+A and A+B collisions (1–3). Moreover, a wide variety of ex-perimental methods were established to connect distributions of measured quantitiesto the distributions of geometric quantities. This review is an attempt to explain howthe RHIC experiments grappled with this problem, and largely succeeded, becauseof both good-sense experimental and theoretical thinking.
Heavy ion physics entered a new era with the turn on of the RHIC collider in2000 (4). Previous generations of heavy ion experiments searching for the quark-gluon plasma (QGP) focused on particular signatures suggested by theory. From thisstrategy, experiments generally measured observables in different regions of phasespace or focused on particular particle types. The RHIC experiments were designedin a comprehensive way, with certain regions of phase space covered by multipleexperiments. This allowed systematic cross checks of various measurements betweenexperiments, increasing the credibility of the separate results (5–8).
Among the most fundamental observables shared between the experiments werethose relating to the geometry of the collision. Identical zero-degree calorimeters(ZDCs) (9) were installed in all experiments to estimate the number of spectator nu-cleons, and all experiments had coverage for multiplicities and energy measurementsover a wide angular range. This allowed a set of systematic studies of centrality ind+Au and A+A collisions, providing one of the first truly extensive data sets, all ofwhich were characterized by geometric quantities.
This review covers the basic information a newcomer to the field should know tounderstand how centrality is estimated by the experiments, and how this is relatedto A+B collisions. Section 2 discusses the history of the Glauber model by referenceto the theoretical description of A+B collisions. Section 3 addresses how experi-ments measure centrality by a variety of methods and relates it by a simple procedureto geometrical quantities. Section 4 illustrates the relevance of various geometricalquantities by reference to actual RHIC data. These examples show how a precisequantitative grasp of the geometry allows qualitatively new insights into the dynam-ics of A+B collisions. Finally, Section 5 assesses the current state of knowledge andpoints to new directions in our understanding of nuclear geometry and its impact onpresent and future measurements.
2. THEORETICAL FOUNDATIONS OF GLAUBERMODELING
2.1. A Brief History of the Glauber Model
The Glauber model was developed to address the problem of high-energy scatter-ing with composite particles. This was of great interest to both nuclear and particlephysicists, both of whom have benefited from the insights of Glauber in the 1950s. Inhis 1958 lectures, Glauber presented his first collection of various papers and unpub-lished work from the 1950s (2). Some of this was updated work started by Molierein the 1940s, but much of it was in direct response to the new experiments involv-ing protons, deuterons, and light nuclei. Until then, there had been no systematic
www.annualreviews.org • Glauber Modeling in High-Energy Nuclear Collisions 207
Ann
u. R
ev. N
ucl.
Part
. Sci
. 200
7.57
:205
-243
. Dow
nloa
ded
from
ww
w.a
nnua
lrev
iew
s.or
gby
Uni
vers
ity o
f C
alif
orni
a -
Dav
is o
n 11
/22/
11. F
or p
erso
nal u
se o
nly.
ANRV326-NS57-08 ARI 14 September 2007 15:14
calculations treating the many-body nuclear system as either a projectile or target.Glauber’s work put the quantum theory of collisions of composite objects on a firmbasis and provided a consistent description of experimental data for protons incidenton deuterons and larger nuclei (10, 11). Most striking were the observed dips in theelastic peaks, whose position and magnitude were predicted by Glauber’s theory byCzyz and Lesniak in 1967 (12).
In the 1970s, high-energy beams of hadrons and nuclei were systematically scat-tered off of nuclear targets. Glauber’s work was found to have utility in describing totalcross sections, for which factorization relationships were found (e.g., σ 2
AB ∼ σAAσBB)(13, 14). In 1969 Czyz & Maximon (1) applied the theory in its most complete form top+A and A+B collisions, focusing mainly on elastic collisions. Finally, Bialas et al. (3,15) applied Glauber’s approach to inelastic nuclear collisions, after they had alreadyapplied their wounded-nucleon model to hadron-nucleus collisions. This is essen-tially the bare framework of the traditional Glauber model, with all of the quantummechanics reduced to its simplest form (16). The main remaining feature of the orig-inal Glauber calculations is the optical limit, used to make the full multiple-scatteringintegral numerically tractable.
Bialas et al.’s (15) approach introduced the basic functions used in more modernlanguage, including the thickness function and a prototype of the nuclear overlapfunction TAB. This paper also introduced the convention of using the optical limit foranalytical and numerical calculations, despite full knowledge that the real Glaubercalculation is a 2(A+B+1)-dimensional integral over the impact parameter and eachof the nucleon positions. A similar convention exists in most theoretical calculationsof geometrical parameters to this day.
With the advent of desktop computers, the Glauber Monte Carlo (GMC) ap-proach emerged as a natural framework for use by more realistic particle-productioncodes (17, 18). The idea was to model the nucleus in the simplest way, as uncorre-lated nucleons sampled from measured density distributions. Two nuclei could bearranged with a random impact parameter b and projected onto the x-y plane. Then,interaction probabilities could be applied by using the relative distance between twonucleon centroids as a stand-in for the measured inelastic nucleon-nucleon crosssection.
The GMC approach was first applied to high-energy heavy ion collisions in theHIJET model (17) and has shown up in practically all A+A simulation codes. Thisincludes HIJING (19), VENUS (20), RQMD(21), and all models that require specificproduction points for the different subprocesses in an A+B collision, rather than justaggregate values.
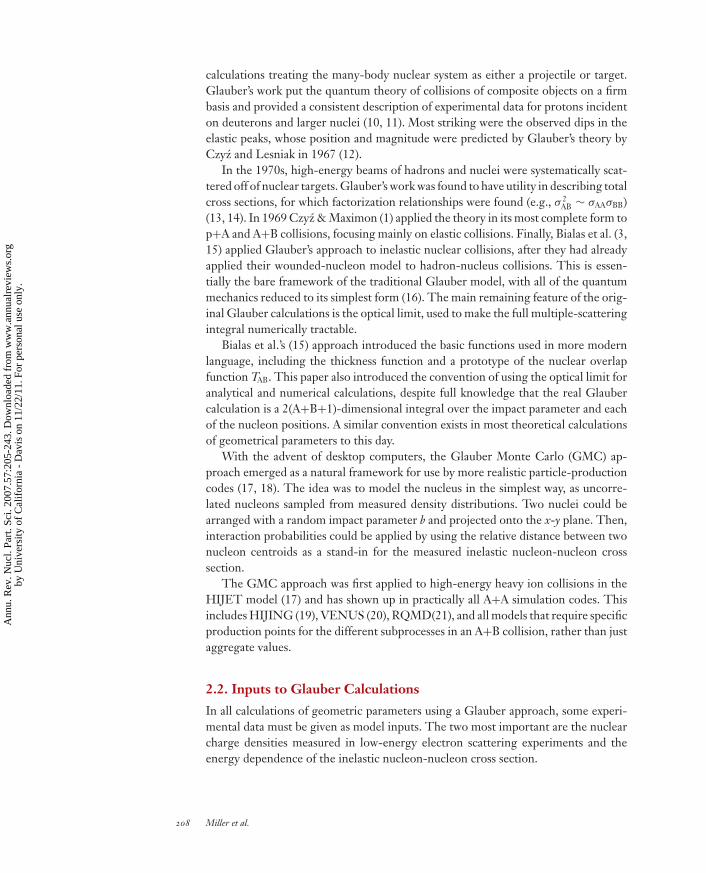
2.2. Inputs to Glauber Calculations
In all calculations of geometric parameters using a Glauber approach, some experi-mental data must be given as model inputs. The two most important are the nuclearcharge densities measured in low-energy electron scattering experiments and theenergy dependence of the inelastic nucleon-nucleon cross section.
208 Miller et al.
Ann
u. R
ev. N
ucl.
Part
. Sci
. 200
7.57
:205
-243
. Dow
nloa
ded
from
ww
w.a
nnua
lrev
iew
s.or
gby
Uni
vers
ity o
f C
alif
orni
a -
Dav
is o
n 11
/22/
11. F
or p
erso
nal u
se o
nly.

ANRV326-NS57-08 ARI 14 September 2007 15:14
Distance r to center (fm)
010 2 3 4 5 6 7 8 9 10 10 2 3 4 5 6 7 8 9 10
0.2
0.4
0.6
0.8
1.0
1.2
63Cu
197Au
Proton-neutron distance rpn
(fm)
0
0.05
0.10
0.15
0.20
0.25
0.30
Deuteron
bρ(
r)/ρ
(0)
p(r
pn)
a Figure 1(a) Density distributions fornuclei used at RHIC.(b) Distribution of theproton-neutron distance inthe deuteron as given by theHulthen wave function.
2.2.1. Nuclear charge densities. The nucleon density is usually parameterized bya Fermi distribution with three parameters:
ρ(r) = ρ01 + w(r/R)2
1 + exp( r−R
a
) , 1.
where ρ0 corresponds to the nucleon density in the center of the nucleus, R cor-responds to the nuclear radius, a to the skin depth, and w characterizes deviationsfrom a spherical shape. For 197Au (R = 6.38 fm, a = 0.535 fm, w = 0) and 63Cu(R = 4.20641 fm, a = 0.5977 fm, w = 0), the nuclei so far employed at RHIC,ρ(r)/ρ0 is shown in Figure 1a with the Fermi distribution parameters as given inReferences 22 and 23. In the Monte Carlo procedure, the radius of a nucleon isdrawn randomly from the distribution 4πr2ρ(r) (where the absolute normalizationis of course irrelevant).
At RHIC, effects of cold nuclear matter have been studied with the aid of d+Aucollisions. In the Monte Carlo calculations, the deuteron wave function was repre-sented by the Hulthen form (24, 25)
φ(rpn) = 1√2π
√ab(a + b)b − a
(e−arpn − e−brpn
rpn
), 2.
with parameters a = 0.228 fm−1 and b = 1.18 fm−1 (26). The variable rpn in Equation2 denotes the distance between the proton and the neutron. Accordingly, rpn wasdrawn from the distribution p(rpn) = 4πr2
pnφ2(rpn), which is shown in Figure 1b.
2.2.2. Inelastic nucleon-nucleon cross section. In the context of high-energynuclear collisions, we are typically interested in multiparticle nucleon-nucleon
www.annualreviews.org • Glauber Modeling in High-Energy Nuclear Collisions 209
Ann
u. R
ev. N
ucl.
Part
. Sci
. 200
7.57
:205
-243
. Dow
nloa
ded
from
ww
w.a
nnua
lrev
iew
s.or
gby
Uni
vers
ity o
f C
alif
orni
a -
Dav
is o
n 11
/22/
11. F
or p
erso
nal u
se o
nly.

ANRV326-NS57-08 ARI 14 September 2007 15:14
σ (m
b)
1
10
102
102 103
σelastic
σtot
σ NNinel (PYTHIA)
sNN
(GeV)
Figure 2The inelasticnucleon-nucleon crosssection σNN
inel asparameterized byPYTHIA (solid line) (34,35), in addition to data ontotal and elasticnucleon-nucleon crosssections as a function of√
s (36). The stars indicatethe nucleon-nucleon crosssection used for GlauberMonte Carlo calculationsat RHIC (σNN
inel = 32.3,35.6, 40, and 42 mb at√
sNN = 19.6, 62.4, 130,and 200 GeV,respectively).
processes. As the cross section involves processes with low momentum transfer, itis impossible to calculate this using perturbative quantum chromodynamics (QCD).Thus, the measured inelastic nucleon-nucleon cross section (σ NN
inel ) is used as an inputand provides the only nontrivial beam-energy dependence for Glauber calculations.From
√sNN ∼ 20 GeV (CERN SPS) to
√sNN = 200 GeV (RHIC), σ NN
inel increasesfrom ∼32 mb to ∼42 mb, as shown in Figure 2. Diffractive and elastic processes,which are typically ignored in high-energy multiparticle nuclear collisions, are gener-ally active out to large impact parameters, and thus require full quantum-mechanicalwave functions.
2.3. Optical-Limit Approximation
The Glauber model views the collision of two nuclei in terms of the individual inter-actions of the constituent nucleons (see, e.g., Reference 27). In the optical limit,the overall phase shift of the incoming wave is taken as a sum over all possibletwo-nucleon (complex) phase shifts, with the imaginary part of the phase shifts re-lated to the nucleon-nucleon scattering cross section through the optical theorem(28, 29). The model assumes that at sufficiently high energies, these nucleons willcarry sufficient momentum that they will be essentially undeflected as the nuclei passthrough each other. Workers also assumed that the nucleons move independentlyin the nucleus and that the size of the nucleus is large compared to the extent ofthe nucleon-nucleon force. The hypothesis of independent linear trajectories of theconstituent nucleons makes it possible to develop simple analytic expressions forthe A+B interaction cross section and for the number of interacting nucleons andthe number of nucleon-nucleon collisions in terms of the basic nucleon-nucleon crosssection.
In Figure 3, two heavy ions, target A and projectile B, are shown colliding atrelativistic speeds with impact parameter b (for colliding beam experiments, the
210 Miller et al.
Ann
u. R
ev. N
ucl.
Part
. Sci
. 200
7.57
:205
-243
. Dow
nloa
ded
from
ww
w.a
nnua
lrev
iew
s.or
gby
Uni
vers
ity o
f C
alif
orni
a -
Dav
is o
n 11
/22/
11. F
or p
erso
nal u
se o
nly.

ANRV326-NS57-08 ARI 14 September 2007 15:14
a
Side view
b
Beam-line view
Projectile B Target A
s–bs–b
s sbb
z
B
A
Figure 3Schematic representation ofthe optical Glauber modelgeometry, with transverse(a) and longitudinal(b) views.
distinction between the target and projectile nuclei is a matter of convenience). Wefocus on the two flux tubes located at a displacement s with respect to the centerof the target nucleus and a distance s − b from the center of the projectile. Duringthe collision these tubes overlap. The probability per unit transverse area of a givennucleon being located in the target flux tube is TA(s) = ∫
ρA(s, zA)d zA, where ρA (s, zA)is the probability per unit volume, normalized to unity, for finding the nucleon atlocation (s, zA). A similar expression follows for the projectile nucleon. The productTA(s)TB (s − b) d 2s then gives the joint probability per unit area of nucleons beinglocated in the respective overlapping target and projectile flux tubes of differentialarea d 2s . Integrating this product over all values of s defines the thickness functionT (b), with
TAB (b) =∫
TA (s) TB (s − b) d 2s . 3.
Notice that T (b) has the unit of inverse area. We can interpret this as the effectiveoverlap area for which a specific nucleon in A can interact with a given nucleon inB. The probability of an interaction occurring is then T (b) σ NN
inel , where σ NNinel is the
inelastic nucleon-nucleon cross section. Elastic processes lead to very little energyloss and are consequently not considered in the Glauber model calculations. Once theprobability of a given nucleon-nucleon interaction has been found, the probabilityof having n such interactions between nuclei A (with A nucleons) and B (with Bnucleons) is given as a binomial distribution:
P (n, b) =(
ABn
) [TAB (b) σ NN
inel
]n [1 − TAB (b) σ NN
inel
]AB−n, 4.
where the first term is the number of combinations for finding n collisions outof AB possible nucleon-nucleon interactions, the second term the probability forhaving exactly n collisions, and the last term the probability of exactly AB − nmisses.
www.annualreviews.org • Glauber Modeling in High-Energy Nuclear Collisions 211
Ann
u. R
ev. N
ucl.
Part
. Sci
. 200
7.57
:205
-243
. Dow
nloa
ded
from
ww
w.a
nnua
lrev
iew
s.or
gby
Uni
vers
ity o
f C
alif
orni
a -
Dav
is o
n 11
/22/
11. F
or p
erso
nal u
se o
nly.

ANRV326-NS57-08 ARI 14 September 2007 15:14
On the basis of this probability distribution, a number of useful reaction quantitiescan be found. The total probability of an interaction between A and B is
d 2σ ABinel
db2≡ pAB
inel(b) =AB∑
n=1
P (n,⇀
b ) = 1 −[1 − TAB (b) σ NN
inel
]AB. 5.
The vector impact parameter can be replaced by a scalar distance if the nuclei are notpolarized. In this case, the total cross section can be found as
σ ABinel =
∫ ∞
02πbdb
{1 −
[1 − TAB (b) σ NN
inel
]AB}
. 6.
The total number of nucleon-nucleon collisions is
Ncoll (b) =AB∑
n=1
nP (n, b) = ABTAB (b) σ NNinel , 7.
using the result for the mean of a binomial distribution. The number of nucleonsin the target and projectile nuclei that interact is known as either the number ofparticipants or the number of wounded nucleons. The number of participants (orwounded nucleons) at impact parameter b is given by (15, 30)
Npart (b) = A∫
TA (s){
1 −[1 − TB (s − b) σ NN
inel
]B}
d 2s
+ B∫
TB (s − b){
1 −[1 − TA (s) σ NN
inel
]A}
d 2s , 8.
where the integral over the bracketed terms gives the respective inelastic cross sectionsfor nucleon-nucleus collisions:
σA(B)inel =
∫d 2s
{1 −
[1 − σ NN
inel TA(B) (s)]A(B)
}. 9.
The optical form of the Glauber theory is based on continuous nucleon densitydistributions. The theory does not locate nucleons at specific spatial coordinates, as isthe case for the Monte Carlo formulation discussed in the next section. This differencebetween the optical and Monte Carlo approaches can lead to subtle differences incalculated results, as discussed below.
2.4. The Glauber Monte Carlo Approach
The virtue of the Monte Carlo approach for the calculation of geometry-relatedquantities such as the average number of participants 〈Npart〉 and nucleon-nucleoncollisions 〈Ncoll〉 is its simplicity. Moreover, it is possible to simulate experimentallyobservable quantities such as the charged-particle multiplicity and to apply similarcentrality cuts, as in the analysis of real data. In the Monte Carlo ansatz, the twocolliding nuclei are assembled in the computer by distributing the A nucleons ofnucleus A and the B nucleons of nucleus B in a three-dimensional coordinate systemaccording to the respective nuclear density distribution. A random impact parame-ter b is then drawn from the distribution dσ/db = 2πb . An A+B collision is treated as
212 Miller et al.
Ann
u. R
ev. N
ucl.
Part
. Sci
. 200
7.57
:205
-243
. Dow
nloa
ded
from
ww
w.a
nnua
lrev
iew
s.or
gby
Uni
vers
ity o
f C
alif
orni
a -
Dav
is o
n 11
/22/
11. F
or p
erso
nal u
se o
nly.

ANRV326-NS57-08 ARI 14 September 2007 15:14
a
x (fm)
10
y (f
m)
–10
–10
Au+Aub = 6 fm
–5
–5 50
0
5
10
–15
–10
–5
0
5
15
10
Au+Aub = 6 fm
z (fm)
10 15–10–15 –5 50
b
x (f
m)
Figure 4A Glauber Monte Carlo event (Au+Au at
√sNN = 200 GeV with impact parameter b = 6 fm)
viewed (a) in the transverse plane and (b) along the beam axis. The nucleons are drawn with
radius√
σNNinel /π/2. Darker circles represent participating nucleons.
a sequence of independent binary nucleon-nucleon collisions. That is, the nucleonstravel on straight-line trajectories, and the inelastic nucleon-nucleon cross section isassumed to be independent of the number of collisions a nucleon underwent before. Inthe simplest version of the Monte Carlo approach, a nucleon-nucleon collision takesplace if the nucleons’ distance d in the plane orthogonal to the beam axis satisfies
d ≤√
σ NNinel /π, 10.
where σ NNinel is the total inelastic nucleon-nucleon cross section. As an alternative to
the black-disk nucleon-nucleon overlap function, for example, a Gaussian overlapfunction can be used (31). An illustration of a GMC event for a Au+Au collisionwith impact parameter b = 6 fm is shown in Figure 4. 〈Npart〉 and 〈Ncoll〉 and otherquantities are then determined by simulating many A+B collisions.
2.5. Differences between Optical and Monte Carlo Approaches
It is often overlooked that the various integrals used to calculate physical observablesin the Glauber model are predicated on a particular approximation known as the opti-cal limit. This limit assumes that scattering amplitudes can be described by an eikonalapproach, where the incoming nucleons see the target as a smooth density. This ap-proach captures many features of the collision process, but does not completely cap-ture the physics of the total cross section. Thus, it tends to lead to distortions in the es-timation of Npart and Ncoll compared to similar estimations using the GMC approach.
www.annualreviews.org • Glauber Modeling in High-Energy Nuclear Collisions 213
Ann
u. R
ev. N
ucl.
Part
. Sci
. 200
7.57
:205
-243
. Dow
nloa
ded
from
ww
w.a
nnua
lrev
iew
s.or
gby
Uni
vers
ity o
f C
alif
orni
a -
Dav
is o
n 11
/22/
11. F
or p
erso
nal u
se o
nly.

ANRV326-NS57-08 ARI 14 September 2007 15:14
This can be seen by simply looking at the relevant integrals. The full (2A+2B)-dimensional integral to calculate the total cross section is (15)
σ ABinel =
∫d 2b
∫d 2s A
1 · · · d 2s AAd 2s B
1 · · · d 2s BB × TA
(sA
1
) · · · TA(sA
A
)TB
(sB
1
) · · · TB(sB
B
)×
{1 −
B∏j=1
A∏i = 1
[1 − σ
(b − sA
i +sBj
)]}, 11.
where σ (s) is normalized such that∫d 2s σ (s) = σ NN
inel , whereas the optical-limit versionof the same calculation is (see Equation 6)
σAB =∫
d 2b{
1 −[1 − σ NN
inel TAB(b)]AB
}. 12.
These expressions are generally expected to be the same for large A (and B) and/orwhen σ NN
inel is sufficiently small (15). The main difference between the two is that manyterms in the full calculation are missing in the optical-limit calculation. These arethe terms that describe local density fluctuations event by event. Thus, in the opticallimit, each nucleon in the projectile sees the oncoming target as a smooth density.
One can test this interpretation to first order by plotting the total cross section as afunction of σ NN
inel for an optical-limit calculation as well as for a GMC calculation withthe same parameters, as shown in the left panel of Figure 5. As the nucleon-nucleoncross section becomes more point like, the optical and GMC cross sections converge.
1 10
1
10–2 10–1
2
3
4
5
6
7
8
9
Optical approximationN
coll (optical)
Ncoll
(MC)
Npart
(optical)
Npart
(MC)
Np
art,
Nco
ll
Glauber Monte Carlo
b (fm)
000 2 4 6 8 10 12 14 16 18 20
200
400
600
800
1000
1200
σA
B (
bar
ns)
σNN (mb)inel
inel
Figure 5(Left) The total cross section, calculated in the optical approximation and with a GlauberMonte Carlo (MC)—both with identical nuclear parameters—as a function of σNN
inel , theinelastic nucleon-nucleon cross section. (Right) Ncoll and Npart as a function of impactparameter, calculated in the optical approximation (lines) and with a Glauber Monte Carlo(symbols). The two are essentially identical out to b = 2RA. Figure courtesy of M.D. Baker,M.P. Decowski, and P. Steinberg.
214 Miller et al.
Ann
u. R
ev. N
ucl.
Part
. Sci
. 200
7.57
:205
-243
. Dow
nloa
ded
from
ww
w.a
nnua
lrev
iew
s.or
gby
Uni
vers
ity o
f C
alif
orni
a -
Dav
is o
n 11
/22/
11. F
or p
erso
nal u
se o
nly.

ANRV326-NS57-08 ARI 14 September 2007 15:14
This confirms the general suspicion that it is the ability of GMC calculations tointroduce shadowing corrections that reduces the cross section relative to the opticalcalculations (11).
However, when calculating simple geometric quantities such as Npart and Ncoll as afunction of impact parameter, there is little difference between the two calculations,as shown in the right panel of Figure 5. The only substantial difference comes at thehighest impact parameters, something discussed in Section 3.4.1. Fluctuations arealso sensitive to this difference, but there is insufficient room in this review to discussmore recent developments (32).
2.6. Glauber Model Systematics
As discussed above, the Glauber model depends on the inelastic nucleon-nucleoncross section σ NN
inel and the geometry of the interacting nuclei. In turn, σ NNinel depends
on the energy of the reaction, as shown in Figure 2, and the geometry depends onthe number of nucleons in the target and projectile.
Figure 6a shows the effect of changing σ NNinel on the calculated values of Npart and
Ncoll for a 197Au+197Au reaction over the range of σ NNinel values relevant at RHIC. The
secondary axis shows the values of√
sNN corresponding to the σ NNinel values. The values
are shown for central events, with impact parameter b < 2 fm, and for a minimum-bias (MB) throw of events. The error bars, which extend only beyond the symbolsize for the Ncoll (b < 2 fm) results, are based on an assumed uncertainty of σ NN
inel at agiven energy of 3 mb. In general, the Glauber calculations show only a weak energydependence over the energy range covered by the RHIC accelerator.
Figure 6b shows the dependence of Npart and Ncoll on the system size for centraland MB events, with values calculated for identical particle collisions of the indicatedsystems at a fixed value of σ NN
inel = 42 mb (corresponding to√
sNN = 200 GeV).Because the Glauber model is largely dependent on the geometry of the collidingnuclei, some simple scalings can be expected for Npart and Ncoll.
1400
1200
1000
800
600
400
200
0 032 34 36 38 40 42 44 46 48 25020015010050
N
a
Aσ NNinel (mb)
1400
1200
1000
800
600
400
200
N
Npart
(b ≤ 2)
Npart
(MB)
Ncoll
(b ≤ 2)
Ncoll
(MB)
b
20 50 100 150 200 250
197Au+197Au
sNN
(GeV)
28Si56Fe
64Zn70Ge
110Pd
148Sm
184W
197Au207Pb
238U
Figure 6(a) Dependence of Npart andNcoll on σNN
inel for central(b ≤ 2 fm) andminimum-bias (MB) eventsfor a 197Au+197Au reaction.(b) Dependence of thesevalues on the system size,with σNN
inel = 42 mb.
www.annualreviews.org • Glauber Modeling in High-Energy Nuclear Collisions 215
Ann
u. R
ev. N
ucl.
Part
. Sci
. 200
7.57
:205
-243
. Dow
nloa
ded
from
ww
w.a
nnua
lrev
iew
s.or
gby
Uni
vers
ity o
f C
alif
orni
a -
Dav
is o
n 11
/22/
11. F
or p
erso
nal u
se o
nly.

ANRV326-NS57-08 ARI 14 September 2007 15:14
0.200 50 100 150 200 250 300
0.25
0.30
0.35
0.40
0.45
⟨Nco
ll⟩/⟨
Np
art⟩
4/3
Npart
28Si
148Sm
56Fe
184W
64Zn
197Au
70Ge
207Pb
110Pd
238U
Figure 7Geometric scaling behaviorof Ncoll as discussed in thetext. The calculations aredone with σNN
inel = 42 mb.
Npart should scale with the volume of the interaction region. In Figure 6b this isseen by the linear dependence of Npart for central collisions on A, where the commonvolume V of the largely overlapping nuclei in central collisions is proportional to Afor a saturated nuclear density. In a collision of two equal nuclei (A+A), the averagenumber of collisions per participant scales as the length lz ∝ N 1/3
part of the interactionvolume along the beam direction so that the number of collisions roughly follows
Ncoll ∝ N 4/3part , 13.
independent of the size of the nuclei. This scaling relationship is demonstrated inFigure 7, where Ncoll/N 4/3
part is plotted as a function of Npart for the systems shownin Figure 6b. The result is confirmed experimentally in Reference 33, where theCu+Cu and Au+Au systems are compared. The geometric nature of the Glaubermodel is evident.
3. RELATING THE GLAUBER MODEL TO EXPERIMENTALDATA
Unfortunately, neither Npart nor Ncoll can be measured directly in a RHIC experi-ment. Mean values of such quantities can be extracted for classes of measured events(Nevt) via a mapping procedure. Typically, a measured distribution (e.g., dNevt/dNch) ismapped to the corresponding distribution obtained from phenomenological Glaubercalculations. This is done by defining centrality classes in both the measured and cal-culated distributions and then connecting the mean values from the same centralityclass in the two distributions. The specifics of this mapping procedure differ bothbetween experiments as well as between collision systems within a given experiment.Herein we briefly summarize the principles and various implementations of centralitydefinition.
3.1. Methodology
The basic assumption underlying centrality classes is that the impact parameter bis monotonically related to particle multiplicity, both at midrapidity and forward
216 Miller et al.
Ann
u. R
ev. N
ucl.
Part
. Sci
. 200
7.57
:205
-243
. Dow
nloa
ded
from
ww
w.a
nnua
lrev
iew
s.or
gby
Uni
vers
ity o
f C
alif
orni
a -
Dav
is o
n 11
/22/
11. F
or p
erso
nal u
se o
nly.

ANRV326-NS57-08 ARI 14 September 2007 15:14
dσ
/dN
ch (
arb
itra
ry u
nit
s)
Nch
⟨b (fm)⟩
⟨Npart
⟩
σ/σtot
(%)
|η| < 1
10–1
10–2
10–3
10–4
0
50
50 70 90 9580
100 150 200 250 300 350
400 800 1200 1600 2000
1
CentralSemicentral
Semiperipheral
Peripheral
024681012
0%
–5%
5%
–10
%
10%
–20
%
20%
–30
%
30%
–50
%
Figure 8An illustrated example ofthe correlation of thefinal-state-observable totalinclusive charged-particlemultiplicity Nch withGlauber-calculatedquantities (b, Npart). Theplotted distribution andvarious values areillustrative and not actualmeasurements (T. Ullrich,private communication).
rapidity. For large b events (“peripheral”) we expect low multiplicity at midrapidityand a large number of spectator nucleons at beam rapidity, whereas for small b events(“central”) we expect large multiplicity at midrapidity and a small number of spectatornucleons at beam rapidity (Figure 8). In the simplest case, one measures the per-eventcharged-particle multiplicity (dNevt/dNch) for an ensemble of events. Once the totalintegral of the distribution is known, centrality classes are defined by binning thedistribution on the basis of the fraction of the total integral. The dashed vertical linesin Figure 8 represent a typical binning. The same procedure is then applied to acalculated distribution, often derived from a large number of Monte Carlo trials. Foreach centrality class, the mean value of Glauber quantities (e.g., 〈Npart〉) for the MonteCarlo events within the bin (e.g., 5%–10%) is calculated. Potential complications tothis straightforward procedure arise from various sources: event selection, uncertaintyin the total measured cross section, fluctuations in both the measured and calculateddistributions, and finite kinematic acceptance.
3.1.1. Event selection. All four RHIC experiments share a common detector toselect MB heavy ion events. The ZDCs are small acceptance hadronic calorimeterswith an angular coverage of θ ≤ 2 mrad with respect to the beam axis (9). Situatedbehind the charged-particle steering DX magnets of RHIC, the ZDCs are primarily
www.annualreviews.org • Glauber Modeling in High-Energy Nuclear Collisions 217
Ann
u. R
ev. N
ucl.
Part
. Sci
. 200
7.57
:205
-243
. Dow
nloa
ded
from
ww
w.a
nnua
lrev
iew
s.or
gby
Uni
vers
ity o
f C
alif
orni
a -
Dav
is o
n 11
/22/
11. F
or p
erso
nal u
se o
nly.

ANRV326-NS57-08 ARI 14 September 2007 15:14
Multiarray BBCs
BBCs
BBCs
OctagonsRings
Paddles
CTBTPC
FTPC
–6 –4 –2 0
STAR
PHOBOS
PHENIX
BRAHMS
η
2 4 6
ZDCs Gas Scintillator Cherenkov Silicon
Figure 9Pseudorapidity coverage of the centrality selection detectors of the four RHIC experiments(37–40). BBCs, beam-beam counter arrays; ZDCs, zero-degree calorimeters.
sensitive to neutral spectators. For Au+Au collisions at√
sNN = 130 GeV and above,the ZDCs are ∼100% efficient for inelastic collisions, thus providing an excellentMB trigger. The RHIC experiments often apply an online timing cut to select eventswithin a given primary vertex interval (∼|zvertex| < 30 cm). Further coincidence withfast detectors near midrapidity is often also used to suppress background events suchas beam-gas collisions. Experiment-specific event selection is described in detail inSection 3.2. Figure 9 displays the pseudorapidity coverage of the suite of subsystemsused to define centrality (both offline and at the trigger level) (37–40). With theexception of the STAR TPC and FTPCs, all other subsystems are intrinsically fastand available for event triggering.
3.1.2. Centrality observables. In MB p+p and p+p collisions at high energy, thecharged-particle multiplicity dNevt/dNch has been measured over a wide range of ra-pidity and is well described by a negative binomial distribution (NBD) (41). However,the multiplicity is also known to scale with the hardness (q 2) of the collision—the mul-tiplicity for hard jet events is significantly higher than that of MB collisions. In heavyion collisions, we manipulate the fact that the majority of the initial-state nucleon-nucleon collisions will be analogous to MB p+p collisions, with a small perturbationfrom much rarer hard interactions. The final integrated multiplicity of heavy ionevents is then roughly described as a superposition of many NBDs, which quicklyapproaches the Gaussian limit.
The total inclusive charged-particle multiplicity Nch can be measured offline bycounting charged tracks (e.g., STAR TPC) or estimated online from the total energydeposited in a detector divided by the typical energy deposition per charged particle(e.g., PHOBOS Paddle scintillation counters). As shown in Figure 9, there is a widevariation in the acceptance of various centrality detectors at RHIC. PHOBOS, with
218 Miller et al.
Ann
u. R
ev. N
ucl.
Part
. Sci
. 200
7.57
:205
-243
. Dow
nloa
ded
from
ww
w.a
nnua
lrev
iew
s.or
gby
Uni
vers
ity o
f C
alif
orni
a -
Dav
is o
n 11
/22/
11. F
or p
erso
nal u
se o
nly.

ANRV326-NS57-08 ARI 14 September 2007 15:14
η
0–5 0 5 –5 0 5 –5 0 5 –5 0 5
200
400
600
80019.6 GeV
dN
ch/d
η62.4 GeV 130 GeV 200 GeV
Figure 10Charged-particle multiplicity (PHOBOS) in Au+Au collisions at various center-of-massenergies for |η| < 5 (57, 58). The different colors represent different centrality selections.
the largest acceptance in η, is well suited to measure d2 NevtdNchdη
(Figure 10). These dataillustrate two key features of particle production in A+B collisions. At a fixed beamenergy, there is no dramatic change in shape as the centrality changes. However, re-ducing the beam energy does change the shape substantially, as the maximum rapidityvaries as ln(
√sNN). Thus, the same trigger detector may have a very different overall
efficiency at different beam energies.Nch can be simulated via various methods, but all require the coupling of a Glauber
calculation to a model of charged-particle production, either dynamic [e.g., HIJING(19)] or static (randomly sampled from a Gaussian, Poisson, or negative binomial).Most follow the general prescription that the multiplicity scales approximately withNpart. For an optical Glauber calculation, the simulated multiplicity (N sim
ch ) can be cal-culated semi-analytically, assuming that each participant contributes a given value ofNch, which is typically drawn from one of the aforementioned static probability distri-butions (42). The same can be done for a GMC simulation with the added advantagethat the detector response to such events can be simulated, thus enabling an equiv-alent comparison of simulated and measured Nch distributions. Various dynamicalmodels of heavy ion collisions exist and can also be coupled to detector simulations.In all cases, the exact value of Npart, Ncoll, b , and N sim
ch are known for each event.
3.1.3. Dividing by percentile of total inelastic cross section. With a measuredand simulated dNevt/dNch distribution in hand, one can then perform the mappingprocedure to extract mean values. Suppose that the measured and simulated distri-butions are both one-dimensional histograms. For each histogram, the total integralis calculated and centrality classes are defined in terms of a fraction of the total in-tegral. Typically, the integration is performed from large to small values of Nch. Forexample, the 10%–20% most central class is defined by the boundaries n10 and n20,which satisfy ∫ n10
∞dNevtdNch
dNch∫ 0∞
dNevtdNch
dNch
= 0.1 and
∫ n20∞
dNevtdNch
dNch∫ 0∞
dNevtdNch
dNch
= 0.2. 14.
www.annualreviews.org • Glauber Modeling in High-Energy Nuclear Collisions 219
Ann
u. R
ev. N
ucl.
Part
. Sci
. 200
7.57
:205
-243
. Dow
nloa
ded
from
ww
w.a
nnua
lrev
iew
s.or
gby
Uni
vers
ity o
f C
alif
orni
a -
Dav
is o
n 11
/22/
11. F
or p
erso
nal u
se o
nly.

ANRV326-NS57-08 ARI 14 September 2007 15:14
En
erg
y in
ZD
Cs
(arb
itra
ry u
nit
s)
Charge in BBCs (arbitrary units)
0 0.5
15%–20%
10%–15%
5%–10%
0%–5%
1
0
2
1.0 1.5 2.0
Figure 11Spectator-energydeposition in thezero-degree calorimeters(ZDCs) as a function ofcharged-particlemultiplicity in thebeam-beam counter arrays(BBCs) (PHENIX) (49).
See, for example, Figure 8. The same procedure is performed on both the measuredand simulated distribution. Note that nmeasured
i need not equal nsimulatedi . This nontrivial
fact implies that the mapping procedure is robust to an overall scaling of the simulatedNch distribution compared to the measured distribution. One can extend the centralityclassification beyond one dimension by studying the correlation of beam-rapidityspectator multiplicity with midrapidity particle production (Figure 11). Althoughthe distribution is somewhat asymmetric, the naive expectations of Section 3.1 areclearly upheld and the mapping procedure proceeds as in the one-dimensional case.
Once a centrality class is defined in simulation, the mean values of quantities suchas Npart can be calculated for events that fall in that centrality bin. Systematic un-certainty in the total measured cross section propagates into a leading systematicuncertainty on the Glauber quantities extracted via the mapping process. This uncer-tainty can be directly propagated by varying the value of the denominator in Equation14 accordingly and recalculating 〈Npart〉 and so on. For example, for Au+Au colli-sions at
√sNN = 200 GeV in the 10%–20% (60%–80%) most central bin, the STAR
Collaboration quotes values of 〈Npart〉 ≈ 234 (21), with an uncertainty of ∼6 (5) fromthe 5% uncertainty on the total cross section alone (43). Clearly the uncertainty inthe total cross section becomes increasingly important as one approaches the mostperipheral collisions.
3.2. Experimental Details
3.2.1. BRAHMS. The BRAHMS experiment uses the charged-particle multiplicityobserved in a pseudorapidity range of −2.2 ≤ η ≤ 2.2 to determine reaction cen-trality (44–46). The multiplicities are measured in a multiplicity array consisting of aninner barrel of Si strip detectors (SiMA) and an outer barrel of plastic scintillator tiledetectors (TMA) (37, 47) for collisions within 36 cm of the nominal vertex location.Both arrays cover the same pseudorapidity range for collisions at the nominal vertex.Beam-beam counter arrays (BBCs) located on either side of the nominal interaction
220 Miller et al.
Ann
u. R
ev. N
ucl.
Part
. Sci
. 200
7.57
:205
-243
. Dow
nloa
ded
from
ww
w.a
nnua
lrev
iew
s.or
gby
Uni
vers
ity o
f C
alif
orni
a -
Dav
is o
n 11
/22/
11. F
or p
erso
nal u
se o
nly.

ANRV326-NS57-08 ARI 14 September 2007 15:14
point at a distance of 2.2 m of the nominal vertex extend the pseudorapidity cov-erage for measuring charged-particle pseudorapidity densities. These arrays consistof Cherenkov UV-transmitting plastic radiators coupled to photomultiplier tubes.Figure 12 shows the normalized multiplicity distribution measured in the multiplic-ity array for the 197Au+197Au reaction at
√sNN = 130 GeV.
The BRAHMS reference multiplicity distribution requires coincident signals inthe experiment’s two ZDC detectors, an interaction vertex located within 30 cm of
BBC
BBC
TMA
TPM1SiMA
(MA)
104
103
102
Co
un
ts
10
1
0 0.1 0.2
50%40% 30% 20% 10%
5%
0.3 0.4 0.5 0.6 0.7 0.8 0.9 1.0
BB
C m
ult
iplic
ity
Si+tile multiplicity
Normalized Si+tile multiplicity
1.0
0.8
0.6
0.4
0.2
00 0.2 0.4 0.6 0.8 1.0
Figure 12Normalized multiplicity distribution for the 197Au+197Au reaction at
√sNN = 130 GeV as
measured in the BRAHMS multiplicity array (MA) (44). The inset shows the correlationpattern of multiplicities measured in the beam-beam counter array (BBC) and the MA. Thevertical lines indicate multiplicity values associated with the indicated centrality cuts. Theschematic shows the relative locations of the Si (SiMA) and tile (TMA) elements of the MA,the BBCs, and the front time-projection chamber (TPM1) of the midrapidity spectrometer.
www.annualreviews.org • Glauber Modeling in High-Energy Nuclear Collisions 221
Ann
u. R
ev. N
ucl.
Part
. Sci
. 200
7.57
:205
-243
. Dow
nloa
ded
from
ww
w.a
nnua
lrev
iew
s.or
gby
Uni
vers
ity o
f C
alif
orni
a -
Dav
is o
n 11
/22/
11. F
or p
erso
nal u
se o
nly.

ANRV326-NS57-08 ARI 14 September 2007 15:14
the nominal vertex location, and that there be at least four hits in the TMA. This ad-ditional requirement largely removes background contributions from beam-residualgas interactions and from very peripheral collisions involving only electromagneticprocesses. The collision vertex can be determined by either the BBCs, the ZDCcounters, or a time-projection chamber that is part of a midrapidity spectrometerarm (TPM1 in Figure 12).
A simulation of the experimental response based on realistic GEANT3 simula-tions (48) and using the HIJING Monte Carlo event generator (19) for input wasused to estimate the fraction of the inelastic scattering yield that was missed in theexperiment’s MB event selection. Multiplicity spectra using the simulated events arecompared with the experimental spectra. The shapes of the spectra are found to agreevery well for an extended range of multiplicities in the TMA array above the thresh-old multiplicity set for the event selection. The simulated events are then used toextrapolate the experimental spectrum below threshold. Using this procedure, it isestimated that the MB event selection criteria selects (93 ± 3)% of the total nuclearcross section for Au+Au collisions at
√sNN = 200 GeV, down to (87 ± 7)% for
Cu+Cu collisions at√
sNN = 62.4 GeV.
3.2.2. PHENIX. We consider two examples: Au+Au at√
sNN = 200 GeV andCu+Cu at
√sNN = 22.4 GeV. The MB trigger condition for Au+Au collisions
at√
sNN = 200 GeV was based on BBCs (38). The two BBCs (3.1 ≤ |η| ≤ 3.9)each consist of 64 photomultipliers that detect Cherenkov light produced by chargedparticles traversing quartz radiators. On the hardware level, an MB event was requiredto have at least two photomultiplier hits in each BBC. Some analyses only used eventswith an additional hardware coincidence of the two ZDCs. Moreover, it was requiredthat the interaction vertex along the beam axis (z-axis) reconstructed on the basis ofthe arrival time difference in the two BBCs lie within ±30 cm of the nominal vertex.
The efficiency of accepting inelastic Au+Au collisions under the condition ofhaving at least two photomultiplier hits in each BBC (N BBC
PMT ≥ 2) was determinedwith the aid of HIJING Monte Carlo events (19) and a detailed simulation of theBBC response (48). With an offline vertex cut of ±30 cm, these simulations yieldan efficiency of (92.3 ± 2)% for Au+Au at
√sNN = 200 GeV (49). The systematic
uncertainties reflect uncertainties of (a) dNch/dy in HIJING, (b) the shape of thez-vertex distribution, and (c) the stability of the photomultiplier gains.
The additional requirement of a ZDC coincidence removes remaining backgroundevents from beam-gas interactions, but possibly also leads to a small inefficiency forperipheral collisions. The efficiency of accepting real Au+Au collisions with N BBC
PMT ≥2 under the condition of a coincidence of the ZDCs was estimated to be 99+1.0
−1.5%.Combining the efficiencies of the BBC and ZDC requirement as well as the offlinevertex cut, PHENIX finds that its sample of MB events in Au+Au collisions at
√sNN =
200 GeV corresponds to 91.4+2.5−3.0% of the total inelastic cross section. Centrality
classes were then defined by cuts on the two-dimensional distribution of the ZDCenergy as a function of the BBC signal, as shown in Figure 11.
As a second example, we consider the centrality selection in Cu+Cu collisionsat
√sNN = 22.4 GeV. At this energy, the beam rapidity ybeam ≈ 3.2 lies within the
222 Miller et al.
Ann
u. R
ev. N
ucl.
Part
. Sci
. 200
7.57
:205
-243
. Dow
nloa
ded
from
ww
w.a
nnua
lrev
iew
s.or
gby
Uni
vers
ity o
f C
alif
orni
a -
Dav
is o
n 11
/22/
11. F
or p
erso
nal u
se o
nly.

ANRV326-NS57-08 ARI 14 September 2007 15:14
Data
Glauber Monte Carlo
Nu
mb
er o
f ev
ents
per
bin
NPC1
hits
1
0 20 40 60 80 100
10
102
103
104
εBBC
= 0.80, µ = 0.35, k = 1.40, α = 1.10
Cu+Cu at 22.4 GeVPHENIX Figure 13
Measured and simulateddistribution of the PadChamber 1 (PC1) hitmultiplicity used as acentrality variable inCu+Cu collisions at√
sNN = 22.4 GeV(PHENIX). BBC,beam-beam counter array.
pseudorapidity range of the BBCs. The BBCs were still used as MB trigger detectors(N BBC
PMT ≥ 1 in both BBCs). However, a monotonic relation between the BBC signaland the impact parameter was no longer obvious. Thus, the hit multiplicity (NPC1)measured with a Pad Chamber 1 (PC1) detector (50) at midrapidity (|η| ≤ 0.35) wasused as a centrality variable.
The PC1 multiplicity distribution was simulated on the basis of a convolution ofthe Npart distribution from a GMC and an NBD. A nonlinear scaling of the averageparticle multiplicity with Npart was allowed: Workers assumed that the number ofindependently decaying precursor particles (ancestors, Nancestor) is given by Nancestor =N α
part. The number of measured PC1 hits per precursor particle was assumed to followan NBD:
Pμ,k(n) = (n + k)(n + 1)(k)
· (μ/k)n
(μ/k + 1)n+k. 15.
In a GMC event, the NBD was sampled Nancestor times to obtain the simulatedPC1 multiplicity for this event. The PC1 multiplicity distribution was simulated fora grid of values for μ, k, and α to find optimal values. Figure 13 shows the measuredand simulated PC1 distribution, in addition to the best estimate of the BBC triggerefficiency (εBBC ≈ 0.8) corresponding to the difference at small NPC1 (see Reference49 for a similar study in Au+Au collisions at
√sNN = 19.6 GeV). Given the good
agreement between the measured and simulated distribution in Figure 13, centralityclasses for Cu+Cu collisions at
√sNN = 22.4 GeV were defined by identical cuts on
the measured and simulated NPC1.
3.2.3. PHOBOS. As discussed above, PHOBOS measures centrality with two setsof 16 scintillator paddle counters covering 3 < |η| < 4.5 (39). Good events aredefined by having a time difference of less than 4 ns between the first hit impinging
www.annualreviews.org • Glauber Modeling in High-Energy Nuclear Collisions 223
Ann
u. R
ev. N
ucl.
Part
. Sci
. 200
7.57
:205
-243
. Dow
nloa
ded
from
ww
w.a
nnua
lrev
iew
s.or
gby
Uni
vers
ity o
f C
alif
orni
a -
Dav
is o
n 11
/22/
11. F
or p
erso
nal u
se o
nly.

ANRV326-NS57-08 ARI 14 September 2007 15:14
Co
un
ts
105
104
103
102
Total number of paddle slats hit0 10 20 30
Au+Au 200 GeV
Monte Carlo simulation
Data
Missing cross section
Figure 14PHOBOS data (39)showing the number ofpaddle slats, out of 32total, hit by chargedparticles in triggeredevents. The data arecompared with a fullMonte Carlo simulationof unbiased HIJINGevents. The data arenormalized aroundN(slats) ∼16 in order tocompare data and the fullsimulations and thus toestimate the fraction ofevents lost to the triggerconditions. Figureadapted with permissionfrom Reference 39.
on each paddle counter (limiting the vertex range) and either a coincidence betweenthe PHOBOS ZDCs or a high-summed energy signal in the paddles (to avoid theslight inefficiency in the ZDCs at small impact parameter at low energies).
PHOBOS estimates the observed fraction of the total cross section by measuringthe distribution of the total number of paddle slats, as shown in Figure 14. Mostof the variation in this quantity essentially measures the very-low-multiplicity partof the multiplicity distribution, as the bulk of the events have sufficient multiplicity tofire all of the paddles simultaneously. The inefficiency is determined by matching theplateau structure in the data to that in HIJING and measuring how many of the low-multiplicity events are missed in the data relative to the Monte Carlo calculation. Thisaccounts for a variety of instrumental effects in an aggregate way, and the differencebetween the estimated value and 100% sets the scale for the systematic uncertainty.
The total detection efficiency for 200 GeV Au+Au collisions is 97%, and 88%when requiring that more than two slats hit on each set of 16 paddle counters. This lastrequirement dramatically reduces background events taken to tape, and the relativeefficiency is straightforward to measure with the events triggered on a coincidenceof one or more hits in each set of counters.
For events with much lower multiplicities and/or lower energies, both the mul-tiplicity and rapidity reach are substantially smaller. This strongly impacts the effi-ciency of the paddle counters and thus potentially distorts the centrality estimation.For these, PHOBOS uses the full distribution of multiplicities measured in severalη regions of the Octagon and Ring multiplicity counters and matches them to thedistributions measured in a Monte Carlo simulation, typically HIJING. Once the
224 Miller et al.
Ann
u. R
ev. N
ucl.
Part
. Sci
. 200
7.57
:205
-243
. Dow
nloa
ded
from
ww
w.a
nnua
lrev
iew
s.or
gby
Uni
vers
ity o
f C
alif
orni
a -
Dav
is o
n 11
/22/
11. F
or p
erso
nal u
se o
nly.
ANRV326-NS57-08 ARI 14 September 2007 15:14
overall multiplicity scale is fit, the difference in the integrals between the data andMonte Carlo simulation gives a reasonable estimate of the fraction of the observedtotal cross section.
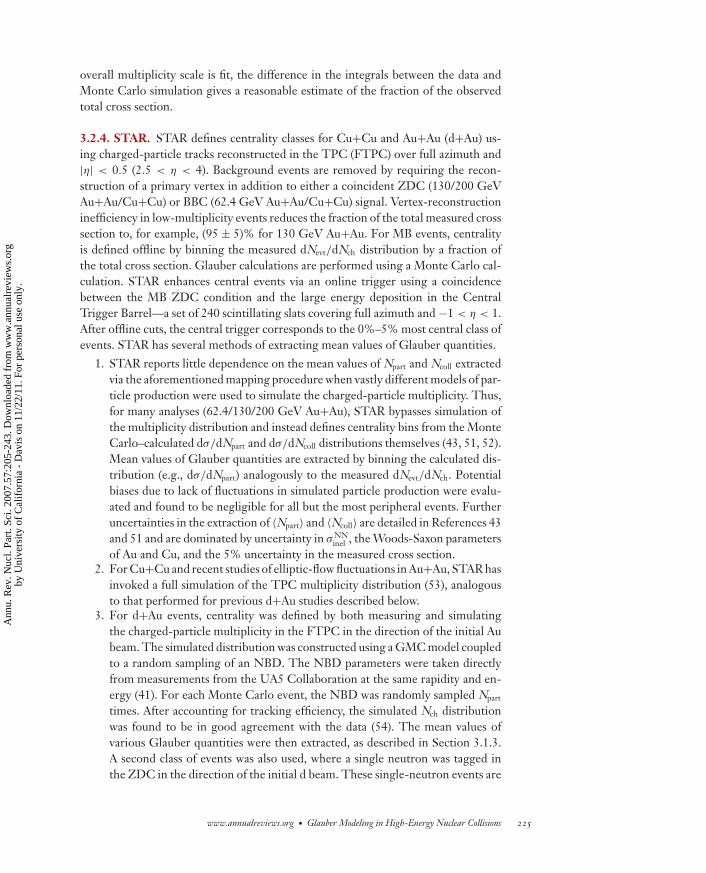
3.2.4. STAR. STAR defines centrality classes for Cu+Cu and Au+Au (d+Au) us-ing charged-particle tracks reconstructed in the TPC (FTPC) over full azimuth and|η| < 0.5 (2.5 < η < 4). Background events are removed by requiring the recon-struction of a primary vertex in addition to either a coincident ZDC (130/200 GeVAu+Au/Cu+Cu) or BBC (62.4 GeV Au+Au/Cu+Cu) signal. Vertex-reconstructioninefficiency in low-multiplicity events reduces the fraction of the total measured crosssection to, for example, (95 ± 5)% for 130 GeV Au+Au. For MB events, centralityis defined offline by binning the measured dNevt/dNch distribution by a fraction ofthe total cross section. Glauber calculations are performed using a Monte Carlo cal-culation. STAR enhances central events via an online trigger using a coincidencebetween the MB ZDC condition and the large energy deposition in the CentralTrigger Barrel—a set of 240 scintillating slats covering full azimuth and −1 < η < 1.After offline cuts, the central trigger corresponds to the 0%–5% most central class ofevents. STAR has several methods of extracting mean values of Glauber quantities.
1. STAR reports little dependence on the mean values of Npart and Ncoll extractedvia the aforementioned mapping procedure when vastly different models of par-ticle production were used to simulate the charged-particle multiplicity. Thus,for many analyses (62.4/130/200 GeV Au+Au), STAR bypasses simulation ofthe multiplicity distribution and instead defines centrality bins from the MonteCarlo–calculated dσ/dNpart and dσ/dNcoll distributions themselves (43, 51, 52).Mean values of Glauber quantities are extracted by binning the calculated dis-tribution (e.g., dσ/dNpart) analogously to the measured dNevt/dNch. Potentialbiases due to lack of fluctuations in simulated particle production were evalu-ated and found to be negligible for all but the most peripheral events. Furtheruncertainties in the extraction of 〈Npart〉 and 〈Ncoll〉 are detailed in References 43and 51 and are dominated by uncertainty in σ NN
inel , the Woods-Saxon parametersof Au and Cu, and the 5% uncertainty in the measured cross section.
2. For Cu+Cu and recent studies of elliptic-flow fluctuations in Au+Au, STAR hasinvoked a full simulation of the TPC multiplicity distribution (53), analogousto that performed for previous d+Au studies described below.
3. For d+Au events, centrality was defined by both measuring and simulatingthe charged-particle multiplicity in the FTPC in the direction of the initial Aubeam. The simulated distribution was constructed using a GMC model coupledto a random sampling of an NBD. The NBD parameters were taken directlyfrom measurements from the UA5 Collaboration at the same rapidity and en-ergy (41). For each Monte Carlo event, the NBD was randomly sampled Npart
times. After accounting for tracking efficiency, the simulated Nch distributionwas found to be in good agreement with the data (54). The mean values ofvarious Glauber quantities were then extracted, as described in Section 3.1.3.A second class of events was also used, where a single neutron was tagged inthe ZDC in the direction of the initial d beam. These single-neutron events are
www.annualreviews.org • Glauber Modeling in High-Energy Nuclear Collisions 225
Ann
u. R
ev. N
ucl.
Part
. Sci
. 200
7.57
:205
-243
. Dow
nloa
ded
from
ww
w.a
nnua
lrev
iew
s.or
gby
Uni
vers
ity o
f C
alif
orni
a -
Dav
is o
n 11
/22/
11. F
or p
erso
nal u
se o
nly.

ANRV326-NS57-08 ARI 14 September 2007 15:14
essentially peripheral p+Au collisions, and the corresponding FTPC multiplic-ity is again well described by the GMC-based simulation (54).
3.3. Acceptance Biases
Because centrality is estimated using quantities that vary monotonically with particlemultiplicity, one must be careful to avoid associating fluctuations of an observablewith fluctuations in the geometric quantities themselves. This is especially true whenestimating the yield per participant pair, when one is estimating the participants fromthe yield itself. Of course, in heavy ion collisions, the extraordinarily high multiplici-ties reduce the effect of autocorrelation bias, as was estimated by STAR (52). However,the RHIC experiments have found that lower multiplicities and lower energies arequite challenging. Estimating the number of participants in d+Au proved partic-ularly delicate owing to autocorrelations, which were reduced (in HIJING simula-tions) by using large regions in pseudorapidity positioned far forward and backward ofmidrapidity (7).
3.4. Estimating Geometric Quantities
3.4.1. Total geometric cross section. The total geometric cross section for thecollision of two nuclei A and B, that is, the integral of the distributions dσ/db shownin Figure 15, is a basic quantity that can be easily calculated in the GMC approach. Itcorresponds to all GMC events with at least one inelastic nucleon-nucleon collision.In ultrarelativistic A+B collisions, the de Broglie wavelength of the nucleons is smallcompared to their transverse extent so that quantum-mechanical effects are negligi-ble. Hence, the total geometric cross section is expected to be a good approximationof the total inelastic cross section. For the reaction systems in Figure 15 (d+Au,Cu+Cu, and Au+Au at
√sNN = 200 GeV), the Monte Carlo calculations yield
dσ
/db
(fm
)
Impact parameter b (fm)
420 6 8 10 12 14 16 18 200
10
20
30
40
50
60
70
80
90
100
Au+Au
Cu+Cu
d+Au
Au+Au (optical limit)
Figure 15Total geometrical crosssection from GlauberMonte Carlo calculations(d+Au, Cu+Cu, andAu+Au at
√sNN =
200 GeV). The green linerepresents an optical-limitcalculation for Au+Au.
226 Miller et al.
Ann
u. R
ev. N
ucl.
Part
. Sci
. 200
7.57
:205
-243
. Dow
nloa
ded
from
ww
w.a
nnua
lrev
iew
s.or
gby
Uni
vers
ity o
f C
alif
orni
a -
Dav
is o
n 11
/22/
11. F
or p
erso
nal u
se o
nly.
ANRV326-NS57-08 ARI 14 September 2007 15:14
0 100 200 300 400
1.05
1.00
1.10 30%–40%
20%–30%10%–20% 6%–10%
0%–6%
Np
art /N
op
tica
lM
Cp
art
Npart
MC
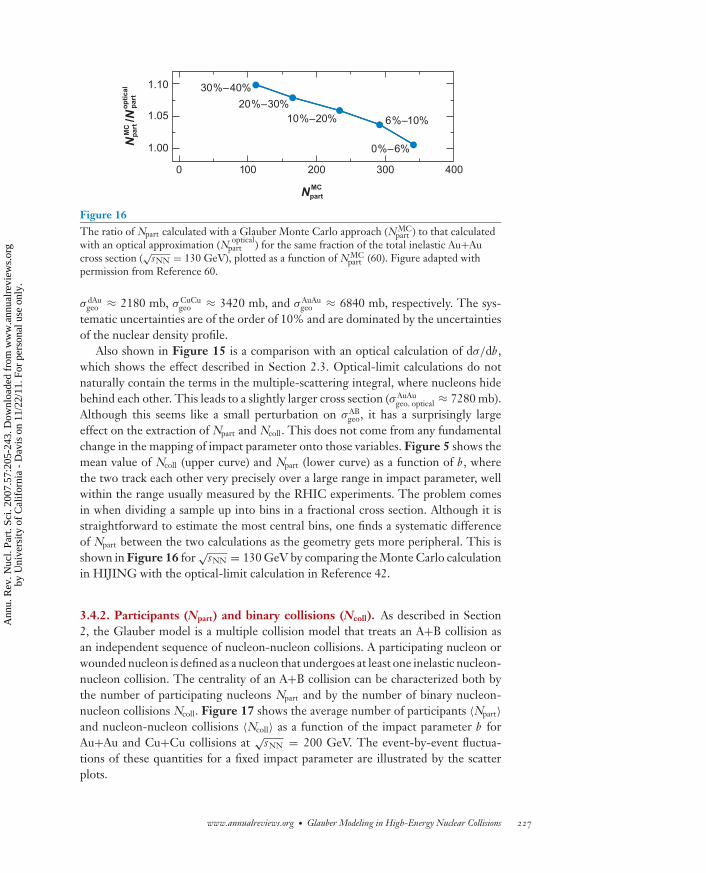
Figure 16The ratio of Npart calculated with a Glauber Monte Carlo approach (N MC
part ) to that calculatedwith an optical approximation (N optical
part ) for the same fraction of the total inelastic Au+Aucross section (
√sNN = 130 GeV), plotted as a function of N MC
part (60). Figure adapted withpermission from Reference 60.
σ dAugeo ≈ 2180 mb, σ CuCu
geo ≈ 3420 mb, and σ AuAugeo ≈ 6840 mb, respectively. The sys-
tematic uncertainties are of the order of 10% and are dominated by the uncertaintiesof the nuclear density profile.
Also shown in Figure 15 is a comparison with an optical calculation of dσ/db ,which shows the effect described in Section 2.3. Optical-limit calculations do notnaturally contain the terms in the multiple-scattering integral, where nucleons hidebehind each other. This leads to a slightly larger cross section (σ AuAu
geo, optical ≈ 7280 mb).Although this seems like a small perturbation on σ AB
geo, it has a surprisingly largeeffect on the extraction of Npart and Ncoll. This does not come from any fundamentalchange in the mapping of impact parameter onto those variables. Figure 5 shows themean value of Ncoll (upper curve) and Npart (lower curve) as a function of b , wherethe two track each other very precisely over a large range in impact parameter, wellwithin the range usually measured by the RHIC experiments. The problem comesin when dividing a sample up into bins in a fractional cross section. Although it isstraightforward to estimate the most central bins, one finds a systematic differenceof Npart between the two calculations as the geometry gets more peripheral. This isshown in Figure 16 for
√sNN = 130 GeV by comparing the Monte Carlo calculation
in HIJING with the optical-limit calculation in Reference 42.
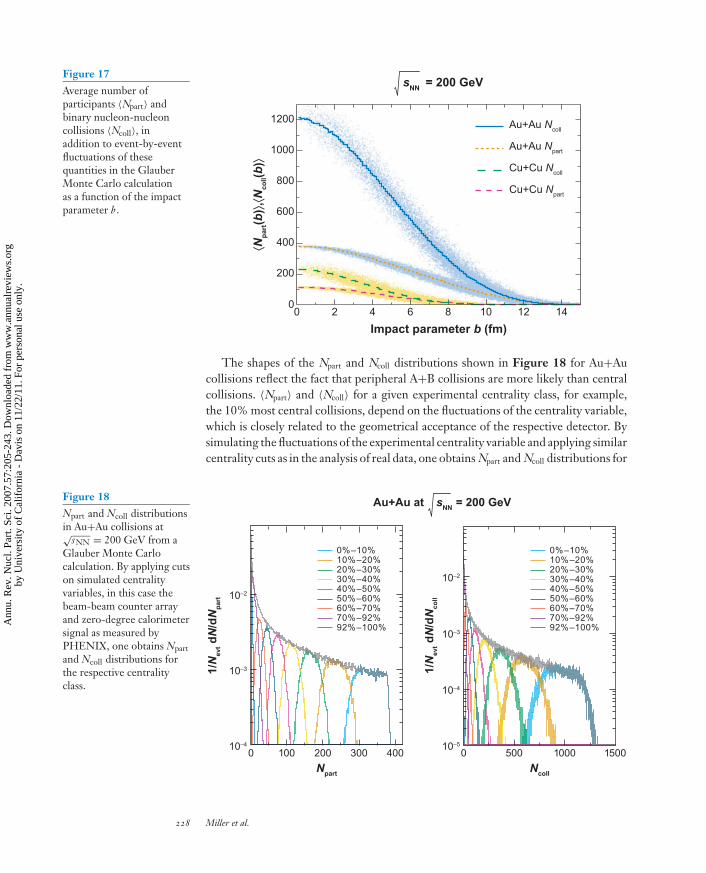
3.4.2. Participants (Npart) and binary collisions (Ncoll). As described in Section2, the Glauber model is a multiple collision model that treats an A+B collision asan independent sequence of nucleon-nucleon collisions. A participating nucleon orwounded nucleon is defined as a nucleon that undergoes at least one inelastic nucleon-nucleon collision. The centrality of an A+B collision can be characterized both bythe number of participating nucleons Npart and by the number of binary nucleon-nucleon collisions Ncoll. Figure 17 shows the average number of participants 〈Npart〉and nucleon-nucleon collisions 〈Ncoll〉 as a function of the impact parameter b forAu+Au and Cu+Cu collisions at
√sNN = 200 GeV. The event-by-event fluctua-
tions of these quantities for a fixed impact parameter are illustrated by the scatterplots.
www.annualreviews.org • Glauber Modeling in High-Energy Nuclear Collisions 227
Ann
u. R
ev. N
ucl.
Part
. Sci
. 200
7.57
:205
-243
. Dow
nloa
ded
from
ww
w.a
nnua
lrev
iew
s.or
gby
Uni
vers
ity o
f C
alif
orni
a -
Dav
is o
n 11
/22/
11. F
or p
erso
nal u
se o
nly.
ANRV326-NS57-08 ARI 14 September 2007 15:14
⟨Np
art(b
)⟩,⟨N
coll(
b)⟩
Impact parameter b (fm)
0 2 4 6 8 10 12 14
200
0
400
600
800
1000
1200 Au+Au Ncoll
Au+Au Npart
Cu+Cu Ncoll
Cu+Cu Npart
sNN
= 200 GeVFigure 17Average number ofparticipants 〈Npart〉 andbinary nucleon-nucleoncollisions 〈Ncoll〉, inaddition to event-by-eventfluctuations of thesequantities in the GlauberMonte Carlo calculationas a function of the impactparameter b .
The shapes of the Npart and Ncoll distributions shown in Figure 18 for Au+Aucollisions reflect the fact that peripheral A+B collisions are more likely than centralcollisions. 〈Npart〉 and 〈Ncoll〉 for a given experimental centrality class, for example,the 10% most central collisions, depend on the fluctuations of the centrality variable,which is closely related to the geometrical acceptance of the respective detector. Bysimulating the fluctuations of the experimental centrality variable and applying similarcentrality cuts as in the analysis of real data, one obtains Npart and Ncoll distributions for
Au+Au at sNN
= 200 GeV
10–2
10–2
10–3
10–4
10–5
0 500 1000 1500
10–3
10–4
0 100 200 300 400
0%–10%10%–20%20%–30%30%–40%40%–50%50%–60%60%–70%70%–92%92%–100%
0%–10%10%–20%20%–30%30%–40%40%–50%50%–60%60%–70%70%–92%92%–100%
1/N
evt d
N/d
Np
art
1/N
evt d
N/d
Nco
ll
Npart
Ncoll
Figure 18Npart and Ncoll distributionsin Au+Au collisions at√
sNN = 200 GeV from aGlauber Monte Carlocalculation. By applying cutson simulated centralityvariables, in this case thebeam-beam counter arrayand zero-degree calorimetersignal as measured byPHENIX, one obtains Npartand Ncoll distributions forthe respective centralityclass.
228 Miller et al.
Ann
u. R
ev. N
ucl.
Part
. Sci
. 200
7.57
:205
-243
. Dow
nloa
ded
from
ww
w.a
nnua
lrev
iew
s.or
gby
Uni
vers
ity o
f C
alif
orni
a -
Dav
is o
n 11
/22/
11. F
or p
erso
nal u
se o
nly.

ANRV326-NS57-08 ARI 14 September 2007 15:14
each centrality class. For peripheral classes, the bias introduced by the inefficiency ofthe experimental MB trigger must be taken into account by applying a correspondingtrigger threshold on the GMC events. Experimental observables such as particlemultiplicities can then be plotted as a function of the mean value of Npart and Ncoll
distributions.The systematic uncertainties of Npart, Ncoll, and other calculated quantities are esti-
mated by varying various model parameters. Figure 19 shows such a study for Au+Aucollisions at
√sNN = 200 GeV (PHENIX). The following effects were considered:
� The default value of the nucleon-nucleon cross section of σNN = 42 mb waschanged to 39 mb and 45 mb.
� Woods-Saxon parameters were varied to determine uncertainties related to thenuclear density profile.
� Effects of a nucleon hard core were studied by requiring a minimum distance of0.8 fm between two nucleons of the same nucleus without distorting the radialdensity profile.
� Parameters of the BBC and ZDC simulation (e.g., parameters describing thefinite resolution of these detectors) were varied.
� The black-disk nucleon-nucleon overlap function was replaced by a gray diskand a Gaussian overlap function (31) without changing the total inelasticnucleon-nucleon cross section.
� The origin of the centrality cuts applied in the scatter plot of ZDC versus BBCspace was modified in the Glauber calculation.
� The uncertainty of the efficiency of the MB trigger leads to uncertainties asto which percentile of the total inelastic cross section is actually selected withcertain centrality cuts. The centrality cuts applied on the centrality observablesimulated with the GMC were varied accordingly to study the influence on〈Npart〉 and 〈Ncoll〉.
� Even if the MB trigger efficiency were precisely known, potential instabilitiesof the centrality detectors could lead to uncertainties as to which percentileof the total cross section is selected. This has been studied by comparing thenumber of events in each experimental centrality class for different run periods.The effect on 〈Npart〉 and 〈Ncoll〉 was again studied by varying the cuts on thesimulated centrality variable accordingly.
The total systematic uncertainty indicated by the shaded boxes in Figure 19 wasobtained by adding the deviations from the default result for each item in the abovelist in quadrature. The uncertainty of Npart decreases from ∼20% in peripheral colli-sions to ∼3% in central Au+Au collisions. Ncoll has similar uncertainties as Npart forperipheral Au+Au collisions. For Npart > 100 (or Ncoll > 200), the relative systematicuncertainty of Ncoll remains constant at ∼10%. Similar estimates for the systematicuncertainties of Npart and Ncoll at the CERN SPS energy of
√sNN = 17.2 GeV were
reported in Reference 55.For the comparison of observables related to hard processes in A+A and p+p
collisions, it is advantageous to introduce the nuclear overlap function 〈TAB〉f for a
www.annualreviews.org • Glauber Modeling in High-Energy Nuclear Collisions 229
Ann
u. R
ev. N
ucl.
Part
. Sci
. 200
7.57
:205
-243
. Dow
nloa
ded
from
ww
w.a
nnua
lrev
iew
s.or
gby
Uni
vers
ity o
f C
alif
orni
a -
Dav
is o
n 11
/22/
11. F
or p
erso
nal u
se o
nly.

ANRV326-NS57-08 ARI 14 September 2007 15:14
0.8
0.9
1.0
1.1
1.2
Different simulation of ZDC energyDifferent BBC fluctuations
Gray disk NN overlap functionGaussian NN overlap functionVariation in 2D BBC-ZDC centrality selectionBBC trigger eff. (91.4+2.5)% (more central)BBC trigger eff. (91.4–3.0)% (less central)Sys. error of exp. centr. sel. (more central)Sys. error of exp. centr. sel. (less central)
0.6
0 200 400 600 800 1000
0.7
0.8
0.9
1.0
1.1
1.2
1.3
1.4
Ncoll
Nco
ll
X/ N
coll
def
ault
Np
art
X/ N
par
t
def
ault
0 50 100 150 200 250 300
Npart
Woods-Saxon: R = 6.65 fm, d = 0.55 fmWoods-Saxon: R = 6.25 fm, d = 0.53 fmNucleons with hard core (r
hard = 0.4 fm)
σ inel = 39 mbNN
σ inel = 45 mbNN
Figure 19Effect of various parameters in the Glauber Monte Carlo calculation on Npart and Ncoll forAu+Au collisions at
√sNN = 200 GeV. BBC, beam-beam counter array; ZDC, zero-degree
calorimeter.
230 Miller et al.
Ann
u. R
ev. N
ucl.
Part
. Sci
. 200
7.57
:205
-243
. Dow
nloa
ded
from
ww
w.a
nnua
lrev
iew
s.or
gby
Uni
vers
ity o
f C
alif
orni
a -
Dav
is o
n 11
/22/
11. F
or p
erso
nal u
se o
nly.

ANRV326-NS57-08 ARI 14 September 2007 15:14
certain centrality class f (see Section 4.2) that is calculated in the GMC approach as
〈TAB〉f = 〈Ncoll〉f/σNNinel . 16.
The uncertainty of the inelastic nucleon-nucleon cross section σ NNinel does not con-
tribute to the systematic uncertainty. Apart from this, 〈TAB〉f has the same systematicuncertainties as 〈Ncoll〉f.
3.4.3. Eccentricity. One of the surprising features of the RHIC data was the strongevent-by-event asymmetries in the azimuthal distributions. This has been attributedto the phenomenon of elliptic flow—the transformation of spatial asymmetries intomomentum asymmetries by means of hydrodynamic evolution. For any hydrody-namic model to be appropriate, the system must be sufficiently opaque (where opacityis the product of density times interaction cross section) such that the system equi-librates locally at early times. This suggests that the relevant geometric quantity forcontrolling elliptic flow is the shape of the overlap region, which sets the scale for thegradients that develop.
The typical variable used to quantify this shape is the eccentricity, defined as
ε = 〈 y2 − x2〉〈 y2 + x2〉 . 17.
Just as with other variables discussed here, there are two ways to calculate this. In theoptical limit, one performs the averages at a fixed impact parameter, weighting eitherby the local participant or the binary collision density. In the Monte Carlo approach,one simply calculates the moments of the participants themselves. Furthermore, onecan calculate these moments with the x-axis oriented in two natural frames. The firstis along the nominal reaction plane (estimated using spectator nucleons). The secondis along the short principal axis of the participant distribution itself (56). The onlymathematical difference between the two definitions involves the incorporation ofthe correlation coefficient 〈xy〉:
εpart =√(
σ 2x − σ 2
y
)2 + 4(σxy )2
σ 2x + σ 2
y. 18.
A comparison of the two definitions is shown in Figure 20. One sees very differentlimiting behavior at very large and small impact parameters. At large impact param-eter, fluctuations due to small numbers of participants drive εstd → 0, but εpart → 1.As b = 0, εstd also goes to zero as the system becomes radially symmetric, whereasεpart now picks up the fluctuations and remains finite. The relevance of these twoquantities to actual data is discussed in Sections 4.3 and 4.4.
4. GEOMETRIC ASPECTS OF P+A AND A+A PHENOMENA
4.1. Inclusive Charged-Particle Yields (Total and Midrapidity)
The total multiplicity in hadronic reactions is a measure of the degrees of freedomreleased in the collision. In the 1970s, researchers discovered that the total number of
www.annualreviews.org • Glauber Modeling in High-Energy Nuclear Collisions 231
Ann
u. R
ev. N
ucl.
Part
. Sci
. 200
7.57
:205
-243
. Dow
nloa
ded
from
ww
w.a
nnua
lrev
iew
s.or
gby
Uni
vers
ity o
f C
alif
orni
a -
Dav
is o
n 11
/22/
11. F
or p
erso
nal u
se o
nly.

ANRV326-NS57-08 ARI 14 September 2007 15:14
Npart
⟨ε⟩
–0.2
0
0 50 100 150 200 250 300 350
0.2
0.4
0.6
0.8⟨εpart⟩ Cu+Cu
⟨εstd⟩ Cu+Cu
⟨εpart⟩ Au+Au
⟨εstd⟩ Au+Au
Figure 20PHOBOS calculation ofeccentricity in Au+Au andCu+Cu collisions as afunction of Npart (74).Both standard andparticipant eccentricitiesare shown. Figure adaptedwith permission fromReference 74.
particles produced in p+A collisions was proportional to the number of participants;that is, Nch ∝ Npart = ν + 1, where ν is defined as the number of struck nucleons inthe nucleus (61). This experimental fact was instrumental in establishing Npart as afundamental physical variable. The situation became more interesting when the totalmultiplicity was measured in Au+Au at four RHIC energies, spanning an order ofmagnitude in
√sNN, and was approximately proportional to Npart there as well. This
is shown in Figure 21 with PHOBOS data from References 58 and 59, and is strikingif one considers the variety of physics processes that should contribute to the totalmultiplicity.
By contrast, the inclusive charged-particle density near midrapidity [d N/dη(|η| <
1)] does not scale linearly with Npart/2. This is shown in Figure 22 with STAR data,with Npart estimated both from an optical calculation as well as a GMC calculation(62). The comparison shows why care must be taken in the estimation of Npart, asusing one or the other gives better agreement with very different models. Eskolaet al.’s (63) saturation model shows scaling with Npart and agrees with the data if Npart
is estimated with an optical calculation. However, it disagrees with the data when theGMC approach is used. Better agreement with the data can be found with a so-calledtwo-component model. For example, in Reference 42
d Ndη
= npp[(1 − x)Npart + xNcoll
]. 19.
This model can be fit to the data by a judicious choice of x, the parameter thatcontrols the admixture of hard particle production. However, there is no evidence ofany energy dependence to this parameter (64, 65) from
√sNN = 19.6 to 200 GeV,
suggesting that the source of this dependence has little to nothing to do with hard orsemihard processes.
4.2. Hard Scattering: TAB Scaling
The number of hard processes between point-like constituents of the nucleons in anA+B collision is proportional to the nuclear overlap function TAB(b) (66–71). This
232 Miller et al.
Ann
u. R
ev. N
ucl.
Part
. Sci
. 200
7.57
:205
-243
. Dow
nloa
ded
from
ww
w.a
nnua
lrev
iew
s.or
gby
Uni
vers
ity o
f C
alif
orni
a -
Dav
is o
n 11
/22/
11. F
or p
erso
nal u
se o
nly.

ANRV326-NS57-08 ARI 14 September 2007 15:14
00 200 400
10
20
30
19.6 GeV
130 GeV
200 GeV
62.4 GeV
Npart
Nch
/⟨Np
art /2
⟩
p(p) + p
Figure 21Total inclusivecharged-particlemultiplicity (Nch) divided bythe number of participatingnucleon pairs (Npart/2) fromPHOBOS data at fourRHIC energies (58, 59).The data are compared withp+p data or interpolationsto unmeasured energies atNpart = 2. Figure adaptedwith permission fromReferences 58 and 59.
follows directly from the factorization theorem in the theoretical description of hardinteractions within perturbative QCD (72). In detail, the average yield for a hardprocess with cross section σ
pphard in p+p collisions per encounter of two nuclei A and
B with impact parameter b is given by
N AB,enchard (b) = TAB(b)σ pp
hard. 20.
Here, TAB(b) is normalized so that∫TAB(b) d2b = AB. σ pp
hard can, for example, representthe cross section for the production of charm-anticharm quark pairs (c c ) or high-transverse-momentum (pT) direct photons in proton-proton collisions.
At large impact parameter, not every encounter of two nuclei A and B leads to aninelastic collision. Hence, the average number of hard processes per inelastic A+Bcollision is given by
N ABhard(b) = TAB(b)
pABinel(b)
σhard, 21.
where pABinel(b) is the probability of an inelastic A+B collision. In the optical limit,
pABinel(b) is given by (see Equation 5)
pABinel(b) = 1 −
(1 − σ NN
inelTAB(b)
AB
)AB
. 22.
www.annualreviews.org • Glauber Modeling in High-Energy Nuclear Collisions 233
Ann
u. R
ev. N
ucl.
Part
. Sci
. 200
7.57
:205
-243
. Dow
nloa
ded
from
ww
w.a
nnua
lrev
iew
s.or
gby
Uni
vers
ity o
f C
alif
orni
a -
Dav
is o
n 11
/22/
11. F
or p
erso
nal u
se o
nly.

ANRV326-NS57-08 ARI 14 September 2007 15:14
(h+ + h–)/2
Kharzeev-Nardin
pp = 2.25 x
hard = 0.11±0.005
EKRTC = 0.89±0.01 a = 0.92 s = 0.40
(2/⟨N
par
t⟩) d
Nch
/dη
⟨Npart⟩ optical Glauber0 50 100 150 200 250 300 350
0
1
3
4
5
2Kharzeev-Nardin
pp = 2.25 x
hard = 0.10±0.005
EKRTC = 0.83±0.01 a = 0.92 s = 0.40
⟨Npart⟩ Glauber Monte Carlo 0 50 100 150 200 250 300 400350
Figure 22Inclusive charged-particle multiplicity near midrapidity [dN/dη(|η| < 1)] divided by thenumber of participating nucleon pairs (Npart/2) estimated using the optical approximation (left)and a Glauber Monte Carlo calculation (right) from STAR. The data are compared withtwo-component fits and a calculation based on parton saturation [EKRT (63)]. Figure adaptedwith permission from Reference 63.
Particle yields at RHIC are usually measured as a function of pT. If an invariant crosssection dσ pp/dpT for a hard scattering process leading to the production of a certainparticle x has been measured in p+p collisions, then according to Equation 21 theinvariant multiplicity of x per inelastic A+B collision with impact parameter b is givenby
1N AB
inel
dN ABx
dpT= TAB(b)
pABinel(b)
dσppx
dpT. 23.
This baseline expectation is based purely on nuclear geometry and assumes the ab-sence of any nuclear effects. In reality, one must average over a certain impact param-eter distribution. As an example, we consider a centrality class f, which correspondsto a fixed impact parameter range b1 ≤ b ≤ b2. Taking the average in this range overthe impact parameter distribution [weighting factor dσ AB/db = 2πbpAB
inel(b)] leads to
1N AB
inel
dN ABx
dpT
∣∣∣∣f
= 〈TAB〉fdσ
ppx
dpT, 24.
with
〈TAB〉f =∫d2bTAB(b)∫d2bpAB
inel(b)=
∫ b2b1
db2πbTAB(b)∫ b2b1
db2πbpABinel(b)
. 25.
Averaging over the full impact parameter range (b1 = 0, b2 = ∞) yields 〈TAB〉f =AB/σ AB
geo. In the GMC approach, 〈TAB〉f for a certain centrality class is calculated as
〈TAB〉f = 〈Ncoll〉f/σNNinel , 26.
234 Miller et al.
Ann
u. R
ev. N
ucl.
Part
. Sci
. 200
7.57
:205
-243
. Dow
nloa
ded
from
ww
w.a
nnua
lrev
iew
s.or
gby
Uni
vers
ity o
f C
alif
orni
a -
Dav
is o
n 11
/22/
11. F
or p
erso
nal u
se o
nly.

ANRV326-NS57-08 ARI 14 September 2007 15:14
RA
A(p
T >
6.0
GeV
/c)
Npart
0
0.5
1.0
1.5
2.0 200 GeV Au+Au direct photon
200 GeV Au+Au π0
0 50 100 150 200 250 300 350
Figure 23Nuclear modification factorRAA in Au+Au collisions at√
sNN = 200 GeV fordirect-photon andneutral-pion yieldsintegrated above pT = 6GeV/c as a function of Npart(73). The dashed linesindicate the systematicuncertainties of 〈TAB〉f usedin the calculation of RAA.Figure adapted withpermission from Reference73.
where the averaging is done for all A+B collisions with at least one inelastic nucleon-nucleon collision and whose simulated centrality variable belongs to centrality class f.
To quantify nuclear effects on particle production in hard scattering processes, thenuclear modification factor RAB(pT) is defined as
RAB(pT) =(N AB
inel
)−1 dN ABx /dpT
〈TAB〉f dσppx /dpT
. 27.
At high pT (pT ≥ 2−3 GeV/c for hadrons and pT ≥ 4−6 GeV/c for direct photons),particle production is expected to be dominated by hard processes such that, in theabsence of nuclear effects, RAB should be unity. Owing to their electromagnetic na-ture, high-pT direct photons are essentially unaffected by the hot and dense mediumproduced in an A+B collision so that they should exhibit TAB scaling (Figure 23).Direct photons indeed follow TAB scaling over the entire centrality range, whereasneutral pions are strongly suppressed in central collisions. This is one of the majordiscoveries at RHIC. The direct-photon measurement is an experimental proof ofTAB scaling of hard processes in A+B collisions. With this observation, the most nat-ural explanation for the suppression of high-pT neutral pions is energy loss of partonsfrom hard scattering in a QGP ( jet quenching) (5–8).
4.3. Eccentricity and Relation to Elliptic Flow
Hydrodynamic calculations suggest that spatial asymmetries in the initial state aremapped directly into in the final-state momentum distribution. At midrapidity, theseanisotropies are manifest in the azimuthal (φ) distributions of inclusive and identifiedcharged particles, with the modulation of dN/dφ ∼ 1 + 2v2 cos[2(φ − R)] char-acterized by the second Fourier coefficient v2, where R defines the angle of thereaction plane for a given event. It is generally assumed that v2 is proportional to theevent eccentricity ε, which was introduced above. Glauber calculations are used toestimate the eccentricity, for either an ensemble of events or on an event-by-eventbasis.
www.annualreviews.org • Glauber Modeling in High-Energy Nuclear Collisions 235
Ann
u. R
ev. N
ucl.
Part
. Sci
. 200
7.57
:205
-243
. Dow
nloa
ded
from
ww
w.a
nnua
lrev
iew
s.or
gby
Uni
vers
ity o
f C
alif
orni
a -
Dav
is o
n 11
/22/
11. F
or p
erso
nal u
se o
nly.

ANRV326-NS57-08 ARI 14 September 2007 15:14
For much of the RHIC program, both calculations were typically carried outin the standard reference frame, with the x-axis oriented along the reaction plane.Using this calculation method was apparently sufficient to compare hydrodynamiccalculations with Au+Au data. However, it was always noticed that the most centralevents, which should trend to ε = 0, tended to have a significant v2 value. This ledto the study of the participant eccentricity, calculated with the x-axis oriented alongthe short principal axis of the approximately elliptical distribution of participants ina Monte Carlo approach (56), described above.
Figure 24, taken from Reference 74, shows v2—the second Fourier coefficient[〈cos(2[φ − R])〉] of the inclusive particle yield relative to the estimated reaction
ν 2/⟨ε
std⟩
b
ν 2/⟨ε
par
t⟩
c
0 100 200 300
Npart
62.4 GeV Au+Au h± 200 GeV Cu+Cu h±
ν 2a
200 GeV Au+Au h±
62.4 GeV Cu+Cu h±
ν
0.5
0
0
1.0
1.5
0
0.1
0.2
0.3
0.4
0.02
0.04
0.06
0.08Figure 24(a) PHOBOSmeasurements (74) of v2for 62.4 and 200 GeVCu+Cu and Au+Aucollisions (foursystem-energycombinations in all). v2divided by standardeccentricity (b) and v2divided by participanteccentricity (c), showingan approximate scaling forall the system-energycombinations. Figureadapted with permissionfrom Reference 74.
236 Miller et al.
Ann
u. R
ev. N
ucl.
Part
. Sci
. 200
7.57
:205
-243
. Dow
nloa
ded
from
ww
w.a
nnua
lrev
iew
s.or
gby
Uni
vers
ity o
f C
alif
orni
a -
Dav
is o
n 11
/22/
11. F
or p
erso
nal u
se o
nly.

ANRV326-NS57-08 ARI 14 September 2007 15:14
plane angle—as a function of Npart. In hydrodynamic models, v2 is proportional tothe eccentricity, suggesting that v2/ε should be a scaling variable. Although the rawvalues of v2 as a function of Npart peak at similar levels in Au+Au and Cu+Cu, dividingby the standard eccentricity makes the two data sets diverge. However, dividing byεpart shows that the two systems have similar v2/εpart at the same Npart. This showsthat the participant eccentricity, a quantity calculated in a simple GMC approach,drives the hydrodynamic evolution of the system for very different energies andgeometries.
4.4. Eccentricity Fluctuations
As described above, one of the most spectacular measurements at RHIC was the largevalue of elliptic flow in Au+Au collisions, suggestive of a Perfect Liquid. After theinitial measurement (75), much attention was given to potential biases that couldartificially inflate the extraction of v2 from the data, such as nonflow effects (e.g.,correlations from jet fragmentation, resonance decay) and event-by-event fluctuationsin v2. Reference 32 was one of the first analyses to study the effects of fluctuationson extraction of v2. Using the assumption v2 ∼ εstd, fluctuations in εstd were studiedusing a GMC calculation and comparing 〈εn
std〉 to 〈εstd〉n. Fluctuations were foundto play a significant role, where different methods of extraction (e.g., two-particleversus higher-order cumulants) gave results differing by as much as a factor of two,with the most significant differences found for the most central (0%–5%) and mostperipheral (60%–80%) event classes.
Recently, in References 53 and 76, the STAR and PHOBOS collaborations havereported measurements of not only 〈v2〉, but also the rms width σv2 . Figure 25 showsthe distribution of σv2/〈v2〉 versus 〈b〉 from Au+Au data. The measurements arecompared with calculations from various dynamical models as well as GMC calcula-tions using both σεstd/〈εstd〉 and σεpart/〈εpart〉. Clearly, the εstd description is ruled out,whereas the εpart description is in good agreement within the measured uncertainties,implying that the measurements are sensitive to the initial conditions. The agreementwith the εpart Glauber calculation further implies that the measured v2 fluctuationsare fully accounted for by the fluctuations in the initial geometry, leaving little roomfor other sources (e.g., Color Glass Condensate). We note that these analyses arenew and the physics conclusions are far from final. However, this is another excellentexample in which Glauber calculations are critical for interpreting RHIC data.
4.5. J/ψ Absorption in Normal Nuclear Matter
Owing to the large mass of the charm quark, c c pairs are expected to be produced onlyin hard processes in the initial phase of an A+B collision. The production rate forc c pairs is thus calculable within perturbative QCD, which makes them a calibratedprobe of later stages of a heavy ion collision. In particular, workers suggested thatfree color charges in a QGP could prevent the formation of a J/ψ from the initiallyproduced c c pairs so that J/ψ suppression was initially considered a key signatureof a QGP formation (77). However, a suppression of J/ψ s relative to the expected
www.annualreviews.org • Glauber Modeling in High-Energy Nuclear Collisions 237
Ann
u. R
ev. N
ucl.
Part
. Sci
. 200
7.57
:205
-243
. Dow
nloa
ded
from
ww
w.a
nnua
lrev
iew
s.or
gby
Uni
vers
ity o
f C
alif
orni
a -
Dav
is o
n 11
/22/
11. F
or p
erso
nal u
se o
nly.

ANRV326-NS57-08 ARI 14 September 2007 15:14
⟨ν2⟩
Impact parameter ⟨b⟩ (fm)
σ ν2/⟨ν
2⟩
Rel
ativ
e fl
uct
uat
ion
s
a
b
0.6
0.4
0.2
00 100 200 300
PHOBOS preliminary
Npart
Star preliminary: sNN
= 200 GeV Au+Au
0
0.05
0
0.05
1.00
0 2 4 6 8 10 12 14
NeXSPheRIO
RG EOS
QGP EOSStandard
Participant
σε /⟨ε⟩ Glauber Monte Carlo
ν2 = 0.034 x ε
part x (dN)–3
dyσν
2
σεpart
⟨ν2⟩
⟨εpart
⟩
data
Glauber Monte Carlo
Figure 25(a) Elliptic-flow mean value (top) and rms width scaled by the mean (bottom), as measured bySTAR, compared with various dynamical models and a Glauber Monte Carlo calculation (53).(b) Gaussian width of v2 divided by mean v2 from PHOBOS (76). Figure adapted withpermission from References 53 and 76.
production rate for hard processes was already seen in p+A collisions. Thus, it becameclear that the conventional J/ψ suppression in p+A collisions needed to be quantifiedand extrapolated to A+B collisions before any conclusions could be drawn about apossible QGP formation in A+B collisions. Cold nuclear matter effects, which affectJ/ψ production, include the modification of the parton distribution in the nucleus(shadowing) and the absorption of preresonant c c pairs (78). For the extrapolation ofthe latter effect from p+A to A+A collisions, the Glauber model is frequently used(79), as described in the following.
We first concentrate on p+A collisions (Figure 26). Conventional J/ψ suppres-sion is thought to be related to the path along the z-axis in normal nuclear matterthat a preresonant c c pair created at point (b, zA) needs to travel. Because the c cpair is created in a hard process, the location of its production is indeed rather welldefined. Usually the effects of processes that inhibit the formation of a J/ψ from thepreresonant c c pair are parameterized with a constant absorption cross section σabs.Furthermore, formation-time effects are often neglected. Under these assumptions,the probability for the breakup of a preresonant c c state created at (b, zA) in a collision
238 Miller et al.
Ann
u. R
ev. N
ucl.
Part
. Sci
. 200
7.57
:205
-243
. Dow
nloa
ded
from
ww
w.a
nnua
lrev
iew
s.or
gby
Uni
vers
ity o
f C
alif
orni
a -
Dav
is o
n 11
/22/
11. F
or p
erso
nal u
se o
nly.
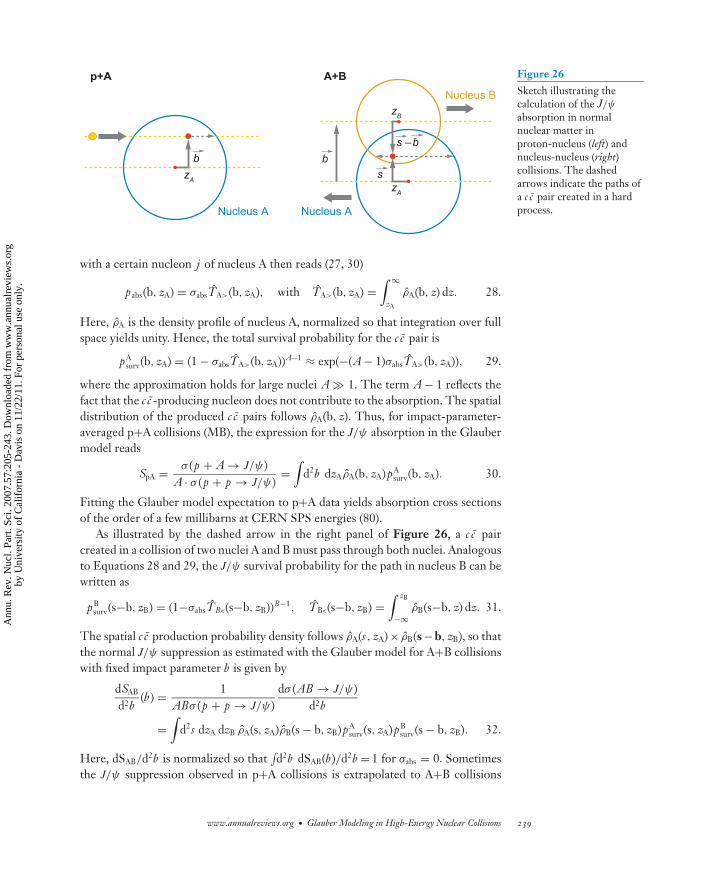
ANRV326-NS57-08 ARI 14 September 2007 15:14
b b
bs –
s
p+A A+B
zA
zA
zB
Nucleus A Nucleus A
Nucleus B
Figure 26Sketch illustrating thecalculation of the J/ψ
absorption in normalnuclear matter inproton-nucleus (left) andnucleus-nucleus (right)collisions. The dashedarrows indicate the paths ofa c c pair created in a hardprocess.
with a certain nucleon j of nucleus A then reads (27, 30)
pabs(b, zA) = σabsTA>(b, zA), with TA>(b, zA) =∫ ∞
zA
ρA(b, z) dz. 28.
Here, ρA is the density profile of nucleus A, normalized so that integration over fullspace yields unity. Hence, the total survival probability for the c c pair is
pAsurv(b, zA) = (1 − σabsTA>(b, zA))A−1 ≈ exp(−(A − 1)σabsTA>(b, zA)), 29.
where the approximation holds for large nuclei A 1. The term A − 1 reflects thefact that the c c -producing nucleon does not contribute to the absorption. The spatialdistribution of the produced c c pairs follows ρA(b, z). Thus, for impact-parameter-averaged p+A collisions (MB), the expression for the J/ψ absorption in the Glaubermodel reads
SpA = σ (p + A → J/ψ)A · σ (p + p → J/ψ)
=∫
d2b dzAρA(b, zA)pAsurv(b, zA). 30.
Fitting the Glauber model expectation to p+A data yields absorption cross sectionsof the order of a few millibarns at CERN SPS energies (80).
As illustrated by the dashed arrow in the right panel of Figure 26, a c c paircreated in a collision of two nuclei A and B must pass through both nuclei. Analogousto Equations 28 and 29, the J/ψ survival probability for the path in nucleus B can bewritten as
pBsurv(s−b, zB) = (1−σabsTB<(s−b, zB))B−1, TB<(s−b, zB) =
∫ zB
−∞ρB(s−b, z) dz. 31.
The spatial c c production probability density follows ρA(s , zA)× ρB(s−b, zB), so thatthe normal J/ψ suppression as estimated with the Glauber model for A+B collisionswith fixed impact parameter b is given by
dSAB
d2b(b) = 1
ABσ (p + p → J/ψ)dσ (AB → J/ψ)
d2b
=∫
d2s dzA dzB ρA(s, zA)ρB(s − b, zB)pAsurv(s, zA)pB
surv(s − b, zB). 32.
Here, dSAB/d2b is normalized so that∫d2b dSAB(b)/d2b = 1 for σabs = 0. Sometimes
the J/ψ suppression observed in p+A collisions is extrapolated to A+B collisions
www.annualreviews.org • Glauber Modeling in High-Energy Nuclear Collisions 239
Ann
u. R
ev. N
ucl.
Part
. Sci
. 200
7.57
:205
-243
. Dow
nloa
ded
from
ww
w.a
nnua
lrev
iew
s.or
gby
Uni
vers
ity o
f C
alif
orni
a -
Dav
is o
n 11
/22/
11. F
or p
erso
nal u
se o
nly.

ANRV326-NS57-08 ARI 14 September 2007 15:14
within the Glauber framework by calculating an effective path length L = LA + LB
so that the expected normal J/ψ suppression can be written as (79–81)
SAB = exp(−Lρ0σabs), 33.
where ρ0 = 0.17 fm−1 is the nucleon density in the center of heavy nuclei. At theCERN SPS, a suppression stronger than expected from the absorption in cold nuclearmatter has been observed in central Pb+Pb collisions (81). This so-called anomalousJ/ψ suppression has been discussed as a potential signal for a QGP formation at theCERN SPS energy.
5. DISCUSSION AND THE FUTURE
The Glauber model as used in ultrarelativistic heavy ion physics is based purely onnuclear geometry. What is left from its origin as a quantum-mechanical multiple-scattering theory is the assumption that A+B collisions can be viewed as sequenceof nucleon-nucleon collisions and that individual nucleons travel on straight-linetrajectories. With the number of participants Npart and the number of binary nucleon-nucleon collisions Ncoll, the Glauber model introduces quantities that are essentiallynot measurable. Only the forward energy in fixed-target experiments has a ratherdirect relation to Npart.
The motivation for using these rather theoretical quantities is manifold. One mainreason for using geometry-related quantities such as Npart calculated with the Glaubermodel is the possibility of comparing centrality-dependent observables measured indifferent experiments. Moreover, the comparison of a different reaction system as afunction of geometric quantities often leads to new insights. Basically all experimentscalculate Npart and Ncoll in a similar way using a Monte Carlo implementation of theGlauber model so that the theoretical bias introduced in the comparisons is typicallysmall. Thus, the Glauber model provides a crucial interface between theory andexperiment.
The widespread use of the Glauber model is related to the fact that indeed manyaspects of ultrarelativistic A+B collisions can be understood purely based on geome-try. A good example is the total charged-particle multiplicity that scales as Npart over awide centrality and center-of-mass energy range. Another example is the anisotropicmomentum distribution of low-pT (pT < ∼2 GeV/c ) particles with respect to thereaction plane. This so-called elliptic flow has its origin in the spatial anisotropy ofthe initial overlap volume in noncentral A+B collisions. It is a success of the Glaubermodel that event-by-event fluctuations of the spatial anisotropy of the overlap zoneas calculated in the Monte Carlo approach appear to be relevant for understandingthe measured elliptic flow. In this way, a precise understanding of the Glauber picturehas been of central concern for understanding the matter produced at RHIC as a nearperfect fluid.
The study of particle production in hard scattering processes is another importantfield of application for the Glauber model. According to the QCD factorizationtheorem, the only difference between p+p and A+A collisions in the perturbativeQCD description in the absence of nuclear effects is the increased parton flux. This
240 Miller et al.
Ann
u. R
ev. N
ucl.
Part
. Sci
. 200
7.57
:205
-243
. Dow
nloa
ded
from
ww
w.a
nnua
lrev
iew
s.or
gby
Uni
vers
ity o
f C
alif
orni
a -
Dav
is o
n 11
/22/
11. F
or p
erso
nal u
se o
nly.

ANRV326-NS57-08 ARI 14 September 2007 15:14
corresponds to a scaling of the invariant particle yields with Ncoll as calculated withthe Glauber model. The scaling of hard processes with Ncoll or TAB was confirmedby the measurement of high-pT direct photons in Au+Au collisions at RHIC. Thissupported the interpretation of a deviation from TAB scaling for neutral pions andother hadrons (high-pT hadron suppression) as a result of parton energy loss in aQGP.
Future heavy ion experiments, both at RHIC and at the LHC, will further push ourunderstanding of nuclear geometry. As the RHIC experiments study more complexmultiparticle observables, the understanding of fluctuations and correlations even insomething as apparently simple as the GMC will become a limiting factor in inter-preting data. And as the study of high-pT phenomena involving light and heavy flavorsbecomes prominent in the RHIC II era, the understanding of nuclear geometry, bothexperimentally and theoretically, will limit the experimental systematic errors. At theLHC, the precision of the geometric calculations will be limited by the knowledgeof σ NN
inel , which should be measured in the first several years of the p+p program.After that, Glauber calculations will be a central part of understanding the baselinephysics of heavy ions at the LHC in terms of nuclear geometry. We hope this reviewwill prepare the next generation of relativistic heavy ion physicists for tackling theseissues.
DISCLOSURE STATEMENT
The authors are not aware of any biases that might be perceived as affecting theobjectivity of this review.
ACKNOWLEDGMENTS
The authors would like to thank our colleagues for illuminating discussions, espe-cially Mark Baker, Andrzej Bialas, Wit Busza, Patrick Decowski, Jamie Dunlop, RoyGlauber, Ulrich Heinz, Constantin Loizides, Steve Manly, Alexander Milov, DaveMorrison, Jamie Nagle, Mike Tannenbaum, and Thomas Ullrich. We would like tothank the editorial staff of Annual Reviews for their advice and patience. M.L.M.acknowledges the support of the MIT Pappalardo Fellowship in Physics. This workwas supported in part by the Office of Nuclear Physics of the U.S. Departmentof Energy under contracts DE-AC02-98CH10886, DE-FG03-96ER40981, andDE-FG02-94ER40818.
LITERATURE CITED
1. Czyz W, Maximon LC. Ann. Phys. 52:59 (1969)2. Glauber RJ. In Lectures in Theoretical Physics, ed. WE Brittin, LG Dunham, 1:315.
New York: Interscience (1959)3. Bialas A, Bleszynski M, Czyz W. Acta Physiol. Pol. B 8:389 (1977)4. Back BB, et al. Phys. Rev. Lett. 85:3100 (2000)5. Arsene I, et al. Nucl. Phys. A 757:1 (2005)
www.annualreviews.org • Glauber Modeling in High-Energy Nuclear Collisions 241
Ann
u. R
ev. N
ucl.
Part
. Sci
. 200
7.57
:205
-243
. Dow
nloa
ded
from
ww
w.a
nnua
lrev
iew
s.or
gby
Uni
vers
ity o
f C
alif
orni
a -
Dav
is o
n 11
/22/
11. F
or p
erso
nal u
se o
nly.

ANRV326-NS57-08 ARI 14 September 2007 15:14
6. Adcox K, et al. Nucl. Phys. A 757:184 (2005)7. Back BB, et al. Nucl. Phys. A 757:28 (2005)8. Adams J, et al. Nucl. Phys. A 757:102 (2005)9. Adler C, et al. Nucl. Instrum. Methods A 470:488 (2001)
10. Franco V, Glauber RJ. Phys. Rev. 142:1195 (1966)11. Glauber RJ. Phys. Rev. 100:242 (1955)12. Czyz W, Lesniak L. Phys. Lett. B 24:227 (1967)13. Fishbane PM, Trefil JS. Phys. Rev. Lett. 32:396 (1974)14. Franco V. Phys. Rev. Lett. 32:911 (1974)15. Bialas A, Bleszynski M, Czyz W. Nucl. Phys. B 111:461 (1976)16. Glauber RJ. Nucl. Phys. A 774:3 (2006)17. Ludlam TW, Pfoh A, Shor A. HIJET. A Monte Carlo Event Generator for P
Nucleus and Nucleus Nucleus Collisions. Brookhaven Natl. Lab. Tech. Rep. BNL-51921, Brookhaven Natl. Lab., Upton, N.Y. (1985)
18. Shor A, Longacre RS. Phys. Lett. B 218:100 (1989)19. Wang XN, Gyulassy M. Phys. Rev. D 44:3501; code HIJING 1.383 (1991)20. Werner K. Phys. Lett. B 208:520 (1988)21. Sorge H, Stoecker H, Greiner W. Nucl. Phys. A 498:567C (1989)22. Collard HR, Elton LRB, Hofstadter R. In Landolt-Bornstein, Numerical Data
and Functional Relationships in Science and Technology, Vol. 2: Nuclear Radii, ed. HSchopper, p. 1. Berlin: Springer-Verlag. 54 pp. (1967)
23. De Jager CW, De Vries H, De Vries C. Atom. Data Nucl. Data Tabl. 36:495 (1987)24. Hulthen L, Sagawara M. Handb. Phys. 39:1 (1957)25. Hodgson PE. In Nuclear Reactions and Nuclear Structure, p. 453. Oxford:
Clarendon. 661 pp. (1971)26. Adler SS, et al. Phys. Rev. Lett. 91:072303 (2003)27. Wong CY. In Introduction to High-Energy Heavy-Ion Collisions, p. 251. Singapore:
World Sci. 516 pp. (1994)28. Chauvin J, Bebrun D, Lounis A, Buenerd M. Phys. Rev. C. 83:1970 (1983)29. Wibig T, Sobczynska D. J. Phys. G 24:2037 (1998)30. Kharzeev D, Lourenco C, Nardi M, Satz H. Z. Phys. C 74:307 (1997)31. Pi H. Comput. Phys. Commun. 71:173 (1992)32. Miller M, Snellings R. nucl-ex/0312008 (2003)33. Alver B, et al. Phys. Rev. Lett. 96:212301 (2006)34. Guillaud JP, Sobol A. Simulation of diffractive and non-diffractive processes at
the LHC energy with the PYTHIA and PHOJET MC event generators. CNRSTech. Rep. LAPP-EXP 2004–06, CNRS, Paris, France (2004)
35. Sjostrand T, Mrenna S, Skands P. JHEP 0605:026 (2006)36. Yao YM, et al. J. Phys. G 33:1 (2006)37. Adamczyk M, et al. Nucl. Instrum. Methods A 499:437 (2003)38. Allen M, et al. Nucl. Instrum. Methods A 499:549 (2003)39. Back BB, et al. Nucl. Instrum. Methods A 499:603 (2003)40. Braem A, et al. Nucl. Instrum. Methods A 499:720 (2003)41. Ansorge RE, et al. Z. Phys. C 43:357 (1989)42. Kharzeev D, Nardi M. Phys. Lett. B 507:121 (2001)
242 Miller et al.
Ann
u. R
ev. N
ucl.
Part
. Sci
. 200
7.57
:205
-243
. Dow
nloa
ded
from
ww
w.a
nnua
lrev
iew
s.or
gby
Uni
vers
ity o
f C
alif
orni
a -
Dav
is o
n 11
/22/
11. F
or p
erso
nal u
se o
nly.

ANRV326-NS57-08 ARI 14 September 2007 15:14
43. Adler C, et al. Phys. Rev. Lett. 89:202301 (2002)44. Bearden IG, et al. Phys. Lett. B 523:227 (2001)45. Bearden IG, et al. Phys. Rev. Lett. 88:202301 (2002)46. Arsene I, et al. Phys. Rev. Lett. 94:032301 (2005)47. Lee YK, et al. Nucl. Instrum. Methods A 516:281 (2004)48. Appl. Softw. Group. GEANT detector description and simulation tool. w5013 edi-
tion, http://wwwasdoc.web.cern.ch/wwwasdoc/geant html3/geantall.html.Geneva: CERN (1993)
49. Adler SS, et al. Phys. Rev. C 71:034908 (2005). Erratum. Phys. Rev. C 71:049901(2005)
50. Aronson SH, et al. Nucl. Instrum. Methods A 499:480 (2003)51. Adams J, et al. Phys. Rev. C 70:044901 (2004)52. Adams J, et al. Phys. Rev. Lett. 91:172302 (2003)53. Sorensen P. nucl-ex/0612021 (2006)54. Adams J, et al. Phys. Rev. Lett. 91:072304 (2003)55. Aggarwal MM, et al. Eur. Phys. J. C 18:651 (2001)56. Manly S, et al. Nucl. Phys. A 774:523 (2006)57. Back BB, et al. Phys. Rev. Lett. 91:052303 (2003)58. Back BB, et al. Phys. Rev. C 74:021901 (2006)59. Back BB, et al. Phys. Rev. C 74:021902 (2006)60. Back BB, et al. Phys. Rev. C 65:031901 (2002)61. Elias JE, et al. Phys. Rev. Lett. 41:285 (1978)62. Adams J, et al. nucl-ex/0311017 (2003)63. Eskola KJ, Kajantie K, Ruuskanen PV, Tuominen K. Nucl. Phys. B 570:379 (2000)64. Back BB, et al. Phys. Rev. C. 70:021902 (2004)65. Back BB, et al. Phys. Rev. C 65:061901 (2002)66. Eskola KJ, Kajantie K, Lindfors J. Nucl. Phys. B 323:37 (1989)67. Eskola KJ, Vogt R, Wang XN. Int. J. Mod. Phys. A 10:3087 (1995)68. Vogt R. Heavy Ion Phys. 9:339 (1999)69. Arleo F, et al. hep-ph/0311131 (2003)70. Jacobs P, Wang XN. Prog. Part. Nucl. Phys. 54:443 (2005)71. Tannenbaum MJ. nucl-ex/0611008 (2006)72. Owens JF. Rev. Mod. Phys. 59:465 (1987)73. Adler SS, et al. Phys. Rev. Lett. 94:232301 (2005)74. Alver B, et al. nucl-ex/0610037 (2006)75. Ackermann KH, et al. Phys. Rev. Lett. 86:402 (2001)76. Alver B, et al. nucl-ex/0702036 (2006)77. Matsui T, Satz H. Phys. Lett. B 178:416 (1986)78. Vogt R. Phys. Rep. 310:197 (1999)79. Gerschel C, Hufner J. Annu. Rev. Nucl. Part. Sci. 49:255 (1999)80. Alessandro B, et al. Eur. Phys. J. C 33:31 (2004)81. Alessandro B, et al. Eur. Phys. J. C 39:335 (2005)
www.annualreviews.org • Glauber Modeling in High-Energy Nuclear Collisions 243
Ann
u. R
ev. N
ucl.
Part
. Sci
. 200
7.57
:205
-243
. Dow
nloa
ded
from
ww
w.a
nnua
lrev
iew
s.or
gby
Uni
vers
ity o
f C
alif
orni
a -
Dav
is o
n 11
/22/
11. F
or p
erso
nal u
se o
nly.