glaciochemical studies and estimated net mass balances for
TRANSCRIPT

The University of MaineDigitalCommons@UMaine
Earth Science Faculty Scholarship Earth Sciences
1985
Glaciochemical Studies and Estimated Net MassBalances for Rennick Glacier Area, AntarcticaBoyd Allen III
Paul Andrew MayewskiUniversity of Maine, [email protected]
W. Berry Lyons
Mary Jo Spencer
Follow this and additional works at: https://digitalcommons.library.umaine.edu/ers_facpub
Part of the Geomorphology Commons, Glaciology Commons, and the Hydrology Commons
This Article is brought to you for free and open access by DigitalCommons@UMaine. It has been accepted for inclusion in Earth Science FacultyScholarship by an authorized administrator of DigitalCommons@UMaine. For more information, please [email protected].
Repository CitationAllen, Boyd III; Mayewski, Paul Andrew; Lyons, W. Berry; and Spencer, Mary Jo, "Glaciochemical Studies and Estimated Net MassBalances for Rennick Glacier Area, Antarctica" (1985). Earth Science Faculty Scholarship. 203.https://digitalcommons.library.umaine.edu/ers_facpub/203
Annals of Glaciology 7 1985 © International Glaciological Society
GLACIOCHEMICAL STUDIES AND ESTIMATED NET MASS BALANCES
FOR RENNICK GLACIER AREA, ANTARCTICA
by
Boyd Alien Ill, Paul A. Mayewski*, W. Berry Lyons and Mary 10 Spencer
(Glacier Research Group, Department of Earth Sciences, University of New Hampshire, Durham, New Hampshire 03824, U.S.A.)
ABSTRACT Two snow and ice cores from the Rennick Glacier
area, Antarctica (study area center point lat 71 ·15'S, long 162 ·30' E) were analyzed for the chemical species: chloride, sodium, reactive silicate, sulfate and nitrate . Core EIO (6.35 m) was taken from Evans Neve, a large accumulation basin at the head of Rennick Glacier. Core MI (4.35 m) was extracted from the accumulation zone on the central plateau of the Morozumi Range, a smal l mountain massif bordering Rennick Glacier. Cores EIO and MI span the time periods from 1929 to 1981 and from 1971 to 1981, respectively, as dated using seasonal variations in chloride (EI0) and sulfate (MI) concentrations . An estimated net balance of 50 kg m- 2 a-I was derived for site EI0 and of 182 kg m- 2 a-I for site Ml. The difference in net mass balance may be explained by elevational differences (MI 1400 m a.s.l., EIO 2305 m a.s.l .). Recent (1973 to 1980) increases in sodium, silicate and sulfate at site EIO may be linked to decreases in Antarctic pack-ice extent (Kukla and Gavin 1981) for the same period.
INTRODUCTION AND BACKGROUND The Antarctic ice sheet is considered to be one of
the important driving forces behind global and atmospheric circulation (Weyant 1967). Consequently, any changes in the size of the ice masses comprising this ice
ROSS SEA
.(\
100 KM
--=- -170' 168 ' 166 '
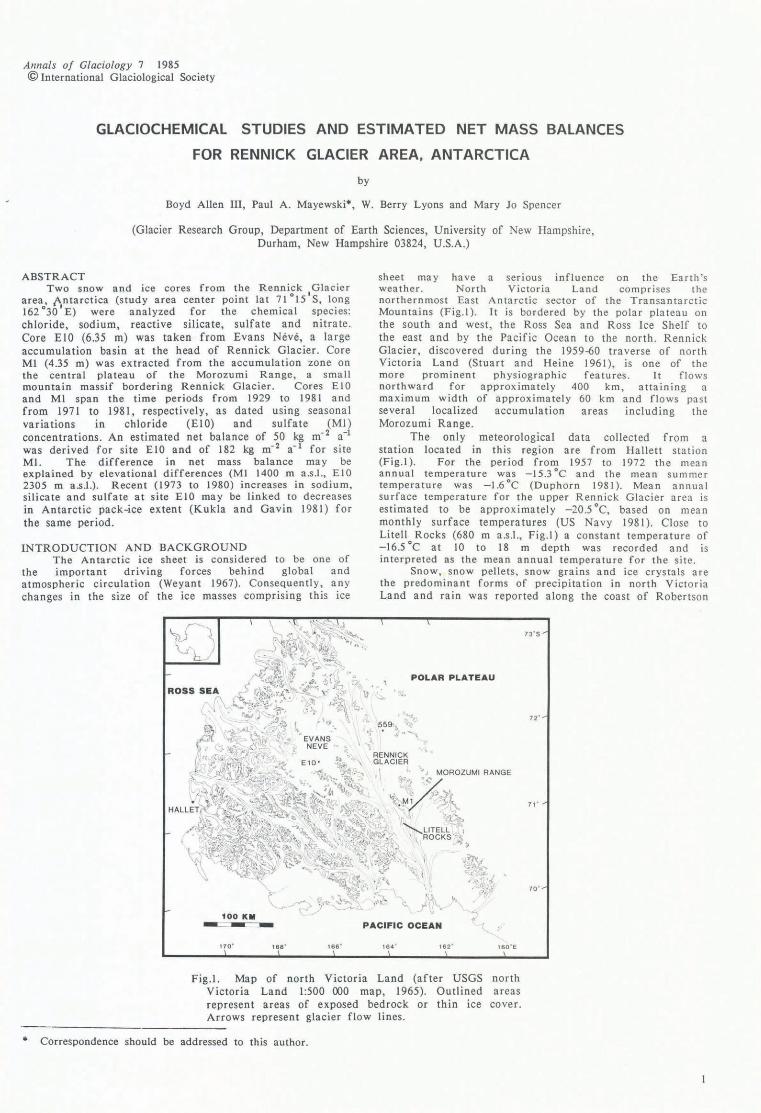
sheet may have a serious influence on the Earth's wea ther. North Victoria Land comprises th e northernmost East Antarctic sector of the Transantarctic Mountains (Fig.I). [t is bordered by the polar plateau on the south and west, the Ross Sea and Ross Ice Shelf to the east and by the Pacific Ocean to the north. Rennick Glacier, discovered during the 1959-60 traverse of north Victoria Land (Stuart and Heine 1961), is one of the more prominent physiographic features. It flows northward for approximately 400 km, attaining a maximum width of approximately 60 km and flows past several localized accumulation areas including the Morozumi Range.
The only meteorological data collected from a station located in this region are from Hallett station (Fig.I). For the period from 1957 to 1972 the mean annual temperature was -15.3·C and the mean summer temperature was -1.6·C (Duphorn 1981). Mean annual surface temperature for the upper Rennick Glacier area is estimated to be approximately -20.5·C, based on mean monthly surface tempera tures (US Navy 1981). Close to Litell Rocks (680 m a.s.l ., Fig.l) a constant temperature of -16.5·C at 10 to 18 m depth was recorded and is interpreted as the mean annual temperature for the site.
Snow, snow pellets, snow grains and ice crystals are the predominant forms of precipitation in north Victoria Land and rain was reported along the coast of Robertson
7 3 ' S
POLAR PLATEAU
7 2 '
,, '
70 '
PACIFIC OCEAN
164 ' 162 ' 160 ' E
Fig.1. Map of north Victoria Land (after USGS north Victoria Land 1:500 000 map, 1965). Outlined areas represent areas of exposed bedrock or thin ice cover. Arrows represent glacier flow lines.
--------------------* Correspondence should be addressed to this author.
Allen and others: Glaciochemistry alld mass balance. Rennick Glacier
Bay twice in January during the 1979-80 German Northern Victoria Land Expedition (GANOVEX) (Duphorn 1981). Annual snowfall at Hallett averages about 183 kg m- 2 a- 1
with the maximum monthly snowfall in March and the minImum in November (Duphorn 1981). Glaciochemical methods have been used successfully for dating purposes in other sections of Antarctica (Herron 1982[a]), nota bl y the Ross Ice Shelf, East Antarctica (Delmas and Boutron 1980) and the Antarctic Peninsula (Aristarain and others 1982). As such, they were employed in this study in order to estimate the net mass balance and sources of moisture feeding the Rennick Glacier region for purposes of glaciological reconstruction, and as a test of whether or not this technique is feasible in such an area. The only other recorded net mass balance measurement for this region is 163 kg m- 2 a- 1 (Stuart and Heine 1961) at snow pit 559 (Fig.!).
METHODOLOGY In order to assess the net balance and determine
sources for air masses entering the study region two coring sites were chosen. Site EIO, 2305 m a.s.l., is in Evans Neve and site MI, 1400 m a.s.l., is in the Morozumi Range. The EIO site provides information concerning the accumulation feeding Rennick Glacier. The MI site, a localized accumulation basin closer to the coast than E 10, provides both a coastal comparison and a site from which to determine net mass balance and moisture sources for alpine glaciers flanking the Morozumi Range.
Methodology employed in this study is made up of five phases: recovery, transport, sectioning, analysis, and data reduction. All acrylic plastic cutters and scrapers used in this study, and the polystyrene jars used for sample storage, were triple-washed in Milli-QTM water (17.9 Ma cm).
Cores measuring 6.35 and 4.65 m at sites EIO and MI, respectively, were recovered using a SIPRE teflon-coated auger. Sites were approached from downwind. All personnel involved with recovery wore plastic gloves and particle masks, and workers involved with packaging of the core wore plastic suits as well. Once removed from the auger barrel, cores were placed on a Saran Wrap™-covered work area, measured, described, scraped with plastic scrapers, and triple-bagged in particle-free bags. The cores were shipped frozen to the University of New Hampshire and stored at -15°C.
Sectioning of the cores was performed in a cold room (-4 0c). A sampling interval of 0.04 m was selected wherever possible in order to provide subseasonal resolution of ion concentrations based on an estimated snow-Qccumulation rate for the study area of 163 kg m- 2 a-1 (Stuart and Heine 1961 ); however, breakage of the core during extraction did not always permit this interval. After sectioning with plastic cutters, densities were determined and the outer surfaces of the sections were removed by scraping. The sections were then put into polystyrene jars and stored in a freezer. Approximately 10 ml water equivalent was sectioned off each frozen sample and placed in a separate jar to be analyzed later by ion chromatography. The remaining sa mples were thawed and acidified with Ultrex ™ ultra pure nitric acid to approximately 1% by volume.
Sodium was analyzed by flame atomic absorption spectrometry using a Perkin-Elmer model 2280 instrument. Cesium chloride (ACS grade) solution was added to a final concentration of 2% in order to control ionization . Reactive silicate was determined colorimetrically using a Technicon AutoAnalyzer n™ (Glibert and Loder 1977). Sample containers were kept closed to minimize room contamination . Repeated blank studies determined room contributions to be less than 0.01 Ilffiol 1- 1 for sodium and silicate.
Chloride, sulfate and nitrate were determined simultaneously on a Dionex 10 ion chromatograph using a fast-run anion separation column, an eluent consisting of 0.003 mol NaHCO and 0.002 mol Na 2C03 and a 0.3 J,LS full-scale chart re~order setting. Three aliquots for each sample were injected with a gas-tight syringe (Hamilton) into a I ml sample loop. The ion chromatography was
2
performed in a class 100 clean laboratory at the Mellon Institute, Pittsburgh, Pennsylvania.
Standard deviations in Ilffiol 1- 1 for the analyses were: chloride 0.63, sodium 0.09, silicate 0.03, sulfate 0.04, and nitrate 0.01. Container blanks were created by filling polystyrene jars with Milli-QTM water (17.9 Ma cm) at the time of core-sectioning. These jars were placed in the same freezer as the samples and they underwent identical handling and analytical procedures. Mean blank concentrations in Ilffiol 1- 1 were: chloride 1.08, sodium 0.!3, silicate 0.04, sulfate 0.06, and nitrate 0.01. The high chloride blank is attributed to contamination by organic solvents during storage in Pittsburgh. Aristarain and others (1982) encountered similarly high chloride blanks and assumed there was organic solvent contamination of plastic vials.
Statistical analyses included spectral and cross-spectral analysis of the time series produced from each core, factor analysis and production of a correlation coefficient matrix. All statistical manipulations and tests were performed on a DEC-IO computer.
By using time-series analysis, a mathematical transformation is made on the chemical data sets to expose characteristic variations that might normally be masked by seasonal or other oscillatory effects. This technique has been used before on other glaciochemical data (Mayewski and others 1984). A regularly spaced data set (every 0.04 m downcore) for the chemical species and density was constructed from the EIO and MI analytical results and examined using a time-series program in the International Mathematical and Statistical Libraries (Release 9.!, IMSL Inc 1982) statistical package. The 0.04 m interval satisfies the Nyquist sampling theorem (Kelley 1976) for what was assumed to be a good estima te of the net mass ba lance for the region, 163 kg m- 2 a- 1 (Stuart and Heine 1961).
To determine the periodicity for each chemical species downcore, spectral density (power) was computed using a spectral analysis program in the IMSL package. (Power is the measure of how much of the variance exists at a particular frequency (Mayewski and others 1984).) Peaks in the power spectrum were used in the manual selection of maximum concentration peaks to be used as seasonal indicators.
Cross-spectral analysis was used to identify similar periodicities of different chemical species. The squared coherence in cross-spectral analysis is the proportional amount of spectral density in signal two (e.g. sodium concentrations) that could be predicted by signal one (e.g . chloride concentrations) using a linear regression that is frequency-dependent (Koopmans 1974). Thus, coherence is a measure of the exten t to which one time series is similar in trend to another and is analogous to a correlation coefficient. The phase at a particular frequency is the amount that one component leads another as a Fourier representation of the time series (Koopmans 1974). Confidence intervals for power peaks and coherence were selected usi ng ta bles in Koopma ns (1974) and Arkin (1962).
Principal component analysis using the Sta tistica I Package for the Social Sciences (Release 7-9, SPSS Inc 1981) was then used to evaluate the variance in chemical concentrations for each core. Principal component analysis has been used on other glaciochemical data from Antarctica (Boutron and Martin 1980) and is a form of factor analysis which characterizes the variance between measured variables by generating mathematical componen ts or factors common to all of the variables (Lewis and others 1983). The communality is the measure of the total variance explained by the factors. These factors are then intuitively related to physical processes or components (Van Epsen and Adams 1983).
Correlation coefficients which measure the linear relationships between two variables have also been used previously on Antarctic glaciochemical data (Boutron and Martin 1980) and were obtained using the SPSS factor analysis program.
For estimation of annual net mass balances, the cores are dated using seasonal concentration peaks. Because of the much lower precision in the density determination (8
Alien and others: Glaciochemistry and mass balance, Rennick Glacier
20
SULFATE (.,M/L)
OO~~~=¥~~~_-.J"
SILICATE (..-M/Ll
123 4
SODIUM ("Mill 0 3 8 8 12 24
:~ .~ ·re
NITRATE (.,M/L)
3 4
DENSITY (kg/m~) o 200 400 800
Ob
r
4
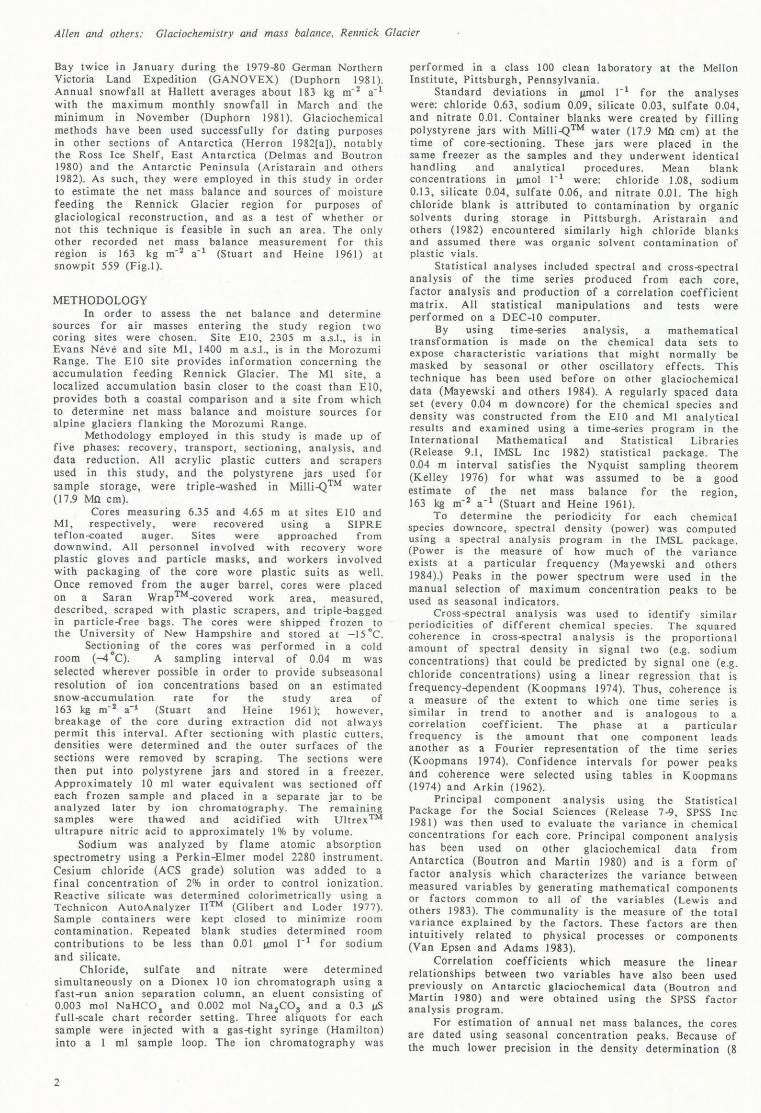
Fig.2(a). Chemical and density data for core from site EIO.
to 16%) as compared to the chemical analyses, individual sections of the core are not density-normalized, thus avoiding the introduction of additional error. Individual density values within each annual section of core are averaged and then multiplied by that core~ection length to arrive at an adjusted water-equivalent net mass balance. As the time~eries analysis was used only as an aid in the manual selection of concentration peaks, and in view of the low precision and relative similarity in density downcore (Figs.2(a) and (b», the data set for the statistical analyses was also not density-normalized for individual sections of the cores.
RESULTS AND DISCUSSION Analytical results (concentration in jLITIol I-I) are
presented in Table I and possible source types of the
CHLORIDE (.,M/ L) SODIUM (..-M / L)
0 5 10 15 20 33 0 5 10 15 30
.~ ~~- o~
I 2 - _ 2 -
4 4 j
SULFATE (..-M/ Ll NITRATE (..-M / L)
0 1 2 3 10 0 1 2 3 4 O ~~-~ 0 , ,
~ '1 ] -4 f
SILICATE (..-M / L) DENSIT Y (kg / m l )
2 3 4 10 20 o 200 400 800 o ,----,,-- ' ----'-------
2 -
4 -
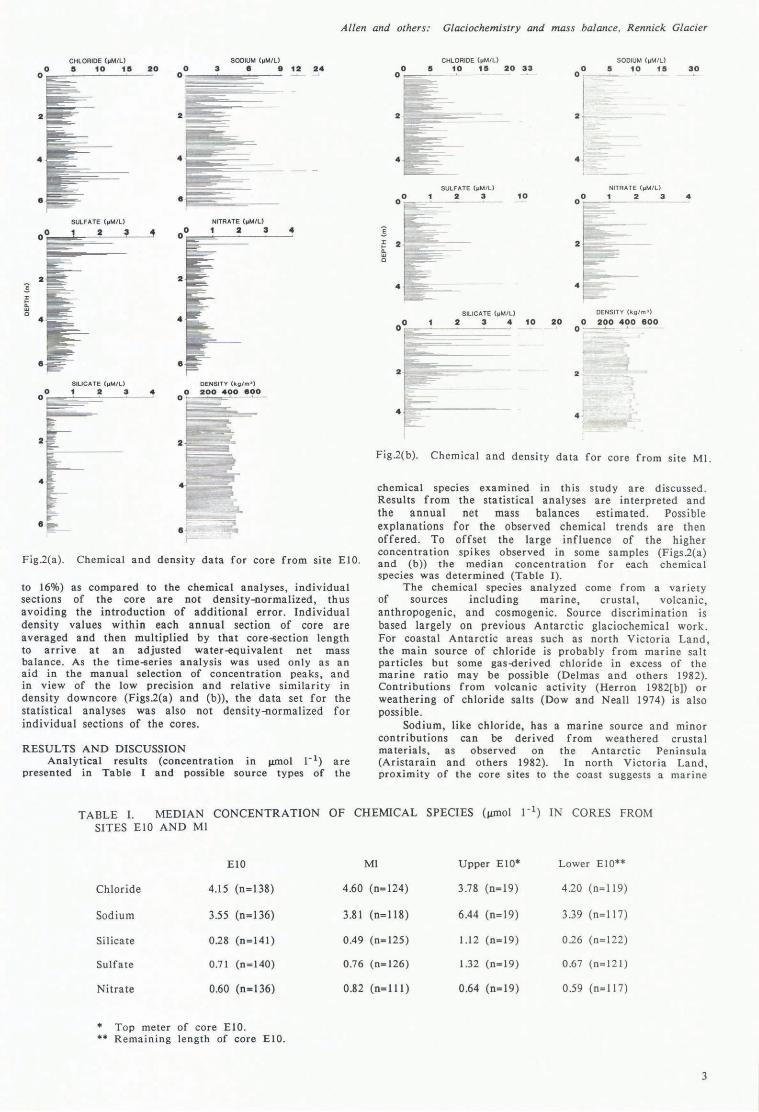
Fig.2(b). Chemical and density data for core from site Ml.
chemical species examined in this study are discussed. Results from the statistical analyses are interpreted and the annual net mass balances estimated. Possible expianations for the observed chemical trends are then offered. To offset the large influence of the higher concentration spikes observed in some samples (Figs.2(a) and (b» the median concentration for each chemical species was determined (Table I).
The chemical species analyzed come from a variety of sources including marine, crustal, volcanic, anthropogenic, and cosmogenic. Source discrimination is based largely on previous Antarctic giaciochemical work. For coastal Antarctic areas such as north Victoria Land , the main source of chloride is probably from marine salt particles but some gas-derived chloride in excess of the marine ratio may be possible (Delmas and others 1982). Contributions from volcanic activity (Herron 1982[b]) or weathering of chloride salts (Dow and Neall 1974) is also possible.
Sodium, like chloride, has a marine source and minor contributions can be derived from weathered crusta I materials, as observed on the Antarctic Peninsula (Aristarain and others 1982). In north Victoria Land, proximity of the core sites to the coast suggests a marine
TABLE I. MEDIAN CONCENTRATION OF CHEMICAL SPECIES (jJJllol 1-1) IN CORES FROM SITES El 0 AND MI
EI0 MI Upper EIO* Lower EI0**
Chloride 4.15 (n=138) 4.60 (n=124) 3.78 (n=19) 4.20 (n= 119)
Sodium 3.55 (n=136) 3.81 (n=118) 6.44 (n=19) 3.39 (n=117)
Silicate 0.28 (n=141) 0.49 (n=125) 1.12 (n=19) 0.26 (n=122)
Sulfate 0.71 (n=140) 0.76 (n=126) 1.32 (n=19) 0.67 (n=121)
Nitrate 0.60 (n= 136) 0.82 (n= 111) 0.64 (n=19) 0.59 (n= 117)
* Top meter of core EI0. ** Remaining length of core EIO.
3
AlIell alld others: Glaciochemistry and mass balance, Rennick Glacier
source for sodium, but rock exposure in the surrounding region (Fig.l), particularly at the southern end of the Morozumi Range, could provide a crusta I source. Silicate is derived primarily from crustal weathering products (Mayewski and Lyons 1982) such as the extremely weathered Beacon Supergroup which comprises more than 50% of the Morozumi Range a nd is found in the ice-free areas around the core sites .
Sources for sulfate in Antarctica include volcanic actiVity, sea-salt Injection and anthropogenic input (Herron 1982[b]), oxidation of marine gaseous compounds (Delmas and others 1982), and input of weathered salts (Dow and Neall 1974). Based on work at South Pole station by Delmas and Boutron (1980), anthropogenic input of sulfate to Antarctica is considered to be minimal. Delmas and others (1982) postulate a predominantly long-range, atmospherically transported aerosol source for sulfate. Mt Erebus on Ross Island continually emits a sulfate-rich plume (Radke 1982) and storm tracks (Dort 1968) could transport aerosol here to north Victoria Land. Thus, the main source of sulfate to the coring sites is probably long-range transport supplemented by volcanic emission.
Marine, volcanic, anthropogenic and cosmogenic sources have all been suggested as potential sources for nitrate in Antarctica (Zeller and Parker 198 1). These multiple sources of nitrate make it difficult to identify any principal origin, although Delmas and others (1982) consider most Antarctic nitrate to be from a d is tant source and to have undergone long-range, atmospheric transport.
Because multiple sources exist for several of the chemical species, correla tion and factor ana l ysis resu Its (Table 11) are used to suggest common input mechanisms for these species. In the EIO core significant correlation exists between the following species: chloride-sodium, sodium-silicate, sodium-sulfate, silicate-sulfate, and sulfate-nitrate. Factor analysis of EIO yielded two factors with factor I being interpreted as a cr ustal source because of the high factor loadings of sodium and silicate and their significant correlation wit h each oth er. Hig h loading of chloride and sodium on factor 2 suggests a marine input mechanism. T he even split of sulfate between factors I and 2 may be explained by so me sulfate arrlvmg with marine salts and the remainder mixing in with crusta I weathering products transported to the core site. The low nitrate variance explained by the factor analysis for EIO verifies the likelihood of eithe r multiple sources or a unique origin of nitrate u nrelated to the other chemical species.
In the MI core significant correlation (99%) exists only between sodium-silicate and sulfate-nitrate . The presence of sodium and chloride in factor I and correlation of sodium with silicate suggests that marine input could be related to crusta I input. This might be caused by intermixing of marine salts with crusta I weathering products. Since the input of cr usta I weathering products to the core site is believed to be continuo us, the association between these species might be used to suggest that marine salts are supplied to the site throughout most of the year. Loading of most of the sulfate and nitrate and half of the chloride on factor 2 implies a common source for these species which may be in the form of long-travelled gas-<lerived aerosols as observed at South Pole station (Delmas and others 1982).
At site EIO only chloride and sodium display any spectral power and only at an interval of 0.13 m. Cross-spectral analysis indicates that these two species occur in phase. The cyclical variations in chloride and sodium input are believed to be annual, because their marine source is modulated by the annual changes in sea ice. This idea is reinforced by Herron's (i 982[a]) documentation of their seasonal occurrence in samples from Ross Ice Shelf. The high chloride concentration peaks (Fig.2(a» were selected as annua l markers because more chloride data were available t han sodium data. This results in a record from 1929 to 1980 (Fig.3) with an estimated mean annual net mass balance of 50±2 kg m- 2 a-I Because error is estimated at ±0.02 m for each seasonal concentration maximum based on the
4
TABLE 11 . RESULTS OF FACTOR ANALYSIS FOR CORES FROM SITES EIO AND MI
EIO Factor loading
Factor Factor Communality I 2
Chlo ride 0.25 0.65 0.484
Sodium 0.30 0.67 0.532
Silicate 0.84 0.17 0.742
Sulfate 0.53 0.50 0.537
Nit ra te 0.10 0.26 0.076
% var ia nce 71.3 28 .7
MI Factor loading
Fac tor Factor Communality I 2
Ch loride 0.35 0.30 0.214
Sodium 0.53 0.07 0.289
Silicate 0.83 0.08 0.689
Sulfa te 0.24 0.67 0.511
Ni tra te - 0 .01 0.62 0.385
% va r iance 75.6 24.4
0.04 m sampling interval , and since two seasonal maxima are involved for dating purposes , error for each annual determ ina tion is calculated as ±0.04 m or 30%.
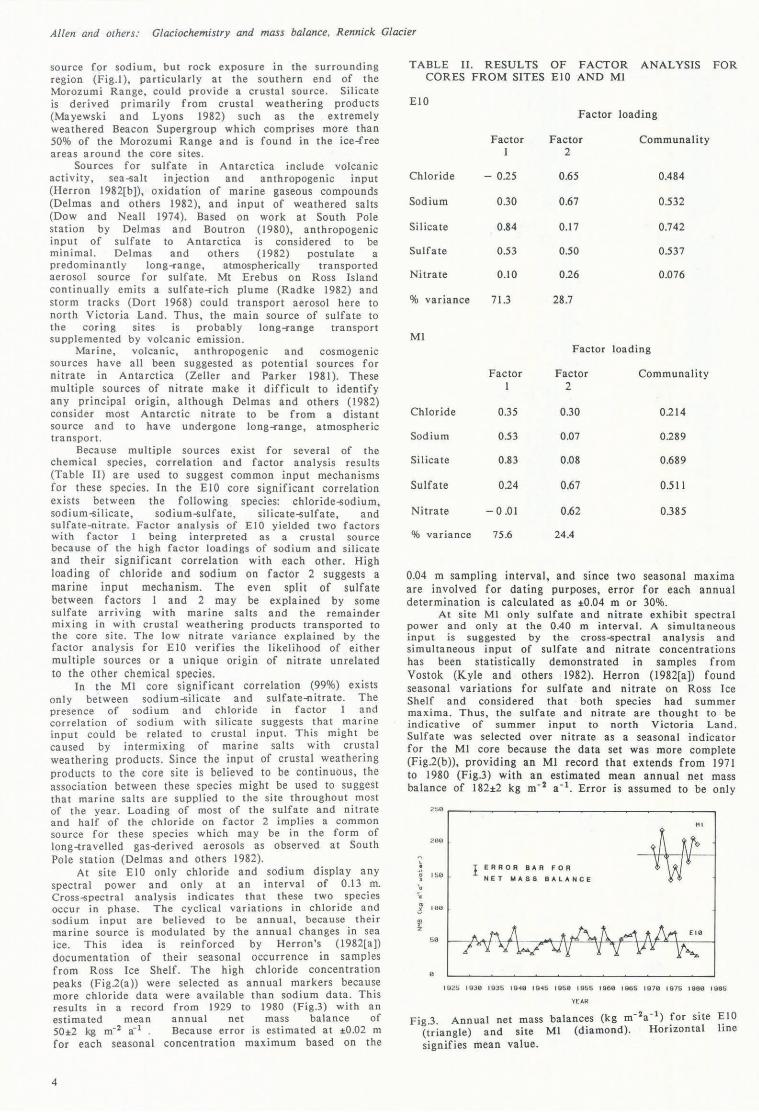
At site MI onl y sulfate and nitrate exhibi t spect ra l power a nd on ly at the 0.40 m interval. A simulta neo us inpu t is suggested by the cross-spectral anal ys is and simul ta neous input of sulfate and nitrate concentrations has been statis t ically demonstrated in samples from Vostok (K yle and others 1982). Herron (l98 2[aJ) f ound seasonal var ia tions for sulfate and nitrate on Ross Ice Shelf a nd considered that both species had summer maxim a . Thus, th e sul fa te and nitrate are thou ght to be indicative of summer i nput to north Victori a La nd . Su lfate was selected over nitrate as a seasonal indicator fo r t he MI co re because the data set was more complete (Fig.2(b», providing an Ml record that extends from 1971 to 1980 (Fig .3) with an estimated mean annual net mass balance of 182±2 kg m- 2 a - I. Error is assumed to be onl y
2!>e
2ee
L , I E RROR BA R FOR
0 150 > NET MAS S BA L ANCE 0
-:E
" lee " !l! z
5 "
e
1925 1930 1935 19"'0 19"15 1950 1955 1960 1965 1970 1975 1980 1985
YEAR
F · 3 Annual net mass balances (kg m- 2a- 1) fo r si te E IO Ig. . r
(tria n gle) and site MI (diamond). Horizonta l Ine signifies mean value .
A/len and others: Glaciochemislry and mass balance. Rennick Glacier
10% at MI because of the larger accumulation rate at Ml compared to EIO. The MI estimated mean annual net mass balance is similar to the 163 kg m- 2 a-I obtained by Stuart and Heine (1961) at snow pit 559 (Fig.!), using snow stratigraphy based on identification of five annual layers.
The lower seasonal resolution in the EIO core resulted from using a sampling scheme based on the only estimate of net mass balance for the region which was three times larger. The variation in estimated annual net mass balances might be a function of elevation (MI: 1400 m, snow pit 559: 1720 m, El 0: 2305 m a.s.! .) or the amount of precipitation reaching each location.
A comparison between the two sites in north Victoria Land is only possible for the period between 1971 and 1980 (Fig.3). Although similarities between the relative pattern of increasing and decreasing net balance at both sites appear in Figure 3, there is no statistically significant correlation (r = 0.035) between annual net mass balances at each site. Mean chemical concentrations were calculated for each net mass balance year and there was no significant correlation (95%) between annual concentrations for species within each core (r = 0.001 - 0.103) or for individual species between the two cores (r = 0.002 - 0.152).
Short-term changes in the spatial variability of chemical concentrations can be evaluated by examining the upper meter of EIO (1973,'!0) and the entire MI core (l971,'!0). Long-term changes are observed by comparing the upper meter of EIO (1973,'!0) with the remainder of the EIO core record (1929-72).
The upper meter of El 0 compared to MI has higher concentrations (±1 standard deviation) of sodium, silicate and sulfate, similar chloride and lower nitrate concentrations . The chloride concentrations are similar within the relatively large standard error (0.63 jJ.ffiol 1-1) and better precIsion migh t ha ve yielded an expected higher chloride value at MI, due to its more coastal location. The large sodium, silicate and sulfate inputs are visible in the upper meter of EI0 (Fig.2(a)) and might reflect a source unique to the EIO site that has become available during the period 1971,'!0. Compa rison of the upper meter of E10 (1971,'!0) with the remainder of the core (1929-72) shows increased sodium, silicate and sulfate, and similar chloride and nitrate, concentrations (±I standard deviation.)
Crusta I weathering would be a source type common to the three increased chemical species and the higher concentrations might be explained by increases in ice-free areas or changes in atmospheric circulation patterns. One possible driving mechanism for these changes is areal changes in Antarctic pack ice. Using remote sensing data, Kukla and Gavin (1981) note a 2 .5 x 106 km 2
decrease (from 8.2 to 5.7 x 10⁶ km 2 ) in the areal extent of summer pack ice surrounding Antarctica during the period from 1973 to 1980 (the same period of time represented by the upper meter of EIO). The same process decreasing the areal extent of sea ice might also be increasing the area of ice-free exposure surrounding the EIO site which would explain the additional crusta I input. These dynamic changes in sea-ice extent may not necessarily yield an increase in chloride concentrations but might promote changes in ice-free areas that would be less seasonally dynamic and generate a greater abundance of crustally weathered material. Volcanic material may have contributed a portion of the higher concentrations observed.
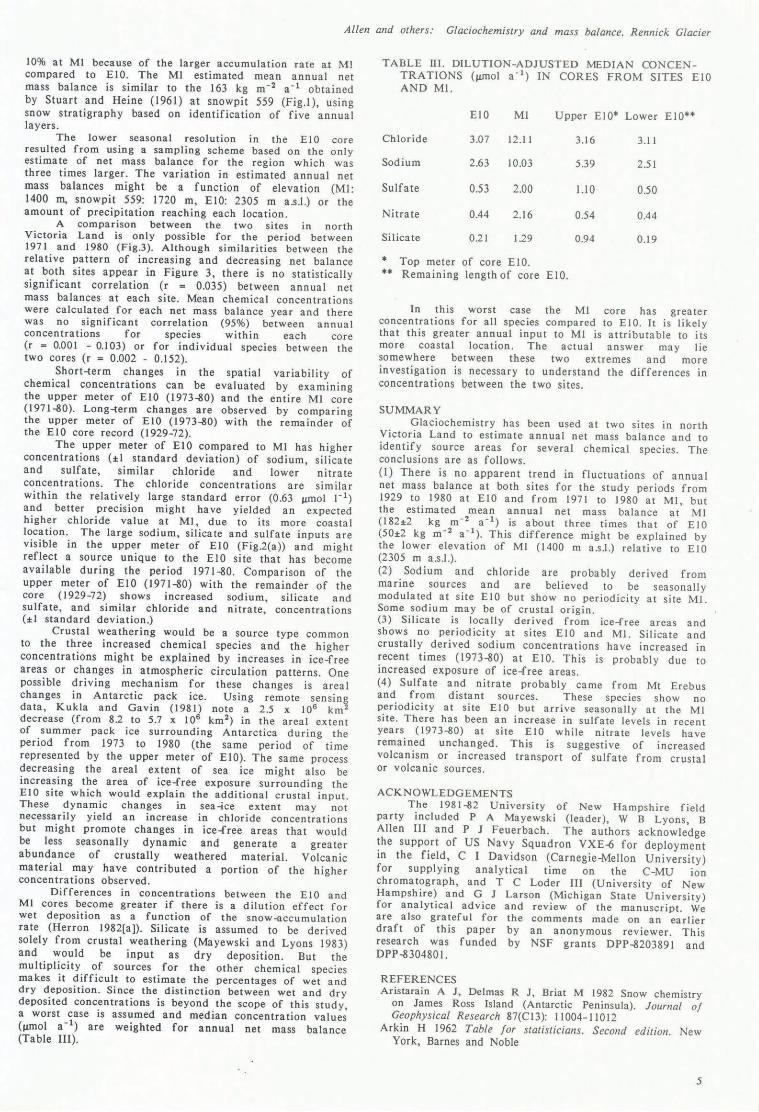
Differences in concentrations between the EIO and MI cores become greater if there is a dilution effect for wet deposition as a function of the snow-Qccumulation rate (Herron 1982[a]). Silicate is assumed to be derived solely from crustal weathering (Mayewski and Lyons 1983) and would be input as dry deposition. But the multiplicity of sources for the other chemical species makes it difficult to estimate the percentages of wet and dry deposition. Since the distinction between wet and dry deposited concentrations is beyond the scope of this study, a worst case is assumed and median concentration values (jJ.ffiol a-I) are weighted for annual net mass balance (Table Ill).
TABLE III . DILUTION-ADJUSTED MEDIAN CONCENTRATIONS (jJ.ffiol a-I) IN CORES FROM SITES EI0 AND MI.
EIO Ml Upper EIO· Lower EIO·*
Chloride 3.07 12.11 3.16 3.11
Sodium 2.63 10.03 5.39 2.51
Sulfa te 0.53 2.00 1.10 0.50
Nitrate 0.44 2.16 0.54 0.44
Silicate 0.21 1.29 0.94 0.19
• Top meter of core EIO. •• Remaining length of core EIO.
In this worst case the MI core has greater concentrations for all species compared to EIO. It is likely that this greater annual input to MI is attributable to its more coastal location. The actual answer may lie somewhere between these two extremes and more investigation is necessary to understand the differences in concen tra tions between the two sites .
SUMMARY Glaciochemistry has been used at two sites in north
Victoria Land to estimate annual net mass balance and to identify source areas for several chemical species. The conclusions are as follows. (J) There is no apparent trend in fluctuations of annual net mass balance at both sites for the study periods from 1929 to 1980 at EIO and from 1971 to 1980 at MI , but the estimated mean annual net mass balance at MI (I 82±2 kg m- 2 a - I) is about three times that of EIO (50±2 kg m -2 a - I). This difference might be explained by the lower elevation of MI (1400 m a .s.l.) rei a ti ve to El 0 (2305 m a.s.! .). (2) Sodium and chloride are probably derived from marine sources and are believed to be seasonally modulated at site EIO but show no periodicity at site MI. Some sodium may be of crusta I origin . (3) Silicate is locally derived from ice-free areas and shows no periodicity at sites EIO and MI . Silicate and crustally derived sodium concentrations have increased in recent times (1973-80) at EIO. This is probably due to increased exposure of ice-free areas. (4) Sulfate and nitrate probably came from Mt Erebus and from distant sources. These species show no periodicity at site EIO but arrive seasonally at the MI site. There has been an increase in sulfate levels in recent years (1973-80) at site EIO while nitrate levels have remained unchanged . This is suggestive of increased volcanism or increased transport of sulfate from crustal or volcanic sources.
ACKNOWLEDGEMENTS The 1981,'!2 University of New Hampshire field
party included P A Mayewski (leader), W B Lyons, B Allen III and P J Feuerbach . The authors acknowledge the support of US Navy Squadron VXE-{i for deployment in the field, C I Davidson (Carnegie-Mellon University) for supplying analytical time on the C-MU ion chromatograph, and T C Loder III (University of New Hampshire) and G J Larson (Michigan State University) for analytical advice and review of the manuscript. We are also grateful for the comments made on an earlier draft of this paper by an anonymous reviewer. This research was funded by NSF grants DPP-8203891 and DPP,'!30480 I.
REFERENCES Aristarain A J, Delmas R J, Briat M 1982 Snow chemistry
on James Ross Island (Antarctic Peninsula). Journal o[ Geophysical Research 87(CI3): 11004-11012
Arkin H 1962 Table for statisticians. Second edition . New York, Barnes and Noble
5
Allen and others: Glaciochemistry and mass balance. Rennick Glacier
Boutron C, Martin S Antarctic snows
1980 Sources of twelve trace metals in determined by principal component
analysis. Journal of Geophysical Research 85(CIO): 5631-5638
Delmas R, Boutron C 1980 Are the past variations of the stratospheric sulfate burden recorded in central Antarctic snow and ice layers? Journal of Geophysical Research 86(CIO): 5645-5649
Delmas R, Briat M, Legrand M 1982 Chemistry of south polar snow. Journal of Geophysical Research 87(C6): 4314-4318
Dort W Jr 1968 Climatic causes of alpine glacier fluctuation, southern Victoria Land. International Association of Scientific Hydrology Publication 86 (ISAGE) 358-362
Dow J A S, Neall V E 1974 Geology of the lower Rennick Glacier, northern Victoria Land, Antarctica. New Zealand Journal of Geology and Geophysics 17(3): 659- 714
Duphom K 1981 Physiographical and glaciogeological observations in north Victoria Land, Antarctica. Geologisches Jahrbuch (Hannover). Reihe B 41: 89-109
Glibert P M, Loder T C 1977 Automated analysis 0/ nutrients in sea water: a manual 0/ techniques. Woods Hole, MA, Woods Hole Oceanographic Institute (Technical Report 77-47)
Herron M M 1982[a] Glaciochemical dating techniques. In Currie L A (ed) Nuclear and chemical dating techniques: interpreting the environmental record. Washington, DC, American Chemical Society: 303-318 (Symposium Series 176)
Herron M M 1982[b] Impurity sources of F-, CI-, N03- and S042- in Greenland and Antarctic precipitation. Journal 0/ Geophysical Research 87(C4): 3052-3060
Kelley J C 1976 Sampling the sea. In Cushing D H, Walsh J J (eds) The ecology of the seas. Philadelphia, PA, W B Saunders: 361-387
Koopmans L H 1974 Spectral analysis 0/ time series. New York, Academic Press
Kukla G, Gavin J 1981 Summer ice and carbon dioxide. Science 214(4520): 497-503
Kyle P, Palais J, Delmas R 1982 The volcanic record of Antarctic ice cores: preliminary results and potential for future investigations. Annals of Glaciology 3: 172-177
Lewis J E, Moore T R, Enright N J 1983 Spatial-temporal variations in snowfall chemistry in the Montreal region. Water. Air and Soil Pollution 20: 7-22
Mayewski P A, Lyons W B 1982 Source and climatic implication of the reactive iron and reactive silicate concentration found in a core from Meserve Glacier, Antarctica. Geophysical Research Lelters 9(3): 190-192
Mayewski P A, Lyons W B, Ahmad N, Smith G, Pourchet M 1984 Interpretation of the chemical and physical time-series retrieved from Sentik Glacier, Ladakh Himalaya, India . Journal 0/ Glaciology 30(104): 66-76
Radke L F 1982 Sulphur and sulphate from Mt Erebus. Nature 299(5885): 710-712
Stuart A W, Heine A J 1961 Glaciological work of the 1959-60 U.S. Victoria Land traverse. Joumal of Glaciology 3(30): 997-1002
V S Navy 1981 Marine climatic atlas 0/ the world. Vol IX. Washington, DC, VS Naval Weather Service Command (NAVAIR Report 50-IC-65)
Van Epsen P, Adams F 1983 The application of principal component and factor analysis procedures to data for elemental concentrations in aerosols from a remote region. Analytica Chimica Acta 150: 153-161
Weyant W S 1967 The Antarctic atmosphere: climatology 0/ the sur/ace environment. New York, American Geographical Society (Antarctic Map Folio Series 8)
Zeller E J, Parker B C 1981 Nitrate ion in Antarctic firn as a marker for solar activity. Geophysical Rsearch Letters 8(8): 895-898
6