glaciers of north america— glaciers of the - usgs · pdf fileglaciers of north...
TRANSCRIPT
Glaciers of North America—
GLACIERS OF THE CONTERMINOUS UNITED STATES
GLACIERS OF THE WESTERN UNITED STATES
By
ROBERT M. KRIMMEL
With a section on
GLACIER RETREAT IN GLACIER NATIONAL PARK, MONTANA
By
CARL H. KEY, DANIEL B. FAGRE,
and
RICHARD K. MENICKE
Glac i e r s , having a to ta l area o f about 580 km
2
, are found in nine wes t e rn s ta t e s o f the Uni t ed State s : Washington, Oregon, Cal i fornia , Montana, Wyoming, Colorado, Idaho, Utah, and Nevada. Only the f i r s t f ive s ta t e s have g lac i e r s large enough to be d i s c e rned at the spat ia l r e so lut ion o f Landsat MSS images . S ince 1850, the area o f g lac i e r s in Glac i e r Nat ional Park has decreased by one - th i rd
SATELLITE IMAGE ATLAS OF GLACIERS OF THE WORLD
Edited by RICHARD S. WILLIAMS, Jr., and JANE G. FERRIGNO
U.S. GEOLOGICAL SURVEY PROFESSIONAL PAPER 1386–J–2

CONTENTS III
Abstract
---------------------------------------------------------------------------- J329
Introduction
----------------------------------------------------------------------- 329
Historical Observations
-------------------------------------------------------- 330
F
IGURE
1. Historical map of a part of the Sierra Nevada, California
------ 331
2. Early map of the glaciers of Mount Rainier, Washington
------- 332
Glacier Inventories
-------------------------------------------------------------- 332
Mapping of Glaciers
------------------------------------------------------------- 333
T
ABLE
1. Areas of glaciers in the western conterminous United States
-- 334
Landsat Images of the Glaciers of the Western United States
--------- 335
F
IGURE
3. Temporal composite of two Landsat images of the South Cascade Glacier basin, Washington
-------------------------- 336
4. Temporal color composite Landsat image of the northern Cascade Range
----------------------------------------------- 337
Selection of Landsat Images
--------------------------------------------- 338
F
IGURE
5.
A
, Map of Landsat nominal scene centers of glacierized areas of the Western United States;
B
, Index map to the optimum Landsat 1, 2, and 3 MSS and Landsat 3 RBV images of the glaciers of the Western United States
------------------------ 338
T
ABLE
2. Optimum Landsat 1, 2, and 3 MSS and RBV images of glaciers of the western conterminous United States
--------- 340
Glaciers of the State of Washington
----------------------------------------- 343
Glaciers of the North Cascade Range
--------------------------------- 343
F
IGURE
6. Sequence of photographs of South Cascade Glacier, Washington, taken in 1928, 1939, 1955, 1983, and 1996, showing changes
--------------------------------------------- 344
7. Sequence of photographs of South Cascade Glacier,taken in 1958, 1978, and 1979, showing changes
------------- 346
8. Cumulative mass balance for South Cascade Glacier:1884–1995
---------------------------------------------------- 348
Glaciers of the Olympic Peninsula
------------------------------------- 348
F
IGURE
9. Landsat 2 MSS false-color composite image of the Olympic Peninsula, Puget Sound, and vicinity, Washington
----------- 349
Glaciers of Mount Rainier
------------------------------------------------ 350
F
IGURE
10. Mount Rainier, Washington, from a part of Landsat 3 RBV image
-------------------------------------------------------- 350
11. Ground photograph of Nisqually Glacier from the old Nisqually River bridge, Mount Rainier, Washington, ca. 1900
351
Glaciers of Southern Washington
-------------------------------------- 352
F
IGURE
12.
A
, Landsat 2 MSS false-color composite image of glaciers on Mount St. Helens, Mount Adams, and Goat Rocks;
B
, Oblique aerial photograph of Mount St. Helens, Washington on 18 May 1980;
C
, Landsat 3 RBV image of Mount St. Helens three months after eruption
---------------------------------- 352
Glaciers of the State of Oregon
----------------------------------------------- 354
Glaciers of the State of California
------------------------------------------- 354
F
IGURE
13. Landsat 3 MSS false-color composite image of the Sierra Nevada of California
----------------------------------------- 355
14. Landsat 3 RBV image of the high central Sierra Nevada, including Mono Lake and most of Yosemite National Park
-- 356
15. Enlargement of part of a Landsat 3 RBV image of the high central Sierra Nevada
---------------------------------------- 357
16. Map of the glaciers of the central Sierra Nevada west of Bishop, California, similar in area coverage to Figure 15
---- 358
CONTENTS
Page
IV CONTENTS
Glaciers of the States of Montana, Wyoming, Colorado, Idaho, Utah, and Nevada
--------------------------------------------------------------- 359
F
IGURE
17. Landsat 3 MSS false-color composite image of the glaciers of Glacier National Park, Montana
------------------------------ 359
18. Landsat 2 MSS false-color composite image of the glaciers of the Wind River Range in west-central Wyoming
----------- 360
19. Oblique aerial photograph taken on 6 August 1979 of some of the glaciers in the Wind River Range, Wyoming
-------------- 361
20. Enlargement of part of a Landsat 3 RBV image that includes most of the glaciers in the State of Colorado
----------------- 362
21. Landsat 2 MSS false-color composite image of the glacierized Sawtooth Range, Idaho
--------------------------------------- 363
22. Landsat 2 MSS false-color composite image of the glacierized Wasatch Range,Utah
------------------------------------------ 364
Glacier Retreat in Glacier National Park, Montana
----------------- 365
F
IGURE
23. Computer-generated, unsupervised spectral classification of a Landsat TM scene of Glacier National Park and vicinity, Montana
------------------------------------------------------ 367
24. Oblique photograph (taken about 1912) showing hanging cirque glaciers and the “glacier staircase” of North Swiftcurrent Glaciers
------------------------------------------------------ 369
25. Four enlargements of figure 23 provide a comparison of the area covered by glacier ice in 1995 with that of the middle 19th century
-------------------------------------------------- 371
26. Photograph of Blackfoot Glacier in August 1914
---------------- 372
27. Neoglacial recession chronology of Sperry Glacier showing the series of termini mapped since the middle 19th century
-- 373
28. Neoglacial recession chronology of Grinnell and Swiftcurrent Glaciers showing the series of termini mapped since the middle 19th century
------------------------------------------- 373
29. Paired 1938 and 1981 photographs of Grinnell Glacier, The Salamander, and proglacial Upper Grinnell Lake
-------- 374
T
ABLE
3. Named glaciers of Glacier National Park and vicinity, Montana
366
Recent Glacier Trends
----------------------------------------------------------- 375
References Cited
------------------------------------------------------------------ 377
Page

GLACIERS OF THE CONTERMINOUS UNITED STATES J329
SATELLITE IMAGE ATLAS OF GLACIERS OF THE WORLD
GLACIERS OF NORTH AMERICA—
GLACIERS OF THE CONTERMINOUS UNITED STATES
GLACIERS OF THE WESTERN UNITED STATES
By
ROBERT M. KRIMMEL
1
With a section on
GLACIER RETREAT IN GLACIER NATIONAL PARK, MONTANA
By
CARL H. KEY,
2
DANIEL B. FAGRE,
2
and
RICHARD K.
MENICKE
3
Abstract
Glaciers are found in the following States of the Western United States: Washington, Ore-gon, California, Montana, Wyoming, Colorado, Idaho, Utah, and Nevada. According to themost recent sources, these glaciers have a total area of about 580 km
2
. The earliest recordedglacier observations were made in 1857, and all the major glacier areas were known by theearly part of the 20th century. Glacier inventories have been completed or are in progress forseveral major glacierized areas. The major source materials for modern glacier inventories ofthe Western United States are the various U.S. Geological Survey topographic map series atscales of 1:24,000, 1:62,500, 1:100,000, and 1:125,000 and the vertical aerial photographs usedto compile these maps. Where these sources are not available, oblique aerial photographshave been used to delineate the extent of glaciers and to update glacier margins where signif-icant change has taken place. Landsat images and digital data have been used in glacier stud-ies in the conterminous United States. However, the spatial resolution of Landsat is such thatonly glaciers in the States of Washington, Oregon, California, Montana, and Wyoming can beeffectively observed from Landsat 1, 2, and 3 data. In the remaining States, the Landsat datacan often offer regional views of moraines from past glaciation and can also be useful in thestudy of glacial geology and the variations in seasonal snow cover.
Introduction
Glaciers are found in the following States of the Western United States:Washington, Oregon, California, Montana, Wyoming, Colorado, Idaho, Utah,and Nevada. The single most comprehensive work on the glaciers in theseStates is volume 1 of “Mountain Glaciers of the Northern Hemisphere,”edited by William O. Field (Field, 1975), and he relied on the expertise ofnumerous people as coauthors. The work attempted to list all glaciologicalliterature and other reference material (including maps, aerial photo-graphs, and terrestrial photographs available for each area), in addition to
1
U.S. Geological Survey, 1201 Pacific Avenue - Suite 600, Tacoma, WA 98402.
2
U.S. Geological Survey, Glacier National Park, West Glacier, MT 59936.
3
U.S. National Park Service, Glacier National Park, West Glacier, MT 59936.
Manuscript approved for publication 7 March 2002.
creating a comprehensive glacier inventory. Numerous references are citedat the end of each chapter. Perhaps the single most referenced source on
J330 SATELLITE IMAGE ATLAS OF GLACIERS OF THE WORLD
the distribution of glaciers in the conterminous United States is a paper byMeier (1961a), who reported on a survey of United States glaciers carriedout from 1957 to 1959. Brown (1989) summarized the status of work oncompiling a glacier inventory of the United States. Snyder (1996) compileda bibliography of glacier studies by the U.S. Geological Survey (USGS) thatincludes numerous citations to studies of glaciers in the Western UnitedStates. This section in “Satellite Image Atlas of Glaciers of the World” must,by the nature of the subject, parallel the work of Meier (1961a) and Field(1975), but it will also stress those data available from the Landsat 1, 2, and3 series of satellites.
The distribution of glaciers in the Western United States can be mostlogically categorized by using the physiographic provinces that encompassvarious mountain ranges. These mountain ranges can be divided arbitrarilyby States, which are used as the primary geographic categorization in thissection for glaciers in the Western United States.
Historical Observations
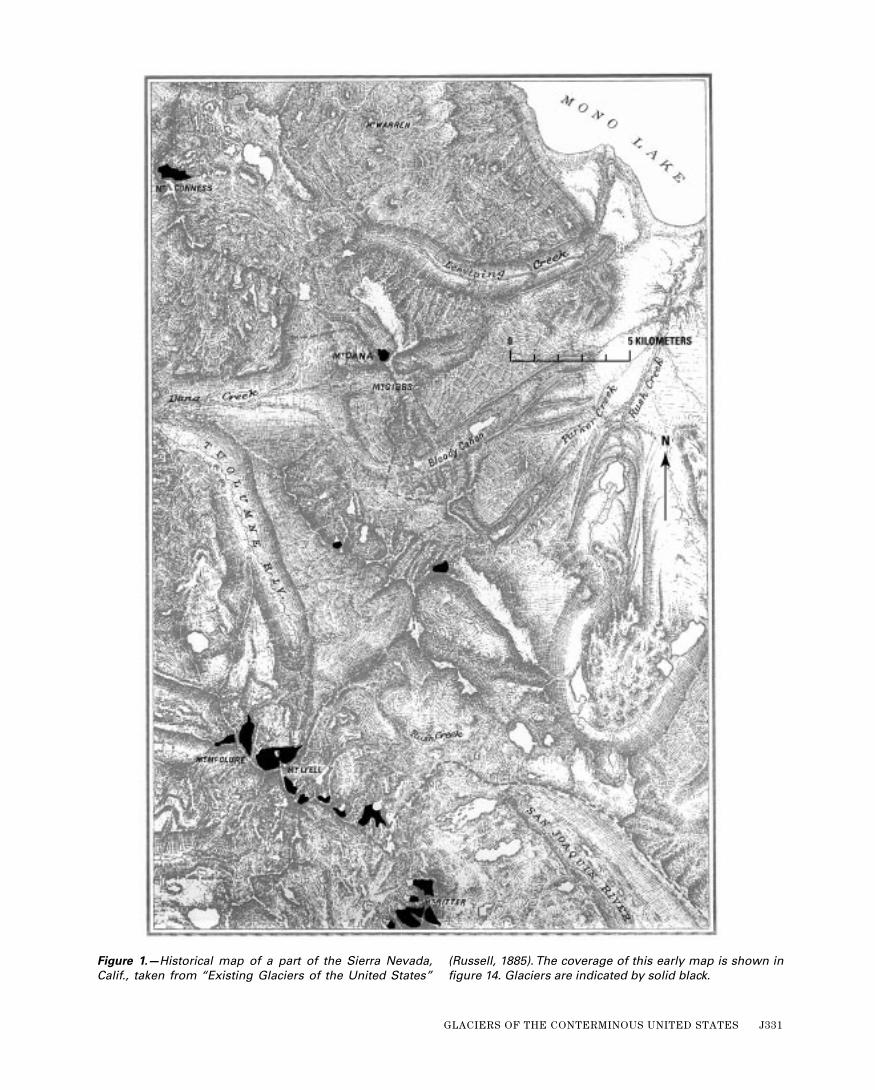
All of the major glacier areas in the Western United States were knownby the early 20th century. The earliest recorded glacier observations weremade by Kautz in 1857 (Kautz, 1875). Other pre-1900 glacier observationsinclude those of Clarence King (1871), John Muir (1894), and I.C. Russell,who published two comprehensive works: “Existing Glaciers of the UnitedStates” (Russell, 1885) and “Glaciers of Mount Rainier” (Russell, 1898).These reports contained maps of glacier cover for a small area of the SierraNevada (fig. 1), Mount Shasta, the Lyell Glacier
4
(Yosemite National Park),and Mount Rainier (fig. 2), as well as numerous sketches of glaciers. Aseries of reports by F.E. Matthes from 1931 to 1945, published in the Trans-actions of the American Geophysical Union (Matthes, 1931, 1932, 1933,1934, 1935, 1936, 1937, 1938, 1939, 1940, 1941, 1942, 1944, and 1945),attempted to summarize contemporary glacier research for that period.With the advent of regionally comprehensive vertical aerial photographsand topographic maps compiled from these photographs, some detailedglacier inventories have subsequently been compiled (Post and others,1971; Graf, 1977; Raub and others, 1980; and Spicer, 1986). Another com-prehensive source of glacier data that includes information on UnitedStates glaciers is the Permanent Service on the Fluctuations of Glaciers(now part of the World Glacier Monitoring Service), which has publishedseven volumes since 1967 summarizing glacier changes during seven suc-cessive 5–year periods (Kasser, 1967 and 1973; Müller, 1977; Haeberli,1985; Haeberli and Müller, 1988; Haeberli and Hoelzle, 1993; Haeberli andothers, 1998).
The long-term measurement of changes in termini position and mass bal-ance of glaciers (Fountain and others, 1991; Østrem and Brugman, 1991) isimportant to understanding both the relationship of glacier fluctuation toclimate change and to the contribution of glacier meltwater to the totalannual discharge of a hydrologic basin (Fountain and Tangborn, 1985a,b).The latter application is especially important where the drainage basin isused for irrigation or for the generation of hydroelectric power.
4
The geographic place-names given in the text have been approved for each State by the U.S. Board onGeographic Names. Unapproved names for glaciers are shown in italics.
GLACIERS OF THE CONTERMINOUS UNITED STATES J331
Figure 1.—
Historical map of a part of the Sierra Nevada,Calif., taken from “Existing Glaciers of the United States”
(Russell, 1885). The coverage of this early map is shown infigure 14. Glaciers are indicated by solid black.
J332 SATELLITE IMAGE ATLAS OF GLACIERS OF THE WORLD
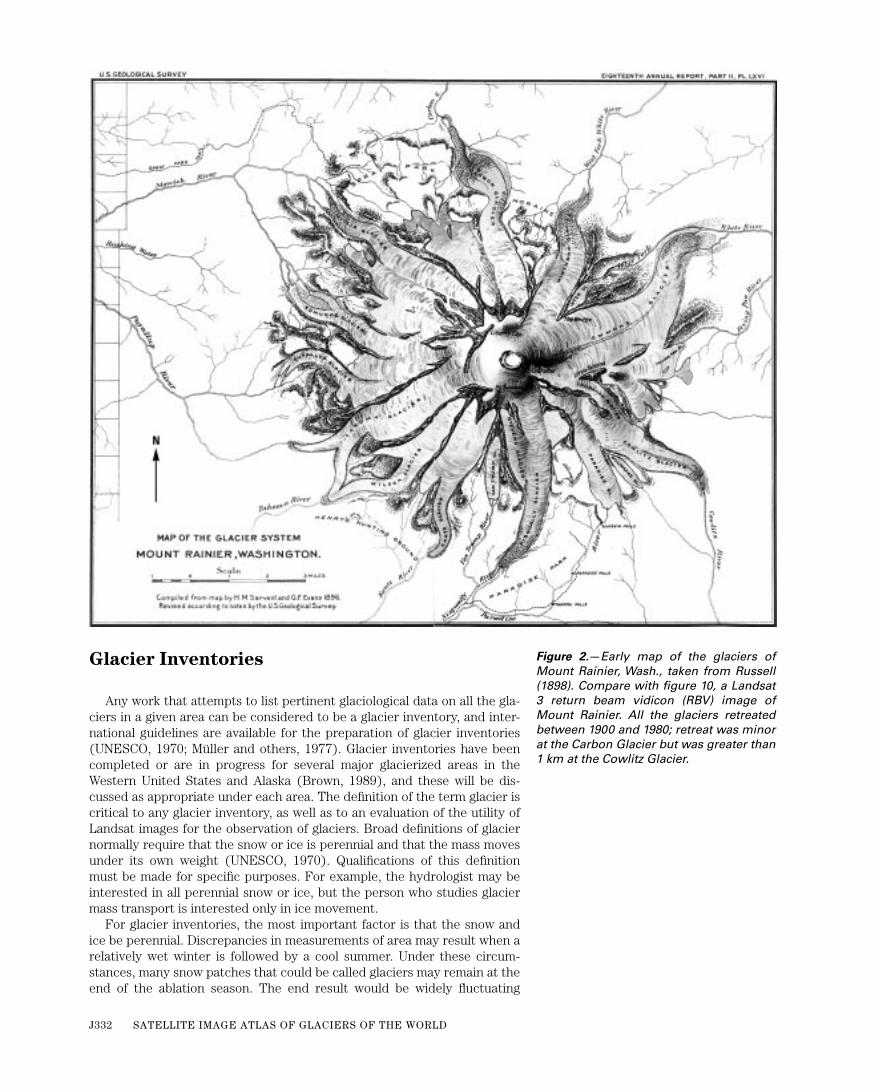
Figure 2.
—
Early map of the glaciers ofMount Rainier, Wash., taken from Russell(1898). Compare with figure 10, a Landsat3 return beam vidicon (RBV) image ofMount Rainier. All the glaciers retreatedbetween 1900 and 1980; retreat was minorat the Carbon Glacier but was greater than1 km at the Cowlitz Glacier.
Glacier
Inventories
Any work that attempts to list pertinent glaciological data on all the gla-ciers in a given area can be considered to be a glacier inventory, and inter-national guidelines are available for the preparation of glacier inventories(UNESCO, 1970; Müller and others, 1977). Glacier inventories have beencompleted or are in progress for several major glacierized areas in theWestern United States and Alaska (Brown, 1989), and these will be dis-cussed as appropriate under each area. The definition of the term glacier iscritical to any glacier inventory, as well as to an evaluation of the utility ofLandsat images for the observation of glaciers. Broad definitions of glaciernormally require that the snow or ice is perennial and that the mass movesunder its own weight (UNESCO, 1970). Qualifications of this definitionmust be made for specific purposes. For example, the hydrologist may beinterested in all perennial snow or ice, but the person who studies glaciermass transport is interested only in ice movement.
For glacier inventories, the most important factor is that the snow andice be perennial. Discrepancies in measurements of area may result when arelatively wet winter is followed by a cool summer. Under these circum-stances, many snow patches that could be called glaciers may remain at theend of the ablation season. The end result would be widely fluctuating

GLACIERS OF THE CONTERMINOUS UNITED STATES J333
glacierized areas in short time periods, which is generally unacceptable forinventory work. Therefore, most inventories are made during a year, ormultiple years, of abnormally light winter snow and (or) a hot, dry summer,which reduce snow-patch areas to a minimum.
Another practical problem in most glacier inventories is that it is normallyimpossible to record every small mass of snow and ice that might fit the gla-cier definition. For this reason, a minimum size limit, in addition to the morecommon definition of glacier, is often stipulated in glacier inventories. Theminimum size is determined by the quality of data, the hydrologic importanceof the snow and ice, and the interest spurred by tourists and recreationalists.For an inventory in the north Cascades (northern Cascade Range) of Wash-ington State, a minimum area of 0.1 km
2
was used (Post and others, 1971).For an inventory in the Sierra Nevada of California, a minimum area of 0.01km
2
was used (Raub and others, 1980; unpub. data). It is not the intent of thisLandsat image atlas to inventory glaciers, and no arbitrary minimum size forglaciers has been assigned; however, the effective spatial resolution of Land-sat’s sensors imposes a minimum on the order of 1 km
2
where used for glacio-logical studies.
5
However, 1 km
2
as the minimum glacier size would be absurdin California because only one glacier, Palisade Glacier, is more than 1 km
2
inarea (Raub and others, 1980; unpub. data).
Mapping of Glaciers
In the Western States, numerous small glaciers exist over a very largearea. Glacier distribution and area are listed in table 1. Because of the scat-tered distribution, no comprehensive study of glacier extent was done previ-ous to the compilation of modern topographic maps. A few studies weremade of isolated areas before 1960, however. Most of these consisted of gen-eral observations and, in some cases, photographic records; they are, for themost part, referenced in Field (1975). In some areas, a few outstanding pho-tographs of glaciers, taken primarily for artistic purposes or the promotionof tourism, exist from as early as 1900. Some of these have found their wayinto modern reports and are used to compare glaciers qualitatively.
The major source materials for modern glacier inventories are the vari-ous USGS topographic map series at scales of 1:24,000, 1:62,500, 1:100,000,and 1:125,000 and the vertical aerial photographs that were used to com-pile these maps. In some instances, modern maps are not available forimportant glacierized areas, in which case modern oblique aerial photo-graphs have been used to delineate the extent of each glacier. This obliqueaerial photography also has been used to update glacier margins in areaswhere significant change has taken place.
The tool most useful in describing the geometry of a glacier is a topo-graphic map. Commonly, the USGS topographic map series do not show suf-ficient detail to satisfy a specific glaciological need, and a special map mustbe produced for a specific glacier. Such special maps, mostly unpublished,have been made for the South Cascade, Nisqually, and Klawatti Glaciers(Meier, 1966), Blue Glacier (Tangborn and others, 1990), and ShoestringGlacier in Washington; the Eliot and Collier Glaciers in Oregon; the McClureand Palisade Glaciers in California; the Grinnell and Sperry Glaciers in Mon-tana; the Dinwoody Glacier in Wyoming; and several glaciers in Colorado.Normally the vertical aerial photographic surveys used for these maps weredone in the early fall, a time particularly advantageous to the mapping of
5
Theoretically, for the 79-m pixel size of the Landsat multispectral scanner image, a glacier 0.2 km
2
inarea could be resolved (approximately 2.8 times the pixel size). From a practical standpoint, however, aglacier 1 km
2
in area (1 mm
2
on a 1:1,000,000-scale Landsat multispectral scanner image) is about thesmallest that can be unambiguously delineated under optimum contrast conditions.
J334 SATELLITE IMAGE ATLAS OF GLACIERS OF THE WORLD
T
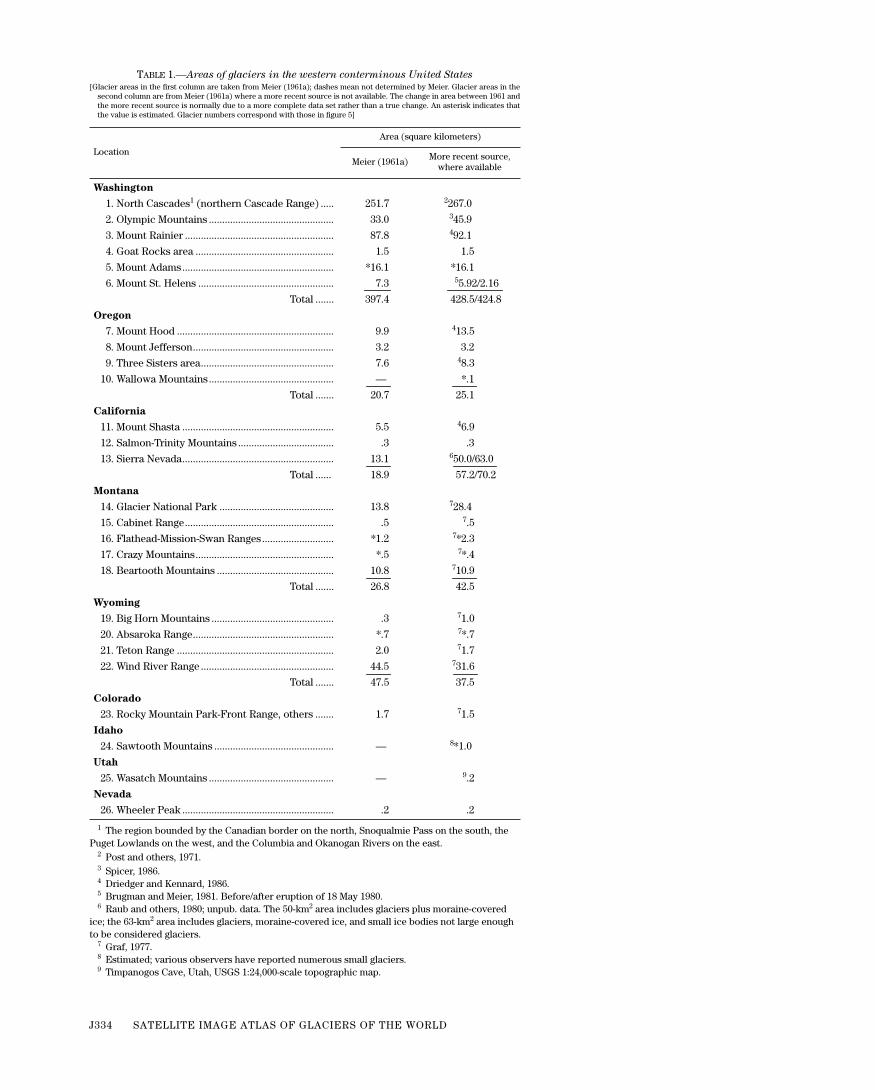
ABLE
1.
—Areas of glaciers in the western conterminous United States
[Glacier areas in the first column are taken from Meier (1961a); dashes mean not determined by Meier. Glacier areas in thesecond column are from Meier (1961a) where a more recent source is not available. The change in area between 1961 andthe more recent source is normally due to a more complete data set rather than a true change. An asterisk indicates thatthe value is estimated. Glacier numbers correspond with those in figure 5]
Location
Area (square kilometers)
Meier (1961a)More recent source,
where available
Washington
1. North Cascades
1
(northern Cascade Range) .....
1
The region bounded by the Canadian border on the north, Snoqualmie Pass on the south, the Puget Lowlands on the west, and the Columbia and Okanogan Rivers on the east.
251.7
2
267.0
2
Post and others, 1971.
2. Olympic Mountains ............................................... 33.0
3
45.9
3
Spicer, 1986.
3. Mount Rainier ........................................................ 87.8
4
92.1
4
Driedger and Kennard, 1986.
4. Goat Rocks area .................................................... 1.5 1.5
5. Mount Adams......................................................... *16.1 *16.1
6. Mount St. Helens ................................................... 7.3
5
5.92/2.16
5
Brugman and Meier, 1981. Before/after eruption of 18 May 1980.
Total ....... 397.4 428.5/424.8
Oregon
7. Mount Hood ........................................................... 9.9
4
13.5
8. Mount Jefferson..................................................... 3.2 3.2
9. Three Sisters area.................................................. 7.6
4
8.3
10. Wallowa Mountains ............................................... — *.1
Total ....... 20.7 25.1
California
11. Mount Shasta ......................................................... 5.5
4
6.9
12. Salmon-Trinity Mountains .................................... .3 .3
13. Sierra Nevada......................................................... 13.1
6
50.0/63.0
6
Raub and others, 1980; unpub. data. The 50-km
2
area includes glaciers plus moraine-covered ice; the 63-km
2
area includes glaciers, moraine-covered ice, and small ice bodies not large enough to be considered glaciers.
Total ...... 18.9 57.2/70.2
Montana
14. Glacier National Park ........................................... 13.8
7
28.4
7
Graf, 1977.
15. Cabinet Range........................................................ .5
7
.5
16. Flathead-Mission-Swan Ranges........................... *1.2
7
*2.3
17. Crazy Mountains.................................................... *.5
7
*.4
18. Beartooth Mountains ............................................ 10.8
7
10.9
Total ....... 26.8 42.5
Wyoming
19. Big Horn Mountains .............................................. .3
7
1.0
20. Absaroka Range..................................................... *.7
7
*.7
21. Teton Range ........................................................... 2.0
7
1.7
22. Wind River Range .................................................. 44.5
7
31.6
Total ....... 47.5 37.5
Colorado
23. Rocky Mountain Park-Front Range, others ....... 1.7
7
1.5
Idaho
24. Sawtooth Mountains ............................................. —
8
*1.0
8
Estimated; various observers have reported numerous small glaciers.
Utah
25. Wasatch Mountains ............................................... —
9
.2
9
Timpanogos Cave, Utah, USGS 1:24,000-scale topographic map.
Nevada
26. Wheeler Peak ......................................................... .2 .2
GLACIERS OF THE CONTERMINOUS UNITED STATES J335
glaciers because the residual snow cover is at a minimum and new snow hasnot started accumulating. The maps not only provide an accurate position ofthe glacier terminus but, even more important, give reliable ice elevationsthroughout the entire area. This third geometric dimension is especiallyvaluable because, through the compilation of later maps from new verticalaerial photographic or ground surveys, volumetric change can be deter-mined over a given time. Ice gain or loss is hydrologically important, and thedistribution of the gain or loss over the glacier is vital to understanding theglacier’s state of health and its relationship to climate.
In this chapter, no attempt is made to use Landsat multispectral scanner(MSS) or Landsat 3 return beam vidicon (RBV) images to define the shape orsize of a glacier. In almost all cases, vertical aerial photographs are availablethat have spatial resolutions of one or two orders of magnitude better than theLandsat MSS images. With the exception of a few isolated cases, even the1:125,000-scale topographic maps depict the glaciers more precisely than doesLandsat. Occasionally though, misinterpretation of photographic data hasresulted in map errors. Although numerous glaciers have undergone changesin terminus position of 100 m or more since the map compilations, no routineattempt has been made to correct the maps by using Landsat image data.
Landsat Images of the Glaciers of the Western
United States
The spatial resolving power of the MSS of the Landsat 1, 2, and 3 sys-tems is such that only glaciers in the States of Washington, Oregon, Califor-nia, Montana, and Wyoming can be observed effectively. In the remainingStates, the Landsat images commonly offer striking views of moraines frompast glaciation and can also be useful in the study of glacial geology andvariations in seasonal snowpack.
The effective spatial resolution of the Landsat MSS sensors is generallyconsidered to be about 200 m under normal conditions of contrast. Underoptimum conditions (high contrast) during the satellite pass and withcareful image and photographic processing, MSS images can give glacio-logical information approaching 100 m in spatial resolution (Krimmel andMeier, 1975). The best possible analysis of Landsat imagery is achieved byusing digital data rather than photographic prints. The Landsat MSS digitalunit is a pixel, and each pixel has a reflectance (gray-scale) value, given asa digital number (DN), ranging from 1 to 127 (MSS bands 4–6) or 1 to 63(MSS band 7) (1 is dark and 127 or 63 is bright). Manipulation of digitaldata not only allows simple analysis of single MSS bands but also permitsthe use of analytical techniques, such as band-to-band ratioing and date-to-date (temporal) comparisons of sequential images.
A very simple way to determine snow cover is by radiance threshold. Aradiance value is picked above which it is assumed that all material is snow.A summation of these pixels with radiance values higher than the arbitraryvalue then represents the snow-covered area. However, in mountainousareas, some snow is always in shadow, which results in a reduced radiance.Also, most of the edge of the snow cover is irregular, and along that bound-ary, many pixels are only partially snow covered (mixed pixels) and nor-mally may have reduced brightness. The radiance of any given pixel is anintegration of the brightness values of all material within that pixel. Somesubjectivity always exists in picking the radiance level for a given percent ofsnow cover, and the resulting regional snow-cover determination is a resultof the selected radiance. Of course, other features in the image can alsoresult in high radiance values, notably clouds.

J336 SATELLITE IMAGE ATLAS OF GLACIERS OF THE WORLD
0 1 KILOMETER
121°04'W 121°03'
48°22'N
48°21'
Lake
Figure 3.
—Pixel-by-pixel temporal com-posite of two Landsat images of the SouthCascade Glacier basin, Washington. Allpixels having a radiance of 100 in MSSband 5 on images from 11 August 1973(1384–18311) and 16 September 1973(1420–18303) were considered to be snow.The heavy solid circles within the basinarea show pixels that were snow on 11August but not snow on 16 September.The shaded area within the basin repre-sents areas of snow, firn, or ice cover atthe end of the melt season in 1973, asdetermined from field observations. Mostof the snow-cover loss between 11 Augustand 16 September was near the glacieredge, at high elevation, or on the lowerglacier just below the equilibrium line(about 1,850 m). The small triangles indi-cate the positions of benchmarks.
The identification of ice is commonly more difficult than that of snow.Simple radiance thresholds do not identify ice because much of it is lessbright than the surrounding rock, glacial outwash, or vegetation. Digitalband-to-band ratios have been successfully used to identify both ice andsnow under shadow conditions (Meier and Evans, 1975). On a regional scale,however, instead of digital data, it has proven to be more cost-effective to useanalog photographic film combined with the subjective input of brightnessvariations in order to gain a knowledge of morainal landforms and trimlines.
Some digital-image processing has been used for selected glaciers. SouthCascade Glacier in the State of Washington is about 3 km long and has an areaof 2.5 km
2
. It has been the site of remote sensing experiments since the 1960’s(Meier and others, 1966). An exceptional Landsat image is required to obtaininformation about a glacier this small (Krimmel and Meier, 1975). Two cloud-free scenes, one from 11 August 1973 and one from 16 September 1973, wereused to determine the change in snow-cover area. Figure 3 shows the Augustdigital image compared to the September digital image, the pixels that aresnow (DN>100 on MSS bands) in August, but not in September, being shownas heavy solid circles. Although such techniques may be useful in analyzingspecial cases in small areas, it has proven to be impractical for large areas
Figure 4.—
(opposite page)
Temporal colorcomposite Landsat image (1420–18303,band 5; 16 September 1973; Path 50, Row26; and 1258–18322, bands 5, 6, and 7; 7April 1973; Path 50, Row 26) of two northCascades (northern Cascade Range)images in Washington State and BritishColumbia, Canada. This image showsareas that were snow covered on 16 Sep-tember 1973 as a brilliant red, areas thatwere snow covered on 7 April 1973 as awhite, and healthy vegetation as a tancolor (Deutsch, 1983, fig. 31–72, p. 1735)The southeast quadrant of the imageincludes most of the glaciers of the northCascades. Relief in the north Cascades isextreme, the valley to summit differencebeing as high as 2,000 m. Mount Baker(image center), at 3,285 m, is the highestpeak; many other peaks approach 2,500 m.Annual precipitation in the north Cascadesincreases rapidly from about 1 m in thePuget Lowlands to as high as 4.5 m at thecrest of the Cascade Range. Precipitationdiminishes rapidly east of the crest to lessthan 0.5 m (Phillips and Donaldson, 1972).The major glacier concentrations are onMount Baker and on high peaks near thecrest of the north Cascades.

GLACIERS OF THE CONTERMINOUS UNITED STATES J337
because of the high cost of digital data, and in addition, critical data neededfrom the end of the melt season commonly cannot be obtained because ofcloud cover.
A similar date-to-date comparison of images can also be made optically. Infigure 4, all the material having greater than a certain brightness level(assumed to be snow) is shown for a fall image (16 September 1973). This isthen registered to a spring image (7 April 1973), which thereby produces abitemporal color-composite image showing the location of perennial snow.
The RBV sensors carried on Landsats 1 and 2 offered no advantage overthe MSS sensors for glacier observation. However, on Landsat 3, the RBVwas modified to produce a panchromatic image having a pixel resolution ofabout 30 m (2.6 times better than the MSS image). Commonly the exposureof the photographic product was such that only some of the image was
San Juan Islands
PugetLowlands
NO
RT
HC
AS
CA
DE
CR
ES
TN
OR
TH
CA
SC
AD
EC
RE
ST
Fraser RiverFraser River
CANADA
U.S .A .
Skagit River
Skagit River
122° 121°30'
122°30'W
49°
48°30'
49°30'N
49°30'N
Mt. BakerMt. Baker
10 0 10 20 30 KILOMETERS
APPROXIMATE SCALE
J338 SATELLITE IMAGE ATLAS OF GLACIERS OF THE WORLD
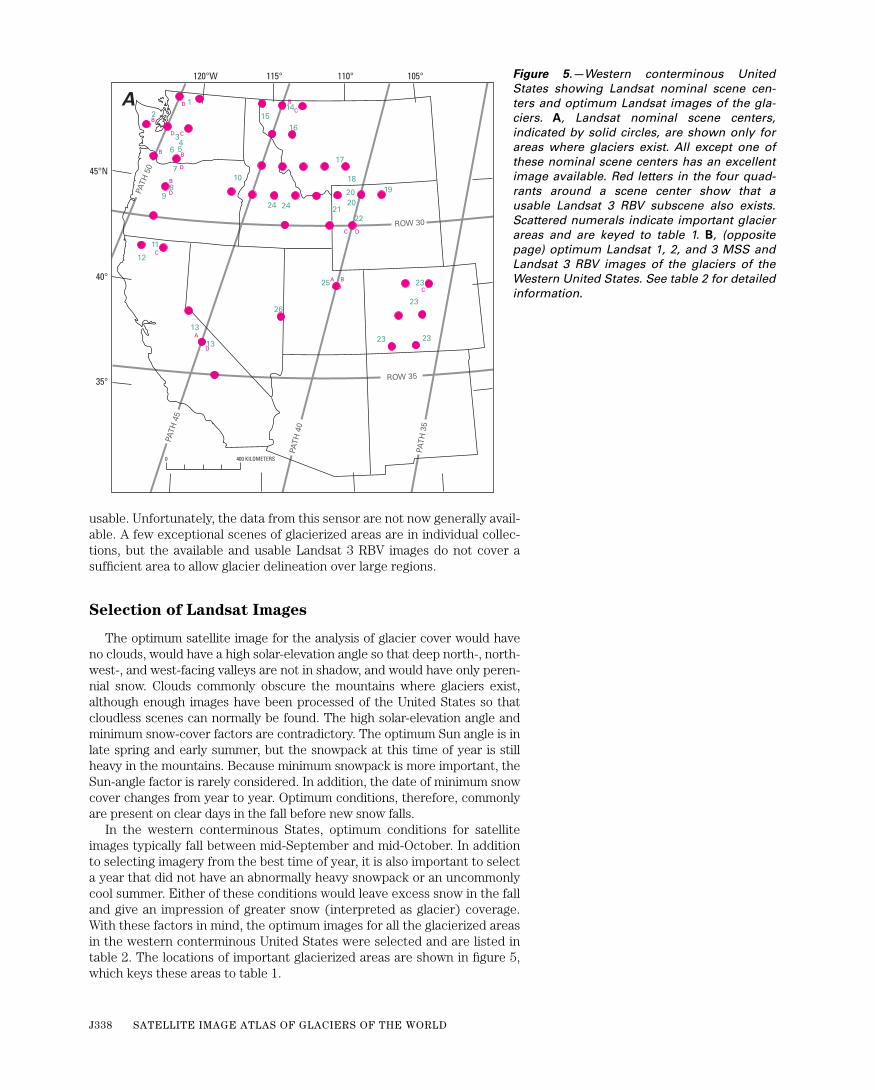
Figure 5
.—Western conterminous UnitedStates showing Landsat nominal scene cen-ters and optimum Landsat images of the gla-ciers.
A
, Landsat nominal scene centers,indicated by solid circles, are shown only forareas where glaciers exist. All except one ofthese nominal scene centers has an excellentimage available. Red letters in the four quad-rants around a scene center show that ausable Landsat 3 RBV subscene also exists.Scattered numerals indicate important glacierareas and are keyed to table 1.
B
, (oppositepage) optimum Landsat 1, 2, and 3 MSS andLandsat 3 RBV images of the glaciers of theWestern United States. See table 2 for detailedinformation.
usable. Unfortunately, the data from this sensor are not now generally avail-able. A few exceptional scenes of glacierized areas are in individual collec-tions, but the available and usable Landsat 3 RBV images do not cover asufficient area to allow glacier delineation over large regions.
Selection of Landsat Images
The optimum satellite image for the analysis of glacier cover would haveno clouds, would have a high solar-elevation angle so that deep north-, north-west-, and west-facing valleys are not in shadow, and would have only peren-nial snow. Clouds commonly obscure the mountains where glaciers exist,although enough images have been processed of the United States so thatcloudless scenes can normally be found. The high solar-elevation angle andminimum snow-cover factors are contradictory. The optimum Sun angle is inlate spring and early summer, but the snowpack at this time of year is stillheavy in the mountains. Because minimum snowpack is more important, theSun-angle factor is rarely considered. In addition, the date of minimum snowcover changes from year to year. Optimum conditions, therefore, commonlyare present on clear days in the fall before new snow falls.
In the western conterminous States, optimum conditions for satelliteimages typically fall between mid-September and mid-October. In additionto selecting imagery from the best time of year, it is also important to selecta year that did not have an abnormally heavy snowpack or an uncommonlycool summer. Either of these conditions would leave excess snow in the falland give an impression of greater snow (interpreted as glacier) coverage.With these factors in mind, the optimum images for all the glacierized areasin the western conterminous United States were selected and are listed intable 2. The locations of important glacierized areas are shown in figure 5,which keys these areas to table 1.
PATH
45
PATH
40
PATH
35
ROW 35
PATH
50
ROW 302221
2020 19
23
23
23
23
25
26
13
13
12
11
2424
1615
1
2
46 5
7
89
17
1810
14
3
C D
A
A
B
C
D
D
D
D
C
C
C
B
B B
B
BDA
120°W
45°N
40°
35°
115° 110° 105°
400 KILOMETERS0

GLACIERS OF THE CONTERMINOUS UNITED STATES J339
ROW 35
ROW 30
ROW 25
PATH
45
PATH
40
PATH
35
PATH
50
B
120°W
45°N
35°
40°
115° 105°110°
WASHINGTON
OREGON
CALIFORNIA
NEVADA
IDAHO
UTAH
ARIZONA
NEW MEXICO
COLORADO
TEXAS
KA
NS
AS
NE
BR
AS
KA
SO
UT
H D
AK
OT
A
NO
RT
H D
AK
OT
A
OKLAHOMA
MONTANA
WYOMING
UNITED STATESMEXICO
CANADA
UNITED STATES
Excellent image (0 to ≤5 percent cloud cover)
Good image (>5 to ≤10 percent cloud cover)
Nominal scene center for a Landsat image outside the area of glaciers
Usable Landsat 3 return beam vidicon (RBV) scenes.A, B, C, and D refer to usable RBV subscenes
EXPLANATION OF SYMBOLS
Evaluation of image usability for glaciologic, geologic, and cartographic applications. Symbols defined as follows:
A
C
B
D
A B
C
C
D
A
D
B
D
B
D
D
D B
B
B
CC
C
0 400 KILOMETERS

J340 SATELLITE IMAGE ATLAS OF GLACIERS OF THE WORLD
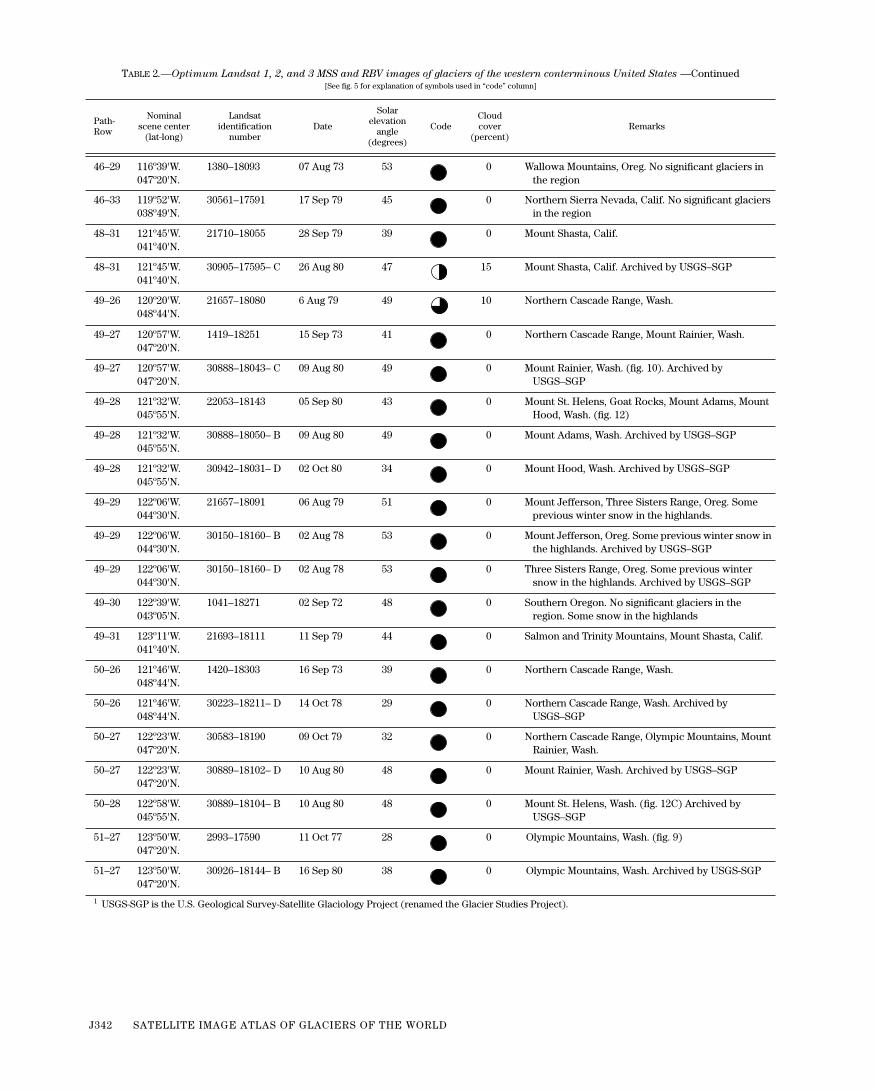
T
ABLE
2
.—Optimum Landsat 1, 2, and 3 MSS and RBV images of glaciers of the western conterminous United States
[See fig. 5 for explanation of symbols used in “code” column]
Path-Row
Nominal scene center
(lat-long)
Landsat identification
numberDate
Solar elevation
angle (degrees)
CodeCloud cover
(percent)Remarks
36–32 105º02'W.
040
o
14'N.
2618–16525 01 Oct 76 38 0 Colorado Front Range. Some snow in the highlands
36–32 105º02'W.040º14'N.
2222–17011 01 Sep 75 48 0 Entire Colorado Front Range
36–32 105º02'W.040º14'N.
30929–16504– C 19 Sep 80 42 5 Superb Landsat 3 RBV of glaciers of Colorado Front
Range (fig. 22). Archived by USGS–SGP
1
36–33 105º31'W.038º49'N.
21338–16451 21 Sep 78 41 0 Central Colorado. Considerable new snow in the highlands. No significant glaciers in the region
36–33 105º31'W.038º49'N.
5843–15511 08 Sep 77 41 30 Central Colorado. No significant glaciers in the region
36–34 105
o
59'W.
037
o
24'N.
30209–17041 30 Sep 78 42 0 South-central Colorado. No significant glaciers in the region
37–32 106º28'W.040º14'N.
30516–17073 03 Aug 79 54 5 North-central Colorado. No significant glaciers in the region. Some previous winter snow in the highlands
37–32 106º28'W.040º14'N.
21699–17025 17 Sep 79 43 0 Excellent image of north-central Colorado. No signifi-cant glaciers in the region
37–33 106º57'W.038º49'N.
21699–17032 17 Sep 79 44 0 Excellent image of central Colorado Rocky Moun-tains. No significant glaciers in the region
37–33 106º57'W.038º49'N.
21303–16491 17 Aug 78 49 0 Excellent image of central Colorado Rocky Moun-tains. No significant glaciers in the region
37–34 107º25'W.037º24'N.
1425–17190 21 Sep 73 46 0 Southwestern Colorado. No significant glaciers in the region
37–34 107º25'W.037º24'N.
30210–17095 01 Oct 78 42 0 Excellent image of southwestern Colorado. No signif-icant glaciers in the region
39–29 107º46'W.044º30'N.
1409–17285 05 Sep 73 46 0 Small glaciers in the Bighorn Mountains, Wyo. Snow in the highlands
39–29 107º46'W.044º30'N.
5147–17022 13 Sep 75 40 0 Excellent image of Bighorn Mountains, Wyo.
40–29 109º12'W.044º30'N.
5490–16444 21 Aug 76 43 0 Some snow in the highlands. Glaciers and moraines in the Beartooth Mountains, Absaroka Range, Wyo.
40–29 109º12'W.044º30'N.
2244–17224 23 Sep 75 39 0 Small glaciers in the Beartooth Mountains, Wyo.
40–30 109º44'W.043º05'N.
21720–17195 08 Oct 79 35 5 Excellent MSS image. Glaciers and moraines of the Wind River Range (fig. 18), Wyo.
40–30 109º44'W.043º05'N.
30573–17231– C 29 Sep79 38 0 Good Landsat 3 RBV image of Wind River Range moraines, Wyo. Archived by USGS–SGP
40–30 109º44'W.043º05'N.
30915–17131– D 05 Sep 80 44 0 Superb Landsat 3 RBV image of moraines and glaciers of the Wind River Range, Wyo. Archived by USGS–SGP
40–32 110º46'W.040º14'N.
6000–16574 18 Oct 77 31 0 No significant glaciers in the region. Good image of moraines of Uinta Mountains, Utah (fig. 21)
40–32 110º46'W.040º14'N.
30933–17133– A 23 Sep 80 40 0 Moraines and cirques in the western Uinta Mountains, Utah. Archived by USGS–SGP
40–32 110º46W.040º14'N.
30933–17133– B 23 Sep 80 40 5 Moraines and cirques in the eastern Uinta Mountains, Utah. Archived by USGS–SGP
41–28 110º04'W.045º55'N.
2965–17034 13 Sep 77 38 0 Crazy Mountains, Mont. No significant glaciers in the region
41–29 110º38'W.044º30'N.
21685–17241 03 Sep 79 45 0 Northern part of Teton Range, Wyo. No significant glaciers in the region

GLACIERS OF THE CONTERMINOUS UNITED STATES J341
41–30 111º10'W.043º05'N.
5509–16492 09 Sep 76 39 0 Central western Wyoming and eastern Idaho. No sig-nificant glaciers in the region
42–28 111º30'W.045º55'N.
1790–17354 21 Sep 74 39 0 Southwestern Montana. No significant glaciers in the region
42–29 112º04'W.044º30'N.
1790–17361 21 Sep 74 40 0 Southwestern Montana and northeastern Idaho. No significant glaciers in the region
42–33 114º08'W.038º49'N.
22064–17363 16 Sep 80 45 0 Wheeler Peak, Nev. No significant glaciers in the region
43–28 112º56'W.045º55'N.
30558–17395 14 Sep 79 41 0 Western Montana. Good image of moraines. No signif-icant glaciers in the region
43–29 113º30'W.044º30'N.
1791–17415 22 Sep 74 40 0 Eastern Sawtooth Range, Idaho. No significant gla-ciers in the region
43–30 114º02'W.043º05'N.
22029–17405 12 Aug 80 51 0 Southern Sawtooth Range, Idaho. No significant gla-ciers in the region
44–26 113º09'W.048º44'N.
30523–17452 10 Aug 79 49 5 Glacier National Park and Lewis Range, Mont. Some previous winter snow in the highlands (fig. 17)
44–26 113º09'W.048º44'N.
30559–17445 15 Sep 79 39 0 Glacier National Park and Lewis Range, Mont.
44–26 113º09'W.048º44'N.
30919–17342– C 09 Sep 80 39 0 Glacier National Park and Lewis Range, Mont. Archived by USGS–SGP
44–27 113º47'W.047º20'N.
30523–17454 10 Aug 79 50 0 Flathead, Mission, and Swan Ranges, Mont. No signif-icant glaciers in the region
44–28 114º22'W.045º55'N.
2230–17452 09 Sep 75 43 0 Bitterroot Range, Idaho- Mont. No significant glaciers in the region
44–28 114º22'W.045º55'N.
30559–17454 15 Sep 79 41 0 Bitterroot Range, Idaho- Mont. No significant glaciers in the region
44–29 114º56'W.044º30'N.
2626–17371 09 Oct 76 33 0 Sawtooth Range, Idaho. Some snow in the highlands. No significant glaciers in the region (fig. 20)
44–29 114º56'W.044º30'N.
30559–17460 15 Sep 79 42 0 Sawtooth Range, Idaho. No significant glaciers in the region
44–35 117º56'W.035º58'N.
1396–18001 23 Aug 73 54 0 Southern Sierra Nevada, Calif. No significant glaciers in the region
45–26 114º36'W.048º44'N.
22085–17505 07 Oct 80 31 0 Glacier National Park and Lewis Range. Cabinet Mountains, Mont.
45–26 114º36'W.048º44'N.
30542–17505– B 29 Aug 79 44 5 Glacier National Park and Lewis Range, Mont.
45–27 115º13'W.047º20'N.
21653–17452 02 Aug 79 51 5 Western Montana. No significant glaciers in the region
45–28 115º48'W.045º55'N.
21293–17323 07 Aug 78 49 0 Western Sawtooth Range, Idaho. No significant gla-ciers in the region
45–29 116º22'W.044º30'N.
21293–17325 07 Aug 78 49 0 Southwestern Sawtooth Range, Idaho. No significant glaciers in the region
45–34 118º54'W.037º24'N.
30578–17532 04 Oct 79 40 0 Sierra Nevada, Calif. No significant glaciers in the region (fig. 13)
45–34 118º54'W.037º24'N.
30578–17532– A 04 Oct 79 40 0 Northern Sierra Nevada, Calif. (fig. 14). Archived by USGS–SGP
45–34 118º54'W.037º24'N.
30578–17532– D 04 Oct 79 40 0 Southern Sierra Nevada, Calif. (fig. 15). Archived by USGS–SGP
46–26 116º02'W.048º44'N.
30561–17561 17 Sep 79 38 0 Cabinet Mountains, Idaho-Mont. No significant gla-ciers in the region
T
ABLE
2
.—Optimum Landsat 1, 2, and 3 MSS and RBV images of glaciers of the western conterminous United States
—Continued
[See fig. 5 for explanation of symbols used in “code” column]
Path-Row
Nominal scene center
(lat-long)
Landsat identification
numberDate
Solar elevation
angle (degrees)
CodeCloud cover
(percent)Remarks
J342 SATELLITE IMAGE ATLAS OF GLACIERS OF THE WORLD
46–29 116º39'W.047º20'N.
1380–18093 07 Aug 73 53 0 Wallowa Mountains, Oreg. No significant glaciers in the region
46–33 119º52'W.038º49'N.
30561–17591 17 Sep 79 45 0 Northern Sierra Nevada, Calif. No significant glaciers in the region
48–31 121º45'W.041º40'N.
21710–18055 28 Sep 79 39 0 Mount Shasta, Calif.
48–31 121º45'W.041º40'N.
30905–17595– C 26 Aug 80 47 15 Mount Shasta, Calif. Archived by USGS–SGP
49–26 120º20'W.048º44'N.
21657–18080 6 Aug 79 49 10 Northern Cascade Range, Wash.
49–27 120º57'W.047º20'N.
1419–18251 15 Sep 73 41 0 Northern Cascade Range, Mount Rainier, Wash.
49–27 120º57'W.047º20'N.
30888–18043– C 09 Aug 80 49 0 Mount Rainier, Wash. (fig. 10). Archived by USGS–SGP
49–28 121º32'W.045º55'N.
22053–18143 05 Sep 80 43 0 Mount St. Helens, Goat Rocks, Mount Adams, Mount Hood, Wash. (fig. 12)
49–28 121º32'W.045º55'N.
30888–18050– B 09 Aug 80 49 0 Mount Adams, Wash. Archived by USGS–SGP
49–28 121º32'W.045º55'N.
30942–18031– D 02 Oct 80 34 0 Mount Hood, Wash. Archived by USGS–SGP
49–29 122º06'W.044º30'N.
21657–18091 06 Aug 79 51 0 Mount Jefferson, Three Sisters Range, Oreg. Some previous winter snow in the highlands.
49–29 122º06'W.044º30'N.
30150–18160– B 02 Aug 78 53 0 Mount Jefferson, Oreg. Some previous winter snow in the highlands. Archived by USGS–SGP
49–29 122º06'W.044º30'N.
30150–18160– D 02 Aug 78 53 0 Three Sisters Range, Oreg. Some previous winter snow in the highlands. Archived by USGS–SGP
49–30 122º39'W.043º05'N.
1041–18271 02 Sep 72 48 0 Southern Oregon. No significant glaciers in the region. Some snow in the highlands
49–31 123º11'W.041º40'N.
21693–18111 11 Sep 79 44 0 Salmon and Trinity Mountains, Mount Shasta, Calif.
50–26 121º46'W.048º44'N.
1420–18303 16 Sep 73 39 0 Northern Cascade Range, Wash.
50–26 121º46'W.048º44'N.
30223–18211– D 14 Oct 78 29 0 Northern Cascade Range, Wash. Archived by USGS–SGP
50–27 122º23'W.047º20'N.
30583–18190 09 Oct 79 32 0 Northern Cascade Range, Olympic Mountains, Mount Rainier, Wash.
50–27 122º23'W.047º20'N.
30889–18102– D 10 Aug 80 48 0 Mount Rainier, Wash. Archived by USGS–SGP
50–28 122º58'W.045º55'N.
30889–18104– B 10 Aug 80 48 0 Mount St. Helens, Wash. (fig. 12C) Archived by USGS–SGP
51–27 123º50'W.047º20'N.
2993–17590 11 Oct 77 28 0 Olympic Mountains, Wash. (fig. 9)
51–27 123º50'W.047º20'N.
30926–18144– B 16 Sep 80 38 0 Olympic Mountains, Wash. Archived by USGS-SGP
1
USGS-SGP is the U.S. Geological Survey-Satellite Glaciology Project (renamed the Glacier Studies Project).
T
ABLE
2
.—Optimum Landsat 1, 2, and 3 MSS and RBV images of glaciers of the western conterminous United States
—Continued
[See fig. 5 for explanation of symbols used in “code” column]
Path-Row
Nominal scene center
(lat-long)
Landsat identification
numberDate
Solar elevation
angle (degrees)
CodeCloud cover
(percent)Remarks

GLACIERS OF THE CONTERMINOUS UNITED STATES J343
Glaciers of the State of Washington
It has been estimated that 75 percent of the glaciers in the United Statesexclusive of Alaska are in the State of Washington (Meier, 1961a). The gla-ciers of Washington are conveniently grouped into six geographic divisions:(1) the north Cascades (northern Cascade Range), including the area fromthe Canadian border south to Snoqualmie Pass and from the Twin SisterMountain area (about 15 km southwest of Mount Baker) in the west to long120º W. in the east; (2) the Olympic Peninsula; (3) Mount Rainier; (4) theGoat Rocks area (about 50 km southeast of Mount Rainier); (5) MountAdams; and (6) Mount St. Helens. Landsat images and other illustrationsfor each of the geographic divisions accompany the following discussions ofeach region.
Glaciers of the North Cascade Range
The most recent and comprehensive glacier inventory of the north Cas-cades, made in late 1969 by the USGS, shows that about one-half of the gla-ciers in Washington are in this region (Post and others, 1971). The sourcematerial for this inventory consisted of USGS large-scale (7.5-minute quad-rangles, 1:24,000-scale) topographic map sheets and USGS oblique aerialphotographs. The oblique aerial photography was used where maps werenot available and also where the termini positions needed to be updated tothe inventory date of 1970. This inventory counted 756 glaciers that had atotal area of 267 km
2
. Since that time, several additional small glaciers havebeen “discovered”; however, these small glaciers do not increase the totalarea significantly. The major concentrations of glaciers in the north Cas-cades are on Mount Baker, at the head of the Thunder Creek drainage, andon Glacier Peak. The largest glacier in this area is the Boston Glacier (lat48º45' N., long 121º01' W.), which has an area of 7.0 km
2
. The longest gla-cier, the Deming Glacier (lat 48º45' N., long 121º51' W.) on Mount Baker, is4.8 km in length.
The north Cascades region is characterized by high relief; many of thevalley floors are less than 500 m in elevation, whereas the nearby summitsare in excess of 2,500 m. Precipitation is heavy; annual precipitation is com-monly more than 4 m near the west side of the crest of the Cascade Range.On the east side of the crest, precipitation is considerably less.
The South Cascade Glacier is located within the north Cascades region atlat 48º22' N., long 121º03' W. Not necessarily representative of the glaciers ofthe north Cascades, it is a relatively flat glacier and has no major ice falls.However, it would be difficult to pick any one glacier that is typical of thenorth Cascades. This glacier has been studied in detail since 1957 (Meierand Tangborn, 1965; Meier and others, 1971; Fountain and Fulk, 1984). It isabout 3 km long and 2.5 km
2
in area and has an equilibrium line altitude(ELA) of 1,860 m. Studies in the South Cascade Glacier basin have beendirected toward glacier mass balance (Meier, 1961b; Meier and Post, 1962;Tangborn, 1965, 1968; Tangborn and others, 1975, 1977; Krimmel, 1989,1993, 1994; Meier and others, 1980; Mayo, 1984; Walters and Meier, 1989),basin water balance (Tangborn, 1963; Krimmel and others, 1978; Sullivan,1994; Krimmel, 1995, 1996, 1997, 1998, 1999, 2000, 2001) ice dynamics andsubglacier and englacier water flow (Fountain, 1989, 1992a, b, 1993, 1994),and many other related topics (Meier, 1958, 1967; Tangborn, 1962).
The history of the South Cascade Glacier shows advances at about3000 B.C. and during the 16th and 19th centuries. A sheared-off tree stumpsome 100 m above the 1970 ice level was dated by the radiocarbon methodat about 5,000 years B.P. (before present). This suggests that the glacierhad been at its present size or smaller for some centuries prior to 3000 B.C.

J344 SATELLITE IMAGE ATLAS OF GLACIERS OF THE WORLD
Figure 6.
—Photographic record of SouthCascade Glacier, Wash., from 1928 to 1996.
A
,In 1928, the glacier had been retreating sincethe neoglaciation maximum length in thelate 19th century. The average retreat ratefrom 1928 to 1980 was about 18 m a
–1
; themaximum retreat rate took place from about1950 to 1960 as the glacier retreated acrossthe lake. The retreat rate during the 1970’swas about 12 m a
–1
. All the glaciers of thenorth Cascades experienced an overallretreat during the 20th century. Obliqueaerial photograph by Wernstadt, U.S. ForestService.
B
, South Cascade Glacier in 1939.Photograph taken by Watson.
C
, South Cas-cade Glacier in 1955. Photograph taken byRichard Hubley, University of Washington.
D
,
E
, see opposite page
Sometime after 3000 B.C., the glacier made an advance that ended in the16th century about 1.5 km downvalley from the 1970 position. The glacierretreated an unknown distance from the 16th century position and thenreadvanced to nearly the 16th century position near the end of the 19thcentury (Miller, 1969).
Since the late 19th century advance of the South Cascade Glacier, its ter-minus has been continuously receding. A 1928 oblique aerial photograph

GLACIERS OF THE CONTERMINOUS UNITED STATES J345
Figure 6.
—
D
, South Cascade Glacier on 10October 1983. Photograph number83RI–188 taken by R.M. Krimmel, USGS.
E
,
South Cascade Glacier on 9 October1996. Black-and-white oblique aerial pho-tograph from original 35-mm color slidetaken by R.M. Krimmel, USGS.
(fig. 6
A
) shows the terminus at today’s west shore of South Cascade Lake.A photograph from 1939 (fig. 6
B
) shows about 100 m of lake opened, andthe first vertical aerial photograph, from 1953, shows about one-half of thelake opened. By 1955, more of the lake was free of glacier ice (fig. 6
C
), andby 1968, the entire lake was clear of glacier ice. Since 1968, recession hascontinued, averaging about 12 m a
–1
, although very minor advances havebeen recorded during this period. During the winter, ice motion continuesbut is not offset by ice ablation, and a seasonal advance takes place. In1972, extremely heavy winter snowpack covered the terminus well into latesummer. Because the snow protected the terminus from melting, itadvanced a few meters. Figure 6
D
, showing the glacier in 1983, is an exam-ple from the collection of recent large-format oblique and vertical aerialphotographs archived by the University of Alaska’s Geophysical Institute in

J346 SATELLITE IMAGE ATLAS OF GLACIERS OF THE WORLD
Figure 7.
—Ice-level changes of South Cas-cade Glacier, Wash.
A
, South Cascade Gla-cier in July 1958. Photograph taken byAustin Post, USGS.
B
, South Cascade Gla-cier in August 1979. Photograph shows aloss of about 30 m near the equilibriumline since 1958. The dashed line is the 1958position of the ice edge. The dotted lineindicates the level of the active glacier ice.Photograph taken by R.M. Krimmel,USGS.
C
,
D
,
E
, see opposite page.
Fairbanks, Alaska. The University of Alaska archive includes most of themajor glaciers in the United States. Figure 6E shows the position of the gla-cier terminus in 1996.
Figure 6 illustrates the exceptional photographic record for South Cas-cade Glacier. Figure 7 illustrates a time sequence of terrestrial photographsused for qualitative analysis of ice-level changes.
The annual mass balance of South Cascade Glacier has ranged from–2.6 m to +1.4 m and has had an average of –0.7 m from 1966 to 1995. Fig-ure 8 shows the cumulative mass balance from 1884 to 1995. Annual runofffrom the entire area of the basin (fig. 3) is normally about 4 m. Precipitationaccounts for 93 percent of this total; the remainder is derived from loss ofice mass.
South Cascade Glacier has an average thickness of 100 m and a maxi-mum thickness of 220 m (Krimmel, 1970). Its average velocity is about10 m a–1. The maximum velocity, about 30 m a–1, is found near the center ofthe lower glacier. Maximum seasonal velocity takes place in the early sum-mer and is 140 percent of the annual velocity; minimum velocity takes placeduring the fall and winter.
South Cascade Glacier is one of only a few glaciers worldwide that havebeen analyzed with regard to their dynamic response to change in climate.A hypothetical 1-m addition to the glacier surface for only 1 year wouldproduce a thickening of the terminus that would amount to 5 m after 23years. This would be followed by a slow return to normal, but it would havean excess of 0.6 m persisting at the terminus 100 years later. The actual gla-cier response is a combination of responses to weather events for each yearof the last century or more, and thus it is complex and has a long “memory”(Nye, 1965).
Balance measurements have been made at numerous other north Cas-cades glaciers, and for the most part, these show trends similar to those atSouth Cascade Glacier. Vesper Glacier was measured during balance years1974–75 (Dethier and Frederick, 1981); Pelto made measurements onColumbia, Daniels, Foss, Ice Worm, Lower Curtis, Yawing, Rainbow, Spi-
der, and Lynch Glaciers from 1984 to 1994 (Pelto, 1996); and North Cas-cades National Park personnel measured North Klawatti, Silver, Noisy, andSandelee Glaciers during 1992–96.

GLACIERS OF THE CONTERMINOUS UNITED STATES J347
Figure 7.—C, Lower South Cascade Glacier in July 1958.Photograph taken by Austin Post, USGS. D, Lower SouthCascade Glacier in August 1979. Photograph shows a lossof about 60 m since 1958. The dashed line is the 1958 posi-tion of the ice edge. Photograph taken by R.M. Krimmel,USGS. E, Lower South Cascade Glacier in August 1978. Iceloss on lower Cascade Glacier at the terminus from 1970 to
1978 was about 30 m, and recession during that period wasabout 90 m. The dashed line is the 1970 terminus positioninferred from, but not visible in, a 1970 photograph. Dottedlines show 1970 levels of ice in areas between the photo-graph point and the far edge of the glacier. The inconspicu-ous building on the extreme left is 2 m high. Photographtaken by R.M. Krimmel, USGS.

J348 SATELLITE IMAGE ATLAS OF GLACIERS OF THE WORLD
0
−10
−20
−30
−40
−50
−60
−70
−80
−90
10
1880 1890 1900 1910 1920 1930 1940 1950 1960 1970 1980 1990 2000
CUM
ULAT
IVE
MAS
S BA
LAN
CE, I
N M
ETER
S
Figure 8.—Cumulative mass balance forSouth Cascade Glacier, Wash., for theyears 1884–1995 (adapted from Tangborn,1980). For the years 1884 to 1957, balancewas calculated by a precipitation-temper-ature model; the balance was directlymeasured for the years 1958–95.
Glaciers of the Olympic Peninsula
Storm systems affecting the Olympic Peninsula tend to approach fromthe west and southwest. Because the Olympic Peninsula (fig. 9) forms abarrier to the moist clouds from the Pacific Ocean, strong precipitationgradients are found from the west to the east. Although most coastal sta-tions receive 2 m of precipitation, about 3 m of precipitation is received 15km inland, and at the crest of the Olympic Mountains 60 km inland, theannual precipitation is 6 m. Farther inland, to the northeast of the sum-mits, the precipitation drops off rapidly to as low as 0.4 m. Because thefreezing level during winter is often below 1,000 m, snow is heavy in themountains, and glaciers exist on many of the higher peaks (Phillips andDonaldson, 1972).
The major glacier concentration is on the Mount Olympus massif, wherethree major glaciers, the Blue, Hoh, and White Glaciers, and numerousother smaller glaciers account for about 80 percent of the area of perennialsnow and ice in the Olympic Mountains. Small glaciers are found on MountAnderson at 2,233 m and on Mount Carrie at 2,133 m; numerous small gla-ciers or ice patches exist above 2,000 m in shaded areas on these and otherpeaks. The total area of perennial snow and ice on the Olympic Mountainsis about 45.9 km2 (Spicer, 1986).
The Blue Glacier is one of the most extensively studied glaciers in theUnited States. The variations of the Blue Glacier during recent centuries(Heusser, 1957) and its mass balance (LaChapelle, 1965), structure (Allenand others, 1960), internal deformation (Shreve and Sharp, 1970), andflow (Meier and others, 1974) have been the subjects of major researchefforts.

GLACIERS OF THE CONTERMINOUS UNITED STATES J349
Strait of Juan de Fuca
Hoo
dC
anal
Chehalis RiverChehalis River
Pug
etS
oun
d
Quinault River
Quinault River
Queets River
Queets River
Hoh
Rive
r
HohRi
ver
Mt. AndersonMt. Anderson
Mt. CarrieMt. Carrie
Mt. OlympusMt. Olympus
124°30'W
125°W
124° 123°30' 123°
48°N
47°30'
47°
10 0 10 20 30 KILOMETERS
APPROXIMATE SCALE
Pacific Ocean
Figure 9.—Landsat 2 MSS false-color composite image(2993–17590, bands 4, 5, and 7; 11 October 1977; Path 51,Row 27) of the Olympic Peninsula, Puget Sound, and vicin-ity, Wash. The Olympic Peninsula is a very distinct physio-graphic unit. To the west is the Pacific Ocean, to the north isthe Strait of Juan de Fuca, to the east is the Hood Canal andPuget Sound, and to the south is the valley of the ChehalisRiver. Relief in the Olympic Mountains is extreme. Rela-tively low valleys extend into the interior, and the 300-mcontour is within 8 km of the 2,429-m high Mount Olympus(north of image center). Other peaks greater than 2,000 m
in elevation are numerous; all are east of the Mount Olym-pus massif. Evidence of the much greater extent of past gla-ciation is easily seen. The valleys of the Hoh, Queets, andQuinault Rivers, all draining to the west, have the classicbroad, relatively straight shape that indicates erosionalmodification by glaciers. Glaciers from these valleys endedin piedmont lobes. Much smaller glaciers existed from therange toward the east because a precipitation pattern simi-lar to the present probably existed during past glacials. Evi-dence of past glacier cover in Puget Sound is indicated bythe small lakes and fjords.
J350 SATELLITE IMAGE ATLAS OF GLACIERS OF THE WORLD
Carbon
Glacier
Carbon
Glacier
Mt. Rainier
Cowlitz
Gl.
Cowlitz
Gl.
Tahoma GlacierPuyallup Glacier
Nis
qu
ally
Gl.
Nis
qu
ally
Gl.
Emm
ons
Gl.
Emm
ons
Gl.
N
0 5 KILOMETERS
Winthrop
Glacier
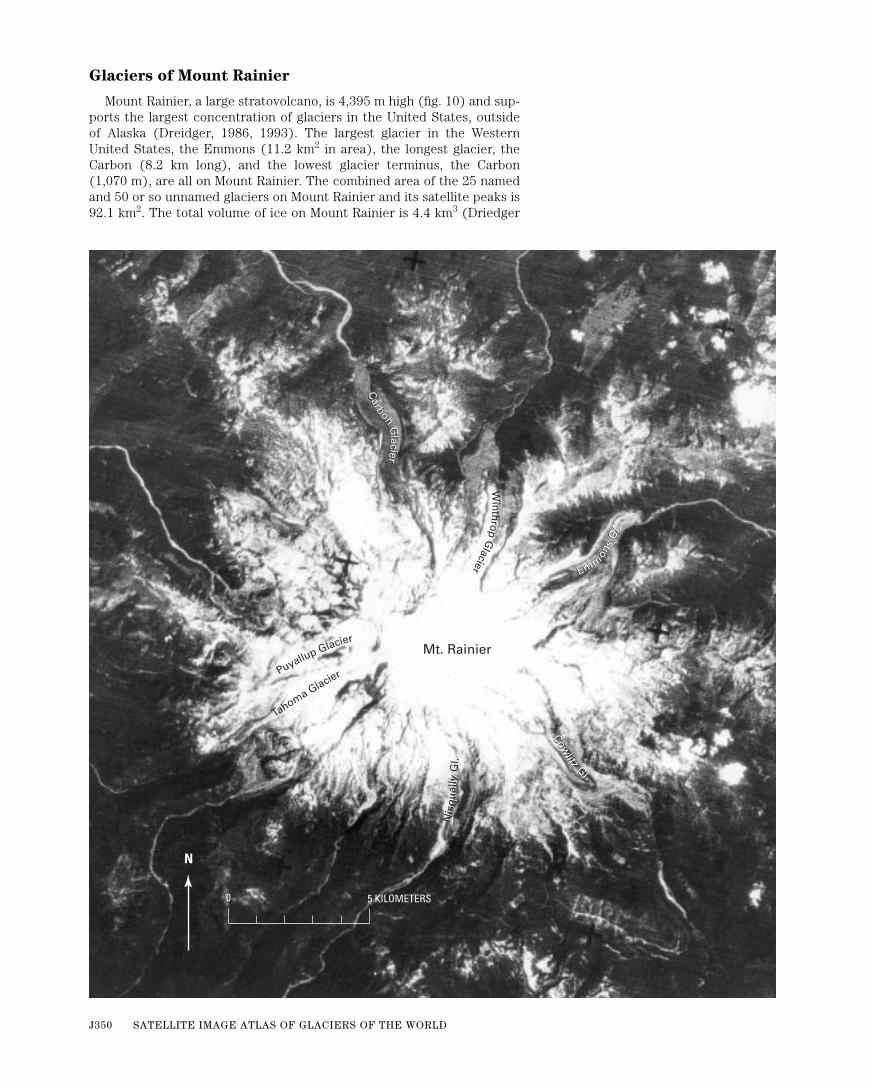
Glaciers of Mount Rainier
Mount Rainier, a large stratovolcano, is 4,395 m high (fig. 10) and sup-ports the largest concentration of glaciers in the United States, outsideof Alaska (Dreidger, 1986, 1993). The largest glacier in the WesternUnited States, the Emmons (11.2 km2 in area), the longest glacier, theCarbon (8.2 km long), and the lowest glacier terminus, the Carbon(1,070 m), are all on Mount Rainier. The combined area of the 25 namedand 50 or so unnamed glaciers on Mount Rainier and its satellite peaks is92.1 km2. The total volume of ice on Mount Rainier is 4.4 km3 (Driedger

GLACIERS OF THE CONTERMINOUS UNITED STATES J351
and Kennard, 1984, 1986). The potential for the interaction of volcanicactivity and the glacier-ice cover makes Mount Rainier a very dangerousvolcano that could produce, as it has in the geologic past, jökulhlaups(Driedger, 1988; Driedger and Fountain, 1989; Walder and Driedger,1995) and lahars (Walder and Driedger, 1993). Richardson (1968) dis-cussed jökulhlaups in the Pacific Northwest region.
Nisqually Glacier is the most accessible major glacier in the contermi-nous United States and offers numerous tourists their first closeup look at aglacier. This glacier also has the longest record of annual observations ofthe position of its terminus—since 1918—of any glacier in the WesternHemisphere. The history of the Nisqually Glacier is documented as well bynumerous early photographs (Veatch, 1969). Figure 11 is an example of anearly photograph of the glacier. The Nisqually Glacier has been the subjectof several glaciological research projects (Hodge, 1972, 1976, 1979). Since1931, annual measurements have been made of the change in thickness,and detailed topographic maps of the Nisqually Glacier were made by theUSGS from vertical aerial photography at scales of 1:10,000 (see Helikerand others, 1984; U.S. Geological Survey, 1978) and 1:12,000 dated 16August 1951, 4 September 1956, 19 August 1961, 25 August 1971, and 31August 1976. The Nisqually Glacier 1976 map sheet (1:10,000 scale) (U.S.Geological Survey, 1978) was preceded by four earlier map sheets:Nisqually Glacier 1931, 1936, 1941, and 1946, published in 1960; NisquallyGlacier 1951, 1956, and 1961, published in 1963; Nisqually Glacier 1966,published in 1968; and Nisqually Glacier 1971, published in 1973. The ter-minus receded almost continuously from the first observation in 1857through 1963 (Kautz, 1875; Heliker and others, 1984). In 1964, active iceadvanced, and this advance continued to 1969 (Sigafoos and Hendricks,1972). Advance began again in 1976 and was continued into 1982. Between1983 and 1986, little change was noted in the terminus of Nisqually Glacier.From 1986 to 1990, a pronounced recession occurred, accompanied bythinning, and retreat was continuing in 2001 (Carolyn L. Driedger, oralcommun., 2001). Since 1857, the total recession has been 1,945 m, and thetotal advance, 294 m (Heliker and others, 1984). An intensive study duringthe late 1960’s and early 1970’s showed speeds that varied from 60 to160 mm d–1 near the terminus and from 200 to 700 mm d–1 near the equilib-rium line. The speed was seasonably dependent, the early summer speedbeing generally about two times the late fall speed (Hodge, 1974).
Figure 11.—Nisqually Glacier from the oldNisqually River bridge, Mount Rainier,Wash. The exact date and photographer ofthis photograph are unknown, but thedate is approximately 1900. This is anexample of a photograph that was pre-sumably taken for nonscientific reasonsbut now provides valuable information onthe position of the glacier terminus.
Figure 10.—(opposite page) Mount Rainier,Wash., from a part of Landsat 3 RBV image30888–18043–C on 9 August 1980 (Path 49,Row 27). The glacier termini are seenextending well beyond the snow-coveredhigher elevations in this Landsat image.Most of the glaciers terminate well abovethe vegetation trimlines, and the actual ter-mini are in places identifiable by a darkerperimeter where the steep glacier edgeforms a shadow. Landsat 3 RBV imagesallow terminus fluctuations as small as 30m to be observed under optimum condi-tions. Abbreviation: Gl., Glacier.
J352 SATELLITE IMAGE ATLAS OF GLACIERS OF THE WORLD
O R E G O NW A S H I N G T O N
Portland
ColumbiaRiv
er
Mt. Hood
Mt. Adams
Mt. St. Helens
Gilbert Peak
Goat Rocks
10 0 10 20 30 KILOMETERS
APPROXIMATE SCALE
122°30'W 122° 121°30' 121°
46°N
45°30'
A
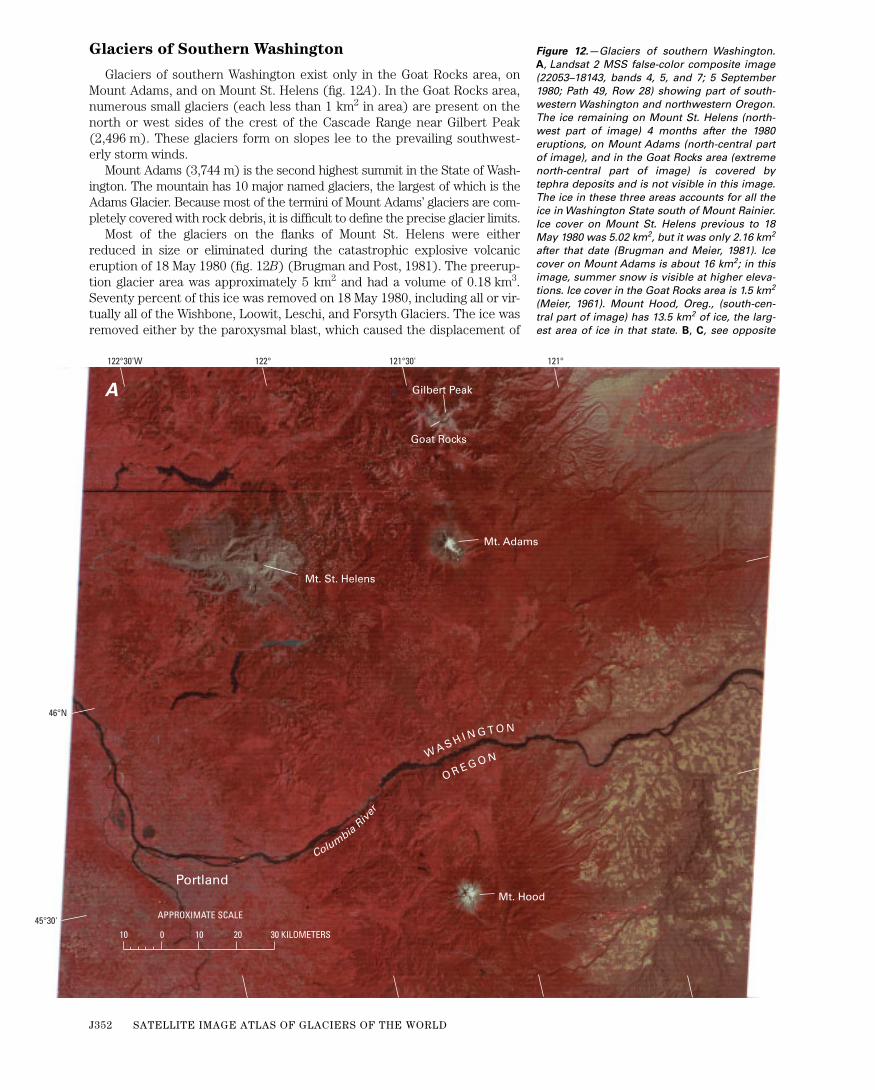
Figure 12.—Glaciers of southern Washington.A, Landsat 2 MSS false-color composite image(22053–18143, bands 4, 5, and 7; 5 September1980; Path 49, Row 28) showing part of south-western Washington and northwestern Oregon.The ice remaining on Mount St. Helens (north-west part of image) 4 months after the 1980eruptions, on Mount Adams (north-central partof image), and in the Goat Rocks area (extremenorth-central part of image) is covered bytephra deposits and is not visible in this image.The ice in these three areas accounts for all theice in Washington State south of Mount Rainier.Ice cover on Mount St. Helens previous to 18May 1980 was 5.02 km2, but it was only 2.16 km2
after that date (Brugman and Meier, 1981). Icecover on Mount Adams is about 16 km2; in thisimage, summer snow is visible at higher eleva-tions. Ice cover in the Goat Rocks area is 1.5 km2
(Meier, 1961). Mount Hood, Oreg., (south-cen-tral part of image) has 13.5 km2 of ice, the larg-est area of ice in that state. B, C, see opposite
Glaciers of Southern Washington
Glaciers of southern Washington exist only in the Goat Rocks area, onMount Adams, and on Mount St. Helens (fig. 12A). In the Goat Rocks area,numerous small glaciers (each less than 1 km2 in area) are present on thenorth or west sides of the crest of the Cascade Range near Gilbert Peak(2,496 m). These glaciers form on slopes lee to the prevailing southwest-erly storm winds.
Mount Adams (3,744 m) is the second highest summit in the State of Wash-ington. The mountain has 10 major named glaciers, the largest of which is theAdams Glacier. Because most of the termini of Mount Adams’ glaciers are com-pletely covered with rock debris, it is difficult to define the precise glacier limits.
Most of the glaciers on the flanks of Mount St. Helens were eitherreduced in size or eliminated during the catastrophic explosive volcaniceruption of 18 May 1980 (fig. 12B) (Brugman and Post, 1981). The preerup-tion glacier area was approximately 5 km2 and had a volume of 0.18 km3.Seventy percent of this ice was removed on 18 May 1980, including all or vir-tually all of the Wishbone, Loowit, Leschi, and Forsyth Glaciers. The ice wasremoved either by the paroxysmal blast, which caused the displacement of
GLACIERS OF THE CONTERMINOUS UNITED STATES J353
10 0 10 20 KILOMETERS
APPROXIMATE SCALE
N
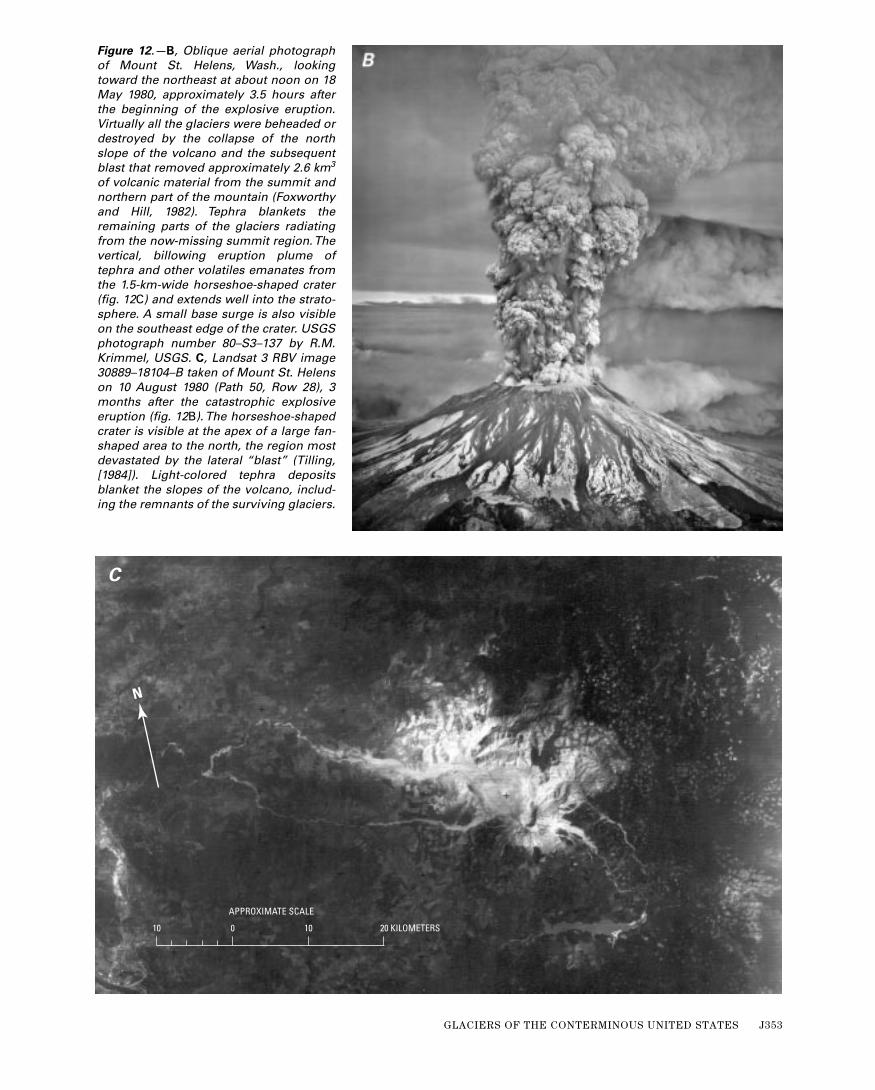
C
Figure 12.—B, Oblique aerial photographof Mount St. Helens, Wash., lookingtoward the northeast at about noon on 18May 1980, approximately 3.5 hours afterthe beginning of the explosive eruption.Virtually all the glaciers were beheaded ordestroyed by the collapse of the northslope of the volcano and the subsequentblast that removed approximately 2.6 km3
of volcanic material from the summit andnorthern part of the mountain (Foxworthyand Hill, 1982). Tephra blankets theremaining parts of the glaciers radiatingfrom the now-missing summit region. Thevertical, billowing eruption plume oftephra and other volatiles emanates fromthe 1.5-km-wide horseshoe-shaped crater(fig. 12C) and extends well into the strato-sphere. A small base surge is also visibleon the southeast edge of the crater. USGSphotograph number 80–S3–137 by R.M.Krimmel, USGS. C, Landsat 3 RBV image30889–18104–B taken of Mount St. Helenson 10 August 1980 (Path 50, Row 28), 3months after the catastrophic explosiveeruption (fig. 12B). The horseshoe-shapedcrater is visible at the apex of a large fan-shaped area to the north, the region mostdevastated by the lateral “blast” (Tilling,[1984]). Light-colored tephra depositsblanket the slopes of the volcano, includ-ing the remnants of the surviving glaciers.
J354 SATELLITE IMAGE ATLAS OF GLACIERS OF THE WORLD
the underlying bedrock and the landslide process, or by melting from pyro-clastic flows. The remaining snow and ice were covered with an average 1 mof tephra, which acted as in insulator against summer ablation (Driedger,1981). The Shoestring Glacier was the site of an ongoing ice-dynamics studyprevious to the eruptions of 1980. During the 18 May 1980 eruption, how-ever, 68 percent of this glacier, including the entire accumulation zone, wasremoved. Preeruption velocity was 20 to 50 cm d–1; posteruption velocitywas 10 to 20 cm d–1 (Brugman and Meier, 1981). The posteruption geometryof Mount St. Helens is such that a new glacier could form in the crater area(Jordan and Kieffer, 1982) (fig. 12C). The floor of the north-facing horse-shoe-shaped crater is at 1,880 m in elevation, has steep-sided walls thatenhance avalanche accumulation, is on the lee side of a steep ridge, so accu-mulation will be further enhanced, and has a northern exposure. In fact,snow from the previous winter was observed under rockfall debris in thecrater in the late summer of 1983 (R.J. Janda, oral commun.). It is unlikelythat a significant glacier will form in the crater, however, as long as the activelava-dome-building phase of Mount St. Helens continues.
Glaciers of the State of Oregon
Glaciers are found in Oregon on the Cascade Range volcanoes of MountHood (fig. 12A), Mount Jefferson, and Three Sisters Range, and in the Wal-lowa Mountains in eastern Oregon. Studies have been made to determinethe ice volume on Mount Hood and the Three Sisters Range in response torequirements for a volcanic-hazards assessment. The total ice area onMount Hood is 13.5 km2; the total volume is 0.16 km3 (Driedger and Ken-nard, 1986). The glaciers in the Wallowa Mountains may be locally signifi-cant, but they are less than 0.1 km2 and are insignificant at the 79-m pixelresolution of Landsat MSS images.
A photographic study of the Collier Glacier on the North Sister Peak dur-ing the period 1934–60 showed general recession (Hopson, 1960). A topo-graphic map of the Collier Glacier was compiled from aerial photographsacquired on 8 September 1958, on 8 September 1968, and on 29 September1979. A longitudinal elevation profile from this map shows that no majorchange in the thickness of the glacier took place between 1959 and 1979.The extreme upper part of the glacier was about 16 m thicker in 1979 thanin 1959; however, changes in the rest of the glacier were less than 5 m.
Glaciers of the State of California
Glaciers are present in California on Mount Shasta (4,319 m), in theTrinity Alps (approximately lat 41º N., long 123º W.), and in the high SierraNevada. The glaciers on Mount Shasta have a total area of 6.9 km2
(Driedger and Kennard, 1984). The glaciers in the Trinity Alps are insignifi-cant at the spatial resolution of the Landsat image.
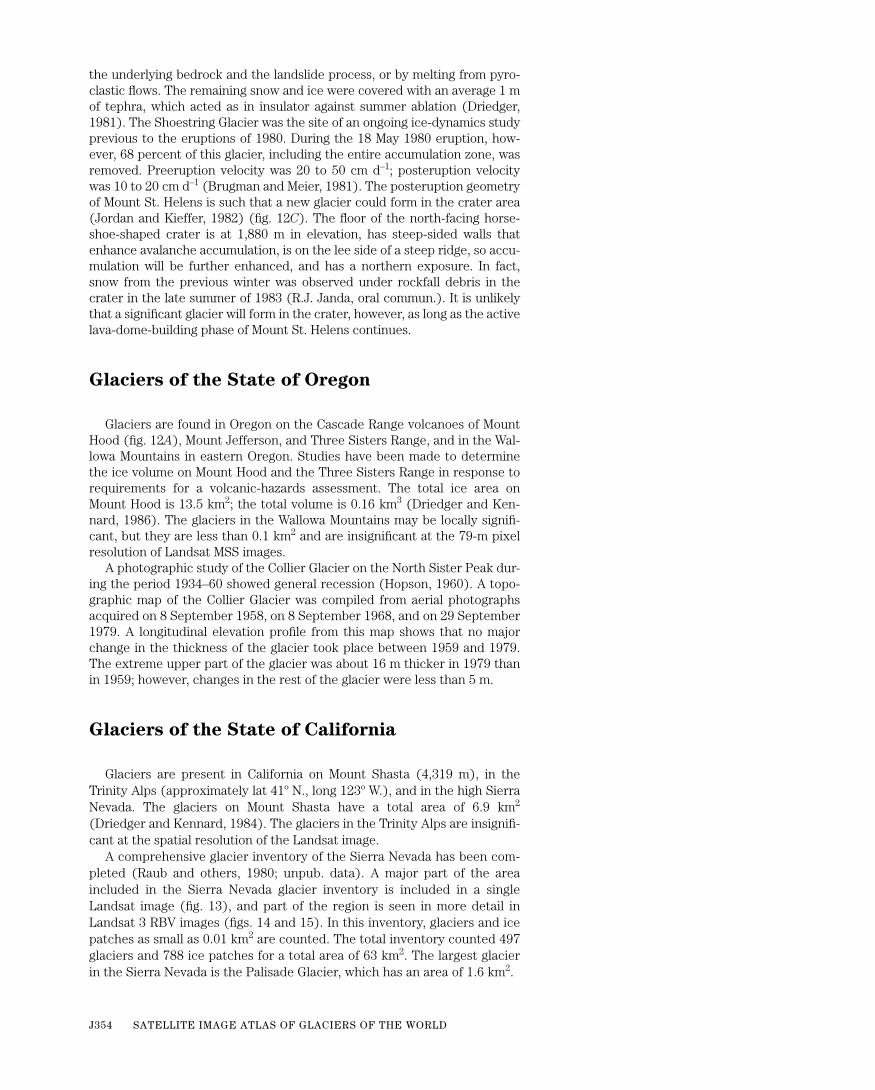
A comprehensive glacier inventory of the Sierra Nevada has been com-pleted (Raub and others, 1980; unpub. data). A major part of the areaincluded in the Sierra Nevada glacier inventory is included in a singleLandsat image (fig. 13), and part of the region is seen in more detail inLandsat 3 RBV images (figs. 14 and 15). In this inventory, glaciers and icepatches as small as 0.01 km2 are counted. The total inventory counted 497glaciers and 788 ice patches for a total area of 63 km2. The largest glacierin the Sierra Nevada is the Palisade Glacier, which has an area of 1.6 km2.

GLACIERS OF THE CONTERMINOUS UNITED STATES J355
Mono Lake
YosemiteValle
y
YosemiteValle
y
Tuolu mne ValleyTuolu mne Valley
SI E
RR
AN
EV
A
DA
SI E
RR
AN
EV
A
DA
10 0 10 20 30 KILOMETERS
APPROXIMATE SCALE
119° 118°30' 118°119°30'W
38°N
37°30'
37°
Figure 13.—Landsat 3 MSS false-color composite image (30578–17532,bands 4, 5, and 7; 4 October 1979; Path 45, Row 34) of the Sierra Nevada ofCalifornia. These mountains, extending from the northwest corner to thesoutheast corner of this image, have a total ice area of 63 km2, as deter-mined by a glacier inventory (Raub and others, 1980). This includes 497 gla-ciers and 788 ice patches too small to be counted as glaciers. None of these1,285 ice bodies, the largest of which is Palisade Glacier (1.6 km2), is signifi-cant at Landsat MSS resolution. The only significant glaciers in California notseen in this image cover 6.9 km2 on Mount Shasta (Driedger and Kennard,1986). Well-defined moraines extend eastward toward Mono Lake (north-central part of image) and westward in the glacier-carved Tuolumne andYosemite Valleys (northwest corner of the image).
J356 SATELLITE IMAGE ATLAS OF GLACIERS OF THE WORLD
10 0 10 KILOMETERSAPPROXIMATE SCALE
N
Figure 14.—Landsat 3 RBV image(30578–17532–A; 4 October 1979; Path 45,Row 34) of the high central Sierra Nevada,centered at lat 37º57' N. and long 119º18' W.,including Mono Lake (east-central part ofimage) and most of Yosemite National Park.The glaciers in this image are too small forany quantitative measurements. However,the extent of past glaciation can easily bemapped. The black rectangle, including thesouthwest part of Mono Lake, indicates themap area shown in figure 1.
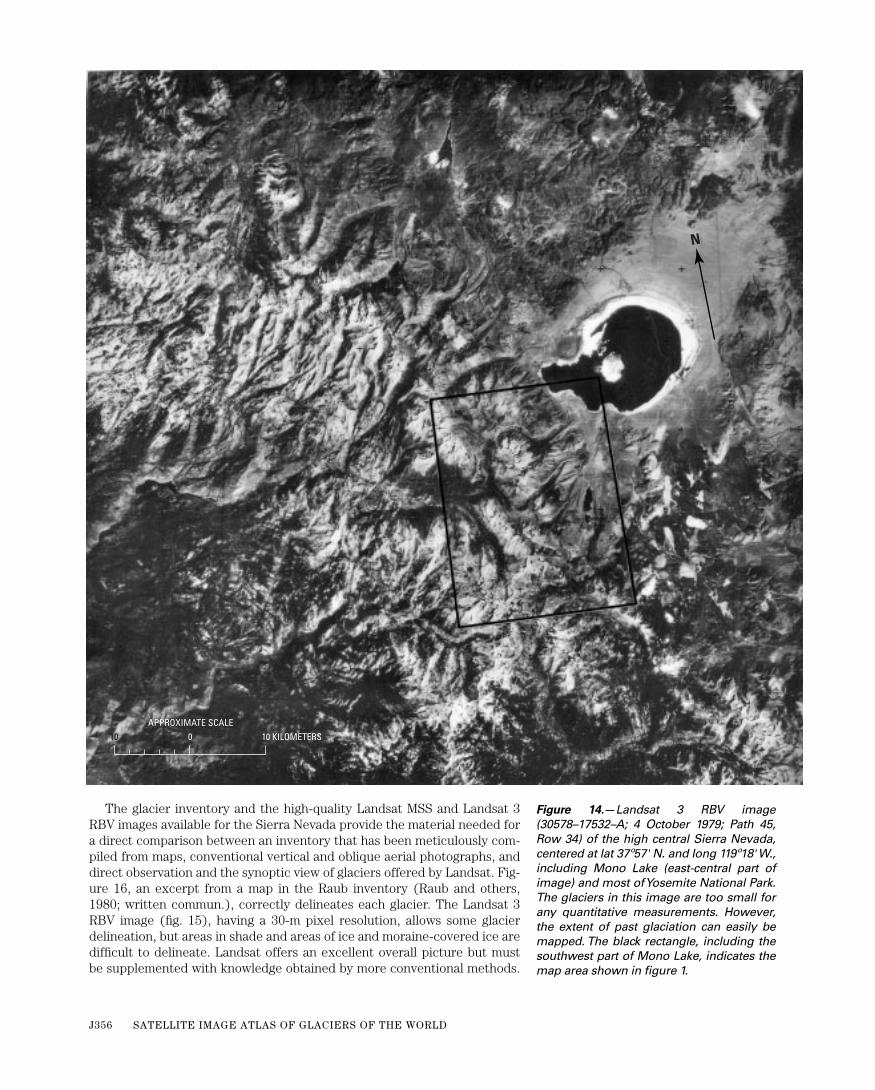
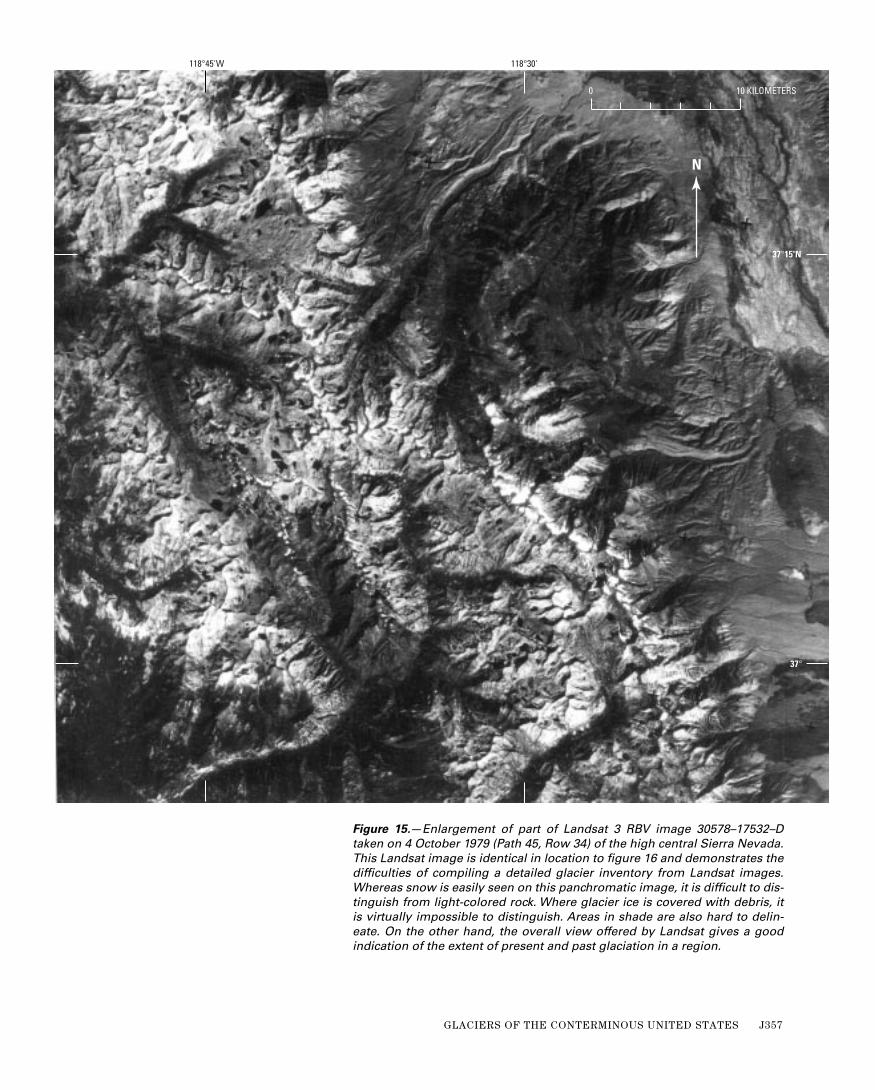
The glacier inventory and the high-quality Landsat MSS and Landsat 3RBV images available for the Sierra Nevada provide the material needed fora direct comparison between an inventory that has been meticulously com-piled from maps, conventional vertical and oblique aerial photographs, anddirect observation and the synoptic view of glaciers offered by Landsat. Fig-ure 16, an excerpt from a map in the Raub inventory (Raub and others,1980; written commun.), correctly delineates each glacier. The Landsat 3RBV image (fig. 15), having a 30-m pixel resolution, allows some glacierdelineation, but areas in shade and areas of ice and moraine-covered ice aredifficult to delineate. Landsat offers an excellent overall picture but mustbe supplemented with knowledge obtained by more conventional methods.
GLACIERS OF THE CONTERMINOUS UNITED STATES J357
0 10 KILOMETERS
N
37°15'N
118°30'118°45'W
37°
Figure 15.—Enlargement of part of Landsat 3 RBV image 30578–17532–Dtaken on 4 October 1979 (Path 45, Row 34) of the high central Sierra Nevada.This Landsat image is identical in location to figure 16 and demonstrates thedifficulties of compiling a detailed glacier inventory from Landsat images.Whereas snow is easily seen on this panchromatic image, it is difficult to dis-tinguish from light-colored rock. Where glacier ice is covered with debris, itis virtually impossible to distinguish. Areas in shade are also hard to delin-eate. On the other hand, the overall view offered by Landsat gives a goodindication of the extent of present and past glaciation in a region.
J358 SATELLITE IMAGE ATLAS OF GLACIERS OF THE WORLD
11
EXPLANATION
Glacier
Rock glacier
Major drainage-basin boundary
Drainage subbasin boundary
Drainage subbasin number
Number identifies glacier within subbasin and in table
118°45'W 118°30'
37°15'N
37°
0 10 KILOMETERS
4214
Figure 16.—Glaciers of the central Sierra Nevada west of Bishop, Calif.,delineated from vertical and oblique aerial photographs and direct fieldobservation. This map excerpt is from the Sierra Nevada glacier inventory(Raub and others, 1980). Glaciers much too small to be identified on a Land-sat image are shown. Compare this figure to figure 15, a Landsat 3 RBVimage of the same area.

GLACIERS OF THE CONTERMINOUS UNITED STATES J359
114°W 113°30' 113° 112°30'
49°N
48°30'
CANADA
U.S.A.
10 0 10 20 30 KILOMETERS
APPROXIMATE SCALE
Glacier National ParkGlacier National Park
Glaciers of the States of Montana, Wyoming,
Colorado, Idaho, Utah, and Nevada
Glaciers in the inland states of the Western United States are significantat the resolution of the Landsat image only in Glacier National Park (fig. 17)and the Beartooth Mountains, Mont., and in the Wind River Range, Wyo.(figs. 18 and 19). Small glaciers, generally less than 1 km2, are scatteredthroughout many of the high mountains of the Western States. These gla-ciers are discussed by Meier (1961a) and Field (1975) and are best identi-fied on USGS topographic maps and (or) aerial photographs. Figures 20,21, and 22 are selected images from these other mountain areas and showthe geomorphic evidence of major past glaciation.
A long history of research is documented on glaciers in Glacier NationalPark, Mont. (Johnson, 1980), in the Wind River Range, Wyo. (Wentworthand Delo, 1931), and in Colorado (Waldrop, 1964). Glacier-ice cores from
Figure 17.—Landsat 3 MSS false-colorcomposite image (30523–17452, bands 4,5, and 7; 10 August 1979; Path 44, Row 26)of Glacier National Park, Mont. Accordingto Graf (1977), the park contains 28.4 km2
of glacier ice, about two-thirds of Mon-tana’s glacier cover. Moraines extendbeyond lake-filled valleys into the plainsto the east and into forested valleys to thewest.

J360 SATELLITE IMAGE ATLAS OF GLACIERS OF THE WORLD
10 0 10 20 30 KILOMETERS
APPROXIMATE SCALE
43°30'N
43°
42°30'
110°30'W 110° 109°30' 109°
WIND
RIVERRANGE
Gannet Peak
Figure 18.—Landsat 2 MSS false-colorcomposite image (21720–17195, bands 4,5, and 7; 8 October 1979; Path 40, Row 30)of the glaciers of the Wind River Range inwest-central Wyoming. This range sup-ports the largest concentration of glaciersin the Rocky Mountains of the UnitedStates. Graf (1977) reported a total of 31.6km2 of ice in this range and a total forWyoming glacier cover of 35 km2. Highpeaks (up to 4,210 m) show negligiblenew snow. Moraines extend 50 kmtoward the northeast and 35 km towardthe southwest from the crest of therange. Overdeepened valleys are nowoccupied by lakes.
the Wind River Range have been used to study changes in atmosphericquality and climate (Naftz, Miller, and See, 1991; Naftz, Rice, and Ranville,1991; Naftz, 1993). Glaciological studies have also been carried out on theUpper Fremont Glacier, Wyo. (Naftz and Smith, 1993). Reed (1964, 1965,1967) carried out glaciological studies on Teton Glacier, Grand TetonNational Park, Wyo.

GLACIERS OF THE CONTERMINOUS UNITED STATES J361
MammothGlacier
Minor Glacier
Dinwoody Glacier
Dinwoody Glacier
HelenGlacier
HelenGlacier
GannettGlacier
GannettGlacier
Fremont GlaciersFremont Glaciers
Gannett Peak
Figure 19.—Oblique aerial photograph taken on 6 August 1979 from abovethe Continental Divide in the Wind River Range, Wyo.; the view is toward thesoutheast. The Minor and Mammoth Glaciers are in the foreground. The gla-ciers flowing away from the viewer on the east side of the divide are, fromleft to right, Gannett, Dinwoody, Helen, and Fremont Glaciers.

J362 SATELLITE IMAGE ATLAS OF GLACIERS OF THE WORLD
Figure 20.—Enlargement of part of a Landsat 3 RBV image(30929–16504–C; Path 36, Row 32) that includes most of the gla-ciers in the State of Colorado. It was taken on 19 September 1980and is centered at about lat 40º12' N. and 105º30' W. The areashown extends from the city of Boulder on the east to Lake Granby
on the west, to Rocky Mountain National Park on the north, and tonear Berthod Pass on the south. The glaciers are only discernibleas small snow patches in cirques in the Rocky Mountains along theeast side of the Continental Divide. Moraines extend both east andwest from the divide.
N
Rocky MountainNational Park(approximate)
CONT
INE
NT
AL
DI V
IDE
CONT
INE
NT
AL
DI V
IDE
Lake
Granby
BoulderBoulder
0 10 KILOMETERS0 10 KILOMETERS
Rocky MountainNational Park(approximate)

GLACIERS OF THE CONTERMINOUS UNITED STATES J363
10 0 10
115°30' 115° 114°30' 114°
45°N
44°30'
44°
116°W
20 30 KILOMETERS
APPROXIMATE SCALEAPPROXIMATE SCALE
30 KILOMETERS2010 0 10
CascadeReservoir
Challis
Stanley
Payette Lake
Figure 21.—The Sawtooth Range of south-central Idaho covers an extensivearea and has numerous peaks 3,500–3,800 m in elevation. Glacier cover inIdaho, all of it in the Sawtooth Range, is estimated to be 1 km2, but it onlyexists as small ice patches in protected areas where the snowpack is locallyincreased by wind redeposition. This Landsat 2 MSS false-color compositeimage (2626–17371, bands 4, 5, and 7; 9 October 1976; Path 44, Row 29), itscenter about 140 km northeast of Boise, Idaho, shows new snow at higherelevations. Extensive moraines are seen in valleys in the southeast quadrantof the image.
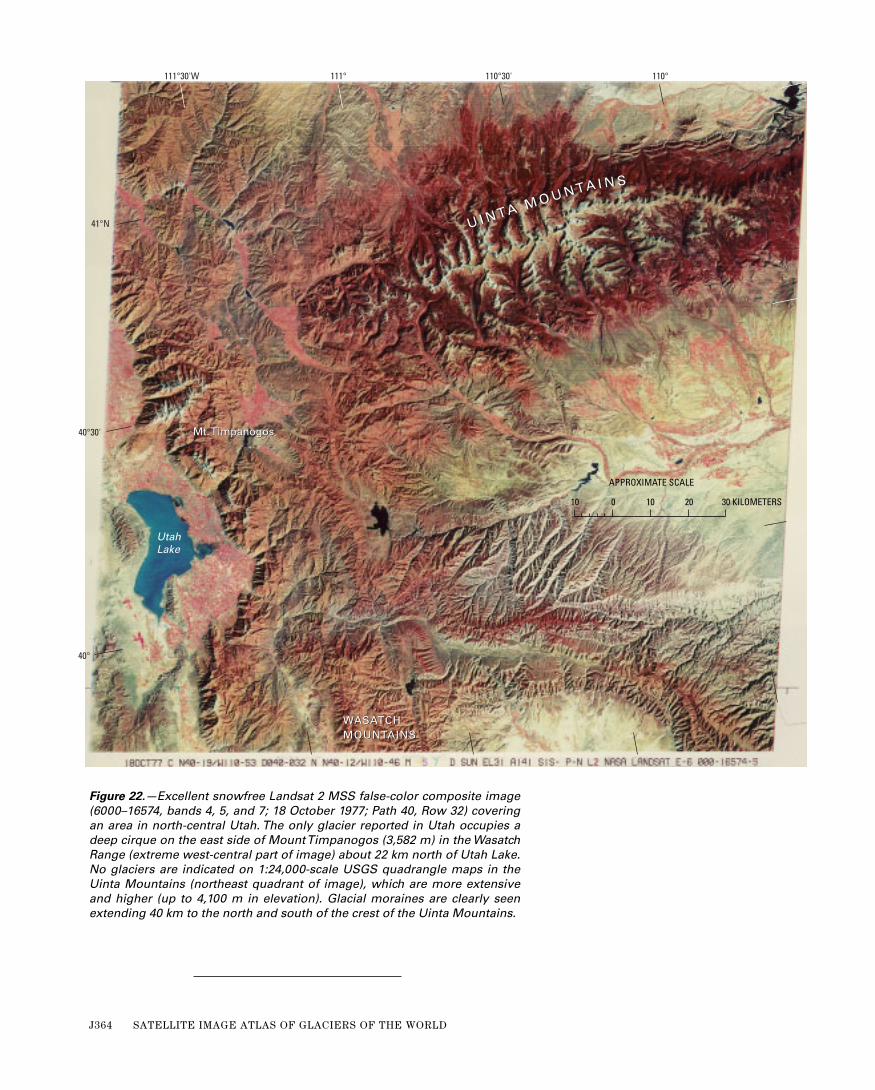
J364 SATELLITE IMAGE ATLAS OF GLACIERS OF THE WORLD
U I N TA M O U N TA I N S
U I N TA M O U N TA I N S
Utah Lake
WASATCHMOUNTAINSWASATCHMOUNTAINS
111° 110°30' 110°111°30'W
41°N
40°30'
40°
Mt. TimpanogosMt. Timpanogos
10 0 10 20 30 KILOMETERS
APPROXIMATE SCALE
Figure 22.—Excellent snowfree Landsat 2 MSS false-color composite image(6000–16574, bands 4, 5, and 7; 18 October 1977; Path 40, Row 32) coveringan area in north-central Utah. The only glacier reported in Utah occupies adeep cirque on the east side of Mount Timpanogos (3,582 m) in the WasatchRange (extreme west-central part of image) about 22 km north of Utah Lake.No glaciers are indicated on 1:24,000-scale USGS quadrangle maps in theUinta Mountains (northeast quadrant of image), which are more extensiveand higher (up to 4,100 m in elevation). Glacial moraines are clearly seenextending 40 km to the north and south of the crest of the Uinta Mountains.

GLACIERS OF THE CONTERMINOUS UNITED STATES J365
Glacier Retreat in Glacier National Park, Montana
By Carl H. Key,6 Daniel B. Fagre6, and Richard K. Menicke7
Glacier National Park encompasses a relatively large, mountainous region(4,080 km2) of northwestern Montana that borders southern Alberta andBritish Columbia, Canada. It was established in 1910 because of its glaciersand unique, glacially carved topography located along the crest of the RockyMountains. In the 1990’s, 37 named glaciers existed in Glacier National Park.All named glaciers within the park are mountain glaciers that have retreateddramatically since the middle 19th-century end of the Little Ice Age in theWestern United States. All but one glacier are contained in the northerntwo-thirds of Glacier National Park between lat 48º30' and 49º00' N. andlong 113º30' and 114º15' W. All head on the Continental Divide or near thedivide on lateral connecting ridges. Mountain peaks in this glacierizedregion range from 2,560 m to 3,190 m in elevation at Mount Cleveland, theglacier-terminus elevations lying generally between 2,000 and 2,400 m.
Observations of the glaciers of Glacier National Park date from the sec-ond half of the 19th century. The earliest delineation of Glacier NationalPark glaciers is found on a map by Ayres (1898) that was made in conjunc-tion with timber inventories of the former Flathead Forest Reserve. All ofthe present Glacier National Park was included in the map. The scale ofAyres’ map is nominally 1:440,000, and some drainage features are incor-rect, but it does provide clues to the areal extent of some of the first recog-nized glaciers in Glacier National Park. The first systematic mapping of theglaciers in the park is presented on the U.S. Geological Survey (USGS)1:125,000-scale Chief Mountain and Kintla Lake quadrangle maps, pub-lished in 1904 and 1906, respectively. These maps resulted from planetabletopographic surveys conducted between 1900 and 1904. It is important tonote the number and relative sizes of named glaciers in these maps. Com-parison with recent data shows that conspicuous changes have taken placeduring the 20th century. Unfortunately, the scale and horizontal control aresuch that quantitative measurements can only be crudely approximated tocompare with contemporary map, photographic, and image sources.
In 1914, Alden published a description of Glacier National Park glaciers,which includes many oblique photographs of glaciers made from 1887 to1913. Although not entirely complete, Alden’s work remains the only mono-graph to describe characteristics of the park’s glaciers at the start of the20th century. In 1952, Dyson published an updated list of glaciers. How-ever, it does not contain much descriptive material.
The most comprehensive and accurate depiction of Glacier NationalPark glaciers is obtained from USGS 1:24,000-scale quadrangle maps pub-lished in 1968 and compiled by the use of stereophotogrammetric tech-niques from aerial photographs made between 1963 and 1966. These mapsprovide an important benchmark for a parkwide assessment of glacier sta-tus. In addition, aerial photographs taken in 1950, 1960, 1968, and 1993cover most of Glacier National Park’s glaciers in late summer and provideadditional data, both before and after the 1968 maps.
The USGS 1968 maps depict 83 ice-and-snow bodies having areas thatexceed 0.1 km2 within the boundary of Glacier National Park. Post and oth-ers (1971) use an area of 0.1 km2 as a practical minimum size in order toindicate the presence of perennial ice-and-snow bodies in regional mappingand glacier-inventory surveys. Of these 83 ice-and-snow bodies, 34 arenamed glaciers. The three additional named glaciers within the park haveareas less than 0.1 km2 (table 3).
6 U.S. Geological Survey, Glacier National Park, West Glacier, MT 59936.7 U.S. National Park Service, Glacier National Park, West Glacier, MT 59936.

J366 SATELLITE IMAGE ATLAS OF GLACIERS OF THE WORLD
TABLE 3.—Named glaciers of Glacier National Park and vicinity, Montana[Glacier area at the end of the Little Ice Age is shown under “1850 area.” “Most recent area” refers to the primary body of a
glacier in the year displayed below “Source year.” “Number of snow patches/glacierets” indicates the number of separatemasses of perennial ice and snow in the cirque(s) associated with each glacier, based on 1:24,000-scale USGS quadranglemaps compiled from 1966 aerial photography. In most cases, the snow patches/glacierets are separate remnants of a gla-cier's former extent. Abbreviation: N., North. Leaders (--), not recorded; parentheses, estimated]
Number(fig. 23)
Named glacier1850 area (square
kilometers)
Most recentarea (square kilometers)
Sourceyear
Number of snow patches/
glacierets
3 Agassiz ...................... 4.06 1.02 1993 10
21 Ahern ........................ – .59 1966 10
4 Baby .......................... – .12 1966 1
33 Blackfoot .................. 17.59
1 The area for Blackfoot Glacier encompasses Jackson Glacier. The area reported for Jackson Glacier is the estimated part of Blackfoot Glacier that yielded Jackson Glacier after the two became separate glaciers.
1.74 1979 3
5 Boulder ..................... – .23 1966 1
14 Carter Glaciers ........ – .47 1966 6
18 Chaney...................... – .54 1966 10
13 Dixon ........................ – .29 1966 3
26 Gem........................... – .02 1966 1
25 Grinnell..................... 22.33
2 The area for Grinnell Glacier encompasses what would later be called The Salamander, an ice apron.
.88 1993 6
1 Harris ........................ – .15 1966 1
31 Harrison.................... 3.09 1.06 1993 18
10 Herbst ....................... – .14 1966 4
11 Hudson ..................... – .09 1966 4
19 Ipasha ....................... – .32 1966 8
32 Jackson..................... 1(3.44) (1.02) 1979 23
2 Kintla......................... – .66 1966 13
35 Logan ........................ .92 3.43 1993 1
37 Lupfer ....................... – .14 1966 1
15 Miche Wabun ........... – .20 1966 3
22 N. Swiftcurrent ........ – .07 1966 6
20 Old Sun ..................... – .42 1966 10
28 Piegan ....................... – .28 1966 1
34 Pumpelly................... 1.84 .72 1979 9
7 Rainbow ................... – 1.21 1966 6
36 Red Eagle ................. .49 3.15
3 Considered to be stagnant or no longer active in 1979 by Carrara and McGimsey.
1993 2
29 Sexton....................... – .40 1966 4
17 Shepard..................... – .20 1966 5
27 Siyeh ......................... – .22 1966 3
30 Sperry ....................... 3.76 .87 1993 7
23 Swiftcurrent ............. .70 .14 1993 4
24 The Salamander....... – 2.23 1993 1
12 Thunderbird ............. – .19 1966 6
8 Two Ocean................ – .43 1966 4
9 Vulture ...................... .77 .21 1993 14
6 Weasel Collar ........... – .56 1966 4
16 Whitecrow................ – .24 1966 10
39 4Gr ant....................... – .34 1995 1
38 4Stanton ....................
4 Grant and Stanton Glaciers are located outside Glacier National Park.
– .37 1995 1
Total 525.55
5 Total area includes 11 of 37 named glaciers in Glacier National Park.
616.34
6 Total area from 1966, 1979, and 1993. Source material includes 37 named glaciers in Glacier National Park and 2 outside the park.

GLACIERS OF THE CONTERMINOUS UNITED STATES J367
0 10 20 KILOMETERS
114°00'W 113°30'
48°30'
49°00'N
CONTINENTAL
DIVIDE
West Glacier
Saint Mary
1
23
4
5
6
7
8
9
10
11
1213
14
15
16
17
1819
20
21
22
23
24 25
26 27
28
29
30
31
3233
34
35
36
37
38
39
Helena
GLACIERNATIONALPARK
MONTANA
Figure 23.—Computer-generated, unsupervised spectral classification of aLandsat TM scene (LT50410260095244, bands 3, 4, 5, Path 41, Row 26) ofGlacier National Park and vicinity, Montana, collected on 1 September1995. The image, which shows the boundary of Glacier National Park, hasbeen rectified geometrically to (UTM) zone 12. Sixty multispectral clustersare represented in false color in order to approximate mean cluster reflec-tance in bands 4, 5, and 3 for red, green, and blue (RGB), respectively. Darkred to brown represents coniferous forest; light to dark orange includesherbaceous and shrub habitats; and yellow green to gray indicates dor-mant grass, rock, and nonvegetated terrain types. Areas of perennial iceand snow stand out in bright pink to dark purple and cover about 36 km2
within Glacier National Park, including amounts estimated within darkshadow zones. The TM pixel resolution at 28.5 m (1 hectare=12.31 pixels) isabout 6.6 times greater than that of Landsat multispectral scanner (MSS)
data (1 hectare=1.86 pixels). Therefore, the TM pixel resolution is sufficientto resolve many of the smaller ice- and-snow patches that were present in1995 from those that were mapped on USGS 1:24,000-scale quadranglemaps in 1968. Perennial ice and snow constitute a relatively small part ofthe entire region, and glaciers occupy even less area. Numbers 1–37 iden-tify named glaciers (see table 3), some of which are now stagnant: 1, Har-ris; 2, Kintla; 3, Agassiz; 4, Baby; 5, Boulder; 6, Weasel Collar; 7, Rainbow; 8,Two Ocean; 9, Vulture; 10, Herbst; 11, Hudson; 12, Thunderbird; 13, Dixon;14, Carter; 15, Miche Wabun; 16, Whitecrow; 17, Shepard; 18, Chaney; 19,Ipasha; 20, Old Sun; 21, Ahern; 22, North Swiftcurrent; 23, Swiftcurrent; 24,The Salamander; 25, Grinnell; 26, Gem; 27, Siyeh; 28, Piegan; 29, Sexton;30, Sperry; 31, Harrison; 32, Jackson; 33, Blackfoot; 34, Pumpelly; 35,Logan; 36, Red Eagle; 37, Lupfer. Numbers 38 (Stanton Glacier) and 39(Grant Glacier) are located outside Glacier National Park.
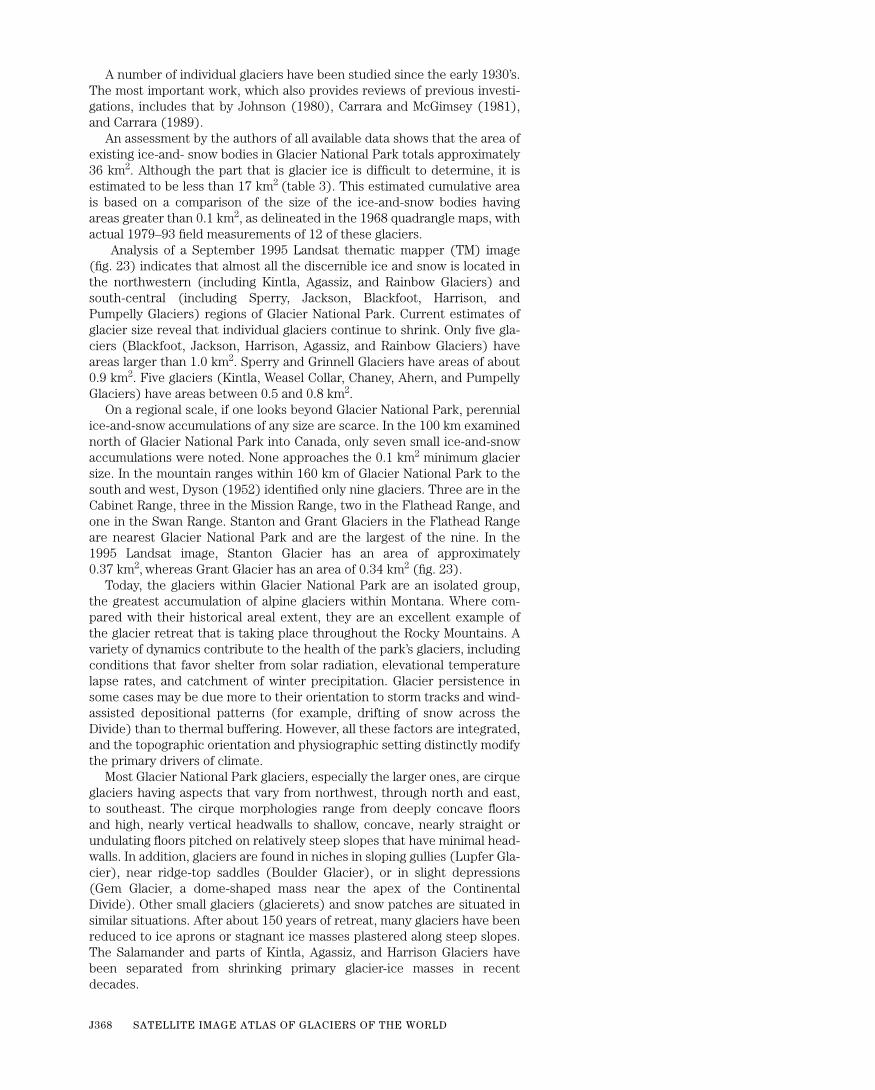
J368 SATELLITE IMAGE ATLAS OF GLACIERS OF THE WORLD
A number of individual glaciers have been studied since the early 1930’s.The most important work, which also provides reviews of previous investi-gations, includes that by Johnson (1980), Carrara and McGimsey (1981),and Carrara (1989).
An assessment by the authors of all available data shows that the area ofexisting ice-and- snow bodies in Glacier National Park totals approximately36 km2. Although the part that is glacier ice is difficult to determine, it isestimated to be less than 17 km2 (table 3). This estimated cumulative areais based on a comparison of the size of the ice-and-snow bodies havingareas greater than 0.1 km2, as delineated in the 1968 quadrangle maps, withactual 1979–93 field measurements of 12 of these glaciers.
Analysis of a September 1995 Landsat thematic mapper (TM) image(fig. 23) indicates that almost all the discernible ice and snow is located inthe northwestern (including Kintla, Agassiz, and Rainbow Glaciers) andsouth-central (including Sperry, Jackson, Blackfoot, Harrison, andPumpelly Glaciers) regions of Glacier National Park. Current estimates ofglacier size reveal that individual glaciers continue to shrink. Only five gla-ciers (Blackfoot, Jackson, Harrison, Agassiz, and Rainbow Glaciers) haveareas larger than 1.0 km2. Sperry and Grinnell Glaciers have areas of about0.9 km2. Five glaciers (Kintla, Weasel Collar, Chaney, Ahern, and PumpellyGlaciers) have areas between 0.5 and 0.8 km2.
On a regional scale, if one looks beyond Glacier National Park, perennialice-and-snow accumulations of any size are scarce. In the 100 km examinednorth of Glacier National Park into Canada, only seven small ice-and-snowaccumulations were noted. None approaches the 0.1 km2 minimum glaciersize. In the mountain ranges within 160 km of Glacier National Park to thesouth and west, Dyson (1952) identified only nine glaciers. Three are in theCabinet Range, three in the Mission Range, two in the Flathead Range, andone in the Swan Range. Stanton and Grant Glaciers in the Flathead Rangeare nearest Glacier National Park and are the largest of the nine. In the1995 Landsat image, Stanton Glacier has an area of approximately0.37 km2, whereas Grant Glacier has an area of 0.34 km2 (fig. 23).
Today, the glaciers within Glacier National Park are an isolated group,the greatest accumulation of alpine glaciers within Montana. Where com-pared with their historical areal extent, they are an excellent example ofthe glacier retreat that is taking place throughout the Rocky Mountains. Avariety of dynamics contribute to the health of the park’s glaciers, includingconditions that favor shelter from solar radiation, elevational temperaturelapse rates, and catchment of winter precipitation. Glacier persistence insome cases may be due more to their orientation to storm tracks and wind-assisted depositional patterns (for example, drifting of snow across theDivide) than to thermal buffering. However, all these factors are integrated,and the topographic orientation and physiographic setting distinctly modifythe primary drivers of climate.
Most Glacier National Park glaciers, especially the larger ones, are cirqueglaciers having aspects that vary from northwest, through north and east,to southeast. The cirque morphologies range from deeply concave floorsand high, nearly vertical headwalls to shallow, concave, nearly straight orundulating floors pitched on relatively steep slopes that have minimal head-walls. In addition, glaciers are found in niches in sloping gullies (Lupfer Gla-cier), near ridge-top saddles (Boulder Glacier), or in slight depressions(Gem Glacier, a dome-shaped mass near the apex of the ContinentalDivide). Other small glaciers (glacierets) and snow patches are situated insimilar situations. After about 150 years of retreat, many glaciers have beenreduced to ice aprons or stagnant ice masses plastered along steep slopes.The Salamander and parts of Kintla, Agassiz, and Harrison Glaciers havebeen separated from shrinking primary glacier-ice masses in recentdecades.

GLACIERS OF THE CONTERMINOUS UNITED STATES J369
Major cirque glaciers typically are hanging, are perched above cliffs, andin some cases, constitute a cascading series of glaciers or a “glacier stair-case,” like the former North Swiftcurrent Glaciers (fig. 24). Little Ice Agecirque glaciers that advanced over cliff margins pushed morainal materialand ice off steep rock faces. This probably produced unconsolidated, recon-stituted ice-and-sediment masses at the base of these slopes. Consequently,terminal moraines are absent below many cirques. This complicates theaccurate mapping of the extent of many middle 19th-century glacier ter-mini. Generally, well-defined lateral moraines do exist, and in the absenceof additional evidence, the limit of Little Ice Age glaciers can be sufficientlywell delineated, at least out to the cliff margins.
At several glaciers, terminal moraines exist where cliffs are absent or aresufficiently distant that they were not reached during Little Ice Age glacierexpansion. Good examples exist at the Sperry and Red Eagle Glaciers, aswell as in the deglacierized valleys below Heavens Peak and Mt. Clements(Demorest, 1938). In addition, at least two glaciers, Agassiz and JacksonGlaciers, extended far enough below bedrock slopes so that they createdforest trimlines (krummholz), which provide explicit boundaries for themaximum extent of middle 19th- century advances.
Johnson (1980) describes the long series of observations on Grinnell andSperry Glaciers, and he exhibits topographic maps that were compiled at ascale of 1:6,000 from 1960 aerial photographs. He also delineates profilesand terminus positions from 1887 through 1969. These maps complementanother set of USGS topographic maps compiled at a scale of 1:4,800 fromaerial photographs taken in 1950 for Sperry and Grinnell Glaciers. Carraraand McGimsey (1981) discuss the recession of Agassiz and Jackson Gla-ciers through 1979, the period of greatest retreat, and establish the age ofmost of the recent moraines as contemporary with the Little Ice Age thatended in the middle 1800’s. This age (middle 1800’s) had been hypothe-sized as early as 1939 (Matthes, 1939, 1940), similar to the age of moraineselsewhere in North America, Iceland, and Europe, but was not definitivelydated in Glacier National Park until the work of Carrara and McGimsey inthe late 1970’s.
The moraines in Glacier National Park are significant because of theirrelatively young age and large size. They represent a long-standing glacial
Figure 24.—Oblique photograph (takenabout 1912) showing hanging cirque gla-ciers and the “glacier staircase” of NorthSwiftcurrent Glaciers (Alden, 1914). No ter-minal moraine exists on the upper part ofthe cliff, whereas a recognizable moraineis associated with the lower glacier.
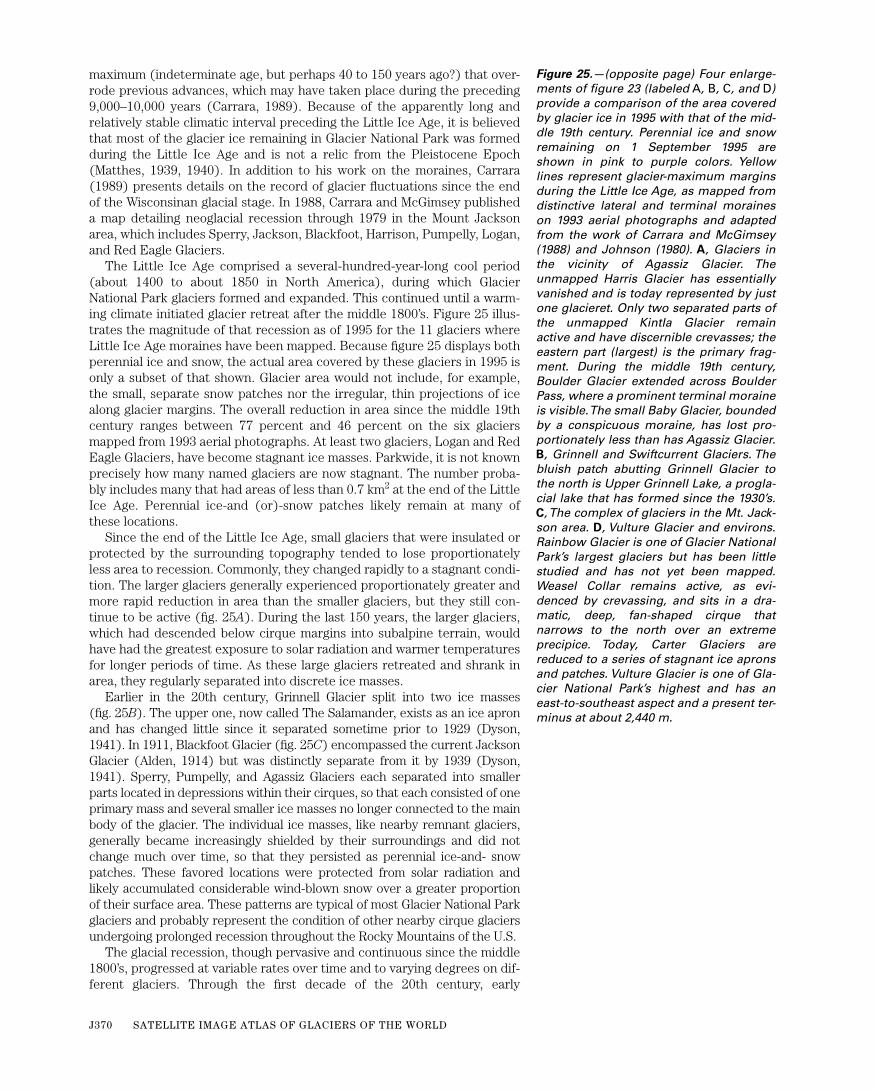
J370 SATELLITE IMAGE ATLAS OF GLACIERS OF THE WORLD
Figure 25.—(opposite page) Four enlarge-ments of figure 23 (labeled A, B, C, and D)provide a comparison of the area coveredby glacier ice in 1995 with that of the mid-dle 19th century. Perennial ice and snowremaining on 1 September 1995 areshown in pink to purple colors. Yellowlines represent glacier-maximum marginsduring the Little Ice Age, as mapped fromdistinctive lateral and terminal moraineson 1993 aerial photographs and adaptedfrom the work of Carrara and McGimsey(1988) and Johnson (1980). A, Glaciers inthe vicinity of Agassiz Glacier. Theunmapped Harris Glacier has essentiallyvanished and is today represented by justone glacieret. Only two separated parts ofthe unmapped Kintla Glacier remainactive and have discernible crevasses; theeastern part (largest) is the primary frag-ment. During the middle 19th century,Boulder Glacier extended across BoulderPass, where a prominent terminal moraineis visible. The small Baby Glacier, boundedby a conspicuous moraine, has lost pro-portionately less than has Agassiz Glacier.B, Grinnell and Swiftcurrent Glaciers. Thebluish patch abutting Grinnell Glacier tothe north is Upper Grinnell Lake, a progla-cial lake that has formed since the 1930’s.C, The complex of glaciers in the Mt. Jack-son area. D, Vulture Glacier and environs.Rainbow Glacier is one of Glacier NationalPark’s largest glaciers but has been littlestudied and has not yet been mapped.Weasel Collar remains active, as evi-denced by crevassing, and sits in a dra-matic, deep, fan-shaped cirque thatnarrows to the north over an extremeprecipice. Today, Carter Glaciers arereduced to a series of stagnant ice apronsand patches. Vulture Glacier is one of Gla-cier National Park’s highest and has aneast-to-southeast aspect and a present ter-minus at about 2,440 m.
maximum (indeterminate age, but perhaps 40 to 150 years ago?) that over-rode previous advances, which may have taken place during the preceding9,000–10,000 years (Carrara, 1989). Because of the apparently long andrelatively stable climatic interval preceding the Little Ice Age, it is believedthat most of the glacier ice remaining in Glacier National Park was formedduring the Little Ice Age and is not a relic from the Pleistocene Epoch(Matthes, 1939, 1940). In addition to his work on the moraines, Carrara(1989) presents details on the record of glacier fluctuations since the endof the Wisconsinan glacial stage. In 1988, Carrara and McGimsey publisheda map detailing neoglacial recession through 1979 in the Mount Jacksonarea, which includes Sperry, Jackson, Blackfoot, Harrison, Pumpelly, Logan,and Red Eagle Glaciers.
The Little Ice Age comprised a several-hundred-year-long cool period(about 1400 to about 1850 in North America), during which GlacierNational Park glaciers formed and expanded. This continued until a warm-ing climate initiated glacier retreat after the middle 1800’s. Figure 25 illus-trates the magnitude of that recession as of 1995 for the 11 glaciers whereLittle Ice Age moraines have been mapped. Because figure 25 displays bothperennial ice and snow, the actual area covered by these glaciers in 1995 isonly a subset of that shown. Glacier area would not include, for example,the small, separate snow patches nor the irregular, thin projections of icealong glacier margins. The overall reduction in area since the middle 19thcentury ranges between 77 percent and 46 percent on the six glaciersmapped from 1993 aerial photographs. At least two glaciers, Logan and RedEagle Glaciers, have become stagnant ice masses. Parkwide, it is not knownprecisely how many named glaciers are now stagnant. The number proba-bly includes many that had areas of less than 0.7 km2 at the end of the LittleIce Age. Perennial ice-and (or)-snow patches likely remain at many ofthese locations.
Since the end of the Little Ice Age, small glaciers that were insulated orprotected by the surrounding topography tended to lose proportionatelyless area to recession. Commonly, they changed rapidly to a stagnant condi-tion. The larger glaciers generally experienced proportionately greater andmore rapid reduction in area than the smaller glaciers, but they still con-tinue to be active (fig. 25A). During the last 150 years, the larger glaciers,which had descended below cirque margins into subalpine terrain, wouldhave had the greatest exposure to solar radiation and warmer temperaturesfor longer periods of time. As these large glaciers retreated and shrank inarea, they regularly separated into discrete ice masses.
Earlier in the 20th century, Grinnell Glacier split into two ice masses(fig. 25B). The upper one, now called The Salamander, exists as an ice apronand has changed little since it separated sometime prior to 1929 (Dyson,1941). In 1911, Blackfoot Glacier (fig. 25C) encompassed the current JacksonGlacier (Alden, 1914) but was distinctly separate from it by 1939 (Dyson,1941). Sperry, Pumpelly, and Agassiz Glaciers each separated into smallerparts located in depressions within their cirques, so that each consisted of oneprimary mass and several smaller ice masses no longer connected to the mainbody of the glacier. The individual ice masses, like nearby remnant glaciers,generally became increasingly shielded by their surroundings and did notchange much over time, so that they persisted as perennial ice-and- snowpatches. These favored locations were protected from solar radiation andlikely accumulated considerable wind-blown snow over a greater proportionof their surface area. These patterns are typical of most Glacier National Parkglaciers and probably represent the condition of other nearby cirque glaciersundergoing prolonged recession throughout the Rocky Mountains of the U.S.
The glacial recession, though pervasive and continuous since the middle1800’s, progressed at variable rates over time and to varying degrees on dif-ferent glaciers. Through the first decade of the 20th century, early

GLACIERS OF THE CONTERMINOUS UNITED STATES J371
0 1 2 KILOMETERS
N
Agassiz
Kintla
Baby
Boulder
Harris
Upper Kintla Lake
BoulderPass
A
0 1 2 KILOMETERS
N
Grinnell
Gem
Swiftcurrent
The Salamander
NorthSwiftcurrent
LakeJosephine
GrinnellLake
CO
NT
INE
NTA
L
DIVIDE
B
N
0 1 2 3 KILOMETERS
Sperry
Harrison
Jackson Blackfoot
Logan
Red Eagle
Pumpelly
AvalancheLake
GunsightLake
CONTINENTAL
DIVIDE
MountJackson
C
0 1 2 KILOMETERSVulture
Carter GlaciersRainbow
WeaselCollar
N
Quartz LakeDIVIDE
Bowm
an Lak
e
Two Ocean
CO
NTINEN
TAL
D
photographs and descriptions indicate that glaciers thinned but retreatedlittle from the end moraines of the Little Ice Age (fig. 26) and that terminiwere still at -or- very near the inner margins of lateral and terminalmoraines (Alden, 1914; Sperry, 1938; Dyson, 1941). In all cases, it must benoted that, although initially the distance of retreat was small, substantialthinning—and therefore appreciable volume loss—likely took place. Thispreceded the eventual retreat of termini. From 1910 onward, recessionrates increased (Dyson, 1948; Johnson, 1980). This corresponded to aperiod of increased scientific interest in Glacier National Park glaciers, andmany of the early investigators bore witness to dramatic instances of glacierrecession. Following the middle 1940’s, recession rates decreased, and gla-ciers became increasingly confined within cirque margins.
On Agassiz and Jackson Glaciers, retreat from 1850’s trimlines below1,800 m averaged less than 7 m a–1 until about 1911 (Carrara and McGim-sey, 1981). Retreat rates increased steadily to 14–42 m a–1 by 1926 and to112–117 m a–1 by 1932. At both glaciers, retreat exposed convex bedrockslopes. These slopes likely supported thinner ice and contributed to therapid retreat during that interval.
By 1939, Jackson Glacier had separated from Blackfoot Glacier (fig. 25C)and rested within the confines of its present-day cirque. Its average rate ofretreat decreased between 1932 and 1944 to about 10 m a–1. Agassiz Gla-cier (fig. 25A), on the other hand, continued retreating up its valley slope ata rate of 90 m a–1 until 1942. From the middle 1940’s until 1979, both

J372 SATELLITE IMAGE ATLAS OF GLACIERS OF THE WORLD
Figure 26.—Overlooking Blackfoot Glacierto the west in August 1914 by E.C. Stebin-ger, USGS. Mount Jackson is the highestpeak in the center, and Reynolds Mountainis to the far right. Glacier ice remains on,or very near, the prominent lateralmoraine, paralleling the glacier across thecentral-right part of the photograph. Ratesof recession were comparatively slowfrom the end of the Little Ice Age throughthe early 20th century, in contrast to rapidrecession in subsequent decades of the1920’s to 1940’s. Early visitors had anopportunity to see Glacier National Parkglaciers at or near their 19th century maxi-mum extents. Today, most of the glacierice visible in the right one-half of the pho-tograph has melted away and exposedbedrock. From the same viewpoint, thecurrent terminus would lie almost in adirect line with Mount Jackson (seefig. 25C).
glaciers continued to retreat but at very low rates, less than 3 m a–1. By1979, Agassiz and Jackson Glaciers had been reduced to about 30 percentof their middle 19th- century area.
Sperry Glacier’s retreat (fig. 25C) has a history similar to that of Agassizand Jackson Glaciers, although variations in recession are not as dramatic.Figure 27 shows the changes in its size from 1850 to 1993. Until 1913, itretreated from its Little Ice Age moraine at a rate that varied between 1 and5 m a–1. From 1913 through 1945, retreat increased substantially tobetween 15 and 22 m a–1. During this period, Sperry Glacier lost about 68percent of its area. Since 1945, the rate of retreat has slowed to an averageof 11 m a–1 between 1945 and 1950 and to about 5 m a–1 between 1950 and1979. At that time, Sperry Glacier occupied only about 26 percent of itsmaximum area in the middle 19th century.
Grinnell Glacier (fig. 25B) displayed less overall variation and greaterconstancy in retreat than the glaciers already discussed. However, betweenthe 1920’s and middle 1940’s, it experienced the largest amount of retreatof any Glacier National Park glacier (fig. 28). Through 1887, Grinnellreceded an average of 2 m a–1. Recession averaged 11 m a–1 from 1887 to1911 but decreased to 5 m a–1 by 1920. During the period 1850 to 1920, theaverage recession was about 6 m a–1. The rate of recession of Grinnell Gla-cier increased after 1920, averaging 15 m a–1, for a total loss of 51 percentin glacier area by 1946. Between 1946 and 1979, recession averaged about 4m a–1 and further reduced the glacier to 41 percent of its former area.
Figure 29 depicts the changes of Grinnell Glacier during the 43-yearperiod from 1938 to 1981. Substantial changes are evident not only in themargin but also in the thickness of the glacier. Compared to the size andthickness of the glacier 50 years earlier (about 1887), when Grinnell Glacierincluded The Salamander ice apron, the magnitude of change is most note-worthy. Recession of Grinnell Glacier has been influenced by its deeply con-cave cirque, as well as by the formation of Upper Grinnell Lake in the early1930’s from meltwater that ponded in a concave basin exposed by theretreating glacier (fig. 29).
Between 1966 and 1979, small advances of parts of the glacier marginswere noted at several glaciers, including Grinnell, Jackson, Blackfoot, andHarrison Glaciers (Carrara, 1989). Other parts of these glaciers did notadvance, and overall sizes either remained essentially the same or recededslightly during the period.
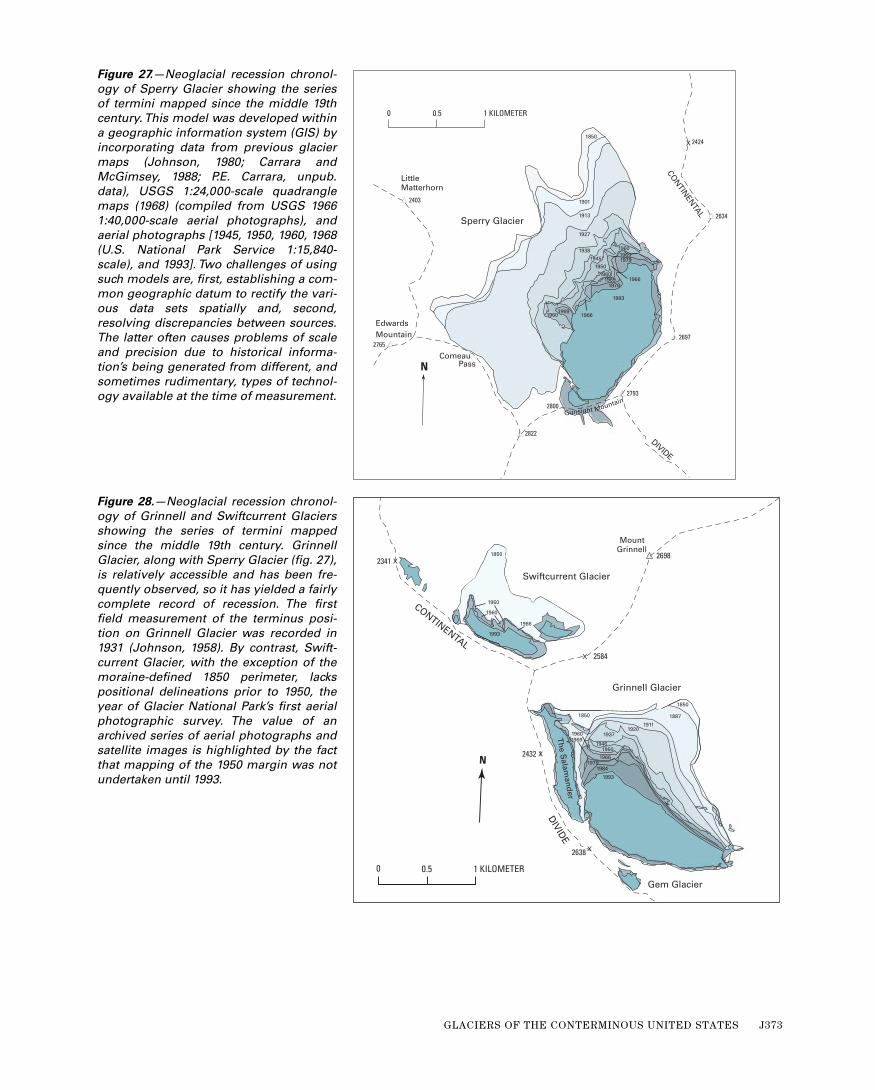
GLACIERS OF THE CONTERMINOUS UNITED STATES J373
N
0 0.5 1 KILOMETER
Grinnell Glacier
Swiftcurrent Glacier
Gem Glacier
CONTINENTAL
DIVID
ET
he S
alaman
der
1993
1984
1850
1850 1887
19111920
1937
19461950
1960
1966
1969
1979
1950
1960
1966
1993
2698
2584
2341
2432
2638
X
X
X
MountGrinnell
X
1850
Figure 27.—Neoglacial recession chronol-ogy of Sperry Glacier showing the seriesof termini mapped since the middle 19thcentury. This model was developed withina geographic information system (GIS) byincorporating data from previous glaciermaps (Johnson, 1980; Carrara andMcGimsey, 1988; P.E. Carrara, unpub.data), USGS 1:24,000-scale quadranglemaps (1968) (compiled from USGS 19661:40,000-scale aerial photographs), andaerial photographs [1945, 1950, 1960, 1968(U.S. National Park Service 1:15,840-scale), and 1993]. Two challenges of usingsuch models are, first, establishing a com-mon geographic datum to rectify the vari-ous data sets spatially and, second,resolving discrepancies between sources.The latter often causes problems of scaleand precision due to historical informa-tion’s being generated from different, andsometimes rudimentary, types of technol-ogy available at the time of measurement.
0 0.5 1 KILOMETER
N
1901
1913
1927
1938
19451950
1966
196619691979
1993
1960
1960
1969
19691979
1960
CON
TINEN
TAL
DIVIDE
X
2697
2793
2800
2822
2765
ComeauPass
Gunsight Mountain
2634
2424
2403
MountainEdwards
LittleMatterhorn
1850
Sperry Glacier
Figure 28.—Neoglacial recession chronol-ogy of Grinnell and Swiftcurrent Glaciersshowing the series of termini mappedsince the middle 19th century. GrinnellGlacier, along with Sperry Glacier (fig. 27),is relatively accessible and has been fre-quently observed, so it has yielded a fairlycomplete record of recession. The firstfield measurement of the terminus posi-tion on Grinnell Glacier was recorded in1931 (Johnson, 1958). By contrast, Swift-current Glacier, with the exception of themoraine-defined 1850 perimeter, lackspositional delineations prior to 1950, theyear of Glacier National Park’s first aerialphotographic survey. The value of anarchived series of aerial photographs andsatellite images is highlighted by the factthat mapping of the 1950 margin was notundertaken until 1993.

J374 SATELLITE IMAGE ATLAS OF GLACIERS OF THE WORLD
Figure 29.—Paired 1938 (left) and 1981(right) photographs of Grinnell Glacierand The Salamander. In the 1981 photo-graph, significant retreat and thinning areclearly evident on the lower level GrinnellGlacier; note comparative glacier-ice thick-ness indicated along the cliff below TheSalamander. Formation of Upper GrinnellLake, which began in the early 1930’s, hasresulted in icebergs’ calving along the ter-minus of much of the Grinnell Glacier. Thishas significantly increased the rate ofrecession. Snow-and-firn lines on the gla-cier surface are relatively similar in thetwo photographs. Only a minor change isnoted in the area of The Salamander, ascompared to the large amount of arealost by Grinnell Glacier. In comparison,krummholz (dark treed patches of stuntedconifers on slopes in the backgroundshowing the approximate location of thetree line) have been relatively stable overthe same period. The 1938 photographwas taken by T.J. Hileman, probably in latesummer; the 1981 photograph by C.H. Keyin late summer.
Other Glacier National Park glaciers, because of their unique character-istics, have responded somewhat independently to changes in climate andshow variations in recession. The magnitude of shrinkage in Grinnell Gla-cier (fig. 29) is most representative of the larger glaciers in the park. Thesmaller glaciers here, while experiencing increased rates of retreat from the1920’s through 1940’s, did not recede nearly as far nor did they thin asmuch in magnitude, though most either disappeared completely or reacheda steady state during that period. Collectively parkwide, such significantchanges translate into dramatic losses of stored water, which result in con-current variations in stream hydrology and sedimentation.
By the end of the 1970’s, Glacier National Park glaciers had been con-fined mostly to high cirque basins for more than three decades. It is clearthat retreat rates decreased in the three decades leading up to that time,but it is also evident that, even as glaciers became increasingly buffered athigher elevations, broad-scale recession continued as proportionately moresurface area became sheltered by cirque walls. Between 1979 and 1993,Sperry Glacier retreated from 45 to 75 m (an average rate of 3 to 5 m a–1)and lost about 11 percent of its surface area (fig. 27). During the sameperiod, Grinnell Glacier retreated 117 to 130 m (an average rate of 8 to9 m a–1), receding about 26 percent (fig. 28). However, a significant amountof this retreat is due to icebergs’ calving.
Between 1979 and 1993, Agassiz, Jackson, and Blackfoot Glaciersreceded only about 50 m, but all exhibited signs of continued thinning,including newly exposed bedrock or increased bedrock outcrops withinthe perimeter of the glaciers. Harrison Glacier, which had lost 61 percentof its area by 1979, continued to retreat through 1993, when it had lost 12percent of its 1979 area. Overall, it decreased to 35 percent of its
GLACIERS OF THE CONTERMINOUS UNITED STATES J375
maximum area during the Little Ice Age (fig. 25C). Vulture Glacier, havinga 1993 area of only 0.21 km2, had receded about 18 percent since 1966. In1993, it occupied only about 28 percent of its 1850 area (fig. 25D). Swift-current Glacier, another small glacier (1993 area of 0.14 km2), appears tobe fairly stable. It had receded nearly to its 1993 size by 1966, and it has arelatively high terminus elevation of 2,200 m in a well-shaded, northeast-facing cirque (fig. 28).
The retreat of the glaciers observed in Glacier National Park in recentyears is consistent with a trend observed in temperate glaciers in otherregions during the last 150 years. Evidently, climate (temperature and pre-cipitation) is the primary controlling factor. Two reasonable hypotheseswarrant consideration. In the first, the temperature warmed quickly duringthe middle 1800’s and then remained relatively stable, so that today’s gla-ciers are still responding to that one change. In the second, the tempera-ture has continued to warm since the Little Ice Age, although it hasincluded some brief periods of cooling. In neither hypothesis has precipita-tion increased. Sigurƒsson and Williams (1998) agreed with the secondhypothesis with respect to Iceland’s glaciers.
The hypothesis that temperature has continued to warm since the LittleIce Age implies that fluctuations of glacier termini are more closely coupledto temperature change and react within shorter time frames than would beimplied by the hypothesis that temperature warmed quickly during themiddle 1800’s and then remained relatively stable. To address these issuesspecifically, the authors recommend the following be instituted: (1) inter-vals and magnitudes of climate variation be correlated more explicitly tothe recession rates of glaciers in the park, (2) new long-term mass-balancemeasurements be carried out, and (3) complete thermodynamic budgetsbe determined that account, individually and over time, for glacier-bedmorphology, elevation, and exposure to solar radiation. In any case, it is sig-nificant that, in spite of favorable topographic settings, Glacier NationalPark’s larger glaciers are shrinking and have not reached an equilibriumwith today’s climate.
Recent Glacier Trends
An often asked question is, “How have glaciers changed in area, length,or volume with time?” The answer must be qualified. It is relatively simpleto observe specific glaciers for several decades, as has been done at theNisqually and South Cascade Glaciers, as well as at several other glaciers. Inall cases, these long records have shown general recession. As the observa-tion frequency is increased, however, some of these records have shownperiods of advance within the general retreat, and these periods of advancedo not always correlate from glacier to glacier. In fact, glaciers that are sideby side geographically sometimes behave differently. These short advancesin the overall trend are a result of the complex interaction between theeffects of elevation, latitude, exposure, basin area-elevation distribution,the variables of climate, and the individual glacier’s dynamic-response char-acteristics. A strategy for monitoring glaciers of the United States and otherglacierized regions is discussed by Fountain and others (1996) and was thesubject of a 1996 workshop on long-term monitoring of glaciers of NorthAmerica and northwestern Europe (Williams and Ferrigno, 1997).
An apparent contradiction exists in this general long-term recession.Table 1 gives glacier areas from Meier (1961a) and from more recent

J376 SATELLITE IMAGE ATLAS OF GLACIERS OF THE WORLD
sources, where available. Many of the recent sources show an increase intotal ice during the last 10 to 20 years. An incorrect conclusion is that gla-cier cover has increased. The correct conclusion is that more glacier coverhas been recorded as a result of better source material, mainly maps andvertical aerial photographs. Had the same quality of source material beenavailable and the same methodology been applied for the earlier determina-tions of area, the apparent trend of glacier increase seen in table 1 wouldalmost certainly be reversed.

GLACIERS OF THE CONTERMINOUS UNITED STATES J377
Alden, W.C., 1914, Glaciers of Glacier National Park: Washing-ton, D.C., U.S. Government Printing Office, U.S. Departmentof the Interior, 48 p.
Allen, C.R., Kamb, W.B., Meier, M.F., and Sharp, R.P., 1960, Struc-ture of the lower Blue Glacier, Washington: Journal of Geol-ogy, v. 68, no. 6, p. 601–625.
Ayres, H.B., 1898, Map of the Flathead Forest Reserve, Montana,in Ayres, H.B., 1900, The Flathead Forest Reserve: U.S. Geo-logical Survey Annual Report 20, pt. 5, p. 246–316.
Brown, C.S., 1989, A description of the United States’ contribu-tion to the world glacier inventory, in Oerlemans, Johannes,ed., Glacier fluctuations and climate change: Dordrecht,Netherlands, Kluwer Academic Publishers, p. 103–108.
Brugman, M.M., and Post, Austin, 1981, Effects of volcanism onthe glaciers of Mount St. Helens: U.S. Geological Survey Cir-cular 850–D (Hydrologic effects of the eruptions of Mount St.Helens, Washington, 1980), p. D1–D11.
Brugman, M.M., and Meier, M.F., 1981, Response of glaciers tothe eruptions of Mount St. Helens, in Lipman, P.W., and Mul-lineaux, D.R., eds., The 1980 eruptions of Mount St. Helens,Washington: U.S. Geological Survey Professional Paper 1250,p. 743–756.
Carrara, P.E., 1989, Late Quaternary glacial and vegetative his-tory of the Glacier National Park region, Montana: U.S. Geo-logical Survey Bulletin 1902, 64 p.
Carrara, P.E., and McGimsey, R.G., 1981, The late neoglacial his-tories of the Agassiz and Jackson Glaciers, Glacier NationalPark, Montana: Arctic and Alpine Research, v. 13, no. 2,p. 183–196.
———1988, Map showing distribution of moraines and extent ofglaciers from the mid-19th century to 1979 in the Mount Jack-son area, Glacier National Park, Montana: U.S. GeologicalSurvey Miscellaneous Investigations Series Map I–1508–C,scale 1:24,000.
Demorest, Max, 1938, Ice flowage as revealed by glacial striae:Journal of Geology, v. 46, no. 5, p. 700–725.
Dethier, D.P., and Frederick, J.E., 1981, Mass balance of “Vesper”Glacier, Washington, U.S.A.: Journal of Glaciology, v. 27,no. 96, p. 271–282.
Deutsch, Morris, contributing author, 1983, Monitoring of snow-line dynamics in the Cascade Mountains, United States andCanada, in Williams, R.S., Jr., Geological applications, chap-ter 31, of Colwell, R.N., editor-in-chief, Manual of remotesensing (2d ed.): Falls Church, Va., American Society of Pho-togrammetry, v. II, p. 1734–1735.
Driedger, C.L., 1981, Effect of ash thickness on snow ablation, inLipman, P.W., and Mullineaux, D.R., eds., The 1980 eruptionsof Mount St. Helens, Washington: U.S. Geological Survey Pro-fessional Paper 1250, p. 757–760.
———1986, A visitor’s guide to Mount Rainier glaciers: Long-mire, Wash., Northwest National Parks and Forest Associa-tion, 80 p.
———1988, Geology in action—jökulhlaups on Mount Rainier:U.S. Geological Survey Open-File Report 88–459, 2 p.
———1993, Glaciers on Mount Rainier: U.S. Geological SurveyOpen-File Report 92–474, 2 p.
Driedger, C.L., and Fountain, A.G., 1989, Glacier outburst floodsat Mount Rainier, Washington State, U.S.A.: Annals of Glaciol-ogy, v. 13, p. 51–55.
Driedger, C.L., and Kennard, P.M., 1984, Glacier volume estima-tion on Cascade volcanoes—An analysis and comparisonwith other methods: Annals of Glaciology, v. 8, p. 59–64.
———1986, Ice volumes on Cascade volcanoes; Mount Rainier,Mount Hood, Three Sisters, and Mount Shasta, Washington,Oregon, and Washington: U.S. Geological Survey Profes-sional Paper 1365, 28 p.
Dyson, J.L., 1941, Recent glacier recession in Glacier NationalPark: Journal of Geology, v. 49, no. 8, p. 815–824.
———1948, Shrinkage of Sperry and Grinnell Glaciers, GlacierNational Park, Montana: Geographical Review, v. 38, no. 1,p. 96–103.
———1952, Glaciers of the American Rocky Mountains: Ameri-can Geophysical Union, Committee on Glaciers, Subcommit-tee on the American Rocky Mountains Triennial Report1950–52, 37 p.
Field, W.O., ed., 1975, Mountain glaciers of the Northern Hemi-sphere: Hanover, N.H., U.S. Army Corps of Engineers, ColdRegions Research and Engineering Laboratory, v. 1, 698 p.
Fountain, A.G., 1989, The storage of water in, and hydrauliccharacteristics of, the firn of South Cascade Glacier, Wash-ington State, U.S.A.: Annals of Glaciology, v. 13, p. 69–75.
———1992a, Subglacial hydraulics of South Cascade Glacier:Seattle, Wash., University of Washington, unpublished Ph.D.dissertation, 265 p.
———1992b, Subglacial water flow inferred from stream mea-surements at South Cascade Glacier, Washington State,U.S.A.: Journal of Glaciology, v. 38, no. 128, p. 51–64.
———1993, Geometry and flow conditions of subglacial waterat South Cascade Glacier, Washington State, U.S.A.—An anal-ysis of tracer injections: Journal of Glaciology, v. 39, no. 131,p. 143–156.
———1994, Borehole water-level variations and implications forthe subglacial hydraulics of South Cascade Glacier, Washing-ton, U.S.A.: Journal of Glaciology, v. 40, no. 135, p. 293–304.
Fountain, A.G., and Fulk, M.A., 1984, South Cascade Glacier bib-liography, Washington: U.S. Geological Survey Open-FileReport 84–441, 13 p.
Fountain, A.G., Krimmel, R.M., and Trabant, D.C., 1996, A strat-egy for monitoring glaciers: U.S. Geological Survey Circular1132, 20 p.
Fountain, A.G., and Tangborn, W.V., 1985a, Contemporary tech-niques for prediction of runoff from glacierized areas, in
Report for the Working Group on Snow and Ice Hydrology ofGlacierized Basins: International Commission on Snow andIce, International Association of Hydrological Sciences Publi-cation No. 149, p. 27–41.
———1985b, The effect of glaciers on streamflow variations:Water Resources Research, v. 21, no. 4, p. 579–586.
References Cited

J378 SATELLITE IMAGE ATLAS OF GLACIERS OF THE WORLD
Fountain, A.G., Trabant, D.C., Brugman, M.M., Ommanney, C.S.,and Monroe, D.S., 1991, Glacier mass balance standards: EOS(American Geophysical Union Transactions), v. 72, no. 46,p. 511–514.
Foxworthy, B.L, and Hill, Mary, 1982, Volcanic eruptions of 1980at Mount St. Helens; the first 100 days: U.S. Geological SurveyProfessional Paper 1249, 125 p.
Graf, W.L., 1977, The distribution of glaciers in the Rocky Moun-tains of the United States: Journal of Glaciology, v. 18, no. 79,p. 325–328.
Haeberli, Wilfried, 1985, Fluctuations of glaciers 1975–1980:Paris, International Association of Hydrological Sciences andUnited Nations Educational, Scientific, and Cultural Organi-zation (UNESCO), v. 4, 265 p., 13 special topographic maps ofglaciers.
Haeberli, Wilfried, and Hoelzle, Martin, 1993, Fluctuations of gla-ciers, 1985–1990: Paris, International Association of Hydro-logical Sciences (International Commission on Snow andIce), United Nations Environment Programme, Global Envi-ronmental Monitoring System (GEMS), International Hydro-logical Programme, and United Nations Educational,Scientific, and Cultural Organization (UNESCO), v. 6, 322 p.
Haeberli, Wilfried, and Müller, Peter, 1988, Fluctuations of gla-ciers 1980–1985: Paris, International Association of Hydro-logical Sciences (International Commission on Snow andIce), United Nations Environment Programme, Global Envi-ronmental Monitoring System (GEMS), International Hydro-logical Programme, and United Nations Educational,Scientific, and Cultural Organization (UNESCO), v. 5, 290 p.
Haeberli, Wilfried, Hoelze, Martin, Suter, Stephan, and Frauen-felder, Regula, 1998, Fluctuations of glaciers 1990–1995:Paris, International Association of Hydrological Sciences(International Commission on Snow and Ice), United NationsEnvironment Programme, Global Environmental MonitoringService (GEMS), International Hydrological Programme, andUnited Nations Educational, Scientific, and Cultural Organi-zation (UNESCO), v. 7, 296 p.
Heliker, C.C., Johnson, Arthur, and Hodge, S.M., 1984, TheNisqually Glacier, Mount Rainier, Washington, 1857–1979: Asummary of the long-term observations and a comprehensivebibliography: U.S. Geological Survey Open-File Report83–541, 20 p.
Heusser, C.J., 1957, Variations of Blue, Hoh, and White Glaciersduring recent centuries: Arctic (Journal of the Arctic Instituteof North America), v. 10, no. 3, p., 139–150.
Hodge, S.M., 1972, The movement and basal sliding of theNisqually Glacier, Mt. Rainier: Seattle, Wash., University ofWashington, Department of Atmospheric Sciences, ScienceReport, (Ph. D. dissertation), 409 p.
———1974, Variations in the sliding of a temperate glacier:Journal of Glaciology, v. 13, no. 69, p. 349–369.
———1976, Direct measurements of basal water pressures—Apilot study: Journal of Glaciology, v. 16, no. 7, p. 205–218.
———1979, Direct measurement of basal water pressures—Progress and problems: Journal of Glaciology, v. 23, no. 89,p. 309–319.
Hopson, R.E., 1960, Collier Glacier—A photographic record:Mazama, v. 42, no. 13, p. 15–26.
Johnson, Arthur, 1958, Investigations on Grinnell and SperryGlaciers, Glacier National Park, Montana: International Geo-detic and Geophysical Union, International Association ofScientific Hydrology Assemblée Générale de Toronto, 1957,Gentbrugge, Belgium, 1958, Extrait des Comptes Rendus etRapports, v. 4, p. 525–534. [In English.]
———1980, Grinnell and Sperry Glaciers, Glacier National Park,Montana—A record of vanishing ice: U.S. Geological SurveyProfessional Paper 1180, 29 p., topographic maps, scale1:6,000.
Jordan, Raymond, and Kieffer H.H., 1982, Topographic map ofMount St. Helens, Washington, showing changes betweenApril 11 and May 16, 1980: U.S. Geological Survey Miscella-neous Investigations Series I–1411, scale 1:10,000.
Kasser, Peter, 1967, Fluctuations of glaciers 1959–1965: Paris,International Association of Scientific Hydrology and UnitedNations Educational, Scientific, and Cultural Organization(UNESCO), v. 1, 52 p., 23 tables, 7 figs., 1:25,000-scale photo-grammetric map of Aletschgletscher.
-———1973, Fluctuations of glaciers 1965–1970: Paris, Interna-tional Association of Hydrological Sciences and UnitedNations Educational, Scientific, and Cultural Organization(UNESCO), v. 2, 357 p., 5 special topographic maps of gla-ciers.
Kautz, A.V., 1875, Ascent of Mount Rainier: Overland Monthly,v. 14, no. 5, p. 393–403.
King, Clarence, 1871, On the discovery of actual glaciers on themountains of the Pacific Slope: American Journal of Science,series 3, v. 1, p. 157–167.
Krimmel, R.M., 1970, Gravimetric ice thickness determination,South Cascade Glacier, Washington: Northwest Science,v. 44, no. 3, p. 147–153.
———1989, Mass balance and volume of South Cascade Glacier,Washington, 1958–1985, in Oerlemans, Johananes, ed., Gla-cier fluctuations and climatic change: Dordrecht, Nether-lands, Kluwer Academic Publishers, p. 193–206.
———1993, Mass balance, meteorological, and runoff measure-ments at South Cascade Glacier, Washington, 1992 balanceyear: U.S. Geological Survey Open–File Report 93–640, 38 p.
———1994, Runoff, precipitation, mass balance, and ice veloc-ity measurements at South Cascade Glacier, Washington,1993 balance year: U.S. Geological Survey Water-ResourcesInvestigations Report 94–4139, 34 p.
———1995, Water, ice, and meteorological measurements atSouth Cascade Glacier, Washington, 1994 balance year: U.S.Geological Survey Water-Resources Investigations Report95–4162, 41 p.
———1996, Water, ice, and meteorological measurements atSouth Cascade Glacier, Washington, 1995 balance year: U.S.Geological Survey Water-Resources Investigations Report96–4174, 37 p.
———1997, Water, ice, and meteorological measurements atSouth Cascade Glacier, Washington, 1996 balance year: U.S.Geological Survey Water-Resources Investigations Report97–4143, 34 p.

GLACIERS OF THE CONTERMINOUS UNITED STATES J379
———1998, Water, ice, and meteorological measurements atSouth Cascade Glacier, Washington, 1997 balance year: U.S.Geological Survey Water-Resources Investigations Report98–4090, 30 p.
———1999, Water, ice, meteorological, and speed measure-ments at South Cascade Glacier, Washington, 1998 balanceyear: U.S. Geological Survey Water-Resources InvestigationsReport 99–4049, 36 p.
———2000, Water, ice, and meteorological measurements atSouth Cascade Glacier, Washington, 1986–1991 balanceyears: U.S. Geological Survey Water-Resources InvestigationsReport 2000–4006, 77 p.
———2001, Water, ice, meteorological, and speed measure-ments at South Cascade Glacier, Washington, 1999 balanceyear: U.S. Geological Survey Water-Resources InvestigationsReport 2000–4265, 36 p.
Krimmel, R.M., and Meier, M.F., 1975, Glacier application ofERTS images: Journal of Glaciology, v. 15, no. 73, p. 391–402.
Krimmel, R.M., Tangborn, W.V., Sikonia, W.G., and Meier, M.F.,1978, Ice and water balances, South Cascade Glacier,1957–1977, in International Symposium on the Computationand Prediction of Runoff from Glacier and Glacial Area,Tbilisi, U.S.S.R., 1978: U.S.S.R. Academy of Sciences, Sectionof Glaciology, Data of Glaciological Studies, Publication 38,p. 143–147, 217–219.
LaChapelle, Edward, 1965, The mass budget of Blue Glacier,Washington: Journal of Glaciology, v. 5, no. 41, p. 609–623.
Matthes, F.E., 1931, Glacier measurements in the United States,
in Reports and papers, Section of Hydrology: NationalResearch Council, National Academy of Sciences, 12thannual meeting, Washington, D.C., American GeophysicalUnion Transactions, p. 211–215.
———1932, On glaciers, in Reports and papers, Section ofHydrology: National Research Council, National Academy ofSciences, 13th annual meeting, Washington, D.C., AmericanGeophysical Union Transactions, p. 282–287.
———1933, On glaciers, in Reports and papers, Section ofHydrology: National Research Council, National Academy ofSciences, 14th annual meeting, Washington, D.C., AmericanGeophysical Union Transactions, p. 345–350.
———1934, Report of the Committee on Glaciers, 1933–34, inReports and papers, Section of Hydrology: National ResearchCouncil, National Academy of Sciences, 15th annual meeting,part 2, Washington, D.C., American Geophysical Union Trans-actions, p. 279–285.
———1935, Report of the Committee on Glaciers, 1934–35, inReports and papers, Section of Hydrology: National ResearchCouncil, National Academy of Sciences, 16th annual meeting,part 2, Washington, D.C., American Geophysical Union Trans-actions, p. 387–392.
———1936, Report of the Committee on Glaciers, 1935–36, inReports and papers, Section of Hydrology: National ResearchCouncil, National Academy of Sciences, 17th annual meeting,part 2, Washington, D.C., American Geophysical Union Trans-actions, p. 286–294.
———1937, Report of the Committee on Glaciers, 1936–37, inReports and papers, Section of Hydrology: National ResearchCouncil, National Academy of Sciences, 18th annual meeting,part 2, Washington, D.C., American Geophysical Union Trans-actions, p. 293–299.
———1938, Report of the Committee on Glaciers, 1937–38, inReports and papers, Section of Hydrology: National ResearchCouncil, National Academy of Sciences, 19th annual meeting,part 1, Washington, D.C., American Geophysical Union Trans-actions, p. 314–320.
———1939, Report of the Committee on Glaciers, April 1939, inReports and papers, Section of Hydrology: National ResearchCouncil, National Academy of Sciences, 20th annual meeting,part 4, Washington, D.C., American Geophysical Union Trans-actions, p. 518–523.
———1940, Report of the Committee on Glaciers, 1939-40, inReports and papers, Section of Hydrology: National ResearchCouncil, National Academy of Sciences, 21st annual meeting,part 2, Washington, D.C., American Geophysical Union Trans-actions, p. 396–406.
———1941, Report of the Committee on Glaciers, 1940-41, inReports and papers, Section of Hydrology: National ResearchCouncil, National Academy of Sciences, 22d annual meeting,part 3, Washington, D.C., American Geophysical Union Trans-actions, p. 1006–1011.
——1942, Report of the Committee on Glaciers, 1941-42, in
Reports and papers, Section of Hydrology: National ResearchCouncil, National Academy of Sciences, 23d annual meeting,part 2, Washington, D.C., American Geophysical Union Trans-actions, p. 374–392.
———1944, Report of the Committee on Glaciers, 1942-43, inReports and papers, Section of Hydrology: National ResearchCouncil, National Academy of Sciences, 24th annual meeting,part 2, Washington, D.C., American Geophysical Union Trans-actions, p. 389–401.
———1945, Report of the Committee on Glaciers, 1943–44, inReports, Section of Hydrology: National Research Council,National Academy of Sciences, 25th annual meeting, part 5,Washington, D.C., American Geophysical Union Transac-tions, p. 677–683.
Mayo, L.R., 1984, Glacier mass balance and runoff research inthe U.S.A.: Geografiska Annaler, series A, v. 66, no. 3,p. 215–227.
Meier, M.F., 1958, Glacier observations in the Cascade Moun-tains, U.S.A., in American Geographical Society, Preliminaryreports of the Antarctic and Northern Hemisphere glaciologyprograms: New York, International Geophysical Year Glacio-logical Report Series 1, p. IX–1–IX–6.
———1961a, Distribution and variations of glaciers in theUnited States exclusive of Alaska, in General Assembly ofHelsinki, 1960: International Association of Scientific Hydrol-ogy Publication No. 54, p. 420–429.
———1961b, Mass budget of South Cascade Glacier, 1957–60:U.S. Geological Survey Professional Paper 424–B,p. B206–B211.
J380 SATELLITE IMAGE ATLAS OF GLACIERS OF THE WORLD
———1966, Some glaciological interpretations of remappingprograms on South Cascade, Nisqually, and Klawatti Gla-ciers, Washington: Canadian Journal of Earth Sciences, v. 3,no. 6, p. 811–818.
———1967, South Cascade Glacier, Washington, in Annals ofthe International Geophysical Year: Glaciology, v. 41,p. 169–170.
Meier, M.F., Alexander, R.H., and Campbell, W.J., 1966, Multi-spectral sensing tests at South Cascade Glacier, Washington:Symposium on Remote Sensing of Environment, 4th, AnnArbor, Mich., Proceedings, p. 145–159.
Meier, M.F., and Evans, W.E., 1975, Comparison of differentmethods for estimating snowcover in forested, mountainousbasins using LANDSAT (ERTS) images, Washington and San-tiam River, Oregon, in Rango, Al, ed., Workshop on Opera-tional Applications of Satellite Snowcover Observations:National Aeronautics and Space Administration Special Pub-lication–391, p. 215–234.
Meier, M.F., Kamb, W.B., Allen, C.R., and Sharp, R.P., 1974, Flowof Blue Glacier, Olympic Mountains, Washington, U.S.A.:Journal of Glaciology, v. 13, no. 68, p. 187–212.
Meier, M.F., Mayo, L.R., Trabant, D.C., and Krimmel, R.M., 1980,Comparison of mass balance and runoff at four glaciers inthe United States, 1966 to 1977: U.S.S.R. Academy of Sci-ences, Section of Glaciology, Data of Glaciological StudiesPublication 38, p. 138–147 (Russian text and figures),p. 214–219 (English text only).
Meier, M.F., and Post, A.S., 1962, Recent variations in mass netbudgets of glaciers in western North America, in Ward, W.,Variations of the regime of existing glaciers: InternationalUnion of Geodesy and Geophysics, International Associationof Scientific Hydrology Publication No. 58, p. 63–77.
Meier, M.F., and Tangborn, W.V., 1965, Net budget and flow ofSouth Cascade Glacier, Washington: Journal of Glaciology,v. 5, no. 41, p. 547–566.
Meier, M.F., Tangborn, W.V., Mayo, L.R., and Post, Austin, 1971,Combined ice and water balances of Gulkana and WolverineGlaciers, Alaska, and South Cascade Glacier, Washington,1965 and 1966 hydrologic years: U.S. Geological Survey Pro-fessional Paper 715–A, 23 p.
Miller, C.D., 1969, Chronology of neoglacial moraines in thedome peak area, North Cascade Range, Washington: Arcticand Alpine Research, v. 1, no. 1, p. 49–65.
Müller, Fritz, 1977, Fluctuations of glaciers 1970–1975: Paris,International Association of Hydrological Sciences andUnited Nations Educational, Scientific, and Cultural Organi-zation (UNESCO), v. 3, 269 p., 12 special topographic maps ofglaciers.
Müller, Fritz, Caflisch, T., and Muller, G., 1977, Instructions forcompilation and assemblage of data for a world glacier inven-tory: Zürich, Swiss Federal Institute of Technology (ETH),Department of Geography, International Commission onSnow and Ice, Temporary Technical Secretariat for WorldGlacier Inventory, 28 p.
Naftz, D.L., 1993, Ice-core records of the chemical quality ofatmospheric deposition and climate from mid-latitude gla-ciers, Wind River Range, Wyoming: Golden, Colo., ColoradoSchool of Mines, unpublished Ph.D. dissertation, 204 p.
Naftz, D.L., Miller, K.A., and See, R.B., 1991, Using glacial icecores from Wyoming as long-term records of atmosphericdeposition quality and climate change—A progress report:American Water Resources Association Hydata Technote,v. 10, no. 4, p. 23–24.
Naftz, D.L., Rice, J.A., and Ranville, J.R., 1991, Glacial-ice com-position—A potential long-term record of the chemistry ofatmospheric deposition, Wind River Range, Wyoming: WaterResources Research, v. 27, no. 6, p. 1231–1238.
Naftz, D.L., and Smith, M.E., 1993, Ice thickness, ablation, andother glaciological measurements on Upper Fremont Glacier,Wyoming: Physical Geography, v. 14, no. 4, p. 404–414.
Nye, J.F., 1965, A numerical method of inferring the budget his-tory of a glacier from its advance and retreat: Journal of Gla-ciology, v. 5, no. 41, p. 589–607.
Østrem, Gunnar, and Brugman, M., 1991, Glacier mass-balancemeasurements, a manual for field and office work: Saska-toon, Saskatchewan, Canada, Norwegian Water Resourcesand Energy Administration, and Environment Canada,National Hydrology Research Institute Science Report 4,224 p.
Pelto, M.S., 1996, Annual net balance of North Cascade glaciers,1984–1994: Glaciology, v. 42. no. 140, p. 3–9.
Phillips, E.L., and Donaldson, W.R., 1972, Washington climate forthe counties Clallam, Grays Harbor, Jefferson, Pacific, Wahki-akum: Pullman, Wash., U.S. Department of Agriculture incooperation with Cooperative Extension Service, Washing-ton State University, p. 6.
Post, Austin, Richardson, Don, Tangborn, W.V., and Rosselot,F.L., 1971, Inventory of glaciers in the North Cascades, Wash-ington: U.S. Geological Survey Professional Paper 705–A,26 p.
Raub, W.B., Post, Austin, Brown, C.S., and Meier, M.F., 1980,Perennial ice masses of the Sierra Nevada, California, in
World glacier inventory, Proceedings of the Riederalp (Swit-zerland) workshop: International Association of HydrologicalSciences-Association Internationale des Sciences Hydro-logiques Publication No. 126, p. 33–34.
Reed, J.C., Jr., 1964, Recent retreat of the Teton Glacier, GrandTeton National Park, Wyo., in Geological Survey research1964: U.S. Geological Survey Professional Paper 501–C,p. C147–C151.
———1965, Rate of ice movement and estimated ice thicknessin part of the Teton Glacier, Grand Teton National Park, Wyo.,in Geological Survey research 1965: U.S. Geological SurveyProfessional Paper 525–B, B137–B141.
———1967, Observations on the Teton Glacier, Grand TetonNational Park, Wyo., 1965 and 1966, in Geological Surveyresearch 1967: U.S. Geological Survey Professional Paper575–C, p. C154–C159.
GLACIERS OF THE CONTERMINOUS UNITED STATES J381
Richardson, Donald, 1968, Glacier outburst floods in the PacificNorthwest, in Geological Survey research 1968: U.S. Geologi-cal Survey Professional Paper 600–D, p. D79–D86.
Russell, I.C., 1885, Existing glaciers of the United States: U.S.Geological Survey Annual Report 5 (1883–84), p. 303–355.
———1898, Glaciers of Mount Rainier: U.S. Geological SurveyAnnual Report 18 (1896-97), pt. 2, p. 349-415.
Shreve, R.L., and Sharp, R.P., 1970, Internal deformation andthermal anomalies in lower Blue Glacier, Mount Olympus,Washington, U.S.A.: Journal of Glaciology, v. 9, no. 55,p. 65–86.
Sigafoos, R.S., and Hendricks, E.L., 1972, Recent activity of gla-ciers of Mount Rainier, Washington: U.S. Geological SurveyProfessional Paper 387–B, p. B1–B24.
Sigurƒsson, Oddur, and Williams, R.S., Jr., 1998, Past, present,and future glacier fluctuations in Iceland: An environmentalresponse to climatic variability in the North Atlantic [abs.]: inAbstracts and curriculum vitae of International Workshop onEnvironmental and Climatic Variations in the North AtlanticRegion, Reykjavík, Iceland (23–26 September 1998), p. 29.
Snyder, E.F., 1996, Bibliography of glacier studies by the U.S.Geological Survey: U.S. Geological Survey Open-File Report95–723, 35 p.
Sperry, A.L., 1938, Avalanche: Boston, Mass., Christopher Pub-lishing House, 166 p.
Spicer, R.C., 1986, Glaciers in the Olympic Mountains, Washing-ton: Present distribution and recent variations: Seattle,Wash., University of Washington, unpublished M.S. disserta-tion, 158 p.
Sullivan, M.E., 1994, South Cascade Glacier, Washington—Hydrologic and meteorological data, 1957–67: U.S. Geologi-cal Survey Open-File Report 94–77, 105 p. and diskette.
Tangborn, W.V., 1962, Glaciological investigations on South Cas-cade Glacier: Mountaineer, v. 55, no. 4, p. 9.
Tangborn, W.V., 1963, Instrumentation of a high altitude glacierbasin to obtain continuous record for water budgets—A pre-liminary report, in General Assembly of Berkeley: Interna-tional Association of Scientific Hydrology Publication No. 61,p. 131–137.
———1965, Net mass budget of South Cascade Glacier, Wash-ington [abs.], in Geological Survey research 1965: U.S. Geo-logical Survey Professional Paper 525A, p. A180–181.
———1968, Mass balances of some North Cascade glaciers asdetermined by hydrologic parameters, 1920–1965, in Interna-tional Commission on Snow and Ice, Bern, Switzerland, 1967,Proceedings: International Association of Scientific Hydrol-ogy Publication No. 79, p. 267–274.
Tangborn, Wendell, 1980, Two models for estimating climate-gla-cier relationships in the North Cascades, Washington, U.S.A.:Journal of Glaciology, v. 25, no. 91, p. 3–21.
Tangborn, W.V., Fountain, A.G., and Sikonia, W.D., 1990, Effect
of altitude-area distribution on glacier mass balance—A com-
parison of North and South Klawatti Glaciers, Washington
State, U.S.A.: Annals of Glaciology, v. 14, p. 278–282.
Tangborn, W.V., Krimmel, R.M., and Meier, M.F., 1975, A compar-
ison of glacier mass balance measurements by glaciologic,
hydrologic and mapping methods, South Cascade Glacier,
Washington, in International Association of Hydrological Sci-
ences, General Assembly of Moscow, U.S.S.R., 1971 Proceed-
ings: International Association of Hydrological Sciences-
Association Internationale des Sciences Hydrologiques Publi-
cation No. 104, p. 185–196.
Tangborn, W.V., Mayo, L.R., Scully, D.R., and Krimmel, R. M.,
1977, Combined ice and water balances of Maclure Glacier,
California, South Cascade Glacier, Washington, and Wolver-
ine and Gulkana Glaciers, Alaska, 1967 hydrologic year: U.S.
Geological Survey Professional Paper 715–B, 20 p.
Tilling, R.I., n.d. [1984], Eruptions of Mount St. Helens: Past,
present, and future: U.S. Geological Survey General Interest
Publication, 52 p.
UNESCO (United Nations Educational, Scientific, and Cultural
Organization), 1970, Perennial ice and snow masses; a guide
for compilation and assemblage of data for a world inven-
tory: Paris, UNESCO-International Association of Scientific
Hydrology Technical Papers in Hydrology, 1, 19 p.
U.S. Geological Survey, 1978, Nisqually Glacier, Mount Rainier
National Park, Washington: Reston, Va., U.S. Geological Sur-
vey, Nisqually Glacier, 1976 Plan, 1:10,000-scale topographic
map based on aerial photographs taken on August 31, 1976.
Veatch, F.M., 1969, Analysis of a 24-year photographic record of
Nisqually Glacier, Mount Rainier National Park, Washington:
U.S. Geological Survey Professional Paper 631, 52 p.
Walder, J.S., and Driedger, C.L., 1993, Glacier-generated debris
flows at Mount Rainier: U.S. Geological Survey Open-File
Report 93–124, [Water Fact Sheet], 2 p.
———1995, Frequent outburst floods from South Tahoma Gla-
cier, Mount Rainier, U.S.A.—Relation to debris flows, meteo-
rological origin and implications for subglacial hydrology:
Journal of Glaciology, v. 41, no. 137, p. 1–10.
Waldrop, H.A. 1964, Arapaho Glacier, a sixty-year record: Uni-
versity of Colorado Studies, Series in Geology, no. 3, 37 p.
Walters, R.A., and Meier, M.F., 1989, Variability of glacier mass
balances in western North America, in Peterson, D.H.,
Aspects of climate variability in the Pacific and western
Americas: American Geophysical Union Geophysical Mono-
graph 55, p. 365–374.
Wentworth, C.K., and Delo, D.M., 1931, Dinwoody Glaciers,
Wind River Mountains, Wyoming, with a brief survey of exist-
ing glaciers in the United States: Geological Society of Amer-
ica Bulletin, v. 42, no. 3, p. 605–620.