giving up job search during a recession: the impact …ftp.iza.org/dp6116.pdf · giving up job...
TRANSCRIPT
DI
SC
US
SI
ON
P
AP
ER
S
ER
IE
S
Forschungsinstitut zur Zukunft der ArbeitInstitute for the Study of Labor
Giving Up Job Search During a Recession:The Impact of the Global Financial Crisison the South African Labour Market
IZA DP No. 6116
November 2011
Sher Verick
Giving Up Job Search During a Recession: The Impact of the Global Financial Crisis
on the South African Labour Market
Sher Verick International Labour Office (ILO)
and IZA
Discussion Paper No. 6116 November 2011
IZA
P.O. Box 7240 53072 Bonn
Germany
Phone: +49-228-3894-0 Fax: +49-228-3894-180
E-mail: [email protected]
Any opinions expressed here are those of the author(s) and not those of IZA. Research published in this series may include views on policy, but the institute itself takes no institutional policy positions. The Institute for the Study of Labor (IZA) in Bonn is a local and virtual international research center and a place of communication between science, politics and business. IZA is an independent nonprofit organization supported by Deutsche Post Foundation. The center is associated with the University of Bonn and offers a stimulating research environment through its international network, workshops and conferences, data service, project support, research visits and doctoral program. IZA engages in (i) original and internationally competitive research in all fields of labor economics, (ii) development of policy concepts, and (iii) dissemination of research results and concepts to the interested public. IZA Discussion Papers often represent preliminary work and are circulated to encourage discussion. Citation of such a paper should account for its provisional character. A revised version may be available directly from the author.
IZA Discussion Paper No. 6116 November 2011
ABSTRACT
Giving Up Job Search During a Recession: The Impact of the Global Financial Crisis on the South African Labour Market*
The global financial crisis deeply impacted the South African labour market resulting in the shedding of almost 1 million jobs over 2009 and 2010. Reflecting longer term structural problems, this employment loss translated into a much larger rise in the number of discouraged individuals rather than those defined as ‘narrowly’ unemployed. Drawing on estimates using the micro-data, this paper shows that this state of non-searching unemployment or discouragement has increased more during the recent crisis for uneducated African males. Moreover, individuals who have given up job search during the recession are statistically different than those who continue searching. At the same time, searching is a transitory state for some of the jobless with considerable movements between the two categories of unemployment. These findings from the first post-Apartheid recession underscore the importance in the South African context of analysing a broad measure of unemployment, which includes discouraged workers. In response to these labour market challenges, the government should further reduce barriers to job search through such measures as training for the low-skilled and transport subsidies, along with other interventions that boost demand and job creation in rural areas. JEL Classification: G01, J21, J64 Keywords: global financial crisis, unemployment, discouraged workers, South Africa Corresponding author: Sher Verick ILO Decent Work Technical Support Team for South Asia International Labour Office (ILO) India Habitat Centre Core 4B, 3rd Floor, Lodi Road New Delhi - 110 003 India E-mail: [email protected]
* The findings and views reported in this paper are those of the author and should not be attributed to the International Labour Organization (ILO). The author is grateful for comments from Duncan Campbell, Sandrine Cazes, Marva Corley-Coulibaly, Alexander Hijzen, Iyanatul Islam, David Kucera, two anonymous referees and seminar participants at the 39th Decent Work Forum at the ILO, DPRU Conference in Johannesburg, and ILO workshop on ‘Developing more effective labour market policies and institutions’ in Istanbul, Turkey.

2
1 Introduction The segregation policies of the Apartheid era in South Africa resulted in low levels of education, suppressed entrepreneurism and spatial inequalities among the African population. Though Apartheid was dismantled in 1994, economic and social outcomes in this country continue to be heavily influenced by these historical legacies. This is no more apparent than in the labour market, which is characterized by some of the highest unemployment rates and lowest employment-population ratios in the world. At the same time, the informal sector is relatively small, which can be argued to be a manifestation of Apartheid policies that stymied entrepreneurship. In addition, labour demand in South Africa has become increasingly skills-biased and, subsequently, the formal part of the economy has failed to absorb the large rise in labour supply that has accompanied the transition to democracy (most notably among African women). Moreover, since the 1990s, there has been a structural shift as reflected by the declining numbers of jobs in the mining and agricultural sectors, which were major employers of poorly educated South Africans. On top of these characteristics, real wages have either remained stagnant or fallen over the post-Apartheid period, above all for low-skilled workers. In terms of the persistent inequalities present in the labour market, Africans in this country are much more likely than other racial groups to be employed in the informal sector, unemployed or to have given up job search altogether and exited the labour force. Youth, the less-skilled and women, which are of course not distinct categories, also experience considerable barriers to participating in the labour market, especially with respect to finding jobs in the formal economy. Youth have faced particular barriers to accessing the labour market: according to the September 2007 Labour Force Survey, the (narrowly-defined) unemployment rate of young South Africans aged 20 to 24 stood at 44.7 per cent even before the global financial crisis hit in 2008. These issues, especially the failure of young South Africans to make a successful transition from school to work, continue to be key policy concerns for the Government of South Africa as they are a major factor behind (and a cause of) the insufficient economic growth and sharp inequalities that drive social unrest and crime. The latest policy initiative, labelled the ‘New Growth Path’, is a reflection of the government’s commitment to engineer significant change that would overcome these persistent barriers.2 Over recent decades, this situation in the South African labour market has also attracted considerable attention from academics who have played an important role in shaping the policy response. In this respect, a broad range of studies have investigated these labour market dimensions in depth, including Banerjee et al. (2008), Bhorat et al. (2001), Bhorat and Kanbur (2006), Devey et al. (2008), Kingdon and Knight (2004, 2006, 2007), OECD (2008), Padayachee (2006), Valodia et al. (2005), and Valodia (2007). One of the key references, Banerjee et al. (2008), finds that unemployment in South Africa is more structural than transitional, while demand has shifted towards skilled workers, which has exacerbated the barriers faced by the unskilled. Overall, the problem of unemployment has been driven by both the fall in demand for less-skilled workers and increase in supply of those with lower levels of education (mostly African women). Banerjee et al. (2008) outline three key reasons why unemployment has remained high among the African population: firstly, less effective job search due to spatial separation between business centres and rural areas, lack of affordable transport, and potentially, discrimination;
2 See, for example,www.agrisa.co.za/konferensie/Agrisa/30814_ngp_framework_for_public_release_final_1.pdf

3
secondly, the failure for the informal sector to act as an ‘absorber’ of excess labour supply; and finally, high reservation wages. Similar to Banerjee et al. (2008), Kingdon and Knight (2007) argue that the rise in the unemployment rate from 1995 to 2003 was due to inadequate economic growth and thus insufficient labour demand relative to the rapid expansion in labour supply over this period.3 Indeed, the labour force grew at over 4 per cent per annum from 1995 to 2003, mainly due to population growth and an increase in labour force participation among women (from 47.8 per cent in 1995 to 62.8 per cent in 2003) and Africans (from 51.8 per cent to 65.9 per cent over the same period). This study also attributes the high South African unemployment rate to labour market inflexibility, though this hypothesis is not tested through the empirical analysis. Kingdon and Knight (2007) cite evidence that informal sector workers have both higher incomes and subjective well-being than the unemployed. For this reason, the authors conclude that the bulk of unemployment in South Africa is involuntary, reflecting the barriers to not only formal sector employment but also to jobs in the informal sector. Hurdles to informal sector employment include crime, lack of access to credit, inadequate infrastructure and services, and insufficient skills and training opportunities (Kingdon and Knight 2007).4 Informal sector workers in South Africa are disproportionately black, female and uneducated, and are mostly operating in the wholesale trade and retail sector (Devey et al. 2008, Valodia 2007, Valodia et al. 2005). One of the main themes of this paper is the difference between the narrow definition of unemployment, which only includes individuals who are actively searching for a job, and the broad classification that also counts the discouraged as unemployed (i.e. adding individuals who are able to work but are not currently searching for a job). In 1994, the difference between the narrow and broad unemployment rates stood at 11.5 percentage points (20.0 versus 31.5 per cent) (Kingdon and Knight 2006). Over the last decade and a half, this gap narrowed and prior to the onset of the recession, it amounted to only 4.8 points (23.5 versus 28.3 per cent). Therefore, while unemployment remained high even in years of stronger growth, a greater percentage of unemployed South Africans were searching, which reflects the higher expected benefits of job search. Going beyond just the differences between aggregate rates, Kingdon and Knight (2006) investigate the nature of searching and non-searching unemployment. Using different tests, this study finds that discouraged workers are more deprived and no happier (in terms of self-reported subjective well-being) than the searching unemployed, while local wage determination takes into account both types of joblessness. As demonstrated by the results presented below, the conclusion of Kingdon and Knight (2006) continues to be highly relevant for South African policymakers: ‘our findings imply that the non-searching unemployed deserve no less policy attention than do the searchers, and that the broad unemployment measure should be estimated alongside the narrow measure and given credence, in South Africa …’ (Kingdon and Knight 2006: 311). During the global boom years of 2002-2007, unemployment in South Africa began to finally fall as economic conditions further improved. In this respect, the unemployment rate stood at 25 per cent in 2007 (it reached a low of 21.9 per cent in the third quarter of 2008), down from 31.2 per cent in 2003. Owing to its strong trade and financials links, South Africa was hit hard by the global financial crisis, which has come on top of the longer term structural problems in its economy and labour market. Consequently, the country fell into a recession in the fourth quarter of 2008 and contracted by 1.7 per cent in 2009.5 This severe slump was largely driven by a contraction in the manufacturing sector, along 3 Referring to the claim of mis-measurement of South African unemployment, Kingdon and Knight (2007) suggest that the high unemployment rate measured through household and labour force surveys could indeed be an underestimate. 4 For the situation of African entrepreneurs during the Apartheid period, see Rogerson (1992). 5 See IMF World Economic Outlook October 2010, available at: http://www.imf.org/external/pubs/ft/weo/2010/02/weodata/index.aspx
4
with a fall in output in the mining, financial, real estate and business services, and wholesale and retail trade sectors (Statistics South Africa 2009, South Africa Reserve Bank 2009). The South African government recognized the severity of the downturn and responded with a fiscal stimulus package that aimed to support demand and create jobs, while the South African Reserve Bank loosened monetary policy.6 In spite of the response of the Government of South Africa, the ensuing recession of 2008-2009 decimated the labour market resulting in a drop in employment of over 800,000 (difference in the average in 2010 over 2008). As shown in this paper, this massive loss of jobs resulted in a number of outcomes that may appear to external commentators as unexpected but are in fact entirely consistent with the findings presented in the literature highlighted above. Nonetheless, they serve as a reminder of the continuing sclerotic state of the labour market in South Africa and the need for policymakers to take action on addressing the structural factors driving these processes. In this respect, the main effect of the downturn on the labour market has been a rise in the number of discouraged individuals, from an average of 1.12 million in 2008 to 1.98 million in 2010. In comparison, narrowly-defined search unemployment increased over the same period by only 214,000 (from 4.08 to 4.29 million). Drawing on the estimates from the micro-data, discouragement has increased more for uneducated Africans. Moreover, individuals who have given up job search are statistically different than those who continue searching while jobless. Indeed, the message emanating from Kingdon and Knight (2006), that South African policymakers need to track the broad measure of unemployment along with the narrow definition is emphatically confirmed by the findings presented in this paper. Furthermore, these findings underscore the need for the Government of South Africa to further reduce barriers to job search through such measures as investing in training, infrastructure, and transport subsidies. The remainder of the paper is structured as follows: section 2 reviews the aggregate statistics, while section 3 presents the data, empirical strategy and micro-estimates of the determinants of labour market status before the crisis (2008) and after (2009-2010), including the role of gender, race, education and spousal labour market status in driving vulnerability to poor outcomes in the labour market. Focusing in more detail on the issue of discouragement and job search, section 4 analyses differences between individuals classified as unemployed and discouraged, and how the decision to undertake job search has changed during the recession of 2009. Finally, section 5 concludes.
2 What the aggregates tell about the impact of the global financial crisis on the South African labour market
During the recession of 2008-2009, the impact on labour market status in South Africa was multifaceted and in some respects unexpected. Overall, the number of South Africans employed decreased from 13.7 million in 2008 to 12.9 million in 2010 (a drop of 5.8 per cent), which was driven by employment losses in the manufacturing, wholesale and retail trade and construction sectors. This dramatic fall in employment represents a partial destruction of the gains made during the 2000s when total employment grew by 3.8 million from 2001 to 2008 (from 10.9 million to 13.7 million). Already among the lowest in
6 The Monetary Policy Committee (MPC) of the South African Reserve Bank started reducing interest rates in December 2008. The cumulative reduction in the repurchase rate over 2008-2009 was 5 percentage points (the rate reached a low of 7 per cent) (South Africa Reserve Bank 2009). The result of tripartite negotiations, the Framework for South Africa’s Response to the International Economic Crisis, outlines the main pillars of the government’s action plan to respond to the crisis, including major public investment programs, see www.info.gov.za/view/DownloadFileAction?id=96381.

5
the world, the employment-population ratio in South Africa has subsequently dropped from 44.6 per cent in 2008 to 40.7 per cent in 2010. In addition to considering the total adjustment, it is also important to look at changes to formal versus informal sector employment.7 In this sense, it is usually assumed that the urban informal sector absorbs workers who are unable to find a job in the formal sector, though the literature increasingly views the sector as consisting of both survivalists and entrepreneurs who chose to operate informally.8 During a downturn, particularly one that is driven by an external shock, it is generally expected that employment in a developing country will fall in the formal sector, accompanied by a rise in employment in the informal sector (see, for example, the impact of the Asian financial crisis on Indonesia in Fallon and Lucas (2002)). In contrast to this stylized fact, informal sector employment in South Africa fell during the recession of 2008-2009 (Figure 1). The share of informal sector employment declined from 17 per cent in 2008Q1 to 15.5 per cent in 2009Q3. From 2008 to 2009, annual employment losses in this sector accounted for 36.1 per cent of the fall in employment (despite its share being below 20 per cent) compared to 37.3 per cent for the formal sector. However, this has since reversed: from 2009 to 2010, 64.2 per cent of the fall in total employment was due to losses in the formal sector. All in all, informal sector employment declined by 14 per cent from 2008Q1 to 2009Q3, while formal sector employment fell by 5.3 per cent from 2008Q1 to 2010Q2. Over 2010, employment in the informal sector has recovered much more rapidly than in the formal sector. Altogether, these figures reveal that adjustment in the informal sector has been more rapid both in terms of job losses during the recession and employment growth once recovery was underway. In general, this can be explained by differences in labour adjustment costs: hiring and firing are more expensive in the formal sector and thus employers are slower to adjust employment over the business cycle.
Figure 1: Adjustment in employment during the crisis: informal versus formal sector, 2008Q1 – 2010Q4
Source: Statistics South Africa Quarterly Labour Force Survey, 2008Q1 to 2010Q4; author’s calculations. Notes: All figures are population weighted; figures may vary from published sources due to revisions and sample selection.
7 This is defined in terms of registration/licensing of enterprise, excluding the agricultural sector. 8 See, for example, Jutting and Laiglesia (2009).

6
Despite this loss of jobs, the narrowly-defined unemployment rate for the whole population only increased from an average of 22.9 per cent in 2008 to 24.0 per cent in 2009, before peaking at 25.0 per cent in 2010 (maximum of 25.3 per cent in the second quarter of 2010) (Figure 2). As expected, the narrowly-defined unemployment rate for youth (aged 15-24) increased by a greater amount (5 percentage points from an annual average of 45.5 per cent in 2008 to 50.5 per cent in 2010). The rate rose by 2.9 percentage points for prime-age men (aged 25-54) (from 15.5 per cent in 2008 to 18.4 per cent in 2010), while it increased by only 1 point for prime-age women (from 21.5 per cent to 22.5 per cent).9 Reflecting the long-term inequalities present in the labour market, searching or narrowly-defined unemployment has increased more for black and coloured South Africans.
Figure 2: Rising divergence between the narrow and broad unemployment rates during the recession and beyond, 2008Q1 – 2010Q4
Source: Statistics South Africa Quarterly Labour Force Survey, 2008Q1 to 2010Q4; author’s calculations. Notes: All figures are population weighted; figures may vary from published sources due to revisions and sample selection. The narrow unemployment rate is the ratio of the unemployed who are searching for a job to the labour force (U/E+U); the broad unemployment rate is the ratio of the sum of the narrowly-defined unemployed and discouraged workers to the broad labour force, which includes these discouraged workers (U+D/U+D+E).
The fall in employment during the recession translated to a larger increase in discouragement, and hence the broad unemployment rate, which includes this labour market category. In this regard, Figure 2 clearly illustrates the divergence between the narrow and broad unemployment rates (see also Table 1). Both rates reached a low in the fourth quarter of 2008, 21.9 and 26.7 per cent, respectively (i.e. a gap of 4.8 percentage points). Reflecting a lag of one quarter with respect to GDP, the two categories of unemployment started increasing only at the beginning of 2009. However, in the case of the narrowly-defined group, the rate peaked at 25.3 per cent in 2010Q2 before falling in the last quarter of 2010. In comparison, the broad unemployment rate has increased by a much greater magnitude and peaked at 33.1 per cent in the third quarter of 2010. The gap between the two rates amounted to 8.4 points in the last quarter of 2010, an increase of 3.6 points from two years earlier. This divergence starkly illustrates the significance of the rising numbers of discouraged workers during the recession South Africa endured in 2008-2009 and beyond during the weak recovery of 2010.
9 This impact on young men has been also found in the case of OECD countries as highlighted by Verick (2009).

7
Table 1: Evolution of the narrow and broad unemployment rates in South Africa, annual averages 2008 to 2010
Annual average
2008 2009 2010 Difference – 2008 to 2010
(percentage points)
Narrow unemployment rate (%)
Total 22.9 24.0 24.9 2.0
Broad unemployment rate (%)
Total 27.5 30.1 32.7 5.2
Male 23.5 27.1 29.4 5.9
Female 32.0 33.4 36.5 4.5
Youth 51.5 56.2 60.3 8.8
African/black 32.5 35.5 38.4 5.9
Primary education or less 28.3 31.2 35.2 6.9
Western Cape 19.7 21.8 23.2 3.5
Eastern Cape 35.1 38.1 39.7 4.6
Northern Cape 28.7 32.3 34.1 5.4
Free State 28.6 32.4 33.5 4.9
KwaZulu-Natal 26.3 29.5 31.7 5.4
North West 31.5 34.6 36.4 4.9
Gauteng 24.2 26.6 30.5 6.3
Mpumalanga 29.4 32.4 38.0 8.6
Limpopo 38.1 37.5 39.1 1.0
GDP growth rate (Y on Y-1) (%) 3.6 -1.7 2.8 - Source: Statistics South Africa Quarterly Labour Force Survey, 2008Q1 – 2010Q4, author’s calculations for annual averages; Statistics South Africa, Gross Domestic Product, Fourth Quarter 2010. Notes: All figures are population weighted; figures may vary from published sources due to revisions and sample selection.
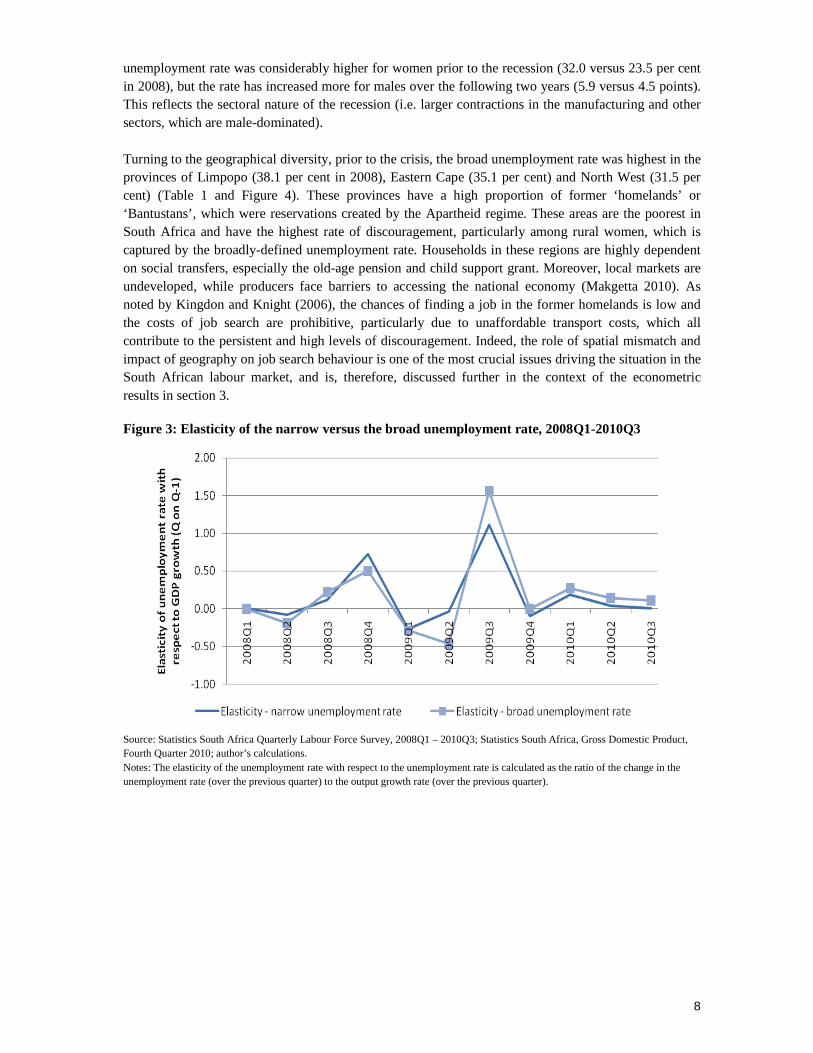
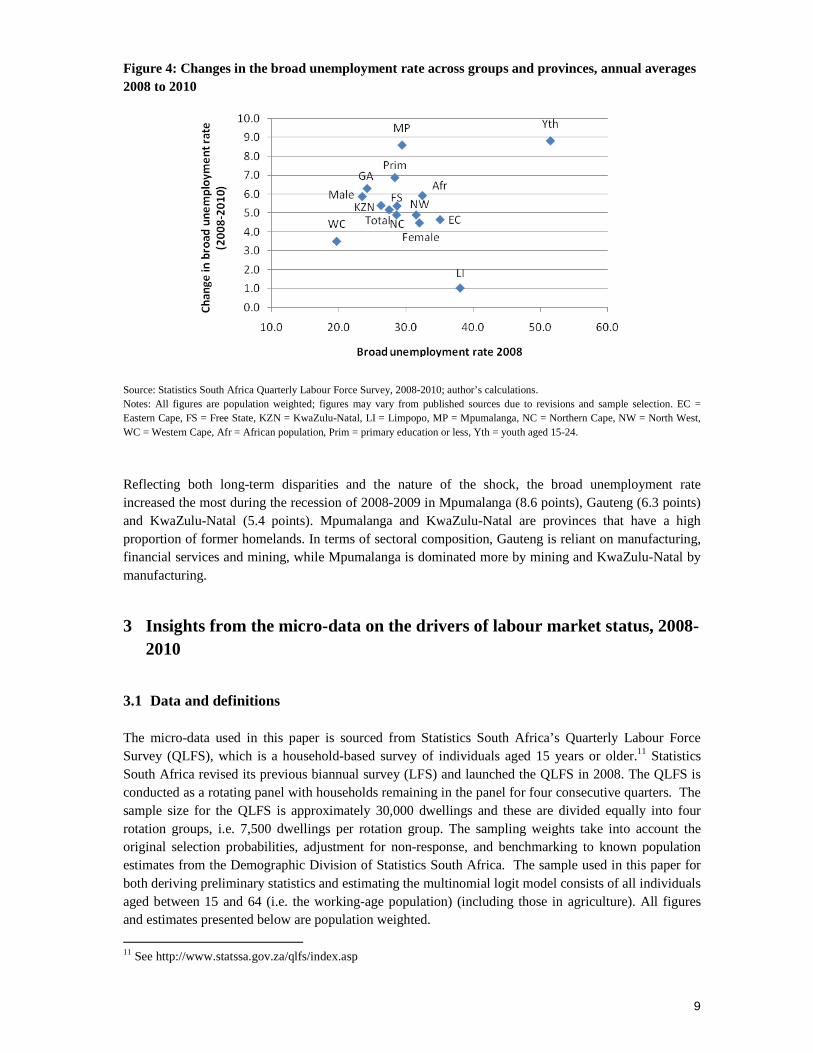
Another way of highlighting these trends is to look at the elasticity of the unemployment rate (using both definitions) with respect to output (as measured by gross domestic product), a relationship known as Okun’s law.10 As captured by Figure 3, the elasticities of both the narrow and broad unemployment rate move in a similar fashion over the business cycle. However, the broad rate was more sensitive to the recession as captured by the more negative elasticities in the first two quarters of 2009. Moreover, the broad unemployment rate continued to rise by a greater amount in 2009Q3, despite the return to positive growth in GDP (hence, the positive elasticity). During 2010, the elasticity of the broad rate remained only slightly higher than the figure for the narrow version. Overall, this pattern reveals a greater elasticity of the broad unemployment rate over the business cycle and, hence, would suggest, as expected, that the decision to undertake job search is very much dependent on the state of the economy. Besides the overall aggregate trends, the broad unemployment rate varies considerably across different population segments and provinces. As illustrated in Table 1 and Figure 4, the broad unemployment rate for youth was already over 50 per cent in 2008 (51.5 per cent) and has since skyrocketed to 60.3 per cent in 2010, representing an increase of 8.8 percentage points. In terms of other groups, the second largest increase was among individuals with at most a primary education (6.9 points), while the rate increased by 5.9 points for the African sub-population. With respect to the gender dimension, the broad
10 There has been considerable discussion surrounding this statistical relationship; see Okun (1962) for the original study and IMF (2010) for a more recent interpretation.
8
unemployment rate was considerably higher for women prior to the recession (32.0 versus 23.5 per cent in 2008), but the rate has increased more for males over the following two years (5.9 versus 4.5 points). This reflects the sectoral nature of the recession (i.e. larger contractions in the manufacturing and other sectors, which are male-dominated). Turning to the geographical diversity, prior to the crisis, the broad unemployment rate was highest in the provinces of Limpopo (38.1 per cent in 2008), Eastern Cape (35.1 per cent) and North West (31.5 per cent) (Table 1 and Figure 4). These provinces have a high proportion of former ‘homelands’ or ‘Bantustans’, which were reservations created by the Apartheid regime. These areas are the poorest in South Africa and have the highest rate of discouragement, particularly among rural women, which is captured by the broadly-defined unemployment rate. Households in these regions are highly dependent on social transfers, especially the old-age pension and child support grant. Moreover, local markets are undeveloped, while producers face barriers to accessing the national economy (Makgetta 2010). As noted by Kingdon and Knight (2006), the chances of finding a job in the former homelands is low and the costs of job search are prohibitive, particularly due to unaffordable transport costs, which all contribute to the persistent and high levels of discouragement. Indeed, the role of spatial mismatch and impact of geography on job search behaviour is one of the most crucial issues driving the situation in the South African labour market, and is, therefore, discussed further in the context of the econometric results in section 3.
Figure 3: Elasticity of the narrow versus the broad unemployment rate, 2008Q1-2010Q3
Source: Statistics South Africa Quarterly Labour Force Survey, 2008Q1 – 2010Q3; Statistics South Africa, Gross Domestic Product, Fourth Quarter 2010; author’s calculations. Notes: The elasticity of the unemployment rate with respect to the unemployment rate is calculated as the ratio of the change in the unemployment rate (over the previous quarter) to the output growth rate (over the previous quarter).
9
Figure 4: Changes in the broad unemployment rate across groups and provinces, annual averages 2008 to 2010
Source: Statistics South Africa Quarterly Labour Force Survey, 2008-2010; author’s calculations. Notes: All figures are population weighted; figures may vary from published sources due to revisions and sample selection. EC = Eastern Cape, FS = Free State, KZN = KwaZulu-Natal, LI = Limpopo, MP = Mpumalanga, NC = Northern Cape, NW = North West, WC = Western Cape, Afr = African population, Prim = primary education or less, Yth = youth aged 15-24.
Reflecting both long-term disparities and the nature of the shock, the broad unemployment rate increased the most during the recession of 2008-2009 in Mpumalanga (8.6 points), Gauteng (6.3 points) and KwaZulu-Natal (5.4 points). Mpumalanga and KwaZulu-Natal are provinces that have a high proportion of former homelands. In terms of sectoral composition, Gauteng is reliant on manufacturing, financial services and mining, while Mpumalanga is dominated more by mining and KwaZulu-Natal by manufacturing.
3 Insights from the micro-data on the drivers of labour market status, 2008-2010
3.1 Data and definitions The micro-data used in this paper is sourced from Statistics South Africa’s Quarterly Labour Force Survey (QLFS), which is a household-based survey of individuals aged 15 years or older.11 Statistics South Africa revised its previous biannual survey (LFS) and launched the QLFS in 2008. The QLFS is conducted as a rotating panel with households remaining in the panel for four consecutive quarters. The sample size for the QLFS is approximately 30,000 dwellings and these are divided equally into four rotation groups, i.e. 7,500 dwellings per rotation group. The sampling weights take into account the original selection probabilities, adjustment for non-response, and benchmarking to known population estimates from the Demographic Division of Statistics South Africa. The sample used in this paper for both deriving preliminary statistics and estimating the multinomial logit model consists of all individuals aged between 15 and 64 (i.e. the working-age population) (including those in agriculture). All figures and estimates presented below are population weighted.
11 See http://www.statssa.gov.za/qlfs/index.asp
10
The analysis below focuses on five labour market states: formal sector employment; informal sector employment; unemployment; discouragement; and other out-of-the-labour force. As per Statistics South Africa, the definition of informality is based on the size of the firm and whether the employer is registered for VAT and income tax. In addition, employment in a private household is also categorized as informal sector employment. A person is narrowly defined as unemployed if they: a) were not employed in the reference week; b) actively looked for work or tried to start a business in the four weeks preceding the survey interview; and c) would have been able to start work or would have started a business in the reference week. A discouraged individual is jobless but has given up job search (i.e. does not satisfy criteria b)). Those classified as other out-of-the-labour force include individuals in education, retirement or those with caring responsibilities.12 Table 2 summarizes the key individual and household variables used in the econometric analysis. These figures indicate that there are significant disparities in labour market status by gender, household size, education, marital status, and race, which have been well documented in the literature (see, for example, Banerjee et al. (2008), Kingdon and Knight (2004, 2007)). In particular, those working in the formal sector tend to be older, male, better educated, and have a smaller family. Africans are over-represented in informal sector employment, unemployment, discouragement and other forms of inactivity. In terms of spousal employment status, there is a strong relationship between spouses’ job search status. Finally, formal sector workers are over-represented in such provinces as Gauteng and Western Cape, while informality is more uniformly distributed. A greater proportion of individuals in Gauteng are considered to be searching unemployed compared to the total sample. At the same time, a higher share of discouraged workers is found in Eastern Cape, KwaZulu-Natal, North West, Mpumalanga and Limpopo, which in turn is driven by the higher proportion of former homelands as noted above.
3.2 Estimates from a model of labour market status To identify the impact of the global financial crisis on the South African labour market, this section estimates a model of labour market status separately for before and after the onset of the recession. For this reason, the Quarterly Labour Force Survey data is pooled providing four quarters of data for the pre-crisis period (2008Q1 to 2008Q4) and eight quarters covering the crisis (2009Q1 to 2010Q4). The following model of labour market status is estimated using a multinomial logit specification, which has the following response probabilities (see, for example, Wooldridge (2002)):
+== ∑=
J
hhj xxxjyP
1
)exp(1/)exp()|( ββ , j = 1,...,J
where y is the outcome variable (labour market status), x is a 1xK vector of explanatory variables, βj is Kx1 vector of coefficients. In this analysis, the dependent variable consists of five labour market states (J=5): formal sector employment; informal sector employment (including private households); unemployment; discouraged workers; and other forms of inactivity. Formal sector employment is used as the normalized outcome. The model is conditioned on age, education, marital status, spousal labour market status, household size, population group and province. Due to differences in labour force participation, the model is estimated separately for women and men. To ease interpretation of the results, average partial effects (APEs) are estimated, which provide more consistent estimates than marginal effects at the mean (Bartus 2005).13
12 See the ILO’s Key Indicators of the Labour Market (KILM) for further details on definitions, http://www.ilo.org/empelm/what/lang--en/WCMS_114240/index.htm 13 For this reason, the Stata margins command was used to calculate the average partial effects. The svy command in Stata was employed to take into account the use of survey data (standard errors are adjusted accordingly).

11
Table 2: Summary statistics by labour market status, average 2008Q1-2010Q4 Sample statistics by labour market status
Variable F I U D OLF Total Age (years) 38.1 39.6 30.7 31.8 31.0 34.0 Female (% of sample) 42.4 58.6 52.2 60.8 61.6 54.4 Number of household members 3.6 3.8 4.6 5.0 4.8 4.3 Primary school or no education (% of sample) 14.2 39.3 17.3 30.4 31.4 25.4 Less than year 12 education (% of sample) 28.9 41.4 44.7 46.2 53.1 43.3 Year 12 education (% of sample) 33.8 16.5 32.6 21.2 13.5 22.6 Tertiary education (% of sample) 23.1 2.9 5.4 2.3 2.0 8.7 Black/African (% of sample) 64.6 87.6 86.1 93.5 82.8 79.0 Coloured (% of sample) 15.5 9.0 10.9 5.0 9.7 11.2 Indian/Asian (% of sample) 4.0 1.1 1.2 0.6 2.4 2.5 White (% of sample) 15.9 2.3 1.9 0.9 5.1 7.3 No spouse (% of sample) 40.6 52.3 53.8 55.0 52.7 49.4 Spouse employed in formal sector (% of sample) 30.4 3.9 6.1 3.7 6.4 12.9 Spouse employed in informal sector (% of sample) 3.9 24.0 4.4 3.7 3.9 6.2 Spouse unemployed (% of sample) 3.3 2.2 15.0 0.7 1.7 3.9 Spouse discouraged (% of sample) 1.1 1.2 0.8 16.6 1.1 1.9 Spouse OLF (% of sample) 20.8 16.4 19.9 20.3 34.3 25.8 Western Cape (% of sample) 17.3 9.1 11.4 2.8 8.8 11.3 Eastern Cape (% of sample) 8.2 11.1 9.6 16.3 13.3 11.3 Northern Cape (% of sample) 5.4 4.9 5.6 4.8 5.5 5.4 Free State (% of sample) 8.6 10.2 10.4 8.0 8.3 8.9 KwaZulu-Natal (% of sample) 15.2 17.0 12.8 19.2 19.9 17.3 North West (% of sample) 7.7 7.2 8.8 11.4 9.2 8.6 Gauteng (% of sample) 23.0 17.5 22.8 10.0 11.0 16.7 Mpumalanga (% of sample) 8.2 11.8 10.1 11.5 9.6 9.6 Limpopo (% of sample) 6.2 11.4 8.6 15.9 14.6 11.1
Source: Statistics South Africa Quarterly Labour Force Survey, average based on quarterly data for 2008Q1-2010Q4; author’s calculations. Notes: All figures are population weighted. F = Employed in the formal sector; I = Employed in the informal sector; U = Unemployed; D = Discouraged; OLF = Other out-of-the-labour force. Sample covers the working-age population (15-64). Using this empirical strategy, the pre-crisis average partial effects indicate that a range of individual and household characteristics drive the labour market status of South African women (Table 3). Firstly, based on the average partial effect at the mean age (34.6 years), an additional year would increase the probability of employment, unemployment and discouragement, while it would lead to a decrease in the likelihood of other forms of inactivity.14 As expected, educational attainment plays a dominant role in differences in labour market status of South African women. In particular, the less education a woman has, the less likely she is to be employed in the formal sector and the more likely she is employed in the informal sector or discouraged. Most striking is the situation for females with at most a primary education: the probability of formal sector employment for these individuals in the pre-crisis period is 40.2 percentage points lower than those with a tertiary education. The relationship between educational attainment and the probability of narrowly-defined unemployment is non-linear. In fact, the likelihood increases the most for females who have completed high school (in comparison to tertiary educated individuals), while it is lower for those with less education.
14 The combined effect of age has to take into account the squared term used in the model. This can be calculated as: �age + 2 x mean(age)*�age .

12
Table 3: Multinomial logit estimates (average partial coefficients) – female labour market status, 2008 versus 2009-2010
Formal sector employment
Informal sector employment
Unemployment Discouragement OLF
2008 2009/10 2008 2009/10 2008 2009/10 2008 2009/10 2008 2009/10 Variable (1) (2) (3) (4) (5) (6) (7) (8) (9) (10) Age 0.006*** 0.006*** 0.003*** 0.003*** 0.002*** 0.001*** 0.001*** 0.001*** -0.011*** -0.011*** Primary school or none (ref: tertiary) -0.402*** -0.374*** 0.091*** 0.079*** -0.025*** -0. 028*** 0.030*** 0.034*** 0.306*** 0.290*** Less than Year 12 -0.340*** -0.315*** 0.077*** 0.073*** -0.002 -0.004 0.022*** 0.029*** 0.244*** 0.217*** Year 12 -0.192*** -0.178*** 0.049*** 0.046*** 0.039*** 0.030*** 0.020*** 0.025*** 0.084*** 0.077*** Black/African (ref: white) -0.025*** -0.032*** 0.056*** 0.064*** 0.078*** 0.084*** 0.029*** 0.042*** -0.137*** -0.158*** Coloured 0.052*** 0.040*** 0.013*** 0.025*** 0.064*** 0.059*** 0.016*** 0.028*** -0.145*** -0.152*** Indian/Asian 0.031*** -0.007 -0.036*** -0.013*** 0.035*** 0.026*** 0.000 -0.002 -0.031*** -0.005 Household size -0.006*** -0.010*** -0.007*** -0.011*** 0.006*** 0. 003*** 0.002*** 0.002*** 0.004*** 0.015*** Spouse employed in formal sector (ref: no spouse) 0.313*** 0.324*** -0.102*** -0.097*** -0.078*** -0. 071*** -0.024*** -0.031*** -0.110*** -0.125*** Spouse employed in informal sector -0.183*** -0.176*** 0.441*** 0.460*** -0.065*** -0. 069*** -0.024*** -0.036*** -0.169*** -0.180*** Spouse unemployed -0.196*** -0.196*** -0.107*** -0.103*** 0.511*** 0. 506*** -0.034*** -0.050*** -0.173*** -0.157*** Spouse discouraged -0.175*** -0.189*** -0.115*** -0.107*** -0.107*** - 0.095*** 0.551*** 0.552*** -0.154*** -0.161*** Spouse OLF -0.158*** -0.111*** -0.111** -0.079*** -0.058*** -0.033*** -0.018*** -0.009*** 0.345*** 0.231*** Western Cape (ref: Gauteng) 0.014*** 0.019*** -0.010*** 0.003 -0.023*** -0.014*** -0.010*** -0.021*** 0.029*** 0.014*** Eastern Cape -0.027*** -0.027*** -0.024*** -0.013*** -0.036*** - 0.051*** 0.019*** 0.029*** 0.068*** 0.062*** Northern Cape -0.020*** -0.022*** -0.034*** -0.020*** -0.013** -0.015*** 0.022*** 0.017*** 0.044*** 0.040*** Free State -0.010** -0.012*** -0.021*** -0.008*** -0.015*** -0.017*** 0.012*** 0.018*** 0.034*** 0.019*** KwaZulu-Natal -0.006* 0.002 -0.004 0.003 -0.050*** -0.077*** 0.000 0.024*** 0.060*** 0.047*** North West -0.027*** -0.034*** -0.038*** -0.033*** -0.032*** - 0.042*** 0.024*** 0.023*** 0.073*** 0.085*** Mpumalanga -0.022*** -0.015*** -0.003 0.011*** -0.036*** -0.033*** 0.015*** 0.027*** 0.046*** 0.010*** Limpopo -0.069*** -0.057*** -0.028*** -0.012*** -0.037*** - 0.080*** 0.017*** 0.035*** 0.117*** 0.114*** Observations 125,536 235,603 125,536 235,603 125,536 235,603 125,536 235,603 125,536 235,603
Source: Statistics South Africa Quarterly Labour Force Survey, 2008Q1 – 2010Q4; author’s calculations. Notes: *** p<0.01, ** p<0.05, * p<0.1. The average partial effects (APEs) are based on a multinomial logit regression where the dependent variable is labour market status. The APEs are presented as percentage point changes in the probability of an outcome.

13
Table 4: Multinomial logit estimates (average partial coefficients) – male labour market status, 2008 versus 2009-2010
Formal sector employment
Informal sector employment
Unemployment Discouragement OLF
2008 2009/10 2008 2009/10 2008 2009/10 2008 2009/10 2008 2009/10 Variable (1) (2) (3) (4) (5) (6) (7) (8) (9) (10) Age 0.011*** 0.011*** 0.003*** 0.003*** 0.003*** 0.003*** 0.001*** 0.001*** -0.017*** -0.018*** Primary school or none (ref: tertiary) -0.321*** -0.341*** 0.095*** 0.092*** 0.026*** 0.036*** 0.026*** 0.046*** 0.174*** 0.167*** Less than Year 12 -0.263*** -0.273*** 0.073*** 0.070*** 0.034*** 0.050*** 0.014*** 0.028*** 0.142*** 0.125*** Year 12 -0.147*** -0.159*** 0.035*** 0.036*** 0.049*** 0.059*** 0.011*** 0.022*** 0.052*** 0.043*** Black/African (ref: white) -0.092*** -0.113*** 0.046*** 0.041*** 0.096*** 0.096*** 0.026*** 0.031*** -0.075*** -0.055*** Coloured -0.040*** -0.051*** 0.031*** 0.028*** 0.094*** 0.085*** 0.009*** 0.016*** -0.093*** -0.078*** Indian/Asian -0.002 -0.005 0.017** 0.023*** 0.055*** 0.045*** 0.002 0.001 -0.072*** -0.065*** Household size -0.016*** -0.012*** -0.005*** -0.005*** 0.008*** 0. 006*** 0.002*** 0.003*** 0.010*** 0.008*** Spouse employed in formal sector (ref: no spouse) 0.146*** 0.140*** -0.038*** -0.038*** -0.054*** -0. 049*** -0.011*** -0.018*** -0.043*** -0.035*** Spouse employed in informal sector -0.020*** -0.013** 0.110*** 0.103*** -0.024*** -0.028*** -0.008*** -0.010*** -0.058*** -0.052*** Spouse unemployed 0.047*** 0.075*** -0.003 -0.005 0.070*** 0.060*** -0.025*** -0.041*** -0.089*** -0.088*** Spouse discouraged 0.033*** 0.021*** -0.011 0.019*** -0.073*** -0.084*** 0.092*** 0.106*** -0.041*** -0.061*** Spouse OLF 0.029*** 0.020*** 0.000 -0.012*** -0.027*** -0.015*** -0.009*** -0.001 0.007 0.009*** Western Cape (ref: Gauteng) 0.024*** 0.021*** -0.022*** -0.010*** -0.022*** -0. 013*** -0.010*** -0.018*** 0.030*** 0.020*** Eastern Cape -0.110*** -0.088*** 0.011*** 0.008** -0.023*** -0.050*** 0.033*** 0.051*** 0.089*** 0.080*** Northern Cape -0.029*** -0.029*** -0.007 -0.015*** -0.034*** -0.031*** 0.011*** 0.012*** 0.059*** 0.063*** Free State -0.043*** -0.031*** 0.006 0.014*** -0.020*** -0.021*** 0.000 0.002 0.057*** 0.036*** KwaZulu-Natal -0.037*** -0.031*** 0.005 0.002 -0.044*** -0.083*** 0.002 0.033*** 0.073*** 0.080*** North West -0.023*** -0.011** -0.024*** -0.027*** -0.019*** -0.038*** 0.019*** 0.023*** 0.048*** 0.053*** Mpumalanga -0.024*** -0.014*** 0.008* 0.005 -0.030*** -0.031*** -0.001 0.014*** 0.048*** 0.026*** Limpopo -0.120*** -0.089*** 0.005 0.023*** -0.024*** -0.075*** 0.015*** 0.033*** 0.123*** 0.108*** Observations 104,733 196,448 104,733 196,448 104,733 196,448 104,733 196,448 104,733 196,448
Source: Statistics South Africa Quarterly Labour Force Survey, 2008Q1 – 2010Q4; author’s calculations. Notes: *** p<0.01, ** p<0.05, * p<0.1. The average partial effects (APEs) are based on a multinomial logit regression where the dependent variable is labour market status. The APEs are presented as percentage point changes in the probability of an outcome.

14
Turning to different population groups, the estimates confirm the disparities that have long been present in the South African labour market. In comparison to whites, African women are more likely to be informally employed, unemployed and discouraged, while they are less likely to be formally employed or inactive for other reasons. Coloured women are more likely to be employed, unemployed, discouraged, and less likely to be out of the labour force than white women. Finally, Indian/Asian women have a higher probability of being employed in the formal sector (only significant for 2008) and informal sector (both periods). At the same, Indian/Asian women have a higher probability of unemployment. The specification used in Table 3 also includes two variables reflecting household status. Firstly, female labour market status is strongly linked to that of the spouse. For example, having a spouse working in the informal sector is associated with a 44.1 percentage point higher probability of working in the same sector in 2008 (vis-à-vis having no spouse). This marginal effect increases to 46.0 per cent in 2009/10. Moreover, the likelihood of searching for females while unemployed is very much linked to the job search status of their spouse (the effect is over 50 percentage points for both narrowly-defined unemployment and discouragement). Secondly, there is a significant correlation between household size and labour market status: a larger household is associated with a lower probability of employment for women (in both the formal and informal sector) but a higher chance of being unemployed, discouraged or out of the labour force. This result suggests that intra-household transfers potentially have an impact on labour market status, an issue returned to below in section 4 when investigating the reasons behind discouragement. In terms of the geographical dummies, the estimates suggest that females in provinces with a high proportion of former homelands, such as Limpopo, North West and Eastern Cape, are generally less likely to be employed (in both the formal and informal sectors) in comparison to Gauteng. These women also have a lower probability of unemployment, while they are more likely to be discouraged or out-of-the labour force. Similar to the findings for women, education has a large average partial effect on the probability of being in a particular labour market state for men (Table 4). More specifically, having lower levels of schooling (compared to tertiary education) reduces the likelihood of formal sector employment, while it increases the likelihood of all other states. Like the estimates for females, this result is strongest for South African men who have at most a primary education: for this vulnerable group, the probability of formal sector employment is 32 percentage points lower in 2008 than those with a tertiary education (in 2009/10, it increased to 34.1 points). In general, the estimates of the effect of age and race on male labour market outcomes are broadly in line with the results for women. For example, being an African man reduces the probability (in comparison to white males) of formal sector employment and other forms of inactivity, while it raises the likelihood of informal sector employment, unemployment, and discouragement. The results for coloured South African males are similar to those found for African males, though the APEs are mostly smaller. While not as large in magnitude as found in the case of females, spousal labour market status also has a strong association with outcomes in the labour market for men. For example, having a spouse who is unemployed but searching increases the probability of being in the same state for males by 7 percentage points in 2008 (in comparison to individuals without a spouse), which decreases to 6 percentage points in 2009-2010. Alternatively, having a spouse who is not actively searching is correlated with an increase in the probability of discouragement for males by 9.2 points in 2008, which then rises to 10.6 points in the crisis period. These findings confirm the importance of social networks and peers in driving the

15
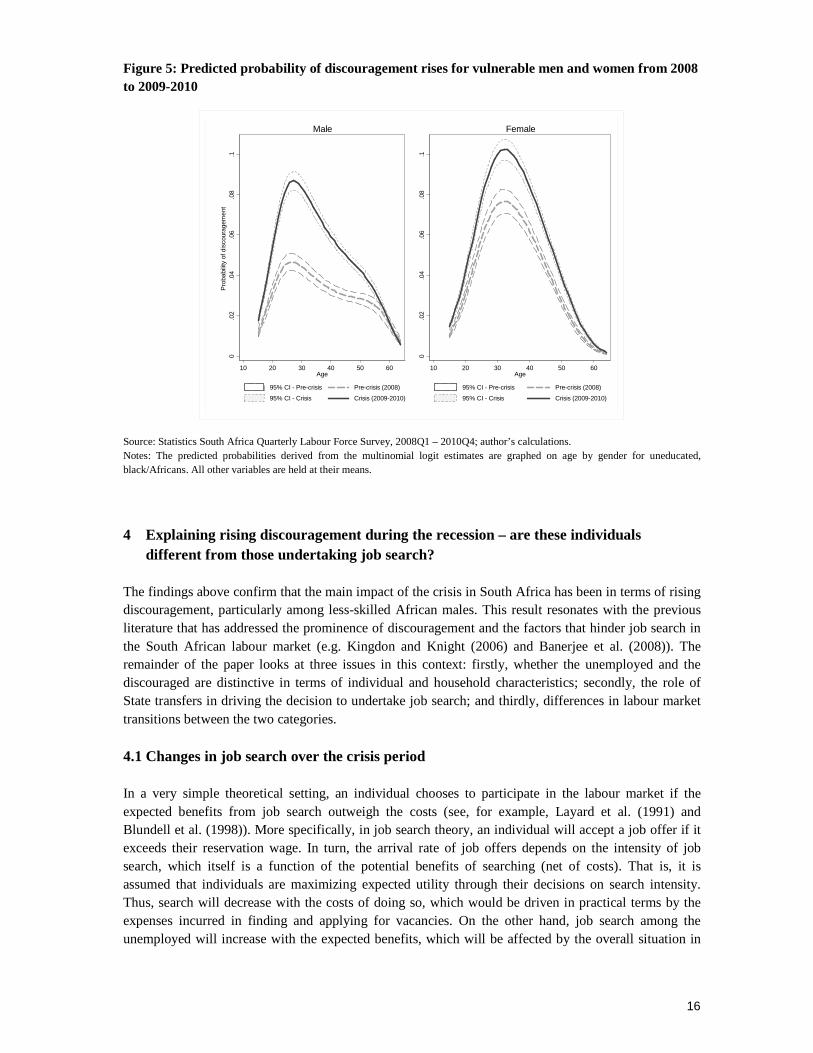
decision to undertake job search, a topic that is investigated further in section 4. The impact of household size on the probabilities is comparable to the findings for women. In order to identify whether the results for South African men and women have changed from 2008 to 2009-2010 during the recession, the equality of coefficients from the multinomial logit model over the two periods is tested using a Wald test. This exercise reveals that for the male sub-sample, the coefficients on educational attainment have significantly changed (in a statistical sense), along with the spouse variables and provincial dummies. For example, the coefficient on the dummy for primary education or less has become more positive from 2008 to 2009-2010 in the case of narrowly defined unemployment (from 2.6 to 3.6 points). Similarly, the estimated APEs show that male high-school dropouts have a higher probability of being unemployed than tertiary educated individuals (by 3.4 percentage points in 2008). This marginal effect has risen to 5.0 points in 2009-2010. There have been a number of changes in the magnitude of coefficients on the provincial dummies. For instance, in the case of discouragement, the average partial effect on the dummy for KwaZulu-Natal, a province hard hit by the crisis and one with a high proportion of former homelands, went from being insignificant in 2008 to 3.3 percentage points (in comparison to males in Gauteng). In the case of females, the APEs have also changed for the population, educational attainment and province dummies. For example, the estimated APEs suggest that African females were 5.6 percentage points more likely to be employed in the informal sector in 2008 than white females, which increased to 6.4 points in 2009-2010. Altogether, these Wald tests of coefficient equality show that the probabilities of being unemployed and discouraged have increased most significantly for Africans, the poorly-educated, and in provinces that have been hit the hardest. To further underscore the changes since the onset of the recession in South Africa, it is useful to view the predicted probabilities of discouragement for females and males in a graphical form and plotting them against age. Age is used because of the known disparities facing young people in the labour market and the overall changes in employment status over the life-cycle. To highlight the strongest impact of the crisis, the effects of race and educational attainment (based on the multinomial logit estimates presented in tables 3 and 4) are combined to underscore the situation for one of the most vulnerable groups in the South African labour market (i.e. uneducated African females and males). The change in predicted probabilities of discouragement displayed in Figure 5 illustrate that the likelihood of being in this state has increased for both uneducated African men and women. Moreover, though discouragement is normally higher for women, the rise has been larger for men. The maximum probability of discouragement for these vulnerable women increased from 7.8 per cent in 2008 (at age 32) to 10.2 per cent in 2009-2010. For men, the peak in the probability of discouragement rose by a greater amount, from 4.7 per cent prior to the crisis (at age 27) to 8.7 per cent in 2009-2010. In summary, these estimates generated from the multinomial logit specification confirm that the impact of the crisis in South Africa is mainly evident in an increase in discouragement, which has important gender, education and racial dimensions.
16
Figure 5: Predicted probability of discouragement rises for vulnerable men and women from 2008 to 2009-2010
0.0
2.0
4.0
6.0
8.1
Pro
babi
lity
of d
isco
urag
emen
t
10 20 30 40 50 60Age
95% CI - Pre-crisis Pre-crisis (2008)
95% CI - Crisis Crisis (2009-2010)
Male
0.0
2.0
4.0
6.0
8.1
10 20 30 40 50 60Age
95% CI - Pre-crisis Pre-crisis (2008)
95% CI - Crisis Crisis (2009-2010)
Female
Source: Statistics South Africa Quarterly Labour Force Survey, 2008Q1 – 2010Q4; author’s calculations. Notes: The predicted probabilities derived from the multinomial logit estimates are graphed on age by gender for uneducated, black/Africans. All other variables are held at their means.
4 Explaining rising discouragement during the recession – are these individuals different from those undertaking job search?
The findings above confirm that the main impact of the crisis in South Africa has been in terms of rising discouragement, particularly among less-skilled African males. This result resonates with the previous literature that has addressed the prominence of discouragement and the factors that hinder job search in the South African labour market (e.g. Kingdon and Knight (2006) and Banerjee et al. (2008)). The remainder of the paper looks at three issues in this context: firstly, whether the unemployed and the discouraged are distinctive in terms of individual and household characteristics; secondly, the role of State transfers in driving the decision to undertake job search; and thirdly, differences in labour market transitions between the two categories.
4.1 Changes in job search over the crisis period In a very simple theoretical setting, an individual chooses to participate in the labour market if the expected benefits from job search outweigh the costs (see, for example, Layard et al. (1991) and Blundell et al. (1998)). More specifically, in job search theory, an individual will accept a job offer if it exceeds their reservation wage. In turn, the arrival rate of job offers depends on the intensity of job search, which itself is a function of the potential benefits of searching (net of costs). That is, it is assumed that individuals are maximizing expected utility through their decisions on search intensity. Thus, search will decrease with the costs of doing so, which would be driven in practical terms by the expenses incurred in finding and applying for vacancies. On the other hand, job search among the unemployed will increase with the expected benefits, which will be affected by the overall situation in
17
the labour market (i.e. whether the economy is growing or in recession). Theoretically, it is indeed expected that there is a strong relationship between the business cycle and job search. Most relevant for this paper, discouragement is likely to increase during recessions because when the job finding rate (exit rate from unemployment) decreases, fewer workers decide to participate in the labour market (Pissarides 2000). This describes the phenomenon of ‘discouraged workers’ that has periodically emerged as a major policy issue. Another relevant issue is the problem of spatial mismatch. Kain (1968) first proposed that African-Americans residing in inner city areas of the United States were poorly connected to regions where jobs were being created. It was argued that this geographical distance was a major cause of higher unemployment rates among this sub-population. As discussed in Van Ham et al. (2001), this spatial mismatch reflects not only the costs of migration and commuting, but also the lower arrival rate of job offers in isolated areas. Ultimately, ‘most people only search for jobs in the vicinity that would not necessitate a residential move.’ (Van Ham et al. 2001: 1737). In addition, discrimination forces individuals to rely on ethnic and social networks that provide access only to a limited set of job opportunities because these individuals are in a similar situation (Van Ham et al. 2001, Zenou 2011). Overall, discouragement would be higher because of both the costs of job search due to location and the inability to use networks that would increase the likelihood of receiving a job offer. These insights are pertinent to the situation evident in rural areas in South Africa, particularly in the former homelands as stressed above. In addition to these studies, there has been considerable discussion in the literature about the empirical robustness of any distinction between searching and non-searching unemployment. As cited in Jones and Riddell (1999: 147, footnote 2), ‘As stated by the President’s Committee to Appraise Employment and Unemployment Statistics (1962: p. 49): “When should a person not working but wanting to work be included in the labor force and thus counted as unemployed? This constitutes the most difficult question with which the Committee has had to deal.”’. From a definitional point of view, discouraged workers should be added to the unemployed if their characteristics and behaviour are similar (Jones and Riddell 1999). In terms of empirical studies on this topic, Jones and Riddell (1999) undertake an analysis of transition rates across four labour market states (employment, unemployment, marginal attachment, and non-participation or inactivity) in the United States, and find that unemployment, marginal attachment and non-participation are indeed distinct states. Moving to the South African context, Kingdon and Knight (2006) find that, for the pre-crisis period, discouraged workers are more deprived and no happier (in terms of self-reported subjective well-being) than the searching unemployed, while local wage determination takes into account both types of jobless. To identify whether unemployment and discouraged individuals differ in terms of observable characteristics in the context of the 2008-2009 recession, a logit model is estimated for the sub-sample of individuals who are jobless but available for work (i.e. excluding non-participants) (see Kingdon and Knight (2006) for a similar approach). Thus, the binary dependent variable equals one if an individual is not actively searching (discouraged), as opposed to being unemployed and actively searching for a job – the key difference being job search. As above, the estimates for 2008 are compared to 2009-2010 to identify changes during the crisis period. As reported in Table 5 (males and females), a number of individual and household characteristics are associated with being discouraged in comparison to searching unemployment. Using the base specification (columns 1 and 2 of Table 5), the estimated odds ratios suggest that, prior to the start of the recession in South Africa, being poorly educated significantly increased the probability of discouragement over unemployment, particularly for women. For example, females with at most a

18
primary education were over 5 times more likely to be discouraged in 2008 than individuals with tertiary education. Surprisingly, there isn’t a consistently strong impact of race (after controlling for age, gender, education, etc). Increasing the age by one year (from the mean) implies a marginal fall in the odds of discouragement over unemployment. In terms of household characteristics, individuals in large households have a higher probability of discouragement, while both males and females with discouraged spouses are much more likely to be inactive in terms of job search. In general, individuals in all provinces besides the Western Cape are less likely to be actively searching for jobs than those located in Gauteng. Table 5: Drivers of discouragement among jobless males and females, odds ratios - 2008 versus 2009-2010
Males Females Variable
2008 (1)
2009/10 (2)
2008 (3)
2009/10 (4)
Age 0.908*** 0.894*** 0.927*** 0.933*** Age-squared 1.001*** 1.002*** 1.001*** 1.001*** Primary school or none (ref: tertiary) 2.889*** 2.942*** 5.356*** 4.559*** Less than Year 12 1.952*** 2.011*** 3.192*** 3.083*** Year 12 1.286 1.338*** 1.874*** 1.759*** Black/African (ref: white) 1.505 0.869 1.905*** 1.264 Coloured 0.672 0.571*** 1.220 1.003 Indian/Asian 0.570 0.425*** 0.630 0.567** Household size 1.047*** 1.046*** 1.025*** 1.028*** Spouse employed in formal sector (ref: no spouse)
1.011 0.870** 0.994 1.007
Spouse employed in informal sector 0.888 0.967 0.924 0.922 Spouse unemployed 0.134*** 0.113*** 0.037*** 0.025*** Spouse discouraged 8.097*** 7.065*** 5.650*** 64.023*** Spouse OLF 0.843** 1.083** 1.058 1.236*** Western Cape (ref: Gauteng) 0.651*** 0.442*** 0.786** 0.464*** Eastern Cape 3.231*** 4.064*** 2.964*** 3.349*** Northern Cape 2.175*** 1.884*** 2.490*** 1.999*** Free State 1.265** 1.337*** 1.793*** 1.910*** KwaZulu-Natal 1.679*** 4.297*** 1.833*** 4.220*** North West 2.377*** 2.422*** 3.125*** 2.794*** Mpumalanga 1.230** 1.861*** 2.463*** 2.701*** Limpopo 2.195*** 4.019*** 2.764*** 5.403*** No. of observations 17,112 37,061 21,696 43,681
Source: Statistics South Africa Quarterly Labour Force Survey, 2008Q1 – 2010Q4; author’s calculations. Notes: *** p<0.01, ** p<0.05, * p<0.1. The odds ratios are based on a logit regression where the dependent variable is a binary variable that equals one for individuals reporting to be discouraged (not actively searching for a job). The sample is restricted to individuals who are ready and able to work (i.e. excluding other forms of inactivity due to education, retirement, caring responsibilities and disability).
Moving to the crisis period (2009-2010), there are a number of changes in the odds ratios that are worth noting. Firstly, in the case of South African males (column 2), the odds of individuals with a completed high-school education (Year 12) becoming discouraged became significant during the recession. In terms of provincial dummies, the odds increased for males and females in the Eastern Cape, KwaZulu-Natal, Mpumalanga and Limpopo provinces, which are regions with a high proportion of former homelands. In comparison, the odds of discouragement for females with a discouraged spouse increased
19
from 5.7 in 2008 to over 64 in 2009/10 (column (4)). This result reinforces that job search is influenced by the situation among family and social networks. Another feature of the South African labour market that is particularly troublesome is the high proportion of jobless individuals who have never been employed. In 2008, prior to the onset of the recession in South Africa, 42.4 per cent of the unemployed had never had a job compared to 48.8 per cent of discouraged individuals. Adding a dummy to the specification used in Table 5, which indicates whether an individual has ever worked, shows unsurprisingly that this factor is positively associated with the likelihood of discouragement.15 South Africans, in particular young people, who never gain work experience, have little hope of finding employment and, thus, do not actively search for a job. Looking at the changes over the crisis period, males who have never worked have significantly higher odds ratio of discouragement in 2009-2010 than in 2008 (1.703 versus 1.410), reflecting how the deteriorating economy has further impacted such marginalized individuals. For females who have never worked before, the odds ratio increased by a smaller margin (from 1.309 to 1.465).
4.2 What role for social transfers? A hotly debated topic in many countries is the impact of social security transfers on labour force participation. In this regard, a large number of studies have investigated the effect of the South African old-age pension (OAP) on labour force participation within recipient households. Contrary to widely-held perceptions and previous studies, Ardington et al. (2009) find that the South African OAP leads to increased employment among prime-aged adults as a consequence of relieving credit constraints to labour migration, a result that has been also found elsewhere (see, for example, Samson (2009)). This positive impact contrasts some earlier findings, which suggested more perverse effects of the pension on labour force participation (e.g. Bertrand et al. 2003)). Another important element of the South African social security system is the child support grant (CSG), which was first introduced in 1998 following the recommendation of the Lund Committee of Child and Family Support. The CSG has since become the most widespread social transfer in the country, accounting for 10.4 million recipients in 2010, which represented 68.1% of all social security recipients, 37% of all households and 34.8% of social grants expenditure (National Treasury 2011; OECD 2011). That said, the value of the CSG, which is means tested, is only R260 per month compared to R1080 for the old-age pension. To enlarge the scope of the transfer, the age cut-off was raised six times since 1998 and stood at 14 years in 2007 prior to the onset of the recession. During the crisis, the cut-off was increased to 15 in 2009, 16 in 2010, and finally, to 17 in 2011. At the same time, the payment has increased from R100 to R260 as of 2011, while the government has conducted outreach campaigns in rural areas to encourage enrolment. The means test threshold for the child support grant is now set at 10 times the value of the grant (National Treasury 2011; SAHRC and UNICEF South Africa 2011). Theoretically, the CSG, like the OAP, could increase job search if it alleviates credit constraints that prevent individuals from migrating to urban centres or actively looking for a job from their home, as argued in the case of OAP. For example, the grant may help mothers pay for child care that in turn allows them to work (Eyal and Woolard 2011). Alternatively, the transfer could decrease search due to an income/substitution effect (individuals are more likely to consume more leisure) or an increase in reservation wages (in a search theoretical setting). Given the size of the transfer, it is, however, not clear whether the CSG would have a major impact on labour force participation of recipients, particularly among female beneficiaries. As argued by Klasen and Woolard (2008), the relationship between transfers and labour outcomes can go the other way: unemployed individuals remain in rural households 15 Results are available from the author upon request.
20
in order to access social transfers and remittances, which in turn reduces their incentives for job search and the arrival rate of offers. A few studies have investigated the potential labour market effects of the child support grant. In this regard, Williams (2007) finds that receiving the CSG is associated with an increase in broad labour force participation, while it has no effect on the narrow definition of participation or employment. Though Samson (2009) only compares raw figures on the likelihood of being in certain labour market states, this study concludes that the CSG is associated with a higher probability of job search and finding employment in poorer households, particularly among women. In a more recent study, Eyal and Woolard (2011) take advantage of changes in the cut-off age to identify the impact of the CSG on a mother’s labour force participation. Using data from the October Household Survey (OHS) and General Household Survey (GHS), this study finds that receiving the grant is associated with a higher probability of labour force participation and employment (and a lower rate of unemployment conditional on participation). Turning to the data utilized in this paper (QLFS), the main form of income support for both the unemployed and discouraged is provided overwhelmingly by other persons in the household: in 2008, 77.7 per cent of the unemployed and 76.5 per of the discouraged reported receiving such transfers (Table 6). In 2009-2010, this proportion stayed approximately the same for the unemployed (77.4 per cent), while it increased for individuals who were not searching for a job (to 79.8 per cent). Support from persons not in the household and child support/foster care grants are also important sources. In this respect, child support grants are a much more important source of income support for discouraged individuals than the searching unemployed (22.5 versus 13.8 per cent in 2008). At the same time, savings are only a minor form of support for those without a job. Finally, despite the large increase in the number of beneficiaries of payments from the Unemployment Insurance Fund (UIF) during the crisis period (from 397,000 beneficiaries in 2007/08 to 529,000 in 2009/10)16, a very small proportion of both unemployed and discouraged workers in our sample stated that they were being supported by such transfers (less than one per cent). This is far lower than the figure of 5 per cent quoted in a recent study by the National Treasury (2011). This underscores that, though South Africa has established an unemployment benefits scheme (Unemployment Insurance Fund (UIF)), the limited coverage means that most individuals without employment rely on other means for survival. The percentage stating that they receive support from a pension is low, though this form of support may also be included in intra/inter-household transfers from relatives who receive the OAP. Returning to the binary (logit) specification reported in Table 5, including dummies for the type of support received by individuals, shows that there is some evidence of an association between receiving transfers and the decision to undertake job search (Table 7). The direction of causality is, however, harder to establish.17 More specifically, Table 7 shows that receiving intra-household transfers is correlated with a lower probability of discouragement for females, but the odds ratio has increased in magnitude over the crisis period. Inter-household transfers are associated with a higher probability of discouragement, which may reflect the role of support from spouses and other family members working away from the household. For males, the likelihood of discouragement has increased during the South African recession for those receiving transfers from within the household, while it has decreased for individuals receiving support from outside the household.
16 See National Treasury (2011), chapter 7. 17 In order to identify causality, an identification strategy is needed – see the approach adopted by Eyal and Woolard (2011).

21
Table 6: Forms of income support for the discouraged and unemployed, both sexes, 2008 versus 2009-10
Percentage receiving support (%) Unemployed Discouraged 2008 2009-2010 2008 2009-2010 Persons in the household 77.7 77.4 76.5 79.8 Persons not in the household 19.7 20.7 21.5 19.9 Child support/foster care grants 13.8 13.6 22.5 22.6 Savings 4.7 4.9 1.9 1.6 Unemployment Insurance Fund (UIF) 0.7 1.0 0.4 0.4 Pension 0.7 0.6 1.4 1.1 Charity 0.1 0.1 0.2 0.1
Source: Statistics South Africa Quarterly Labour Force Survey, 2008Q1–2010Q4; author’s calculations.
The estimates reported in Table 7 also suggest that receiving UIF benefits and relying on savings is positively associated with job search among males. In terms of the more generous old-age pension, receiving this transfer is associated with a larger odds ratio for both men and women prior to the crisis in 2008, but the ratio is only marginally significant in the case of the female sub-sample. In 2009/10, the odds ratio for individuals receiving the pension has increased significantly for males but not females. The dummy for child grants is positively and significantly correlated with the probability of discouragement for females (and for males in 2008), but there hasn’t been a major shift in the odds ratio for these variables. Table 7: Transfers and the likelihood of discouragement among jobless males and females, odds ratios - 2008 versus 2009-2010
2008 2009/10 Variable (1) (2) MALES Intra-household transfers 1.072 1.299*** Inter-household transfers 1.047 0.867*** UIF 0.873 0.519*** Savings 0.549*** 0.414*** Pension 1.435 1.764*** Grants 1.759*** 1.004 Observations 17,112 37,061
FEMALES Intra-household transfers 0.888** 1.065* Inter-household transfers 1.239*** 1.187*** UIF 1.021 0.798 Savings 0.804 0.564*** Pension 1.470* 1.141 Grants 1.332*** 1.238*** Observations 21.696 43,681
Source: Statistics South Africa Quarterly Labour Force Survey, 2008Q1 – 2010Q4; author’s calculations. Notes: *** p<0.01, ** p<0.05, * p<0.1. The odds ratios are based on a logit regression where the dependent variable is a binary variable that equals one for individuals reporting to be discouraged (not actively searching for a job). The sample is restricted to individuals who are ready and able to work (i.e. excluding other forms of inactivity due to education, retirement, caring responsibilities and disability). Other variables included in the logit regression are listed in Table 5.

22
4.3 Are transitions in the labour market different for the discouraged? As highlighted above, the study by Jones and Riddell (1999) analysed transition rates to identify differences between the unemployed and discouraged workers. Though Statistics South Africa does not provide an identifier to link the various waves of the QLFS (which is sampled on the basis of a rotating panel as noted in section 3.1), a panel can be created from the data using the household identifier and information on age, gender, population group, marital status and educational status. Using a similar approach taken by Ranchhod and Dinkelman (2008) for the earlier Labour Force Survey (including dropping false matches on the basis of inconsistencies in marital status and educational attainment), this results in a sample of 181,372 observations for 2008-2010. 60,624 observations were dropped from the full sample because individuals were only present in one wave; a further 20,421 observations were eliminated due to inconsistencies in marital status and educational attainment. This process resulted in a matching rate of 48.7 per cent (compared to 38 per cent for Ranchhod and Dinkelman (2008) for the LFS). Attrition may not be random and, therefore, it is not possible to claim that figures from this data are representative of the South African working-age population. Using this matched dataset, it is possible to compare the transitions across the five labour market states (formal sector employment, informal sector employment, unemployment, discouragement and out-of-the-labour force). To isolate the impact of the crisis, the transition rates for 2008Q1-2008Q4 (i.e. transitions from 2008Q1 to 2008Q2, 2008Q2 to 2008Q3 and 2008Q3 to 2008Q4) are compared to 2009Q1-2009Q4 (2009Q1 to 2009Q2, 2009Q2 to 2009Q3 and 2009Q3 to 2009Q4). Table 8: Labour market transitions rates in 2008 versus 2009 FEMALES Period t+1 Period t Ft+1 It+1 Ut+1 Dt+1 OLF t+1 2008 2009 2008 2009 2008 2009 2008 2009 2008 2009 Ft 89.2 91.7 3.8 3.3 2.8 1.9 0.6 0.8 3.6 2.4 It 7.6 7.6 74.9 80.0 5.2 3.1 2.3 1.7 10.1 7.6 Ut 7.6 5.4 8.6 4.4 55.9 61.2 5.3 7.6 22.6 21.4 Dt 6.2 3.0 7.1 2.5 16.9 19.5 39.8 49.5 30.0 25.5 OLFt 1.7 0.7 2.4 1.9 6.2 5.5 2.4 3.3 87.3 88.9
MALES Period t+1 Period t Ft+1 It+1 Ut+1 Dt+1 OLF t+1 2008 2009 2008 2009 2008 2009 2008 2009 2008 2009 Ft 90.6 92.8 3.7 2.9 3.2 2.3 0.5 0.7 2.0 1.2 It 17.5 12.9 67.1 74.3 8.1 6.7 2.9 1.6 4.4 4.6 Ut 13.7 9.7 7.7 4.0 60.4 67.7 4.2 7.6 14.0 11.1 Dt 3.8 3.6 7.0 8.2 22.7 24.6 43.2 46.4 23.2 17.3 OLFt 1.4 0.7 2.3 1.9 6.0 6.1 1.5 3.0 88.9 88.3
Source: Statistics South Africa Quarterly Labour Force Survey, 2008Q1–2009Q4; author’s calculations. Notes: F = formal sector employment; I = informal sector employment; U = narrowly-defined unemployment; D = discouragement; OLF = other out-of-the-labour force. The individuals in the panel were matched across waves of the QLFS using observable characteristics.
As displayed in Table 8, there is a high degree of persistence in formal sector employment and inactivity (OLF), while there is considerable churning across different states in the South African labour market, which is similar to findings for earlier periods (see, for example, Banerjee et al. (2008)).
23
Discouragement is the least absorbing state. At the same time, men are more likely to move into formal sector employment from informal sector employment and unemployment than from the state of discouragement (see the findings of Ranchhod and Dinkelman (2008) for an earlier period). Of particular interest is the high rate of transitions from discouragement into narrowly-defined unemployment (and vice-versa), which reflects the decision to undertake job search changes over time, even from one quarter to the next. For example, in 2008, 22.7 and 16.7 per cent of discouraged males and females started actively searching for a job in the next quarter. As highlighted above (see also Kingdon and Knight (2006) and Makgetta (2010)), the likelihood of finding employment in the former ‘homeland’ areas is very low, while the costs of job search to urban centres are high. A typical search strategy for individuals living in these regions is to wait for information about a specific job offer that they receive through their social network (especially through an employed relative or friend). This would partly explain the churning evident in the transitions between narrowly-defined unemployment and discouragement. In terms of changes in transition rates from 2008 to 2009, there is evidence that most states have become more absorbing during the recession; that is, individuals were less likely to move. For example, 60.4 per cent of males remained in informal sector employment from one quarter to the next in 2008, which increased to 67.7 per cent in 2009. Interestingly, these transitions from formal and informal sector employment into unemployment and discouragement have largely decreased from 2008 to 2009 for both men and women. In contrast, the most visible impact of the crisis is the fall in the inflow rates for males, especially from informal sector employment and unemployment into formal sector employment, and from unemployment into informal sector employment. In 2008, 17.5 per cent of informal sector workers and 13.7 per cent of the unemployed moved to the formal sector in the next quarter. These transition rates fell in 2009 to 12.9 and 9.7 per cent, respectively. At the same time, there were lower inflow rates into informal sector work from unemployment (for both women and men). This is consistent with the decline in informal sector employment discussed above and displayed in Figure 1. Overall, the rise in narrowly-defined unemployment during the recession of 2008-2009 has been caused more by a fall in inflow rather than outflow rates. In addition to these changes to inflow rates, transitions from narrowly-defined unemployment to discouragement, and vice-versa, have increased for both sexes during the crisis period. Given the low match rate, it is difficult to robustly identify the determinants of transitions (using the same individual and household variables employed above). Experimenting with different specifications (such as logit for entries into formal sector employment) reveals that there are no major significant changes during the recession. However, if a better matched panel was available, this type of analysis could be further explored.
5 Conclusion Since the end of Apartheid in 1994, South Africa has been plagued by some of the highest unemployment rates and lowest employment-population ratios in the world. During the global boom years of 2002-2007, unemployment began to finally fall as economic conditions further improved. Owing to its strong trade and financials links, South Africa was, however, hit hard by the global financial crisis, which has exacerbated the longer term structural problems in the economy and labour market. Consequently, the country fell into a recession in the fourth quarter of 2008 and contracted by 1.7 per cent in 2009.

24
In spite of the fiscal stimulus package and the loosening of monetary policy, the ensuing recession of 2008-2009 decimated the South African labour market resulting in a drop in employment of over 800,000 (difference in the average in 2010 over 2008). The main effect of the downturn on the labour market has been a rise in the number of discouraged individuals, from an average of 1.12 million in 2008 to 1.98 million in 2010. In comparison, narrowly-defined search unemployment increased over the same period by only 214,000 (from 4.08 to 4.29 million). As a result, there has been a growing divergence between the narrow and broad unemployment rates, which averaged 25.0 and 32.7 per cent in 2010, respectively. The broad unemployment rate increased the most for youth, the less-educated, Africans and individuals in both hard-hit provinces (such as Gauteng) and regions where discouragement is a long-term challenge (e.g. Mpumalanga). Drawing on a model of labour market status, the estimates done separately for males and females confirm the findings of the previous literature, namely that Africans and the less-educated are more likely to be employed in the informal sector, unemployed (only in the case of men) and discouraged. A larger household is associated with a lower probability of employment and a higher likelihood of joblessness. Going beyond the focus of earlier studies, the results also show that individual labour market outcomes are highly correlated with the status of the spouse. In particular, the likelihood of job search among the unemployed is linked to the search status of their spouse: couples tend to be either jointly searching or discouraged. Looking at changes in the marginal effects from the 2008 to 2009-2010, there is evidence that the probabilities of being unemployed and discouraged increased the most during the crisis for Africans, the poorly-educated and individuals in the most-affected provinces. Departing from longer term gender disparities, searching and non-searching unemployment increased more during the recession for poorly-educated African men than women with similar characteristics, which stems from the sectoral impact of the crisis. The analysis presented in this paper also demonstrates that the discouraged and searching unemployed are different on the basis of observable characteristics, notably population group, educational attainment, spousal status and location. There is some evidence that social transfers, including child support grants, are correlated with job search (though causality is more difficult to establish), and this association became stronger during the crisis period. Using a matched panel from the QLFS, transitions between labour market states reveal that there is both persistence in some states (formal sector employment and inactivity) and churning between narrowly-defined unemployment and discouragement. For example, in 2008, 22.7 and 16.7 per cent of discouraged males and females started actively searching for a job in the next quarter, which reveals the decision to undertake job search changes over time, even from one quarter to the next. Unsurprisingly, the searching unemployed, especially males, are more likely than discouraged individuals to move into formal sector employment in the following period. In terms of changes in the transition rates over the crisis period, most labour market states became more absorbing during the recession, and the increase in unemployment has been caused more by a fall in inflows into formal sector employment than outflows. These findings serve as a reminder of the continuing sclerotic state of the labour market in South Africa and the need for policymakers to take action on addressing the structural factors driving these processes. The results also strongly support the notion that a broader measure of the unemployment rate best captures the deterioration in the South African labour market during the recession of 2008-2009. As also argued by Kingdon and Knight (2006), it is, however, ultimately useful for policymakers to distinguish between both searching and non-searching states of joblessness and thus report on both the narrow and broad unemployment rates.

25
The response of policymakers to the first post-Apartheid recession indicates that the South African government are placing considerable emphasis on existing schemes such as the Expanded Public Works Programme (EPWP), while experimenting with innovative measures such as the Training Layoff Fund. However, most policies did not specifically target the issue of discouragement and job search. In 2010, the President Zuma announced the latest policy initiative, the ‘New Growth Path’, which focuses on how and where to create jobs. Though addressing insufficient labour demand is indeed a critical issue, this needs to be supplemented with policies that tackle the supply-side, namely the problems of inadequate skills, work experience and spatial inequalities. This would involve further interventions to reduce barriers to job search such as improving the quality and access to training and employment services, investing in infrastructure, and providing targeted transport subsidies. Ultimately, job search for the unemployed in rural areas needs to become more affordable and effective, which also requires sustainable local economic development in these regions.
26
References Ardington, C., Case, A. and V. Hosegood (2009) ‘Labor supply responses to large social transfers:
longitudinal evidence from South Africa’, American Economic Journal: Applied Economics, Vol. 1, No. 1, pp. 22-48.
Banerjee, A., Galiani, S., Levinsohn, J., McLaren, Z. and I. Woolard (2008) ‘Why has unemployment risen in the new South Africa?’, Economics of Transition, Vol. 16, No. 4, pp. 715-740.
Bartus, T. (2005) ‘Estimation of marginal effects using margeff’, The Stata Journal, Vol. 5, No. 3, pp. 309-329.
Betrand, M., Mullainathan, S. and D. Miller (2003) ‘Public policy and extended families: evidence from pensions in South Africa’, World Bank Economic Review, Vol. 17, No. 1, pp. 27-50.
Blundell, R., Ham, J. and C. Meghir (1998) ‘Unemployment, discouraged workers and female labour supply’, Research in Economics, Vol. 52, pp. 103-131.
Bhorat, H. and R. Kanbur (eds.) (2006) Poverty and Policy in Post-Apartheid SA. Human Sciences Research Council Press, Pretoria, South Africa.
Bhorat, H., Leibbrandt, M., Maziya, M., Van der Berg, S. and I. Woolard (2001) Fighting poverty – Labour Markets and Inequality in South Africa. UCT Press, Cape Town, South Africa.
Devey, R., Lebani, L., Skinner, C. and I. Valodia (2008) ‘The Informal Economy’, In: Kraak, A. and K. Press (eds.) Human Resources Development Review 2008: Education, Employment and Skills in South Africa, Human Sciences Research Council Press, Pretoria, South Africa.
Eyal, K. and I. Woolard (2011) ‘Female labour force participation and South Africa’s Child Support Grant’, Paper presented to the CSAE’s 25th Anniversary Conference 2011: Economic Development in Africa, 20-22 March 2011, Oxford.
Fallon, P.R. and R.E.B. Lucas (2002) ‘The impact of financial crises on labor markets, household incomes, and poverty: a review of evidence’, The World Bank Research Observer, Spring 2002, Vol. 17, No. 1, pp. 21-45.
International Monetary Fund (IMF) (2010) ‘Unemployment dynamics during recessions and recoveries: Okun’s Law and beyond,’ In: IMF (2010) World Economic Outlook Rebalancing Growth, April 2010. Chapter 3, IMF, Washington, D.C.
Jones, S.R.G. and W.C. Riddell (1999) ‘The measurement of unemployment: an empirical approach’, Notes and Comments, Econometrica, Vol. 67, No. 1, pp. 147-162.
Jutting, J. and J.R. de Laiglesia (eds.) (2009) Is Informal Normal? Towards More and Better Jobs in Developing Countries. OECD Development Centre Studies, Paris.
Kain, J. (1968) ‘Housing segregation, negro employment, and metropolitan decentralization’, Quarterly Journal of Economics, Vol. 82, pp. 175-197.
Kingdon, G. and J. Knight (2004) ‘Unemployment in South Africa: the nature of the beast’, World Development, Vol. 32, No. 3, pp. 391-408.
Kingdon, G. and J. Knight (2006) ‘The measurement of unemployment when unemployment is high’, Labour Economics, Vol. 13, pp. 291-315.
Kingdon, G. and J. Knight (2007) ‘Unemployment in South Africa, 1995-2003: causes, problems and policies’, Journal of African Economies, Vol. 16, No. 5, pp. 813-848.
Klasen, S. and I. Woolard (2008) ‘Surviving unemployment without state support: unemployment and household formation in South Africa’, Journal of African Economies, Vol. 18, No. 1, pp. 1-51.
Layard, R., Nickell, S. and R. Jackman (1991) Unemployment: Macroeconomic Performance and the Labour Market. Oxford University Press, Oxford.
Makgetta, N.S. (2010) ‘Synthesis paper: South Africa’, mimeo. National Treasury of the Republic of South Africa (2010) Budget Review 2010. Available at:
http://www.treasury.gov.za/documents/national%20budget/2010/review/Budget%20Review.pdf. National Treasury of the Republic of South Africa (2011) Budget Review 2011. Available at:
http://www.treasury.gov.za/documents/national%20budget/2011/default.aspx.
27
Okun, A.M. (1962) ‘Potential GNP: its measurement and significance’, American Statistical Association, Proceedings of the Business and Economics Section, pp. 98-104.
Organisation for Economic Co-operation and Development (OECD) (2008) ‘Realising South Africa's employment potential’, In: OECD (2008) Economic Assessment of South Africa 2008. Chapter 3, OECD, Paris.
Organisation for Economic Co-operation and Development (OECD) (2011) OECD Employment Outlook 2011. OECD, Paris.
Padayachee, V. (ed.) (2006) The Development Decade? Economic and Social Change in South Africa, 1994-2004. Human Sciences Research Council Press, Pretoria, South Africa.
Pissarides, C.A. (2000) Equilibrium Unemployment Theory, Second Edition. Massachusetts Institute of Technology (MIT) Press, United States.
Ranchhod, V. and T. Dinkelman (2008) ‘Labour market transitions in South Africa: what can we learn from matched labour force survey data?’ Southern Africa Labour and Development Research Unit Working Paper, No. 14.
Rogerson, C.M. (1992) ‘The absorptive capacity of the informal sector in the South Africa city’, In: Smith, D.M. The Apartheid City and Beyond. Routledge, London.
Samson, M. (2009) ‘Social cash transfers and employment: a note on empirical linkages in developing countries’, In: OECD (2009) Promoting Pro-poor Growth: Employment. OECD, Paris.
South Africa Reserve Bank (2009) ‘September 2009’, Quarterly Bulletin, No. 253. South African Human Rights Commission (SAHRC) and UNICEF South Africa (2011) South Africa’s
Children: A Review of Equity and Child Rights. South African Human Rights Commission/UNICEF.
Statistics South Africa (2009) ‘Gross domestic product – third quarter: 2009’, Statistical Release, P0441, available at: www.statssa.gov.za.
Valodia, I. (2007) The Informal Economy in South Africa: Issues, Debates and Policies: Reflections after an Exposure Dialogue Programme with Informal Workers in Durban, South Africa, Research Report, No. 75, March 2007.
Valodia, I., Lebani, L. and C. Skinner (2005) ‘Low-waged and informal employment in South Africa’, Review of Labour Markets in South Africa, Human Sciences Research Council, Pretoria, South Africa.
Van Ham, M., Mulder, C.H. and P. Hooimeijer (2001) ‘Local underemployment and the discouraged worker effect’, Urban Studies, Vol. 38, No. 10, pp. 1733-1751.
Verick, S. (2009) ‘Who is hit hardest during a financial crisis? The vulnerability of young men and women to unemployment in an economic downturn’, IZA Discussion Paper, No. 4359.
Williams, M.J. (2007) ‘The social and economic impacts of South Africa’s Child Support Grant’, Economic Policy Research Institute Working Paper, No. 40.
Wooldridge, J.M. (2002) Econometric Analysis of Cross Section and Panel Data. The MIT Press, Cambridge, Mass.
Zenou, Y. (2011) ‘Spatial versus social mismatch: the strength of weak ties’, IZA Discussion Paper, No. 5507.