gis in banking: evaluation of canadian bank...
TRANSCRIPT

© Canadian Journal of Regional Science/Revue canadienne des sciences régionales, XXIV: 3(Autumn/automne 2001), 419-442.ISSN: 0705-4580 Printed in Canada/Imprimé au Canada
GIS in Banking: Evaluation of Canadian Bank Mergers
Eliot Hug h MacD onald
Department of Geography
University of T oronto
Toronto, ON M5S 3G3
Introduction
Banks in Canada use geographic information systems (GIS) technology for a wide
range of applications. These include, but are not limited to, selecting new branch
sites, identifying risks associated with closing a branch, executing targ eted mark et-
ing campaigns, navigating customers to ward their loc ations, gaining b etter insights
into markets served and expected financial performance given those markets, and
adding cla rity and impa ct to reporting through maps. But one such area in which
GIS is applied, namely the evaluation of bank mergers, is of particular interest not
only to regional scien tists but the pub lic in general. In this article, the use of GIS
and related methodologies by banks in evaluating mergers and preparing for
governm ent review of m ergers is pro filed.
In 1998, Canadian business news was dominated by merger proposals from
some of the country’s largest banking institutions. The Royal Bank of Canada,
Canada’s largest bank, and the Bank of Mon treal, Canad a’s first bank, were first
to announce these intentions. This was followed soon after by a merger proposal
between the Toronto-Dominion Bank and the Canadian Imperial Bank of Com-
merce. The Competition Bureau, an agency of the Federal Government, was faced
with reviewing these proposals within the context of its general mandate - ensuring
that Canada maintains a competitive marketplace which allows the public to enjoy
the benefits of competition, including competitive prices, product choice and
quality service (Department of Industry 1991, 1997). The outcom e of the review
was to prevent the mergers in the 1 998 prop osals.
In making details of the merger review process public, the government re-
420 MACDONALD
vealed that the proce ss lends itself very well to incorporation of GIS methodo-
logies. To pu t it very simply, the process followed by the government involves
trying to identify where a merger will result in market share levels for the merging
parties in excess of specified levels. Thus, a merger evaluation of this type requires
an understanding of what defines a relev ant market, b oth in terms of what p roducts
define a market and the geographical component. It also demands some type of
automated processes for handling larg e amounts o f geograph ic data for all regions
of an entire country. The government has established a process which involves
defining markets geographically and collecting industry data to gauge market share
levels for these markets. The process used is one which is extremely d ifficult to
reproduce by those banks wishing to evaluate mergers by performing their own
“self-review” of a merger in relation to competition law compliance, and has been
under debate in ter ms of whethe r or not app ropriate ge ographic markets resu lt
from such a process. T his paper fo cuses on the ways in which GIS-based method-
ologies can be applied to this merger evaluation process, particularly to derive
market boundaries around which the government is expected to structure its merger
review pro cess and estim ate market sh are for those regions.
In trying to gauge regional competition issues involving mergers, defining
what geographic markets are approp riate has bee n an issue cha llenging both
government and the corporations. In general, it is agreed that market boundaries
should reflect both the locations of service outlets themselves, as well as where the
masses of consumers are located in order to predict market share with as much
accuracy as possible. For example, defining markets such that boundaries surround
only the immediate regions of certain branches can lead to greatly overstated
market share estimates (understating the impact of competitors just outside these
boundaries). Even if accuracy in market share estimation is achieved, the choice
of overall market sizes can present further problems. If the defined markets are too
large, regions may exist within these large markets where merging parties dom inate
the area and can make pricing changes for customers who are still too far away
from alternative banking services that they would consider reasonably accessible.
Adding to the complexity is the fact that the approp riate geogra phic mark et defini-
tions will change as different product markets are considered, such as commercial
loans versus consumer d eposits.
Market share represents the key statistic on w hich the gove rnment relies to
gauge the possibility that merging corporations may enjoy too much market power
within a particular geographic region. For the banks themselves, the data on
compe titive business volumes for specific, relatively small, geographic regions
needed to measure market share is simply not ava ilable. How ever, using G IS, a
complex “spatial interaction model” for predicting market share based on what
types of markets (in other words, the settlement pattern of customers) are located
near branches of different organisations can be developed (see below). The model
can be applie d to virtually any defined geographic region, e.g. “non-standard”
regions defined by government for a merger review, such that banks nee d not rely
on merely assigned city names in order to deal with the geogr aphical me asuremen t.
A methodo logy for first defining the markets themselves, such that they match as
GIS IN BANKING 421
well as possible the geographic regions expected to be formed by the government
for a given merg er review, is pro posed a s well. For simplicity, one specific product
line, persona l deposits, is used for demo nstration purp oses.
The paper is pr esented in five se ctions. First, a brief background on each of
five main con cepts involved in this m erger review process is presented, viz. how
the government agency approaches a merger review, the concep t of “trade areas”
and defining appropriate geographic markets, measuring market share and an
overview of the type of model used. Second, methodologies for defining geo-
graphic markets as dictated by government guidelines are reviewed. Third, the key
model used to estimate market share (in this case, share of the “personal deposits”
market for banks) for these geographic markets is outlined. Fourth, the methodolo-
gies are executed using selected case studies in order to test them. Two Canadian
banking institutions, Toronto-Dom inion Bank and C anada Trust, are used as a
target for testing the market definition methodologies. These organisations were
chosen because a merger between them took place shortly before this paper was
written, and a po rtion of the resu lts of the merger review process have been pub-
lished by the gover nment. Finally, a brief set of conclusions are drawn. For some
sections of the paper, the added value of having actual data for a selected institu-
tion can be offered, and processing of this data is used to support concepts. To
protect the privacy of this institution, it will be referred to merely as the F.I .R.M.
(the Financial Institution Reviewing a Merger).
Related Research and Concepts
The Competition Bureau and Merger Enforcement Guidelines
The letters, studies, and guidelines developed by or submitted to the Canadian
governm ent’s Competition Bureau as a result of the major ba nk merger propos als
in 1998 provide a major source of information on merger procedures and enforce-
ment (e.g., McFetridge 1998; Task Force 1998; C.D. Howe 1998 ; Neave and
Milne 1998; Horstman et al 1996). The Co mpetition Bureau has the mandate of
ensuring that Canada maintains a competitive marketplace and that the Canadian
public continues to enjoy the benefits of competitive prices, product choice and
quality service (Neave 1996; Cardwell 1997). A merger can re sult in increased
market power within certain markets, giving for instance an ability to increase
prices when the reduced number of competitors in a market leaves fewer alterna-
tives. The Bureau must perform related market analysis in order to evaluate the
presence of such dan gers.
A major co mpone nt of The Bureau’s review is the definition of relevant
markets, which has both a product and geographic dimension. The intent of the
Bureau in defining the ap propriate geograp hic market is to includ e all areas in
which there are suppliers to which customers would likely turn in response to an
attempt by the merging firms to exercise market power. Thus, the size of the

422 MACDONALD
market will vary with different product dimensions. For example, customers
looking for a major loan, or commercial clients requiring special services, may not
be as sensitive to distance as individual consumers for whom accessibility consid-
erations are more relevant (CCF 1998). As a conseq uence, “pe rsonal dep osits” is
the product group chosen for analysis in the paper.
Although the Burea u’s specific me thodolo gy used to define geo graphic
markets remains confidential, and perhaps even variable or ad hoc depending on
the circumstances, a sufficient amount of information on the process has been
made available to reach some useful conclusions. For urban markets, it is clear that
the 25 mark ets defined for the latest Census by Statistics Canada as “Census
Metropolitan Areas (CMAs)”, and the 112 markets defined as “Census Agglomera-
tions (CAs)” are used (Statistics Canada 19 97). These regions are based on urban
cores of 100,000 or more population, and 10,000 or more populatio n respective ly
(Statistics Canada 1993). Their geo graphic territo ries are well de fined and re adily
available in electronic format for incorporation into GIS software.
For rural markets, the process is less clear, but the following conclusions can
be drawn from published data:
< Initially, pairs of bran ches of the m erging institutions tha t are within 20 km of
one another , and in which both branches are in “rural” areas (outside of CMA
or CA territories), are identified.
< Marke ts are made up of municipalities within the regions surrounding the
pairs of branches defined above. The “municipalities” are represented by
Statistics Canada’s “Census Subdivisions (CSDs)”, for which spe cific defini-
tions and electronic representations are also available.
< Marke ts do not overlap. That is, each CSD is assigned to one and only one
market.
< Only “rural” CSDs (CSDs not part of a CMA or CA) are assigned to rural
markets.
< A maximum of one rural market per pair of branches defined above is identi-
fied, and only for regions surrounding a “line” joining these branches (be-
lieved to be base d on 20 km aroun d this “line”). This leaves many rural “unas-
signed” regions throughout the coun try, for which competitive analysis is
deemed unnecessar y.
This presents a tremendous stage for showcasing GIS. As will be demons trated in
the next major section, GI S can help the governm ent and me rging parties a void
months of tedious effort trying to identify such markets manually. Electronic street
address and postal data, combined with GIS software tools, permit us to first assign
geograp hic locations to lists of bank branches involved which the GIS software can
further manage. Following this, the task of dete rmining pairs of branche s within
close proximity and selecting municipalities which surround these pairs can also
be automated via GIS.
The Bureau a lso relies heavily on available data published by organisations
such as the Canadian Bankers Association in order to calculate market shares, and

GIS IN BANKING 423
uses these data as an initial screening test. Regarding the last point above, the
Bureau states that the markets which are “relevant” are those defined through use
of the “hypothetical monopolist” test. Under this test, a relevant market is the
smallest geograp hic area such that a sole supplier of the se banking p roducts co uld
profitably ma intain a non-tran sitory price incr ease versus w hat could be charged
without the merger taking place. In general, if the post-merger market share of the
merging parties wou ld be less than 35 %, it is assumed that there is NOT a threat
of new marke t power be ing generate d. Otherw ise, further in depth review of the
market is req uired.
Trade Area Definitions
A trade area can be defined as the geographic region from which a particular sales
outlet draws most of its customers (Lea 1998a). There are three imp ortant issues.
The first relates to the task of defining the appropriate “size” of a trade area for a
given store outlet -- how far a customer will go to use a particular store outlet
versus another. This varies widely depending on both the product, or service
involved, and the attributes of the store outlets themselves. Attempting to define
store trade areas using simplified methods such as drawing circles aroun d outlets
or splitting up a region into trade areas base d merely on proximity is sho wn to
produce significantly inaccurate trade areas in many cases. The distances traveled
by customers fo r a particular b anking pro duct need s to be understood, even when
branch-leve l markets are g rouped into larger ma rkets.
A second issue concerns the use of polygon based trade area definitions for
the purpose of aggregating statistics for markets served by store ou tlets. For these
types of trade area definitions, data are either completely “in” or completely “out”,
depending on whether or not its locations are inside or outside of the boundary
defined. However, the typical pattern of consumer purchases at retail outlets is one
that varies with distance and the attractiveness of the outlets involved. Within a
particular neighbourhood, the majority of households may be customers of the
nearest store outlet, but a significant percentage may be c ustomers of the next
nearest. Thus, trying to estimate market share based on splitting a region into trade
area polygons for the individual store outlets can lead to significantly inacc urate
results. Therefo re, the conce pt of the “Hu ff probabilistic trade area”, where a trade
area for a given outlet is represented by a set of probabilities for each neighbour-
hood of households using the outlet as its prime source, is adopted as a more
suitable alternative (Lea 1998b).
A third issue concerns a debate as to whether customers com e to a store as a
result of its creation, or are served by a store which is built because the customers
were already there . There is a tw o-way relation ship betwee n retail outlet gro wth
and population growth. Thus, the “system” of urban growth simultaneously gener-
ates markets due to the existence of stores and stores to se rve existing ma rkets
(Jones and Simm ons 199 0). This co ncept und erlies some o f the research in this
paper because, when branch level market share estimation models are created,

424 MACDONALD
branch size is effectively elimin ated from consideration as it is assumed to be
determined exogenously. The issue of where customers base their branch location
choice, such as its proximity to their home or work locations, also plays a key role
in determinin g the appro priate mark et bound ary.
Market Share: Issues and Alternatives
There are a number of varying components of market share, and there are different
ways it can be defined (Lea 1999; Simmons et al 1998). The metrics used can
include total custome rs served, tota l sales revenue , total units sold, “balan ces” held
by customers and number of stores or companies operating in the industry. The
market (geograp hy) defined can vary from immediate (prime) “trad e areas” within
close proximity to store outlets, to entire major regions within which the institu-
tions have presence. The pro duct dime nsion can also vary significantly in terms of
what set to include in th e definitions. This can vary further when an additional
“customer” dimension is tied into it, where even one product is further split based
on the fact that different customer segments (e.g., major corporate clients versus
individual households) are being served by different sets of companies. Further-
more, market share can be calculated on the basis of where customers live (“de-
mand based” a pproac h), or based on where the stores themse lves are loca ted
(“supply based” approach).
In this analysis, much of this complexity has been removed by the limitation
imposed by the data available for m odeling. T he market d ata made wid ely avail-
able to banking in stitutions involves preset definitio ns for most of these compo-
nents. Only certain p roduct gro upings, sets of competitors, geographic regions and
methods of calculation (in terms of branch versus customer based) have been used
(provided). Spatial pattern (and thus, GIS) is also central to the estimation of
market share, particularly when it comes to estimating the total market (data are
usually readily available to give accurate measures of one’s own sales). But the
issue of spatial distribution of customers and store outlets, and the associated
issues of trade area definitions clea rly impact the complexity of the task. Some of
the complex ity is removed by the fact that one need only deal with relatively large
regions for the purpose of merger review, and the issue of mar ket definition is
driven by how the government defines the markets. However, it will be necessary
to consider submarket issues in cases where the goal is to estimate market share of
a specific competitor, and thus “numerator” data are not even directly available for
the market share estimates. This is certainly the case for merger planning, particu-
larly when planning and evaluations are needed before the stage when information
is being share d betwee n institutions.
GIS IN BANKING 425
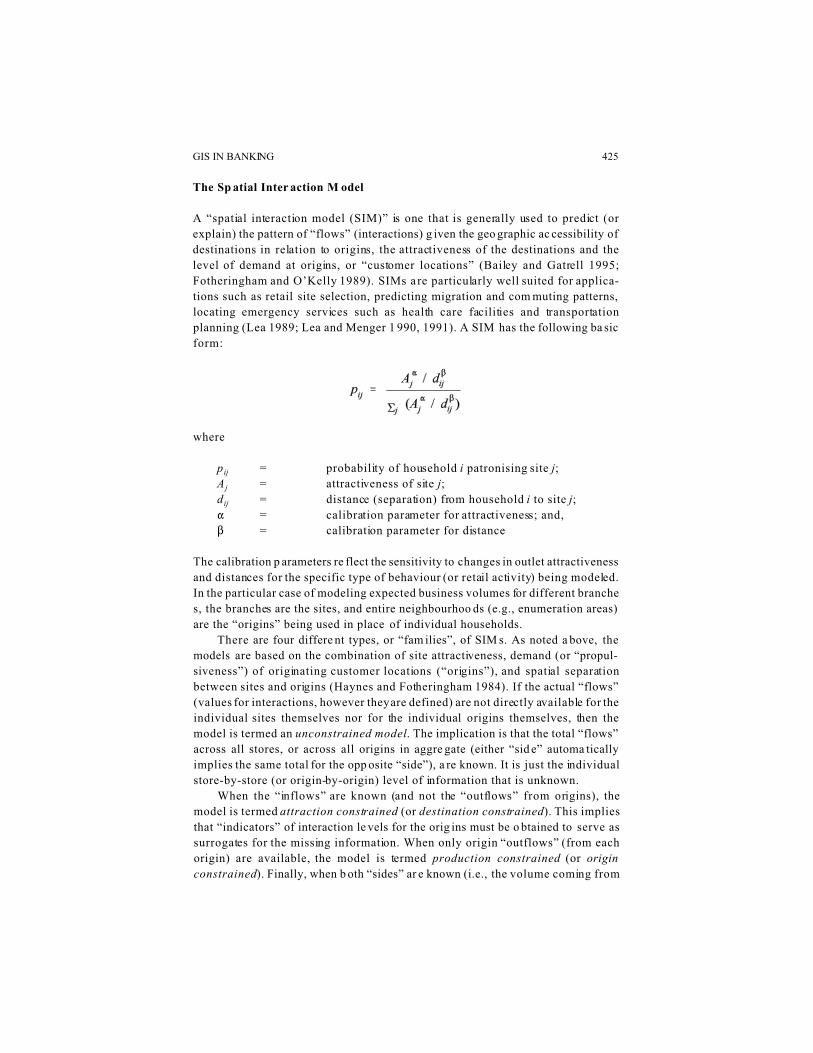
The Sp atial Inter action M odel
A “spatial interaction model (SIM)” is one that is generally used to predict (or
explain) the pattern of “flows” (interactions) g iven the geo graphic ac cessibility of
destinations in relation to origins, the attractiveness of the destinations and the
level of demand at origins, or “customer locations” (Bailey and Gatrell 1995;
Fotheringham and O’Kelly 1989). SIMs a re particularly well suited for applica-
tions such as retail site selection, predicting migration and com muting patterns,
locating emergency services such as health care facilities and transportation
planning (Lea 1989; Lea and Menger 1 990, 1991). A SIM has the following ba sic
form:
where
p ij = probability of household i patronising site j;
A j = attractiveness of site j;
d ij = distance (separation) from household i to site j;
" = calibration parameter for attractiveness; and,
$ = calibration parameter for distance
The calibration p arameters re flect the sensitivity to changes in outlet attractiveness
and distances for the specific type of behaviour (or retail activity) being modeled.
In the particular case of modeling expected business volumes for different branche
s, the branches are the sites, and entire neighbourhoo ds (e.g., enumeration areas)
are the “origins” being used in place of individual households.
There are four differe nt types, or “fam ilies”, of SIM s. As noted a bove, the
models are based on the combination of site attractiveness, demand (or “propul-
siveness”) of originating customer locations (“origins”), and spatial separation
between sites and origins (Haynes and Fotheringham 1984). If the actual “flows”
(values for interactions, however they are defined) are not directly available for the
individual sites themselves nor for the individual origins themselves, then the
model is termed an unconstrained model. The implication is that the total “flows”
across all stores, or across all origins in aggre gate (either “sid e” automa tically
implies the same total for the opp osite “side”), a re known. It is just the individual
store-by-store (or origin-by-origin) level of information that is unknown.
When the “inflows” are known (and not the “outflows” from origins), the
model is termed attraction constrained (or destination constrained). This implies
that “indicators” of interaction le vels for the orig ins must be o btained to serve as
surrogates for the missing information. When only origin “outflows” (from each
origin) are available, the model is termed production constrained (or origin
constrained). Finally, when b oth “sides” ar e known (i.e., the volume coming from

426 MACDONALD
each individual origin and feeding into eac h individual site are known), it is a
doubly constrained (or production-attraction constrained) model. In th is case, it
is merely the interaction patterns themselves (e.g., which customers go to which
sites) that are being mode led. Note that the set of “origin s” need no t refer to
individuals themselves, but rather groups o f individuals (e.g., “neighbourhoods”),
where central points (“centroids”) for the groups or the edges of boundaries
surrounding the group s are used for the purpo se of calculating distances.
GIS Based Market Definition Methodologies for Merger Review
The focus of this section is on trying to duplicate the pre-defined process set by the
Canadian government for defining geographic markets for merger review. How-
ever, it is worth first reviewing the basic aim of this process and evaluating the
process in p lace before presenting the methodo logy.
The Concept of “Natural Markets”
The appropriate market definitions are b elieved by m any to be on es which fall
“naturally” from consumer patterns. “Na tural markets” is an unofficial term used
frequently by both the governm ent and the corpora tions during merger planning
and review. From the perspective of merger review partic ipants, they can be
defined very loosely as isolated ge ographic regions within which a high degree of
econom ic integration exists (e.g. commuting to work takes place). One might also
visualise “natural markets” as the regions which result when one splits up the
country using boundary lines which are generally not crossed w ith high volumes
for the purposes of attending work, shopping or going to the bank. Clearly, trying
to derive boundaries that strictly meet these genera l conditions w ould be v irtually
unachieva ble without making the regions very large. For countless urbanised
regions, the overlap in commuting patterns wo uld require that a boundary be drawn
around an enormous populatio n before the re is no significant v olume of co mmut-
ing taking place acro ss the bound ary. In theory, thes e markets should not change
as one reviews a particular proposed merger. However, the governm ent currently
establishes a process which tends to isolate regions around the m erging parties’
branch locations, citing that these are the “relevant” areas in question for the given
propo sal.
Other factors surro unding ma rket definition fo r financial service s also com pli-
cate the issue. In direct contrast to the urban commuting scenario outlined above,
there are many isolated villages surrounded by hundreds or thousands of square
kilometres of virtually uninhab ited territory. In many of these, the village popula-
tion does not come close to warranting the installation of even an automated
banking machine. A nother facto r is the banking produc t in question, and how
GIS IN BANKING 427
markets change when different product lines are being reviewed . And finally,
despite perhaps representing the key activity, commuting to work does not repre-
sent the only way in wh ich econo mic integration exists between different regions.
Certainly examples such as shopping at a regional mall, or relying on information,
health and other services of another region, should in theory be given some consid-
eration.
One general ap proach fo r defining “natural” rural markets would be one which
closely follows the “functional reg ion” conc epts used b y Statistics Cana da in
defining CMAs and CA s (Statistics Canada 1997). That is, use the most populated
areas as “cores” (or “hubs”) and assign surrounding areas to these “cores” based
on some measure of integration between those regions and the cores (a hub and
spoke approach, in some sense). Such a process has already been developed by
Statistics Canada for developing such regions in urban areas, but not for other rural
areas. Figure 1 presents a specific process in the form of a flow chart which can be
used to define such “natural” markets in rural regions and using an automated GIS
program. Although difficult to interpret without careful review, this demonstrates
both the power of today’s GIS too ls in being able to automate such a process as
well as the complexities involved in enabling the organisation to take advantage
of this power. This process is simplified in that distances alone are used as a
measure of integration be tween regio ns -- though this co uld be enh anced with
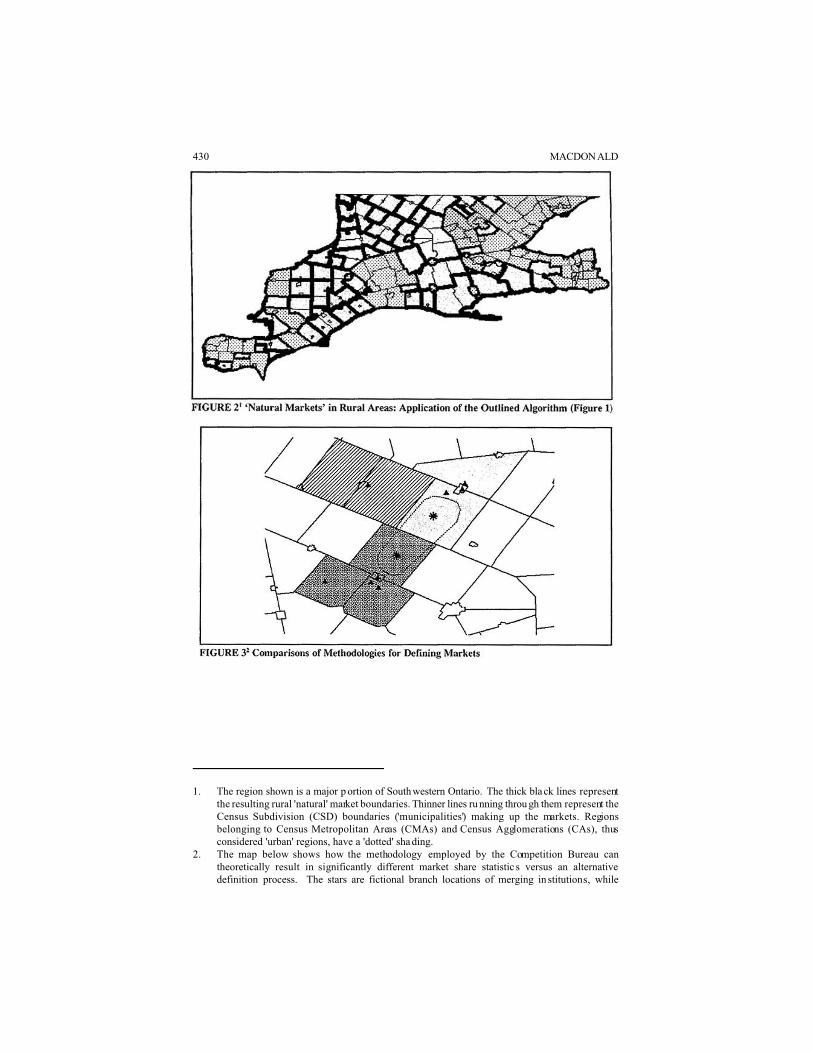
greater data availability. Figure 2 shows the regions which result after a GIS
program written in ESRI’s ArcView software (using the “Avenue” programming
language) is executed. It performs the process described in Figure 1.
Figure 3 demonstrates how following such a process (a “natura l market”
approach unaffected by which particular organisations are being reviewed) can
differ versus rural markets created by using the basic approach employed by the
government for merger review. Note also the significant differences in market
share figures which can result, with the govern ment’s proc ess almost alw ays
resulting in an inflated market share figure for the institutions proposing a merger.
This alternative process is first presented in this section merely to demonstrate the
theoretical issues involved and where GIS is applied in carrying out a market
definition process. It represents a potential improvement, given that the govern-
ment wishes to main tain both its current urban definitions (the CMAs and CAs),
and its desire to keep the process simple by using non-overlapping polygons as
markets. It is not necessarily proposed as i deal. As discussed in the previous
section on trade areas, polygon-based market definitions, which split market
compo nents into those “com pletely in” or “c ompletely out” of the market, do not
generally rep resent the true m arketplace very well.

428 MACDONALD

GIS IN BANKING 429
430 MACDONALD
1. The region shown is a major p ortion of Southwestern Ontario. The thick black lines representthe resulting rural 'natural' market boundaries. Thinner lines ru nning throu gh them represent theCensus Subdivision (CSD) boundaries ('municipalities') making up the markets. Regionsbelonging to Census Metropolitan Areas (CMAs) and Census Agglomerations (CAs), thusconsidered 'urban' regions, have a 'dotted' sha ding.
2. The map below shows how the methodology employed by the Competition Bureau cantheoretically result in significantly different market share statistic s versus an alternativedefinition process. The stars are fictional branch locations of merging in stitutions, while
GIS IN BANKING 431
triangles represent branches of other institutions not involved in the merger proposal. TheBureau approach could produce a market simi lar to that indicated by th e dotted line, rather thanthree separate natural markets.
Metho dologies for D uplicating the C anadian G overnmen t’s
Mar ket Definition Pr ocess
The above discussion should be given consideration when a bank is evaluating
issues of market d ominance for itself, but in practical terms it is advisable that the
institution attempt to match the process currently being enforced -- a virtually
impossible task without the aid of GIS. Given what is known about how the Com-
petition Bureau defines markets, it is possible to use GIS to ac tually duplicate this
same general proc ess. Thus, through a combination of popular GIS and database
software, an extremely tedious month-long process involving inspection of branch
locations and municipality locations can be converted into one computer program
me executed w ithin a couple of minutes. T he proce ss is used for rura l markets
alone (given that CM As and C As are used to defined u rban mar kets), and is
described below, this time without the flowc hart represe ntation.
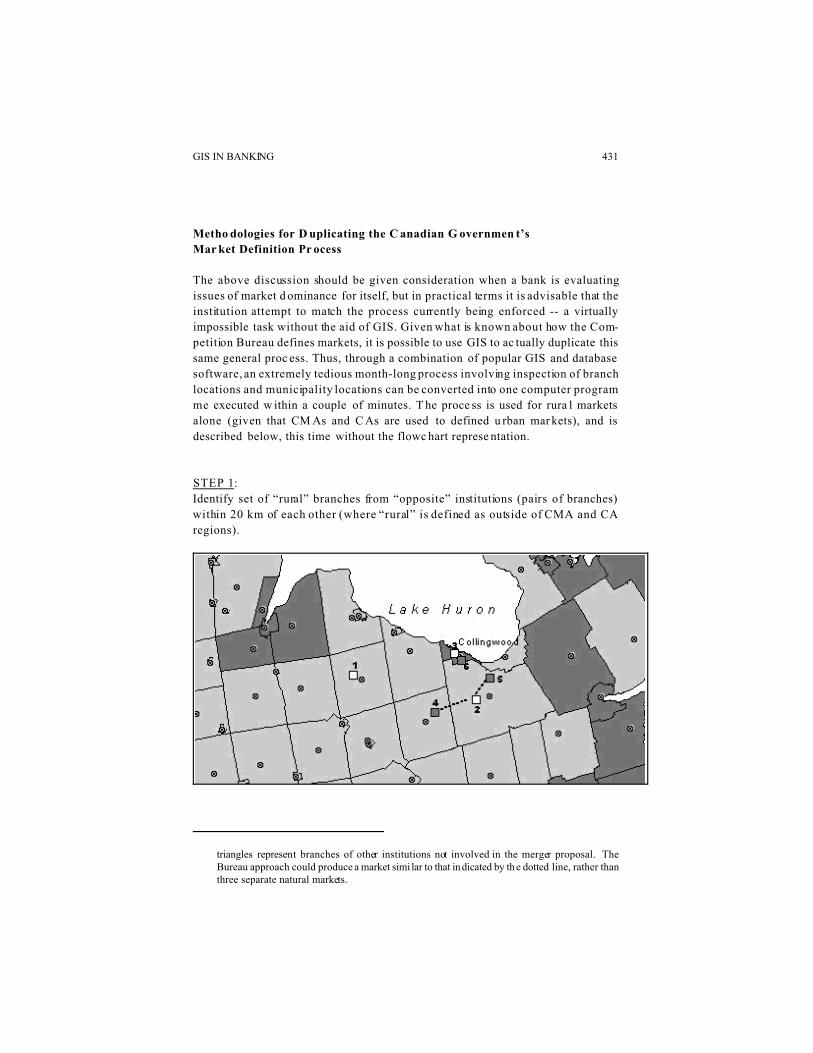
STEP 1:
Identify set of “rural” branches from “opposite” institutions (pairs of branches)
within 20 km of each other (where “rural” is defined as outside of CMA and CA
regions).

432 MACDONALD
The above graphic depicts Census Subdivisions (CSD s) for a region surrounding
Collingwood, Ontario, Canada. Darker zones represent urban municipalities
(within CA or CMA regions), and circular markers represent population-weighted
“centroids” of the CSD s. Assume the square ma rkers are br anches, with wh ite
squares belonging to one institution an d grey squa res belong ing to the other
institution with which the first is considering merging. Only two pairs of branches
would be selected for step 1, as indicated by the dotted lines joining 2 with 4 and
2 with 5. Branch 1 is more than 20 km from branch 4 and branch 4 represents the
same institution as branch 5, so these pairs are not selected. Branches 3 and 6 are
both within the “urban” zone representing the Collingwood CA, so they are not
paired together or with any other b ranches.
STEP 2:
Extract distinct pairs of branches from set created in step 1 using an iterative
process of selecting branches closest to each other in same municipality and
eliminating all others also within 20 km of either of those br anches.
In the graphic above, the pair made up of branches 2 and 5 are selected first,
based on proximity, and the pair comprised of 2 with 4 is eliminated.
STEP 3:
Create 20 km buffer zones around the set of branch pairs from Step 2.
The distance of 2 0 km used for the buffer zo ne represe nts the best estimate of what
the government uses in its own m arket definition process, fro m person al experi-
ence and the few com ments pub lished by the go vernment.

GIS IN BANKING 433
STEP 4:
Create Census Su bdivision (CSD) population-weighted “centroids”, based on
Enumeration Are a (EA) level pop ulations.
The CSD centroids, shown in the above graphics, can be generated by weight-
ing the geographic locations of the EAs making up each CSD according to popula-
tion. The “centroids” of the EAs (geographic centre points of their boundaries) and
their populations can be obtained directly from Statistics Canada.
STEP 5:
Determine, for each buffer zone, which rural CSDs fall into the zone.
In the above graphic, three rural CSDs would be identified for the one buffer
zone. These wo uld be store d in a separ ate table, alo ng with the buffer zone to
which they belong. W hen the pro cess is performe d nationally, this will likely re sult
in a huge list of CSD codes matched to buffer zones, the latter of which can be
coded via the largest CSD or assigned some kind of pseud o ID numbe rs. These
coded zones now represent the initial set of government-defined “markets”, and
each consist of a set of CSD regions (versus the oval-shaped buffer zones them-
selves). Overlaps between these initial markets still need to be resolved before they
are finalised.
STEP 6:
Merge markets resulting from step 5 above which involve an overlap of at least
half the population of one o f the markets.
Since there may be more than tw o markets each overlapping at least one of the
others in a regional cluster, this process does not simply involve looking at isolated
pairs of overlapping markets. Thus, an iterative process is used to determine the
procedure for m erging markets. For each iteration, the pair of markets involving
the highest percentage overlap of population are merged first. For “ties”, the pair
of markets w hich involves the smallest po pulation is cho sen first. These markets
are merged together, and treated as one market before the next iteration. The
process continues until no markets have more than half of the populati on over-
lapped by another m arket. This, o f course, can still leave mark ets which overlap
slightly.
STEP 7:
Allocate ea ch municip ality (CSD) within a region shared by d ifferent markets to
one and only on e market, ba sed on sho rtest distance to the nearest branch from
branch pair.
In this step, minor overlaps are resolved by splitting up the overlap regions
and allocating subregions among the identified markets. Each market has an
original associated pair of branches from the earlier steps of this process. During
the merging of markets, the “more overlapped” markets were merged into the
other (the latter can be considered the “primary” or “receiving” original market

434 MACDONALD
region for the new expanded region). It is the pair of branches from that region
which is retained for the purpose of step 7 here.
Market Share Estimation through GIS
The Spatial Interaction M odel:
Institution by Institution Market Share Estimation
Recall, spatial interactio n models like the one de monstrated in this section typi-
cally involve prediction of customer interactions based on distances and indicators
of store or branch attractiveness. As banking institutions do not have extensive
attribute data about competitors, indicators of branch attractiveness (the ability for
the branch to draw customers versus other branches) would have to be derived
from surrog ate informatio n such as the fo llowing exam ples:
< The number of staff, or floor space, of the nearest branch b elonging to o ne’s
own institution. This indicator offers potential value only in cases where
branches of the same size tend to be located together in space, and there is
almost always a bran ch for one’s o wn institution not far away from each
compe titor.
< Retail sales levels existing within close pr oximity to the branch. Business
activity data can be used to estimate retail presence within the immedia te
vicinity of each b ranch.
< Hours of service. Using individual web sites of banking institutions, it is
possible, though tedious, to extract total weekly branch hours of service for
each and every branc h.
< Institution “type” indicator (or “ratings”). It is possible to provide subjective
ratings for branch es accord ing to the type o f banking institution they repre-
sent. For exam ple, a major bank branch can be given a higher “rating” versus,
for example, a local credit union, knowing that the typical bank branch tends
to draw significa ntly more pe rsonal dep osits than the typic al credit union .
The particular model presented here for demonstration purposes uses the same
attractiveness score across all branches, although experimentation with other
indicators of attractiveness such as those listed abo ve may yield stronger results.
The market share estimates are derived from a “produc tion-constrain ed (Huff
based) spatial interaction model” (L ea 1990 ; see above ), in which the ob jective is
to estimate the pe rcent of the m arket in an area (in this case, an enumeration area
or EA) banking at eac h of a number of financial (FI) institutions. Thus, p ij =
estimated percentage of market in enumeration area (EA)i ban-king at financial
institution (FI)j , or

GIS IN BANKING 435
where
A j = Attractiveness of site FIj;
d ij = Distance (separation) from EAi centroid to site FIj;
" = Calibration constant for attractiveness; and,
$ = Calibration constant for distance
For the model, straight line distances were used, and calculated as the dis-
tances between population-weighted EA centroids and the branch locations. The
level of demand (“outflow from origins”) was represented by total aggregate
interest income of taxfilers in the neigh bourho od, adju sted for differe nces in
daytime population in relation to Census population (interest income reweighted,
such that figures will still add up to the correct total across all markets, for non-
overlapping markets). T his was a cho ice based on some b asic analysis of available
industry consumer deposit balance data in relation to demographic data, which
suggested that using this statistic gave a reasonable indicator of depos it volumes
when dealing with reg ions for which only the demographic data were available.
And again, further analysis of what measure to use to indicate market demand for
the selected product is part of the proc ess of develo ping such a m odel, and better
indicators are certainly possible. The taxfiler data used in this model have been
aggregated directly to the EA level, by Statistics Canada, from the original raw
data at the postal code level (normally only available to the public at higher levels
of geographic aggregation than the EA level). For each of the 101 regions for
which actual market share data were available, the data (or “market”) being allo-
cated is restricte d to that imm ediate regio n.
For each model, the attractiveness parameter (") was set to 0.8 , while the
distance parameter ($) was set to 1.2. While these should be determined from
rigorous calibration efforts, in this study they have been estimated -- for example,
from tests perform ed on dista nce deca y for F.I.R.M . customers. F or this model,
attractiveness scores are eliminated (replaced merely with 1’s in the equation).
Thus, when allocating the demand within a particular enumeration area to different
branches, a calculation of (10.8 / distance1.2) was made for each branch in relation
to the EA.
In the following diagram, assume the shaded region is an enumeration area
with a total demand of 4,000 “units” and a geographic centroid indicated by the
circular marker. Assume also that the squares are branches, and that the numbers
indicated on the line segments represent distances to the EA centroid in some kind
of units.

436 MACDONALD
For this scenario, the expected proportion of demand “interacting with” branch C,
with dx representing the distance fro m the EA centroid to branch x, wo uld be equal
to
Similarly, the proportions are 60.1 %, 26.2 % and 5 % for b ranches A, D and B
respectively.
In order to arrive at a predicted market share figure for a particular institution
in the market, the propor tion of dem and from e ach EA is multiplied by the actual
demand and then allocated accordin gly. Each branch will then have been allocated
a certain volume of demand from various EAs. These branch-level demand figures
are then totaled across all of the institution’s branches in the market for the numer-
ator. The denominator is the total for the entire market of the statistic used to
indicate demand level. Since indicators of demand are being used in place of true
demand figures for each EA, the total demand figures across all branches in the
market will represent some ratio of the total tru e deman d in the market. O rdinarily,
a spatial interaction model used to predict demand (or business volumes) will be
formulated such that total predicted demand across all service locations in the
market equates to total actual demand in the market. A multiplier is used in these
cases when they are not equal. For the models in this paper, since market share
(percentage) is being pred icted, and the predicted totals will equate to actual totals
(100 %), a multiplier is, in effect, being used.
GIS software is heavily leaveraged to perform the millions of required dis-
tance calculations between all combinations of enumeration areas and bank branc
hes, and to generate the geographic, population-weighted “centroids” for enumera-

GIS IN BANKING 437
tion areas beforehand. For the purpose of this paper, this model was executed by
allowing such a GIS programme to run for an overnight period to obtain model
results. Overnight processing is a frequent oc currence fo r organisatio ns taking full
advantage of the powers of GIS.
Testing the Methodologies
Evaluating the Spatial Interaction Model
In order to evaluate the results of the model, it was necessary to use the individual
branch level figures generated by the model (the demand “allocated” to each of the
branches) to produce market share data for only one institution (the F.I.R.M.) for
which true market share figures we re available. A number of measures were then
used for evaluation. In each case, the figure applies to the set of 101 regions used
in the mode l. Again, these regions represent those for which the author has ob-
tained actual personal deposit market share figures for one institution. They also
represent the same typic al sizes of mark ets as would b e the case in a re al world
scenario, with most representing C MA or C A definitions. These selected figures
involve comparison of the F.I.R.M. market share predicted by the model versus the
actual F.I.R.M. market share, and do not necessarily represent the most ideal
measures, but rather a sa mple of so me that have been typic ally requested within
the workplace environ ment of a major Ca nadian bank. Th ey are as follows:
< The overall R 2. Calculated using the set of predicted market share figures from
the spatial interaction model (across all markets) in relation to what is being
used as the set of actual market share figures.
< The R2 with the 5 regions involving the most error removed -- that is, the R2
with “outliers” removed.
< R2 values, with records for Alberta and Qu ebec remove d. Each of these
provinces involve incorporation of “non-banks” in the denominator for the
actual industry d ata used (and there is no way to parse them out). This is not
the case for an y other pro vince.
< R2 with “irrelevant”, or “non-problem”, markets removed. “Non-problem”
markets are those in which no two banks have a combined market share
greater than 35 %. Since error in a prediction which is too low for a “non-
problem” market does not generally cause incorrect assumptions about actions
which need to take place in the market (in order to resolve a competition
problem), the models were evaluated with these records removed.
< Percentage of regions in the “correct category” (“problem” versus “non-prob-
lem” categories). S ince a goal is to identify a set of p roblem markets and
determine what might need to be don e about it, this is another good indicator.

438 MACDONALD
TABLE 1 Model Results: Selected Figures using Given “Predictor” of Personal Deposits Share
CBA-Reported Branch Share Market Share Predicted by Model
R2 21.3% 49.6%
R2 excluding ‘worst’ 5 28.7% 49.5%
R2 excl. Alta. & Que. 53.1% 46.0%
R2 excl. ‘irrelevant’ 82.0% 67.6%
% in Correct Category 65.3% 81.2%
National % above Actual 19.7% 2.1%
% within 3 of Actual % 41% 63%
< Overall error in the national average market share. This indicates, on average,
whether predictions were too high or low, and by how much. It is not an
indicator of quality, of course, since large positive and negative errors become
cancelled o ut.
< Percentage of markets for which predicted share was within 3 % of true share.
This measure is more “forgiving” for a model which is consistently incorrect
by at least one or two full percent, but significantly incorrect for very few
markets.
The results are summ arised in T able 1. R 2 values of ab out 70 % are desirab le
in models used for predictive purposes. Although these results do not reflect such
a level in most cases, it should be kept in mind that the types of model discussed
here (spatial interaction models), particularly those involving the allocation of
small geographic units for the entire country of Canada, typically involve long
development (calibrating) p eriods by m any staff memb ers using con siderable
processing power. The model here is presented primarily to demonstrate the
process. The results should still, however, help in evaluating the development of
such a model based on GIS for this particular purpose. For reference purposes, the
same figures are calculated using reported share of branch locations (number of
branches in the market for the selected institution as the percentage of number of
all institutions’ branches) as a predictor of personal deposit share.
Evaluating the Market Definition Methodology: A Merger Between TD Bank and Canada Trust
Recall the aim of the GIS-based procedure for defining markets outlined above.
It was to try to match the geographic markets which would be defined by the
government (the Competition Bureau) when it completes its lengthy process of
defining markets through predetermined guidelines for a given merger review.
Thus, to test this methodology, actual results of a merger review for a merger
proposal made between the Toronto-Dominion Bank and Canada Trust (von

GIS IN BANKING 439
Finckenstein 2000) a re used. A listi ng of the markets defined by the Bureau for
this merger p roposal w as fortunately m ade pub lic to facilitate this test.
As indicated previously, CMAs and CAs were used for urban markets, and
rural markets were defined as in Figure 2. The results conformed closely to the
Bureau ’s markets. From the Competition Bureau’s letter made public, “in rural
areas, the Bureau examined the competitive environment of all Toronto-Dominion
and Canada Trust branches within 20 kilometres of each othe r. Using this criteria,
Toronto-Dominion and Canada Trust operations overlap in 11 rural markets” (von
Finckenstein 2000). T he list of rural markets, and whether or no t each was also
identified successfully by the proposed G IS programm e, is as follows:
"Bureau Market" Name Province Created via GIS
Metho dology?
Dunnville Ont. Yes
Fergus Ont. Yes
Ingersoll Ont. Yes
Kirkland Lake Ont. Yes
Norwich Ont. Yes
Wilmot Ont. Yes
Amherstburg Ont. Yes
Bridgewater N.S. Yes
Hanover Ont. Yes
Kerns Ont. No
Parksville B.C. Yes
Unfortuna tely, there were no other data available, for this merger proposal, which
allowed the testing of the actual definitions of these markets. But based on previ-
ous exposure by the author to actual market definitions generated by the Bureau,
the definitions themselves appear relatively close. It should be kept in mind that
there is also the possibility that discrepancies result simply because either the
branch location da ta collected by the gover nment or tha t collected b y the author
is in error.
Conclusions
The results show that the spatial interaction models can produce better estimates
of market share than those resulting from use of reported branch locations, but
under lengthier development efforts than those involved for this demonstration.
For efficiency, the simple spatial interaction model dem onstrated here almost
complete ly omitted the use of attractiveness indicators and calibration p rocedures,
two very important components of any of these types of models. Yet, the model

440 MACDONALD
still generated fairly useful results. Thus, even with all the simplifications and
assumptions, the appro ach seems quite prom ising. The p aper has d emonstrate d, in
fairly straightforward fashion, how such spatial m odeling tech niques can b e devel-
oped. By using these concep ts as a starting point, and applying time and resources
toward making imp rovemen ts, a powerful m odel for p redicting ma rket share would
likely result.
The most significant potential improvement to the spatial models wou ld
almost certainly rest with the competitor branch attribute information, where there
is not enough directly related items of data available for other competitors’ branc
hes. In the case of proposed mergers, which involve huge expenses (legal, and so
forth), it would seem to be worth the time and effort for a large banking institution
to use its resources stationed throughout the country to survey local competitive
branches. Extremely valuable data can be collected in a relatively short time,
perhaps even through a quick, two-minute assessment at each location. This can
involve simply recording scores based on only the most obviou s key attributes,
such as overall branch size, overall appearance or environment, ap proxima te
number of parking spaces and accessibility. Without additional branch informa-
tion, the model simply estimates the business volumes which should be generated
based on where branches are located in relation to the market. This takes many
very key factors in determining market share out of the equation, such as level of
marketing activity, quality of staff and prices (rates) offered.
In the case of personal depo sits, even using share of branches as a proxy for
market share is not alto gether inacc urate, and ca n be used in place of generating
such a spatial interaction model as demo nstrated ab ove if time is simp ly unavail-
able. This would imply that the major Canadian banking institutions tend to offer
similarly sized service outlets, on ave rage, throug hout different regions of the
country (at least in terms of retail deposit-related services), which likely is not
altogether wrong. Howev er, there is enough error associated with using these
simple branch count statistics as market share estimates (and enough importance
associated with the task) to warrant d evelopm ent of more robust me thodolog ies in
most cases. T his is especially true when one starts to analyse other product mar-
kets, where num ber of bra nches bec omes a less u seful indicator of true market
share.
Most importantly, the research demonstrates how GIS can be play an integral
part in helping a financial institution plan more adequately for competition laws
related to merger a ttempts. It shou ld be kep t in mind that the a im for this paper was
not to present a working model which can successfully be transferred to the real
world, but rather to demonstrate the processes and concepts involved in making
the corresponding initiative a success via GIS. As made evident, how-to lessons
in performing some of these GIS-oriented steps through various software packages
was avoided in order to p ermit a focus o n outlining the ap plication itself in simple
terms. Fairly detailed steps have been developed which serve as guidelines for the
types of work and costs involved for such complex processes -- a necessary stage
before getting to the point where the actual steps are carried out within the soft-
ware environme nt. It is worth noting also tha t valuable knowledg e about m arkets

GIS IN BANKING 441
and customer behaviour can b e gained by perform ing such GIS based analyses,
even if successful predictive models are not developed. The speed at which other-
wise lengthy, tedious tasks can be performed using these types of methodologies
is a tremendous ben efit -- the market definition process is an excellent example of
this. Furthermore, these methodologies need not be limited to the narrow scope of
merger planning. Many of the concepts and methodologies contribute almost
equally to the understanding of how GIS can assist other important applications for
retailers, such as selecting new store sites or evaluating the impact of changes to
the branch system of financial institutions.
References
Bailey, T.C. and A.C. Ga trell. 1995. Interactive Spatial D ata Ana lysis. New York:
Longma n Scientific & T echnical.
Cardwe ll, W. 19 97. The Functional Reconfiguration of a Financial Services
Delivery Network: Consumer Activity Based Spatial Interaction Modeling
Applied to an Alternative Approach to Delivery Planning . Report 97-7.
CSCA Research Toron to: Ryerson Polytechnic University.
C.D. Howe Institute. 1998. “The Changing Rules of the Money Game: Proceed-
ings of a Roundtable on Canada’s Financial Industry after the Bank Merger
Proposals”. C.D. H owe Institute Commentary 113, edited by William B.P.
Robson.
Departm ent of Industry. 1 991. Merger En forcement G uidelines. Ottawa: Su pply
and Services Canada.
_______. 1997. “Merger Enforcement Guidelines as Applied to a Bank Merger”.
Submission of the Director of Investigation and Research, Competition
Bureau, to the Task Force on the Future of the Canadian Financial Services
Sector. Ottawa: Supply and Services Canada.
ESRI. 1996. Using ArcView GIS. Redlands, CA: Environmental Systems Research
Institute Inc.
Fotheringham, A.S. and M .E. O’Ke lly. 1989. Spatial Interaction M odels: Formu-
lations and Ap plications. Dordrecht, N etherlands.
Haynes, K.E. and A.S. Fothe ringham. 1 984. Gravity and Spatial Interaction
Models. Beverly Hills, CA: Sage P ublications.
Horstmann, I.J., G.F. Mathewson and N.C. Quigley. 1996. “Ensuring Competition:
Bank D istribution of Insu rance Pro ducts”. Obs., 40. C.D. Howe Institute.
Jones, K. and J. S immons. 1 990. The Retail Environment. London , UK: Rout-
ledge.
Lea, A.C. 1989. “An Overview of Formal Methods of Retail Site Evaluation and
Sales Fore casting: Part 1 ”. The Operational Geographer, 7: 8-17.
_______. 1998a. “Trade Areas: Co ncepts, No t Polygons” . Business Geo graphics,
6: 18.
_______. 1998b. “Misuses and Abuses of the Trade Area Concept”, in GIS ‘98/RT
‘98 Pathways to Knowledge Integration: Conference Proceedings. Fort

442 MACDONALD
Collins, CO : Adams/G IS Wo rld Inc., pp. 1 40-143 .
_____ __. 199 9. Alternative Appro aches to Estimating Market Share, in E. Price
(ed.). Toronto: Custom Research Department of Compusearch M icromar-
keting (now MapInfo/Compusearch).
Lea, A.C. and G.L. Menger. 1990. “A n Overvie w of Form al Metho ds of Retail
Site Evaluation and Sales Forecasting: Part 2, Spatial Interaction Models”.
The Operational Geographer, 8: 17-23.
_______. 1991. “An Overview of Formal Methods of Retail Site Evaluation and
Sales Forecasting, P art 3: Loca tion-Allocatio n Mod els”. The Operational
Geographer, 9: 17-26.
McFetridge, D.G. 1998. Competition Policy Issues. Research Paper Prepared for
the Task Force on the Future of the Canadian Financial Services Sector.
Catalogue no BT22-61/3-1998E-2. Ottawa: Department of Finance.
Neave, E.H. 1996. “Canadian Financial Regulation: A System in Transition”.
Comm entary , 78. C.D. Howe Institute.
Neave, E.H. and F. Milne. 1998. “Revising Canada’s Financial Regulation : Analy-
ses and Re comme ndations”. Commentary, 101. C.D. Howe Institute.
Simmons, J., S. Kamikiha ra and D . Tenenb aum. 199 8. Analyzing M arket Share in
Canadian Cities. CSCA Research Report 9 8-5. To ronto: Ryer son Polyte chnic
University.
Statistics Canada. 1993. Geography Guide Book. Catalogue no 92-310E. Ottawa:
Industry, Science and Technology Canada.
_______. 1997. 1996 Census Dictionary. Catalogue no 92-351-XPE. Ottawa:
Industry Canada.
Task Force. 1 998. Report of the Task Force: On the Future of the Canadian
Financial Services Sector. Catalogue no BT22-61/1 998E . Ottawa: D epart-
ment of Finance.
von Finckenstein, K. 2000. Letter to CEOs of Toronto-Dominion Bank and Cana-
da Trust Company on conclusions of the Competition Bureau’s ( Industry
Canada) review of the banks’ proposed merger. January 28.