gis-based evaluation of multifarious local renewable energy...
TRANSCRIPT

ARTICLE IN PRESS
0301-4215/$ - se
doi:10.1016/j.en
�Correspond53213.
E-mail addr
Energy Policy 34 (2006) 730–742
www.elsevier.com/locate/enpol
GIS-based evaluation of multifarious local renewable energy sources:a case study of the Chigu area of southwestern Taiwan
Cheng-Dar Yue�, Shi-Sian Wang
Department of Resource and Environment Studies /Department of Asset Science, Leader University, No. 188, Sec. 5, An-Chung Rd., Tainan 709,
Taiwan, ROC
Available online 28 August 2004
Abstract
The issue of regulating greenhouse gas emissions of developing countries is one of the main reasons for the US’s retreat from
ratifying the Kyoto Protocal, and this deserves particular attention in order to ensure that a robust international climate policy
exists in the future. Enabling developing countries to move toward low-carbon energy systems would enhance the feasibility for their
participation in mitigating greenhouse gas emissions. This study evaluates wind, solar, and biomass energy sources in a rural area of
Chigu in southwestern Taiwan by means of analyzing technical, economic, environmental, and political implications in order to
establish an evaluation model for developing local renewable energy sources. The adopted approach evaluates local potentials of
renewable energy sources with the aid of a geographic information system according to actual local conditions, and allows the
assessment to consider local potentials and restrictions such as climate conditions, land uses, and ecological environments, thus
enabling a more-accurate assessment than is possible with evaluations on an approximate basis. These results may help build a
developmental vision for sustainable energy systems based on locally available natural resources, and facilitate a transition of
national energy and environmental policies towards sustainability.
r 2004 Elsevier Ltd. All rights reserved.
Keywords: Renewable energy; Potential evaluation; Geographic Information System
1. Introduction
The issue of global warming is becoming a greatchallenge which the international community must facein this century. The latest report of the IPCC (Inter-governmental Panel on Climate Change) in 2001indicated that development heavily relying on fossil fuelenergies will raise global mean temperatures by about4.5 1C during the 21st century. Only with a transitiontoward a low-resource-consuming economy and the useof clean energy sources and technologies will it bepossible to mitigate temperature increases to about 2 1C(IPCC, 2001). In other words, cutting energy consump-
e front matter r 2004 Elsevier Ltd. All rights reserved.
pol.2004.07.003
ing author. Tel.: +886-627-62801; fax: +886-625-
ess: [email protected] (C.-D. Yue).
tion and facilitating a transition of energy structurestowards renewable energy sources have become neces-sary alternatives for humanity in order to stabilize theglobal climate system. This holds for both developedand developing countries.
Substituting fossil fuels with renewable energy sourcesis regarded as a significant measure for cutting globalcarbon emissions (Brown, 2003; Houghton, 1997; IPCC,2001). Full use of these sources can help mitigate globalwarming in environmental terms, meet energy needs ineconomic terms, and provide employment for ruralareas in socioeconomic terms (Thothathri, 1999;UNCSD, 2002; Yue et al., 2001). All these indicatetheir sustainability for global and local development. Inaddition to a legislative framework set at the nationallevel for their promotion, locally based evaluations fordeveloping renewable energy sources can provide a vital

ARTICLE IN PRESSC.-D. Yue, S.-S. Wang / Energy Policy 34 (2006) 730–742 731
basis for evaluations at the national level, and thusenhance political effectiveness.
In this context, this study attempted to investigatethe Chigu area of southwestern Taiwan as an example,and to establish a procedure for evaluating localrenewable energy sources. With geographic informa-tion system (GIS)-based analyses, multifarious renew-able energy sources were evaluated according to actuallocal land uses in order to provide more-integratedand accurate decision-making information for policy-makers and investors. The established model may helplocalities explore their exploitable resources, and thiscan possibly be expanded to conduct comprehensivesurveys at the national level in order to estimate theentire potential of a country. These represent indis-pensable information for decision-making in order tobuild a sustainable energy system which enhancesclimate protection.
Fig. 1. Geographic location of the Chig
Fig. 2. Land use zo
2. The study area and analysis of its renewable energy
sources
The study area of Chigu is located in the southwesterncoastal region of Taiwan, as depicted in Fig. 1. Theregion of Chigu covers an area of 12,560 ha, andcontains a population of 25,769 currently. The absoluteelevation in the entire area is no more than 10m, whilethe average gradient is less than 5%. An ordinaryagricultural area is located in the western part of theregion (Fig. 2). This area has mostly been exploited asfish farms for many decades, among which many arefalling into disuse. Overexploitation of groundwater forfish farming has since long led to land subsidence. The‘‘special agricultural area’’ is cropland of good quality,and is used for food production. The main habitat whereover half of the known population of the globallyendangered migratory bird, the Black-faced Spoonbill
u region in southwestern Taiwan.
ning at Chigu.

ARTICLE IN PRESSC.-D. Yue, S.-S. Wang / Energy Policy 34 (2006) 730–742732
(Platalea minor), overwinters is located in the south-western part of Chigu, and has been designated a‘‘Wildlife conservation area’’. These birds migrate southfrom northeast Asia to Chigu in autumn every year, andmigrate north from this region back to northeast Asia inspring the following year. The reasons for selecting thislocality for the case study are as follows:
�
There is relatively excellent wind potential due to itslocation along the coast; � There is ample insolation in the southwestern regionof Taiwan for the exploitation of solar energy;
� A low population density in this rural area providesgood conditions for the development of wind energyand biomass;
� The local government intends to exploit renewableenergy sources and requires information related totheir evaluation; and
� Reconciliation between the development of renewableenergy sources and protection of habitat of endan-gered species can be addressed by this case in order toexplore possible solutions.
Among various renewable energy sources, windenergy presents a particularly promising value forapplication due to its technological ripeness andrelatively low cost at present (Brown et al., 2002; IPCC,2001). A recent study indicated excellent wind potentialin the western coastal areas of Taiwan in spite of thelack of effective policies for promoting its development(ECROC, 1999b).
Biomass is regarded as an ideal complement to windenergy, because it not only can coexist with windturbines in terms of land use, but it also complementswind energy in compensating for longer calm times.Photovoltaics also present a significant potential whenconsidering ample insolation year round in southernTaiwan. One disadvantage is its current high costs, but itis expected that they will continue to drop in the future.In the context of these climatic and technological consi-derations, this study evaluates the wind, biomass, andphotovoltaic energy based on local wealthy resources.
1In treating the probable disturbance of wind turbines on the habitat
of birds, a setback of 200m from bird habitats is generally
recommended. In the case of a conservation area for birds particularly
worthy of protection, a distance of 500m would be maintained. Since
the endangered Black-faced Spoonbill is categorized as a bird
particularly worthy of protection, a setback from the conservation
area of 500m is adopted here in order to retain a sufficiently wide
buffer zone between the wind turbines and the conservation area.2Building lot size generally accounts for approximately 70% of
settlement areas exclusive of road areas in non-urban areas in Taiwan.3The building coverage ratio of building lots in non-urban sites on
average is not allowed to exceed 60% in Taiwan.
3. Methodology for evaluating energy potentials
The methodology used for evaluating the potentials oflocal renewable energy sources was as follows.
3.1. Wind energy
According to recommended guidelines for windturbine installation (DWIA, 2003a; ECROC, 1999a;ITRI, 2001; Kaltschmitt and Wiese, 1994; Voivontaset al., 1998), the evaluation in this study was conductedby the following procedure.
(1)
The potential was evaluated under the considerationof the following restrictions: � A minimum allowable wind speed of 4m/s; � A minimum distance from urban planned districts of500m;
� A minimum distance from villages of 250m; � A minimum distance from wildlife conservationareas of 500m;1
�
A minimum distance from forests of 250m; and � A minimum distance from ecologically sensitiveareas of 250m.
(2) The following areas were not considered for theinstallation of wind turbines:
� Floodplains and � Roads(3)
The distance between wind turbines was set as threetimes the rotor diameter, calculated using the VestasV80 wind turbine with a diameter of 80m and arated capacity of 2MW.(4)
Annual output was calculated with mean wind speedand roughness class 1.5 by means of the ‘‘WindTurbine Power Calculator’’ from the Danish WindIndustry Association (DWIA, 2003a).3.2. Photovoltaics
The installation area was set to be 25% of the rooftoparea of buildings to calculate the energy output.
(1)
(Building lot size)=[(Urban planned districts)+(Area of villages)�(Road area in urban planneddistricts)�(Road area in villages)]� 70%.2(2)
(Floor area)=(Building lot size)� (60% of thebuilding coverage ratio).3(3)
The area of installed PV panels was set as (Floorarea) � 25%.(4)
The installation capacity was set as 0.133 kW/m2. (5) The annual output was set at 1540 kWh/kW tocalculate the total annual output.
3.3. Biomass
The potential was evaluated by estimating that half ofthe designated ‘‘ordinary agricultural areas’’ would be

ARTICLE IN PRESSC.-D. Yue, S.-S. Wang / Energy Policy 34 (2006) 730–742 733
planted in sugar cane for energy crop culti-vation, ethanol would be extracted from the sugarcane, and electricity would be generated from thebagasse (Boyle, 1996). Planting sugar cane in partsof the ordinary agricultural areas which are currentlyused as fish farms is intended to search for ways todeal with the many disused fish farms on ordinaryagricultural areas on the one hand, and of mitigat-ing land subsidence due to overexploitation ofgroundwater by aquaculture on the other. Althoughthe fallow area in the ‘‘special agricultural area’’at Chigu currently encompasses 1100 ha and com-prises 40% of the total designated ‘‘special agricul-tural area’’ of 2718 ha, this area is not slated to growenergy crops in this study under the consideration ofreserving good-quality farmland for food production asa priority.
(1)
The following areas will not be considered for use asland area available for planting energy crops as‘‘ordinary agricultural areas’’: � wildlife conservation areas; � ecologically sensitive areas; � a buffer zone from the coastline of 1.5 km consider-ing the salinity of the soil;
� the area planned for a school; and � roads outside of villages and urban planneddistricts.
(2) The area for planting energy crops should be (Landarea available for planting energy crop) � 50% inorder to reserve the scope for agricultural extension,the planting of chemical and technical raw materials,and fish farms.
(3)
Fig. 4. Distribution of mean annual wind speed in Chigu in m/s
(Source: ITRI, 2001).
The annual energy output was calculated accordingto the ethanol yield from the sugar cane planted perhectare and year, and to the energy output extractedper cubic meter of ethanol. Electricity generationwas calculated based on sugar cane yields in tons per
Fig. 3. Distribution of excluded and available areas
hectare per year, and on the electricity generated perton of cane.
4. Results of the potential evaluation
4.1. Wind energy
The excluded and available areas for installing windturbines in Chigu are depicted in Fig. 3. Based on thedata of the annual mean wind speed (Fig. 4), the annualenergy output was calculated and is indicated in Table 1.Totally, about 1178 wind turbines of 2MW of unitcapacity would be allowed to be installed. The total
for installing wind turbines at Chigu.
ARTICLE IN PRESSC.-D. Yue, S.-S. Wang / Energy Policy 34 (2006) 730–742734
installation capacity amounts to 2356 MW. Theseturbines would be capable of generating approximately3255GWh annually.
4.2. Photovoltaics
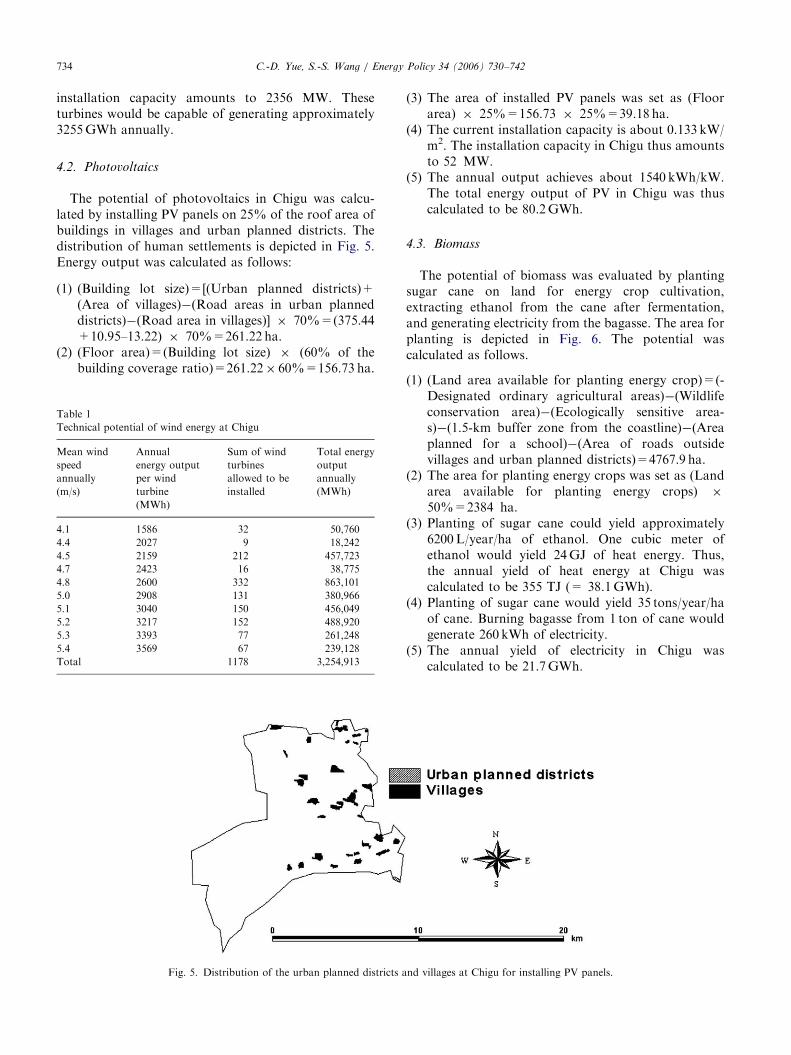
The potential of photovoltaics in Chigu was calcu-lated by installing PV panels on 25% of the roof area ofbuildings in villages and urban planned districts. Thedistribution of human settlements is depicted in Fig. 5.Energy output was calculated as follows:
(1)
Tab
Tech
Mea
spee
ann
(m/s
4.1
4.4
4.5
4.7
4.8
5.0
5.1
5.2
5.3
5.4
Tota
(Building lot size)=[(Urban planned districts)+(Area of villages)�(Road areas in urban planneddistricts)�(Road area in villages)] � 70%=(375.44+10.95–13.22) � 70%=261.22 ha.
(2)
(Floor area)=(Building lot size) � (60% of thebuilding coverage ratio)=261.22� 60%=156.73 ha.le 1
nical potential of wind energy at Chigu
n wind
d
ually
)
Annual
energy output
per wind
turbine
(MWh)
Sum of wind
turbines
allowed to be
installed
Total energy
output
annually
(MWh)
1586 32 50,760
2027 9 18,242
2159 212 457,723
2423 16 38,775
2600 332 863,101
2908 131 380,966
3040 150 456,049
3217 152 488,920
3393 77 261,248
3569 67 239,128
l 1178 3,254,913
Fig. 5. Distribution of the urban planned districts a
(3)
nd v
The area of installed PV panels was set as (Floorarea) � 25%=156.73 � 25%=39.18 ha.
(4)
The current installation capacity is about 0.133 kW/m2. The installation capacity in Chigu thus amountsto 52 MW.(5)
The annual output achieves about 1540 kWh/kW.The total energy output of PV in Chigu was thuscalculated to be 80.2GWh.4.3. Biomass
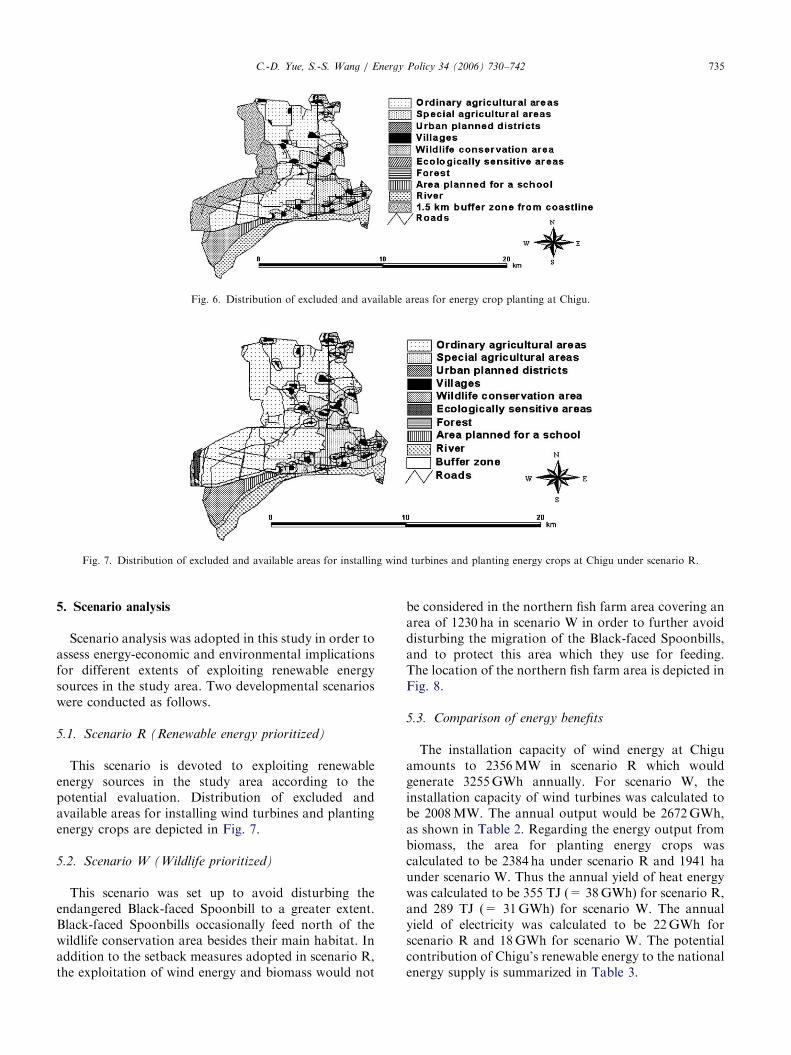
The potential of biomass was evaluated by plantingsugar cane on land for energy crop cultivation,extracting ethanol from the cane after fermentation,and generating electricity from the bagasse. The area forplanting is depicted in Fig. 6. The potential wascalculated as follows.
(1)
(Land area available for planting energy crop)=(-Designated ordinary agricultural areas)�(Wildlifeconservation area)�(Ecologically sensitive area-s)�(1.5-km buffer zone from the coastline)�(Areaplanned for a school)�(Area of roads outsidevillages and urban planned districts)=4767.9 ha.(2)
The area for planting energy crops was set as (Landarea available for planting energy crops) �50%=2384 ha.(3)
Planting of sugar cane could yield approximately6200L/year/ha of ethanol. One cubic meter ofethanol would yield 24GJ of heat energy. Thus,the annual yield of heat energy at Chigu wascalculated to be 355 TJ (= 38.1GWh).(4)
Planting of sugar cane would yield 35 tons/year/haof cane. Burning bagasse from 1 ton of cane wouldgenerate 260 kWh of electricity.(5)
The annual yield of electricity in Chigu wascalculated to be 21.7GWh.illages at Chigu for installing PV panels.
ARTICLE IN PRESS
Fig. 6. Distribution of excluded and available areas for energy crop planting at Chigu.
Fig. 7. Distribution of excluded and available areas for installing wind turbines and planting energy crops at Chigu under scenario R.
C.-D. Yue, S.-S. Wang / Energy Policy 34 (2006) 730–742 735
5. Scenario analysis
Scenario analysis was adopted in this study in order toassess energy-economic and environmental implicationsfor different extents of exploiting renewable energysources in the study area. Two developmental scenarioswere conducted as follows.
5.1. Scenario R (Renewable energy prioritized)
This scenario is devoted to exploiting renewableenergy sources in the study area according to thepotential evaluation. Distribution of excluded andavailable areas for installing wind turbines and plantingenergy crops are depicted in Fig. 7.
5.2. Scenario W (Wildlife prioritized)
This scenario was set up to avoid disturbing theendangered Black-faced Spoonbill to a greater extent.Black-faced Spoonbills occasionally feed north of thewildlife conservation area besides their main habitat. Inaddition to the setback measures adopted in scenario R,the exploitation of wind energy and biomass would not
be considered in the northern fish farm area covering anarea of 1230 ha in scenario W in order to further avoiddisturbing the migration of the Black-faced Spoonbills,and to protect this area which they use for feeding.The location of the northern fish farm area is depicted inFig. 8.
5.3. Comparison of energy benefits
The installation capacity of wind energy at Chiguamounts to 2356MW in scenario R which wouldgenerate 3255GWh annually. For scenario W, theinstallation capacity of wind turbines was calculated tobe 2008MW. The annual output would be 2672GWh,as shown in Table 2. Regarding the energy output frombiomass, the area for planting energy crops wascalculated to be 2384 ha under scenario R and 1941 haunder scenario W. Thus the annual yield of heat energywas calculated to be 355 TJ (= 38GWh) for scenario R,and 289 TJ (= 31GWh) for scenario W. The annualyield of electricity was calculated to be 22GWh forscenario R and 18GWh for scenario W. The potentialcontribution of Chigu’s renewable energy to the nationalenergy supply is summarized in Table 3.

ARTICLE IN PRESS
Fig. 8. Distribution of excluded and available areas for installing wind turbines and planting energy crops in Chigu under scenario W.
Table 2
Technical potential of wind energy in Chigu under scenario W
Mean wind
speed
annually
(m/s)
Annual
energy output
per wind
turbine
(MWh)
Sum of wind
turbines
allowed to be
installed
Total energy
output
annually
(MWh)
4.1 1586 32 50,760
4.4 2027 9 18,242
4.5 2159 212 457,723
4.7 2423 16 38,775
4.8 2600 332 863,101
5.0 2908 131 380,966
5.1 3040 150 456,049
5.2 3217 45 144,746
5.3 3393 77 261,248
Total 1004 2671,611
C.-D. Yue, S.-S. Wang / Energy Policy 34 (2006) 730–742736
6. Economics
6.1. Energy benefits
An analysis of the technical potential for renewableenergy sources in Chigu indicated that wind energy,photovoltaics, and biomass would jointly generate3357GWh of electricity annually under scenario R,covering 1.9% of the 2001 electricity consumption of175,909GWh. As to scenario W, total electricity yieldwould be 2770GWh annually, accounting for 1.6% of2001’s electricity consumption. With regard to the yieldof heat energy, ethanol production from sugar caneplanting would generate about 38 and 31GWh of energyin scenarios R and W, respectively, both of which wouldaccount for about 0.1% of the transport-related oildemand of 57,927GWh for 2001 in Taiwan. Calculatedwith the method of substitution, about 8777 and7242GWh of primary energy supply could be substi-tuted in scenarios R and W, respectively. This equals
2% and 1.7% of the primary energy supply of438,490GWh for 2001.
6.2. Capital costs
As noted above, the installation capacities from windenergy in scenarios R and W are 2356 and 2008 MW,respectively. Based on the current capital cost of windturbines in Taiwan at US$1060/kW (ECROC, 2000), thecapital costs of the wind energy for scenarios R and Ware US$2.5 and 2.1 billion, respectively.
Based on the capital cost of US$6364/kW forphotovoltaics, the installation of 52 MW necessitatesUS$331 million. With regard to ethanol productionfrom biomass, the capital costs are approximatelyUS$0.303/L. The planting of sugar cane on 2384 ha ofland would cost US$4.5 million for scenario R, and on1941 ha of land with US$3.6 million for scenario W.
6.3. Investment incentives
The incentives for investment in exploiting renewableenergy sources in Taiwan are analyzed in Table 4. Thestate-run utility, Taiwan Power Company (Taipower),remunerates electricity from hydropower and windenergy at US$0.062/kWh by a contracted price. Theremunerations recommended in this study areUS$0.062/kWh for wind power, US$0.185/kWh forpower from photovoltaics, and US$0.60/LOE (liter oilequivalent) for ethanol from biomass.
The costs of wind power and ethanol are lower thanthe remuneration, thus we do not suggest that a subsidyfor investment costs of wind power and ethanolproduction be instituted with the aim of spendinglimited public funds on subsidizing other uncompetitiverenewable energy sources like photovoltaics. Subsidiesfor power from photovoltaic are suggested to be set at50% of total investment costs in order to help the

ARTICLE IN PRESS
Table 4
Investment incentives for exploiting renewable energy sources
Source Costs in US$ Suggested remuneration
in US$
Suggested subsidy of
the total investment
costs (%)
Amortization period
(years)
Period over which the
investment is to be
recovered (years)
Wind 0.051/kWh 0.062/kWh 0 13 20
PV 0.329/kWh 0.185/kWh 50 19.7 25
Biomassa 0.529/LOEb 0.60/LOEb 0 9 15
aIncludes only ethanol production from sugar cane planting; electricity generation from bagasse is not included.bLOE: liter oil equivalent; 1LOE ¼ 3:7674� 107 J.
Table 3
Potential contribution of Chigu’s renewable energy to the national energy supply for the reference year 2001
Energy technology Scenario Electricity (GWh) Heat (GWh) Primary energya (GWh) CO2 reductionb (� 103 ton)
Wind R 3255 8463 1888
W 2672 6947 1550
PV 80 208 46
Biomass R 22 38 106 25
W 18 31 86 20
Total R 3357 38 8777 1959
W 2770 31 7242 1616
Share in 2001 (%) R 1.9 0.1c 2.0 0.9d
W 1.6 0.1c 1.7 0.7d
aBy the method of substitution.bCO2-reducing factor: 0.58 kg CO2/kWh of electricity; 0.315 kg CO2/kWh of heat.cThe share of heat energy from ethanol of the heat energy from gasoline consumed for transport.dThe reference year is 2000.
C.-D. Yue, S.-S. Wang / Energy Policy 34 (2006) 730–742 737
uncompetitive photovoltaics penetrate the market in theinitial stage. Under these premises, wind turbines couldbe amortized for 13 years, photovoltaics for 19.7 years,and ethanol from biomass for 9 years. Compared to thelonger periods over which these investment are to berecovered of 20, 25 and 15 years, respectively, it is hopedthat the shorter periods of amortization will provideincentives for investment.
6.4. Comparison of energy costs
Without considering the social and environmentalcosts, wind power generation cost approximatelyUS$0.051/kWh by 1999 in Taiwan. This cost is higherthan that of fossil fuel oil at US$0.048/kWh, coal atUS$0.03/kWh, nuclear energy at US$0.026/kWh, and islower than that of natural gas at US$0.068/kWh, andphotovoltaics at US$0.329/kWh. The costs of ethanolfrom sugar cane planting at US$0.529/LOE are lowerthan the market price of gasoline at US$0.648/LOE.Full use of bagasse residues for electricity generationcould further offset the costs, making this energy cropeven more cost-competitive.
Conventional economic analysis cannot handle costsof pollution and of the depletion of common propertyresources because common property cannot be priva-tized and thus is outside of the market place (Hill et al.,
1995; Tietenberg, 2000; Wenz, 2001). Comparison ofenergy costs without considering the externality ofenergy use is thus misleading. This distortions of costcalculations resulting from externalities can explain whythe costs of electricity from nuclear energy atUS$0.10–0.12/kWh in the US are much higher thanthat at US$0.026/kWh in Taiwan (Owen et al., 1998),although Taiwan’s nuclear power plant was importedfrom the US.
Based on the current energy prices not including theexternal costs of electricity generation, the costs of windpower approximate those of oil, but are lower thanthose of natural gas. Due to the relatively lower costs ofwind power, its exploitation should be prioritizedamong renewable energy sources.
Although the costs of ethanol production frombiomass are currently already lower than those ofgasoline on the market in Taiwan, the obstacles ofsubstituting gasoline with this clean fuel still have to beremoved through market establishment for ethanol asvehicle fuels with institutional promotion. The costs ofphotovoltaics are still high, making it necessary to relyon governmental subsidies for its use. As the costsof this energy source are expected to drop in thenear future, if the external costs of energy utilization canbe internalized, then the subsidies would becomeunnecessary.

ARTICLE IN PRESSC.-D. Yue, S.-S. Wang / Energy Policy 34 (2006) 730–742738
6.5. Finance of subsidies
Governmental interference in markets with subsidiescould be used to correct a distorted marketplace withexternalities (Brown, 2001; Goulder, 2000b). The sub-sidies to utilities are to balance the lower energy pricecompared to the remuneration price, and those forinvestment costs are to be covered in the short term inTaiwan by the following sources:
�
Annual funding of US$91 million arranged from thebudget and dictated by the draft of ‘‘The SpecialAction Plan for a Non-Nuclear Country’’ passed inSeptember 2003 for promoting energy savings andrenewable energy sources; and � Revenue from the fees for preventing air pollutionlevied on gas consumption since 1995.
The long-term funding is suggested to be combinedwith distortion-correcting taxes by means of the follow-ing measures:
�
Expansion of ‘‘The Fees for Preventing and Remedy-ing Air Pollution’’, levied since 1995 for SOx and NOxpollutants, to contain carbon as a pollutant inproportion to carbon contents of various energysources; or
� Taxation of carbon in proportion to the carboncontent of various energy sources.
In implementing either of these measures, partialrevenue could be used to finance cuts in income taxes forlow-income people in order to relax the burden on thepoor while internalizing the environmental and socialcosts of using carbon-containing energy sources (Bar-row, 1999; Goulder, 2000a; Smith, 2000).
7. Environmental benefits and impacts
7.1. Environmental benefits
7.1.1. CO2 reduction
The substitution of fossil fuels by wind energy,photovoltaics, and biomass would reduce pollutionresulting from local SOx and NOx emissions on theone hand, and help mitigate global warming by CO2
reduction on the other. About 0.63 kg of CO2 wasproduced per generated kilowatt-hour in 1998 in Taiwan(Young, 1999). Calculated with a CO2-reducing factorof 0.58 kg CO2/kWh for electricity and of 0.315 kg CO2/kWh for heat (BMU, 1999), about 2 million tons of CO2
emissions could be avoided annually for scenario R, and1.6million tons for scenario W, as calculated in Table 3.In order to respond to implementation of the UnitedNations Framework Convention on Climate Change,Taiwan’s EPA aims to set a target of maintaining
Taiwan’s CO2 emissions in the year 2020 at the level ofthat in the year 2000 with 223 million tons from thepredicted 501 million tons as the reference emissionsamount according to a resolution of the NationalEnergy Conference held in 1998 (Yue et al., 2003). Theannual CO2 reduction of 2million tons based onscenario R would amount to 0.9% of the plannedemissions by 2020, while that of 1.6million tons basedon scenario W would amount to 0.7%.
7.1.2. Protecting agricultural land
Agricultural area is increasingly subjected to pressureof being converted into nonagricultural land due to thedrop of the agricultural output value in Taiwan afteraccession to the WTO. Using ordinary agricultural areasto plant energy crops could protect agricultural landfrom being converted to land for construction and urbanfacilities, and help supplement underground water.
7.2. Environmental impacts
The criterion for evaluating the potential of renewableenergy sources in this study excludes improper areas andsets buffer zones between potentially exploitable areasand sensitive areas in order to consider the environ-mental impacts in the phase of planning. Taiwan’s EPAin 2001 added wind energy proposals to the list of publicand private projects that may require assessment fortheir potential impacts on the environment, while theproposals for exploiting photovoltaics and biomass arenot subject to such requirements. The environmentalimpacts of exploiting related renewable energy sourcesare discussed in the following sections.
7.2.1. Wind energy
According to the pronouncement of Taiwan’s EPA,the proposals for wind energy require an environmentalimpact assessment if the projects are (EPAROC, 2001):
�
sited in a national park; � sited in a wildlife conservation area; � newly established or expanded facilities on urban landwith a generation capacity or cumulative generationcapacity of more than 25,000 kW; or
� newly established or expanded facilities on non-urbanland with a generation capacity or cumulativegeneration capacity of more than 50,000 kW.
There is no national park located in Chigu. Whether itis necessary for wind energy proposals to implement anenvironmental impact assessment depends on the scaleof the project. The potential impacts of exploiting windenergy in allowable areas are discussed in the followingsection.
(1)
Impact on flora and fauna. Under scenario R, thedesignated wildlife conservation area is excluded
ARTICLE IN PRESSC.-D. Yue, S.-S. Wang / Energy Policy 34 (2006) 730–742 739
from the exploitable area, and is further set back500m from its boundaries. These considerations aimto avoid disturbing the activities of the Black-facedSpoonbill and other birds in the wildlife conserva-tion area. Scenario W further excludes the northernfish farms in order to avoid disturbing the migrationof the Black-faced Spoonbills between the study areaand northeast Asia. The designation of a 250-mbuffer zone from ecologically sensitive areas isintended to avoid affecting the flora and fauna inthose areas.
(2)
Sound. The allowable areas for exploitation main-tain a minimum distance of 500m from urbanplanned districts, and 250m from villages. Thesource sound level of the selected wind turbine ofVestas V80 approximates 101 dBA under a windspeed of 8m/s. Calculating sound level by distancefrom source indicates that the noise level 224m awaywould be approximately 42 dBA, and at 282m awaywould be 40 dBA (DWIA, 2003b). This meets thestandard for inviting bids for the installation of ademonstration system of wind power in Taiwan at45 dBA 300m away.7.2.2. Photovoltaics
(1)
PV module recycling. The basic material from which99% of cells are made, silicon, is not harmful. In thecase of PV modules containing small quantities oftoxic metals, safe recycling will have to be developedso that the substances in the PV modules are notreleased into the environment. The corporationbetween the Taiwanese authority, such as the EPAor the Ministry of Economic Affairs, and the PVmanufacturer is recommended to develop such arecycling program.(2)
Visual amenities. Whether rooftop arrays are visuallypleasing or not depends on individual aesthetictastes. PV modules in the form of special roof tilescould blend into roof structures more unobtrusively,and even make rooftops more attractive.7.2.3. Biomass
(1)
Farming intensity. This consideration concerns thepotential increase in intensive farming with highinputs of fertilizers and pesticides. For providinglong-term nutrients on the fields used to grow energycrops, biomass power plants or processing facilitiesare recommended to be located near the land wherethe biomass is grown (Scheer, 2002). This wouldreturn nutrients taken from the fields by means ofspreading the residues from biomass processing backon the fields used to grow it, so that nutrients theycontain are not lost.Another recommended measure would be the use ofsewage sludge. Sewage sludge would provide a slow-release fertilizer for the fields. The water content ofsewage sludge would reduce the demand for irriga-tion. This would simultaneously reduce the demandfor chemical fertilizer and water.
(2)
Possible reduction of biological diversity. The plant-ing of energy crops would be restricted to withinagricultural land. The wildlife conservation area,ecologically sensitive areas, and buffer zones alongthe coastline are excluded from planting. Thesewould minimize the impact on biological diversity.This study takes sugar cane as an example toevaluate the potential of biomass. This does notmean that other energy crops ought to be excludedin future planning. It is recommended that differentenergy crops be grown in order to provide betterhabitat conditions for biodiversity, and to avoidoutbreaks of disease.8. Political implications
The experiences of developing renewable energysources in countries indicate that the essential factor ofdevelopment does not so much lie in the form ofremuneration regulation, i.e., the price or quantityregulation, but rather in the level of the remunerationprice (BMU, 1999). The Netherlands, Denmark, andGermany provide higher remuneration and are accord-ingly successful in the implementation, while theremuneration in Sweden, Austria, and the UK is low,and low implementation rates have been demonstrated.Combination of a quota system with the advantage ofminimum price regulation, similar to the Non-FossilFuel Obligation adopted in the UK, would be promisingsince the technical and economic status of varioustechnologies for deploying renewable energy sourcescould be matched.
Whether the policies provide a framework to arrangesufficient incentives for private investors has been shownto be the key for developing domestic renewable energysources. The most significant measures include thefollowing.
8.1. Legislatively stipulated grid connection and premium
prices
The use of legislatively stipulated premium prices paidper generated energy has been shown to be the mosteffective tool for stimulating markets of renewableenergy sources in India, Denmark, Spain, and Germany(ECDGE, 1998; Hinsch, 1999). Utility companies thatoperate grids for public power are obliged to connectinstallations for the generation of electricity fromrenewable energy sources to their grids, to purchaseelectricity available from these installations as a priority,and to compensate the suppliers of this electricity in

ARTICLE IN PRESSC.-D. Yue, S.-S. Wang / Energy Policy 34 (2006) 730–742740
accordance with these provisions. These obligations canbe seen in the drafted ‘‘Regulation of DevelopingRenewable Energy Sources’’ in Taiwan that is still inthe legislative process (ECROC, 2002). The remunera-tions with a contract price is currently being appraisedby governmental agencies on a project base according tothe ‘‘Operational principles of the Economic Ministryfor appraising and selecting the target of receiving andpurchasing electricity generated from renewable energysources’’. On this basis, the state-run electricity utility,Taipower, would remunerate electricity generated fromrenewable energy sources with contract prices. Thepassage of the regulation is urgently needed in order toprovide greater assurances of incentives for investmentin renewable energy sources in place of the currentsystem through an appraisal and selection process.
8.2. Capital grants
This measure has been widely used to stimulateprivate investment in developmental fields promotedby policy, particularly in the initial stage of develop-ment. The government in Taiwan currently offers nomore than 50% of the total investment costs for projectsof wind energy and photovoltaics that are selected by agovernmental agency through an appraisal and selectionprocess. The funding of US$91 million yearly has beenannounced in the draft of ‘‘The Special Action Plan fora Non-Nuclear Country’’ for promoting energy savingsand renewable energy sources. This source, along with‘‘The Fees for Preventing and Remedying Air Pollu-tion’’ levied since 1995, could be used to finance part ofthe installation costs for exploiting renewable energysources.
8.3. Financial incentives
Since many renewable energy sources, such as windand biomass, are mostly generated in extensive ruralareas, farmland is the location which provides the mostland available for developing these energy sources.Considering that the capital costs of wind turbines areprohibitively high for farmers, low-interest loans wouldbe significant incentives for private investors. A numberof countries provide lower interest loan of 1–2% lowerthan that on the market for wind power, and zerointerest loans for photovoltaics for the first 10 years. Inaddition, only a third of the turnover tax must be paidfor products and services of renewable energy resources.All these could increase incentives for investment inrenewable energy sources.
8.4. Incentives for the integration of PV and buildings
The prevailing custom of having level roofs onbuildings in Taiwan fosters the problem of providing
the possibility of building illegal stories onto thestructure which in turn damages building safety. TheConstruction and Planning Agency (CPA) in Taiwanhas the intention of stipulating that all new buildingsadopt a form of sloping roof in order to prevent such aproblem. It is recommended that the CPA propose aprogram to promote integration of sloping roofs,facades, and photovoltaics for new buildings witheconomic incentives such as grants calculated on thebasis of the installed PV panel area. This would removethe possibility for building illegal stories, increase theroof surface available for installation of PV arrays, andbeautify rooftops of buildings.
8.5. Reconciliation of long-term agricultural, energy, and
environmental imperatives
Trade liberalization of agricultural products driven byaccession to the WTO has led to a drop in agriculturaloutput value in Taiwan. Areas of fallow land and landconverted to nonagricultural ends are estimated to havereached 80,000 ha or about 2.2% of the entire country’sarea. In response to this development, agriculturalpolicy in Taiwan is set to release agricultural land. Inaddition to retaining agricultural land in an appropriatequantity for agricultural development, portions ofagricultural land are to be converted to nonagriculturaluse in order to meet the needs of economic development,and to facilitate rational use of land resources.Agricultural land with lower productivity is to bereforested. Agricultural land lacking productivity is tobe changed to nonagricultural uses (COAROC, 2003).
Since it has not been clearly determined how much the‘‘appropriate quantity for agricultural development’’really refers to, two points are worthy of attention. First,the necessary quantity of agricultural land for foodproduction needs to be defined so that it can beprotected in order to ensure self-sufficiency of the foodsupply in situations of price rises on the internationalfood market, and of supply shortages due to interna-tional political, economic, or ecological instability.Many countries regard the significance of being self-sufficient in food to the furthest extent possible as anational security issue (Beatley, 2000). Second, thereleased agricultural land should be used for plantingenergy crops, and chemical and technical raw materialsrather than for construction and other urban facilitiesdue to a number of ecological considerations, such asavoidance of carbon release into the atmosphere andsupplementation of underground water.
9. Conclusions
This survey of renewable energy sources in the Chiguarea has reached the following conclusions.

ARTICLE IN PRESSC.-D. Yue, S.-S. Wang / Energy Policy 34 (2006) 730–742 741
�
The installation capacity of wind energy amounts to2356 MW with a generation capacity of 3255GWhannually in scenario R. For scenario W, installationcapacity is calculated to be 2008MW with a genera-tion capacity of 2672GWh. These demonstrate a fargreater potential for the development than photo-voltaics and biomass. This can to a great extent beattributed to the advantageous geographical condi-tions of a windy coastal area and of a low-densitypopulation distribution. � The installation capacity of photovoltaics of 52MWwith an annual energy output of 80GWh is restrictedto the application on rooftops rather than forextensive land areas under the consideration ofreserving the limited land resources in Taiwan. Itspotential is none the less greater than that of biomass.The introduction of this technology should, however,be promoted since its application can be expanded tobuilding facades and other facilities on the one hand,and its electricity generation (supply side) is close toconsumers (demand side) which enhances the value ofthe generated electricity on the other.
� Biomass energy could be used to generate ethanolwith energy values of 38 and 31GWh for scenarios Rand W, respectively, which could serve as fuels formotorized vehicles. In addition, about 22 and18GWh of electricity could be generated from fullyusing the bagasse in scenarios R and W, respectively.Despite the relatively lower potential, the productionof this energy source is not subject to climate-inducedfluctuations that would be imposed on energy fromwind and photovoltaics. This makes biomass energyan ideal complement for energy produced from windand photovoltaics.
The approaches adopted in this study have thefollowing implications for exploiting local renewableenergy sources:
�
The GIS-based approach of evaluating local potentialof renewable energy sources adopted in this studytakes into account actual local conditions andrestrictions such as climate conditions, land uses,and ecological environments which produces a more-accurate assessment than evaluations on an approx-imate basis. � The process of evaluating local renewable energysources adopted in this study using technical,economic, environmental, and political analyses canserve as an example to investigate local and domesticrenewable energy sources with vertical integration.The results of such surveys can help formulate localand national long-term energy and environmentalpolicies.
� The simultaneous evaluation of multifarious sourcesin this study could help combine various renewable
energy sources with horizontal integration in order toprovide complementary and more-sufficient powersupplies, and consequently enhance their capabilityfor supplying electricity.
� The scenario analyses adopted in this study could beused to assess energy-economic and environmentalimplications of exploiting renewable energy sourcesunder different considerations in the study area,whether prioritizing renewable energy or wildlife.This information is valuable for both governmentaldecision-making and political debate at the local level.
� Based on the methodologies adopted in this study,other renewable energy sources and criteria ofexploitation could be evaluated according to actualconditions at the local level.
With the aid of GIS, an evaluation of multifariousrenewable energy sources according to local real landuses is able to provide more-integrated and accuratedecision-making information for policy-makers andinvestors. This approach can further be expanded toconduct a comprehensive survey at the national level inorder to grasp the entire potential of a country. Theseimplications may help build a developmental vision forsustainable energy systems based on locally availablenatural resources, and facilitate a transition of nationalenergy and environmental development towards sustain-ability.
Acknowledgements
This paper presents the research project entitled ‘‘Anevaluation model for developing local renewable energysources: strategies for the Chigu region in Taiwan’’funded by the National Science Commission of theRepublic of China. The authors would like to thank theCommission for supporting this survey. The authorsalso express their gratitude to Profs. Yuh-Jyh Yueh andHsueh-Sheng Chang of Leader University for the GISdata and technical aids, to sir Armin Bertram of theplanning office for the renewable energy system ‘‘Pro-jekt’’ in Germany for information about measures forprotecting wildlife from wind turbines, to the TaiwanCounty government for the satellite map to ascertain theposition of the wildlife conservation area, and to theIndustrial Technology Research Institute for data aboutwind potential distribution in Taiwan. Their kindassistance all contributed to the achievements of thisproject.
References
Barrow, C.J., 1999. Environmental Management: Principles and
Practice. Routledge, London.
Beatley, T., 2000. Green Urbanism. Island Press, Washington, DC.

ARTICLE IN PRESSC.-D. Yue, S.-S. Wang / Energy Policy 34 (2006) 730–742742
BMU, 1999. Klimaschutz durch Nutzung erneuerbarer Energien
(Climate protection through the use of renewable energy). Study
commissioned by the Bundesministerium fur Umwelt, Naturschutz
und Reaktorsicherheit (BMU) (Federal Ministry for the Environ-
ment, Nature Conservation and Nuclear Safety). BMU website:
http://www.bmu.de/fset800.php.
Boyle, G. (Ed.), 1996, Renewable Energy: Power for a Sustainable
Future. Oxford University Press, Oxford, UK.
Brown, L.R., 2001. Eco-Economy: Building an Economy for the
Earth. Norton, New York.
Brown, L.R., 2003. Plan B: Rescuing a Planet Under Stress and a
Civilization in Trouble. Norton, New York.
Brown, L.R., Larsen, J., Fischlowitz-Roberts, B., 2002. The Earth
Policy Reader. Norton, New York.
COAROC (Council of Agriculture of the Republic of China), 2003.
The overall response strategy of Taiwan’s agriculture after acceding
to the WTO. COAROC website: http://www.coa.gov.tw/2/50/55/
55.html#4.
DWIA (Danish Wind Industry Association), 2003a. Guided tour.
DWIA website: http://www.windpower.org/index.htm.
DWIA (Danish Wind Industry Association), 2003b. Wind energy
manual. DWIA website: http://www.windpower.org/index.htm.
ECDGE (European Commission’s Directorate General for Energy),
1998. Wind energy—the facts. AGORES (A Global Overview of
Renewable Energy Sources) website: http://www.agores.org/
publications/wind_Energy.htm.
ECROC (Energy Commission of the Republic of China). 1999a. The
Standard for Inviting Bids for the Installation of Demonstration
System of Wind Power. Taipei, Taiwan.
ECROC (Energy Commission of the Republic of China), 1999b. Final
Report of Plan for Research and Exploitation of New Energy and
Clean Energy. Taipei, Taiwan.
ECROC (Energy Commission of the Republic of China), 2000.
Analysis of Costs and Amortization for Renewable Energy Sources
in Taiwan. Taipei, Taiwan.
ECROC (Energy Commission of the Republic of China), 2002. Energy
White Paper. Taipei, Taiwan.
EPAROC (Environmental Protection Administration of the Republic of
China), 2001. The pronouncement for the implementation of
environmental impact assessment for the installation of wind turbine.
EPAROC website: http://w3.epa.gov.tw/epalaw/index.htm.
Goulder, L.H., 2000a. Confronting the prospect of global climate
change: carbon taxes and other domestic policy options. In: Ernst,
W.G. (Ed.), Earth systems. Cambridge University Press, Cam-
bridge, UK, pp. 34–445.
Goulder, L.H., 2000b. Steps from environmental science to effective
policy. In: Ernst, W.G. (Ed.), Earth systems. Cambridge University
Press, Cambridge, UK, pp. 425–433.
Hill, R., O’Keefe, P., Snape, C., 1995. Energy planning. In:
Kirkby, J., O’Keefe, P., Timberlake, L. (Eds.), The Earthscan
Reader in Sustainable Development. Earthscan Publications,
London.
Hinsch, C., 1999. It’s up to Brussels to prioritize defense of the
independent producers. New Energy, Vol. 4. German Wind Energy
Association, Osnabruck, Germany, pp. 10–12.
Houghton, J., 1997. Globale Erwarmung. Springer, Berlin.
IPCC, 2001. Climate change 2001: mitigation. Technical summary. A
report of Working Group III of the Intergovernmental Panel on
Climate Change. IPCC website: http://www.ipcc.ch.
ITRI (Industrial Technology Research Institute), 2001. Wind potential
distribution in Taiwan. Study commissioned by the Energy
Commission of the Republic of China, Taipei, Taiwan.
Kaltschmitt, M., Wiese, A., 1994. Technische Energiepotentiale,
substituerbare End- und Primarenergieaquivalente und Kosten
ernerbarer Energietrager in Deutschland (Technical energy poten-
tial, replaceable end and primary energy equivalents and costs of
renewable energy sources in Germany). Zeitschrift fur Energie-
wirtschaft, Koln, Germany 1/94, 41–64.
Owen, O.S., Chiras, D.D., Reganold, J.P., 1998. Natural Resource
Conservation. Prentice Hall, Upper Saddle River, NJ.
Scheer, H., 2002. The Solar Economy: Renewable Energy for a
Sustainable Global Future. Earthscan Publication, London.
Smith, S., 2000. Environmental and public finance aspects of the
taxation of energy. In: Helm, D. (Ed.), Environmental policy.
Oxford University Press, Oxford, UK.
Thothathri, R., 1999. The wind brought jobs and prosperity. New
Energy, Vol. 4. German Wind Energy Association, Osnabruck,
Germany, pp. 28–30.
Tietenberg, T., 2000. Environmental and Natural Resource Econom-
ics. Addison Wesley Longman, New York.
UNCSD (UN Commission on Sustainable Development), 2002. Plan
of implementation of the world summit on sustainable develop-
ment. UNCSD website: http://www.un.org/esa/sustdev/documents/
docs.htm.
Voivontas, D., Assimacopoulos, D., Mourelatos, A., 1998. Evaluation
of renewable energy potential using a GIS decision support system.
Renewable Energy 13 (3), 333–344.
Wenz, P.S., 2001. Environmental Ethics Today. Oxford University
Press, Oxford, UK.
Young, R. J., 1999. The inventory of the energy-related greenhouse gas
emissions in Taiwan. Available at: http://www.erl.itri.org.tw/
energy_policy/EC/FY88/new08.htm.
Yue, C.-D., Liu, C.-M., Liou, E.M.L., 2001. A transition toward
a sustainable energy future: feasibility assessment and develop-
ment strategies of wind power in Taiwan. Energy Policy 29,
951–963.