gis applications faculty of computer science university of indonesia dr. aniati murni copyright...
Post on 18-Dec-2015
217 views
TRANSCRIPT

GIS Applications
Faculty of Computer ScienceUniversity of Indonesia
Dr. Aniati Murni
Copyright ©AniatiMurni

2
Contoh Aplikasi Contoh Aplikasi
Agriculture Precision Farming Electricity Distribution Network Forest Fire

GIS in Agriculture Application(Source: GIS AsiaPacific, February/March 1998)
Faculty of Computer ScienceUniversity of Indonesia
Dr. Aniati Murni

4
Aspects of Agriculture ApplicationAspects of Agriculture Application
Aspects of applications Crop location and area estimation; Yield prediction; Diseases monitoring; and Precision Farming.
Required information Identification of crop type; Measurement of crop area; Determination of crop boundaries; Estimates of yield and
production; The determination of crop health and stress; and The measurements of in-field variation (good and bad crops).

5
Data Capture Technology(Pengaruh Image Resolution)Data Capture Technology(Pengaruh Image Resolution)
High resolution optical remote sensing sensor (SPOT, three times/year)
Synthetic Aperture Radar (SAR) sensor High resolution image for precise farming: resolution-size vs
error

6
Location and Area EstimationLocation and Area Estimation Colors in optical sensor images can identify crop/vegetation type,
different health and maturity, growing season and harvesting season (using multitemporal data);
Crop boundaries, image pixel size, and information from the grower can be used for area estimation.
Areas declared as potatoes areas is combined with the declared location and area of planted potatoes to get a map of growing potatoes.
Later, the field supervisor can use this map to record the planting returns and to process only the growing potatoes area with no corresponding planting returns.

7
Yield PredictionYield Prediction
Compare the probable crop yield at a detailed level and the product estimation;
Predict the surpluses or shortages to support price prediction and stabilization effort at national level;
Improve logistics planning for the harvest, transportation, storage and processing of seasonal crops.

8
Disease MonitoringDisease Monitoring
The healthy and unhealthy crops can be differentiated using false color optical sensor SPOT data where healthy trees are red and unhealthy trees are pink and purples.
This information can be used to estimate the impact on the production and model of the epidemic (in terms of extent, severity, spreading time).
Red = healthy vigorous crops
Pink/Purple = unhealthy or blighted crops

9
Precision Farming (Lower Cost but More Competitive)Precision Farming (Lower Cost but More Competitive)
The type and structure of soil or unsuited to the crop type; Different nutrient availability or non-uniform of seed distribution; Germination; and Uneven irrigation.
Sources/Causes of in-field variation (good and bad crops):
The usefulness of multitemporal analysis:• Is there any repeatable variation?
• Then it can be solved by fertilizing (use only if it is required / reduce fertilizer use, efisien / saving money, avoid run-off chemical polluted water); and additional / better irrigation.
• Can predict crop yield and help farmer to improve farming efficiency.

10
Vigorous Crops Recognition by Vegetation IndexVigorous Crops Recognition by Vegetation Index
Healthier crops higher vegetation index: ;
Vegetation Index Measures
High
NDVI

GIS in Electricity Distribution Network (Source: GIS AsiaPacific, June/July 1998)
Faculty of Computer ScienceUniversity of Indonesia
Dr. Aniati Murni

12
The Objective of the GIS ProjectThe Objective of the GIS Project
distribution network technical information base;
customer connection database; and decision support systems.
To improve the reliability and accessibility of the power company’s:

13
Information RequirementsInformation Requirements An accurate register of geographic position of
distribution system assets for valuation and financial performance reporting purposes;
The capacity and geographic location of each customer connection points to the network to be used as an input parameter in the determination of charges for line function services;
This meant that the management should be able to derive (a) an electrical schematic of the network for analysis and planning purposes; (b) an asset inventory with location attributes for system maintenance.

14
Steps to achieve the objectiveSteps to achieve the objective
Assess the existing information contained in database;
Conduct a survey on information requirements; Design and implement a strategy to obtain all
necessary information; Coordinate all information into a central database of
a GIS; Develop operational processes and procedures to
automate up-to-date data maintenance; Expand access to and operations of the GIS
throughout the functional units of the organization.

15
Identification of data requirementsIdentification of data requirements
No previous database or records of individual poles and structures;
Records on rural lines were limited to large scale hard copy maps (1:10.000), so that the line position information is inaccurate and no detail attributes;
Records on urban lines and cables were in the A1 paper of 1:10.000 scale and could be directly digitized using CAD system;
A number of text data should be entered including the code numbers of computerized transformer and substations;
16
Identification of data requirements (continuation)
Identification of data requirements (continuation)
Incomplete records of existing transformers and substation records without or with wrong transformer data;
The database was based on customer account which is related to a single meter installation, in fact one customer may have more than one meter installations, meaning may have more than one customer accounts;
The database could be based on customer connection points but there was no information on their load capacity;
The database for street lights was in text describing the attribute of location name.

17
Data Capture StrategyData Capture Strategy Data of geographic position and load capacity of
each customer network connection points; Geographic position and attributes of substation,
lines, cables, switchgear, and streetlights; Data collection is divided into urban and rural data
collection; Rural data collection is divided into ground
mapping / survey and aerial mapping; Geographic position is measured using GPS (Global
Positioning System).
18
Ground MappingGround Mapping A roving crew consists of one lineman and one surveyor,
visits all rural transformer sites and all their connected customer NCPs.
The surveyor made a field sketch book of the layout of 400V lines from each transformer, detail 400V conductors, substation code numbers, GPS (geographic) positions.
The lineman affixed the NCP identification number plate. At the end of each day, the GPS waypoint files were
down loaded to CAD system, and the field sketch book was transferred to CAD mapping.

19
Aerial Mapping Aerial Mapping The survey involved a low-level helicopter
flyover of all rural high voltage lines; A video camera is mounted at the helicopter and
recorded the view of the overhead lines; Each high voltage line connection is marked and
its position is recorded and stored in the GPS file.
At the end of each day, the data is down loaded to CAD system to provide input data for high voltage line connection database.
20
Urban Data Collection Urban Data Collection
The existing urban power map of 1:1.000 scale is used in the survey as the field sketch map where additional customer NCPs information is added to the map;
The urban power lines include under-ground cable and above-ground poles;
The data of above-ground line network includes the customer NCPs and the related NCP code number;
The NCP map is used by the lineman to add information of meter installation code number and its load capacity;
In the case of under-ground cable, the customer NCP is located at the service pillar box, so that it can be identified;
All the data then are digitized into the CAD maps.

21
System Map ProductionSystem Map Production
This system produces an electronic map of all components of line network assets and entities such as transformers, NCPs, etc.;
The electronic map consists of sets of graphic entities which are geographically connected to each other;
Entity identifier is needed to relate the graphic entity to its attribute (table data) in the relational database;
The tolerable accuracy for rural and urban network is 10m - 15m and around 5m, respectively.

22
GIS ImplementationGIS Implementation
After the electronic maps are produced, then the GIS construction can be implemented;
The data coverage/layers include the theme of high voltage network, NCP network, switch gear network, etc.;
The relation between the graphic/spatial data and text/attribute/non-spatial data is also established;
The system is then extended as a multiuser system, so that each unit in the company can utilize the data;
In this way, the system has already been integrated to the network operational management system.

GIS in Fishermen, Farmers, Forest Change and Fire (Source: GIS AsiaPacific, February/March 1998)
Faculty of Computer ScienceUniversity of Indonesia
Dr. Aniati Murni

24
DSWR (Danau Sentarum Kalimantan Wildlife Reserve) Data
DSWR (Danau Sentarum Kalimantan Wildlife Reserve) Data
Area : 132,000 ha
Population : 6000 - 8000
Feature : Swamp Forest
Fauna : Rare Red Asian Arowana Proboscis Monkey, Orang Utan
Stakeholders : Muslim Melayu (fishermen, traders,
timber concessionaires, timber workers, conservation agency and local government officials)
Christian and Animist Iban (shifting
cultivators)

25
Area of Danau Sentarum, KalimantanArea of Danau Sentarum, Kalimantan

26
DSWR Conservation Project (1992 - 1997)DSWR Conservation Project (1992 - 1997)
Funded by British Conservation Project between Government of Indonesia and UK Tropical Forest Management Programme (ITFMP);
Implemented based on Participatory and Community Management Plan in collaboration with the Ministry of Forestry’s Directorate General of Forest Protection and Nature Conservation;
Using the remote sensing technology and GIS (Geographic Information System) to produce 1:50,000 map scale;
Thematic Legend: vegetation, burned areas, regenerating areas, reserved villages (the local community decides its village boundary), socio-economic data, forest use status, administrative boundaries, geology data, logging concession boundaries, and spatial planning status.

27
Landsat TM of D. Sentarum (August 1990) Red = burned forest Green = forest
Landsat TM of D. Sentarum (August 1990) Red = burned forest Green = forest
Forest
Burned Forest

28
Images of D. SentarumImages of D. Sentarum
Burned Swamp Forest
Danau Sentarum in Wet Season

29
Joint Research between Conservation Project and CIFOR (The Center for International Forestry Research)
Joint Research between Conservation Project and CIFOR (The Center for International Forestry Research)
Forest Cover Change Analysis: using Landsat TM and MSS to produce base map of 1:50,000 scale. Aerial photo is used to digitize forest boundary on the base map.
Stakeholder activities: shifting cultivation (dry and wet land), hunting, fishing, harvest rattan, honey, firewood and timber from the forest.
During the period of 1973-1990, the swamp forest area was reduced from 4000 ha to 3444 ha; and the burned swamp forest was increased from 59 ha to 239 ha.
Research on the Criteria and Indicator for Sustainable Forest Management System - Forest Change, Shifting Cultivator, Fisherfolks
30
Joint Research between Conservation Project and CIFOR (continuation)
Joint Research between Conservation Project and CIFOR (continuation)
The cause of forest fire could be physical (natural) or anthropogenic (the human) but it is sure not caused by shifting cultivation.
The hill and dry land forest (non-swamp forest) was also reduced from 1089 ha to 884 ha due to shifting cultivation activities. The remaining dry land forest was regenerated forest or non-cleared forest which is used for funeral.
Fishery could sustain the swamp forest, but some are also burned. The majority of the burned swamp forest are the dwarf and stunted (pohon-pohonnya kecil karena tidak subur) swamp forest.

31
Forest change of one village areaForest change of one village area
32
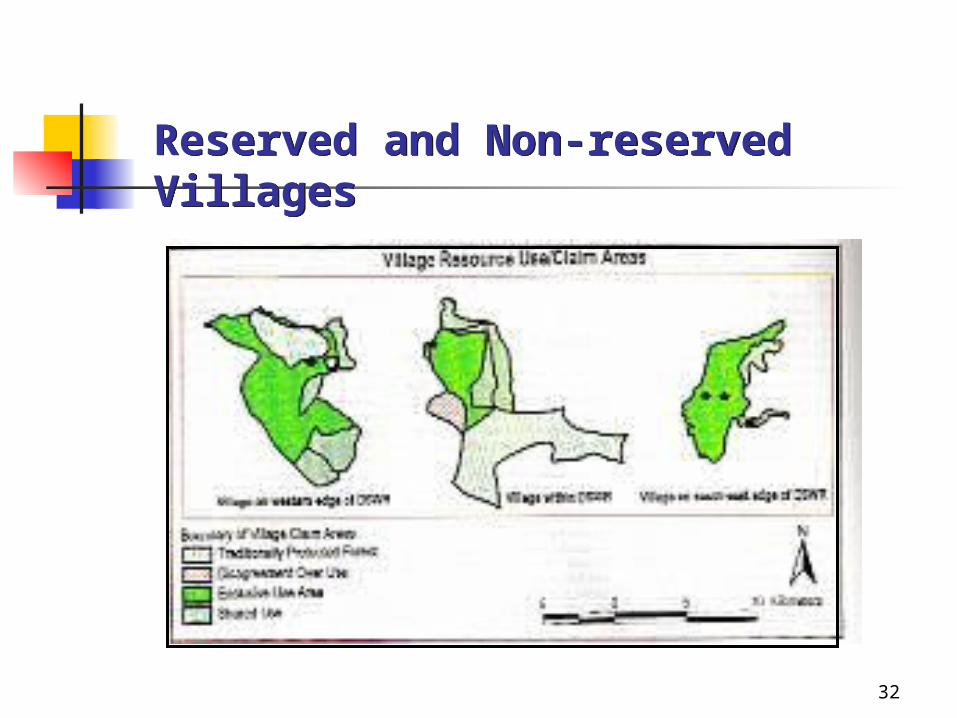
Reserved and Non-reserved VillagesReserved and Non-reserved Villages

33
ConclusionsConclusions Forest damages in non-reserved area have experienced greater
loss in forest cover than that in reserved area. Most of the cause is fire.
Swamp forest damages in shifting cultivation areas are not always worse than that in fishery areas.
The remote sensing and GIS technologies are potential for sustainable forest management.
The socioeconomic data, ethnographic data and forest classification data could be used to obtain the cause of forest fire.
The shared claim zones consistently show forest decrease, often as a result of burning. Focusing on conflict resolution between the major stakeholders in these areas may lead to less burning.
The study of deforestation shows a complex analysis which need to examine conditions historically.