ghrelin in the treatment of catabolic disorders ghrelin in... · ghrelin in the treatment of...
TRANSCRIPT

Ghrelin in the Treatment of
Catabolic DisordersJoseph Gertner, MB, MRCP
Benjamin Levinson, MD
Mayumi Furuya PhD
Asubio Pharmaceuticals Inc; Rochelle Park NJ, USA
and
Asubio Pharma Ltd; Kobe, Japan

International Congress on GH 4 March 2011 2
Disclosure
Joseph Gertner, Benjamin Levinson, and Mayumi Furuya are full-time employees of Asubio Pharmaceuticals Inc, USA and Asubio Pharma Ltd, Japan
SUN11031 (synthetic human ghrelin) has not been approved for human use except for research purposes by any regulatory authority in any country

International Congress on GH 4 March 2011 3
Contents
• Cachexia as a paradigm for catabolic disorders
• What is required of a treatment for cachexia
• Ghrelin as an anti-cachectic therapeutic
• SUN11031 (synthetic human ghrelin) in an animal model of cachexia
• A trial of SUN11031 in COPD-associated cachexia

International Congress on GH 4 March 2011 4
Cachexia as a Paradigm for Catabolic Disorders
Cachexia is difficult to define; the definition usually includes a time-dependent (longitudinal) component
Summary of Definition from Evans et al 20081
“Cachexia is a complex metabolic syndrome associated with underlying illness and characterized by loss of muscle with or without loss of fat mass”
1Evans, WJ et a 2008 Clin Nutr 27: 793

International Congress on GH 4 March 2011 5
Features of Cachexia
Adapted from Evans, WJ et al 2008 Clin Nutr 27: 793

International Congress on GH 4 March 2011 6
The Impact of Cachexia on the Patient
• Weight loss, principally loss of lean body mass (LBM) and negative protein balance generally
• Functional decline (physical, immunological)
• Increased susceptibility to side-effects of treatment of the underlying condition
• Anorexia
• Depression and decreased quality of life
• Increased morbidity and mortality
• Cachexia as a self-reinforcing cycle
International Congress on GH 4 March 2011 7
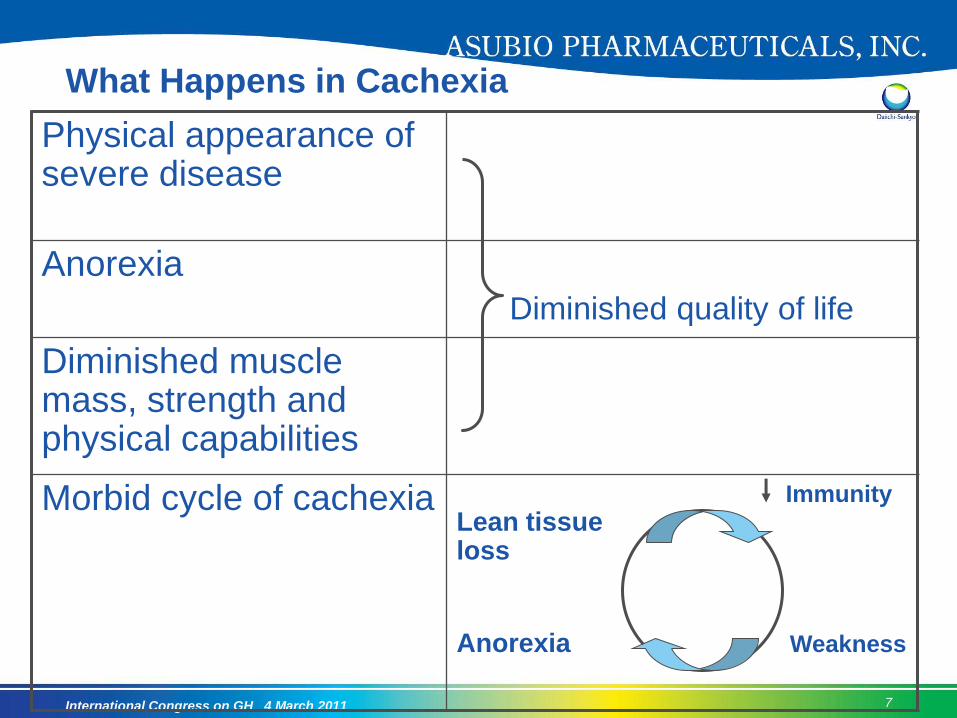
What Happens in Cachexia
Physical appearance of severe disease
Anorexia
Diminished quality of life
Diminished muscle mass, strength and physical capabilities
Morbid cycle of cachexia Immunity
Lean tissue loss
Anorexia Weakness

International Congress on GH 4 March 2011 8
What is Required of a Treatment for Cachexia?
• Reversal of weight loss
• Restoration of lean body mass
• Improved physical function
• Where the underlying disease is severe and progressive a treatment should at least be able to slow progression of the above

International Congress on GH 4 March 2011 9
Ghrelin is AnticachecticGH release
Appetite
stimulation
Stimulation
of GI
motility
SympatholyticAnti-
inflammatory
Anabolic
GI function Food intake
Metabolic rate Anticatabolic
ANTICACHECTIC

International Congress on GH 4 March 2011 10
Published Trials of Ghrelin in Catabolic States
1st Author
Reference
Short Title Number Controlled
Lundholm KCancer 2010116:2044
ghrelin to unselected weight-losing cancer patients
17 Y
Hotta M Endocr J. 2009;56:1119
Ghrelin increases food intake in anorexia nervosa
5 N
Ashby DRKidney Int. 2009 ;76:199
appetite improvement in malnourished dialysis patients
12 Y
Neary NMJCEM 2004 89(6):2832
increased energy intake in cancer patients with impaired appetite:
7 Y

International Congress on GH 4 March 2011 11
Effect of Ghrelin on a Cigarette-Smoke
Induced Model of COPD

International Congress on GH 4 March 2011 12
Protocol
N=10, Mean ± SE. *** p<0.001 vs. Sham. $$$ p<0.001 vs. Veh.
Day1 Day84
Exposure to cigarette smoke or air (Sham)
Vehicle, SUN11031 0.1 or 1.0 mg/kg sc,bid
Body Weight gain Grip strength
50
100
150
200
Sham Veh
BW
ga
in (
g)
***
$ $ $
SUN11031 (mg/kg)
0.1 10.50
0.60
0.70
0.80
0.90
Sham Veh
Grip s
trength
(kg)
P=0.084 P=0.068
SUN11031 (mg/kg)
0.1 1
International Congress on GH 4 March 2011 13
SUN11031 (Synthetic Human Ghrelin) Improves
Lean Body Mass (LBM) and Function in
Advanced COPD Cachexia
SUN11031, an investigational drug under development, is a 28 amino acid peptide structurally identical to human ghrelin.

International Congress on GH 4 March 2011 14
Objectives
• The aim of the present Phase 2 study was to determine whether the administration of SUN11031 could increase body mass and physical performance in cachectic subjects with COPD.

International Congress on GH 4 March 2011 15
Methods
• 227 eligible male and female subjects age ≥ 50 years with cachexia associated with COPD with FEV1 20% to 79% predicted were randomized 1:1:1 to placebo, SUN11031 20 µg/kg and 40 µg/kg bid, all given sc for 84 days
• The definition of cachexia was based on the consensus statement of Evans et al5 with documented involuntary nonedematous weight loss > 5% over 12 months or BMI ≤ 21 kg/m2 for males or ≤ 20 kg/m2 for females
• The 6-minute walk test (6MWT) was selected as the 1º endpoint because it is widely used in assessing physical performance in COPD
• The Short Physical Performance Battery (SPPB), a validated test of lower body function, predictive of morbidity and mortality in middle aged and geriatric subjects, served as a 2º measure of performance
5 Evans, WJ et al Clin Nutr. 2008 Dec;27(6):793-9.

International Congress on GH 4 March 2011 16
Plan of Study Treatment Assessments

International Congress on GH 4 March 2011 17
Efficacy Assessment
• Physical Performance
6 Minute Walk Test
Short Physical Performance Battery (SPPB)
Handgrip strength
Maximum inspiratory pressure
• Body mass
Body weight
Body composition by dual-energy X-ray absorptiometry (DXA)
• Appetite assessment
Appetite assessment by visual analog scale (VAS)
• Safety
Standard spirometry
Modified MRC dyspnea scale
Physical examination
Routine biochemistry, endocrine and cytokine biomarkers

International Congress on GH 4 March 2011 18
Distribution and Disposition of Study Subjects

International Congress on GH 4 March 2011 19
Demographics (ITT Population, N=214)
Placebo(n=72)
20 µg/kg BID
(n=73)
40 µg/kg BID
(n=69)
Age, yearsMean ± SDMedian (Range)
66.1 ± 8.8467.0 (50-89)
64.5 ± 8.0565.0 (51-84)
66.2 ± 9.2067.0 (47-86)
Males, n(%) 41 (56.9%) 51 (69.9%) 48 (69.6%)
White Race, n(%) 64 (88.9%) 65 (89.0%) 64 (92.8%)
Hispanic/Latino Ethnicity, n(%)
57 (79.2%) 62 (84.9%) 52 (75.4%)
Height, cm Mean ± SDMedian (Range)
161.48 ± 8.026162.00
(147.0-179.0)
164.65 ±9.520
166.00 (142.2-189.0)
165.29 ±7.877
165.00 (150.0-189.0)
SD = standard deviation

International Congress on GH 4 March 2011 20
BMI = body mass index; PImax = maximal inspiratory pressure
All data are presented as mean ± standard deviation
Baseline Characteristics (ITT Population, N=214)
Placebo(n=72)
20 µg/kg BID(n=73)
40 µg/kg BID(n=69)
6MWT, meters 317.30 ± 80.616 333.93 ± 78.914 333.30 ±68.199
Weight, kg 48.84 ± 7.957 50.63 ± 8.598 53.23 ± 8.812
BMI, kg/m2 18.65 ± 2.181 18.62 ± 2.278 19.42 ± 2.522
PImax, cm H20 48.33 ± 19.118 53.92 ± 30.305 53.87 ± 21.631
Lean body mass, kg 37.85 ± 6.770 39.25 ± 7.750 40.39 ± 6.801
Fat mass, kg 9.28 ± 4.429 9.33 ± 4.859 10.88 ± 5.139
SPPB 8.7 ± 1.78 9.2 ± 1.91 8.7 ± 2.14
International Congress on GH 4 March 2011 21
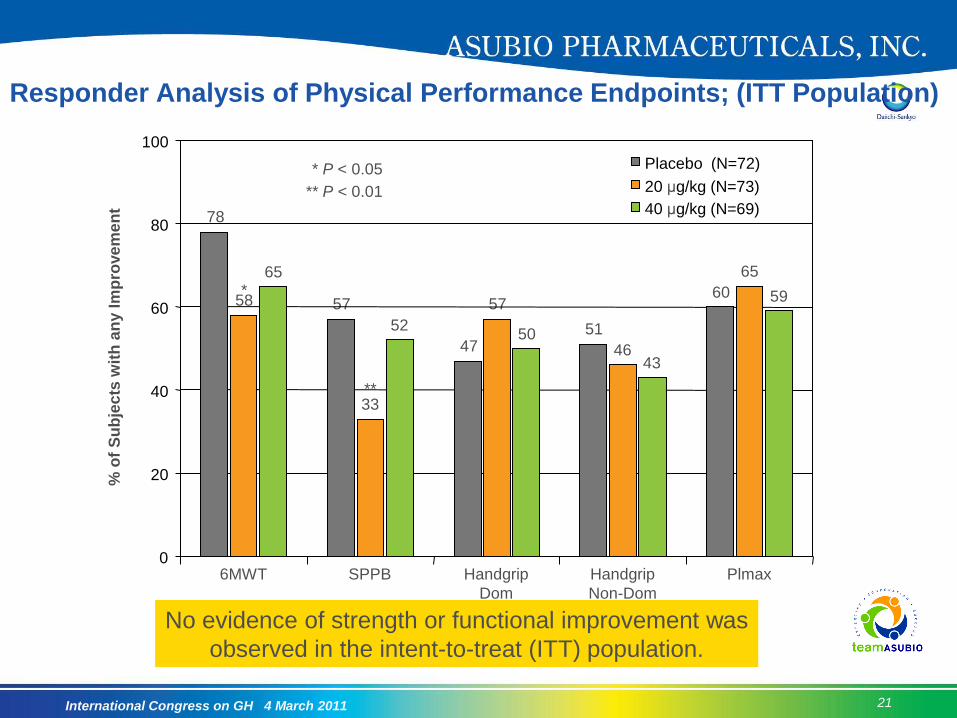
Responder Analysis of Physical Performance Endpoints; (ITT Population)%
of
Su
bje
cts
wit
h a
ny I
mp
rove
me
nt
6MWT
78
58
65*
57
33
52
47
57
50 51
4643
60
65
59
**
** P < 0.01
* P < 0.05
SPPB Handgrip
Dom
Handgrip
Non-Dom
Plmax0
20
40
60
80
100
Placebo (N=72)
20 μg/kg (N=73)
40 μg/kg (N=69)
No evidence of strength or functional improvement was
observed in the intent-to-treat (ITT) population.

International Congress on GH 4 March 2011 22
Secondary Endpoint: Mean Change from Baseline
in Body Weight (ITT)
BL = Baseline; ITT = Intent-to-Treat
0
0.5
1
1.5
2
2.5
3
BL 8 15 22 29 43 57 85 99
Day
Bo
dy
We
igh
t M
ean
Ch
an
ge
fro
m B
L (
kg
)
Placebo SUN11031 20 µg/kg SUN11031 40 µg/kg
*SUN11031 vs Placebo, P < 0.05
**SUN11031 vs Placebo, P<0.001
*
*
****
** **
**
**
****
****
**
*
Las
t
Do
s
e
Baseline Body Weight (kg)Placebo: 48.84SUN11031 20 µg/kg: 50.63SUN11031 40 µg/kg: 53.23

International Congress on GH 4 March 2011 23
Changes in Body Weight and LBM to Day 85
Weight Change from Baseline
0
0.5
1
1.5
2
2.5
3
Placebo 20 µg/kg 40 µg/kg
Kg
LBM Change from Baseline
0
0.5
1
1.5
2
2.5
3
Placebo 20 µg/kg 40 µg/kg
Kg
± SEM ± SEM
**
** ***
**
* P < 0.05 vs placebo
P < 0.001 vs placebo

International Congress on GH 4 March 2011 24
Secondary Endpoint: Lean Body Mass (ITT)
BL = Baseline; ITT = Intent-to-Treat
*SUN11031 vs Placebo, P <0.05
**SUN11031 vs Placebo, P<0.001
Baseline Lean Body Mass (kg)Placebo: 37.85SUN11031 20 µg/kg: 39.25SUN11031 40 µg/kg: 40.39
0
0.5
1
1.5
2
2.5
3
BL 29 85 99
Day
Le
an
Bo
dy
Ma
ss
Me
an
Ch
an
ge
fro
m B
L (
kg
)
Placebo SUN11031 20 µg/kg SUN11031 40 µg/kg
***
**
****
*
Last
Dos
e

International Congress on GH 4 March 2011 25
Secondary Endpoint: Fat Mass (ITT)
BL = Baseline; ITT = Intent-to-Treat
0
0.05
0.1
0.15
0.2
0.25
0.3
0.35
BL 29 85 99
Day
Fa
t M
as
s M
ea
n C
ha
ng
e f
rom
BL
(k
g)
Placebo SUN11031 20 µg/kg SUN11031 40 µg/kg
Las
t
Do
s
e
Baseline Fat Mass (kg)Placebo: 9.28SUN11031 20 µg/kg: 9.33SUN11031 40 µg/kg: 10.88

International Congress on GH 4 March 2011 26
Responder Analysis of Changes in
Body Weight and LBM (ITT Population)
**
**
**
**
****
**
Responder Analysis: % With Weight Increase
ITT Population, Day 85 Assessment
% o
f S
ub
jects
with
Weig
ht In
cre
ase
Weight Gain > 0 kg Weight Gain > 2 kg LBM Gain > 0% LBM Gain > 3%
Responder Analysis: % With LBM Increase
ITT Population, Day 85 Assessment
% o
f S
ub
jects
with
LB
M In
cre
ase
65.3
78.1
85.5
** P < 0.01
25.0
49.3
62.3 61.8
85.3
** P < 0.01
17.6
61.458.8
84.3
0
20
40
60
80
100
Placebo (N=72)
20 μg/kg (N=73)
40 μg/kg (N=69)
0
20
40
60
80
100
Placebo (N=72)
20 μg/kg (N=73)
40 μg/kg (N=69)

International Congress on GH 4 March 2011 27
Effect of SUN11031 on Growth Hormone and
IGF-1 Concentrations (ITT Population)1
*
***
GH Predose and 0.5 Hrs Post Dose on Day 85
PK Population (Sparse Sampling)
Ng/m
L
Predose Day 85 Day 1
IGF-1 Values
ITT Population
Ng/m
L
1.21.9
0.8
*** P < 0.001
1.1
13.7
17.3
** P < 0.01
90.1***
1Sparse sampling was used to obtain GH concentrations,
so caution should be used in interpreting GH levels
**93.3
*94.6
* P < 0.05
88.4
82.3
86.9
83.1
81.2
84.7
Da
y 2
9
Da
y 5
7
Da
y 8
5
0
5
10
15
20
Placebo (N=37)
20 μg/kg (N=33)
40 μg/kg (N=40)
70
75
80
85
90
95
100Placebo (N=72)
20 μg/kg (N=73)
40 μg/kg (N=69)

International Congress on GH 4 March 2011 28
Percentage of Subjects with LBM Increase and Functional
Improvement by Test (Advanced Cachexia Population)Responder Analysis of Physical Performance Endpoints (ITT Population)
Percentage with any Improvement – Day 85 Assessment
% o
f S
ubje
cts
with L
BM
Incre
ase a
nd Im
pro
vem
ent >
0 b
y T
est
6MWT
36
39
56
26
34
59
33
49
44
26
49
38
31
63
44
** P < 0.01
* P < 0.05
SPPB Handgrip
Dom
Handgrip
Non-Dom
Plmax
*
**
*
**
0
20
40
60
80
100
Placebo (N=39)
20 μg/kg (N=46)
40 μg/kg (N=34)
In subjects with advanced cachexia, responders were defined as those who
experienced both LBM gain and functional improvement. Significantly higher
proportion of responders in the SUN11031 treated than in the placebo groups

International Congress on GH 4 March 2011 29
Increase in LBM and Improved Performance
(Advanced Cachexia Population)Percentage of Subjects with LBM Increase,
by Treatment Group (Advanced Cachexia Population)
% o
f S
ubje
ct w
ith
LB
M I
ncre
ase
Ba
se
line
Absolute and Percentage Change in SPPB
Score (Advanced Cachexia Population with
LBM Gain)
% C
han
ge
fro
m B
aselin
e S
PP
B
56.4
** P < 0.01
5.5
*20.0
* P < 0.05
15.1
6.3
Day 2
9
Day 5
7
Day 8
5
88.2
81.8
**
*
6.2
5.6
3.8
8.1
6.5
* P < 0.05
*
0
5
10
15
20
25Placebo (N=22)
20 μg/kg (N=36)
40 μg/kg (N=30)
0
20
40
60
80
100
Placebo (N=37)
20 μg/kg (N=33)
40 μg/kg (N=40)
1.37 Point Change
P < 0.05
0.97 Point Change
P < 0.061

International Congress on GH 4 March 2011 30
Most Frequently Reported TEAEs (>5% in Any Treatment Group)
Preferred Term, N (%)
PlaceboN=73
SUN1103120 µg/kg bid
N=75
SUN1103140 µg/kg bid
N=76
COPD 23 (31.5) 20 (26.7) 16 (21.1)
Injection site hematoma 7 (9.6) 3 (4.0) 7 (9.2)
Headache 5 (6.8) 4 (5.3) 5 (6.6)
Weight decreased 3 (4.1) 6 (8.0) 4 (5.3)
Bronchitis 4 (5.5) 5 (6.7) 3 (3.9)
Diarrhea 7 (9.6) 2 (2.7) 1 (1.3)
Nasopharyngitis 1 (1.4) 6 (8.0) 2 (2.6)
Nausea 3 (4.1) 1 (1.3) 5 (6.6)
Back pain 1 (1.4) 4 (5.3) 3 (3.9)
Injection site pain 2 (2.7) 4 (5.3) 2 (2.6)
Abdominal pain upper 0 (0.0) 4 (5.3) 3 (3.9)
Hypertension 4 (5.5) 1 (1.3) 1 (1.3)
Insomnia 1 (1.4) 0 (0.0) 4 (5.3)
Hyperhidrosis 0 (0.0) 2 (2.7) 4 (5.3)

International Congress on GH 4 March 2011 31
Conclusions• Treatment of subjects with COPD-associated cachexia with the orexigenic
and pro-anabolic hormone, SUN11031 at 20 and 40 µg/kg bid resulted in rapid and significant increases in body weight and lean body mass
• In the ITT population these increases were not associated with improvement in any of the functional performance measures evaluated
• Selection of subjects with more advanced cachexia who also gained LBM by Day 85, revealed a statistically significant and clinically meaningful increase in performance on the SPPB in subjects receiving 40 µg/kg bid but not 20 µg/kg bid
• SUN11031 was safe and well-tolerated in both dosage groups. No medically important treatment-related changes were reported in any of the hematology, chemistry, urinalysis, or glucose metabolism parameters, ghrelin antibody levels, or vital signs. Local tolerance of the injections was good
• The use of a more stringent definition of cachexia and endpoints designed to assess lower body function rather than cardio-respiratory fitness may permit a more accurate assessment of the role of agents designed to treat cachexia in COPD