ghita, melania georgeta (2014) molecular …eprints.nottingham.ac.uk/14480/1/melania_georgeta... ·...
TRANSCRIPT

Ghita, Melania Georgeta (2014) Molecular biomechanics of seed germination in Arabidopsis thaliana and Lepidium sativum. PhD thesis, University of Nottingham.
Access from the University of Nottingham repository: http://eprints.nottingham.ac.uk/14480/1/MELANIA_GEORGETA_GHITA__ID_No_4147982.pdf
Copyright and reuse:
The Nottingham ePrints service makes this work by researchers of the University of Nottingham available open access under the following conditions.
This article is made available under the University of Nottingham End User licence and may be reused according to the conditions of the licence. For more details see: http://eprints.nottingham.ac.uk/end_user_agreement.pdf
For more information, please contact [email protected]

MOLECULAR BIOMECHANICS
OF SEED GERMINATION IN
ARABIDOPSIS THALIANA AND
LEPIDIUM SATIVUM
MELANIA GEORGETA GHITA
BSc (Hons), MSc
A thesis submitted to The University of Nottingham for
the degree of Doctor of Philosophy
June 2014
i
Abstract
Seed germination is a key process in world agriculture. For this reason, the
capacity of a seed to germinate with minimum input from farmers is highly
desirable, keeping the production costs as low as possible. The physiological
mechanism of germination is well known, involving the rupture of the
endosperm and testa envelope by the expanding embryo, but the molecular and
biomechanical changes underlying this process are poorly understood. In order
to answer the question of how the plant developmentally regulates changes in
cell wall stiffness associated with germination, an innovative molecular
biomechanics approach was developed. It combines biophysical, engineering
and molecular biology approaches. A comparative approach was taken using
the related species Arabidopsis thaliana and Lepidium sativum, the former due
to the wealth of genomic resources, and the latter due to larger size and ease of
use in biomechanics experiments.
Environmental scanning electron microscopy imaging revealed that the
endosperm structure is intact after protrusion of the radicle, confirming the fact
that rupture occurs between individual cells. Germination is a process that
requires targeted cell separation or/ and cell wall remodeling. For this reason,
following the predictions of the gene network SeedNet, containing the
endosperm-specific sub-network cluster 19 (Bassel et al., 2011), endosperm
specific genes were studied.
In order to localize their expression, promoter::GUS constructs were used
for the genes DELTA-VPE, SCPL51 and DOF2.1, and different mutant alleles
of four transcription factors from cluster 19 (athb23, bhlh-115, bee2 and
dof2.1) were screened to identify changes in germination behaviour.
DELTA-VPE and SCPL51 were proven to be endosperm specific and ABA
insensitive. DELTA-VPE was GA insensitive and SCPL51 expression required
GA. Also, DELTA-VPE expression could be observed after 15 minutes of
imbibition in the whole endosperm, while SCPL51 showed a temporal
expression requiring 18 hours of imbibition before being observed in all
endosperm cells. The analysed T-DNA lines showed an epistatic relationship
ii
between ATHB23 and DOF 2.1 and a decreased sensitivity to stress factors like
osmotic and salt stresses, than the wild type.
Using nanoindentation, a differentiation between different regions of
endosperm was attempted, but the methodology was not sensitive enough.
However, different elastic modulus values for imbibed and dry Lepidium seeds
were registered. To image the internal changes in seed structure during
germination, micro-CT was used, estimating values for endosperm thickness
from dry state to germinated one.
This work enforces the knowledge of the molecular biology and
biomechanical properties of the endosperm.

iii
Acknowledgements
I would like to thank to my supervisors Dr. Nicola Everitt and Prof.
Michael Holdsworth, for their support, encouragement and guidance through
my PhD.
I would like to thank Holdsworth lab members who have assisted me in
my project but also making a familiar and enjoyable place to work: Dr. Cristina
Sousa Correia, Julietta Marquez, Geeta Prasad, Sophie Berckhan, Dr.
Guillermina Mendiondo, Dr. Jorge Vicente Conde, Daniel Rooney, Dr. Daniel
Gibbs and many others unmentioned here.
I would like to thank to my family who supported me all these years, and
to my best friend Mileva Jarcov for her continuous support. NIHIL SINE DEO
iv
ABSTRACT i
ACKNOLEDGMENTS iii
TABLE OF CONTENTS iv
LIST OF FIGURES vii
LIST OF TABLES ix
LIST OF ABBREVIATIONS x
1 LITERATURE REVIEW 1
1.1 The importance of seeds 1
1.2 Engineering seed germination 1
1.3 Seed structure 2
1.4 Seed dormancy and germination 2
1.4.1 Seed dormancy 2
1.4.2 Seed germination 4
1.5 Plant hormones involved in seed germination 5
1.5.1 ABA 5
1.5.2 Ethylene 8
1.5.3 Gibberellins 9
1.5.4 Auxin 11
1.5.5 Cytokinins 12
1.5.6 Brassinosteroids 13
1.6 The function of the endosperm in germination 14
1.6.1 Endosperm development 15
1.6.2 Testa rupture and endosperm weakening during germination 16
1.7 The correlation gene network 18
1.8 Plant biomechanics 21
1.8.1 Biomechanics of seed germination 22
1.9 Seed cell wall structure 24
1.9.1 New cell wall remodeling proteins 25
1.9.2 Cell wall expansin 26
1.10 Methods to study plant biomechanics 27
1.10.1 Atomic force microscopy 27
1.10.2 Nanoindentation of biological materials 28
1.10.2.1 Principle of the method 29
1.10.2.2 Adaptation for indentation of polymeric biomaterials and
tissues
31
1.10.2.3 Indenter shape and size 32
1.10.2.4 Corrections to recorded data 32
1.10.2.5 Material related effects 34
1.10.3 Micro x–ray computed tomography 35
1.10.4 Digital image correlation (DIC) 35

v
1.11 Recent work in seed germination mechanics 37
1.12 Aims of the project 38
2 Materials and Methods 39
2.1 Seeds and plants 39
2.1.1 Seed material 39
2.1.1.1 Seed sterilization and plating 39
2.1.1.2 Germination media 39
2.1.1.3 Seed germination conditions 39
2.1.2 Plant growth conditions 40
2.1.3 Statistical treatment 40
2.1.4 Cross pollination of Arabidopsis plants 40
2.2 RNA manipulation 41
2.2.1 Borate isolation of RNA 41
2.2.2 QiagenRNeasy RNA extraction kit 41
2.2.3 QiagenRNeasy plant mini Kit – RNA clean up protocol 41
2.2.4 RNA gel electrophoresis 42
2.2.4.1 1xMOPS gel buffer 42
2.2.4.2 5 x RNA loading buffer 42
2.2.5 First strand cDNA synthesis 42
2.3 DNA manipulation 43
2.3.1 PCR reaction 43
2.3.2 Promoter cloning through Gateway cloning system 44
2.3.2.1 BP clonase reaction 45
2.3.2.2 LR clonase reaction 46
2.3.2.2.1 LB media- Luria-Bertani 48
2.3.3 Transformation of recombinant clones from LR reaction into
competent Agrobacterium tumefaciens GV3101 PMP90
48
2.3.3.1 Agrobacterium-mediated Arabidopsis plant transformation 49
2.3.3.1.1 Selection of transformed plants 49
2.4 β-glucuronidase (GUS) staining 50
2.4.1 Preparing the GUS stain 50
2.4.2 Performing GUS staining 50
2.4.3 Mounting embryos and endosperms 51
2.5 Nanoindentation 51
2.5.1 Initial system evaluation 51
2.5.2 Indentation conditions 52
2.5.3 Statistical analyses of nanoindentation results 53
2.6 Micro x–ray computed tomography 53
2.6.1 Statistical analyses of estimated endosperm thickness 54
2.7 Environmental scanning electron microscopy 55

vi
2.8 Atomic force microscopy 55
2.9 Digital image correlation 56
2.10 Yeast1 hybrid screening 56
2.10.1 Preparation of bait and prey constructs 56
2.10.2 Preparation of bait and control prey constructs inoculum for
mating
57
2.10.2.1 YPAD medium 57
2.10.3 Mating of yeast strains 58
2.10.4 Enrichment for mated (diploid) cells 58
2.10.5 3-AT titration of diploid cells 58
2.10.6 Scoring yeast growth 58
3 Results 59
3.1 Analysis of endosperm specific gene expression in
Arabidopsis
59
3.1.1 Introduction 59
3.1.2 Analysis of the genetic function of EXPA2 in germination 61
3.1.3 Analysis of promoters of cluster 19 genes 64
3.1.4 Analysis of cluster 19 promoter expression in the endosperm 69
3.1.4.1 Reporter expression drive by cluster 19 promoters 69
3.1.4.2 Effect of ABA/GA on expression driven by cluster 19
promoter GUS lines in seeds
71
3.1.4.3 Is an embryo signal controlling endosperm genes expression? 74
3.1.4.4 Temporal GUS expression for cluster 19 promoters 79
3.1.4.5 Analysis of the genetic regulation of endosperm function by
cluster 19 transcription factors
82
3.1.4.6 Testing putative interactions between EXPA2 promoter and
cluster 19 transcription factors using yeast one hybrid system
89
3.2 Biomechanics and imaging 95
3.2.1 Nanoindentation of plant materials 95
3.2.2 Atomic force microscopy 100
3.2.3 Imaging Lepidium seeds using micro-CT 101
3.2.4 Digital image correlation 111
4 Discussion 113
4.1 Investigating molecular biomechanics 113
4.2 Molecular dissection of endosperm specific gene expression 114
4.2.1 Endosperm specific gene expression 115
4.2.2 Control of seed germination by EXPA2 118
4.2.3 Putative interaction between EXPA2 promoter fragments and
transcription factors from cluster 19
119
vii
4.3 Biomechanical dissection of endosperm function 120
4.3.1 Imaging Lepidium seeds using micro-CT 122
4.3.2 Correlating gene activity with endosperm rupture in seed
germination
123
4.3.3 Conclusion 125
4.4 Future work 126
4.4.1 Confirming the role of EXPA2 in endosperm function 126
4.4.2 Adjustments of biomechanics and imaging approaches 127
4.4.3 New techniques to be used in endosperm physical properties
assessments
127
5 Bibliography 129
List of Figures
Figure 1.1 Time course of major events associated with germination and
subsequent postgerminative growth
4
Figure 1.2 Structure of a mature seed of Lepidium sativum 15
Figure 1.3 Arabidopsis and Lepidium seeds 16
Figure 1.4 The correlation gene network 18
Figure 1.5 Cluster 19 of the SeedNet 20
Figure 1.6 Schematic of (a) a typical load-displacement curve;
(b) the indentation process
29
Figure 2.2 MML Nanotest NTX Instrument 52
Figure 3.1 EndoNet, gene network, interactions represented by edges.
EXPA2 interactions with genes from different clusters
60
Figure 3.2 EXPA2 expression in the whole seed using
Nottingham Seed eFP Browser
62
Figure 3.3 T-DNA lines with the insertion positions for EXPA2
(At5g05290)
63
Figure 3.4 Graphs of testa rupture (%) of expa2-2 in comparison with
the wild type (Col-0)
64
Figure 3.5 DOF2.1 expression in the whole seed using
Nottingham Seed eFP Browser
65
Figure 3.6 DELTA-VPE expression in the whole seed according to
Nottingham Seed eFP Browser
66
Figure 3.7 SCPL51 expression in Arabidopsis seed, using Nottingham
vSEED eFP Browser
67
Figure 3.8 (A) Promoter fusion construct for promDELTA-VPE::GUS
and promSCPL51::GUS; (B) Translation fusion construct for
promDOF2.1::DOF2.1::GUS
68
Figure 3.9 (A) PCR amplification products of promoters;
(B) Digestion results with BsrGI of the promoters cloned into
donor vector pDONR221;
(C) Digestion products with BsrGI of promoters cloned into
final vector pKAN and pGWB433
68
viii
Figure 3.10 Germination assay for the promoter::GUS lines used in the
endosperm specific experiments
70
Figure 3.11 Expression properties of the promSCPL51::GUS,
promDELTA-VPE::GUS and promDOF2.1::DOF2.1::GUS
71
Figure 3.12 GUS expression in the promoters’ response to ABA
treatment
72
Figure 3.13 GUS expression for the cluster 19 genes, as a response to GA 73
Figure 3.14 Endosperms stained after 30 hours imbibed on 1/2MS + 50
µM Norflurazon
73
Figure 3.15 GUS expression in endosperm separated after 15-30 minutes
of imbition
75
Figure 3.16 GUS expression in endosperm separated after 30-45 minutes
of imbition
76
Figure 3.17 GUS expression in endosperm separated after 45-60 minutes
of imbition
78
Figure 3.18 GUS expression in separated endosperms after 6 hours of
imbibition
79
Figure 3.19 GUS expression in separated endosperms after 12 hours of
imbibition
80
Figure 3.20 GUS expression in separated endosperms after 18 hours of
imbibition
81
Figure 3.21 GUS expression in separated endosperms after 24 hours of
imbibition
81
Figure 3.22 T-DNA lines used in this study with the insertion positions
for cluster 19 transcription factors.
83
Figure 3.23 Germination assays for athb23, dof2.1 and the double mutant
athb23dof2.1.
84
Figure 3.24 Germination assay for bee2, bhlh115 and the double mutant
bee2bhlh115
85
Figure 3.25 Germination scores for athb23, dof2.1 and athb23dof2.1 on
media containing stress agents
86
Figure 3.26 Testa rupture (%) of athb23 and athb23dof2.1 mutants scored
for 7 days on 3 different concentrations of PAC
87
Figure 3.27 GUS expression over 24 hours of imbibition for
promEXPA2::GUS in athb23 background and Col-0
88
Figure 3.28 Transcription factors binding sites and small RNA target sites
for EXPA2, 1200bp upstream ATG; displayed map using
AthaMap
89
Figure 3.29 EXPA2 promoter (1200bp upstream ATG) was split in 4
fragments of 400bp and 300bp
90
Figure 3.30 Digestion products of EXPA2 promoter fragments cloned in
pHISLEU2GW (BsrGI)
90
Figure 3.31 BsrGI digestion products of TFs cloned into pDEST22 90
Figure 3.32 Diploids cells on selective media DOB-L-W 92
Figure 3.33 Diploid cells grown on auxotrophic media (DOB-L-W-H). 93
Figure 3.34 Yeast one hybrid screening of transcription factors: DOF2.1,
bHLH, ATHB23 and BEE2 with EXPA2 promoter fragments:
E1, E2, E3 and E4, on auxotrophic media containing
increasing 3-AT concentrations
94
Figure 3.35 Load-displacement curves of Arabidopsis Col-0 leaves 95

ix
Figure 3.36 Reduced modulus (GPa) for Arabidopsis mutants qua2,
xxt1xxt2, arad1 leaves in comparison with their wild type
correspondent Col-0 and QRT, respectively
96
Figure 3.37 Reduced modulus (GPa) results for Arabidopsis Col-0 leaves,
indented on both sides: adaxial (the upper surface of the leaf)
and abaxial (the lower surface of the leaf) sides.
97
Figure 3.38 Results of nanoindentation dry cress seeds (Lepidium
sativum).
98
Figure 3.39 Hardness (GPa) and reduced modulus (GPa) for Lepidium
seeds imbibed for 1 and 16 hours
99
Figure 3.40 AFM images of a dry Arabidopsis seed 100
Figure 3.41 Micro-CT images of Lepidium seeds, at different imbibition
time points: dry, 1hour, 3 hours, 8 hours no testa ruptured, 8
hours with testa ruptured, and 16 hours of imbibition
102
Figure 3.42 2D micro-CT of an imbibed Lepidium seed. 103
Figure 3.43 Micro-CT 2D pictures of a dry Lepidium seed 104
Figure 3.44 Micro-CT 2D section of a 1 hour imbibed Lepidium seed 105
Figure 3.45 Micro-CT 2D section of an 8 hours imbibed Lepidium seed 106
Figure 3.46 Micro-CT 2D picture of a Lepidium germinated seed using
VG Studio Max
107
Figure 3.47 eSEM Arabidopsis germinating seed 108
Figure 3.48 Mean values of Lepidium endosperm thickness at 5 time
points
109
Figure 3.49 Mean values for micropylar endosperm (ME), lateral
endosperm (LE) and peripheral endosperm (PE) thickness, at
different moments of imbibition
110
Figure 3.50 Three Lepidium seeds without testa, coated with Cr powder 111
Figure 3.51 Displacement heat maps for Lepidium seeds generated using
Istra 4D
111
Figure 3.52 Strain heat maps for Lepidium seeds, on chosen area of
interest
112
LIST OF TABLES
Table 2.1 Primers used for different amplifications: Gateway primers;
Primers used in genotyping the T-DNA lines, including the
insertion.
43

x
LIST OF ABBREVIATIONS
3-AT 3-Amino-1, 2, 4-triazole
ABA Abscisic acid
AFM Atomic force microscopy
BR Brassinosteroids
COT Cotyledons
CRWEs Cell wall remodeling enzymes
DIC Digital image correlation
dNTPs Deoxynucleotide triphosphates
DRY Whole dry seeds
E Establishment
Er Elastic modulus
eSEM Environmental scanning electron microscopy
G Germination
GA Gibberellic acid
GFP Green fluorescence protein
GO Genome ontology
GPa GigaPascal
GUS β-glucuronidase
H Hardness
HIS Histidine
IAA Indol-3-acetic acid (auxin)
IKI Iodine potassium iodide
Leu Leucine
MCE Micropylar and chalazal endosperm
MD Morphophysiological dormancy
Micro-CT Micro x–ray computed tomography
PAC Paclobutrazol
PD Physiological dormancy
PE Peripheral endosperm
PEG Polyethylene glycol
PMEs Pectin metylesterases
PY Physical dormancy
PY+ PD Combinational dormancy
RAD Radicle
TR Testa rupture
TRs Transcription factors
W Tryptophan
1
1. Literature review
1.1 The importance of seeds
Seeds are a vital component of the world`s diet. Also, with seeds the next
generation of plants begins. The seed contains the embryo as a new plant in
miniature and is physiologically equipped for its role of food supplier for the
seedling, until it becomes a plant.
1.2 Engineering seed germination
Seeds studies are performed either for understanding the plant evolution
and biodiversity, competition with other plants, adaptation to adverse
environmental conditions or tolerance to drought, salts, heavy metals, etc. or
just for the scientific knowledge. Seeds remain an important factor of the world
food security as major nutritional source for humans and livestock.
Crop yields depend largely on germination quality. For this reason
understanding germination helps to improve seed priming (regulated
germination) and the co-existence with other crops, but also to minimize seed
dispersal in crop plants and to generate yield increase (Liljegren et al., 2000).
The development of proteins markers for seed vigour contributed
significantly to seed longevity (Ogé et al., 2008) improving crop seed quality
further used as food, feed or green chemistry (increased content of vitamins A
and E in crops (DellaPenna, 2005) and usage of plant oils for the production of
chemicals and biofuels (Damude & Kinney, 2007; Ruiz-López et al., 2009)).
In order to engineer seed germination the principles behind it must be first
understood and described. How the protective layers of the embryo are
physically arresting the radicle protrusion, but also what genetic background is
involved in germination, are questions still to be answered.
To improve the resistance of seeds to mechanical harvesting, transportation
and storage, the physical properties of the covering layers must be known, in

2
order to avoid the deterioration or viability loss of seeds (Khodabakhshian,
2012).
Biomechanical analysis of seed germination aims to elucidate the physics
and also the mechanics of this physiological process. How the physical
properties of endosperm change through the germination process is still unclear
for Arabidopsis, although for Lepidium was proven that it is weakening in the
micropylar region (the 0.5 mm long, cone-shaped, region of the endosperm
enclosing the radicle tip) prior radicle protrusion (Müller et al., 2006).
1.3 Seed structure
In angiosperms the double fertilisation process leads to three genetically
distinct seed tissues: the seed coat (maternal origin), the triploid endosperm
(two maternal sets of chromosomes and one paternal) and the diploid embryo
(Berger et al., 2006).
The most outer layer of the seed is called testa, consisting of dead tissue in
mature Arabidopsis and Lepidium seed accumulates mucilage or flavonoids
(Figure 1.2). Testa confers seed coat imposed dormancy (Debeaujon &
Koornneef, 2000).
1.4 Seed dormancy and germination
1.4.1 Seed dormancy
Dormancy is an adaptive trait that optimizes the distribution of germination
over time in a population of seeds (Bewley, 1997). A broad definition of
dormancy was proposed by Baskin & Baskin, in 2004: a dormant seed does not
have the capacity to germinate in a specified period of time under any
combination of normal physical environmental factors that are otherwise
favourable for its germination (Baskin & Baskin, 2004).

3
Although dormancy can be measured only by the absence of germination, it
is rather a characteristic of the seed that determines the conditions required for
germination (Vleeshouwers, 1995; Fenner & Thompson, 2005). Baskin &
Baskin (2004), have proposed a comprehensive classification system, based on
the devised dormancy classification system developed by Nikolaeva in 1967,
which considers both morphological and physiological properties of the seed
(Nikolaeva, 2004). This system includes five classes of seed dormancy:
physiological (PD), morphological (MD), morphophysiological (MPD),
physical (PY) and combinational (PY+ PD).
Physiological dormancy is the most common dormancy class and it is
found in seeds of gymnosperms and all major angiosperm clades. The system
proposed by Baskin & Baskin (2004) divides physiological dormancy into
three levels: deep, intermediate and nondeep. In the first level, the embryos
excised from the seeds either do not grow or will produce abnormal seedlings.
Treatment with gibberellic acid does not break dormancy, and stratification
(subjecting seeds to cold and moist conditions, simulating winter conditions) is
required before germination can take place (Baskin & Baskin, 2004).
The great majority of seeds, including those of Arabidopsis thaliana, have
nondeep PD (Baskin & Baskin, 2004). Excised embryos from these seeds
produce normal seedlings. Gibberellic acid (GA), scarification (physical
alteration of the seed coat) and stratification can break this type of dormancy.
Morphological dormancy appears in seeds with undeveloped but
differentiated embryos. These embryos are not dormant, but simply need time
to grow and germinate, e.g. Apium graveolens (Jacobsen & Pressman, 1979).
Morphophysiological dormancy is also evident in seeds with
undeveloped embryos, but in addition they have a physiological component to
their dormancy. These seeds require a dormancy-breaking treatment (Baskin &
Baskin, 2004).

4
Physical dormancy is caused by impermeability of the seed or fruit coat,
which prevents water-uptake by seed. This type of dormancy can be broken by
mechanical or chemical scarification (Baskin, 2003).
Combinational dormancy is evident in seeds with water-impermeable
coats combined with physiological embryo dormancy (Baskin & Baskin,
2004).
1.4.2 Seed germination
Seed germination consists of those events that commence with water
uptake by the quiescent dry seed and terminate with the elongation of the
embryonic axis (Bewley & Black, 1994).
Uptake of water by a mature dry seed is triphasic (Figure 1.1), with a rapid
initial uptake followed by a plateau phase. A further increase in water uptake
occurs only after germination is completed, as the embryonic axis elongates
(Bewley, 1997).
Figure 1.1 Time course of major events associated with germination and subsequent
postgerminative growth (Taken from Bewley, 1997).
5
Upon imbibition, the seed rapidly resumes metabolic activity. The
structures and enzymes necessary for this initial resumption of metabolic
activity are generally assumed to be present within the dry seed, having
survived the desiccation phase that terminates seed maturation (Bewley, 1997).
The embryo-covering layers can confer mechanical constraint that must be
overcome by the growth potential of the embryo (Kucera et al., 2005). Two
forms of mechanical constrains and release mechanisms can be distinguished:
(1) living seed-covering layers, where a regulated tissue weakening occurs
before germination and the tissue itself can produce enzymes for this process
(e.g. endosperm or inner testa) and (2) mostly dead seed-covering layers where
predetermined breaking points facilitate tissue rips before germination (e.g.
outer testa, pericarp). Enzymes facilitating testa rupture might be released by
the endosperm and/ or the radicle (Morris et al., 2011; Lee et al., 2012).
1.5 Plant hormones involved in seed germination
Among the most important functions of plant hormones are controlling and
coordinating cell division, growth and differentiation (Hooley, 1994). The
phytohormones: abscisic acid (ABA), ethylene, gibberellins (GA), auxin
(IAA), cytokinins, and brassinosteroids are biochemical substances controlling
many physiological and biochemical processes in the plant. These vital
molecules are produced by plants and also by soil microbes (Jiménez, 2005;
Santner et al., 2009).
Plant hormones can affect different seed physiological processes including
dormancy and germination (Graeber et al., 2010). The major hormones
influencing germination and dormancy are discussed below.
1.5.1 ABA
Recent studies have elucidated the core of ABA signaling pathway.
PYRABACTIN RESISTANCE 1 (PYR1) was identified as an ABA receptor

6
through a chemical genetics approach (Park et al., 2009). The Arabidopsis
genome encodes 13 genes similar to PYR1, which were named as PYR1
LIKE1-13 (PYL1-13). Ma et al., 2009, named them RCARs (REGULATORY
COMPONENTS OF ABA RECEPTOR (Ma et al., 2009). All PYR1/PYL1-
PYL13/RCARs belong to the same gene family in Arabidopsis (Park et al.,
2009; Ma et al., 2009).
Protein phosphatase 2C (PP2C) was proven to be acting as a negative
regulator in ABA signaling (Rodriguez et al., 1998). ABSCISIC ACID
INSENSITIVE1, 2 (ABI1, ABI2), identified based on their insensitivity to ABA
have been shown to encode paralogous of PP2Cs (Meyer et al., 1994; Leung et
al., 1997).
HOMOLOGY TO ABI1 (HAB1 and HAB2) are also two other ABA
signaling regulators (Saez et al. 2004). Another PP2Cs important for the ABA
response of germination, are ABA-HYPERSENSITIVE GERMINATION1 and 3
(AHG1 and AHG3); AHG1 function is specific to seed germination and early
post-germinative growth, whereas AHG3 is involved in later stages of growth
(Nishimura et al., 2007).
ABA induction of ABI1 and ABI2, negative regulators of ABA signaling,
is inhibited by the transcription factor ABI3 in a feed-forward pathway (Suzuki
et al., 2003). In another feed-forward pathway, ABI3 activates the
transcription factor ABI5, a positive regulator of ABA signaling (Lopez-
Molina et al., 2002).
ABI5 is important in determining ABA responsiveness during
embryogenesis, seed maturation and regulating the transition after germination
to vegetative growth (Finkelstein & Lynch, 2000). ABI5 promoter activity was
observed in the whole embryo and specifically in the micropylar endosperm in
the presence of high ABA concentration (Penfield et al., 2006), confirming its
role in arresting the germination potential (Bewley, 1997).
Other positive regulators of ABA signaling have been identified as SNF-1
related protein kinases 2 (SnRK2s) (Nambara et al., 2010). In Arabidopsis, 10

7
SnRK protein kinases were identified and divided into 3 subclasses. Only three
of them: SRK2D/SnRK2.2, SRK2I/SnKR2.3 and SRKD2E/SnRK2.6/OST1 are
involved in seed germination, being strongly controlled by ABA (Nakashima et
al., 2009).
The proposed model of ABA signal transduction begins with ABA binding
to the PYR/PYL/RCAR. This binding inhibits PP2C activity, thus the
phosphorylated state of SnRK2s. PP2Cs normally de-phosphorylate SnRK2s,
keeping them inactive. De-repression of SnRK2s protein kinase activates
downstream signaling targets by phosphorylation such as ABI5 and other
transcription factors (Nambara et al., 2010).
ABA deficiency during seed development is associated with the absence of
primary dormancy of the mature seed (Koornneef & van der Veen, 1980;
Kucera et al., 2005). ABA production can have dual origins: the embryo or
maternal tissues, but only the ABA of embryonic origin is necessary to impose
dormancy (Nambara & Marion-Poll, 2003). ABA deficient mutants not only
exhibit the appearance of nondormant seeds but also show seed vivipary
(precocious germination on mother plant).
In Arabidopsis, the inhibitory effects of ABA on germination is through
delaying the radicle expansion and weakening of the endosperm, as well as the
enhanced expression of transcription factors, which may adversely affect the
process of seed germination (Graeber et al., 2010; Müller et al., 2006).
Upon seed imbibition, within the first 12 hours, the ABA level in dormant
and nondormant seeds drops 10 fold (Piskurewicz et al., 2008). Dormant seeds
have the capacity to synthesize de novo ABA; however the mechanism by
which this happens is still unknown (Lee et al., 2010).
The Arabidopsis abi have been identified by selecting the seeds capable of
germination on high ABA concentrations media, inhibitive for the wild type
(Koornneef & Karssen, 1994).
8
The abi1 mutant seed phenotype was described as having reduced
dormancy, easily broken by chilling or dry storage, reduced ABA sensitivity of
germination and no precocious germination (Beaudoin et al., 2000).
The abi3 and 4 showed reduced seed longevity and reduced chlorophyll
breakdown, which might be due to the reduced seed dormancy (Clerkx et al.,
2003).
1.5.2 Ethylene
Compared with the other plant hormones, ethylene has the simplest
biochemical structure (C2H4). However, it influences a wide range of plant
processes, e.g. flowering, fruit ripening, aging, dormancy inhibition and seed
germination (Matilla, 2000; Matilla & Matilla-Vázquez, 2008; Arteca &
Arteca, 2008).
It is not yet understood how ethylene influences seed germination. There
are different ideas regarding seed germination. According to several studies,
ethylene is produced as a result of seed germination, while others claim that
ethylene is a prerequisite condition for seed germination (Matilla, 2000;
Petruzzelli et al., 2000; Petruzzelli et al., 2003).
The amount of ethylene increases during the germination of many plant
seeds including wheat, corn, soybean and rice, affecting the rate of seed
germination (Pennazio & Roggero, 1991). Ethylene production is higher in
non-dormant seeds than in dormant seeds (Matilla, 2000).
The primary action of ethylene could be the promotion of radial cell
expansion in the embryonic hypocotyl, increased seed respiration or water
potential (Kucera et al., 2005). High-level induction of ABA-sensitive class I
β-1,3-glucanase gene expression in the micropylar endosperm of tobacco seeds
requires endogenous ethylene and promotes endosperm rupture (Leubner-
Metzger et al., 1998).

9
Brassinosteroids and auxin are able to stimulate the production of ethylene
(Arteca & Arteca, 2008). Gibberellins, ethylene and BR can induce seed
germination by promoting the rupture of testa and endosperm, while
antagonistically interacting with the inhibitory effects of ABA on seed
germination (Finch-Savage & Leubner-Metzger, 2006; Holdsworth et al.,
2008).
Ethylene is perceived by a family of receptors related to Arabidopsis
ETR1 (ETHYLENE RESPONSE1), the first cloned plant hormone receptor,
and its binding inhibits the signaling activities of this receptors family
(Stepanova & Alonso, 2005).
In the absence of ethylene, the ETR1 activates CTR1, CONSTITUTIVE
TRIPLE RESPONSE1, which is a negative regulator of downstream signaling
components. CTR1 is inactive in the presence of ethylene (Schaller et al.,
1995; Stepanova & Alonso, 2005). Also, ETHYLENE-INSENSITIVE2 (EIN2)
is a downstream signaling component, which in the absence of ethylene is
down-regulated by CTR1 (Kendrick & Chang, 2008).
ctr1 and ein2 have been recovered as receptors and suppressor mutants,
respectively, of abi1 (Beaudoin et al., 2000). Also, era3 enhanced response to
ABA3 was showing an increased sensitivity of the seeds to ABA by
overaccumulating of ABA (Ghassemian et al., 2000). Ethylene has been shown
to interact with ABA in its role in the promotion of germination (Linkies et al.,
2009; Linkies & Leubner-Metzger, 2012).
1.5.3 Gibberellins
The most active endogenous gibberellin in Arabidopsis is GA4; its
expression increases with seed imbibition and reaches its peak just before
radicle protrusion (Ogawa et al., 2003), underlying the importance of the novo
GA biosynthesis for the radicle protrusion control, in Arabidopsis seeds.

10
Severe mutants defective in GA biosynthesis like ga1-3 (null allele), GA1
gene is deleted, defective in ent-copalyl diphosphate synthase (a step in GA
biosynthesis pathway (Sun & Kamiya, 1994), fail to germinate displaying
dwarfism, reduced fertility and delayed flowering (Richards et al., 2001).
Positive regulators of GA signaling pathway in Arabidopsis, are SLY1
(SLEEPY1) and PKL (PICKLE), while the negative regulators include SHI,
SPY, RGA, GAI, RGL1 and RGL2 (McGinnis et al., 2003). SLY1 encodes an F-
box component of the SCF E3 ubiquitin ligase. This component mediates the
GA-induced degradation of the DELLA proteins GAI, RGA, RGL2, removing
their negative regulatory action and allowing the promotion of the GA-induced
response (Tyler et al., 2004).
DELLA proteins are conserved growth repressors that modulate all aspects
of GA responses. These GA-signalling repressors are nuclear localized and
likely function as transcription associated regulators. Recent studies
demonstrated that GA, upon binding to its receptor, depresses its signalling
pathway by binding directly to DELLA proteins and targeting them for rapid
degradation via the ubiquitin-proteasome pathway (Zentella et al., 2007).
DELLA proteins play two important roles in GA signaling: (1) they help
establish GA homeostasis by direct feedback regulation on the expression of
GA biosynthetic and GA receptor genes, and (2) they promote the expression
of downstream negative components that are putative transcription
factors/regulators or ubiquitin E2/E3 enzymes (Zentella et al., 2007).
During seed germination five DELLAs are involved: REPRESSOR OF
GA1-3 (RGA), GA-INSENSITIVE (GAI), RGL1, RGL2 and RGL3 (Tyler et al.,
2004). RGL2 is key to repressing seed germination: rgl2 can germinate on low
GA concentrations (Lee et al., 2002).
RGL2 has a conserved DELLA motif essential for its proteasome-
mediated destruction (Lee et al., 2002). GA binds to Arabidopsis
GIBERELLIN-INSENSITIVE DWARF1 (GID1)-like receptors
(GID1a, GID1b, and GID1c) (Griffiths et al., 2006; Voegele et al., 2011) and

11
enhances RGL2 interaction with the F-box protein SLEEPY 1 (SLY1),
facilitating RGL2 ubiquitination and degradation, subsequently (Feng et al.,
2008).
In addition, one of the putative DELLA targets, XERICO, promotes
accumulation of ABA that antagonizes GA effects. Therefore, DELLA may
restrict GA-promoted processes by modulating both GA and ABA pathways
(Zentella et al., 2007).
Although GAI and RGA also play a role in germination, RGL2 is
considered to be the main DELLA factor repressing germination (Lee et al.,
2002; Tyler et al., 2004). Overaccumulation of RGA may stimulates ABA
synthesis (Zentella et al., 2007).
The weakening of the endosperm is produced by GA activation of genes
encoding cell wall remodeling enzymes (Voegele et al., 2011), while ABA
prevents its weakening (Müller et al., 2006; Linkies et al., 2009).
In seeds, gibberellins stimulate the synthesis and production of hydrolases,
especially α-amylase, proteases and β- glucanases (Yamaguchi, 2008).
1.5.4 Auxin
Auxin regulates many aspects of plant growth and development through
the Transport inhibitor response1 (TIR1)/Additional F box protein (AFB)-
Aux/indole-3-acetic acid (IAA) - AUXIN RESPONSE FACTOR (ARF)
signalling system (Chapman & Estelle, 2009). ARFs regulate the expression of
a large set of auxin-responsive genes by binding to auxin response elements
(AuxREs) in their promoters (Mockaitis & Estelle, 2008).
Auxin is a plant hormone, which plays a key role in regulating cell
cycling, growth and development (He et al., 2005), formation of vascular
tissues (Davies, 1995) and pollen development (Ni et al., 2002). The growth
and development of different plant organs, including the embryos, leaves and

12
roots is believed to be controlled by auxin transport (Rashotte et al., 2000;
Popko et al., 2010).
Auxin by itself is not a necessary hormone for seed germination. However,
according to the available data, auxin is present in the seed radicle tip during
and after seed germination (Liu et al., 2007). Although indole-3-acetic acid
(IAA), the major auxin, may not be necessary for seed germination, it is
necessary for the development of young seedlings (Hentrich et al., 2013). The
accumulated IAA in the seed cotyledons is the major source of IAA for the
seedlings. In legumes, saturated fatty acids are the major source of IAA in
mature seeds (Bialek & Cohen, 1989).
Auxin enhances ABA-mediated seed dormancy through the recruitment
of ARF10/16 to maintain ABI3 expression during seed imbibition (Liu et al.,
2013) and regulates the GA pathway by modulating the effect of GA on the
levels of DELLA proteins (Fu & Harberd, 2003).
Although IAA by itself may not be important for seed germination, its
interactions and cross talk with gibberellins and ethylene may influence the
processes of seed germination and seedlings establishment (Fu & Harberd,
2003).
1.5.5 Cytokinins
Cytokinins are derived from adenine molecules. They were first
discovered in 1950, based on their ability to enhance cell division (Miller &
Skoog, 1955). They are present in developing seeds, localized in the
endosperms (Mok & Mok, 2001), it is assumed that they are required for
embryo cell divisions (Kucera et al., 2005).
The cytokinin receptors CRE1/AHK4, AHK2 and AHK3 are able to
regulate different functions related to the development and physiology of
Arabidopsis thaliana, such as: embryo development by affecting the cellular
division, seed size, seed production and germination, hypocotyls and shoot

13
growth, senescence of leaf, roots growth, nutrients uptake, handling and
surviving stress agents (Riefler et al., 2006; Heyl et al., 2012).
1.5.6 Brassinosteroids
Brassinosteroids have been identified as positive regulators of germination
and counteract the inhibitory effects of ABA during seed germination. Playing
a major role in cell elongation, cell division and skotomorphogenesis, BRs
mutants did not show any phenotype in germination (Steber & McCourt,
2001).
When used as external add, they rescued the ga1-3 (GA deficient mutant)
and sly1 (GA insensitive mutant) germination phenotypes, suggesting their role
in normal germination (Steber & McCourt, 2001).
The BR mutants share a common phenotype with GA mutants, such as
male sterility and dwarfism. DET2 encodes a steroid 5 α-reductase which is
required for BR biosynthesis (Li et al., 1997). A good candidate as BR receptor
is BRI1 (BRASSINOSTEROID INSENSITIVE1) a leucine-rich repeat
receptor-like kinase (Noguchi et al., 1999).
The BR biosynthetic det2-1 mutant and the BR insensitive bri1-1 mutant
were more affected by the ABA than the wild type, suggesting that a BR signal
is required to overcome the inhibitive effect of ABA on germination (Steber &
McCourt, 2001).
BRs, gibberellic acid and ethylene are able to increase the ability of
embryos to develop into new plants by facilitating endosperm`s rupture and
antagonistically interacting with ABA (Finch-Savage & Leubner-Metzger,
2006).

14
1.6 The function of endosperm in germination
The endosperm acts as a mechanical barrier to germination of angiosperms
seeds (Finch-Savage & Leubner-Metzger, 2006). During seed germination
there is a prerequisite condition for radical protrusion: the weakening of the
micropylar endosperm for species like Arabidopsis thaliana, species from
Asteraceae, Solanaceae and Rubiaceae (Kucera et al., 2005).
Endosperm weakening can be promoted by GA and inhibited by ABA
(Müller et al., 2006). It has been proposed that the endosperm-weakening
mechanism is part of the germination process of nondormant seeds and is not
part of a dormancy release process per se (Baskin & Baskin, 2004).
Within a dormant seed population, for all seeds, there is a distribution of
forces required to puncture the endosperm layer covering the radicle, which
moves to lower puncture forces during stratification, suggesting that these
changes begin to occur while the seed is still dormant (Finch-Savage &
Leubner-Metzger, 2006).
The endosperm structure differs between species. For example,
Arabidopsis thaliana has a single-cell layer throughout the endosperm, while
Lepidium sativum has multicellular layers in the micropylar region (Figure
1.2).

15
Figure 1.2 (A) Structure of a mature seed of Lepidium sativum. (B) Endosperm, a single cell
layer; and testa (inner and outer integument). The outer testa develops mucilage upon
imbibition. (C) Structure of the micropylar endosperm (1-2 cell layers) covering the radicle tip.
(D) Structure of the chalazal seed region. (Taken from Müller et al., 2006)
1.6.1 Endosperm development and structure
During female gametophyte development, a haploid megaspore undergoes
three rounds of mitosis without cellularization to produce an eight-nucleate
structure. Cellularization results in three antipodal cells at the chalazal pole,
one egg cell and two synergid cells at the micropylar pole, and a central cell in
the center, which inherits two nuclei.
In Arabidopsis these nuclei fuse to form the diploid central cell nucleus
and the antipodal cells degenerate before fertilization. Thus, in the mature
female gametophyte of Arabidopsis, the central cell occupies most of the
volume of the embryo sac being located at the chalazal pole.

16
The central cell has three regions that become distinct as the seed grows:
the embryo-surrounding region or micropylar endosperm (MCE), the
peripheral endosperm (PEN) in the central chamber, and the chalazal
endosperm (CZE) (Brown et al., 1999; Boisnard-Lorig, 2001; Sorensen, 2002).
In members of Brassicaceae family, the endosperm consists of three
domains: micropylar, central and chalazal (Brown et al., 1999; Sørensen et al.,
2001). The chalazal domain is assumed to play an important role in loading the
storage compounds into developing seeds (Nguyen et al., 2000; Nguyen et al.,
2001).
Arabidopsis thaliana and Lepidium sativum belong to the same family,
Brassicaceae, and although their seeds have similar anatomies and similar
germination physiology, they differ by size, significantly. For biomechanical
approaches, Lepidium seeds have a size which allows methods such as
puncture force or nanoindentation (Figure 1.3).
Figure 1.3 Arabidopsis and Lepidium seeds: (A) The larger size of Lepidium seeds allows the
use of methodologies, for which Arabidopsis seeds are too small; (B) Drawing of a mature
Lepidium seed: the embryo is enclosed by the endosperm and the surrounding testa (Taken
from Müller et al., 2006)
1.6.2 Testa rupture and endosperm weakening during germination
Testa rupture and endosperm rupture are temporally separate events during
the germination of many seeds (Leubner-Metzger, 2003; Petruzzelli et al.,

17
2003). These events are also mechanistically distinct processes, because the
testa is dead and the endosperm alive.
The current findings (Finch-Savage & Leubner-Metzger, 2006) support the
view that germination control by seed-covering layers is achieved through the
combined or successive actions of several cell-wall-modifying proteins.
In several species endosperm weakening has been associated with the GA-
induction of cell wall remodeling enzymes, e.g. in tomato seeds such as: endo-
β-mannanases (Nonogaki et al., 2000), β-1,3-glucanase and chitinases (Wu et
al., 2001) and xyloglucan endotransglycosylase (Chen et al., 2001). In
Arabidopsis, an extensin-like gene (AtEPR1) was shown to be expressed in the
micropylar endosperm (Dubreucq et al., 2000).
Analysis of transcriptome expression data sets derived from isolated
embryo and endosperm tissues could be used to reveal which cell-wall related
genes were endosperm-specific (Penfield et al., 2006). In one analysis, the
majority of the 51 cell wall-associated genes (as defined by the Genome
Ontology (GO) cellular component “cell wall”) showed higher expression in
the endosperm than embryo, encoding endotransglycosylase-related proteins,
pectin metylesterases and expansins (Holdsworth et al., 2008).
Concerning the hormones orchestrating the processes of germination,
ABA has an inhibitive effect on the endosperm rupture but not on the testa
rupture. This inhibitory effect of ABA is counteracted by GA supporting the
view that endosperm rupture is under the control of an ABA-GA antagonism
(Koornneef et al., 2002; Yamaguchi & Kamiya, 2000; Leubner-Metzger, 2003;
Kucera et al., 2005).
The hypothesis that GA is an embryo signal for the induction of the
endosperm weakening is consistent with published work on GA biosynthesis
and response during Arabidopsis seed germination (Yamaguchi et al., 2001;
Yamaguchi & Kamiya, 2000; Yamauchi et al., 2004; Ogawa, 2003).

18
1.7 The correlation gene network
Using a total of 138 samples representing three ecotypes and eight
mutants, 73 nongerminating and 65 germinating samples, Bassel et al., 2011,
generated SeedNet. A condition-dependent network model of transcriptional
interactions associated with dormant and germinating seeds, it highlights the
interactions between the germination and dormancy regulators, making
predictions of regulators interactions with 50% accuracy (Bassel et al., 2011).
This network subdivided the seed in 3 regions (Figure 1.4). Genes (nodes)
associated with dormancy were exclusively located in region 1 of the network,
while the ones associated with germination were located in region 3.
Transcripts induced by the dormancy breaking after-ripening were associated
with region 3, whilst those down-regulated by after-ripening were associated
with region 1.
Figure 1.4 SeedNet-Coexpression network in Arabidopsis seeds (Bassel et al., 2011). Region 1
(red dots) - genes associated with dormancy, ABA-up and after-ripening down regulated;
Region 3 (blue dots) - genes associated with germination, ABA down and GA up-regulated;
Region 2- genes associated with the transition between region 1 and region 3.
19
Also, according to hormonal response, the genes up-regulated by ABA
were predominantly located in region 1 of the network, although many were
present in region 3. ABA-down-regulated genes were associated with region 3.
Conversely, the genes up-regulated by GA were exclusively located in region 3
of the network, while the down-regulated ones in region 1.
In addition, genes up-regulated by ABA- regulated vegetative abiotic
stresses as drought, were associated with region 1, whilst the ones regulated by
non-ABA stresses, such as hypoxia, were not. Region 1 of SeedNet is
associated with non-germination and transcripts induced by ABA-mediated
abiotic stresses in plants.
Using a Molecular Complex Detection algorithm, there were defined 136
modules, or clusters of significantly interacting genes. These modules were
associated either with dormancy and ABA, or germination and GA, or with
genes with no developmental or hormonal control. For example, module 2 was
associated with germination and GA, comprises genes associated with cell
expansion, CWREs, protein translation, cytoskeleton or water channels. Within
the modules associated with dormancy and ABA, an abundance of key
regulators to complete the germination was found.
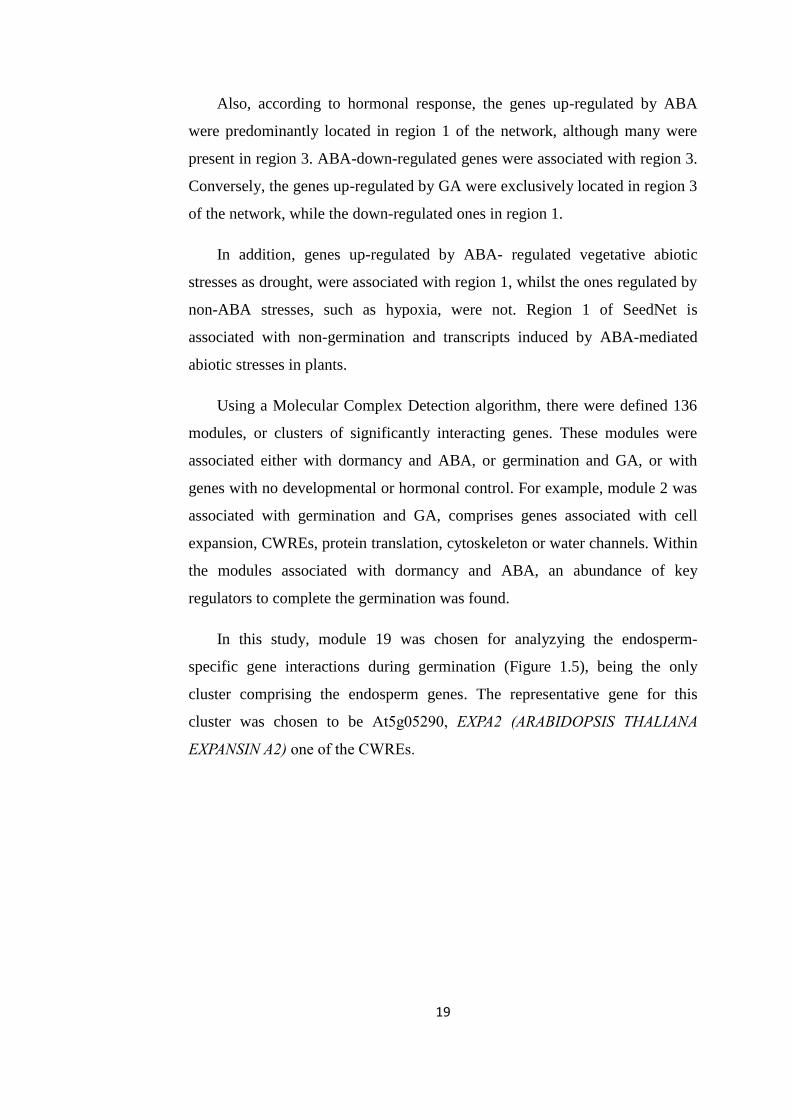
In this study, module 19 was chosen for analyzying the endosperm-
specific gene interactions during germination (Figure 1.5), being the only
cluster comprising the endosperm genes. The representative gene for this
cluster was chosen to be At5g05290, EXPA2 (ARABIDOPSIS THALIANA
EXPANSIN A2) one of the CWREs.
20
EXPA2 was shown to be exclusively expressed in germinating seeds and
the mutant (Salk_117075) showed delayed germination, suggesting
that EXPA2 is involved in controlling seed germination (Yan et al., 2014).
Also, it was proven that EXPA2 expression is controlled mainly by RGL1 and
that its overexpression confers a higher tolerance to stress factors (Ogawa et
al., 2003; Yan et al., 2014).
Figure 1.5 Cluster 19 of the SeedNet positive correlation network reveals expression
interactions between endosperm-specific components. Circles- genes: pink- others; red-
CRWEs; yellow- transcription factors. Lines- significant transcriptional interactions between
genes. Increased node size corresponds to higher degree of interaction and edge width to
interaction strength (Bassel et al., 2011).
At3g15720 glycoside hydrolase family 28 protein / polygalacturonase (pectinase) family protein At1g69530 ATEXPA1 (ARABIDOPSIS THALIANA EXPANSIN A1) At4g36540 BEE2 (BR ENHANCED EXPRESSION 2); DNA binding / transcription factor bHLH At4g21490 NDB3; NADH dehydrogenase At5g05290 ATEXPA2 (ARABIDOPSIS THALIANA EXPANSIN A2) At5g39760 ATHB23 (ARABIDOPSIS THALIANA HOMEOBOX PROTEIN 23); DNA binding / transcription
factor At1g73220 ATOCT1 (ARABIDOPSIS THALIANA ORGANIC CATION/CARNITINE TRANSPORTER1); At2g27690 CYP94C1 (cytochrome P450, family 94, subfamily C, polypeptide 1); oxygen binding At4g34600 similar to unknown protein [Arabidopsis thaliana] (TAIR:AT2G16385.1) At3g44990 XTR8 (xyloglucan:xyloglucosyltransferase 8); hydrolase, acting on glycosyl bonds At2g17710 similar to unnamed protein product [Vitisvinifera] (GB:CAO42932.1) At4g01450 nodulin MtN21 family protein At5g02260 ATEXPA9 (ARABIDOPSIS THALIANA EXPANSIN A9) At1g51070 basic helix-loop-helix (bHLH) family protein At3g20210 DELTA-VPE (delta vacuolar processing enzyme); cysteine-type endopeptidase At1g05570 CALS1 (CALLOSE SYNTHASE 1); transferase, transferring glycosyl groups At2g28510 Dof-type zinc finger domain-containing protein At2g40610 ATEXPA8 (ARABIDOPSIS THALIANA EXPANSIN A8) At2g27920 SCPL51; serine carboxypeptidase
21
1.8 Plant biomechanics
Although growth and morphogenesis are controlled by genetics, physical
shape change in plant tissue results from a balance between cell wall loosening
and intracellular pressure. Despite recent work demonstrating a role for
mechanical signals in morphogenesis, precise measurement of mechanical
properties at the individual cell level remains a technical challenge (Routier-
Kierzkowska et al., 2012).
Plant cells are surrounded by cell walls that contain considerable turgor
pressure within (Schopfer, 2006). Although morphogenesis occurs at the tissue
level (Coen et al., 2004), wall mechanical properties are controlled at the
cellular level through the deposition and chemical modification of cell wall
material (Köhler & Spatz, 2002; Baskin, 2005; Burgert, 2006; Cosgrove, 2005;
Schopfer, 2006). For this reason, the mechanical properties of the cell walls
have to be studied in planta, at the cellular and subcellular scales (Geitmann,
2006; Mirabet et al., 2011).
In 1965, Lockhart provided the first model to answer the question of
growth limitation at cellular level. For a cell to expand there are two
prerequisite conditions: the cell wall must increase its surface area and water
must enter the cell to increase its volume, concomitantly (Lockhart, 1965). Cell
extension depends on a balance of antagonizing wall-loosening and wall-
stiffening processes that can be independently regulated by different growth
factors such as hormones and light (Schopfer, 2006).
As plant shape is defined by cells number and cell size, it is important to
understand growth at cellular level. It is valid for seeds too, considering their
importance in human life, but also to explain and understand physiological
processes definitive in plants life.
Plant growth occurs when the cell wall expands, due to the differences in
turgor pressure between the cell and extracellular space, and it is possible due
to the cell wall elasticity and extensibility, physical properties given by the cell
wall components (Ray et al., 1972).

22
The cell wall is a viscoelastic complex which undergoes plastic
deformation when the turgor pressure is higher than the yield threshold. The
yield threshold describes the energy that the cell wall components can store
elastically before being irreversible deformed. This irreversible wall
extensibility is called cell wall stiffness (Braidwood et al., 2013).
In single cells, stiffness can be investigated in situ using micro and
nanoindentation methods (Geitmann, 2006). A thin probe indents the cell
surface, while both the applied load and the probe displacement are monitored.
Stiffness values are extracted by computing the slope of the force-displacement
curve at maximal indentation depth. The stiffness obtained reflects not only
cell wall elastic properties but also turgor pressure (Wang et al., 2004), cell and
indenter geometry (Bolduc et al., 2006) and mechanical stresses prior to
indentation (Zamir & Taber, 2004).
Although there are still debates on what generates growth, it is the
negative water potential or the alteration of the cell wall composition, it seems
that the growth direction is established by the components of the cell wall
(Winship et al., 2011).
1.8.1 Biomechanics of seed germination
Only in the last decade, the study of seed germination became an
interdisciplinary effort including methods and approaches from engineering,
mathematical, and computer sciences. These interdisciplinary approaches have
added a new dimension to our understanding of plant biology in general and
seed germination in particular (Geitmann & Ortega, 2009; Moulia, 2013;
Schopfer, 2006).
When dry seeds come in contact with water, water uptake is driven by the
low water potential in the dry seed. The seed cells continue to swell until the
osmotic forces are balanced by the tensile forces from viscoelastic stretching of
the cell wall, and any other forces transmitted from the surrounding cells. If the

23
cell wall flexibility is increased by cell wall restructuring then the same tensile
force will produce a larger change in size (Schopfer, 2006).
Measurements of the temporal increase of the fresh weight of seeds
through water uptake shows a triphasic water uptake profile for many species
(Bewley, 1997; Weitbrecht et al., 2011).
In a first phase rapid water uptake can be observed, concomitant with an
increase in seed volume or swelling. In a second phase, the fresh weight
remains constant for some time as the seed undergoes metabolic preparations
for the termination of germination and subsequent seedling growth. Finally, in
phase three, the embryo elongates due to more water uptake and breaks
through the covering tissue layers, marking the end of germination.
The force required for the testa rupture is given by the difference between
the embryo expansion potential and the constraint generated by its surrounding
layers. In an orthodox seed, a seed which will survive drying and/or freezing
during ex-situ conservation (Hahm et al., 2009), the embryo expansion
potential must be positive, otherwise the seed does not germinate remaining in
a dormant state (Schopfer, 2006). There are environmental factors which can
change the germination potential level, thus the dormancy can be broken by
light, hormones, low temperatures, etc. (Baskin, 2003).
One might assume that the embryo first breaks through the adjacent layer
covering it. In Arabidopsis thaliana and Lepidium sativum, this layer is the
endosperm. Interestingly, however, the outer surrounding seed coat, ruptures
first (Liu et al., 2005; Müller et al., 2006). In several crop species such as
tobacco (Manz et al., 2005) the same germination pattern is followed: first the
testa ruptures followed by endosperm rupture and radicle protrusion, while in
tomato testa and endosperm rupture in the same time (Groot & Karssen, 1987).
All shape and size changes of tissues in germinating seeds are the result of
cell growth, as no cell division can be observed during germination (Sliwinska
et al., 2009).
24
To quantify the force needed for the radicle to break the endosperm,
physical measurements have been carried out using isolated endosperms from
different species: tomato (Groot & Karssen, 1987), coffee (da Silva et al.,
2004) and cress (Müller et al., 2006). The mutual conclusion from these
puncture force experiments was that the micropylar region of the endosperm is
weakened prior endosperm rupture. Endosperm rupture together with the
embryo`s growth potential are inhibited by ABA and stimulated by GA (Müller
et al., 2006).
1.9 Seed cell wall structure
Although the investigations on cell growth mechanics started more than a
century ago, with Sachs in 1887 (Sachs, 1887) and de Vries in 1877, the
mechanism is not yet fully understood.
The conventionally accepted model for plant cell walls implies a complex
composite of polysaccharides with low protein content. The polysaccharides
consist mainly in cellulose and a range of non-cellulosic polysaccharides, such
as pectic polysaccharides (galacturonic acid) and hemicelluloses (xyloglucans,
heteroxylans, heteromannans) (Burton et al., 2010).
The biosynthesis of cell wall components is taking place in the Golgi
complex (the matrix polysaccharides) and in the plasma membrane (cellulose,
up to 36 complexes of cellulose synthases) (Burton et al., 2010).
The cellulose is grouped in microfibrils (Somerville, 2006), while the
pectic polysaccharides form complex hydrated gels, cross-linked by covalent
and ionic bonds with other cell wall components (Caffall & Mohnen, 2009).
The pectins confer strength and flexibility to the cell wall, while
hemicellulose is reinforcing the cell wall by cross-linking cellulose microfibrils
(Scheller & Ulvskov, 2010).

25
In 2011, a new cell wall structure was suggested by Dick-Perez et al.,
consisting of a single network of polysaccharides featuring interactions
between cellulose, xyloglucans and pectin (Dick-Pérez et al., 2011).
Cell expansion in meristematic tissue is a major and irreversible cell
process requiring the remodeling of the cell wall. This growth is not only
caused by the water uptake, driven by the osmotic pressure, but it also involves
processes of hydrolysis, rearrangement or disassembly of structural polymers
(Rodríguez-Gacio et al., 2012). All the processes are dependent on enzymatic
activity: hydrolases, expansins, transglycosylases or reactive oxygen species
(Schopfer, 2006; Burton et al., 2010).
1.9.1 New cell wall remodeling proteins
Although it is still unclear what initiates growth, it is clear that cell wall
modification is required to direct growth (Braidwood et al., 2013). A softening
of the cell wall is not taking place only in the meristematic tissues, or in fruit
ripening, programmed cell death but also in endosperm rupture upon
germination (Weitbrecht et al., 2011).
For the completion of germination, the cell wall must thus be remodelled
in the embryo to allow the cell elongation, and/or in the endosperm to lower its
resistance to the radicle expansion (Cosgrove, 2001). As expression and
activity of a number of cell wall modifying enzymes change in both embryo
and endosperm (Lee et al., 2012; Morris et al., 2011), it can be assumed that
both change their biophysical properties.
Cell walls are modifying their physical properties by altering the
composition or/and interaction of the cell wall components, enabling a rapid
structure modification. The most common proteins released by plants to alter
their cell wall promoting growth, are the glycosyltransferases, expansins and
pectin methylesterases (PMEs) (Peaucelle et al., 2011).

26
1.9.2 Cell wall expansins
There are known 4 families of expansins in Arabidopsis, two families
contain members that have the ability to extend cell walls (EXPA or α-
expansin, and EXPB or β-expansin), whereas the functions of the other two
related families (EXLA and EXLB, for expansin-like family A and B) are still
not clear (Cosgrove, 2005).
Cell-wall enlargement begins with wall stress relaxation, which allows the
cells to take up water and physically enlarge. Expansins are a group of non-
enzymatic wall proteins that induce wall stress relaxation and extension. They
mediate the disrupting of non-covalent linkages that hold microfibrils in place.
The mechanism by which the cell wall is loosened is not fully understood.
There might be an enzymatic release of xyloglucans, resulting in increasing the
cell wall extensibility and cell growth or a non-enzymatic action of hydroxyl
radicals which cuts the polysaccharides (Cosgrove, 2005).
The pH of the cell wall of growing cells is typically between 4.5 and 6,
which is the range in which acidification activates expansin activity. This is
biologically important because a number of agents alter cell growth, by
inducing the cell to alter its wall, e.g. stem and root tropisms (bending toward
or away from a stimulus), hormone-induced growth, light-induced stimulation
of leaf expansion and inhibition of stem elongation, responses of shoots, roots
and leaves to water deficits and salt stresses and early outgrowth of root hairs
(Cosgrove, 2005).

27
1.10 Methods to study plant biomechanics
1.10.1 Atomic force microscopy
Atomic force microscopy (AFM) enables the collection of force-
indentation curves at various cell surface points. Each curve comprises the
approach and retraction of the cantilever, considered as a small elastic beam,
from the surface while recording its deformation.
The cantilever has a calibrated stiffness constant so that the attractive/
repulsive forces between the tip and the sample surface can be measured, and
mechanical properties such as adhesion and elasticity can be quantified
(Goldsbury & Scheuring, 2002).
For almost two decades AFM has been used to image the surface of living
animal cells in a non-destructive manner. In plants, very few studies have used
this technology (Milani et al., 2013). Among these, observations have been
done on extracted or isolated cell walls from various tissues and species in
order to examine cell-wall structure and texture (Well et al., 1996; Davies &
Harris, 2003).
In plants, AFM was first used to study the mechanical properties of fiber
walls in wood (Clair et al., 2003). Using AFM, Marga et al., 2005, have
visualized and characterized the effect of expansin on cellulose microfibrils
network, demonstrating that it acts selectively on the cross-linking polymers
between parallel microfibrils, rather than more generally on the wall matrix
(Marga et al., 2005).
In 2011, Milani et al., used AFM to measure cell wall properties of the
shoot apical meristem epidermis. They found a difference in elasticity of the tip
compared with the peripheral region of the apical meristem; the cell walls were
less elastic in the meristematic tip (5 ± 2 MPa) than in the flanks of the
meristem (1.5 ± 0.7 MPa) (Milani et al., 2011).
Using a similar method, in 2012 Fernandes et al., performed AFM on
Arabidopsis roots. The plasticity of root cell walls was revealed by the

28
difference in the approach and retraction curves. This study did not reveal any
spatial differences in plastic or viscoelastic behaviour along the root
(Fernandes et al., 2012).
In 2013, Braybrook and Peaucele, using AFM demonstrated that auxin
increases the cell wall elasticity in the shoot apex prior to organ emergence, in
Arabidopsis (Braybrook & Peaucelle, 2013).
1.10.2 Nanoindentation of biological materials
Nanoindentation is a technique which uses the recorded depth of
penetration of an indenter into the specimen along with the measured applied
load to determine the area of contact and hence the hardness of the tested
specimen. Many other mechanical properties can also be obtained from the
experimental load-displacement curve, the most straight-forward being the
reduced modulus, but properties such as the strain-hardening index, fracture
toughness, yield strength and residual stress can also be obtained in some
circumstances (Fischer-Cripps, 2005).
With a typical working force range of 1 µN to 500 mN and displacement
range of 1 nm to 20 µm, this technique bridges the gap between AFM and
macroscale mechanical testing (Ebenstein & Pruitt, 2006).
Load and displacement are monitored continuously during the indentation
process, resulting in a load-displacement curve, as shown in Fig. 1.6a. The
interaction between the tip and the sample during the indentation process is
illustrated in Fig. 1.6b.

29
Figure 1.6 Schematic of (a) a typical load-displacement curve; (b) the indentation process P
max = maximum load applied; h max = penetration depth; h c = contact depth (the height of the
contact between the tip and the sample); h f = final depth; S= unloading stiffness (Taken from
Ebenstein & Pruitt, 2006).
In plants, nanoindentation has been used to evaluate the properties of
fibres (which are reinforcement materials), such as cotton stalk (Gossypium
herbaceu), soybean stalk (Glycine max), cassava stalk (Manihot esculent), rice
straw (Oryza sativa L.) and wheat straw (Triticum aestivum L.) (Wu et al.,
2010).
The elastic modulus of wheat straw was found to be 20.8 GPa, which was
the highest value for straws, while the highest hardness was observed in cotton
stalk at 0.85 GPa (Wu et al., 2010).
1.10.2.1 Principle of the method
The analysis used to determine the hardness (H) and elastic modulus (Er),
is an extension of the method proposed by Doerner and Nix (2011), that

30
accounts for the fact that unloading curves are distinctly curved in a manner
that cannot be accounted for by the flat punch approximation. In the flat punch
approximation used by Doerner and Nix, the contact area remains constant as
the indenter is withdrawn, and the resulting unloading curve is linear. In
contrast, experiments have shown that unloading curves are distinctly curved
and usually well approximated by the power law relation:
P = α (h max -h f ) m ,
where α and m are power law fitting constants (Oliver & Pharr, 1992).
Oliver and Pharr (Oliver & Pharr, 1992) further generalized their
approach, resulting in the widely used compliance method for indentation
analysis. Letting F(d) be an “area function” that describes the projected (or
cross sectional) area of the indenter at a distance d back from its tip, the contact
area A is then
A = f(h c ).
Once the contact area is determined, the hardness is estimated from:
H =A
Pmax .
This definition of hardness is based on the contact area under load; it may
deviate from the traditional hardness measured from the area of the residual
hardness impression if there is significant elastic recovery during unloading
(Oliver & Pharr, 2004).
Measurement of the elastic modulus follows from its relationship to
contact area and the measured unloading stiffness through the relation:
S = β
2E eff A ,
Where E eff is the effective elastic modulus defined by

31
effE
1=
E
21 +
i
i
E
21
.
The effective elastic modulus takes into account the fact that elastic
displacement occurs in both the specimen, with Young`s modulus E and
Poisson`s ratio ν, and the indenter, with elastic constants E i and i (Oliver &
Pharr, 2004). The indenter material properties are usually known (E I = 1141
GPa, i = 0.07 for diamond, a common tip material), so the Young`s modulus
of a material can be calculated from the reduced modulus if the Poisson`s ratio
of the sample material is known. If the Poisson`s ratio of the sample is not
known, the plane strain modulus
E`= )1( 2
E
can be reported.
1.10.2.2 Adaptation for indentation of polymeric biomaterials and
tissues
Polymeric biomaterials and tissues often exhibit viscoelastic or time-
dependent behaviour (Fung, 1993) and may be subject to adhesive interactions
between the tip and the sample. The compliance method is based on
assumption of elastic, isotropic materials and negligible adhesion (Oliver &
Pharr, 2004).
Creep is the most observed effect of viscoelasticity or the tip is sinking
into the sample under a constant load. To avoid its appearance Briscoe et al.,
incorporated a 10 s hold period at peak load in order to allow the material to
approach equilibrium prior to unloading (Briscoe et al., 1998). An appropriate
hold time should be selected based on the creep and unloading rates used in
experiments (Wu et al., 2011).

32
Adhesion between the tip of the indenter and the sample can interfere with
measurements of modulus using the compliance method in soft tissue samples.
The compliance method overestimates the modulus when there is a significant
tip-sample adhesion (Carrillo et al., 2011).
1.10.2.3 Indenter shape and size
Indenter tips are usually made out of very stiff materials, such as diamond
and sapphire, so that the compliance of the tip is much lower than the sample
compliance.
The three sided pyramid Berkovich indenter is the most popular geometry
for nanoindentation testing, and is used for metals, ceramics, glassy polymers
or mineralized tissues. Also, there is a four-sided Vickers pyramid indenter, but
it is much easier to grind the faces of the indenter to meet at a single point than
a line, so the Berkovich indenter is preferred.
For soft tissues a spherical tip is commonly used to minimize plastic
deformation and stress concentrations, but also to avoid damage to the sample.
For viscoelastic materials the cylindrical flat punch is used; it has the
advantage of a constant, known contact area as a function of depth, but has
high stress concentration at the contact perimeter.
The dimension of the tip is also important. If the goal is to measure tissue-
level properties in a soft tissue, a large diameter spherical tip will be necessary
so that the contact area will be much greater than the diameter of an individual
cell or fiber (Ebenstein & Pruitt, 2006).
1.10.2.4 Corrections to recorded data
The most common and necessary corrections are the initial penetration, the
instrument frame compliance and the indenter area function.

33
Initial penetration
The determination of the initial contact between the indenter and the
specimen is important because the contact point determines the datum of the
displacement measurement. The initial contact force is set by the user and once
it is achieved the depth sensor set to zero and the loading then proceeds.
The significance of initial penetration correction depends upon magnitude
of the maximum load applied to the indenter relative to the magnitude of the
initial contact force. The lowest force that can be detected or set in atypical
initial penetration is in the order of 2-5 µm and the initial penetration is a few
nanometers (Fischer-Cripps, 2006).
Frame compliance
The compliance correction is dependent on the load and is not a constant
(as the initial penetration correction). It becomes particularly important when
testing very stiff materials. Its correction requires knowledge of the value of
the compliance of the instrument, often measured by the manufacturer and set
within the software.
The best way to measure and verify the value of the instrument compliance
is to conduct a series of tests at different loads on a fairly stiff specimen
(sapphire). A common mistake in operating or calibrating a nanoindenter is to
determine the compliance using only one reference standard. For best results,
the compliance should be determined on a variety of standard specimens (fused
silica, silicon and sapphire). The resulting values should be consistent for each
of the specimens (Fischer-Cripps, 2006).
Area function
The area function of the indenter is a function or a table of values that
provides the best estimate of the area of contact as a function of the contact
depth for the indenter being used. It is common to test a material of known
modulus or hardness using the following equation (Fischer-Cripps, 2006):
A = C 1 h2
c + C 2 h c + C 3 h2/1
c + C 4 h4/1
c +…
34
Where h is the plastic (or contact) depth and C 1 is usually a number close to
24.5 and the remaining fitting constants account for the tip rounding and other
departures from the ideal shape.
Thermal drift
Thermal drift refers to changes in dimension of the indenter, specimen and
the instrument, resulting from a temperature change during the test. It is
measured in nm/s.
Thermal drift can introduce large errors into the load-displacements curves
causing the measured hardness and elastic modulus to be in error. The most
common situation is at the contact between the indenter and the specimen
(Fischer-Cripps, 2006). There are two ways to correct it:
(1) Reduce the temperature variations at the specimen to an absolute
minimum. The machine should be enclosed into an isolated cabin and located
into a controlled environment (just above room temperature).
(2) Correct the data for thermal drift. The correction is made by
accumulating depth readings while holding the load constant (5-10 s). The
preferred option is the hold data at 10% of unloading curve, since the creep of
the specimen is minimized.
1.10.2.5 Material-related effects
There are various materials-related effects which can cause errors in the
estimation of elastic modulus and hardness of the specimen. The most
significant is piling-up. It is the most unresolved issue in nanoindentation
testing. There are two ways to approach the problem: perform an area function
calibration on a reference specimen which has a similar ratio of elastic
modulus/hardness as the test specimen or as ISO 14577 recommends, ignore
the effect and treat the resulting values as comparative values (Fischer-Cripps,
2006).

35
1.10.3 Micro x–ray computed tomography
The imaging process in computed tomography is based on the differential
attenuation of x-rays in relation to specific density of the tissue (i.e. the beam
passes more easily through low-density, whereas dense objects absorb or
reflect the beam) (Pajor et al., 2013).
Evolving primarily from medical sciences it is now considered as an
established tool for non-invasive, non-destructive, precise visualization and
quantification of the internal structures of materials in 3D (Pajor et al., 2013).
The first attempt of scanning Arabidopsis seeds was done in 2006, by
Cloetens et al., using synchrotron facilities to investigate the structure and
spatial distribution of intracellular voids (Cloetens et al., 2006).
In 2008, another attempt was done by Kaminuma et al., using a
commercially available CT scanner to obtain datasets of Arabidopsis leaves
and seeds. Although level of detail was sufficient to reveal the spatial
distribution of trichomes in leaves, the scans of seeds were extremely noisy
(Kaminuma et al., 2008).
In recent years, x-ray CT has been widely utilized in rhizosphere studies,
mainly focusing on the study of soil structure (Mooney, 2006), interactions
between soil and microbes (Pajor et al., 2013), and in vivo imaging of plant
roots, root development and architecture (Tracy et al., 2012).
1.10.4 Digital image correlation (DIC)
Digital image correlation (DIC) is a non-contacting method that analyzes
the full-field shape, deformation and motion by applying related algorithm to
the acquired images data of the subject. The application of DIC has contributed
greatly to the research fields that cover material sciences and experimental
mechanics (Pan et al., 2009).
With the development of DIC, there are mainly two important assumptions
involved that convert image information into experimental measurement and

36
analysis of the strains and displacements on objects. One is the motion of
points from both image and object directly corresponding to each other.
According to this assumption, the displacement of points on target object can
be quantified by determining the image motions. Consequently, such kind of
assumption can provide a uniform (one to one) correspondence between points
on image and points on object in a 2-D vision.
Another assumption is based on the contrast at each sub-region of the
object, so that accurate matching can be performed to show up the
movements/deformations (Sutton, 2008). A sufficient contrast can be achieved
by applying a pattern on the specimen. Usually, grids, lines or dots are
preferred and they can be easily obtained by painting, adhering or surface
machining (Bornert et al., 2008).
Generally, there are three steps involved in 2-D DIC implementation:
1) Experimental setup and specimen preparation;
2) Capturing images;
3) Determine the displacement and strain by processing the obtained
images using a specific software (Istra 4D) (Pan et al., 2009).

37
1.11 Recent work in seed germination mechanics
Changes in the properties of the endosperm significantly affect the timing
of radicle emergence in non-dormant seeds. The mechanical resistance of
micropylar endosperm is mainly due to the thick and rigid cell walls in this
tissue, therefore its weakening is due to cell wall modification (Bewley et al.,
2013).
Bassel et al., (2014), following the mathematical theory assuming that
growth depends on the abundance of cell-wall remodeling agents and the
amount of stress/strain in the wall itself, developed a mechanical model using
finite-element method.
According to the model described by Bassel et al. (2014), cell size and
arrangement of cells in tissue affect the stress on cell wall, as well as the cell
ability to expand in response to turgor pressure. It is not only the cell wall
remodeling activity but also the amount of stretch in the cell wall that leads to
tissue weakening and rupture.
However, a new hypothesis stands for a “mechanosensing” wound
response, provided by embryo pressure directed on micropylar cells, rather
than chemical molecules for endosperm weakening (Dekkers et al., 2013;
Martínez-Andújar et al., 2012). Pathogen-response genes were identified as
micropylar endosperm enriched genes in tomato seeds (Martínez-Andújar et
al., 2012) suggesting the fact that testa rupture triggers a wound response thus
activation of genes expression in the tissue.
Together with testa rupture, genes known to be induced by touch or
thigmotropism are activated (2.5% of Arabidopsis genes encoding calcium-
binding, cell wall modifying, defense, transcription factor and kinase proteins
are rapidly up-regulated in touch-stimulated plants) (Braam 2005).
Also, Dekkers et al., (2013) observed that gene expression associated with
jasmonate biosynthesis was activated upon testa rupture in the micropylar
endosperm; recently shown to be a key regulator of plant morphogenesis and
enhanced pest resistance upon touch (Chehab et al., 2012).

38
1.12 Aims and objectives of the project
The aim of this study was to correlate gene expression with physical
property changes, in the endosperm of Arabidopsis thaliana and Lepidium
sativum seeds during germination.
The objectives of this thesis were:
• To generate/estimate values of endosperm stiffness, hardness, or
changes in structure and shape using imaging and mechanical approaches.
The hypothesis tested was that the endosperm stretches during
germination, becoming thinner. Another assumption to be confirmed was that
endosperm physical properties are changing through germination, weakening
in the micropylar region in order to allow radicle protrusion.
Another objective was to detect differences in stiffness of Arabidopsis
mutants with known biochemical alteration of the cell wall composition, using
nanoindentation. The methodologies used to visualize and detect changes in
seeds shape and structure were: AFM, Micro-CT and nanoindentation.
• To reveal the tissue specificity (spatial and temporal distribution) of
the genes from cluster 19 (cluster comprising endosperm specific genes)
confirming the predictions of SeedNet
The hypothesis tested was based on SeedNet predictions, that cluster 19
comprises genes specifically expressed in the endosperm during germination.
The expression of several gene promoters (EXPA2, DELTA-VPE, SCPL51 and
DOF2.1) was monitored using GUS staining technique, to reveal their spatial
distribution in the endosperm, during germination. Also, the effect of ABA/GA
and the embryonic signal required for their expression was observed.
To reveal the interactions between the transcription factors from cluster
19, the behaviour of germination of their mutants was studied: ATHB23, BEE2,
bHLH115, DOF2.1. To analyse the transcription factors (T-DNA lines)
mutants, and their putative interactions with EXPA2 promoter fragments, using
yeast one hybrid system.

39
2. Materials and Methods
2.1 Seeds and plants
2.1.1 Seed material
Mutants of Arabidopsis were kindly provided, by Dr. Bas Dekkers, Utrecht
University and by Dr. Kieran Lee, Leeds University. The wild type
Arabidopsis (Col-0) was obtained from members of the Holdsworth research
group.
2.1.1.1 Seed sterilization and plating
Seed sterilization was carried out in the laminar air flow chamber. Seeds
were aliquoted into micro centrifuge tubes (1.5 ml) and were surface sterilized
using freshly diluted 5% (v/v) bleach (Parazone, UK) for 5 minutes. Seeds
were then washed three times with sterile water. Seeds were plated onto media
using an Ultipipette tip. Plates were sealed using micropore tape (3M,
Bracknell, UK).
2.1.1.2 Germination media
Germination media contained 0.7% (w/v) agar supplemented with half-
strength Murashige & Skoog salts (DuchefaBiochemie B.V., Haarlem,
Netherlands, Murashige & Skoog 1962). The pH of the media was adjusted to
6.2 before autoclaving. All media were stored at 4°C and allowed to warm for
at least 20 minutes before use.
2.1.1.3 Seed germination conditions
Seeds on media plates were incubated at 22°C in continuous light (light
intensity 60 μmols m-2
s-1
) in a controlled environment growth chamber.
Germination was achieved when the radicle protruded through the endosperm.
Seedlings were transplanted into soil when the first true leaves had appeared.

40
2.1.2 Plant growth conditions
Plants were grown in controlled environment chambers at 22°C in
continuous light conditions (light intensity 60 μmols m-2
s-1
). The soil
contained four parts of compost (LevingtonM3, Scotts, Godalming, UK), two
parts of vermiculite (medium grade, 2.0-2.5 mm, Sinclair, Lincoln, UK) and
one part perlite (standard grade, 2.0-2.5 mm, Lincoln, Sinclair, Lincoln, UK).
2.1.3 Statistical treatment
All germination assays were conducted with four replicates of at least 50
seeds per line. Biological replicates were seed lots collected from different
plants that were grown at the same time. Data are presented as the mean +/- the
standard error. The formula used to calculate standard error was: Standard error
= standard deviation/ √n, where n is the sample size; Standard deviation = ±√ Σ
(x- x) 2
/ n-1, where x = sample value, x= mean.
2.1.4 Cross pollination of Arabidopsis plants
All flowers showing petals and all opened buds were removed from the
recipient (female) inflorescence. Remaining floral buds were emasculated
using forceps. All siliques were removed. A mature flower was selected and
removed from the donor line (male) with forceps. This was then brushed onto
the emasculated stigma of the recipient plant until pollen stuck on to the
recipient stigma surface. Siliques of cross pollinated stigmas were collected in
a 1.5 ml Eppendorf tube after the siliques began to turn yellow.

41
2.2 RNA Manipulation
2.2.1 Borate isolation of RNA
For RNA extraction the Protocol from Cotton Genome Center, UC Davis
(http://cottongenomeceter.ucdavis.edu/protocols/RNA), was modified, as
follows:
The Borate extraction buffer was made up in DEPC-treated water: 0.2 M
Na2B4O7·10H2O, 30 mM EGTA, 1% (w/v) SDS and 1% (w/v) sodium
deoxycholate. After prepared fresh, were added: 2% (w/v) PVP, 10 mM DTT,
1% Nonidet-40, 25 mg/ml proteinase K, 2 M KCl and 8 M LiCl.
2.2.2 QiagenRNeasy RNA extraction kit
Frozen tissue (100 g) was ground to a fine powder in a mortar and pestle
cooled with liquid nitrogen. 0.7 ml borate buffer, chilled on ice, was added for
each 100 mg tissue. The samples were grinded until the liquid nitrogen thawed
and transferred to chilled Eppendorf tubes. 0.35 mg of proteinase K was added
in each tube. The tubes were incubated in a water bath, at 42°C, for one hour
and 30 minutes. After adding 56 µl 2 M KCl, the samples were placed on ice
for 1 hour. To remove the debris, the tubes were centrifugated for 12 minutes at
4°C at 12 000 g. The supernatant was transferred to new Eppendorf tubes, and
LiCl was added to a final concentration of 2M, and incubated at 4°C,
overnight. The second day, the precipitated RNA was collected after a cold
centrifugation at 12 000 g, for 20 minutes. The formed pellet was resuspended
in 100 µl DEPC water, by vortexing, and manipulated further according with
manufacturer protocol (Qiagen, Ltd., Manchester, UK).
2.2.3 QiagenRNeasy Plant Mini Kit – RNA Clean Up Protocol
Samples were manipulated according with the manufacturer instructions
(Qiagen Ltd., Manchester, UK). Concentration was checked using Nanodrop
ND1000 spectrophotometer (Nanodrop, Wilmington, USA).

42
2.2.4 RNA Gel electrophoresis
Samples were run in an electrophoresis 1.2% (w/v) agarose gel (0.48 g
agarose, 4 ml of 10x MOPS Buffer (section 3.2.4.1), 36 ml of water, 720 µl
37% (v/v) formaldehyde and 0.4 µl of 10 mg/ml Ethidium bromide). Before
loading on the gel, each sample was mixed with 5x RNA loading buffer
(section 3.2.4.2). The running buffer used, was containing 200mM MOPS (free
acid), 50 mM Sodium acetate (pH 7.5), 10 mM EDTA (pH 8.0). The pH was
corrected to 7.0 with NaOH. The RNA loading buffer was prepared in aliquots,
stable for 3-4 months kept at 4°C, using: 16 µl saturated bromophenol blue, 80
µl 500 mM EDTA pH 8.0, 720 µl 37% (v/v) formaldehyde, 2 ml 100% (v/v)
glycerol, 3084 µl formamide solution, 4 ml 10 x MOPS buffer and RNase-free
water.
2.2.4.1 1xMOPS gel buffer (300ml)
30 ml 10 x MOPS Buffer
6 ml 37% Formaldehyde
264 ml water
2.2.4.2 5 x RNA loading buffer
16 µl saturated bromophenol blue
80 µl 500 mM EDTA pH 8.0
720 µl 37% formaldehyde
2 ml 100% glycerol
3084 µl formamide
4 ml 10 x MOPS buffer
+ RNase-free water to 10 ml.
2.2.5 First strand cDNA synthesis
For a final volume of 20 µl volume reaction, 1 µl of (dT)20 oligo (50 µM),
50-250 ng of random primer or 2 pmol of gene-specific primer, 10 pg-5 µg
total RNA 500 ng/µl and 1µl 10 mM dNTPs Mix, were mixed with distilled
water to 13 µl. The mixture was heated at 65°C for 5 min and cooled on ice for

43
at least 1 min. After a short centrifugation, 4 µl 5xFirst-Strand Buffer, 1 µl
0.1M DTT, 1 µl RNase OUT Recombinant RNase Inhibitor and 1 µl Super
Script III RT (200 u/µl) (Invitrogen, Paisley, UK), were added. Everything was
incubated for 60 min at 55°C. To inactivate the reaction, the tube was heated at
70°C for 15 min.
2.3 DNA Manipulation
2.3.1 PCR reaction
Using DNA (genomic DNA or cDNA) as template, PCR was performed to
amplify specific genes, using gene-specific primers. For a volume of 50 µl, the
next protocol was followed: 5 µl of 10 x PCR Buffer [200 mM Tris-HCl, pH
8.4, 500 mM KCl], 1 µl of dNTPs, 1 µl of 10 µM sense primer, 1 µl of 10 µM
antisense primer, 0.4 µl of Taq-DNA polymerase (5 U/µl) (Phusion High-
Fidelity DNA Polymerase, Thermo Scientific, Fisher Scientific - UK Ltd) and
2 µl of DNA template were mixed with autoclaved distilled water to the final
volume of 50 µl. The PCR machines used here were GeneAmp PCR System
9700; PE Applied Biosystem.
98°C - 5 minutes
98°C - 30 seconds
57°C - 30 seconds 30-40 cycles
72°C -2 minutes
72°C - 7 minutes
The primers used for different amplifications are shown in Table 2.1.
Gene name Sequence
At3g20210
pDELTA-VPE f
GGGGACAAGTTTGTACAAAAAAGCAGGCTGAAATGGAGTGAGACCATTGTTA
pDELTA-VPE r
GGGGACCACTTTGTACAAGAAAGCTGGGTCTTGAATCTGATTCTTGTGAGAA
At2g27920 pSCPL51_f GGGGACAAGTTTGTACAAAAAAGCAGGCTTTGTAGTGTCAATTGTAAAATTG
pSCPL51_r
GGGGACCACTTTGTACAAGAAAGCTGGGTTCAGACGATTCTTTGTGGATCAAT
At5g39760 ATHB23_1st_f ATTACAAACAAGTGTAACTATG
ATHB23_1
st_r GAATAAGCTTACTCTAAGCTTC
ATHB23_2nd
_f
GGGGACAAGTTTGTACAAAAAAGCAGGCTGCTTCGAACCCAATCATTTTGAG
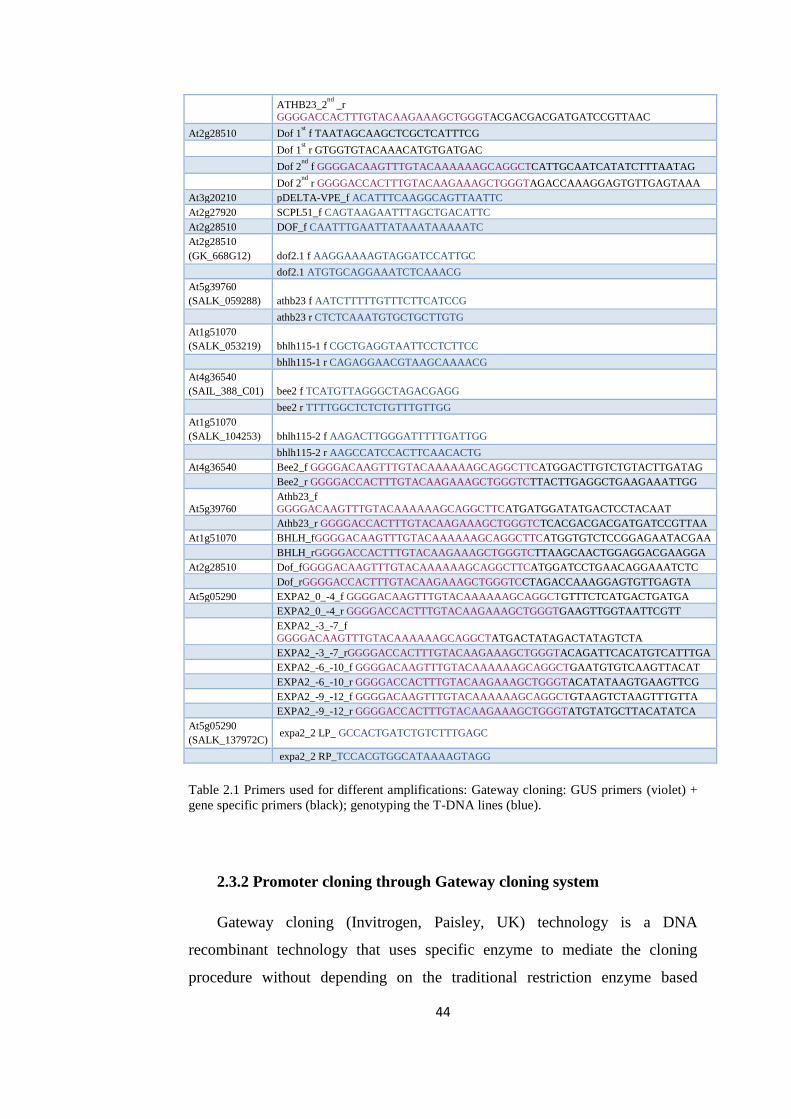
44
ATHB23_2nd
_r
GGGGACCACTTTGTACAAGAAAGCTGGGTACGACGACGATGATCCGTTAAC
At2g28510 Dof 1st f TAATAGCAAGCTCGCTCATTTCG
Dof 1
st r GTGGTGTACAAACATGTGATGAC
Dof 2
nd f GGGGACAAGTTTGTACAAAAAAGCAGGCTCATTGCAATCATATCTTTAATAG
Dof 2
nd r GGGGACCACTTTGTACAAGAAAGCTGGGTAGACCAAAGGAGTGTTGAGTAAA
At3g20210 pDELTA-VPE_f ACATTTCAAGGCAGTTAATTC
At2g27920 SCPL51_f CAGTAAGAATTTAGCTGACATTC
At2g28510 DOF_f CAATTTGAATTATAAATAAAAATC
At2g28510
(GK_668G12) dof2.1 f AAGGAAAAGTAGGATCCATTGC
dof2.1 ATGTGCAGGAAATCTCAAACG
At5g39760
(SALK_059288) athb23 f AATCTTTTTGTTTCTTCATCCG
athb23 r CTCTCAAATGTGCTGCTTGTG
At1g51070
(SALK_053219) bhlh115-1 f CGCTGAGGTAATTCCTCTTCC
bhlh115-1 r CAGAGGAACGTAAGCAAAACG
At4g36540
(SAIL_388_C01) bee2 f TCATGTTAGGGCTAGACGAGG
bee2 r TTTTGGCTCTCTGTTTGTTGG
At1g51070
(SALK_104253) bhlh115-2 f AAGACTTGGGATTTTTGATTGG
bhlh115-2 r AAGCCATCCACTTCAACACTG
At4g36540 Bee2_f GGGGACAAGTTTGTACAAAAAAGCAGGCTTCATGGACTTGTCTGTACTTGATAG
Bee2_r GGGGACCACTTTGTACAAGAAAGCTGGGTCTTACTTGAGGCTGAAGAAATTGG
At5g39760
Athb23_f
GGGGACAAGTTTGTACAAAAAAGCAGGCTTCATGATGGATATGACTCCTACAAT
Athb23_r GGGGACCACTTTGTACAAGAAAGCTGGGTCTCACGACGACGATGATCCGTTAA
At1g51070 BHLH_fGGGGACAAGTTTGTACAAAAAAGCAGGCTTCATGGTGTCTCCGGAGAATACGAA
BHLH_rGGGGACCACTTTGTACAAGAAAGCTGGGTCTTAAGCAACTGGAGGACGAAGGA
At2g28510 Dof_fGGGGACAAGTTTGTACAAAAAAGCAGGCTTCATGGATCCTGAACAGGAAATCTC
Dof_rGGGGACCACTTTGTACAAGAAAGCTGGGTCCTAGACCAAAGGAGTGTTGAGTA
At5g05290 EXPA2_0_-4_f GGGGACAAGTTTGTACAAAAAAGCAGGCTGTTTCTCATGACTGATGA
EXPA2_0_-4_r GGGGACCACTTTGTACAAGAAAGCTGGGTGAAGTTGGTAATTCGTT
EXPA2_-3_-7_f
GGGGACAAGTTTGTACAAAAAAGCAGGCTATGACTATAGACTATAGTCTA
EXPA2_-3_-7_rGGGGACCACTTTGTACAAGAAAGCTGGGTACAGATTCACATGTCATTTGA
EXPA2_-6_-10_f GGGGACAAGTTTGTACAAAAAAGCAGGCTGAATGTGTCAAGTTACAT
EXPA2_-6_-10_r GGGGACCACTTTGTACAAGAAAGCTGGGTACATATAAGTGAAGTTCG
EXPA2_-9_-12_f GGGGACAAGTTTGTACAAAAAAGCAGGCTGTAAGTCTAAGTTTGTTA
EXPA2_-9_-12_r GGGGACCACTTTGTACAAGAAAGCTGGGTATGTATGCTTACATATCA
At5g05290
(SALK_137972C) expa2_2 LP_ GCCACTGATCTGTCTTTGAGC
expa2_2 RP_TCCACGTGGCATAAAAGTAGG
Table 2.1 Primers used for different amplifications: Gateway cloning: GUS primers (violet) +
gene specific primers (black); genotyping the T-DNA lines (blue).
2.3.2 Promoter cloning through Gateway cloning system
Gateway cloning (Invitrogen, Paisley, UK) technology is a DNA
recombinant technology that uses specific enzyme to mediate the cloning
procedure without depending on the traditional restriction enzyme based

45
cloning limitations and enabling to use practically any expression system,
bacteria or yeast cells.
2.3.2.1 BP Clonase reaction
Gateway BP Clonase II enzyme mix catalyses the in vitro recombination
of PCR products (containing attB sites) and a donor vector (containing attP
sites) to generate entry clones. The donor vectors used here were
pDONR221/pDONRZeo. These vectors are part of the Gateway system which
uses a specific enzyme for cloning. The cloning procedure follows the principle
of specific adaptor flanking at the 5` of the primer with specific enzyme
reaction. Two steps of recombination were needed in order to produce the final
construct before Agrobacterium-mediated Arabidopsis transformation. The
PCR primers used in the first cloning step were designed with a special adapter
at the 5` end named as attB1 (forward primer) and attB2 (reverse primer).
The amplicon derived from PCR was then cloned into intermediate
vectors, pDONR221 and pDONRZeo to produce an entry clone (subclone) for
the next recombinant reaction. These vectors have two adaptors, named attP1
and attP2. A recombination reaction mediated by the BP Clonase II enzyme
produced the entry clone, forming new adaptors (attL1 and attL2). These
vectors were also designed with ccdB gene which helps the screening of
positive clones. The ccdB gene is a lethal gene that targets DNA gyrase. This
principle is useful for ensuring that the plasmid containing it cannot be
propagated in standard E. coli strains (for cloning purposes). The ccdB
positive-selection marker acts by killing the background of cells with no cloned
DNA, only cells containing a recombinant DNA giving rise to viable clones.
For cloning of PCR products, fragments were amplified using Finnzymes
Phusion High-Fidelity Polymerase (NEB, Hitchin, UK). PCR was carried out
in 50 µl reactions, with 0.1 U Phusion Polymerase, 1x Phusion HF Buffer, 200
µM each dNTP, 0.5 pMol each primer.
46
BP cloning was performed using Gateway BP Clonase II enzyme mix
from Invitrogen as followed:
attB- PCR product (15-150 ng) 1-7 µl
Donor vector (pDONR221/pDONRZeo- 150 ng/µl) 1 µl
TE buffer; pH 8.0 to 8 µl
2 µl BP clonase enzymes was added to the solution and incubated at 25°C
for 1 hour. 1 µl of Proteinase K was added to the sample and incubated at 37°C
for 10 minutes to terminate the reaction. NEB 5-α competent cells from NEB
England Biolabs were thawed on ice, then 1 µl of the cloning reaction was
added to the cells and they were incubated on ice for 20 minutes. They were
then heat shocked at 42°C for 45 seconds, incubated on ice for 2 minutes, then
250 µl pre-warmed LB media was added, and the cells recovered at 37°C in a
shaking incubator for 1 hour. 50 µl or 200 µl were plated onto LB-agar plates
containing 50 µg/ml Kanamycin or Zeocin 30 µg/ml (Sigma Aldrich,
Gillingham, UK), and the plates were incubated overnight at 37°C.
Colonies were picked using a sterile micropipette tips and PCR was
carried out with the same primers that were designed for BP clonase reaction.
This PCR was used to check for the presence of the desired fragment.
Overnight cultures (16 hours incubated at 37°C) were grown from the positive
colonies which were proven by PCR and DNA minipreps were carried out to
extract plasmid DNA from the cultures using the Qiagenminiprep kit following
the manufacturer’s protocol (Qiagen, Ltd., Manchester, UK). Plasmids DNA
(represent the Entry clones) were then sent for DNA sequencing with M13
forward and reverse primers to confirm the sequence of the cloned fragment
and to ensure it was inserted correctly and in frame, to Source Biosciences
Labs, Nottingham, UK.
2.3.2.2 LR Clonase reaction
The positive entry clones (from BP reaction) which were shown to be
correctly cloned by the sequencing results were used for the LR recombinant
47
reaction. Gateway LR Clonase II enzyme mix catalyses the in vitro
recombination of subcloning DNA segments from clones (containing attL
sites) and a destination vector (containing attR sites) to generate final clones.
The destination vectors used in these experiments were pKAN, pGWB433,
pDEST22 and pHISLEU2GW.
To generate final clone for promoter studies, LR cloning was performed
using Gateway LR Clonase II enzyme mix from Invitrogen. Entry clone from
previous BP clonase reaction was used in this reaction with the LR Clonase II
enzyme mix from Invitrogen as followed:
Entry clone (50-150 ng) 1-7 µl
Destination vector (150 ng/µl) 1 µl
TE buffer; pH 8.0 to 8 µl
2 µl LR clonase enzymes was added to the solution and incubated at 25°C
for 1 hour. 1 µl of Proteinase K was added to the sample and incubated at 37°C
for 10 minutes to terminate the reaction. NEB 5-α competent cells from NEB
England Biolabs were thawed on ice, then 1 µl of the cloning reaction was
added to the cells and they were incubated on ice for 20 minutes. They were
then heat shocked at 42°C for 45 seconds, incubated on ice for 2 minutes, then
250 µl pre-warmed LB media (section 2.3.2.2.1) was added, and the cells
recovered at 37°C in a shaking incubator for 1 hour. 50 µl and 200 µl of the
cells were plated onto LB-agar plates with 100 µg/ml Spectinomycin for
pKAN and pGWB433, 100 µg/ml Ampicillin for pDEST22 and 50 µg/ml of
Kanamycin for pHISLEU2GW (Sigma Aldrich, Gillingham, UK), and the
plates were incubated overnight at 37°C.
Colonies produced on the respective antibiotic agar plates for bacterial
selection were used for plasmid extraction and the isolated plasmids were sent
for sequencing to Source Biosciences Labs, Nottingham, UK.
Overnight cultures (16 hours incubated at 37°C) from positive clones were
grown, and minipreps were carried out to extract plasmids DNA from the
cultures using the Qiagenminiprep kit following the manufacturer’s protocol

48
(Qiagen, Ltd., Manchester, UK). Positive clones were transformed into
Agrobacterium tumefaciens.
2.3.2.2.1 LB media- Luria-Bertani
10 g/L Tryptone
5 g/L Yeast extract
10 g/L NaCl
+ 1.5-2% (w/v) agar for solid media plates.
2.3.3 Transformation of recombinant clones from LR reaction into
competent Agrobacterium tumefaciens GV3101 PMP90
Agrobacterium tumefaciens strain GV3101 PMP90 competent cells were
thawed on ice, then 1 µl of the LR cloning reaction was added to the cells and
they were incubated on ice for 20 minutes. Cells were then electro pulse using
a BioRad electroporator which the programme was set as transformation via
Agrobacterium. 900 µl pre-warmed LB media was added, and the cells
recovered at 28°C in a shaking incubator for 4 hour. Cells were recovered by
centrifugation for 2 minutes at 3040 x g, and then resuspended in 250 µl LB
media. 50 µl and 200 µl of the cells were plated onto LB-agar plates with 100
µg/ml Spectinomycin, 25 µg/ml Gentamycin, 50 µg/ml Rifampicin (Sigma
Aldrich, Gillingham, UK), to select for the construct and for the correct
bacterial resistance. Plates were incubated for 2 days at 28°C.
Individual colonies from selection plates were picked using sterile
micropipette tips; PCR was used to check for the presence of the desired
fragment using the same primers used for colonies PCR of LR recombinant
selection and PCR condition as described below:

49
94°C – 5 minutes
94°C – 30 seconds
57°C – 30 seconds 30-40 cycles
72°C – 2 minutes
72°C– 7 minutes
Plant transformation was then performed using the Agrobacterium strain
containing the correct constructs.
2.3.3.1 Agrobacterium-mediated Arabidopsis plant transformation
Arabidopsis plants were grown with 8 plants per 9 cm pot. They were
allowed to flower, the first bolts were removed when they had reached
approximately 10 cm in height. Roughly 5 days later the plants were ready for
use in transformation experiments.
A 4 ml of Agrobacterium inoculated culture containing the construct for
transformation was grown for 24 hours at 28ºC with shaking at 2000 rpm.
From this, 2 ml was transferred into 200 ml LB media containing 100 µg/ml
Spectinomycin, 25 µg/ml Gentamycin, 50 µg/ml Rifampicin (Sigma Aldrich,
Gillingham, UK) and was grown for 24 hours. This culture was centrifuged at
3040 x g, 4°C for 10 minutes to pellet the cells, which were resuspended in 5%
(w/v) sucrose solution. Before dipping into plant, 26 µl of Silwet L-77
surfactant was added into 250 ml sucrose solution containing the resuspended
cells pellet. This Silwet L-77 surfactant was added to aid transformation by
reducing surface tension of the sucrose solution containing the resuspended
cells pellet and increase the wetting performance. The plants were then covered
in a sealed plastic sleeve for 24 hours, then left to grow and form seeds.
2.3.3.1.1 Selection of transformed plants
To identify transformed plants more quickly and more easily, seeds were
sterilized and plated on agar plates containing specific antibiotic as usual and
50
stratify for 2 days. The plates were transferred to growth room and exposed to
light for 4-6 h, then covered and kept in the dark for 48 h. After a further 24 h
in light, resistant seedlings could be easily identified as darker green (on 50 µg/
ml kanamycin) and with longer hypocotyls than non-resistant seedlings.
2.4 β-glucuronidase (GUS) staining
GUS is successfully used to identify tissue-specific gene expression in
many plant organs. In mature Arabidopsis seeds, the testa is no longer a living
tissue, a fact that makes the seeds impermeable to the GUS substrate.
Therefore, all staining procedures involved prior separation of embryo from
testa and endosperm.
2.4.1 Preparing the GUS stain
The GUS stain solution contains: 100 mM sodium phosphate buffer; 0.1%
(v/v) Triton X-100; 2 mM X-Gluc; with pH 7.0.
To make a 10 ml phosphate buffer with a pH of 7.0, two stock solutions
were mixed: 1 M Sodium Monophosphate (A) and 1 M Sodium Diphosphate
(B). The two solutions were mixed at a ratio of 39:61 (390 µl of A and 610 µl
of B). The result was 1 ml phosphate buffer with pH 7.0. 9 ml of water was
added to dilute the 1M Phosphate Buffer and 100 mM Buffer pH 7.0, was
obtained. 10.44 mg of X-Gluc substrate was added to the buffer solution,
vortexed until dissolved, completely. Then, Triton X-100 was added by
pipetting up and down, until the whole amount was incorporated.
2.4.2 Performing GUS staining
Before being used, two different cyanide solutions were added fresh into
the GUS staining solution (above). Two stock solutions of 100X concentrated
cyanide were prepared: 100 mM Potassium Ferri-cyanide and 100 mM
Potassium Ferro-cyanide. For each of 10 ml GUS solution (1 mM), 0.1 ml of
each 100 mM Potassium Ferri-cyanide and Potassium Ferro-cyanide were

51
added. Tissues were covered in GUS staining solution. After seeds were
dissected separating the endosperm/testa from the embryo, each tissue was
incubated in 20 µl GUS stain solution, using 0.5 ml tubes, at 37 °C, for 24
hours.
Subsequent to staining, the tissues were placed in 450 ml of fixative (3:1
Ethanol: Acetic Acid + 1% Tween v/v). Stained and fixed samples were
mounted on microscope slides and imaged, using a LEICA DIC microscope
(Leica DFC 420C).
Seed testa being dark-brown coloured makes impossible the visualisation
of the endosperms underneath, so for this reason, the endosperm plus the
covering testa were bleached. After 30 minutes in 25% (v/v) Parazone solution,
the testa became transparent. The separated embryos and endosperms were
resuspended in 450 µl of distilled water. This treatment had no effect on GUS
stain.
2.4.3 Mounting embryos and endosperms
Each embryo and endosperm was mounted in Hoyer’s solution (30 g
Arabic gum, 200 g chloral hydrate, 20 g glycerol, 50 ml water). The embryo or
endosperm were pipetted onto microscope slides using a 200 µl pipette set to
150 µl and using a yellow tip with the end cut off (to create a large opening at
the end). The excess water was removed before the Hoyer`s solution was added
on the microscope slides. The cover slips were placed on top of the samples.
2.5 Nanoindentation
2.5.1 Initial System Evaluation
Before indentations on plant tissue were carried out, the system
performance was checked using 100 mN and 300 mN indentations on a
reference sample of fused silica (FS) with the ~12.5 µm radius sphero-cone
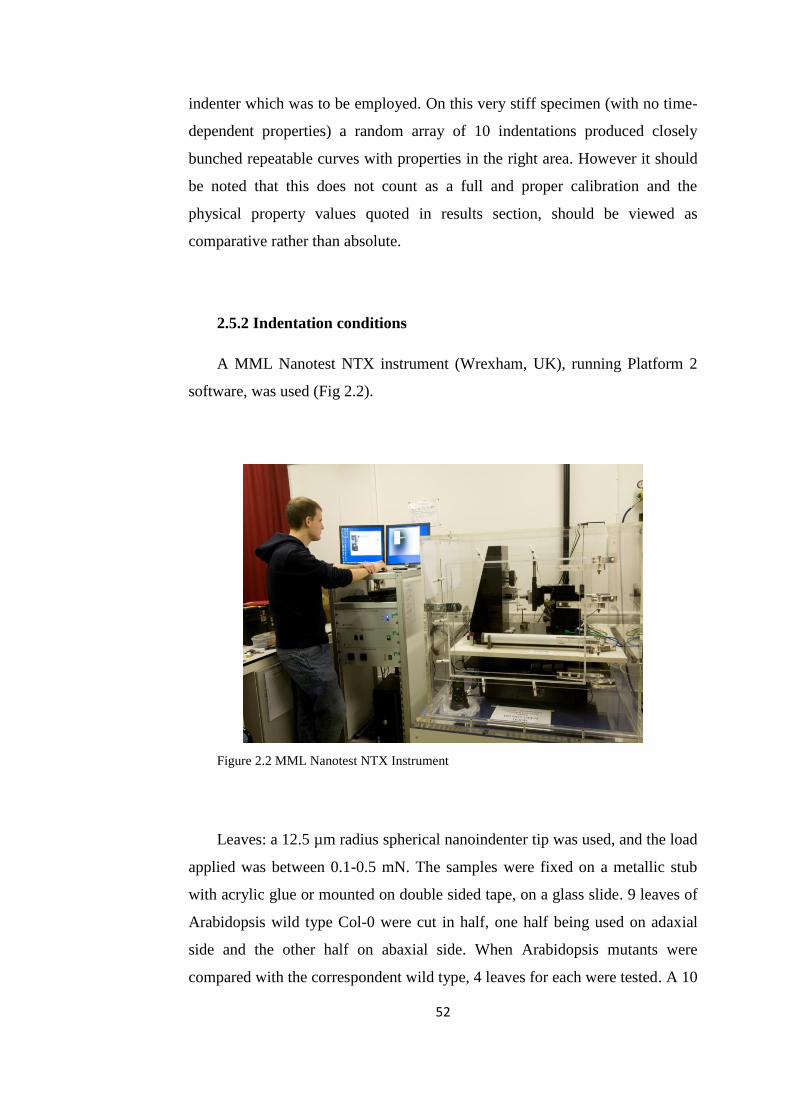
52
indenter which was to be employed. On this very stiff specimen (with no time-
dependent properties) a random array of 10 indentations produced closely
bunched repeatable curves with properties in the right area. However it should
be noted that this does not count as a full and proper calibration and the
physical property values quoted in results section, should be viewed as
comparative rather than absolute.
2.5.2 Indentation conditions
A MML Nanotest NTX instrument (Wrexham, UK), running Platform 2
software, was used (Fig 2.2).
Figure 2.2 MML Nanotest NTX Instrument
Leaves: a 12.5 µm radius spherical nanoindenter tip was used, and the load
applied was between 0.1-0.5 mN. The samples were fixed on a metallic stub
with acrylic glue or mounted on double sided tape, on a glass slide. 9 leaves of
Arabidopsis wild type Col-0 were cut in half, one half being used on adaxial
side and the other half on abaxial side. When Arabidopsis mutants were
compared with the correspondent wild type, 4 leaves for each were tested. A 10

53
indentations cycle required 2 hours, after this time, the sample dehydrates. The
indented areas were chosen randomly, avoiding main veins, when leaves or
stem or used as samples. The temperature inside the cabin was 22°C.
Seeds: Dry whole Lepidium sativum seeds (10 seeds) or imbibed seeds (6
seeds) with the testa removed were glued with Loctite 454 onto a metallic stub.
Five to twenty indentations were performed on each seed with a 12.5 µm
spherical indenter radius in a temperature regulated cabin at 22°C.
Maximum load applied was between 1- 5 mN. The loading and unloading
time was 20 s, while the dwell period was 60 s. The surface was detected by
the system measuring a load of 0.05 mN. The unloading cycle was interrupted
for 60 s at 10% of max load for collection of thermal drift data.
The indented area was chosen approximatively in the same position for the
subjected samples, e.g. smooth area for leaves (between veins) and the region
above the radicle for seeds, closer to the micropylar end.
2.5.3 Statistical analyses of nanoindentation results
The significance of nanoindentation results was analysed using Minitab
two-tail t-test, comparing the mean values for elastic modulus of seeds in
different stages of imbibition (dry and 1 or 16 hours imbibed seeds) or the
elastic modulus values for leaves of Arabidopsis mutants (altered cell wall
composition) and wild types (Col-0 and QRT).
2.6 Micro X–ray Computed Tomography
X-ray computed tomography is a minimally-invasive structural imaging
method that allows 3-D reconstruction of scanned objects. It involves the
acquisition of a series of x-ray projection images at a known number of angular
positions through 360 degrees.
Lepidium seeds (imbibed for 1, 3, 8, and 16 hours) were fixed for 16 h at 4
°C in neutral-buffered formalin (3.7% formaldehyde in 0.1 M phosphate
buffer, pH 7.0). Fixed as well as unfixed seeds sampled at the same time points

54
were stained for 16 h in a solution containing 0.1% (w/v) iodine and 0.2%
(w/v) potassium iodide in water, washed in water and dehydrated in 70%
ethanol (3 washes for 10 minutes each) (Metscher, 2009). The staining was
performed with a contrast agent (staining the starch) to improve the x-ray
attenuation. The samples were scanned in 70% ethanol in 0.2 ml PCR tubes,
(Extragene).
Eight replicate Lepidium seeds (imbibed or dry) were used for X–ray
micro-CT scanning. Each seed was placed in a 0.2 ml micro-centrifuge tube
and held in place with a conical-shaped polystyrene bung to minimize
movement of the sample during the scan. Each sample was scanned for 40
minutes using a Phoenix Nanotom 180NF x–ray computed tomography system
(GE Sensing and Inspection Technologies GmbH, http://www.ge-mcs.com)
fitted with a molybdenum transmission target at maximum electron
acceleration energy of 60 kV, a current of 140 µA, and 1200 projection images
were acquired. The detector size during the scan was 2304 x 2304 pixels,
resulting in a spatial resolution of 2.25 µm. Projection images were
reconstructed using Datos|rec reconstruction software (GE Sensing and
Inspection Technologies GmbH) using a filtered back-projection algorithm.
Seed morphology was quantified using the automatic material calibration tool
within StudioMax version 2.0 (Volume Graphics,
http://www.volumegraphics.com), in which the background (air) and material
(seed) are differentiated based on the grey value of individual voxels, which
relates to the x–ray attenuation and hence material density of the sample. The
intracellular pore space was quantified within a region of interest (created from
a mask fitted to the surface of the seed) by summing the voxels defined as air
from the calibration.
2.6.1 Statistical analyses of estimated endosperm thickness
In order to detect any significant difference between endosperm
thicknesses in the same region or between regions (micropylar, lateral or
peripheral), estimated values from micro-CT scans were compared using

55
GenStat two-way ANOVA statistical test. 30 Lepidium seeds were imaged at
different time points of imbibition (1, 3, 8, 16 hours of imbibition), 6 seeds for
each time point were analysed.
2.7 Environmental Scanning Electron Microscopy
An environmental scanning electron microscope (eSEM) allows imaging
of a specimen in its natural state. eSEM images of Arabidopsis were taken in
collaboration with Niki Weston (University of Nottingham). All images were
taken with a Philips XL30 scanning electron microscope. An accelerating
voltage of 10 kV was used for all images, the stage was cooled to ~ 3°C for all
samples and a disk of wetted filter paper was used to keep samples hydrated.
80- 100% relative humidity was used during imaging.
2.8 Atomic Force Microscopy
The instrument used for the experiments was a D3000 (Veeco, Santa
Barbara, CA) with a liquid cell for imbibed seeds. All measurements were
conducted using triangular SiN4 cantilever tips (NP-Veeco) and were done at
room temperature. The spring constant of the cantilevers was 0.58 N/m. Force
curves were recorded with a velocity of 0.5 μm/s. Seeds of Arabidopsis wild
type were studied in dry or 24 hours imbibed state. An online optical
microscope was used to align the AFM tip at the appropriate points on the seed
surface.
Single measurements were performed at different points along the seed. A
reference hard glass surface was used. After the probe is in contact with the
surface, any change in the z scanner displacement equals the change in
cantilever deflection. On a softer surface, to reach the same cantilever
deflection, the z scanner needs to displace a larger amount because of the
indentation into the sample surface. The difference between the hard and soft
surface gives the indentation into the sample surface.

56
2.9 Digital image correlation
To observe and create patterns successfully on Lepidium endosperms for
the purpose of strain measuring, the mucilage and testa have been removed. A
20-50 µm chromium powder was used as labelling particles. Then, an optical
acquiring system (CMOS camera) was used to obtain the object surface image.
After series of images were obtained during the occurrence of the deformation,
the performance of image matching was launched by selecting a subset (an n x
n pixels multiple pixel region). Istra 4 was used to register images (taking
picture every 10 minutes for 2 hours) and also to analyse the results.
In this case, the selected subset was pre-located due to unique grey level
(light intensity distribution) in the featured pattern. After deformation, the
displacement of the subset based on object surface image, could be exactly
located by searching the certain light intensity distribution within subset. Since
the subset on the deformed image was located, the displacement of the selected
subset (region of interest) could be estimated, as a heat map.
2.10 Yeast1 hybrid screening
Yeast one hybrid system was used to analyse the relationship between
EXPA2 (At5g05290) promoter and the selected transcription factors: BEE2
(At4g36540); ATHB23 (At5g39760); bHLH115 (At1g51070); DOF2.1
(At2g28510).
2.10.1 Preparation of bait and prey constructs
The transcription factors were fused with GAL4 activation domain
(GAL4AD) into a Gateway compatible plasmid (pDEST22, Invitrogen,
Paisley, UK), conferring auxotrophy to tryptophan (W). Clones of these
constructs were individually introduced into yeast Saccharomyces cerevisiae
YM4271 (A mating type), creating a yeast library of 96-well plates. As a
57
negative control, GFP was used (GAL4BD:: prey GFP, Invitrogen, Paisley,
UK).
An episomal plasmid to clone bait sequences (EXPA2 promoter fragments)
has been constructed (pTUY1H) (Castrillo et al., under revision). The
constructs were introduced into Saccharomyces cerevisiae Y187 (α mating
type).
Both strains are adenine deficient, so all the used media needed external
adenine addition (Sigma Aldrich).
2.10.2 Preparation of bait and control prey constructs inoculum for
mating
Fresh colonies from plates with minimal media (DOB) (MP
Pharmaceuticals, 4024-012) lacking the respective amino acid: leucine ( -L for
pTUY1H) or tryptophan (-W), were used to inoculate 2 ml of YPAD medium,
a complex medium to inhibit reversion of the ade1 and ade2 mutations
(3.10.2.1) (10 ml tubes). They were grown at 28°C with shaking for 24 hours.
2.10.2.1 YPAD medium
Yeast extract (1%) 10 g/L
Peptone (2%) 20 g/L
Glucose (2%) 20 g/L
Agar (2%) 20 g/L
Adenine sulphate (0.004%) 40 mg/L
The pH was adjusted to 5.8 with HCl

58
2.10.3 Mating of yeast strains
200 µl of the bait cultures were mixed with 200 µl of prey cultures, using a
10 ml falcon. They were incubated at 28°C for 48 hours, without shaking.
2.10.4 Enrichment for mated (diploid) cells
From the mated cultures 50 µl were used to inoculate 1 ml of DOB-L-W,
into a 10 ml falcon. They were grown at 48°C for 48 hours, with shaking.
2.10.5 3-AT titration of diploid cells
After two days of incubation, diploid enriched cultures were plated on
appropriate media to score for diploids and positive bait-prey interactions. 5 µl
of each inoculum were plated on the following media:
DOB-L-W;
DOB-L-W-H;
DOB-L-W-H + 1, 5, 10, 15, 30, 60 mM 3-AT (3-Amino-1, 2, 4-triazole,
Sigma Aldrich, Gillingham, UK);
The inoculated plates were placed at 28°C for 7 days.
2.10.6 Scoring yeast growth
The yeast growth was scored between day 2 and 7, after plating. In order
to know the appropriate media to be used in the real screening, the scoring at
day 5 and the lowest 3-AT concentration inhibiting completely the yeast
growth, were selected. Leaky expression of the HIS3 reporter gene was titrated
by using diploid cells obtained after mating the two yeast strains. 3-AT is a
competitive inhibitor of the product of HIS3 gene.

59
3. Results
3.1 Analysis of endosperm specific gene expression in Arabidopsis
3.1.1 Introduction
Bassel et al. (2011), using publically available transcriptome data,
developed a network of correlation based interactions between genes expressed
in Arabidopsis seeds during either germination or dormancy.
Representing the number of genes, the nodes within SeedNet were
separated into 3 regions, associated either with germination (region 3) or
dormancy (region 1), or the transition state between them (region 2). The
interactions between genes are represented by edges. It was found that genes
from regions 1 and 3 were associated with ABA or GA responses.
If Bassel et al. developed a coexpression network (Bassel et al., 2011), in
2013, Dekkers et al. developed two time-based networks comparing the genes
expressed in the endosperm and embryo of Arabidopsis seeds: EndoNet and
RadNet (Dekkers et al., 2013).
Interactive visualizations of both networks are available online at
http://vseed.nottingham.ac.uk.
Using the Molecular Complex Detection (MCODE) algorithm (Bader &
Hogue, 2003), Bassel et al. defined 136 modules of significantly interacting
genes within SeedNet (Bassel et al., 2011).
In this study, one of these clusters, cluster 19, comprising endosperm
specific genes was analysed (Figure 1.5). The most well-known gene of this
cluster was EXPA2 (At5g05290) (Figure 3.2). This gene has been analysed
previously, being important in germination, as it encodes an expansin protein
involved in endosperm weakening (Yan et al., 2014; Dubreucq et al., 2000;
Ogawa et al., 2003; Penfield et al., 2006).

60
Figure 3.1 EndoNet, gene network, interactions represented by edges. (A) EXPA2 first
neighbours (genes from different clusters; each cluster is represented by a unique colour). (B)
Genes observed in this study are highlighted.
The hypothesis tested by these analyses, was that the genes from the same
cluster are coexpressed in terms of time and spatial distribution, within
endosperm during germination. Based on gene networks prediction, it was
tested if other genes from cluster 19 were following the same expression
pattern as EXPA2, and also checked if there are gene interactions during
germination between endosperm specific genes.
A
B

61
3.1.2 Analysis of the genetic function of EXPA2 in germination
Previous work showed that EXPA2 (Figure 3.2) is involved in the
endosperm cell wall remodeling process during germination, that is a GA-
inducible and micropylar endosperm specific gene (Ogawa et al., 2003; Yan et
al., 2014; Endo et al., 2012).

62
Figure 3.2 (A) EXPA2 expression in the whole seed using Nottingham Seed eFP Browser. The
scale bar indicates the expression of EXPA2, the highest expression level represented by red,
and the lowest by yellow. (B) Expression of EXPA2 in vSEED transcriptomic database. The
above graphs show (on a log2 scale) the levels of RNA expression in Endosperm and Embryo
during germination. MCE = Micropylar and Chalazal Endosperm, RAD = Radicle, PE = Rest
of the endosperm, COT = Cotyledons, DRY = Whole dry seeds.
A
B
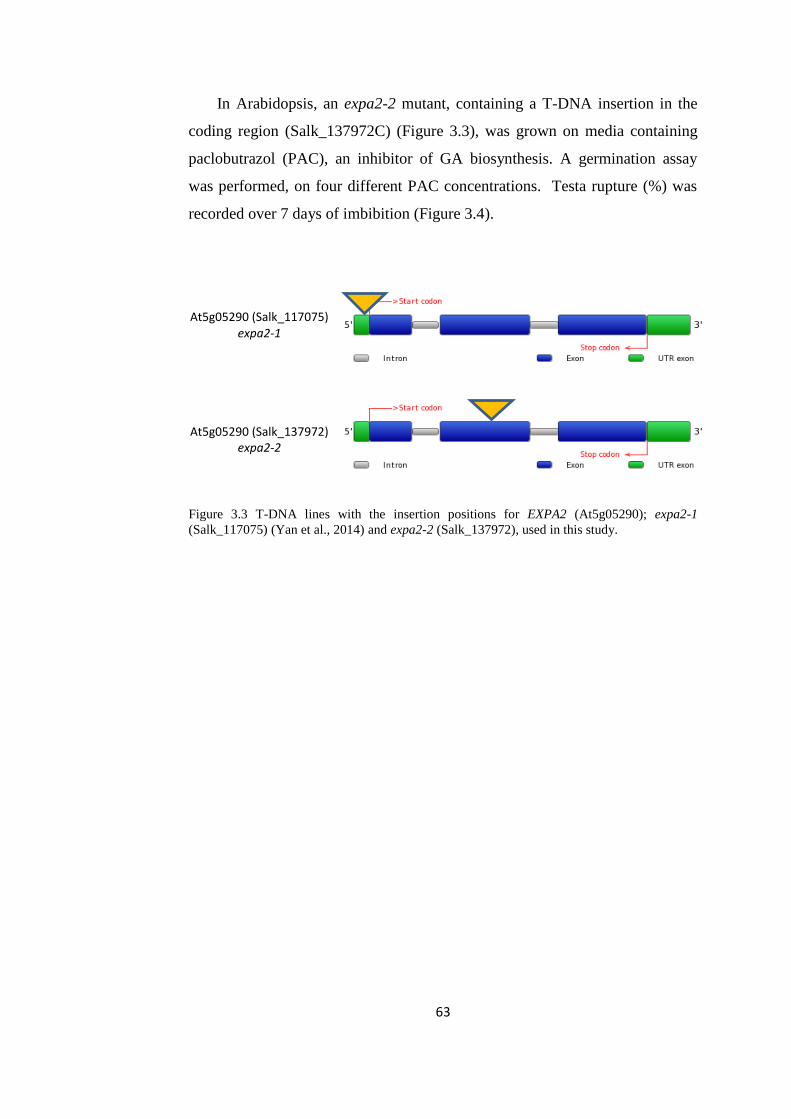
63
In Arabidopsis, an expa2-2 mutant, containing a T-DNA insertion in the
coding region (Salk_137972C) (Figure 3.3), was grown on media containing
paclobutrazol (PAC), an inhibitor of GA biosynthesis. A germination assay
was performed, on four different PAC concentrations. Testa rupture (%) was
recorded over 7 days of imbibition (Figure 3.4).
Figure 3.3 T-DNA lines with the insertion positions for EXPA2 (At5g05290); expa2-1
(Salk_117075) (Yan et al., 2014) and expa2-2 (Salk_137972), used in this study.
At5g05290 (Salk_117075) expa2-1
At5g05290 (Salk_137972) expa2-2
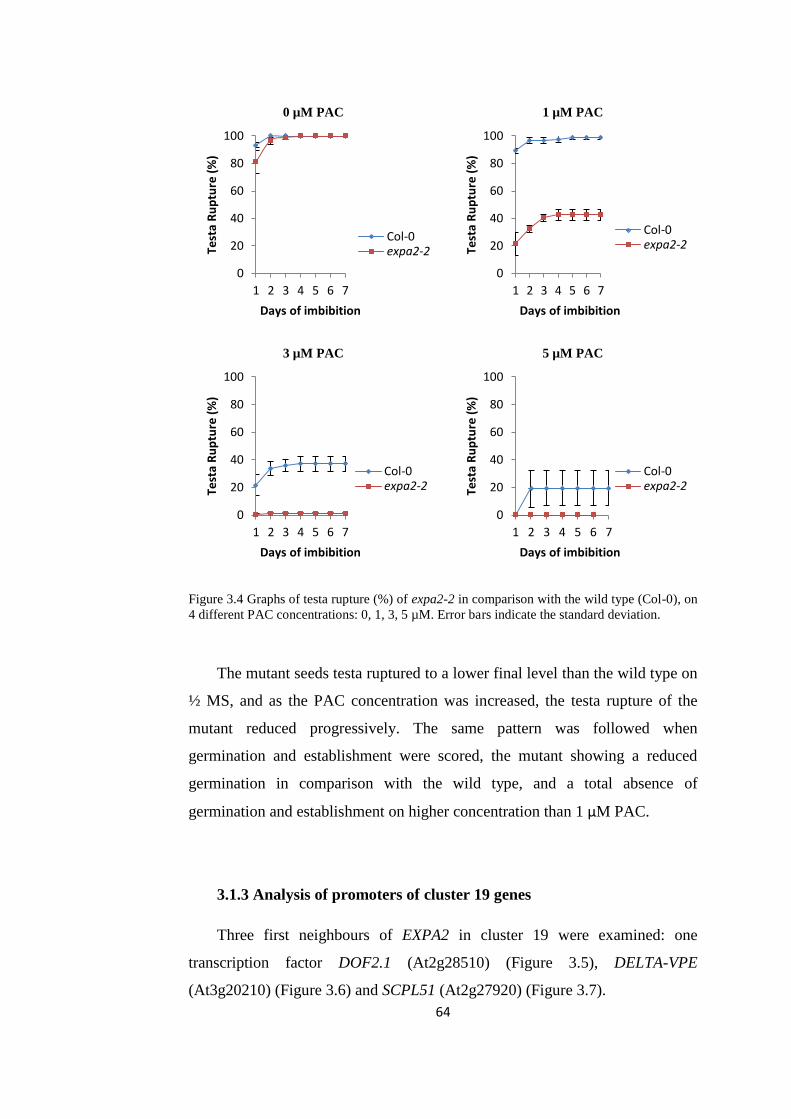
64
Figure 3.4 Graphs of testa rupture (%) of expa2-2 in comparison with the wild type (Col-0), on
4 different PAC concentrations: 0, 1, 3, 5 µM. Error bars indicate the standard deviation.
The mutant seeds testa ruptured to a lower final level than the wild type on
½ MS, and as the PAC concentration was increased, the testa rupture of the
mutant reduced progressively. The same pattern was followed when
germination and establishment were scored, the mutant showing a reduced
germination in comparison with the wild type, and a total absence of
germination and establishment on higher concentration than 1 µM PAC.
3.1.3 Analysis of promoters of cluster 19 genes
Three first neighbours of EXPA2 in cluster 19 were examined: one
transcription factor DOF2.1 (At2g28510) (Figure 3.5), DELTA-VPE
(At3g20210) (Figure 3.6) and SCPL51 (At2g27920) (Figure 3.7).
0
20
40
60
80
100
1 2 3 4 5 6 7
Test
a R
up
ture
(%
)
Days of imbibition
1 µM PAC
Col-0expa2-2
0
20
40
60
80
100
1 2 3 4 5 6 7
Test
a R
up
ture
(%
)
Days of imbibition
5 µM PAC
Col-0expa2-2
0
20
40
60
80
100
1 2 3 4 5 6 7
Test
a R
up
ture
(%
)
Days of imbibition
0 µM PAC
Col-0expa2-2
0
20
40
60
80
100
1 2 3 4 5 6 7
Test
a R
up
ture
(%
)
Days of imbibition
3 µM PAC
Col-0expa2-2

65
Figure 3.5 (A) DOF2.1 expression in the whole seed using Nottingham Seed eFP Browser. The
scale bar indicates the expression of DOF2.1, the highest expression level represented by red,
and the lowest by yellow. (B) Expression of DOF2.1 in vSEED transcriptomic database. The
above graphs show (on a log2 scale) the levels of RNA expression in Endosperm and Embryo
during germination. MCE = Micropylar and Chalazal Endosperm, RAD = Radicle, PE = Rest
of the endosperm, COT = Cotyledons, DRY = Whole dry seeds.
A
B

66
Figure 3.6 (A) DELTA-VPE expression in the whole seed according to Nottingham Seed eFP
Browser. The scale bar indicates the expression of DELTA-VPE, the highest expression level
represented by red, and the lowest by yellow. (B) Expression of DELTA-VPE in vSEED
Transcriptomic data base. The above graphs show (on a log2 scale) the levels of RNA
expression in Endosperm and Embryo during germination. MCE = Micropylar and Chalazal
Endosperm, RAD = Radicle, PE = Rest of the endosperm, COT = Cotyledons, DRY = Whole
dry seeds.
B
A
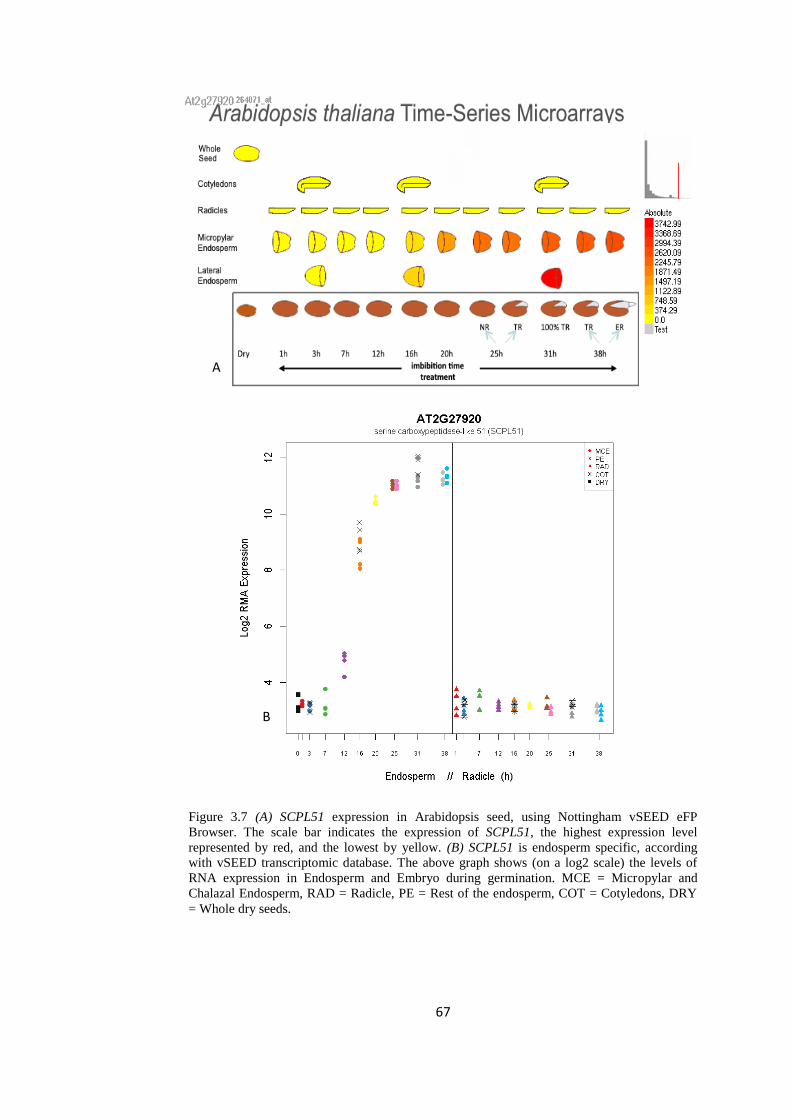
67
Figure 3.7 (A) SCPL51 expression in Arabidopsis seed, using Nottingham vSEED eFP
Browser. The scale bar indicates the expression of SCPL51, the highest expression level
represented by red, and the lowest by yellow. (B) SCPL51 is endosperm specific, according
with vSEED transcriptomic database. The above graph shows (on a log2 scale) the levels of
RNA expression in Endosperm and Embryo during germination. MCE = Micropylar and
Chalazal Endosperm, RAD = Radicle, PE = Rest of the endosperm, COT = Cotyledons, DRY
= Whole dry seeds.
A
B

68
GUS constructs were developed containing the promoter region of
DELTA-VPE and SCPL51, consisting of 2000bp, upstream of the ATG, while
for DOF2.1 a translational fusion was performed, including the gene sequence
as well. The fragments were amplified using specific GUS primers, into final
vectors, using Gateway cloning kit (Figure 3.8).
Figure 3.8 (A) Promoter fusion construct for promDELTA-VPE::GUS and promSCPL51::GUS;
(B) Translation fusion construct for promDOF2.1::DOF2.1::GUS, the stop codon was
removed to keep the C-terminal GUS protein in frame.
Figure 3.9 (A) PCR amplification products of promoters of: (1)- DELTA-VPE (1.3kb); (2)-
SCPL51 (2kb); (3)- DOF2.1 (3.7kb) (B) Digestion results with BsrGI of the promoters cloned
into donor vector pDONR221 : pDONR221+ DELTA-VPE (1); pDONR221+SCPL51 (2);
pDONR221+DOF2.1 (3) (C) Digestion products with BsrGI of promoters cloned into final
vector pKAN and pGWB433, respectively : (2), (3), (4) - pKAN+DELTA-VPE; (5), (6), (8)-
pKAN +SCPL51; (7), (9), (10)- pGWB433+DOF2.1; M- DNA ladder 1kb+.
The transgenic seeds were used in experiments to confirm the prediction of
SeedNet that the selected genes are endosperm specific and to analyse their
individual expression characteristics.
A
M 1 2 3
B
M 1 2 3
C
1 M 2 3 4 5 6 7 8 9 10
Promoter 2000bp uptstream 5` ATG
ATG GUS STOP CODON A
Promoter 2000bp uptstream 5` ATG B
ATG
Genomic DNA
ATG
GUS
TAG

69
3.1.4 Analysis of promoter expression of cluster 19 genes in the
endosperm
3.1.4.1 Reporter expression driven by cluster 19 promoters
In order to define the spatial and temporal expression of the promoter of
DELTA-VPE, DOF 2.1 and SCPL51, a series of experiments were performed.
Seeds of promDELTA-VPE::GUS, promDOF2.1::DOF2.1::GUS and
promSCPL51::GUS were imbibed on ½ MS for 24 hours and then separated
from the embryo and stained overnight. The lines with the most consistent and
uniform expression were selected to be used in further experiments.
Four independent transgenic lines for each construct were analysed; fifty
seeds per each replicate, with four replicates for each line, counted at 30, 34
and 48 hours of imbibition (Figure 3.10).

70
Figure 3.10 Germination assay for the promoter::GUS lines used in the endosperm specific
experiments. 4 lines with 4 replicates for each construct were analysed. The germination was
scored at 3 different time points: 30, 34 and 48 hours of imbibition. Error bars represent the
standard deviation.
The seeds were in the same stage of after-ripening (grown and harvested at
the same time) and could therefore be directly compared. The endosperms were
dissected after 24 hours of imbibition, and stained overnight, to observe the
reporter gene activity (Figure 3.11).
0
20
40
60
80
100
30 34 38 42 46 50
Test
a R
up
ture
(%
)
hours of imbibition
0
20
40
60
80
100
30 34 38 42 46 50
Ge
rmin
atio
n (
%)
hours of imbibition
0
20
40
60
80
100
30 34 38 42 46 50
Esta
blis
he
d (
%)
hours of imbibition

71
Figure 3.11 Expression properties of the promEXPA2::GUS, promDELTA-VPE::GUS,
promSCPL51::GUS and promDOF2.1::DOF2.1::GUS. Seeds of transgenic plants were
imbibed for 24h, after which seed coat (testa and endosperm (1) and embryo (2) were separated
and assessed for GUS accumulation by staining. The seed coat was bleached to ease
visualisation of stain; this treatment did not affect the GUS expression. Scale bar= 25µm.
The expression of GUS driven by all of the promoters could be observed
in the endosperm, but not in the embryo. While for EXPA2, DELTA-VPE and
SCPL51 the expression was visible in the entire endosperm, for the
translational fusion of the transcription factor DOF2.1 an isolated expression
could be observed, in the micropylar region.
3.1.4.2 Effect of ABA/GA on expression driven by cluster 19 promoter
GUS lines in seeds
To understand the effect of ABA and GA on the expression of promoters
of DELTA-VPE, SCPL51 and DOF2.1, seeds containing the reporter gene
linked to promoters of these genes, were plated on media containing ABA or
GA. GA was previously shown to control EXPA2 activity, its expression being
increased by external GA addition, while ABA has no effect on EXPA2
expression (Ogawa et al., 2003), but nothing is known about the other three
genes from cluster 19.
Seeds of promDELTA-VPE::GUS, promDOF2.1::DOF2.1::GUS,
promSCPL51::GUS were plated on ½ MS media plus 10 µM ABA, for 5 days,
at which point the endosperms were separated from embryos and stained for 24
hours to observe GUS activity (Figure 3.12).
promEXPA2::GUS
promDELTA-VPE::GUS
promSCPL51::GUS
promDOF2.1::DOF2.1::GUS
endosperms
embryos
A
B

72
Figure 3.12 GUS expression in the promoters’ response to ABA treatment: promEXPA2::GUS,
promDELTA-VPE::GUS, promSCPL51::GUS, promDOF2.1::DOF2.1::GUS. Seeds were
imbibed for 5 days on ½ MS+ 10 µM ABA, dissected at that moment and stained for 24 hours.
promSCPL51::GUS and promDELTA-VPE::GUS were expressed all over the endosperm, but
no expression could be detected on promDOF2.1::DOF2.1::GUS containing seeds. Image
courtesy of Julietta Marquez for promEXPA2::GUS. Scale bar= 25µm.
As shown in figure 3.12, the activity of promEXPA2::GUS,
promDELTA-VPE::GUS and promSCPL51::GUS was not affected by ABA.
The conclusion would be that promoter driven expression of these genes is
ABA insensitive. No expression could be observed for
promDOF2.1::DOF2.1::GUS, either because the expression was at an
undetectable level or it was inhibited by ABA presence.
To test the response to GA, after a short imbibition period of 1 hour,
half of the dissected endosperms were stained, while the other half was plated
on media containing 25 µM GA, for 24 hours before being stained.
The results, shown in figure 3.13, indicate that promEXPA2::GUS
could be observed in the micropylar endosperm after one hour of imbibition
and that when GA was added in the media, its expression spread in the entire
endosperm. promDELTA-VPE::GUS was expressed in the whole endosperm
after 1 hour of imbibition while, and its expression did not require GA, while
promSCPL51::GUS was expressed only if external GA was added into media.
promDOF2.1::DOF2.1::GUS expression could not be detected.
promEXPA2::GUS promDELTA-VPE::GUS promSCPL51::GUS promDOF2.1::DOF2.1::GUS
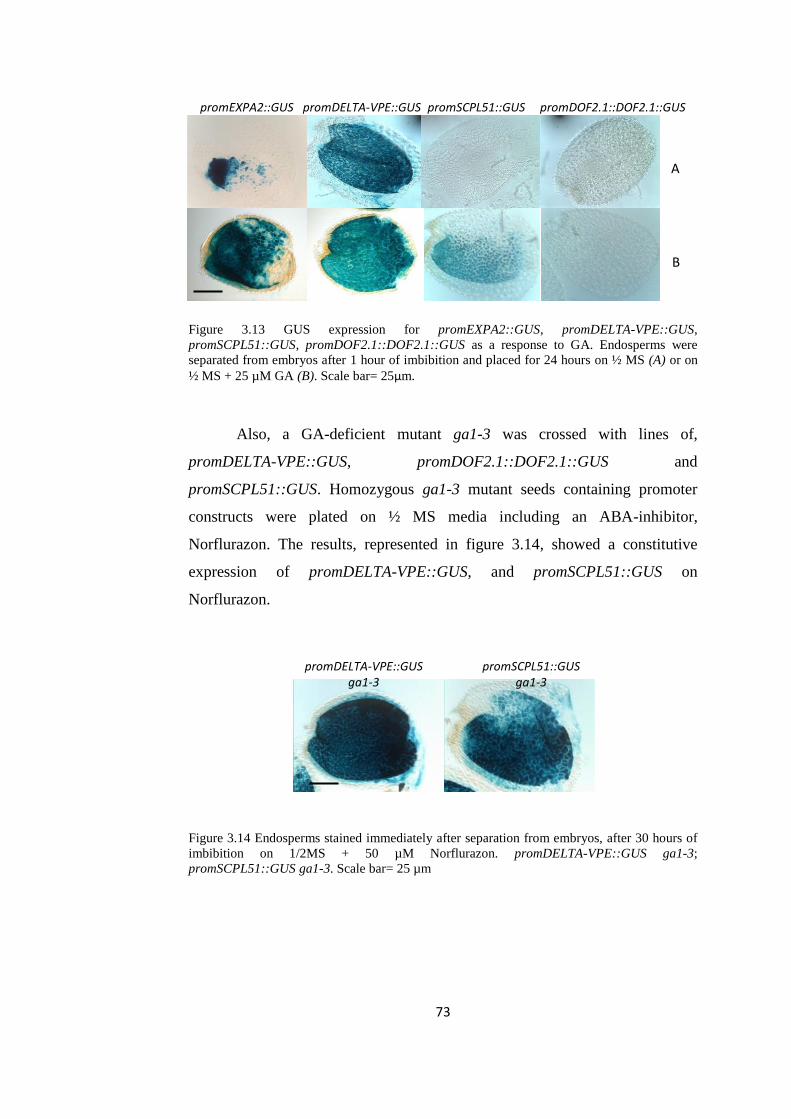
73
Figure 3.13 GUS expression for promEXPA2::GUS, promDELTA-VPE::GUS,
promSCPL51::GUS, promDOF2.1::DOF2.1::GUS as a response to GA. Endosperms were
separated from embryos after 1 hour of imbibition and placed for 24 hours on ½ MS (A) or on
½ MS + 25 µM GA (B). Scale bar= 25µm.
Also, a GA-deficient mutant ga1-3 was crossed with lines of,
promDELTA-VPE::GUS, promDOF2.1::DOF2.1::GUS and
promSCPL51::GUS. Homozygous ga1-3 mutant seeds containing promoter
constructs were plated on ½ MS media including an ABA-inhibitor,
Norflurazon. The results, represented in figure 3.14, showed a constitutive
expression of promDELTA-VPE::GUS, and promSCPL51::GUS on
Norflurazon.
Figure 3.14 Endosperms stained immediately after separation from embryos, after 30 hours of
imbibition on 1/2MS + 50 µM Norflurazon. promDELTA-VPE::GUS ga1-3;
promSCPL51::GUS ga1-3. Scale bar= 25 µm
promDELTA-VPE::GUS ga1-3
promSCPL51::GUS ga1-3
promEXPA2::GUS promDELTA-VPE::GUS promSCPL51::GUS promDOF2.1::DOF2.1::GUS
A
B

74
3.1.4.3 Is an embryo signal controlling endosperm gene expression?
In order to answer to the above question, separations of the endosperms
from the embryos at different time points were performed. The endosperms
were stained straight away or plated for 24 hours on respective media.
The subjected seeds were containing: promDELTA-VPE::GUS,
promSCPL51::GUS, promEXPA2::GUS in Col-0 background, or the mutants
with GA deficient background: promDELTA-VPE::GUS ga1-3,
promSCPL51::GUS ga1-3 and promEXPA2::GUS ga1-3.
The first time point, when the separation was possible without destroying
the endosperm structure, was between 15-30 minutes of imbibition on ½ MS or
½ MS + 25 µM GA, followed by the separations of the endosperm from
embryo. Half of the dissected endosperms were stained immediately after
separation from embryos, while the other half was plated on ½ MS media, or ½
MS + 25 µM GA for 24 hours and then stained (Figure 3.15).

75
Figure 3.15 GUS expression in endosperm separated after 15-30 minutes of imbition on ½ MS
(Col-0 background) or ½ MS+ 25 µM GA (ga1-3 background). (A) Endosperms stained
immediately after separation from embryos. (B) Separated endosperms were plated on ½ MS +
25 µM GA for 24 hours, then stained. (C) Separated endosperms were plated on ½ MS for 24
hours, followed by staining. Delta ga1-3 represents promDELTA-VPE::GUS ga1-3; Delta Col-
0 is promDELTA-VPE::GUS in Col-0 background; Scpl51 ga1-3 used for promSCPL51::GUS
ga1-3; Scpl51 Col-0 is promSCPL51::GUS in Col-0 background; Expa2 ga1-3 represents
promEXPA2::GUS ga1-3; Expa2 Col-0 is promEXPA2::GUS in Col-0 background. Scale bar=
25 µm
In Col-0 background only the activity of promDELTA-VPE::GUS and
promEXPA2::GUS, could be visible after 15 minutes of imbibition. The
promoter expression of DELTA-VPE, could be observed in the entire
endosperm while, for EXPA2 only in few cells of the micropylar endosperm.
The expression of promDELTA-VPE::GUS in ga1-3 background after 15-
30 minutes of imbibition on media containing GA, could be observed in the
micropylar endosperm. Also when the separated endosperms were plated for
24 hours on media with GA a similar expression could be noticed. When there
Delta ga1-3
GA
15-30 min of
imbibition
Scpl51 ga1-3
GA
Expa2 ga1-3
GA
Delta ga1-3
GA
Delta ga1-3
MS
Scpl51 ga1-3
MS
Scpl51 ga1-3
GA
Expa2 ga1-3
GA
Expa2 ga1-3
MS
GUS
24h on respective
media
Delta Col-0
GA
Delta Col-0
MS
Scpl51 Col-0
GA
Scpl51 Col-0
MS
Expa2 Col-0
MS
Expa2 Col-0
GA
Delta Col-0
MS
Expa2 Col-0
MS
A
B
C

76
was no GA in the media, a scarce expression could be observed in few cells of
the micropylar endosperm.
No GUS expression could be seen for promSCPL51::GUS and
promEXPA2::GUS in ga1-3 background, suggesting that their expression
might require endogenous GA or an embryonic signal that is developed later
than 15-30 minutes of imbibition.
The next time point for endosperm separation from embryo was between
30 and 45 minutes. The results are summarized in the figure 3.16.
Figure 3.16 GUS expression in endosperm separated after 30-45 minutes of imbition on ½ MS
for Col-0 background and ½ MS + 25 µM GA for ga1-3 background. (A) Endosperms stained
immediately after separation from embryos. (B) Separated endosperms were plated on ½ MS +
25 µM GA for 24 hours, then stained. (C) Separated endosperms were plated on ½ MS for 24
hours, followed by staining. Delta ga1-3 represents promDELTA-VPE::GUS ga1-3; Delta Col-
0 is promDELTA-VPE::GUS in Col-0 background; Scpl51 ga1-3 used for promSCPL51::GUS
ga1-3; Scpl51 Col-0 is promSCPL51::GUS in Col-0 background; Expa2 ga1-3 represents
promEXPA2::GUS ga1-3; Expa2 Col-0 is promEXPA2::GUS in Col-0 background. Scale bar=
25 µm
B
30-45 minutes of imbibition
GUS
24h on respective media
Delta ga1-3 GA
Delta ga1-3 MS
Scpl51 ga1-3 GA
Scpl51 ga1-3 MS
Expa2 ga1-3 GA
Expa2 ga1-3 MS
Delta Col-0 GA
Delta Col-0 MS
Scpl51 Col-0 GA
Scpl51 Col-0 MS
Expa2 Col-0 GA
Expa2 Col-0 MS
Delta ga1-3 GA
Scpl51 ga1-3 GA
Expa2 ga1-3 GA
Delta Col-0 MS
Expa2 Col-0 MS
A
C

77
At 30-45 minutes of imbibition, the expression of promDELTA-VPE::GUS
in ga1-3 background could be observed in few cells of the micropylar region
either if the endosperms were stained directly after the separation from the
embryo, or plated for 24 hours on ½ MS media with or without GA. For
promSCPL51::GUS ga1-3, no activity was observed.
The GUS expression for promEXPA2::GUS in ga1-3 in the separated
endosperms was concentrated in the micropylar region of the endosperm when
the endosperms were stained straight after the separation. After 24 hours on ½
MS media with GA, the expression spread all over the endosperm, while laying
only on ½ MS the expression was localized everywhere but not in the chalazal
endosperm.
For promDELTA-VPE::GUS in Col-0 background, GUS expression was
seen all over the endosperm cells, regardless if endosperms were stained
straight after separations from embryos, or plated on ½ MS with or without GA
for 24 hours. For promEXPA2::GUS in Col-0, a variation of GUS expression
could be seen between endosperm from GA supplemented media, underlying
the effect of GA on EXPA2 activity.
After one 45-60 minutes of imbibition on ½ MS media supplemented with
GA, the endosperms were separated and either stained directly for 24 hours,
both placed on ½ MS or ½ MS + GA for 24 hours, and then stained (Figure
3.17).

78
Figure 3.17 GUS expression in endosperm separated after 45-60 minutes of on ½ MS for Col-0
background and ½ MS + 25 µM GA for ga1-3 background. (A) Endosperms stained
immediately after separation from embryos. (B) Separated endosperms were plated on ½ MS +
25 µM GA for 24 hours, then stained. (C) Separated endosperms were plated on ½ MS for 24
hours, followed by staining. Delta ga1-3 represents promDELTA-VPE::GUS ga1-3; Delta Col-
0 is promDELTA-VPE::GUS in Col-0 background; Scpl51 ga1-3 used for promSCPL51::GUS
ga1-3; Scpl51 Col-0 is promSCPL51::GUS in Col-0 background; Expa2 ga1-3 represents
promEXPA2::GUS ga1-3; Expa2 Col-0 is promEXPA2::GUS in Col-0 background. Scale bar=
25 µm
After 45-60 minutes of imbibition, GUS expression was detected only in
the separated endosperms of promDELTA-VPE::GUS and promEXPA2::GUS
in ga1-3 and Col-0 background. For promDELTA-VPE::GUS ga1-3, GUS
activity could be detected only in the micropylar endosperm, while in Col-0
background in the whole endosperm, regardless the treatment.
For promEXPA2::GUS ga1-3, GUS expression was present in each single
cell of the endosperm with or without treatment, while in Col-0 an isolated
expression in the micropylar endosperm was noticed on media without GA.
45-60 minutes of
imbibition
Delta ga1-3
GA
Scpl51 ga1-3
GA
Expa2 ga1-3
GA
GUS
24h on
respective media
Delta ga1-3
GA
Delta ga1-3
MS
Scpl51 ga1-3
GA
Scpl51 ga1-3
MS
Expa2 ga1-3
GA
Expa2 ga1-3
MS
Delta Col-0
GA
Delta Col-0
MS
Scpl51 Col-0
GA
Scpl51 Col-0
MS
Expa2 Col-0
GA
Expa2 Col-0
MS
Delta Col-0
MS
Expa2 Col-0
MS
C
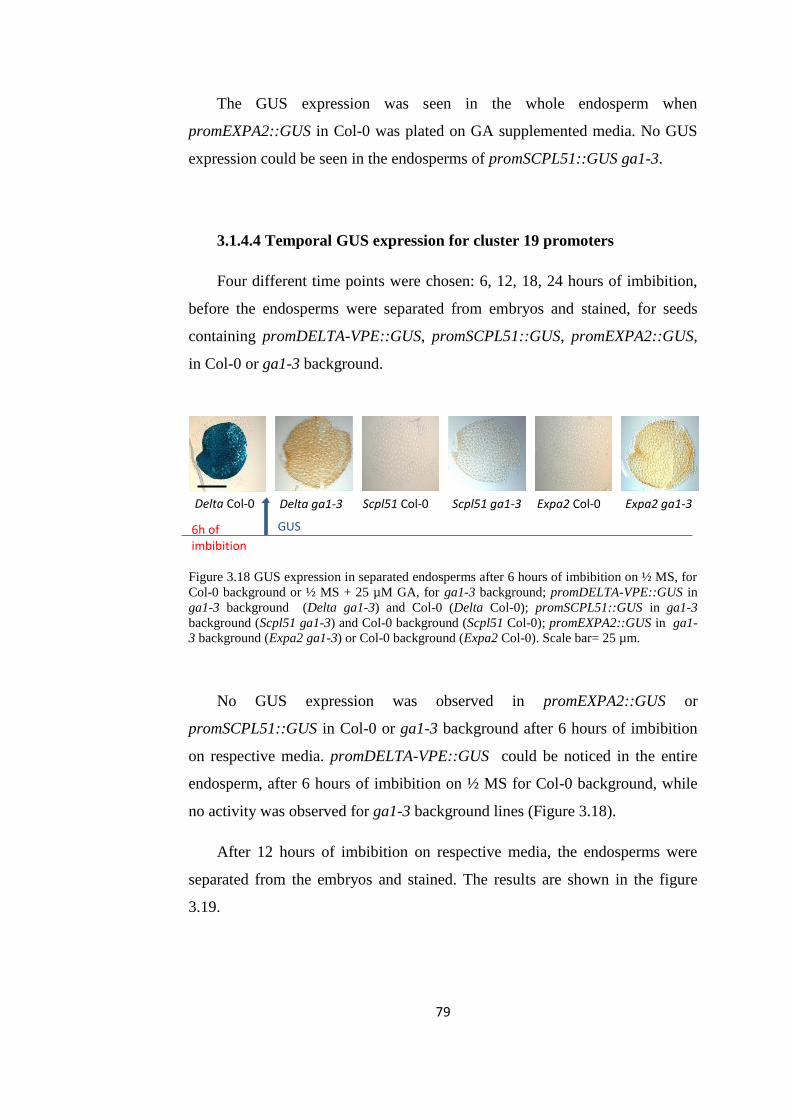
79
The GUS expression was seen in the whole endosperm when
promEXPA2::GUS in Col-0 was plated on GA supplemented media. No GUS
expression could be seen in the endosperms of promSCPL51::GUS ga1-3.
3.1.4.4 Temporal GUS expression for cluster 19 promoters
Four different time points were chosen: 6, 12, 18, 24 hours of imbibition,
before the endosperms were separated from embryos and stained, for seeds
containing promDELTA-VPE::GUS, promSCPL51::GUS, promEXPA2::GUS,
in Col-0 or ga1-3 background.
Figure 3.18 GUS expression in separated endosperms after 6 hours of imbibition on ½ MS, for
Col-0 background or ½ MS + 25 µM GA, for ga1-3 background; promDELTA-VPE::GUS in
ga1-3 background (Delta ga1-3) and Col-0 (Delta Col-0); promSCPL51::GUS in ga1-3
background (Scpl51 ga1-3) and Col-0 background (Scpl51 Col-0); promEXPA2::GUS in ga1-
3 background (Expa2 ga1-3) or Col-0 background (Expa2 Col-0). Scale bar= 25 µm.
No GUS expression was observed in promEXPA2::GUS or
promSCPL51::GUS in Col-0 or ga1-3 background after 6 hours of imbibition
on respective media. promDELTA-VPE::GUS could be noticed in the entire
endosperm, after 6 hours of imbibition on ½ MS for Col-0 background, while
no activity was observed for ga1-3 background lines (Figure 3.18).
After 12 hours of imbibition on respective media, the endosperms were
separated from the embryos and stained. The results are shown in the figure
3.19.
Delta Col-0 Delta ga1-3 Scpl51 Col-0 Scpl51 ga1-3 Expa2 Col-0 Expa2 ga1-3
6h of imbibition
GUS

80
Figure 3.19 GUS expression in separated endosperms after 12 hours of imbibition on ½ MS,
for Col-0 background or ½ MS + 25 µM GA, for ga1-3 background; promDELTA-VPE::GUS
in ga1-3 background (Delta ga1-3) and Col-0 (Delta Col-0); promSCPL51::GUS in ga1-3
background (Scpl51 ga1-3) and Col-0 background (Scpl51 Col-0); promEXPA2::GUS in ga1-
3 background (Expa2 ga1-3) or Col-0 background (Expa2 Col-0). Scale bar= 25 µm.
The GUS expression in promDELTA-VPE::GUS, in Col-0 background,
could be noticed in all the cells of the endosperm, while in ga1-3 background,
an isolated expression could be observed in few cells of the micropylar
endosperm. No GUS activity was observed for promSCPL51::GUS, in both
backgrounds Col-0, ga1-3, respectively. For promEXPA2::GUS, only few cells
of the endosperm showed GUS expression, in the Col-0 background, while for
ga1-3 background, the GUS expression was present in all the endosperm cells,
except the chalazal region.
The third chosen time point to dissect the seeds separating the endosperm
from embryo was at 18 hours of imbibition. The observed GUS activity is
displayed in figure 3.20.
Delta Col-0 Delta ga1-3 Scpl51 Col-0 Scpl51 ga1-3 Expa2 Col-0 Expa2 ga1-3
12h of imbibition
GUS

81
Figure 3.20 GUS expression in separated endosperms after 18 hours of imbibition on ½ MS,
for Col-0 background or ½ MS + 25 µM GA, for ga1-3 background; promDELTA-VPE::GUS
in ga1-3 background (Delta ga1-3) and Col-0 (Delta Col-0); promSCPL51::GUS in ga1-3
background (Scpl51 ga1-3) and Col-0 background (Scpl51 Col-0); promEXPA2::GUS in ga1-
3 background (Expa2 ga1-3) or Col-0 background (Expa2 Col-0). Scale bar= 25 µm.
After 18 hours of imbibition, expression of promDELTA-VPE::GUS and
promEXPA2::GUS could be observed fully expressed in both backgrounds
Col-0 and ga 1-3, in all the endosperm cells. The promSCPL51::GUS
expression was noticed only in the Col-0 background, in the micropylar and
lateral endosperm, but no activity was detected in ga1-3 background.
The latest time point was 24 hours of imbibition. Endosperms were
separated and stained, and the results are summarized in the below images
(Figure 3.21).
Figure 3.21 GUS expression in separated endosperms after 24 hours of imbibition on ½ MS for
Col-0 background or ½ MS + 25 µM GA, for ga1-3 background; promDELTA-VPE::GUS in
ga1-3 background (Delta ga1-3) and Col-0 (Delta Col-0); promSCPL51::GUS in ga1-3
background (Scpl51 ga1-3) and Col-0 background (Scpl51 Col-0); promEXPA2::GUS in ga1-
3 background (Expa2 ga1-3) or Col-0 background (Expa2 Col-0). Scale bar= 25 µm.
Delta Col-0 Delta ga1-3 Scpl51 Col-0 Scpl51 ga1-3 Expa2 Col-0 Expa2 ga1-3
24h of imbibition
GUS
Delta Col-0 Expa2 ga1-3
18h of imbibition
GUS
Delta ga1-3 Scpl51 Col-0 Scpl51 ga1-3 Expa2 Col-0

82
GUS expression could be seen in the whole endosperm for promDELTA-
VPE::GUS and promEXPA2::GUS, in both backgrounds, Col-0 and ga1-3,
while for promSCPL51::GUS, GUS expression was concentrated in the
micropylar and lateral endosperm for both backgrounds, Col-0 and ga1-3,
respectively.
3.1.4.5 Analysis of the genetic regulation of endosperm function by
cluster 19 transcription factors
In addition to defining the expression patterns of cluster 19 genes, genetic
interactions were probed by analyzing the regulation of germination by
transcription factors within the cluster. These include members of the bHLH,
C2C2 and ATH families (Bassel et al., 2011).
Germination of after-ripened mutant seeds (Figure 3.22) was analyzed in
the presence or absence of PAC; this approach was used to probe the
relationship between transcription factors function and requirement of GA for
their expression.
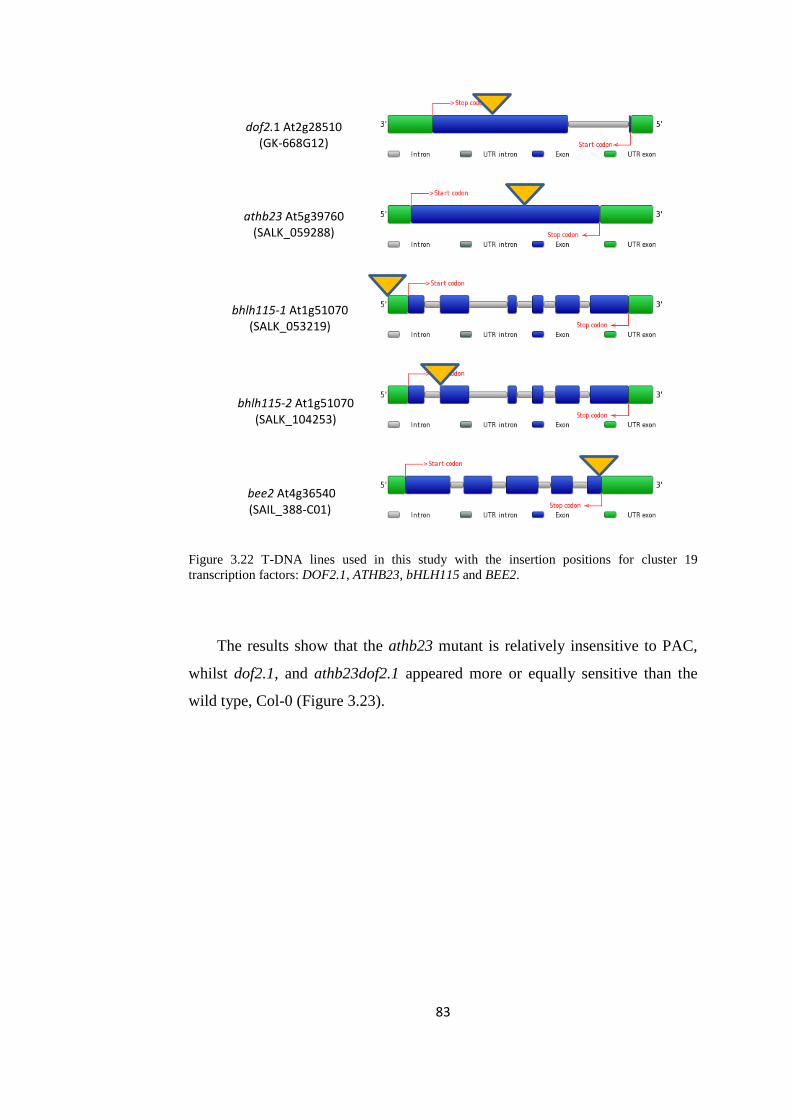
83
Figure 3.22 T-DNA lines used in this study with the insertion positions for cluster 19
transcription factors: DOF2.1, ATHB23, bHLH115 and BEE2.
The results show that the athb23 mutant is relatively insensitive to PAC,
whilst dof2.1, and athb23dof2.1 appeared more or equally sensitive than the
wild type, Col-0 (Figure 3.23).
dof2.1 At2g28510 (GK-668G12)
athb23 At5g39760 (SALK_059288)
bhlh115-1 At1g51070 (SALK_053219)
bee2 At4g36540 (SAIL_388-C01)
bhlh115-2 At1g51070 (SALK_104253)
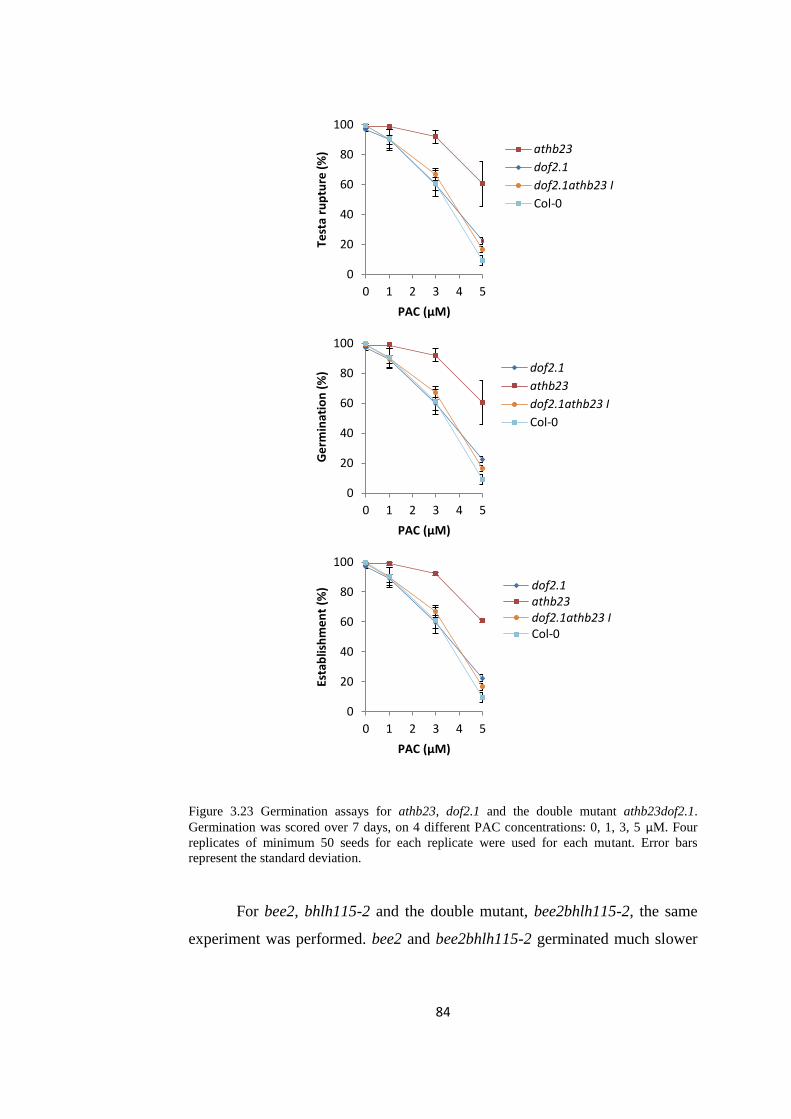
84
Figure 3.23 Germination assays for athb23, dof2.1 and the double mutant athb23dof2.1.
Germination was scored over 7 days, on 4 different PAC concentrations: 0, 1, 3, 5 µM. Four
replicates of minimum 50 seeds for each replicate were used for each mutant. Error bars
represent the standard deviation.
For bee2, bhlh115-2 and the double mutant, bee2bhlh115-2, the same
experiment was performed. bee2 and bee2bhlh115-2 germinated much slower
0
20
40
60
80
100
0 1 2 3 4 5
Test
a ru
ptu
re (
%)
PAC (µM)
athb23
dof2.1
dof2.1athb23 I
Col-0
0
20
40
60
80
100
0 1 2 3 4 5
Ge
rmin
atio
n (
%)
PAC (µM)
dof2.1
athb23
dof2.1athb23 I
Col-0
0
20
40
60
80
100
0 1 2 3 4 5
Esta
blis
hm
en
t (%
)
PAC (µM)
dof2.1athb23dof2.1athb23 ICol-0
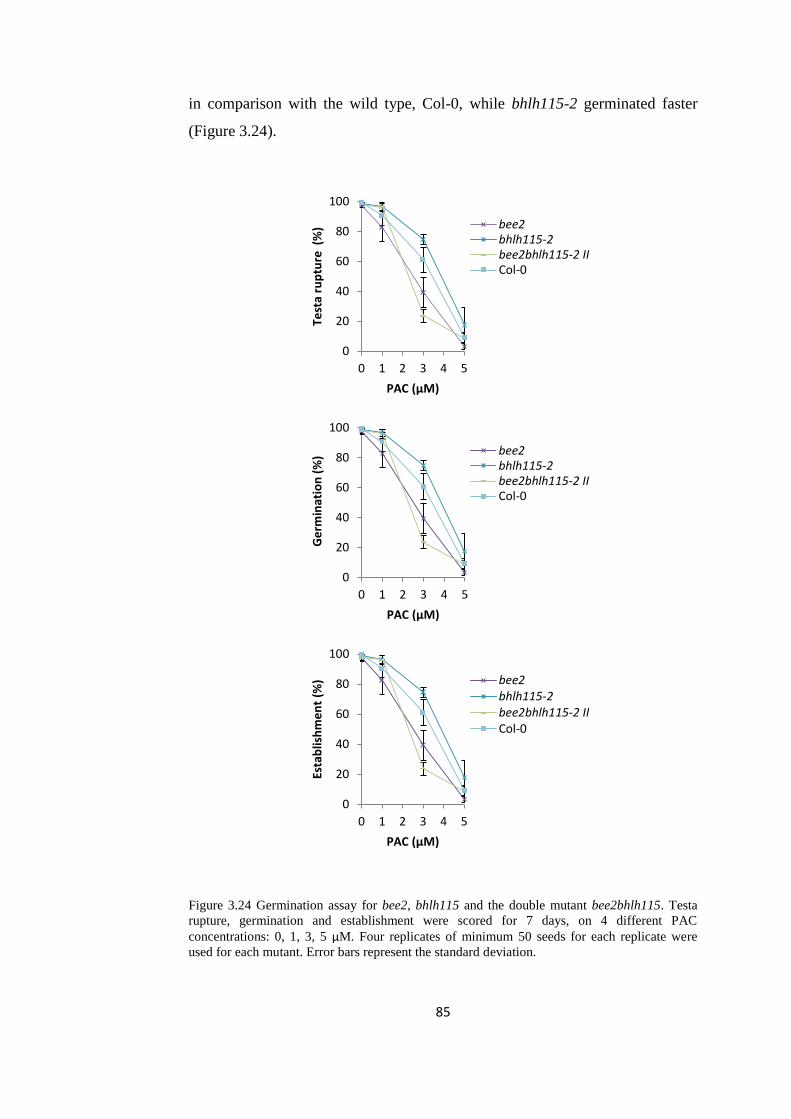
85
in comparison with the wild type, Col-0, while bhlh115-2 germinated faster
(Figure 3.24).
Figure 3.24 Germination assay for bee2, bhlh115 and the double mutant bee2bhlh115. Testa
rupture, germination and establishment were scored for 7 days, on 4 different PAC
concentrations: 0, 1, 3, 5 µM. Four replicates of minimum 50 seeds for each replicate were
used for each mutant. Error bars represent the standard deviation.
0
20
40
60
80
100
0 1 2 3 4 5
Test
a ru
ptu
re (
%)
PAC (µM)
bee2bhlh115-2bee2bhlh115-2 IICol-0
0
20
40
60
80
100
0 1 2 3 4 5
Ge
rmin
atio
n (
%)
PAC (µM)
bee2bhlh115-2bee2bhlh115-2 IICol-0
0
20
40
60
80
100
0 1 2 3 4 5
Esta
blis
hm
en
t (%
)
PAC (µM)
bee2bhlh115-2bee2bhlh115-2 IICol-0

86
Subsequently, the response of athb23, dof2.1 and the double mutant
athb23dof2.1 to stress agents including salt (NaCl) and polyethylene glycol
(PEG 6000) was analysed. For this purpose, a range of concentrations were
used, 0, 10, 20, 30% PEG and 0, 50, 100, 150 and 200 mM NaCl, in a
germination assay of 7 days, following chilling for 48 hours at 4°C.
Figure 3.25 Germination scores (7th
day) for athb23, dof2.1 and athb23dof2.1 on media
containing stress agents: PEG (0, 10, 20, 30%) and NaCl (0, 50, 100, 150 mM). The error bars
indicate standard deviation.
In figure 3.25, germination responses to different concentrations of PEG
and NaCl, indicate a higher tolerance of the mutants to abiotic stresses, than the
wild type Col-0. Both substances diminish water potential of cells.
To understand the relationship between transcription factors in cluster 19
and structural genes, crosses between athb23 and athb23dof2.1 and
0
20
40
60
80
100
0 50 100 150 200
Ge
rmin
atio
n (
%)
NaCl (mM)
Col-0
dof2.1
athb23
athb23dof2.1
0
20
40
60
80
100
0 10 20 30
Ge
rmin
atio
n (
%)
PEG (%)
Col-0
dof2.1
athb23
athb23dof2.1

87
promEXAP2::GUS, promDOF2.1::DOF::GUS, promDELTA-VPE::GUS and
promSCPL51::GUS, were made.
After the seeds were genotyped and the homozygous lines selected, a
germination assay on PAC was performed (Figure 3.26).
Figure 3.26 Testa rupture (%) of athb23 and athb23dof2.1 mutants scored for 7 days on 3
different concentrations of PAC: 0, 1 and 3 µM PAC. promDOF2.1/EXPA2::GUS athb23 were
showing testa rupture slower than the wild type, but also than the double mutants
promDOF2.1/EXPA2/DELTA-VPE/SCPL51::GUS athb23dof2.1. Error bars indicate standard
deviation.
The results show that the double mutants testa ruptured faster than the
single athb23, on media containing a GA inhibitor agent.
promDOF2.1::DOF2.1::GUS athb23 and promEXPA2::GUS athb23 were
more sensitive to PAC than the wild type Col-0, but also than double mutants
0
20
40
60
80
100
1 2 3 4 5 6 7
Test
a R
up
ture
(%
)
Days of imbibition
0 µM PAC
0
20
40
60
80
100
1 2 3 4 5 6 7
Test
a R
up
ture
(%
) Days of imbibition
1 µM PAC
0
20
40
60
80
100
1 2 3 4 5 6 7
Test
a R
up
ture
(%
)
Days of imbibition
3 µM PAC
Col-0DOF::GUS athb23DOF::GUS athb23dof2.1EXPA2::GUS athb23dof2.1DELTA-VPE::GUS athb23dof2.1EXPA2::GUS athb23SCPL51::GUS athb23dof2.1

88
promDOF2.1::DOF2.1::GUS athb23dof2.1 and promEXPA2::GUS
athb23dof2.1, respectively.
The fact that athb23 and athb23dof2.1 mutant lines resulted from crosses
with structural genes from cluster 19 were germinating differently than the
athb23 and athb23dof2.1 lines, it might be due to the environmental conditions
changes inside the growth rooms (night time temperature was changed).
Moreover, promEXPA2::GUS expression was monitored in the seeds
resulted from crosses between the transgenic plants and a mutant of ATHB23
(transcription factor, present in cluster 19). The analysed seeds were containing
promEXPA2::GUS in athb23 background, as well as in Col-0. They were
imbibed in ½ MS for 6, 12, 18 and 24 hours before the endosperms were
separated from embryos and stained (Figure 3.27).
Figure 3.27 GUS expression over 24 hours of imbibition (6, 12, 18, 24 HAI= hours of
imbibition) for promEXPA2::GUS in athb23 background and Col-0. Scale bar= 50 µm.
The results are indicating the fact that EXPA2 promoter expression was
visible after 18 hours of imbibition, in the whole endosperm in the wild type
background, while for athb23 mutant the expression was limited to the
micropylar and lateral endosperm. After 24 hours of imbibition, GUS activity
for EXPA2 promoter was similar for both backgrounds.
6HAI 12HAI 18HAI 24HAI
promEXPA2::GUS athb23
promEXPA2::GUS

89
3.1.4.6 Testing putative interactions between EXPA2 promoter and
cluster 19 transcription factors using yeast one hybrid system.
Regulation of transcription is important and underlines the gene expression
pattern. This is controlled by the number, position and interactions between the
cis-elements in gene promoters and the transcription factors. Cis-elements are
short DNA-sequences located in the gene promoters that are bound to certain
transcription factors (Castrillo et al., 2011).
To test if there are any interactions between the EXPA2 promoter and the
transcription factors from cluster 19: ATHB23, BEE2, bHLH115 and DOF2.1,
yeast one hybrid system was used. Possible interactions are displayed using
ATHAMAP program in Figure 3.28.
- other ABI3/VP1 AP2/EREBP bHLH bZIP
C2C2(Zn) Dof
C2C2(Zn) GATA
C2H2(Zn) CAMTA CAMTA-like
E2F/DP GARP GARP/ARR-B
GATA GRF
HD-HOX HD-KNOTTED HD-PHD HD-ZIP HSF
LFY MADS MIR MYB NAC SBP small RNAs TCP Trihelix WRKY(Zn) Figure 3.28 Transcription factors binding sites and small RNA target sites for EXPA2, 1200bp
upstream ATG; displayed map using AthaMap (http://www.athamap.de).
The promoter of EXPA2 was divided into 4 fragments: 3 fragments of
400bp and 1 fragment of 300bp (Figure 3.29). Each fragment was cloned into
pHISLEU2GW vector, using Gateway cloning system (Figure 3.30).

90
Figure 3.29 EXPA2 promoter (1200bp upstream ATG) was split in 4 fragments of 400bp and
300bp, respectively. The last 100bp of each fragment was overlapping with the beginning of
the next fragment.
Figure 3.30 Digestion products of EXPA2 promoter fragments cloned in pHISLEU2GW
(BsrGI): (1), (2) E1; (3), (4) E2; (5), (6) E3; (7), (8) E4; M- DNA ladder 1kb+.
The transcription factors: ATHB23 (At5g39760), bHLH115 (At1g51070),
BEE2 (At4g36540) and DOF2.1 (At2g28510) were amplified and cloned into
pDEST22, a vector suitable for yeast transformation (Figure 3.31), using
Gateway cloning system.
Figure 3.31 BsrGI digestion products of TFs cloned into pDEST22: (1), (2) ATHB23; (3)
BEE2; (4) bHLH; (5), (6) (7), (8) DOF2.1; M- DNA ladder 1kb+.
ATG 400bp
300bp 700bp
600bp 1000bp
1200bp
900bp
E4
E3
E2
E1
1 2 3 4 5 6 7 8 M M
1 4 5 M 2 3 6 7 8 M

91
After the DNA sequence of constructs was confirmed by Source
BioScience Sequencing Labs, that the vectors are containing the correct DNA
fragments, either EXPA2 promoter fragments or the TFs, the samples were sent
to Madrid, to Centre for Plant Biotechnology and Genomic, to the Laboratory
of Dr. Luis Onate Sanchez.
Under his supervision, the constructs were transformed into yeast strains,
the prey sequences (TFs) into Saccharomyces cerevisiae YM4271, together
with two negative controls: Green Fluorescent Protein (GFP) and an empty
plasmid. The bait sequences, the four fragments of EXPA2 promoter, were
cloned into Saccharomyces cerevisiae Y187 (α mating type) (Castrillo et al.,
under revision).
As described in Materials and Methods chapter, the plasmid used to
recombine the TFs into a yeast compatible strain, was conferring auxotrophy to
tryptophan, while the bait sequences were cloned into a strain with auxotrophy
to leucine, enabling the selection of the transformants.
After being grown on selective media where only diploid cells could grow
(- LEU, -W), the cultures containing diploid cells were mixed and plated on
plates with media lacking both amino acids (DOB-LEU-W) (Figure 3.32). The
diploid cells growth is an indicative for the success of mating between yeast
strains containing bait and prey sequences.

92
Figure 3.32 Diploids cells on selective media DOB-L-W (growing media lacking leucine and
tryptophan; only diploids cells could grow). Mated cells of EXPA2 promoter fragments (E1,
E2, E3, E4) with TFs: DOF2.1, bHLH115, ATHB23, BEE2 and two negative controls: GFP
and an empty plasmid.
To score for diploids and positive bait-prey interactions, selective media
missing histidine (Figure 3.33) and containing increasing concentrations of 3-
Amino-1, 2, 4- triazole (3-AT), an inhibitor of the reporter gene HIS3, as
described in Materials and Methods, were used (Figure 3.34).
E1
E2
E3
E4
BEE2 ATHB23 bHLH DOF1 DOF4 GFP Empty
plasmid

93
Figure 3.33 Diploid cells grown on auxotrophic media (DOB-L-W-H). Mated cells of EXPA2
promoter fragments (E1, E2, E3, E4) with TFs: DOF2.1, bHLH115, ATHB23, BEE2 and two
negative controls: GFP and an empty plasmid.
Yeast growth was reduced as soon as the histidine was removed from
media. Leaky expression of HIS3, was titrated using different 3-AT
concentrations, avoiding an increased number of false positive, but also
allowing the observation of weak interactions (Figure 3.34).
The yeast growth was scored for 5 days on auxotrophic media
containing different 3-AT concentrations. Yeast cells carrying the first two
EXPA2 promoter fragments (E1 and E2) required 0.1 mM 3-AT to suppress the
basal activity of HIS3, while a higher concentration was neded for E3 and E4
(Figure 3.34).
E1
E2
E3
E4
Empty
plasmid GFP DOF4 DOF1 bHLH ATHB23 BEE2

94
Figure 3.34 Yeast one hybrid screening of transcription factors: DOF2.1, bHLH115, ATHB23
and BEE2 with EXPA2 promoter fragments: E1, E2, E3 and E4, on auxotrophic media
containing increasing 3-AT concentrations: (A)- 0.1 mM 3-AT; (B)- 0.3 mM 3-AT; (C)- 0.7
mM 3-AT; (D)- 1mM 3-AT; (E)- 2mM 3-AT; (F)- 3mM 3-AT.
Diploid colony size was taken into account to compare and normalize
the strenghth of positive bait-prey interactions (Castrillo et al., 2011).
According to this principle, the only positive interactions appeared to be
between EXPA2 third and fourth fragments, E3 and E4, and BEE2 and
ATHB23, from the TFs.
From figure 3.34, we could see that the only matched pairs, able to
grow on higher 3-AT concentrations were E3/E4- ATHB23/BEE2. The
negative control stopped growing on 2 mM 3-AT.
As a preliminary result, the interacting factors appeared to be ATHB23
and BEE2 and the third and fourth fragments of EXPA2 promoter (E3 and E4).
E1
E2
E3
E4
BEE2 ATHB23 bHLH DOF1 DOF4 GFP
A
E1
E2
E3
E4
GFP DOF4 DOF1 bHLH ATHB23 BEE2
B
GFP DOF4 DOF1 bHLH ATHB23 BEE2
C
GFP DOF4 DOF1 bHLH ATHB23 BEE2
E1
E2
E3
E4 D
GFP DOF4 DOF1 bHLH ATHB23 BEE2
E1
E2
E3
E4 E
GFP DOF4 DOF1 bHLH ATHB23 BEE2
F
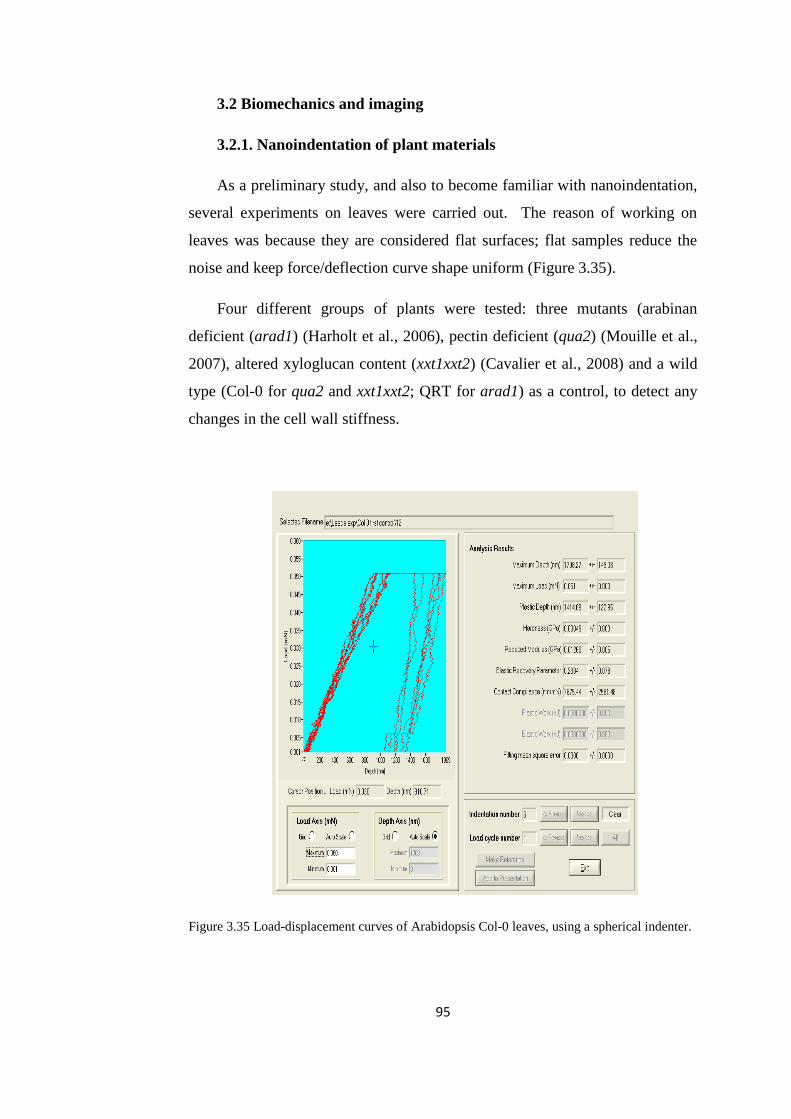
95
3.2 Biomechanics and imaging
3.2.1. Nanoindentation of plant materials
As a preliminary study, and also to become familiar with nanoindentation,
several experiments on leaves were carried out. The reason of working on
leaves was because they are considered flat surfaces; flat samples reduce the
noise and keep force/deflection curve shape uniform (Figure 3.35).
Four different groups of plants were tested: three mutants (arabinan
deficient (arad1) (Harholt et al., 2006), pectin deficient (qua2) (Mouille et al.,
2007), altered xyloglucan content (xxt1xxt2) (Cavalier et al., 2008) and a wild
type (Col-0 for qua2 and xxt1xxt2; QRT for arad1) as a control, to detect any
changes in the cell wall stiffness.
Figure 3.35 Load-displacement curves of Arabidopsis Col-0 leaves, using a spherical indenter.

96
The results plotted in figure 3.36, comparing the hardness and elastic
modulus values of the mutants with the correspondent wild type, no significant
difference could be found (two tail t-test, p>5). Using the literature results as
reference, it was expected to find differences in stiffness between qua2 and
Col-0, arad1 and QRT, the mutants having stiffer cell walls, while xxt1xxt2
more compliant than Col-0.
Figure 3.36 Reduced modulus (GPa) for Arabidopsis mutants qua2, xxt1xxt2, arad1 leaves in
comparison with their wild type correspondent Col-0 and QRT, respectively. Four leaves for
each type were tested with 10 indentations for each, in the same area, approximatively. Error
bars represent standard deviation.
Another comparison was made between the two sides of a leaf: adaxial
and abaxial sides, using different loading forces. The results were plotted in
figure 3.37. After running the t-test, no significant difference (p>0.5) was
found between the adaxial and abaxial sides.
0
0.005
0.01
0.015
0.02
0.025
0.03
Re
du
ced
mo
du
lus
(GP
a)
qua2Col-0
0
0.005
0.01
0.015
0.02
0.025
0.03R
ed
uce
d M
od
ulu
s (G
Pa)
xxt1xxt2Col-0
0
0.005
0.01
0.015
0.02
0.025
0.03
Re
du
ced
Mo
du
lus
(GP
a)
arad1QRT

97
Figure 3.37 Reduced modulus (GPa) results for Arabidopsis Col-0 leaves, indented on both
sides: adaxial (the upper surface of the leaf) and abaxial (the lower surface of the leaf) sides.
(A) Maximum load was 0.2 mN; (B) Maximum load was 0.5 mN; expt- experiment1, 2
consisting of 10 indentations per experiment. Halves of nine leaves were used in these
experiments, to be indented on both sides. Error bars represent standard deviation.
Although the results of leaves nanoindentation were not very encouraging,
Lepidium dry seeds were subjected to nanoindentation tests. The
nanoindentation approach was used in an attempt to generate reduced modulus
values for Lepidium endosperms in different stages of germination; assuming
that the changes in cell wall stiffness would be detectable.
The modulus of elasticity of a seed is a mechanical property which has
been suggested as a measure of the textural attribute described as firmness
(Khodabakhshian, 2012).
To test the sensitivity of the method, 10 dry cress seeds were indented, and
the results appeared to be consistent (the measured mean stiffness of the seeds
appeared to be constant amongst the cohort within the precision of the
technique), excluding seed 7 (Fig 3.38).
0
0.004
0.008
0.012
0.016
Re
du
ced
Mo
du
lus
(GP
a)
expt1 upperexpt2 upperexpt1 lowerexpt2 lower
0
0.004
0.008
0.012
0.016
Re
du
ced
Mo
du
lus
(G
Pa)
expt1 upperexpt2 upperexpt 1 lowerexpt 2 lower
A B

98
Figure 3.38 Results of nanoindentation of dry cress seeds (Lepidium sativum). Ten seeds were
indented with 10 indentations on top of the radicle; the elastic modulus (GPa) results are
displayed in columns; Error bars ± standard deviation.
Once the methodology was accepted as reliable, tests on imbibed seeds
were performed. After indenting 6 Lepidium endosperms, the mean value of
reduced modulus was ~100 MPa (Figure 3.39a). The cabin environment (22°C)
was leading to sample dehydration, as could be visually observed (Figure
3.39b). In order to complete a set of 10 indentations, approximately 2 hours
was needed. No significant difference was found between the elastic modulus
for endosperms of seeds imbibed for 1 or 16 hours (p>0.05).
0
1
2
3
4
5
6
Re
du
ced
mo
du
lus
(GP
a)
Cress 1
Cress 2
Cress 3
Cress 4
Cress 5
Cress 6
Cress 7
Cress 8
Cress 9
Cress 10

99
Figure 3.39 (A) Hardness (GPa) and reduced modulus (Er) (GPa) for Lepidium seeds imbibed
for 1 and 16 hours, respectively; (B) Lepidium seeds testa removed imbibed for 1, 16 hours
before and after indentation (same seed). 6 seeds were indented for each time point, 10
indentations being performed on top of the radicle, aiming the same area. HAI= hours of
imbibition; Error bars ± standard deviation. Scale bar= 500 µm.
B
16 HAI 1 HAI
Before After Before After
0
0.005
0.01
0.015
0.02
Hardness (GPa)
1HAI
16HAI
0
0.1
0.2
0.3
0.4
Er (GPa)
1HAI
16HAI
A

100
3.2.2 Atomic force microscopy
Dry Arabidopsis seeds were imaged using AFM. The acquired images
represent the height of the sample, a 3D reconstruction of it and also a heat
map (Figure 3.40).
Figure 3.40 AFM images of a dry Arabidopsis seed.1: height; 2: phase (3D reconstruction); 3-
3D heat map; scale bar= 2 µm.
Unfortunately no comparable data were acquired. The methodology failed
completely, when imbibed Arabidopsis endosperms were imaged. The
cantilever tip did not retract from the sample, impossible to generate retracting
curves.

101
3.2.3 Imaging Lepidium seeds using micro-CT
As the various components of an organ have different x–ray attenuation
coefficients, micro-computed tomography allows discrimination between
liquid-filled cells and the air-filled intercellular space of the seed. Thus scans
of either dry seed or imbibed seeds may be separated into those parts
representing solid plant tissue and the air spaces within the tissue (Dorca-
Fornell et al., 2013).
Thirty three Lepidium seeds in different stages of germination were
scanned in order to visualize the changes inside the seed from a dry state to the
completion of germination. In figure 3.41, seeds in different states are
represented as sections of seeds. The imbibed seeds were stained with 1% IKI,
while the dry seed was scanned without staining, considering that the staining
solution is an aqueous solution.
A B

102
Figure 3.41 Micro-CT images of Lepidium seeds, at different imbibition time points: dry,
1hour, 3 hours, 8 hours no testa ruptured, 8 hours with testa ruptured, and 16 hours of
imbibition. Scale bar= 0.06 mm. (VG Studio Max;
http://www.volumegraphics.com/en/products/vgstudio-max.html)
Assuming that endosperm thickness in affected by the compression or/and
stretching, using micro-CT 2D reconstructions, apparent thickness was
approximated using the automatic material calibration tool within StudioMax
version 2.0 (Volume Graphics, http://www.volumegraphics.com), in which the
background (air) and material (testa, endosperm and embryo) are differentiated
based on the grey value of individual voxels, which relates to the x–ray
attenuation and hence material density of the sample.
Dry seed 1HAI
3HAI 8HAI NTR
8HAI TR 16HAI

103
The endosperm was divided in three regions: micropylar, lateral and
peripheral (Figure 3.42). The mean values of endosperm thickness in these
regions were compared.
Figure 3.42 2D micro-CT of an imbibed Lepidium seed. Endosperm was divided in 3 regions:
micropylar, lateral and peripheral; each region was subdivided in: central (C), lateral right (R)
and left (L). Scale bar = 0.7 mm.
In dry seeds, the endosperm layer had an average thickness of ~ 15 µm in
all the regions: micropylar, chalazal, and non-micropylar endosperm (Figure
3.43).
Lateral endosperm 1R
Lateral endosperm 1L
Peripheral endosperm 1L
Peripheral endosperm C
Peripheral endosperm 1R
Micropylar endosperm 4L Micropylar endosperm 3L Micropylar endosperm 2L
Micropylar endosperm 1L Micropylar endosperm C
Micropylar endosperm 2R
Micropylar endosperm 1R

104
Figure 3.43 Micro-CT 2D pictures of a dry Lepidium seed. Endosperm thickness values
estimated using VG Studio Max; http://www.volumegraphics.com/en/products/vgstudio-
max.html. Scale bar= 0.08 mm
In an imbibed seed, before testa ruptures, the endosperm thickness
increased in the micropylar region to 25 µm, while in the chalazal region
remained at the same value (Figure 3.44).
embryonic axis
testa
endosperm
cotyledons
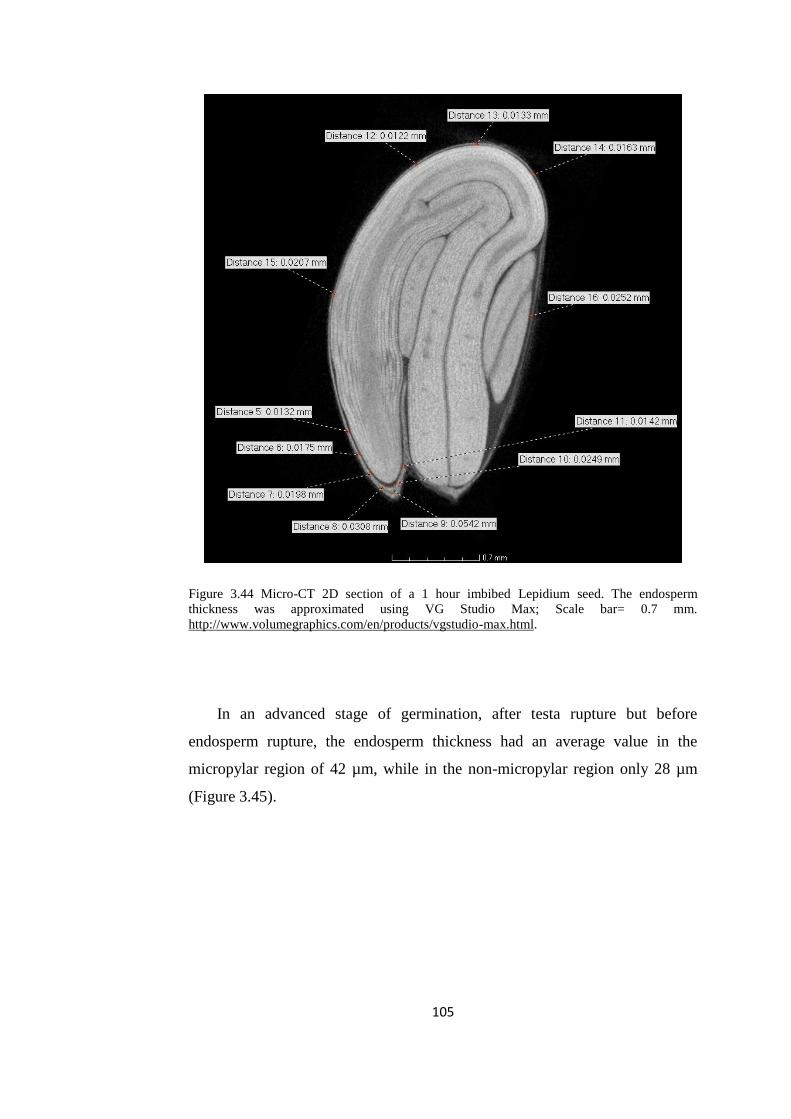
105
Figure 3.44 Micro-CT 2D section of a 1 hour imbibed Lepidium seed. The endosperm
thickness was approximated using VG Studio Max; Scale bar= 0.7 mm.
http://www.volumegraphics.com/en/products/vgstudio-max.html.
In an advanced stage of germination, after testa rupture but before
endosperm rupture, the endosperm thickness had an average value in the
micropylar region of 42 µm, while in the non-micropylar region only 28 µm
(Figure 3.45).

106
Figure 3.45 Micro-CT 2D section of an 8 hours imbibed Lepidium seed. The endosperm
thickness was approximated using VG Studio Max; Scale bar= 0.65 mm. http://www.volumegraphics.com/en/products/vgstudio-max.html.
After the radicle has protruded through the endosperm, the thickness of
micropylar endosperm was no longer measurable, but the values of endosperm
thickness in the seed were between 16-40 µm (Figure 3.46).

107
Figure 3.46 Micro-CT 2D picture of a Lepidium germinated seed using VG Studio Max;
http://www.volumegraphics.com/en/products/vgstudio-max.html. The radicle protruded
through the endosperm, making impossible the thickness estimation in the micropylar region.
Scale bar= 0.05 mm.
After the radicle protrusion, the endosperm cells remained intact,
suggesting that the rupture appears between individual cells, as was observed
on eSEM scans of Arabidopsis germinating seed (Figure 3.47). It enforces the
findings of Bethke et al. (2007) that the endosperm cells from radicle region
exhibited vacuolation and wall weakening, enough for individual cells to be
released from the layer.
endosperm
testa
radicle

108
Figure 3.47 eSEM Arabidopsis germinating seed. After radicle protrusion, the endosperm cells
are intact, suggesting the appearance of rupture between individual cells. Scale bar= 50 µm.
Mean values of endosperm thickness in different regions ME, LE and
PE were compared as subsections, each section being divided as shown in
figure 3.42, at different time points of imbibition (1, 3, 8, 16 hours) using
ANOVA two ways statistical test. The results indicated a significant difference
between subsections in single time points (p<0.001), significant difference
between time points (p<0.001) and also a significant difference between
subsections in different time points (p<0.001). 6 seeds for each time point were
analysed. The values are displayed in figure 3.48.
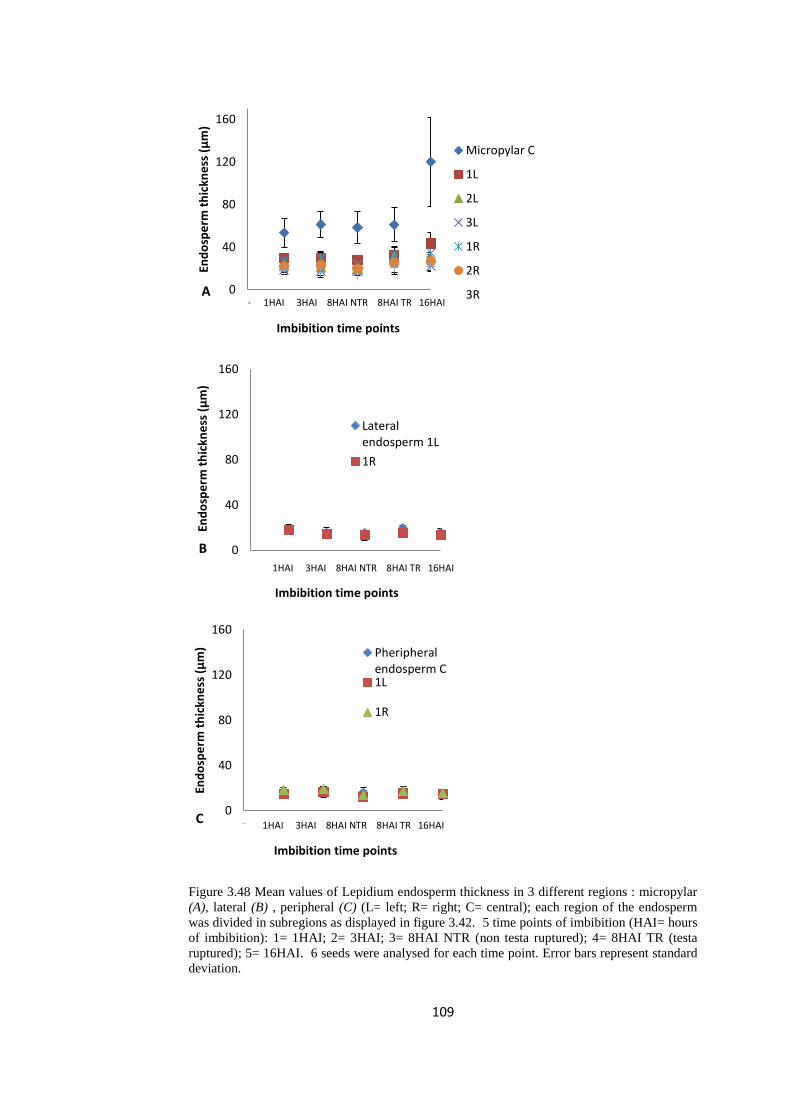
109
Figure 3.48 Mean values of Lepidium endosperm thickness in 3 different regions : micropylar
(A), lateral (B) , peripheral (C) (L= left; R= right; C= central); each region of the endosperm
was divided in subregions as displayed in figure 3.42. 5 time points of imbibition (HAI= hours
of imbibition): 1= 1HAI; 2= 3HAI; 3= 8HAI NTR (non testa ruptured); 4= 8HAI TR (testa
ruptured); 5= 16HAI. 6 seeds were analysed for each time point. Error bars represent standard
deviation.
A
B
0
40
80
120
160
0 1 2 3 4 5
End
osp
erm
th
ickn
ess
(µ
m)
Imbibition time points
Micropylar C
1L
2L
3L
1R
2R
3R
0
40
80
120
160
0 1 2 3 4 5
End
osp
erm
th
ickn
ess
(µ
m)
Imbibition time points
Lateralendosperm 1L
1R
0
40
80
120
160
0 1 2 3 4 5
End
osp
erm
th
ickn
ess
(µ
m)
Imbibition time points
Pheripheralendosperm C1L
1R
1HAI 3HAI 8HAI NTR 8HAI TR 16HAI
1HAI 3HAI 8HAI NTR 8HAI TR 16HAI
1HAI 3HAI 8HAI NTR 8HAI TR 16HAI
C
B
A
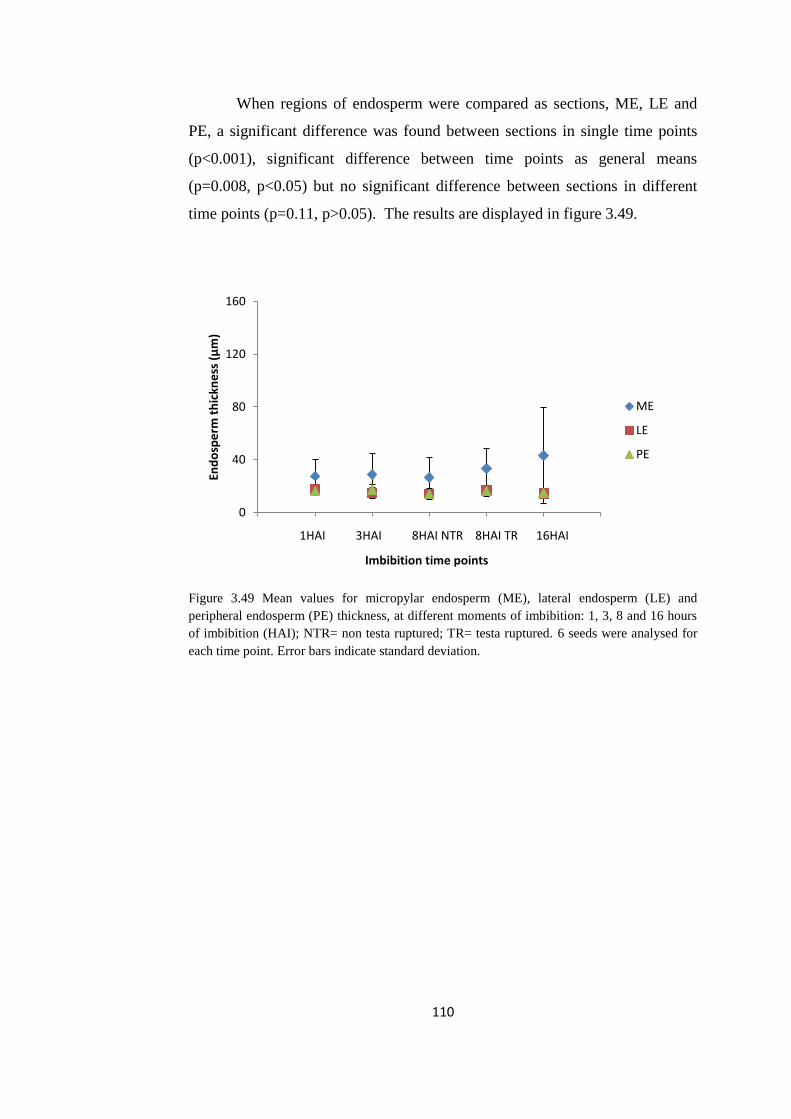
110
When regions of endosperm were compared as sections, ME, LE and
PE, a significant difference was found between sections in single time points
(p<0.001), significant difference between time points as general means
(p=0.008, p<0.05) but no significant difference between sections in different
time points (p=0.11, p>0.05). The results are displayed in figure 3.49.
Figure 3.49 Mean values for micropylar endosperm (ME), lateral endosperm (LE) and
peripheral endosperm (PE) thickness, at different moments of imbibition: 1, 3, 8 and 16 hours
of imbibition (HAI); NTR= non testa ruptured; TR= testa ruptured. 6 seeds were analysed for
each time point. Error bars indicate standard deviation.
0
40
80
120
160
0 1 2 3 4 5 6
End
osp
erm
th
ickn
ess
(µ
m)
Imbibition time points
ME
LE
PE
1HAI 3HAI 8HAI NTR 8HAI TR 16HAI

111
3.2.4 Digital image correlation
Although no DIC work has been reported for plants, it has been
successfully used to small animal tissue samples (Sutton et al., 2008). We
therefore tried using it, hoping to find realistic displacement results for
germinating Lepidium seeds. For this reason, imbibed seeds with testa
removed, coated in Cr powder, were subjected to images acquirement for 2
hours, using an optical Leica microscope having attached a camera (Figure
3.50).
Figure 3.50 Three Lepidium seeds without testa, coated with Cr powder. Scale bar= 0.05 mm
The recorded images were analyzed using Istra 4D software, generating
heat maps. After a region of interest was selected, and a reference point was
chosen, the strain was represented by colours, ranging from purple to red
(Figure 3.51).
Figure 3.51 Displacement heat maps for Lepidium seeds generated using Istra 4D. The purple
represents the smallest strain while at the other end the red colour, the highest (units are
µstrain).

112
Although the generated maps were showing a certain displacement into the
endosperm surface, in reality, this could not be linked to seed activity, since the
endosperm was drying out because of the heat generated by the microscope
lamp (Figure 3.52); the respective seed would never complete the germination,
unless it was rehydrated.
Figure 3.52 Strain heat maps for Lepidium seeds, on chosen area of interest. A uniform particle
pattern was chosen, so any movement could be registered. Scale bar= 0.05 mm.

113
4. Discussion
4.1 Investigating molecular biomechanics
The mechanical behaviour of organisms and organs is determined by the
physical properties of their components, tissues and cells. Recent biomechanics
studies have started to address mechanical properties of the plant cells in living
and growing tissues, at micro and nano scale, trying to elucidate growth and
organ shape formation.
In this study, an attempt to detect changes in endosperm cells physical
properties starting with imbibition and ending with radicle protrusion was
performed. Also using imaging techniques endosperm cells through
germination were visualized.
As discussed in introduction section it has been proven by various studies
on different species, e.g. tomato, coffee, lettuce (Bewley, 1997; da Silva et al.,
2004) and Lepidium sativum (Müller et al., 2006; Linkies et al., 2009) that the
endosperm changes its physical properties in the micropylar region, the region
covering the radicle, in order to allow the radicle to protrude.
For completing germination, not only the embryo growth is required but
also the loosening of the surrounding tissues. But how does loosening happen?
It is hypothesised to involve the relaxation of the cell wall tensile stress by cell
wall loosing agents, a decrease in turgor pressure and enlargement, by cell wall
creep (Cosgrove, 2005; Schopfer, 2006).
Marga et al., 2005, demonstrated using AFM that EXPANSIN is a
loosening agent in cucumber hypocotyls, acting on the linking polymers
between parallel microfibrils, rather than the whole matrix (Marga et al., 2005).
There are other cell wall remodeling enzymes which are involved in
endosperm loosening mainly mannanases (Nonogaki et al., 2000), glucanases
(Leubner-Metzger, 2003) and endotransglycosylases (Van Sandt et al., 2007).
Not only the cell wall components and the turgor pressure are important in
cell wall loosening, but also the hormones, ABA having an inhibitory effect,
114
delaying the endosperm rupture, while GA and ethylene are promoting the
endosperm weakening (Bewley, 1997; Müller et al., 2006; Linkies et al., 2009;
Finch-Savage & Leubner-Metzger, 2006).
In order to detect any changes in physical properties of the endosperm,
nanoindentation and later on, AFM, were proposed as suitable methodologies.
Nanoindentation was considered sensitive enough to detect differences in
tissue physical properties between endosperm regions, hoping to generate
results of stiffness and elasticity.
Also, imaging techniques were developed to visualize the changes
happening inside the seed through germination. For this purpose, Micro-CT,
eSEM and DIC were used.
4.2 Molecular dissection of endosperm specific gene expression
Understanding the role for the endosperm in germination is crucial for
elucidation of the mechanisms and processes happening during this irreversible
process. Several studies identified the genes expressed specifically in the
endosperm during germination (Dubreucq et al., 2000; Penfield et al., 2004).
One gene EXPANSIN A2 (EXPA2), has been described by Ogawa et al.,
2003 (Ogawa et al., 2003) and later on used as an endosperm marker by
Penfield et al., 2006 (Penfield et al., 2006). Other endosperm specific genes
include proteases, transporters, and cell wall–modifying enzymes (Penfield et
al., 2006).
In this study, EXPA2 was used in the compared expression with the
promoter expression of DELTA-VPE, SCPL51 and DOF 2.1. The proposed
hypothesises to be tested were concerning the DELTA-VPE, DOF2.1 and
SCPL51 specificity (spatial and temporal distribution in endosperm cells
during germination); to understand the effect of transcription factors from
cluster 19 on germination, by observing the phenotype germination for their T-

115
DNA lines; and to test any putative interactions between EXPA2 promoter and
transcription factors from cluster 19.
Also, another point of interest in studying these genes was their responses
to hormones, but also to establish if their expression requires an embryo signal.
4.2.1 Endosperm specific gene expression
The promoters of four genes from cluster 19, the only endosperm specific
cluster, were analysed (Bassel et al., 2011). Their expression was monitored
within GUS constructs. According to the results of this study, EXPA2, DELTA-
VPE, SCPL51 and DOF2.1 were expressed only in the endosperm, but not in
the embryos, suggesting an endosperm specific function for the encoded
proteins.
Also, a temporal distribution was observed for SCPL51 and EXPA2, which
required between 12-18 hours of imbibition before expression became visible,
while DELTA-VPE was expressed in the entire endosperm as early as 15
minutes of imbibition (the earliest time possible to separate seed tissues).
DELTA-VPE was proved by Endo et al., 2012 to be an enzyme involved in cell
death of testa formation, during seed development (Endo et al., 2012).
Endo et al., 2012, demonstrated that DELTA-VPE is endosperm specific
expressed in the imbibed seeds, and that is involved in cell vacuolation. Using
a mutant of this, they proved that vacuolation is a consequence of germination
(Endo et al., 2012).
In order to understand if their expression was triggered by an embryonic
signal, the endosperms were separated from embryos at early time imbibition
points, from 15 minutes to 24 hours, and stained after being plated on ½ MS or
½ MS supplemented with GA for 24 hours.
It was found that DELTA-VPE does not need an embryo signal to be
expressed, and also that it is GA insensitive; no difference was observed

116
between its expression on normal media, or media supplemented with GA.
Apparently, the expression of this gene is not trigger by GA.
While DELTA-VPE expression was not dependent on an embryonic signal,
it was not the case of SCPL51, which after separated from embryos and plated
on normal media, no activity of the reporter gene was registered, but when
external GA was added, its expression became visible by time. Therefore this
shows that its expression is trigger by GA.
To assess the effect of ABA on the expression of these genes, after five
days of imbibition on ½ MS with ABA, dissected endosperms were GUS
stained and then imaged, revealing the fact that EXPA2, DELTA-VPE and
SCPL51 were expressed, without any inhibitory effect of ABA on their
expression. This suggests that they are not involved in endosperm rupture but
general endosperm function.
It was observed that EXPA2 is expressed in the micropylar endosperm in
the first hours of imbibition that its expression requires an embryonic signal
and GA, and also that ABA has no effect on its expression. These results were
confirmed by Yan et al., 2014, who demonstrated the key role played by
EXPA2 in germination (Yan et al., 2014).
An interesting observation was that when promEXPA2::GUS and
promDELTA-VPE::GUS were transferred to a GA deficient background (ga1-
3), their expression characteristics changed. promDELTA-VPE::GUS instead of
showing an expression distributed in the whole endosperm, only an isolated
expression in few cells of the micropylar endosperm was observed. The
reduced expression of promDELTA-VPE::GUS in ga1-3 background, may
indicate the requirement of endogenous GA in endosperm cells before
imbibition.
Also, analysing the expression of promEXPA2::GUS in ga1-3 background,
it revealed a temporal expression, being present in the first hours of imbibition
in the micropylar endosperm, extended overtime in the whole endosperm; an
enriched expression in comparison with promEXPA2::GUS in Col-0

117
background. The difference between promEXPA2::GUS ga1-3 and
promEXPA2::GUS was the absence of endogenous GA in ga1-3, and its
presence in Col-0 background. Although the dissected endosperms were plated
on GA supplemented media, the expression of the reporter gene was less
abundant than in the ga1-3 background.
The contradictory results of promEXPA2::GUS expression cannot be
considered to elaborate a hypothesis, further investigations and repetition of
experiments would be required in order to explain them.
Analysing the role of transcription factors from cluster 19 in germination,
T-DNA lines were used in germination assays to score the germination
percentage on Paclobutrazol, an inhibitor of GA biosynthesis. In the
germinations assays were included double mutants, as well as the single
mutants: bee2, bhlh115-2, bee2bhlh115-2, athb23, dof2.1 and athb23dof2.1.
The results showed that athb23 is less sensitive than Col-0 and
athb23dof2.1, on media containing a GA inhibitor agent, germinating faster. If
the GA biosynthesis was inhibited and transcription factors ATHB23 and DOF
2.1 were not expressed, the seeds germinated slower while if only ATHB23 was
not expressed, they germinated faster.
This fact suggests a direct effect of DOF2.1 on ATHB23 expression. The
mutation whose phenotype is expressed is called epistatic, in this case DOF2.1,
while the altered phenotype is called hypostatic, ATHB23. Epistasis is the
phenomenon where the effects of one gene are modified by one or several
other genes (Rasmusson & Phillips, 1997).
When bee2, bhlh115-2, bee2bhlh115-2 were subjected to the same
treatment, bee2 and bee2bhlh115-2 germinated much slower in comparison
with the wild type, Col-0, while bhlh115-2 germinated faster.
Because only athb23 and athb23dof2.1 showed a germination phenotype,
they were selected to be used in crosses with promEXAP2::GUS,
promDOF2.1::DOF2.1::GUS, promDELTA-VPE::GUS and
promSCPL51::GUS. The homozygous seeds were plated on PAC, but for
118
athb23 mutant lines, a reduced germination could be observed, in opposition
with previous results. Due to the changes of the environmental conditions into
the growth rooms (night time temperature changed, Mike Holdsworth personal
communication) the germination phenotype could not be reproduced.
It is known that transcription factors are involved in stress responses
(Nakashima et al., 2012) by overexpression they provide high tolerance to
drought and salt. When athb23, dof2.1 and athb23dof2.1 were plated on
different concentration of PEG and NaCl, the germination scores were higher
than for the wild type, Col-0, suggesting that not only overexpression but also
knockout of transcription factors can affect germination by maintaining a
higher water potential of cells, emphasizing the role of endosperm in stress
tolerance.
4.2.2 Control of seed germination by EXPA2
The Arabidopsis EXPA2 was found to be expressed highly in endosperm
and described as an early GA-induced transcript during seed germination
(Ogawa et al., 2003).
Using an EXPA2 mutant (Salk_117075, T-DNA insertion in the promoter
region), exp2-1, Yan and al., 2014, demonstrated that mutant seeds, in which
the expression of EXPA2 was almost completely supressed, germinated
significantly slower than the wild type, confirming its importance for seed
germination (Yan et al., 2014).
Also, when plated on media containing osmotic stress factors such as NaCl
and PEG, expa2-1 seeds were showing a higher sensitivity than the wild type
Col-0, while the overexpression mutant seeds showed an improved tolerance to
stress factors than the wild type, Col-0.
In this study it was used a different T-DNA line (SALK_137972C, T-DNA
insertion in the coding region), expa2-2, observing that mutant seeds had a

119
reduced germination in comparison with the wild type Col-0, on media
containing an inhibitor of GA biosynthesis.
It is known that GA promotes germination (Groot & Karssen, 1987) and
also Yan et al., 2014, showed that EXPA2 is involved in the GA-mediated seed
germination, enforcing the results from expa2-2 germination scores on media
containing an inhibitor of GA biosynthesis.
It was observed a reduce germination for expa2-2, when the endogenous
GA was blocked by PAC, in comparison with the wild type, Col-0. This fact
supports the idea of which between EXPA2, GA and seed germination is a
direct interdependency. Also, it suggests the role of EXPA2 on endosperm
loosening, the mutant seeds lacking its expression showed a reduced
germination in comparison with the wild type.
4.2.3 Putative interaction between EXPA2 promoter fragments and
transcription factors from cluster 19
In the last years, yeast one hybrid system was frequently used to reveal the
control of transcription in plants, allowing in very short time identification of
cis-elements of a promoter and the transcription factors which they interact
with (Castrillo et al., 2011).
To test if there was any interaction between the EXPA2 promoter and
transcription factors from cluster 19, yeast one hybrid system was used. After
the constructs were grown in the yeast strain as baits, preys, respectively, the
yeast growth was scored after five days on selective media, containing an
inhibitor of the reporter gene used.
In this study the bait sequences represented by EXPA2 fragments, four
fragments of 400bp each, were mated with the prey sequences BEE2, ATHB23,
DOF2.1 and bHLH115, and grown on selective media, allowing the growth
and development only of the diploid cells.

120
Comparing the colony size, as a principle of interaction (Castrillo et al.,
2011), the results indicated a possible interaction between the third and fourth
fragment of EXPA2 (E3, E4) promoter and ATHB23 and between the fourth
fragment of EXPA2 promoter (E4) with BEE2, but further experiments are
required to confirm the result, as positive interactions.
Although the cis-elements in the EXPA2 promoter fragments 3 (E3) and 4
(E4) indicated specific bindings with DOF2.1, and fragments 1 (E1) with
bHLH115 or BEE2, apparently, fragments 3 and 4 (E3, E4) interact with
ATHB23 and BEE2, according to yeast one hybrid system preliminary results.
4.3 Biomechanical dissection of endosperm function
Lee et al., 2013, suggested that Arabidopsis and Lepidium endosperm cell
walls contain cellulose, homogalacturonan, arabinan, and xyloglucan, with the
difference that Lepidium endosperm cell walls contain extensin (Lee et al.,
2013). Also, the micropylar endosperm of Lepidium consists of one, two cell
layers, not a monolayer as in Arabidopsis.
Discussing the physical properties of cell wall components, it gives an idea
of physical properties of the cell wall. Cellulose microfibrils being inelastic and
having a high tensile strength, were proposed to control the organ shape
(Baskin, 2005). Also, they increase the wall strength by cross-linking with
xyloglucans (Wolf et al., 2012), through hydrogen bonds disrupted by
expansins (Cosgrove, 2001).
A series of glycosidases were reported to alter the structure of xyloglucans
and the interactions with cellulose (Park & Cosgrove, 2012), but it was not
enough to produce polymer creep which allows cell extension. Dick-Perez et
al., 2011, suggested that pectin plays an important role in cell wall extensibility
(Dick-Pérez et al., 2011).
There is direct connection between the pH and growth, Rayle in 1973,
developed a theory according which the influx of hydrogen ions causes
loosening of cell wall, allowing cell expansion through polymer creep (Rayle,

121
1973). This acid growth theory, sustain the activity of expansins in cell wall
expansion (Cho & Cosgrove, 2000).
Although many studies were investigating the cell wall growth, very little
is known about endosperm cell wall in germinating seeds. Most of the studies
cover the biochemical aspect, while for mechanical tests only seeds with a
certain size were analysed. For Arabidopsis, despite the fact that its genome
was decoded, it is still unclear how plants cells are growing.
According to Muller et al., a force of 37.8 ± 2.5 mN was necessary to
puncture the Lepidium endosperm at 8 hours of imbibition, just after testa
rupture, and only 19.5 ± 1.7 mN was necessary at 18 hours of imbibition, when
the endosperm ruptured. So, according to literature references, there are
differences in endosperm strength and fracture toughness during germination
and between its regions (Müller et al., 2006; Linkies et al., 2009).
When nanoindentation was suggested to be a suitable approach to detect
the difference in stiffness of endosperm in different regions, it was already
known that endosperm is weakening in the micropylar region prior radicle
protrusion in Lepidium sativum seeds from puncture force experiments (Müller
et al., 2006).
Indenting Lepidium seeds in a dry state, having the entire testa on,
basically the testa was the indented tissue, consistent results for stiffness and
hardness were found. It was not the same with testa removed imbibed seeds for
1 hour or 16 hours, where no significant difference in stiffness could be
detected between the respective time points. It is known that larger sample size
lead to increased precision of the results.
After nanoindentation could not detect the expected differences, AFM
seemed to be a better option. Using a first generation machine, it was
impossible to scan imbibed Arabidopsis seed; the cantilever tip remained
attached to the sample, so no retraction curves were generated. Thus, no values
could be generated for adhesion, hardness or elastic modulus.
122
The first attempt using nanoindentation to detect the differences in cell
wall stiffness was performed on leaves of different Arabidopsis mutants, which
were lacking one of the cell wall components: arabinan deficient (arad1),
pectin deficient (qua2), xyloglucan deficient (xxt1xxt2) and the wild types (Col
0 for qua2 and xxt1xx2; QRT for arad1) as a control.
The statistical analysis of the preliminary results showed no significant
differences concerning the stiffness of the leaves, although it might be expected
that qua2 (Mouille et al., 2007) and arad1 (Harholt et al., 2006) would have
stiffer walls, while xxt1xxt2 (Cavalier et al., 2008) more compliant.
Also, when compare the sides of the leaf, the abaxial and adaxial, no
significant difference was found, although the adaxial was expected to be
stiffer (Braybrook & Kuhlemeier, 2010). However, the scatter results, reflected
by high standard deviation values, can be explained by the irregular surface,
due to the presence of hairs and stomatal apertures.
4.3.1 Imaging Lepidium seeds using micro-CT
Assuming that the seed structure is changing through germination,
Lepidium seeds in different state of imbibition were scanned using micro-CT.
Also, using StudioMax version 2.0 (Volume Graphics,
http://www.volumegraphics.com), the endosperm thickness was approximated
and compared for 32 seeds for four different time points of imbibition: 1, 3, 8
and 16 hours of imbibition. These estimations, when being compared using
ANOVA multiple variance statistical test, showed no significant difference in
thickness by time between regions of the endosperm but significant difference
between subregions as shown in Results section.
Although the samples were not embedded in resin the IKI staining could
generate an average of volume shrinkage of 40% in soft tissues (Buytaert et al.,
2014) also the ethanol dehydration could have similar effects on seeds. The
effect can be measured by comparing the volume of the unstained sample with
a stained one, considering the volume reduction when analysing the results.

123
In this study there was not a direct comparison between an unstained
hydrated seed and IKI stained ethanol dehydrated samples, the shrinkage being
assumed to be produced uniform in all the cells, regardless their anisotropy,
thus the results being directly comparable.
How the fact that the endosperm is not changing in thickness, can be
explained? It is known that the turgor pressure is keeping the cell wall in
tension, and that at a certain value it triggers the extension of the cell wall
(Boyer, 2009). In order to hold this pressure, the cell wall is reinforced by new
biosynthesized material, so the enlargement is taking place simultaneously with
cell wall biosynthesis (Kutschera, 1990).
From micro-CT images, it could be concluded that the endosperm
thickness remained constant for Lepidium seeds; also using eSEM to image the
endosperm structure in Arabidopsis seeds, it could be noticed that the
endosperm rupture occurs between individual cells, its structure remaining
intact after radicle protrusion.
Another important issue would be the extension direction of the
endosperm cells, from eSEM scans, being visible a width enlargement in the
first hours of imbibition and ending-up with a lengthwise enlargement. So,
whatever is happening in the cell wall, in terms of remodeling and
restructuring, it influences the growth directions. It will be very interesting if a
model of embryo growth will become available, so the endosperm expansion
will be fully understood.
4.3.2 Correlating gene activity with endosperm rupture in seed
germination
This study confirmed the spatial and temporal distribution of
endosperm specific genes during germination; it identified new interactions
between transcription factors ATHB23 and BEE2 and the promoter of EXPA2,
genes belonging to the same cluster, endosperm specific, according to SeedNet
124
(Bassel et al., 2011). It also, revealed an epistatic relationship between two
transcription factors of cluster 19, ATHB23 and DOF2.1.
Using eSEM it was suggested that Arabidopsis endosperm rupture
occurs between individual cells, highlighting the fact that endosperm cells in
the radicle region, vacuolated and weakened enough for individual cells to be
released (Bethke et al., 2007). Bethke et al. proven that there is a direct
interdependency between number and size of vacuoles in Arabidopsis
endosperm cells and cell wall thickness. If at the beginning of the germination,
a nondormant seed has a various numbers of small vacuoles in endosperm
cells, at the end of it one single big vacuole was noticed. Also, endosperm cells
are synthesising enzymes that are degrading the cell wall to a thin band
(Bethke et al., 2007).
Based on Bethke et al. observations on endosperm cell-wall thickness
(Bethke et al., 2007) seeds of Lepidium sativum were scanned using micro-CT.
The micro-CT images of Lepidium seeds were used to approximate the
apparent thickness of the endosperm cell layer at different time points of
imbibition. The results showed statistically significant differences in thickness
between different regions of endosperm, ME, LE and PE, as well as between
their subregions. Although there was a significant difference between
subregions by time, no correlation was found between regions and time.

125
4.3.3 Conclusion
Studying genes that are endosperm specific, it was attempted to
correlate gene expression with changes in endosperm physical properties
during germination.
In this study, a link between gene expression and changes in physical
properties of the endosperm was probed. Also, visualization of changes inside
the seed through germination was accomplished by micro-CT imaging, while
eSEM revealed a rupture between individual cells before radicle protrusion.
Knowing that the Arabidopsis endosperm cells near radicle tip are
becoming less angular compared with the rest of the endosperm cells during
germination, suggesting that the cell walls are thinning and weakening,
estimated values for Lepidium endosperm thickness were compared for
different imbibition time points, in different regions. Thus, a significant
difference was found between the ME, LE and PE suggesting that endosperm
cells are expanding differently, the fastest being the region around the radicle
tip.
Also, this study confirmed the prediction of the SeedNet concerning
tissue specificity of cluster 19 genes EXPA2, DELTA-VPE, SCPL51 and
DOF2.1, as being endosperm specific, their promoters’ expression being
observed only in the endosperm but not in the embryo.
Along with the specificity of expression, it was revealed a temporal and
spatial distribution of these genes expression, 12-18 hours being necessary for
the expression of SCPL51 and EXPA2 to become visible first in the micropylar
endosperm expanding by time, while DELTA-VPE was expressed in the entire
endosperm cells after 15 minutes of imbibition.
Another interesting observation was the signal required for their
expression: DELTA-VPE appeared to be independent of an embryonic signal
being insensitive to GA and ABA; EXPA2 required an embryonic signal and
GA to be expressed, being insensitive to ABA, while SCPL51 needed an
embryonic signal and GA for its expression, ABA having no effect on it.
126
Analysing the role of transcription factors from cluster 19 in
germination, T-DNA lines were assessed by germination assays, revealed the
epistatic relationship between DOF2.1 and ATHB23.
Knowing the role of transcription factors in stress responses, cluster 19
transcription factors knockouts were observed in germination assays (athb23,
dof 2.1, athb23dof2.1, bee2, bhlh115-2 and bee2bhlh115-2). The germination
scores suggested that not only overexpression but also knockout of
transcription factors can affect germination by maintaining a higher water
potential of cells, emphasizing the role of the endosperm in stress tolerance.
Putative interactions between EXPA2 promoter fragments and
transcription factors from cluster 19 were tested using yeast one hybrid system.
Apparently, fragments 3 and 4 of EXPA2 promoter interacted with ATHB23
and BEE2, but further confirmations are required.
4.4 Future work
4.4.1. Confirming the role of EXPA2 in endosperm function
Further investigations will be necessary to validate the preliminary results
obtained in this thesis, showing an interaction between EXPA2 promoter
fragments and ATHB23 and BEE2, and also to confirm that it is not a false
positive.
Another interesting approach would be the comparison of the two EXPA2
T-DNA lines, expa2-1 and expa2-2, to reveal the effect of the insertion position
on seed capacity to germinate, but also to observe the behaviour of expa2-2 on
media containing salt and osmotic stress factors.

127
4.4.2 Adjustments of biomechanics and imaging approaches
In terms of biomechanics, AFM remains the only sensitive methodology to
sense the differences between endosperm cell walls physical properties, but
with condition of using the latest generation machines.
Also, nanoindentation cannot be excluded from the methodologies to test
seed tissues, but it requires an improvement of the conditions of indentation,
such as: proper visualization of the indenting points and also the turgidity of
the samples, maybe the use of an aquatic cell. All of these will allow the
selection of interested region, but also will minimise the scatter of results, by
maintain the same turgor pressure in the indented cells.
For imaging, micro-CT is a technique which will evolve fast enough so the
Arabidopsis seeds could be imaged and tissue dimensions inside the seed could
be estimated, with minimum errors.
DIC although is novel in plant biomechanics, it is promising, and an
adjustment of the recording conditions (keeping the endosperm hydrated all
along the process) and also of the particle pattern, could bring the expected
results.
4.4.3 New techniques to be used in endosperm physical properties
assessment
Other experimental approaches used to quantify physical parameters at
cellular and subcellular levels include: micropipette aspiration (measures the
suction pressure necessary to suck a single cell into a micropipette)
(Hochmuth, 2000) to measure the endosperm elasticity; use of microneedles
(Dennerll et al., 1989) or optical tweezers (Hénon et al., 1999) to measure the
forces needed to deform cells shape (micropylar endosperm cells prior radicle
protrusion).
Although it was applied only on animal cells, the magnetic rotational
microrheology (Wilhelm et al., 2003) could be successfully used for plant cells,
128
providing information on viscoelastic shear moduli of the cytoplasm (how
vacuolation changes the viscosity of endosperm cells, upon imbibition)
avoiding the interference with the cell wall.
Another approach used successfully to assess plant cell turgidity was the
pressure probe, which cannot be used for seeds do to the higher content of
lipids and the lack of vacuolation in dry seeds, but promising remains the
tonometer approach for imbibed endosperms. The tonometer approach can
measure the turgor pressure of cells, by applying a spherical glass probe onto
the cell surface with a known force (Lintilhac et al., 2000; Wei, 2001).
Small deformation oscillatory rheology is a technique that measures the
viscosity of a material after being subjected to an oscillating shear stress,
approach being part of the tensile and compression tests, used to assess
components of the cell wall, individually. These methodologies are generating
shear modulus and dynamic viscosity values (Schopfer, 2006; Kutschera, 1996;
Wang et al., 2004). This new method has been used to show that Young’s
modulus of cultured tomato cell walls is at its lowest at pH 4.5, the pH
optimum for expansin activity (Wang et al., 2004).

129
5. Bibliography
Arteca, Richard N, and Jeannette M Arteca. 2008. “Effects of brassinosteroid,
auxin, and cytokinin on ethylene production in Arabidopsis thaliana
Plants.” Journal of Experimental Botany 59 (11): 3019–26.
Bader, Gary, and Christopher Hogue. 2003. “An automated method for finding
molecular complexes in large protein interaction networks.” BMC
Bioinformatics 4 (1): 2.
Baskin, Carol C. 2003. “Breaking physical dormancy in seeds - focussing on
the lens.” New Phytologist 158 (2): 229–32.
Baskin, Jerry M., and Carol C. Baskin. 2004. “A classification system for seed
dormancy.” Seed Science Research 14: 1–16.
Baskin, Tobias I. 2005. “Anisotropic expansion of the plant cell wall.” Annual
Review of Cell and Developmental Biology 21 (January). Annual
Reviews, 4139 El Camino Way, PO BOX 10139, Palo Alto, CA 94303-
0139 USA: 203–22.
Bassel, George W, Hui Lan, Enrico Glaab, Daniel J Gibbs, Tanja Gerjets,
Natalio Krasnogor, Anthony J Bonner, Michael J Holdsworth, and
Nicholas J Provart. 2011. “Genome-wide network model capturing seed
germination reveals coordinated regulation of plant cellular phase
transitions.” Proceedings of the National Academy of Sciences of the
United States of America 108 (23): 9709–14.
Bassel, George W, Petra Stamm, Gabriella Mosca, Pierre Barbier de Reuille,
Daniel J Gibbs, Robin Winter, Ales Janka, Michael J Holdsworth, and
Richard S Smith. 2014. “Mechanical constraints imposed by 3D cellular
geometry and arrangement modulate growth patterns in the Arabidopsis
embryo.” Proceedings of the National Academy of Sciences of the United
States of America 111 (23): 8685–90.
Beaudoin, N, C Serizet, F Gosti, and J Giraudat. 2000. “Interactions between
abscisic acid and ethylene signaling cascades.” The Plant Cell 12 (7):
1103–15.
Berger, Frédéric, Paul E Grini, and Arp Schnittger. 2006. “Endosperm: an
integrator of seed growth and development.” Current Opinion in Plant
Biology 9 (6): 664–70.
Bethke, Paul C, Igor G L Libourel, Natsuyo Aoyama, Yong-Yoon Chung,
David W Still, and Russell L Jones. 2007. “The Arabidopsis aleurone
layer responds to nitric oxide, gibberellin, and abscisic acid and is
sufficient and necessary for seed dormancy.” Plant Physiology 143 (3):
1173–88.

130
Bewley, J. D. 1997. “Seed germination and dormancy.” The Plant Cell 9 (7):
1055–66.
Bewley, J. Derek. 1997. “Breaking down the walls — a role for endo-β-
mannanase in release from seed dormancy?” Trends in Plant Science 2
(12): 464–69.
Bewley, J. Derek, and Michael Black. 1994. Seeds. Springer.
Bewley, J. Derek, Kent Bradford, Henk Hilhorst, and Hiroyuki Nonogaki.
2013. Seeds: Physiology of Development, Germination and Dormancy.
Springer Science & Business Media.
Bialek, K, and J D Cohen. 1989. “Free and conjugated indole-3-acetic acid in
developing bean seeds.” Plant Physiology 91 (2): 775–79.
Boisnard-Lorig, C. 2001. “Dynamic Analyses of the expression of the
HISTONE::YFP fusion protein in Arabidopsis show that syncytial
endosperm is divided in mitotic domains.” The Plant Cell Online 13 (3):
495–509.
Bolduc, J-E, L J Lewis, C-E Aubin, and A Geitmann. 2006. “Finite-element
analysis of geometrical factors in micro-indentation of pollen tubes.”
Biomechanics and Modeling in Mechanobiology 5 (4): 227–36.
Bornert, M., F. Brémand, P. Doumalin, J.-C. Dupré, M. Fazzini, M. Grédiac, F.
Hild, et al. 2008. “Assessment of digital image correlation measurement
errors: methodology and results.” Experimental Mechanics 49 (3): 353–
70.
Boyer, John S. 2009. “Evans Review : Cell wall biosynthesis and the molecular
mechanism of plant enlargement.” Functional Plant Biology 36 (5).
CSIRO Publishing: 383.
Braam, Janet. 2005. “In touch: plant responses to mechanical stimuli.” The
New Phytologist 165 (2): 373–89.
Braidwood, Luke, Christian Breuer, and Keiko Sugimoto. 2013. “My body is a
cage: mechanisms and modulation of plant cell growth.” The New
Phytologist, August.
Braybrook, Siobhan A, and Cris Kuhlemeier. 2010. “How a plant builds
leaves.” The Plant Cell 22 (4): 1006–18.
Braybrook, Siobhan A, and Alexis Peaucelle. 2013. “Mechano-chemical
aspects of organ formation in Arabidopsis thaliana: the relationship
between auxin and pectin.” PloS One 8 (3): e57813.
131
Briscoe, B.J., K.K. Liu, and D.R. Williams. 1998. “Adhesive contact
deformation of a single microelastomeric sphere.” Journal of Colloid and
Interface Science 200 (2): 256–64.
Brown, R. C., Betty E. Lemmon, Hong Nguyen, and Odd-Arne Olsen. 1999.
“Development of endosperm in Arabidopsis thaliana.” Sexual Plant
Reproduction 12 (1): 32–42.
Burgert, Ingo. 2006. “Exploring the micromechanical design of plant cell
walls.” American Journal of Botany 93 (10): 1391–1401.
Burton, Rachel A, Michael J Gidley, and Geoffrey B Fincher. 2010.
“Heterogeneity in the chemistry, structure and function of plant cell
walls.” Nature Chemical Biology 6 (10). Nature Publishing Group, a
division of Macmillan Publishers Limited. All Rights Reserved. 724–32.
Buytaert, Jan, Jana Goyens, Daniel De Greef, Peter Aerts, and Joris Dirckx.
2014. “Volume shrinkage of bone, brain and muscle tissue in sample
preparation for micro-CT and light sheet fluorescence microscopy
(LSFM).” Microscopy and Microanalysis : The Official Journal of
Microscopy Society of America, Microbeam Analysis Society,
Microscopical Society of Canada, June, 1–10.
Caffall, Kerry Hosmer, and Debra Mohnen. 2009. “The structure, function, and
biosynthesis of plant cell wall pectic polysaccharides.” Carbohydrate
Research 344 (14): 1879–1900.
Carrillo, Fernando, Shikha Gupta, Mehdi Balooch, Sally J. Marshall, Grayson
W. Marshall, Lisa Pruitt, and Christian M. Puttlitz. 2011.
“Nanoindentation of polydimethylsiloxane elastomers: effect of
crosslinking, work of adhesion,and fluid environment on elastic modulus’
[J. Mater.Res. 20, 2820 (2005)].” Journal of Materials Research 21 (02).
Cambridge University Press: 535–37.
Castrillo, Gabriel, Franziska Turck, Magalie Leveugle, Alain Lecharny, Pilar
Carbonero, George Coupland, Javier Paz-Ares, and Luis Oñate-Sánchez.
2011. “Speeding cis-trans regulation discovery by phylogenomic analyses
coupled with screenings of an arrayed library of Arabidopsis transcription
factors.” Edited by Miguel A. Blazquez. PloS One 6 (6). Public Library of
Science: e21524.
Cavalier, David M, Olivier Lerouxel, Lutz Neumetzler, Kazuchika Yamauchi,
Antje Reinecke, Glenn Freshour, Olga A Zabotina, et al. 2008.
“Disrupting two Arabidopsis thaliana xylosyltransferase genes results in
plants deficient in xyloglucan, a major primary cell wall component.” The
Plant Cell 20 (6): 1519–37.

132
Chapman, Elisabeth J, and Mark Estelle. 2009. “Mechanism of auxin-regulated
gene expression in plants.” Annual Review of Genetics 43 (January): 265–
85.
Chehab, E Wassim, Chen Yao, Zachary Henderson, Se Kim, and Janet Braam.
2012. “Arabidopsis touch-induced morphogenesis is jasmonate mediated
and protects against pests.” Current Biology : CB 22 (8): 701–6.
Chen, F, P Dahal, and K J Bradford. 2001. “Two Tomato expansin genes show
divergent expression and localization in embryos during seed
development and germination.” Plant Physiology 127 (3): 928–36.
Cho, H T, and D J Cosgrove. 2000. “altered expression of expansin modulates
leaf growth and pedicel abscission in Arabidopsis thaliana.” Proceedings
of the National Academy of Sciences of the United States of America 97
(17): 9783–88.
Clair, Bruno, Richard Arinero, Gérard Lévèque, Michel Ramonda, and Bernard
Thibaut. 2003. “Imaging the mechanical properties of wood cell layers by
atomic force modulation microscopy.” IAWA Journal 24.
Clerkx, Emile J M, Hetty Blankestijn-De Vries, Gerda J Ruys, Steven P C
Groot, and Maarten Koornneef. 2003. “Characterization of green seed, an
enhancer of abi3-1 in Arabidopsis that affects seed longevity.” Plant
Physiology 132 (2): 1077–84.
Cloetens, Peter, Régis Mache, Michel Schlenker, and Silva Lerbs-Mache.
2006. “Quantitative phase tomography of Arabidopsis seeds reveals
intercellular void network.” Proceedings of the National Academy of
Sciences of the United States of America 103 (39): 14626–30.
Coen, Enrico, Anne-Gaëlle Rolland-Lagan, Mark Matthews, J Andrew
Bangham, and Przemyslaw Prusinkiewicz. 2004. “The genetics of
geometry.” Proceedings of the National Academy of Sciences of the
United States of America 101 (14): 4728–35.
Cosgrove, D. J. 2001. “Wall structure and wall loosening. a look backwards
and forwards.” Plant Physiology 125 (1): 131–34.
Cosgrove, Daniel J. 2005. “Growth of the plant cell wall.” Nature Reviews.
Molecular Cell Biology 6 (11): 850–61.
Da Silva, E A Amaral, Peter E Toorop, Adriaan C van Aelst, and Henk W M
Hilhorst. 2004. “Abscisic acid controls embryo growth potential and
endosperm cap weakening during coffee (Coffea arabica cv. rubi) seed
germination.” Planta 220 (2): 251–61.

133
Damude, Howard G, and Anthony J Kinney. 2007. “Engineering Oilseed plants
for a sustainable, land-based source of long chain polyunsaturated fatty
acids.” Lipids 42 (3): 179–85.
Davies, Lynette M, and Philip J Harris. 2003. “Atomic force microscopy of
microfibrils in primary cell walls.” Planta 217 (2): 283–89.
Davies, P.J. 1995. “Plant hormones.” Kluwer Academic Publishers.
Debeaujon, I, and M Koornneef. 2000. “Gibberellin requirement for
Arabidopsis seed germination is determined both by testa characteristics
and embryonic abscisic acid.” Plant Physiology 122 (2): 415–24.
DellaPenna, Dean. 2005. “Progress in the dissection and manipulation of
vitamin E synthesis.” Trends in Plant Science 10 (12): 574–79.
Dekkers, Bas J W, Simon Pearce, R P van Bolderen-Veldkamp, Alex Marshall,
Pawel Widera, James Gilbert, Hajk-Georg Drost, et al. 2013.
“Transcriptional dynamics of two seed compartments with opposing roles
in Arabidopsis seed germination.” Plant Physiology 163 (1). American
Society of Plant Biologists: 205–15.
Dennerll, T J, P Lamoureux, R E Buxbaum, and S R Heidemann. 1989. “The
cytomechanics of axonal elongation and retraction.” The Journal of Cell
Biology 109 (6 Pt 1): 3073–83.
Dick-Pérez, Marilú, Yuan Zhang, Jennifer Hayes, Andre Salazar, Olga A
Zabotina, and Mei Hong. 2011. “Structure and interactions of plant cell-
wall polysaccharides by two- and three-dimensional magic-angle-spinning
solid-state NMR.” Biochemistry 50 (6): 989–1000.
Doerner, M.F., and W.D. Nix. 2011. “A method for interpreting the data from
depth-sensing indentation instruments.” Journal of Materials Research 1
(04). Cambridge University Press: 601–9.
Dorca-Fornell, Carmen, Radoslaw Pajor, Christoph Lehmeier, Marísa Pérez-
Bueno, Marion Bauch, Jen Sloan, Colin Osborne, et al. 2013. “Increased
leaf mesophyll porosity following transient retinoblastoma-related protein
silencing is revealed by microcomputed tomography imaging and leads to
a system-level physiological response to the altered cell division pattern.”
The Plant Journal : For Cell and Molecular Biology 76 (6): 914–29.
Dubreucq, Bertrand, Nathalie Berger, Emmanuel Vincent, Murielle Boisson,
Georges Pelletier, Michel Caboche, and Loic Lepiniec. 2000. “The
Arabidopsis AtEPR1 extensin-like gene is specifically expressed in
endosperm during seed germination.” The Plant Journal 23 (5): 643–52.
Ebenstein, Donna M., and Lisa A. Pruitt. 2006. “Nanoindentation of biological
materials.” Nano Today 1 (3): 26–33.

134
Endo, Akira, Kiyoshi Tatematsu, Kousuke Hanada, Lisza Duermeyer,
Masanori Okamoto, Keiko Yonekura-Sakakibara, Kazuki Saito, et al.
2012. “Tissue-specific transcriptome analysis reveals cell wall
metabolism, flavonol biosynthesis and defense responses are activated in
the endosperm of germinating Arabidopsis thaliana seeds.” Plant & Cell
Physiology 53 (1): 16–27.
Feng, Suhua, Cristina Martinez, Giuliana Gusmaroli, Yu Wang, Junli Zhou,
Feng Wang, Liying Chen, et al. 2008. “Coordinated regulation of
Arabidopsis thaliana development by light and gibberellins.” Nature 451
(7177). Nature Publishing Group: 475–79.
Fenner, Michael, and Ken Thompson. 2005. The ecology of seeds. Cambridge
University Press.
Fernandes, Anwesha N, Xinyong Chen, Colin A Scotchford, James Walker,
Darren M Wells, Clive J Roberts, and Nicola M Everitt. 2012.
“Mechanical properties of epidermal cells of whole living roots of
Arabidopsis thaliana: an atomic force microscopy study.” Physical
Review. E, Statistical, Nonlinear, and Soft Matter Physics 85 (2 Pt 1):
021916.
Finch-Savage, William E, and Gerhard Leubner-Metzger. 2006. “Seed
dormancy and the control of germination.” The New Phytologist 171 (3):
501–23.
Finkelstein, R R, and T J Lynch. 2000. “The Arabidopsis abscisic acid
response gene abi5 encodes a basic leucine zipper transcription factor.”
The Plant Cell 12 (4): 599–609.
Fischer-Cripps, A.C. 2006. “Critical review of analysis and interpretation of
nanoindentation test data.” Surface and Coatings Technology 200 (14-15):
4153–65.
Fu, Xiangdong, and Nicholas P Harberd. 2003. “Auxin promotes Arabidopsis
root growth by modulating gibberellin response.” Nature 421 (6924):
740–43.
Fung, Y. C. 1993. Biomechanics: mechanical properties of living tissues.
Springer.
Geitmann, Anja. 2006. “Experimental approaches used to quantify physical
parameters at cellular and subcellular levels.” American Journal of Botany
93 (10): 1380–90.
Geitmann, Anja, and Joseph K E Ortega. 2009. “Mechanics and modeling of
plant cell growth.” Trends in Plant Science 14 (9): 467–78.

135
Ghassemian, M, E Nambara, S Cutler, H Kawaide, Y Kamiya, and P McCourt.
2000. “Regulation of abscisic acid signaling by the ethylene response
pathway in Arabidopsis.” The Plant Cell 12 (7): 1117–26.
Goldsbury, Claire, and Simon Scheuring. 2002. “Introduction to atomic force
microscopy (AFM) in biology.” Current Protocols in Protein Science /
Editorial Board, John E. Coligan ... [et Al.] Chapter 17 (November): Unit
17.7.
Graeber, Kai, Ada Linkies, Kerstin Müller, Andrea Wunchova, Anita Rott, and
Gerhard Leubner-Metzger. 2010. “Cross-species approaches to seed
dormancy and germination: conservation and biodiversity of ABA-
regulated mechanisms and the Brassicaceae DOG1 genes.” Plant
Molecular Biology 73 (1-2): 67–87.
Griffiths, Jayne, Kohji Murase, Ivo Rieu, Rodolfo Zentella, Zhong-Lin Zhang,
Stephen J Powers, Fan Gong, et al. 2006. “Genetic characterization and
functional analysis of the GID1 gibberellin receptors in Arabidopsis.” The
Plant Cell 18 (12): 3399–3414.
Groot, S P, and C M Karssen. 1987. “Gibberellins regulate seed germination in
tomato by endosperm weakening: a study with gibberellin-deficient
mutants.” Planta 171 (4): 525–31.
Hahm, Tae-Shik, Sung-Jin Park, and Y Martin Lo. 2009. “Effects of
germination on chemical composition and functional properties of sesame
(Sesamum indicum L.) seeds.” Bioresource Technology 100 (4): 1643–47.
Harholt, Jesper, Jacob Krüger Jensen, Susanne Oxenbøll Sørensen, Caroline
Orfila, Markus Pauly, and Henrik Vibe Scheller. 2006. “ARABINAN
DEFICIENT 1 is a putative arabinosyltransferase involved in biosynthesis
of pectic arabinan in Arabidopsis.” Plant Physiology 140 (1): 49–58.
He, Jun-Xian, Joshua M Gendron, Yu Sun, Srinivas S L Gampala, Nathan
Gendron, Catherine Qing Sun, and Zhi-Yong Wang. 2005. “BZR1 is a
transcriptional repressor with dual roles in brassinosteroid homeostasis
and growth responses.” Science (New York, N.Y.) 307 (5715): 1634–38.
Hénon, S, G Lenormand, A Richert, and F Gallet. 1999. “A new determination
of the shear modulus of the human erythrocyte membrane using optical
tweezers.” Biophysical Journal 76 (2): 1145–51.
Hentrich, Mathias, Christine Böttcher, Petra Düchting, Youfa Cheng, Yunde
Zhao, Oliver Berkowitz, Josette Masle, Joaquín Medina, and Stephan
Pollmann. 2013. “The Jasmonic acid signaling pathway is linked to auxin
homeostasis through the modulation of YUCCA8 and YUCCA9 gene
expression.” The Plant Journal : For Cell and Molecular Biology 74 (4):
626–37.

136
Heyl, Alexander, Michael Riefler, Georgy A Romanov, and Thomas
Schmülling. 2012. “Properties, functions and evolution of cytokinin
receptors.” European Journal of Cell Biology 91 (4): 246–56.
Hochmuth, R M. 2000. “Micropipette aspiration of living cells.” Journal of
Biomechanics 33 (1): 15–22.
Holdsworth, Michael J, Leónie Bentsink, and Wim J J Soppe. 2008.
“Molecular networks regulating Arabidopsis seed maturation, after-
ripening, dormancy and germination.” The New Phytologist 179 (1): 33–
54.
Hooley, R. 1994. “Gibberellins: perception, transduction and responses.” Plant
Molecular Biology 26 (5): 1529–55.
Jacobsen, J V, and E Pressman. 1979. “A structural study of germination in
celery (Apium graveolens L.) seed with emphasis on endosperm
breakdown.” Planta 144 (3): 241–48.
Jiménez, Víctor M. 2005. “Involvement of plant hormones and plant growth
regulators on in vitro somatic embryogenesis.” Plant Growth Regulation
47 (2-3): 91–110.
Kaminuma, Eli, Takeshi Yoshizumi, Takuji Wada, Minami Matsui, and
Tetsuro Toyoda. 2008. “Quantitative analysis of heterogeneous spatial
distribution of Arabidopsis leaf trichomes using micro x-ray computed
tomography.” The Plant Journal : For Cell and Molecular Biology 56 (3):
470–82.
Kendrick, Mandy D, and Caren Chang. 2008. “Ethylene signaling: new levels
of complexity and regulation.” Current Opinion in Plant Biology 11 (5):
479–85.
Khodabakhshian, R. 2012. “Elastic behavior of sunflower seed and its kernel.”
Commission of Agricultural and Biosystems Engineering (CIGR).
Köhler, Lothar, and Hanns-Christof Spatz. 2002. “Micromechanics of plant
tissues beyond the linear-elastic range.” Planta 215 (1): 33–40.
Koornneef, M, M L Jorna, D L Brinkhorst-van der Swan, and C M Karssen.
1982. “The isolation of abscisic acid (aba) deficient mutants by selection
of induced revertants in non-germinating gibberellin sensitive lines of
Arabidopsis thaliana (L.) heynh.” TAG. Theoretical and Applied
Genetics. Theoretische Und Angewandte Genetik 61 (4): 385–93.
Koornneef, M, and J H van der Veen. 1980. “Induction and analysis of
gibberellin sensitive mutants in Arabidopsis thaliana (L.) heynh.” TAG.
Theoretical and Applied Genetics. Theoretische Und Angewandte Genetik
58 (6): 257–63.
137
Koornneef M., Karssen C. M. 1994. Arabidopsis. Edited by Somerville C. R.
Meyerowitz E. M. Cold Spring Harbor Laboratory Press.
Koornneef, Maarten, Leónie Bentsink, and Henk Hilhorst. 2002. “Seed
dormancy and germination.” Current Opinion in Plant Biology 5 (1): 33–
36.
Kucera, Birgit, Marc Alan Cohn, and Gerhard Leubner-Metzger. 2005. “Plant
hormone interactions during seed dormancy release and germination.”
Seed Science Research 15 (4). Cambridge University Press: 281–307.
Kutschera, U. 1990. “Cell-wall synthesis and elongation growth in hypocotyls
of Helianthus annuus L.” Planta 181 (3): 316–23.
Kutschera, U. 1996. “Cessation of cell elongation in rye coleoptiles is
accompanied by a loss of cell-wall plasticity.” Journal of Experimental
Botany 47 (9): 1387–94.
L.M. Vleeshouwers, H.J. Bouwmeester. 1995. “Redefining seed dormancy: an
attempt to integrate physiology and ecology.” J. Ecology 83 (1995) 1031-
1037.
Lee, Keun Pyo, Urszula Piskurewicz, Veronika Turecková, Miroslav Strnad,
and Luis Lopez-Molina. 2010. “A seed coat bedding assay shows that
rgl2-dependent release of abscisic acid by the endosperm controls embryo
growth in Arabidopsis dormant seeds.” Proceedings of the National
Academy of Sciences of the United States of America 107 (44): 19108–13.
Lee, Kieran J D, Valérie Cornuault, Iain W Manfield, Marie-Christine Ralet,
and J Paul Knox. 2013. “Multi-scale spatial heterogeneity of pectic
rhamnogalacturonan i (rg-i) structural features in tobacco seed endosperm
cell walls.” The Plant Journal : For Cell and Molecular Biology 75 (6):
1018–27.
Lee, KJD, and BJW Dekkers. 2012. “Distinct cell wall architectures in seed
endosperms in representatives of the Brassicaceae and Solanaceae.” Plant
Journal 160 (3): 1551–66.
Lee, Sorcheng, Hui Cheng, Kathryn E King, Weefuen Wang, Yawen He,
Alamgir Hussain, Jane Lo, Nicholas P Harberd, and Jinrong Peng. 2002.
“Gibberellin regulates Arabidopsis seed germination via RGL2, a
GAI/RGA-like gene whose expression is up-regulated following
imbibition.” Genes & Development 16 (5): 646–58.
Leubner-Metzger, G, L Petruzzelli, R Waldvogel, R Vögeli-Lange, and F
Meins. 1998. “Ethylene-responsive element binding protein (EREBP)
expression and the transcriptional regulation of class I beta-1,3-glucanase
during tobacco seed germination.” Plant Molecular Biology 38 (5): 785–
95.

138
Leubner-Metzger, G. 2003. “Functions and regulation of β-1,3-glucanases
during seed germination, dormancy release and after-ripening.” Seed
Science Research 13 (1). Cambridge University Press: 17–34.
Leung, J, S Merlot, and J Giraudat. 1997. “The Arabidopsis ABSCISIC ACID-
INSENSITIVE2 (ABI2) and ABI1 genes encode homologous protein
phosphatases 2C involved in abscisic acid signal transduction.” The Plant
Cell 9 (5): 759–71.
Li, J, and J Chory. 1997. “A putative leucine-rich repeat receptor kinase
involved in brassinosteroid signal transduction.” Cell 90 (5): 929–38.
Liljegren, S J, G S Ditta, Y Eshed, B Savidge, J L Bowman, and M F
Yanofsky. 2000. “SHATTERPROOF MADS-box genes control seed
dispersal in Arabidopsis.” Nature 404 (6779): 766–70.
Linkies, Ada, and Gerhard Leubner-Metzger. 2012. “Beyond gibberellins and
abscisic acid: how ethylene and jasmonates control seed germination.”
Plant Cell Reports 31 (2): 253–70.
Linkies, Ada, Kerstin Müller, Karl Morris, Veronika Turecková, Meike Wenk,
Cassandra S C Cadman, Françoise Corbineau, et al. 2009a. “Ethylene
Interacts with abscisic acid to regulate endosperm rupture during
germination: a comparative approach using Lepidium sativum and
Arabidopsis thaliana.” The Plant Cell 21 (12): 3803–22.
Lintilhac, P M, C Wei, J J Tanguay, and J O Outwater. 2000. “Ball tonometry:
a rapid, nondestructive method for measuring cell turgor pressure in thin-
walled plant cells.” Journal of Plant Growth Regulation 19 (1): 90–97.
Liu, Po-Pu, Nobuya Koizuka, Tanja M Homrichhausen, Jessica R Hewitt, Ruth
C Martin, and Hiroyuki Nonogaki. 2005. “Large-scale screening of
Arabidopsis enhancer-trap lines for seed germination-associated genes.”
The Plant Journal : For Cell and Molecular Biology 41 (6): 936–44.
Liu, Po-Pu, Taiowa A Montgomery, Noah Fahlgren, Kristin D Kasschau,
Hiroyuki Nonogaki, and James C Carrington. 2007. “Repression of
AUXIN RESPONSE FACTOR10 by microRNA160 is critical for seed
germination and post-germination stages.” The Plant Journal : For Cell
and Molecular Biology 52 (1): 133–46.
Liu, Xiaodong, Hong Zhang, Yang Zhao, Zhengyan Feng, Qun Li, Hong-Quan
Yang, Sheng Luan, Jianming Li, and Zu-Hua He. 2013. “Auxin controls
seed dormancy through stimulation of abscisic acid signaling by inducing
ARF-mediated ABI3 activation in Arabidopsis.” Proceedings of the
National Academy of Sciences of the United States of America 110 (38):
15485–90.
139
Lockhart, James A. 1965. “An analysis of irreversible plant cell elongation.”
Journal of Theoretical Biology 8 (2): 264–75.
Lopez-Molina, Luis, Sébastien Mongrand, Derek T McLachlin, Brian T Chait,
and Nam-Hai Chua. 2002. “ABI5 acts downstream of ABI3 to execute an
ABA-dependent growth arrest during germination.” The Plant Journal :
For Cell and Molecular Biology 32 (3): 317–28.
Ma, Yue, Izabela Szostkiewicz, Arthur Korte, Danièle Moes, Yi Yang,
Alexander Christmann, and Erwin Grill. 2009. “Regulators of PP2C
phosphatase activity function as abscisic acid sensors.” Science (New
York, N.Y.) 324 (5930): 1064–68.
Manz, Bertram, Kerstin Müller, Birgit Kucera, Frank Volke, and Gerhard
Leubner-Metzger. 2005. “Water uptake and distribution in germinating
tobacco seeds investigated in vivo by nuclear magnetic resonance
imaging.” Plant Physiology 138 (3): 1538–51.
Marga, Francoise, Michel Grandbois, Daniel J Cosgrove, and Tobias I Baskin.
2005. “Cell wall extension results in the coordinate separation of parallel
microfibrils: evidence from scanning electron microscopy and atomic
force microscopy.” The Plant Journal : For Cell and Molecular Biology
43 (2): 181–90.
Martínez-Andújar, Cristina, Wioletta E Pluskota, George W Bassel, Masashi
Asahina, Piotr Pupel, Theresa T Nguyen, Noriko Takeda-Kamiya, et al.
2012. “Mechanisms of hormonal regulation of endosperm cap-specific
gene expression in tomato seeds.” The Plant Journal : For Cell and
Molecular Biology 71 (4): 575–86.
Matilla, A.J., and M.A. Matilla-Vázquez. 2008. “Involvement of ethylene in
seed physiology.” Plant Science 175 (1-2). Elsevier: 87–97.
Matilla, Angel J. 2007. “Ethylene in seed formation and germination.” Seed
Science Research 10 (02). Cambridge University Press: 111–26.
McGinnis, K. M. 2003. “The Arabidopsis SLEEPY1 gene encodes a putative
F-box subunit of an SCF E3 ubiquitin ligase.” The Plant Cell Online 15
(5): 1120–30.
Metscher, Brian D. 2009. “MicroCT for comparative morphology: simple
staining methods allow high-contrast 3D imaging of diverse non-
mineralized animal tissues.” BMC Physiology 9 (1): 11.
Meyer, K, M P Leube, and E Grill. 1994. “A protein phosphatase 2C involved
in ABA signal transduction in Arabidopsis thaliana.” Science (New York,
N.Y.) 264 (5164): 1452–55.
140
Milani, Pascale, Siobhan A Braybrook, and Arezki Boudaoud. 2013.
“Shrinking the hammer: micromechanical approaches to morphogenesis.”
Journal of Experimental Botany 64 (15): 4651–62.
Milani, Pascale, Maryam Gholamirad, Jan Traas, Alain Arnéodo, Arezki
Boudaoud, Françoise Argoul, and Olivier Hamant. 2011. “In vivo analysis
of local wall stiffness at the shoot apical meristem in arabidopsis using
atomic force microscopy.” The Plant Journal : For Cell and Molecular
Biology 67 (6): 1116–23.
Miller CO, F Skoog, MH Von Saltza and FM Strong. 1955. “Kinetin, a cell
division faction from deoxyribonucleic acid.” J Am Chem Soc Miller CO,
(77): 1392–93.
Mirabet, Vincent, Pradeep Das, Arezki Boudaoud, and Olivier Hamant. 2011.
“The role of mechanical forces in plant morphogenesis.” Annual Review
of Plant Biology 62 (January): 365–85.
Mockaitis, Keithanne, and Mark Estelle. 2008. “Auxin receptors and plant
development: a new signaling paradigm.” Annual Review of Cell and
Developmental Biology 24 (January): 55–80.
Mok, David WS, and Machteld C Mok. 2001. “Cytokinin metabolism and
action.” Annual Review of Plant Physiology and Plant Molecular Biology
52 (June): 89–118.
Mooney, S.J. 2006. “Three-dimensional visualization and quantification of
soil macroporosity and water flow patterns using computed tomography.”
Soil Use and Management 18 (2): 142–51.
Morris, Karl, Ada Linkies, Kerstin Müller, Krystyna Oracz, Xiaofeng Wang,
James R Lynn, Gerhard Leubner-Metzger, and William E Finch-Savage.
2011. “Regulation of seed germination in the close Arabidopsis relative
Lepidium sativum: a global tissue-specific transcript analysis.” Plant
Physiology 155 (4): 1851–70.
Mouille, Grégory, Marie-Christine Ralet, Céline Cavelier, Cathlene Eland,
Delphine Effroy, Kian Hématy, Lesley McCartney, et al. 2007.
“Homogalacturonan synthesis in Arabidopsis thaliana requires a Golgi-
localized protein with a putative methyltransferase domain.” The Plant
Journal : For Cell and Molecular Biology 50 (4): 605–14.
Moulia, Bruno. 2013. “Plant biomechanics and mechanobiology are
convergent paths to flourishing interdisciplinary research.” Journal of
Experimental Botany 64 (15): 4617–33.
Müller, Kerstin, Stefanie Tintelnot, and Gerhard Leubner-Metzger. 2006a.
“Endosperm-limited Brassicaceae seed germination: abscisic acid inhibits
embryo-induced endosperm weakening of Lepidium Sativum (cress) and

141
endosperm rupture of cress and Arabidopsis thaliana.” Plant & Cell
Physiology 47 (7): 864–77.
Nakashima, Kazuo, Yasunari Fujita, Norihito Kanamori, Takeshi Katagiri,
Taishi Umezawa, Satoshi Kidokoro, Kyonoshin Maruyama, et al. 2009.
“Three Arabidopsis SnRK2 Protein Kinases, SRK2D/SnRK2.2,
SRK2E/SnRK2.6/OST1 and SRK2I/SnRK2.3, involved in ABA signaling
are essential for the control of seed development and dormancy.” Plant &
Cell Physiology 50 (7): 1345–63.
Nakashima, Kazuo, Hironori Takasaki, Junya Mizoi, Kazuo Shinozaki, and
Kazuko Yamaguchi-Shinozaki. 2012. “NAC Transcription factors in plant
abiotic stress responses.” Biochimica et Biophysica Acta 1819 (2): 97–
103.
Nambara, Eiji, and Annie Marion-Poll. 2003. “ABA action and interactions in
seeds.” Trends in Plant Science 8 (5): 213–17.
Nambara, Eiji, Masanori Okamoto, Kiyoshi Tatematsu, Ryoichi Yano,
Mitsunori Seo, and Yuji Kamiya. 2010. “Abscisic acid and the control of
seed dormancy and germination.” Seed Science Research 20 (02).
Cambridge University Press: 55.
Nguyen, H., R. C. Brown, and B. E. Lemmon. 2000. “The specialized chalazal
endosperm in Arabidopsis thaliana and Lepidium virginicum
(Brassicaceae).” Protoplasma 212 (1-2): 99–110.
Nguyen, H. 2001. “Patterns of cytoskeletal organization reflect distinct
developmental domains in endosperm of Coronopus didymus
(Brassicaceae).” International Journal of Plant Sciences 162 (1). The
University of Chicago Press: 1–14.
Ni, Di An, Xiao Hong Yu, Ling Jian Wang, and Zhi Hong Xu. 2002. “Aberrant
development of pollen in transgenic tobacco expressing bacterial iaaM
gene driven by pollen- and tapetum-specific promoters.” Shi Yan Sheng
Wu Xue Bao 35 (1): 1–6.
Nikolaeva, M.G. 2004. “On criteria to use in studies of seed evolution.” Seed
Science Research 14 (04). Cambridge University Press: 315–20.
Nishimura, Noriyuki, Tomo Yoshida, Nobutaka Kitahata, Tadao Asami, Kazuo
Shinozaki, and Takashi Hirayama. 2007. “ABA-Hypersensitive
Germination1 encodes a protein phosphatase 2C, an essential component
of abscisic acid signaling in Arabidopsis seed.” The Plant Journal : For
Cell and Molecular Biology 50 (6): 935–49.
Noguchi, T, S Fujioka, S Choe, S Takatsuto, S Yoshida, H Yuan, K A
Feldmann, and F E Tax. 1999. “Brassinosteroid-insensitive dwarf mutants

142
of Arabidopsis accumulate brassinosteroids.” Plant Physiology 121 (3):
743–52.
Nonogaki, H, O H Gee, and K J Bradford. 2000. “A germination-specific endo-
beta-mannanase gene is expressed in the micropylar endosperm cap of
tomato seeds.” Plant Physiology 123 (4): 1235–46. h
Ogawa, Mikihiro, Atsushi Hanada, Yukika Yamauchi, Ayuko Kuwahara, Yuji
Kamiya, and Shinjiro Yamaguchi. 2003. “Gibberellin biosynthesis and
response during Arabidopsis seed germination.” The Plant Cell 15 (7):
1591–1604.
Ogé, Laurent, Gildas Bourdais, Jérôme Bove, Boris Collet, Béatrice Godin,
Fabienne Granier, Jean-Pierre Boutin, Dominique Job, Marc Jullien, and
Philippe Grappin. 2008. “Protein repair L-isoaspartyl methyltransferase 1
is involved in both seed longevity and germination vigor in Arabidopsis.”
The Plant Cell 20 (11): 3022–37.
Oliver, W.C., and G.M. Pharr. 1992. “An improved technique for determining
hardness and elastic modulus using load and displacement sensing
indentation experiments.” Journal of Materials Research 7 (06).
Cambridge University Press: 1564–83.
Oliver, W.C., and G.M. Pharr. 2004. “Measurement of hardness and elastic
modulus by instrumented indentation: advances in understanding and
refinements to methodology.” Journal of Materials Research 19 (01).
Cambridge University Press: 3–20.
Pajor, R, A Fleming, C P Osborne, S A Rolfe, C J Sturrock, and S J Mooney.
2013. “Seeing space: visualization and quantification of plant leaf
structure using x-ray micro-computed tomography.” Journal of
Experimental Botany 64 (2): 385–90.
Pan, Bing, Kemao Qian, Huimin Xie, and Anand Asundi. 2009. “Two-
dimensional digital image correlation for in-plane displacement and strain
measurement: a review.” Measurement Science and Technology 20 (6).
IOP Publishing: 062001.
Park, Sang-Youl, Pauline Fung, Noriyuki Nishimura, Davin R Jensen, Hiroaki
Fujii, Yang Zhao, Shelley Lumba, et al. 2009. “Abscisic acid inhibits type
2c protein phosphatases via the PYR/PYL family of START proteins.”
Science (New York, N.Y.) 324 (5930): 1068–71.
Park, Yong Bum, and Daniel J Cosgrove. 2012. “Changes in cell wall
biomechanical properties in the xyloglucan-deficient xxt1/xxt2 mutant of
Arabidopsis.” Plant Physiology 158 (1). American Society of Plant
Biologists: 465–75.

143
Peaucelle, Alexis, Romain Louvet, Jorunn N Johansen, Fabien Salsac, Halima
Morin, Françoise Fournet, Katia Belcram, et al. 2011. “The transcription
factor BELLRINGER modulates phyllotaxis by regulating the expression
of a pectin methylesterase in Arabidopsis.” Development (Cambridge,
England) 138 (21): 4733–41.
Penfield, Steven, Yi Li, Alison D Gilday, Stuart Graham, and Ian A Graham.
2006a. “Arabidopsis ABA INSENSITIVE4 regulates lipid mobilization in
the embryo and reveals repression of seed germination by the
endosperm.” The Plant Cell 18 (8): 1887–99.
Penfield, Steven, Elizabeth L Rylott, Alison D Gilday, Stuart Graham, Tony R
Larson, and Ian A Graham. 2004. “Reserve mobilization in the
arabidopsis endosperm fuels hypocotyl elongation in the dark, is
independent of abscisic acid, and requires PHOSPHOENOLPYRUVATE
CARBOXYKINASE1.” The Plant Cell 16 (10): 2705–18.
Pennazio, S., and P. Roggero. 1991. “Effects of exogenous salicylate on basal
and stressinduced ethylene formation in soybean.” Biologia Plantarum 33
(3): 248–248.
Petruzzelli, L, I Coraggio, and G Leubner-Metzger. 2000. “Ethylene promotes
ethylene biosynthesis during pea seed germination by positive feedback
regulation of 1-aminocyclo-propane-1-carboxylic acid oxidase.” Planta
211 (1): 144–49.
Petruzzelli, L., M. Sturaro, D. Mainieri, and G. Leubner-Metzger. 2003.
“Calcium requirement for ethylene-dependent responses involving 1-
aminocyclopropane-1-carboxylic acid oxidase in radicle tissues of
germinated pea seeds.” Plant, Cell and Environment 26 (5): 661–71.
Piskurewicz, Urszula, Yusuke Jikumaru, Natsuko Kinoshita, Eiji Nambara,
Yuji Kamiya, and Luis Lopez-Molina. 2008. “The gibberellic acid
signaling repressor RGL2 inhibits Arabidopsis seed germination by
stimulating abscisic acid synthesis and ABI5 activity.” The Plant Cell 20
(10): 2729–45.
Popko, J, R Hänsch, R-R Mendel, A Polle, and T Teichmann. 2010. “The role
of abscisic acid and auxin in the response of poplar to abiotic stress.”
Plant Biology (Stuttgart, Germany) 12 (2): 242–58.
Rashotte, A M, S R Brady, R C Reed, S J Ante, and G K Muday. 2000.
“Basipetal auxin transport is required for gravitropism in roots of
Arabidopsis.” Plant Physiology 122 (2): 481–90.
Rasmusson, D. C., and R. L. Phillips. 1997. “Plant breeding progress and
genetic diversity from de novo variation and elevated epistasis.” Crop
Science 37 (2). Crop Science Society of America: 303.

144
Ray, Peter M., Paul B. Green, and Robert Cleland. 1972. “Role of turgor in
plant cell growth.” Nature 239 (5368): 163–64.
Rayle, D L. 1973. “Auxin-induced hydrogen-ion secretion in avena coleoptiles
and its implications.” Planta 114 (1): 63–73.
Richards, Donald E, Kathryn E King, Tahar Ait-Ali, and Nicholas P Harberd.
2001. “How gibberellin regulates plant growth and development: a
molecular genetic analysis of gibberellin signaling.” Annual Review of
Plant Physiology and Plant Molecular Biology 52 (June): 67–88.
Riefler, Michael, Ondrej Novak, Miroslav Strnad, and Thomas Schmülling.
2006. “Arabidopsis cytokinin receptor mutants reveal functions in shoot
growth, leaf senescence, seed size, germination, root development, and
cytokinin metabolism.” The Plant Cell 18 (1): 40–54.
Rodriguez, Pedro L, Gregor Benning, and Erwin Grill. 1998. “ABI2, a second
protein phosphatase 2C involved in abscisic acid signal transduction in
Arabidopsis.” FEBS Letters 421 (3): 185–90.
Rodríguez-Gacio, María del Carmen, Raquel Iglesias-Fernández, Pilar
Carbonero, and Angel J Matilla. 2012. “Softening-up mannan-rich cell
walls.” Journal of Experimental Botany 63 (11): 3976–88.
Routier-Kierzkowska, Anne-Lise, Alain Weber, Petra Kochova, Dimitris
Felekis, Bradley J Nelson, Cris Kuhlemeier, and Richard S Smith. 2012.
“Cellular force microscopy for in vivo measurements of plant tissue
mechanics.” Plant Physiology 158 (4): 1514–22.
Ruiz-López, Noemí, Richard P Haslam, Mónica Venegas-Calerón, Tony R
Larson, Ian A Graham, Johnathan A Napier, and Olga Sayanova. 2009.
“The synthesis and accumulation of stearidonic acid in transgenic plants: a
novel source of ‘heart-healthy’ omega-3 fatty acids.” Plant Biotechnology
Journal 7 (7): 704–16.
Sachs, Julius. 1887. Lectures on the Physiology of Plants / by Julius von Sachs,
Translated by H. Marshall Ward. Oxford :: The Clarendon Press.
Saez, Angela, Nadezda Apostolova, Miguel Gonzalez-Guzman, Mary Paz
Gonzalez-Garcia, Carlos Nicolas, Oscar Lorenzo, and Pedro L Rodriguez.
2004. “Gain-of-function and loss-of-function phenotypes of the protein
phosphatase 2C HAB1 reveal its role as a negative regulator of abscisic
acid signalling.” The Plant Journal : For Cell and Molecular Biology 37
(3): 354–69.
Santner, Aaron, Luz Irina A Calderon-Villalobos, and Mark Estelle. 2009.
“Plant hormones are versatile chemical regulators of plant growth.”
Nature Chemical Biology 5 (5). Nature Publishing Group: 301–7.

145
Schaller, G. E., A. N. Ladd, M. B. Lanahan, J. M. Spanbauer, and A. B.
Bleecker. 1995. “The ethylene response mediator ETR1 from Arabidopsis
forms a disulfide-linked dimer.” Journal of Biological Chemistry 270
(21): 12526–30.
Scheller, Henrik Vibe, and Peter Ulvskov. 2010. “Hemicelluloses.” Annual
Review of Plant Biology 61 (January): 263–89.
Schopfer, Peter. 2006. “Biomechanics of plant growth.” American Journal of
Botany 93 (10): 1415–25.
Sliwinska, Elwira, George W Bassel, and J Derek Bewley. 2009. “Germination
of Arabidopsis thaliana seeds is not completed as a result of elongation of
the radicle but of the adjacent transition zone and lower hypocotyl.”
Journal of Experimental Botany 60 (12): 3587–94.
Somerville, Chris. 2006. “Cellulose synthesis in higher plants.” Annual Review
of Cell and Developmental Biology 22 (January): 53–78.
Sorensen, M. B. 2002. “Cellularisation in the endosperm of Arabidopsis
thaliana is coupled to mitosis and shares multiple components with
cytokinesis.” Development 129 (24): 5567–76.
Sørensen, Mikael Blom, Abdul M. Chaudhury, Hélène Robert, Estelle
Bancharel, and Frédéric Berger. 2001. “Polycomb group genes control
pattern formation in plant seed.” Current Biology 11 (4): 277–81.
Steber, C M, and P McCourt. 2001. “A role for brassinosteroids in germination
in Arabidopsis.” Plant Physiology 125 (2): 763–69.
Stepanova, Anna N., and Jose M. Alonso. 2005. “Ethylene signalling and
response pathway: a unique signalling cascade with a multitude of inputs
and outputs.” Physiologia Plantarum 123 (2): 195–206.
Sun, T P, and Y Kamiya. 1994. “The Arabidopsis GA1 locus encodes the
cyclase ent-kaurene synthetase A of gibberellin biosynthesis.” The Plant
Cell 6 (10): 1509–18.
Sutton, M A, X Ke, S M Lessner, M Goldbach, M Yost, F Zhao, and H W
Schreier. 2008. “Strain field measurements on mouse carotid arteries
using microscopic three-dimensional digital image correlation.” Journal
of Biomedical Materials Research. Part A 84 (1): 178–90.
Sutton, Michael A. 2008. Springer Handbook of Experimental Solid
Mechanics. Edited by William N. Sharpe. Boston, MA: Springer US.
Suzuki, Masaharu, Matthew G Ketterling, Qin-Bao Li, and Donald R McCarty.
2003. “Viviparous1 alters global gene expression patterns through
regulation of abscisic acid signaling.” Plant Physiology 132 (3): 1664–77.

146
Tracy, Saoirse R, Colin R Black, Jeremy A Roberts, Craig Sturrock, Stefan
Mairhofer, Jim Craigon, and Sacha J Mooney. 2012. “Quantifying the
impact of soil compaction on root system architecture in tomato (solanum
lycopersicum) by x-ray micro-computed tomography.” Annals of Botany
110 (2): 511–19.
Tyler, Ludmila, Stephen G Thomas, Jianhong Hu, Alyssa Dill, Jose M Alonso,
Joseph R Ecker, and Tai-Ping Sun. 2004. “Della proteins and gibberellin-
regulated seed germination and floral development in Arabidopsis.” Plant
Physiology 135 (2): 1008–19.
Van Sandt, Vicky S T, Dmitry Suslov, Jean-Pierre Verbelen, and Kris
Vissenberg. 2007. “Xyloglucan endotransglucosylase activity loosens a
plant cell wall.” Annals of Botany 100 (7): 1467–73.
Voegele, Antje, Ada Linkies, Kerstin Müller, and Gerhard Leubner-Metzger.
2011. “Members of the gibberellin receptor gene family GID1
(GIBBERELLIN INSENSITIVE DWARF1) play distinct roles during
Lepidium sativum and Arabidopsis thaliana seed germination.” Journal of
Experimental Botany 62 (14): 5131–47.
Wang, C X, L Wang, and C R Thomas. 2004. “Modelling the mechanical
properties of single suspension-cultured tomato cells.” Annals of Botany
93 (4): 443–53.
Wei, C. 2001. “An insight into cell elasticity and load-bearing ability.
measurement and theory.” Plant Physiology 126 (3): 1129–38.
Weitbrecht, Karin, Kerstin Müller, and Gerhard Leubner-Metzger. 2011. “First
off the mark: early seed germination.” Journal of Experimental Botany 62
(10): 3289–3309.
Wel, N. N., C. A. J. Putman, S. J. T. Noort, B. G. Grooth, and A. M. C. Emons.
1996. “Atomic force microscopy of pollen grains, cellulose microfibrils,
and protoplasts.” Protoplasma 194 (1-2): 29–39.
Wilhelm, C, F Gazeau, and J-C Bacri. 2003. “Rotational magnetic endosome
microrheology: viscoelastic architecture inside living cells.” Physical
Review. E, Statistical, Nonlinear, and Soft Matter Physics 67 (6 Pt 1):
061908.
Winship, Lawrence J, Gerhard Obermeyer, Anja Geitmann, and Peter K
Hepler. 2011. “Pollen tubes and the physical world.” Trends in Plant
Science 16 (7): 353–55.
Wolf, Sebastian, Kian Hématy, and Herman Höfte. 2012. “Growth control and
cell wall signaling in plants.” Annual Review of Plant Biology 63
(January): 381–407.

147
Wu, C T, G Leubner-Metzger, F Meins, and K J Bradford. 2001. “Class I beta-
1,3-glucanase and chitinase are expressed in the micropylar endosperm of
tomato seeds prior to radicle emergence.” Plant Physiology 126 (3):
1299–1313.
Wu, Yan, Siqun Wang, Dingguo Zhou, Cheng Xing, Yang Zhang, and Zhiyong
Cai. 2010. “Evaluation of elastic modulus and hardness of crop stalks cell
walls by nano-indentation.” Bioresource Technology 101 (8): 2867–71.
Wu, Ziheng, Tyler A Baker, Timothy C Ovaert, and Glen L Niebur. 2011.
“The effect of holding time on nanoindentation measurements of creep in
bone.” Journal of Biomechanics 44 (6): 1066–72.
Yamaguchi, S, and Y Kamiya. 2000. “Gibberellin biosynthesis: its regulation
by endogenous and environmental signals.” Plant & Cell Physiology 41
(3): 251–57.
Yamaguchi, S, Y Kamiya, and T Sun. 2001. “Distinct cell-specific expression
patterns of early and late gibberellin biosynthetic genes during
Arabidopsis seed germination.” The Plant Journal : For Cell and
Molecular Biology 28 (4): 443–53.
Yamaguchi, Shinjiro. 2008. “Gibberellin Metabolism and its regulation.”
Annual Review of Plant Biology 59 (January): 225–51.
Yamauchi, Yukika, Mikihiro Ogawa, Ayuko Kuwahara, Atsushi Hanada, Yuji
Kamiya, and Shinjiro Yamaguchi. 2004. “Activation of gibberellin
biosynthesis and response pathways by low temperature during imbibition
of Arabidopsis thaliana seeds.” The Plant Cell 16 (2): 367–78.
Yan, An, Minjie Wu, Limei Yan, Rui Hu, Imran Ali, and Yinbo Gan. 2014.
“AtEXP2 is involved in seed germination and abiotic stress response in
Arabidopsis.” Edited by John Schiefelbein. PloS One 9 (1). Public Library
of Science: e85208.
Zamir, Evan A, and Larry A Taber. 2004. “On the effects of residual stress in
microindentation tests of soft tissue structures.” Journal of Biomechanical
Engineering 126 (2): 276–83.
Zentella, Rodolfo, Zhong-Lin Zhang, Mehea Park, Stephen G Thomas, Akira
Endo, Kohji Murase, Christine M Fleet, et al. 2007. “Global analysis of
della direct targets in early gibberellin signaling in Arabidopsis.” The
Plant Cell 19 (10): 3037–57.