ghent university faculty of pharmaceutical sciences · ghent university faculty of pharmaceutical...
TRANSCRIPT

GHENT UNIVERSITY
FACULTY OF PHARMACEUTICAL SCIENCES
Department of Pharmaceutical Analysis
Laboratory for Drug Quality and Registration (DruQuaR)
Academic year 2012-2013
API LOSS DURING CAPSULE PREPARATION
Eline GRAULS
First Master of Pharmaceutical Care
Promotor
Prof. Bart De Spiegeleer
Commissioners
Prof. J.P. Remon
Prof. H. Robays

COPYRIGHT
"The author and the promoters give the authorization to consult and to copy parts of this thesis
for personal use only. Any other use is limited by the laws of copyright, especially concerning
the obligation to refer to the source whenever results from this thesis are cited."
May 22, 2013
Promoter Author
Prof. dr. Bart De Spiegeleer Eline Grauls

SUMMARY
Due to sub-label claim API content problems in capsules, this research investigated the
API loss during the preparation of capsules. This thesis consists of two parts. First, the
experimental part, where the pharmaceutical compounding of three molecules
(hydrocortisone, triamcinolone and dexamethasone) are evaluated on potential API losses.
Furthermore, the influence of some variables (e.g. mortar) are investigated in more detail. The
second part includes the datamining of a list of 17 molecules, in which the median assay
results of each molecule are modeled in function of the molecule structural descriptors,
examining a molecule effect on the observed sub-label claim API contents in capsules.
Our findings show that for the three molecules, the highest API loss occurred at the
mortar step. Therefore, the influence of this variable was investigated separately, from which
two main conclusions were drawn:
(1) the type of material of the mortar has an influence on API loss, i.e. an agate
mortar has a lower API loss than a porcelain mortar.
(2) the used state of the mortar plays an important role as well, i.e. a new mortar (not
used) showed a lower API loss than an old mortar (extensively used). The older/more
used/rougher the mortar becomes, the higher the API loss will be.
Another important result is that there is no loss of API at the capsule shell, which is
interesting for the pediatric/geriatric use.
The presence of a molecule (chemical) effect on the median assay values is demonstrated
based upon the results of the datamining. This molecule effect was modeled, by expressing
the 17 median assay values in function of corresponding molecular descriptors, using stepwise
MLR and PCA techniques. The obtained MLR model, containing 3 variables (RDF060m,
R6e+ and R3m
+) explained 92.5% of the observed % API loss variability, whereas the PCA
model explained 95%. The larger the variability in API loss is, the more sensitive the
compound is for operational variables (i.e., mortar type and condition, API concentration, no.
of capsules produced, personnel and capsulation device).
Based on our findings, future research efforts are needed to improve the API loss during
capsule preparation, i.e. to decrease the loss as well as its variability.

SAMENVATTING
Vanwege vaak voorkomende API problemen in capsules, analyseerde dit onderzoek het
API verlies tijdens de capsule bereiding. Deze thesis bestaat uit twee luiken. Het eerste luik is
het experimenteel gedeelte, waarin drie moleculen (hydrocortisone, triamcinolone en
dexamethasone) onderzocht worden op potentieel API verlies tijdens de bereiding. Bovendien
wordt de invloed van sommige variabelen (vb. mortier) nader onderzocht. Het tweede luik
bestaat uit datamining van een lijst van 17 moleculen, waarbij de analyse resultaten (mediaan)
van elke molecule worden gemodelleerd in functie van de structurele descriptoren van de
moleculen. Hier zal het molecule-effect op de waargenomen sub-label claim API inhoud in de
capsules onderzocht worden.
Onze bevindingen tonen aan dat voor de drie moleculen, het hoogste API verlies optrad
in de mortier stap. Daarom werd de invloed van deze variabele apart onderzocht, waaruit twee
belangrijke conclusies werden getrokken:
(1) het materiaal van de mortier speelt een belangrijke rol in het API verlies, d.w.z.
een agaat mortier heeft een lager API verlies dan een porseleinen mortier.
(2) alsook de toestand/conditie van de mortier speelt een belangrijke rol, een nieuwe
mortier (nog niet gebruikt) toonde een lager API verlies aan dan een oude mortier (veel
gebruikt). Hoe ouder/meer gebruikt/ruwer de mortier, hoe hoger het API verlies zal zijn.
Een ander belangrijk resultaat is dat er geen verlies van API aan de capsulewand optrad,
wat interessant is voor pediatrisch/geriatrisch gebruik.
Het deel datamining, toont de aanwezigheid van een molecuul (chemisch) effect op de
mediaan analyse waarden aan. Dit molecuul effect werd gemodelleerd met behulp van
stapsgewijze MLR en PCA technieken. Het verkregen MLR-model verklaarde 92,5% van het
geobserveerde % API verlies, terwijl het PCA-model 95% verklaarde. Hoe groter de
variabiliteit in API verlies, hoe gevoeliger het component is voor operationele variabelen
(d.w.z. type en staat van de mortier, de API concentratie, het aantal gemaakte capsules, het
personeel en de gelulier).
Op basis van onze bevindingen zijn toekomstige onderzoeksinspanningen nodig om het
API verlies tijdens de capsulebereiding te verbeteren, d.w.z. het verlagen van het verlies
alsook zijn variabiliteit.
WORD OF THANKS
“Many a little makes a mickle.”
(William Camden, 1614)
First of all, I want to thank my promoter Prof. Bart De Spiegeleer for giving me the
opportunity to perform this thesis and for his good advice.
Subsequently I would like to thank Apr. Matthias D’Hondt for his excellent guidance,
corrections and comments on writing this thesis.
I would also like to thank Prof. Jean-Paul Remon and Prof. Chris Vervaet for letting me use
the materials that I needed for this thesis.
I would like to thank everyone of DruQuaR as well for their help and pleasant atmosphere.
And finally I would like to thank my family and friends for their support during this thesis.
TABLE OF CONTENTS
1. INTRODUCTION .............................................................................................................. 1
1.1 GENERAL ................................................................................................................... 1
1.1.1 Drugs .................................................................................................................... 1
1.1.2 Routes of administration ...................................................................................... 1
1.1.3 Dosage forms ........................................................................................................ 2
1.1.4 Capsules ............................................................................................................... 3
1.2 CAPSULE PREPARATION ....................................................................................... 4
1.2.1 Industrial ............................................................................................................... 4
1.2.2 Pharmaceutical compounding .............................................................................. 4
1.2.2.1 Capsules ........................................................................................................ 5
1.2.2.2 Trituration ..................................................................................................... 5
1.3 API LOSS DURING MAGISTRAL CAPSULE PREPARATION ............................ 6
1.3.1 Problem ................................................................................................................ 6
1.3.2 Powder .................................................................................................................. 6
1.3.2.1 Mixing of powders ........................................................................................ 6
1.3.2.2 Physicochemical properties........................................................................... 7
1.3.2.3 Sampling ....................................................................................................... 7
1.3.3 Roughness degree of the surface .......................................................................... 7
1.3.4 Compounds ........................................................................................................... 7
1.4 ULTRA PERFORMANCE LIQUID CHROMATOGRAPHY .................................. 8
2. OBJECTIVE ..................................................................................................................... 10
3. MATERIALS AND METHODS ...................................................................................... 11
3.1 CHEMICALS ............................................................................................................ 11
3.2 MATERIALS AND EQUIPMENTS ........................................................................ 11
3.3 METHODS ................................................................................................................ 12
3.3.1 UPLC–method and verification ......................................................................... 12
3.4 HYDROCORTISONE CAPSULE PREPARATION ............................................... 12
3.4.1 Hydrocortisone 10 mg capsules ......................................................................... 12
3.4.1.1 Capsule preparation .................................................................................... 12
3.4.1.2 Swabbing of working area and equipment + swab sample preparation ...... 12
3.4.1.3 Preparation of reference solutions............................................................... 13
3.4.1.4 Capsule sample preparation ........................................................................ 13
3.4.1.5 Residual capsule sample preparation .......................................................... 13
3.4.2 Hydrocortisone 20 mg capsules ......................................................................... 13
3.4.3 Mortar influence during hydrocortisone preparation ......................................... 14
3.4.3.1 Different mortars ......................................................................................... 14
3.4.3.2 Capsule preparation .................................................................................... 14
3.4.3.3 Swabbing of working area and equipment + swab sample preparation ...... 14
3.4.3.4 Preparation of reference solutions............................................................... 14
3.5 TRIAMCINOLONE CAPSULE PREPARATION: 4 MG ....................................... 15
3.6 DEXAMETHASONE CAPSULE PREPARATION: 0.25 MG ................................ 15
3.6.1 Influence of sample solvent and sample solvent strength .................................. 15
3.6.2 Preparation of own-made 10%-dexamethasone trituration ................................ 16
3.6.2.1 Protocol 10%-dexamethsanone trituration .................................................. 16
3.6.2.2 Swabbing of working area and equipment + swab sample preparation ...... 17
3.6.2.3 Preparation of reference solutions............................................................... 17
3.6.3 Analytical development and pilot recovery experiments ................................... 17
3.6.3.1 Filter and centrifuge influence .................................................................... 18
3.6.3.2 Influence mixing step only .......................................................................... 18
3.6.3.3 Influence swabbing technique ..................................................................... 19
3.6.4 Dexamethasone 0.25 mg capsules ...................................................................... 20
3.6.4.1 Protocol capsule preparation ....................................................................... 20
3.6.4.2 Swabbing of working area and equipment + swab sample preparation ...... 20
3.6.4.3 Preparation of reference solutions............................................................... 20
3.6.4.4 Capsule sample preparation ........................................................................ 21
3.6.4.5 Residual capsule sample preparation .......................................................... 21
3.7 DATAMINING ......................................................................................................... 21
4. RESULTS AND DISCUSSION ....................................................................................... 23
4.1 METHOD VERIFICATION ..................................................................................... 23
4.2 HYDROCORTISONE ............................................................................................... 23
4.2.1 Hydrocortisone 10 mg capsules ......................................................................... 23
4.2.1.1 % label claim capsules ................................................................................ 23
4.2.1.2 API mass balance ........................................................................................ 24
4.2.2 Hydrocortisone 20 mg capsules ......................................................................... 24
4.2.2.1 % label claim capsules ................................................................................ 24
4.2.2.2 API mass balance ........................................................................................ 25
4.2.2.3 Comparison of hydrocortisone concentration in bulk and residual powder 26
4.2.3 Concentration effect ........................................................................................... 27
4.2.4 Mortar influence ................................................................................................. 28
4.2.5 Suggestion for improvement of hydrocortisone capsule preparations ............... 30
4.3 TRIAMCINOLONE .................................................................................................. 31
4.3.1 Triamcinolone 4 mg capsules ............................................................................. 31
4.3.1.1 % label claim capsules ................................................................................ 31
4.3.1.2 API mass balance ........................................................................................ 32
4.4 DEXAMETHASONE ............................................................................................... 33
4.4.1 Own-made 10%-dexamethasone trituration ....................................................... 33
4.4.1.1 Dexamethasone content in own-made trituration ....................................... 33
4.4.1.2 Swabs dexametasone content and % API mass balance ............................. 33
4.4.2 Analytical development and pilot recovery experiments ................................... 34
4.4.2.1 Sample solvent strength influence .............................................................. 34
4.4.2.2 Filter and centrifuge influence .................................................................... 34
4.4.2.3 Influence swabbing technique ..................................................................... 35
4.4.2.4 Microscopy ................................................................................................. 35
4.4.2.5 Process: influence mixing step .................................................................... 36
4.4.3 Dexamethasone 0.25 mg capsules using 10% own-made trituration ................. 37
4.4.3.1 % label claim capsules (own-made trituration)........................................... 37
4.4.3.2 API mass balance (own-made trituration) .................................................. 38
4.4.4 Dexamethasone 0.25 mg capsules using a 10% commercial trituration ............ 39
4.4.4.1 % label claim capsules (commercial trituration)......................................... 39
4.4.4.2 API mass balance (commercial trituration) ................................................ 39
4.4.5 Comparison of the own-made and commercial trituration ................................. 40
4.5 INFLUENCE OF CHEMICAL STRUCTURE (DATAMINING) ........................... 41
4.5.1 Data .................................................................................................................... 41
4.5.2 Modeling ............................................................................................................ 42
4.5.3 Stepwise multiple linear regression .................................................................... 42
4.5.3.1 Model 1: All selected descriptors (n=1616) ................................................ 42
4.5.3.2 Model 2: selected descriptor groups (n=355) ............................................. 43
4.5.3.3 Model 3: selected descriptors (n=55) .......................................................... 43
4.5.4 Principal component analysis (PCA) ................................................................. 44
4.5.5 Discussion of models ......................................................................................... 44
4.6 FUTURE PERSPECTIVES ...................................................................................... 46
5. CONCLUSION ................................................................................................................. 47
6. REFERENCES ................................................................................................................. 48
7. ATTACHMENT ...................................................................................................................
8. EVENING LECTURES: INTERNATIONALISATION AT HOME ..................................

LIST WITH ABBREVATIONS
ACN Acetonitrile
ANOVA Analysis of variance
API Active pharmaceutical ingredient
DEX Dexamethasone
HC Hydrocortisone
HETP Height equivalent of a theoretical plate
HPLC High performance liquid chromatography
HPMC Hydroxypropyl methylcellulose
LC Label claim
LOD Limit of detection
LOQ Limit of quantification
MeOH Methanol
MLR Multiple linear regression
PCA Principal component analysis
PDA Photodiode array
PLS Partial least squares
QC Quality control
RSD Relative standard deviation
TMF Therapeutisch magistraal formularium
TRI Triamcinolone
UPLC Ultra performed liquid chromatography
UV Ultraviolet
1
1. INTRODUCTION
1.1 GENERAL
1.1.1 Drugs
Medicines evolved from natural products (such as plants or plants components) to
chemically synthesized drugs, in which the 19th
century was a breakthrough for the
pharmaceutical industry. A drug is defined as “a single or combination of substances with
therapeutic or prophylactic properties in relation to diseases in humans or animals”, according
to the Royal decree of 25/3/1964 [1]. The two main goals of drug administration are to improve
the patient’s health and the quality of life. Despite having positive, desired effects (therapeutic
effects), drugs can also carry negative, undesired effects (side effects), whereby these side
effects are often dose-related [2].
The role of the pharmacist has evolved significantly over the years, in which
pharmaceutical care has become more and more important, surpassing drug preparation. In the
field of pharmaceutical care, the pharmacist gives advice and feedback to the patient, doctor
and nurse, and is regarded as the expert of medicines. However, the role of the pharmacist still
comprises the preparation of medicines and the delivery of commercial preparations.
1.1.2 Routes of administration
Pharmaceutical drugs have a wide variety in properties and action mechanisms, resulting in
different administration routes and dosage forms, so each illness can be treated as optimal as
possible. The three main administration routes are given in Table 1.1 [3].
Each route of administration has his own advantages, and disadvantages and combined
with the specific drug properties and general patient preferences, an optimal administration
route can be chosen. The oral route is preferred by the most people, as this is a painless, safe,
easy and cheap administration route [4-6].
2
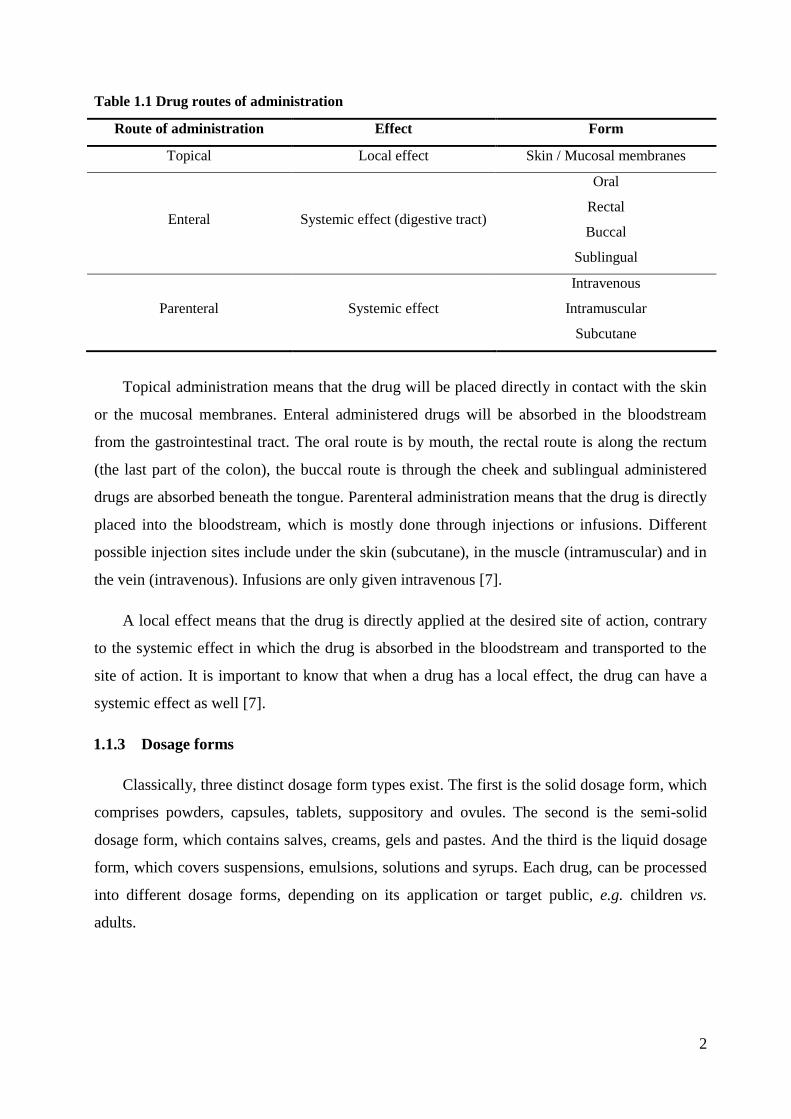
Table 1.1 Drug routes of administration
Route of administration Effect Form
Topical Local effect Skin / Mucosal membranes
Enteral Systemic effect (digestive tract)
Oral
Rectal
Buccal
Sublingual
Parenteral Systemic effect
Intravenous
Intramuscular
Subcutane
Topical administration means that the drug will be placed directly in contact with the skin
or the mucosal membranes. Enteral administered drugs will be absorbed in the bloodstream
from the gastrointestinal tract. The oral route is by mouth, the rectal route is along the rectum
(the last part of the colon), the buccal route is through the cheek and sublingual administered
drugs are absorbed beneath the tongue. Parenteral administration means that the drug is directly
placed into the bloodstream, which is mostly done through injections or infusions. Different
possible injection sites include under the skin (subcutane), in the muscle (intramuscular) and in
the vein (intravenous). Infusions are only given intravenous [7].
A local effect means that the drug is directly applied at the desired site of action, contrary
to the systemic effect in which the drug is absorbed in the bloodstream and transported to the
site of action. It is important to know that when a drug has a local effect, the drug can have a
systemic effect as well [7].
1.1.3 Dosage forms
Classically, three distinct dosage form types exist. The first is the solid dosage form, which
comprises powders, capsules, tablets, suppository and ovules. The second is the semi-solid
dosage form, which contains salves, creams, gels and pastes. And the third is the liquid dosage
form, which covers suspensions, emulsions, solutions and syrups. Each drug, can be processed
into different dosage forms, depending on its application or target public, e.g. children vs.
adults.

3
For each route of administration, a number of dosage forms exist. For example the enteral
route can be accessed through capsules, tablets and liquid formulations while the topical route
can be used through salves, gels, creams and pastes.
1.1.4 Capsules
Capsules are small containers which are filled with one or more active pharmaceutical
ingredient (API) and excipients such as filling agents, flowing agents, solubilizing agents and
antimicrobial preservatives [8]. The excipients need to be API-compatible, concerning
chemical stability, density, particle size and shape [9]. The capsule is filled with a drug dose,
which can be a solid, a semi-solid or a liquid formulation. Capsules are mostly gelatin-based,
which were invented in the 19th
century, primarily to mask the bad taste and unappetizing color
of the active substances [10]. Gelatin is prepared from collagen derived from the bones and the
skin of animals through partial hydrolysis. An alternative for gelatin is hydroxypropyl
methylcellulose (HPMC), which is an synthetic derivative of cellulose. The primary advantage
of HPMC is that it is derived from a vegetable source, which is important for vegetarians and
certain religions. Also, HPMC is compatible with hygroscopic products as HPMC itself has a
relatively low water content of 2-5%, while gelatin has a water content of 13-16% [11, 12].
Capsules are a popular dosage form because of their stability, the high dosage accuracy, quick
drug release and ease of swallowing.
There are two kinds of capsules, the hard gelatin capsules (exist out of two parts) and the
soft gelatin capsules (exist out of one part). The soft gelatin capsules, mostly filled with liquids,
exist in different sizes and shapes and can only be made in the industry [10].
In the pharmacy, hard gelatin capsules-based drug formulations can be made. The hard
gelatin capsules are mostly filled with a solid formulation and have a Coni-Snap® system for
secure closure to ensure that the capsules cannot be opened accidentally and/or unobserved.
Due to the Coni-Snap® system, a drama such as the “Chicago Tylenol murder” can be
prevented. Here, an unknown person poisoned Tylenol capsules (API:paracetamol) with
cyanide, which resulted in the death of seven people. Because of this incident, safe drug
packaging such as the Coni-Snap® capsules, which hampers tampering, are important to
guarantee the safety of the patients [13]. However, if a patient needs to open the capsule, the
capsules may not be locked into the Coni-Snap® capsule system.

4
Hard gelatin capsules exist in different sizes, ranging from n° 5 (smallest) to n° 000
(largest). The capsule sizes and their corresponding total volumes according to the
Therapeutisch magistraal formularium (TMF)” are given in Table 1.2 [9].
Table 1.2 Volumes of hard gelatin capsules in the pharmacy according to TMF
Capsule size
N° 3 2 1 0 00 000
Volume (ml) 0.27 0.37 0.48 0.67 0.95 1.36
According to the European Pharmacopeia, i.e. in the Dosage Forms monograph “Capsules”
(Ph. Eur. 1/2008:0016) and Pharmaceutical Preparations (Ph. Eur. 04/2013:2619), quality is
required [8]. There are three major aspects: (i) average weight/content, (ii) weight/content
distribution, (iii) dissolution and disintegration. These are specifications which can be tested by
quality control (QC).
1.2 CAPSULE PREPARATION
1.2.1 Industrial
Today, the majority of all drugs formulations, are prepared industrially [14]. The reason for
this increase of industrially produced medicines are the low costs, the high production speed,
the complexity of the new drugs formulations and the high quality requirements. A
disadvantage of the mechanical preparations of drugs is that the pharmaceutical industry
doesn’t allow or at least limits individualized medication, resulting in a “one size fits all”-
strategy [15].
1.2.2 Pharmaceutical compounding
Pharmaceutical compounding is the preparation of drugs formulations performed by the
pharmacist, which continues to play an important role in today’s health care system as it allows
for a more individualized, i.e. patient-specific, medication program [14]. It is important that
pharmacy students still possess adequate skills for pharmaceutical compounding, so a safe and
high quality drug product can be delivered to the patient [16].

5
1.2.2.1 Capsules
For certain pharmacy-made capsule preparations, TMF stipulates specific guidelines. TMF
is a reference manual where compounding methods are described as well as providing shelf
lifes and indications. Several materials are needed for capsule preparation. A weighing device,
needed for weighing API starting material, a mortar, pestle and flexible plastic card for mixing
the different starting materials (APIs and excipients) into one homogenous powder, a
measuring cylinder for obtaining a sufficient powder volume (API and excipients) to fill the
capsules, a paper funnel to transfer the powder from the mortar to the measuring cylinder and a
capsulation device (or gelulier) in which the powder mixture is filled out into the capsules [9].
A example of the mortar-pestle-flexible plastic card and capsulation device are given in Figure
1.1.
Figure 1.1: Mortar, pestle and flexible plastic card (left) and capsulation device (right)
1.2.2.2 Trituration
In the pharmacy, the minimum API weight which can still be measured accurately is set at
50 mg. If a lower API quantity is needed, a trituration (i.e. dilution) must be made, to ensure
sufficient accurate weighing. Excipients, containing diluents (e.g. lactose, mannitol, starch) and
lubricants (e.g. talc, colloidal siliciumdioxide, magnesium stearaat), as well as a small amount
of permitted colorant (color agent iron red, color agent riboflavine) are used in a trituration of
API [17]. The colorant enables visual confirmation of a homogeneous powder mixture. From
this trituration, a desired quantity will be taken corresponding to the desired API amount.
Beside pharmacy-made triturations, commercially available triturations can also be bought,
having i.a. the advantage of the availability of an analysis certificate confirming the quality of
the trituration [9].
6
1.3 API LOSS DURING MAGISTRAL CAPSULE PREPARATION
1.3.1 Problem
There has been several problems (mainly variability and content) with the API content in
pharmaceutical compounded capsules. Basically, the API content in capsules is often too low.
In 2011, an article was published in Testaankoop where this quality problem was cited. The
investigation of Testaankoop verified the preparation of 40 dexamethasone (0.5 mg) capsules
by 42 different pharmacists. Two pharmacists did not take the prescription, because they did
not possess the raw API material. The samples were checked against four requirements: (i)
weight distribution, (ii) average content and (iii) content distribution. Only 11 of the 40
samples, or approximately 27.50%, passed all these tests. Most disapproved samples had an
average API content outside of the 90-110% interval, whereas the weight distribution was
found to be fairly ok (32 of the 40 samples, or approximately 80%, passed this requirement).
Finally, (iv) labeling of the preparation was also checked on the required statements and only
one pharmacist was found to conform with the regulatory requirements [14].
As a direct result of previous API content studies, a ringtest (number 4) was performed, in
which the preparation of different capsules preparations, focusing on different APIs, was
investigated. As a result of this study, which confirmed the aforementioned sub-label claim API
content problem, a closer look on the capsule preparation process was required. This thesis will
examine the different steps included in the pharmaceutical capsule preparation process, and
evaluate the API losses in this process.
1.3.2 Powder
1.3.2.1 Mixing of powders
Mixing of powders is a technique which is used in many industries, including the
pharmaceutical industry. Here blending of particles, a technique to obtain a
homogenous/uniform mixture, is a commonly used step in the preparation of solid mixtures
such as tablets and capsules. For the blending of powders, several methods are used, ranging
from manual mixing with mortar and pestle to mechanical mixing. The mixing process is
influenced by the powders characteristics [18, 19].

7
1.3.2.2 Physicochemical properties
The physical and chemical properties of a powder are important to understand their
behavior. There are 2 types of powders, free flowing and cohesive powders. The particles in
free flowing powders do not adhere with each other, whereas particles in cohesive powders
have a relatively strong cohesion force. Cohesion is a force of attraction between equal
molecules [20]. The smaller the particle becomes, the more important the cohesion force is due
to the presence of the interparticle forces (e.g. Van der Waals Forces, dipole bonds, hydrogen
bonds, polarizability, aromaticity, electrostatic forces, hydrophobicity) [21].
1.3.2.3 Sampling
For analyzing a powder mixtures, samples should be taken (i.e. sampled). Various
materials can be used for sampling in pharmaceutical analyses (e.g. end-sampling probes).
Sampling is mostly done in triplicate and are preferably taken at different places in the powder
bed, so the samples are representative for the total powder mixture. The size of the sample is
often one to three times the final dosage unit. Sampling is an in-process technique. [21].
1.3.3 Roughness degree of the surface
During the capsule preparation, the powder mixture comes into contact with different
surfaces, e.g. mortar and/or the surface of the gelulier. The roughness of these surfaces will
also influence a potential powder and API loss. Generally, the possibility of any powder loss
increases with the roughness of the surfaces it comes into contact with. The mortar material ,
e.g. agate, melamin, porcelain, and gelulier material (plastic and metal) as well as the state of
use will influence the roughness of the corresponding surfaces.
1.3.4 Compounds
In Ringtest 4 following API’s were investigated by DruQuaR: hydrocortisone,
triamcinolone and dexamethasone. The molecular structure of hydrocortisone, triamcinolone
and dexamethasone is given in Figure 1.2.

8
OH
OH
CH3
H
O
CH3
H
H
OH
O
Hydrocortisone
OH
H
H
F
OH
CH3
CH3
OH
OH
O
O
TriamcinoloneO
OHO
CH3
CH3
CH3
OH
F H
H
OH
Dexamethasone
Figure 1.2: Molecular structures of hydrocortisone, triamcinolone and dexamethasone
These three molecules are corticosteroids, more specific glucocorticoids [22]. They are
therapeutically used in the therapy of inflammatory diseases and in immunosuppression [23].
Hydrocortisone, also named cortisol, is a natural glucocorticoid in humans. Triamcinolone and
dexamethasone are synthetic glucocorticoids, which have an analogue structure to
hydrocortisone but have a weaker mineralocorticoid effect and stronger glucocorticoid effect
[9, 22].
API content data of other molecules are also available and allow investigation of a
molecule-specific influence on the final API content in the capsule (see section 4.5).
1.4 ULTRA PERFORMANCE LIQUID CHROMATOGRAPHY
In liquid column chromatography, the stationary phase is packed in a column. The sample,
which is usually a solubilized mixture of compounds including the analyte(s), is injected on the
top of the column and mobile phase flows continuously over the column. The sample
components will be distributed between the stationary and mobile phase. Because of a selective
delay on the stationary phase, the different sample components will elute with a different rate
through the column, resulting in sample separation. The component with the most affinity for
the stationary phase will be elute from the column as last. For the visualization of the
separation process a photodiode array (PDA) detector is used and a ultraviolet (UV)-
chromatogram is obtained.
Ultra performed liquid chromatography (UPLC) uses columns packed with small fully
porous particles (1.7 µm). The smaller particle size results in a higher back-pressure, requiring
specialized pump equipment. As a result of the smaller particle size, the Van Deemter curve is
flattened out, resulting in relative higher separation efficiencies with higher flow rates (Figure
1.3). The lower Height Equivalent of a Theoretical Plate (HETP), the better the separation
efficiency and the column performance is. The physical dimensions (i.e. length and diameter)

9
of a UPLC column are reduced in comparison with a high performance liquid chromatography
(HPLC) column, because of the increase in back-pressure and increased column performance.
This results in a relative smaller sample injection volume during UPLC analysis.
A photodiode array (PDA) detector is coupled to the UPLC equipment. The advantage of
this detector is that the absorbance within a variety of wavelengths are recorded, usually
ranging from 190 nm to 400 nm, resulting in a wavelength spectrum. This spectrum can then be
used for verification of sample identity as well as peak purity verification. As UPLC peak are
generally sharper than HPLC peaks and good chromatographic practices require a minimum of
15 data points per peak, the sampling rate of a PDA detector coupled to UPLC is set higher
(e.g. 20 Hz) then when coupled to HPLC equipment (e.g. 1 Hz) [24].
Figure 1.3: The Van Deemter curve for different particle sizes [25]
The advantages of UPLC over HPLC analysis are the shorter analysis time, the increased
resolution and higher sensitivity [24-26], but instead, nowadays, the system is overall more
costly and less robust.

10
2. OBJECTIVE
In the pharmacy, active pharmaceutical ingredients (API) sub-label claims in
pharmaceutically compounded capsules is already a hot discussion topic during the last few
years. However, no studies were conducted to investigate how much API loss there is, where
this API loss occurs, and what could be the reason or origin for this API loss. The objective of
this research is to answer these raised questions.
This thesis contains an experimental part, where three kinds of capsules will be
pharmaceutically compounded, i.e. hydrocortisone, triamcinolone and dexamethasone,
following the guidelines of TMF. The working area and equipments will be swabbed in order to
discover if an API loss occurs, and if so, to quantitate this loss. Swabbing areas will include
the desk, the capsulation device or gelulier, the measuring cylinder, the weighing device, the
mortar, the pestle, the flexible plastic card and the paper funnel. A UPLC-PDA method will be
used to determine the amount of API present in the capsule and at the swabbed areas and
equipment.
The second part of this thesis uses assay data of 17 different molecules, obtained from the
the internal quality system of the UZ Ghent and from a study examining sub-label claim API
content in capsule (Ringtest 4). These assay results include following variables: (i) molecule
(API), (ii) API concentration, (iii) number of capsules made, (iv) pharmacist and (v)
preparation material (e.g. mortar influence). The assay results of each molecule will be
modeled in function of the molecule structural descriptors, examining if a chemical molecule-
effect on the observed sub-label claim API contents in capsules exists.

11
3. MATERIALS AND METHODS
3.1 CHEMICALS
Methanol (MeOH, HPLC grade) and acetonitrile (ACN, UPLC quality) were obtained
from Fisher Chemical (Loughborough, United Kingdom). Water was purified using a Milli-Q
academic water purification system (Sartorius, Göttingen, Germany), resulting in <18.2
mΩ×cm quality. The API compounds hydrocortisone, triamcinolone and dexamethasone were
obtained from Fagron (Waregem, Belgium) and the excipient diluant B (99.5 % mannitol
powder and 0.5 % anhydrous colloidal siliciumdioxide) was obtained from Université de Liège
(Liège, Belgium). The colorant riboflavin was obtained from C.V. Laboratoria Flandria
(Zwijnaarde, Belgium). Sodium dihydrogen phosphate monohydrate (Merck acs, Darmstadt,
Germany) and di-potassium hydrogen phosphate anhydrous (Panreac Quimica sa, Barcelona,
Spain) were used to make the 10 mM phosphate buffer pH 4.
3.2 MATERIALS AND EQUIPMENTS
Following materials and equipment were used in this thesis:
- Sonification of solutions was done using Branson 2210 (A4 Ultrasone)
- UPLC analysis was done on a Waters Acquity H UPLC Class using a Quaternary
Solvent Manager, a Waters Acquity Sample Manager, combined with a Flow Through
Needle, and a Waters Acquity Performance LC PDA
- Centrifugation of the solutions was done using Eppendorf Centrifuge 5810R at 3220 x
g for 5 minutes at 22°C
- A Mettler Toledo balance (type:X5105DU) was used, with a sensitivity of 0.01 mg
- Finnpipette Thermo Scientific of 100-1000 µL
- Hard gelatin capsules (n°2, yellow) were obtained from Feton (Brussels, Belgium)
- Filter (Whatmann 1, 90 mm Ø, Cat No 1001090)
- HPLC glass vials
- Microscope (Axiostar plus, Zeiss) and a photo camera (Canon, power shot A640)
- Mortar 1 (medium used, section 3.4.3.1) was used in section 3.4.1, 3.4.2, 3.5 and 3.6.

12
3.3 METHODS
3.3.1 UPLC–method and verification
The general UPLC method used an Acquity UPLC BEH C18 (50 x 2.1 mm; 1.7 µm)
analytical column combined with a VanGuardTM
BEH C18 (1.7 µm) guard column. The
column and sample compartment temperatures were set at 30°C (± 3°C) and 10°C (± 3°C),
respectively. The flow rate was set at 0.5 mL/min and the injection volume at 2 µL. PDA
detection (190 - 400 nm) was used combined with a quantification wavelength of 240 nm. A
65/35 H2O/ACN mobile phase mixture was used for hydrocortisone and triamcinolone analysis,
whereas a 65/35 phosphate buffer pH 4 (10 mM)/ACN mobile phase was used for
dexamethasone analysis. A 50/50 H2O/MeOH sample solvent was used for hydrocortisone and
trimacinolone analysis, whereas a 70/30 H2O/MeOH dilution was used for dexamethasone
analysis.
For the method verification, linearity, LOQ and repeatability were investigated. For the
linearity, the concentration and peak area of reference 100%, 90% and 80% were used to
calculate the R2. For LOQ (mg/ml), reference 1% was used. The repeatability was evaluated
based upon independently prepared reference solutions.
3.4 HYDROCORTISONE CAPSULE PREPARATION
3.4.1 Hydrocortisone 10 mg capsules
3.4.1.1 Capsule preparation
Twenty capsules (n°2) containing 10 mg hydrocortisone were prepared according to TMF
[9].
3.4.1.2 Swabbing of working area and equipment + swab sample preparation
The capsulation device, the weighing device, the measuring cylinder, the paper funnel, the
desk and the mortar-pestle-flexible plastic card were swabbed using MeOH wetted cotton. The
swabs were transferred into a 50.0 mL volumetric flask and diluted with methanol to just below
volume. The flasks were sonicated for 5 min, diluted to volume using MeOH after which 10.0
mL was transferred into a 20.0 mL volumetric flask and diluted to just below volume using
H2O. The flasks were sonicated for 5 min and then diluted to volume using H2O. An aliquote
was transferred into a glass HPLC vial.

13
3.4.1.3 Preparation of reference solutions
Three different reference solutions (100%, 90% and 80% label claim) were made. Two 10
fold-dilution series resulting in 10%, 9% and 8% reference solutions and 1%, 0.9%, 0.8%
reference solutions were made. The final concentration of the 100% reference solution was
equal to 0.05 mg/mL hydrocortisone (50/50 MeOH/H2O).
3.4.1.4 Capsule sample preparation
Ten individual capsules, filled with the API powder mixture, were weighed. The capsules
were carefully opened and the powder content transferred into a 50.0 mL volumetric flask. The
emptied capsules were slightly closed, as some residual powder is still present, and were
weighed.
The powder mixture, obtained from the bulk capsule powder, was diluted to volume using
methanol and filtered. Of this filtrate, 25.0 ml was transferred into a 100.0 mL volumetric flask,
50.0 mL H2O was added and MeOH was used to dilute to just below volume. The flasks were
sonicated for 5 min and then diluted to volume using MeOH. An aliquote was transferred into a
glass HPLC vial.
3.4.1.5 Residual capsule sample preparation
The emptied capsules were re-opened and the two halves were carefully transferred into a
10.0 mL volumetric flask and dissolved in methanol. The flask was sonicated for 5 min to
dissolve the residual powder. 1.0 mL was transferred into a 2.0 mL volumetric flask and diluted
to just below volume using H2O. The flasks were sonicated for 5 min and then diluted to
volume using H2O. An aliquote was transferred into a glass HPLC vial.
3.4.2 Hydrocortisone 20 mg capsules
The protocol given in section 3.4.1 is followed. The capsule sample preparation is
corrected for this increase in API content by additional dilution.

14
3.4.3 Mortar influence during hydrocortisone preparation
3.4.3.1 Different mortars
Four different mortars were evaluated. Details about these mortars are given in Table 3.1.
Table 3.1 Materials
Product description Supplier Condition
Mortar 1 HCT West Germany 181/125 Medium used
Mortar 2 Avignon France Porcelain, new, not used
Mortar 3 - Extensively used
Mortar 4 DruQuaR Agate for IR analyses
Pestle Omega pharma Same pestle was used in each preparation
Flexible plastic card - Same card was used in each preparation
3.4.3.2 Capsule preparation
In each mortar, two powder mixtures were prepared corresponding to the preparation of 20
capsules containing 10 and 20 mg hydrocortisone capsules (capsules n°2).
These eight powder mixtures were prepared according to the TMF guidelines. The last step
in which the powder mixture is uniformly distributed over the 20 capsules was not performed.
Here, the powder mixture present in the mortar will be transferred into a beaker instead.
3.4.3.3 Swabbing of working area and equipment + swab sample preparation
The mortar, pestle and flexible plastic card were swabbed using MeOH wetted cotton. The
swabbing of this working equipments and the swab sample preparation are the same as in
section 3.4.1.2. The swabs sample preparations are diluted, so that their final concentrations are
located within the reference solution blocks.
3.4.3.4 Preparation of reference solutions
The preparation of the hydrocortisone reference solutions is the same as in section 3.4.1.3.

15
3.5 TRIAMCINOLONE CAPSULE PREPARATION: 4 MG
The protocol similar to section 3.5 was followed. 20 capsules (n°2) of 4 mg triamcinolone
were made according to TMF [9]. The swabs sample preparations are diluted, so that their final
concentrations are located within the reference solution blocks.
3.6 DEXAMETHASONE CAPSULE PREPARATION: 0.25 MG
Some chromatography anomalies were seen, i.e. wide API peaks and presence of a
shoulder peak next to the main dexamethasone peak, when using the
hydrocortisone/triamcinolone UPLC method for dexamethasone assay. To improve the
chromatographic (UPLC) method, following changes were made: (1) the aqueous mobile phase
part was substituted for a 10 mM phosphate buffer pH 4, (2) the samples were diluted in 30/70
MeOH/H2O and (3) furthermore, it was decided so substitute the old guard column for a new
one. All these three “changes” are part of a good chromatography practices.
3.6.1 Influence of sample solvent and sample solvent strength
When using the hydrocortisone/triamcinolone UPLC method for dexamethasone assay, the
presence of a shoulder peak next to the main dexamethasone peak was noticed, see Figure 3.1.
Figure 3.1: Chromatography anomalies, i.e. wide API peaks and presence of a shoulder peak next
to the main dexamethasone peak (using the hydrocortisone/triamcinolone UPLC method for
dexamethasone assay)

16
To improve the chromatographic (UPLC) method, some changes were made, which results
in a better chromatography, see Figure 3.2.
Figure 3.2: Optimized method: chromatogram obtained using Acquity UPLC BEH C18 (50 × 2.1
mm; 1.7 µm) combined with new guard (lot: 0185302881) (0.003 mg/ml dexamethasone) (70/30
H2O/MeOH, mobile phase 35/65 ACN/10mM phosphate buffer pH 4)
The influence of different sample solvents, i.e. methanol and acetonitrile, on the overall
chromatography was investigated. Moreover, the sample solvent strength was also investigated.
For hydrocortisone and triamcinolone assay, a 50/50 MeOH/H2O sample solvent was used.
However, good chromatographic practices state that a weaker (or equivalent) sample solvent
strength, in comparison to (starting) mobile phase conditions, must be used [27].
Therefore, for dexamethasone assay, a 30/70 MeOH/H2O sample solvent was used. The
robustness of this sample solvent was checked by varying the ratios ± 10% (i.e. 20/80
MeOH/H2O and 40/60 MeOH/H2O).
3.6.2 Preparation of own-made 10%-dexamethasone trituration
3.6.2.1 Protocol 10%-dexamethsanone trituration
Due to the low quantity API needed (5 mg = 0.25 mg x 20), which is under the limit (50
mg), a trituration must be made. The own-made 10%-dexamethasone trituration was prepared
17
according to TMF of a comparable molecule, i.e. fludrocortisones acetate [9]. Following steps
were performed:
1: Weigh the amount of dexamethasone (100 mg), riboflavin (50 mg) and excipient
diluant B (100 mg) separately into a weighing device.
2: Calculate how much excipient diluant B is still required to obtain a 10 % trituration
and weigh this amount separately into a weighing device (1000 mg – x mg
dexamethasone – y mg riboflavin – z mg excipient diluant B).
3: Add 100 mg excipient diluant B in the mortar and crush/ground/mix with a pestle.
4: Add 50 mg riboflavin and mix until a homogeneous color is obtained.
5: Add 100 mg dexamethasone and mix again until a homogeneous color is obtained.
6: Add step by step (in small quantities) the rest of the excipient diluant B. Mix after
each addition to obtain an uniform colored mixture.
7: Weigh the container in which the trituration is to be placed.
8: Bring the content of the mortar in the container and weigh again, thus allowing the
calculation of the total trituration powder amount.
3.6.2.2 Swabbing of working area and equipment + swab sample preparation
The weighing device, the measuring cylinder, the paper funnel, the desk+gloves, the
mortar, pestle and flexible plastic card were swabbed using MeOH wetted cotton. The swabs
were transferred into a volumetric flask. The swabs sample preparations are diluted and the
final concentration concentrations are located within the reference solution blocks.
3.6.2.3 Preparation of reference solutions
Three different reference solutions (100%, 90% and 80%) were made. Then two 10 fold-
dilutions to 10%, 9% and 8% reference solutions and 1%, 0.9%, 0.8% reference solutions were
made. The 100% reference solution was equal to 0.003 mg/mL hydrocortisone (30/70
MeOH/H2O).
3.6.3 Analytical development and pilot recovery experiments
After initial 0.25 mg dexamethasone capsulations experiments (see section 3.6.4), an
unaccountable dexamethasone loss was noticed. Analytical development and pilot recovery
experiments were performed to locate the problem (see Fishbone-diagram in Attachment 1).
The objective was to eliminate the apparent, but yet unexplained, loss in dexamethasone at the

18
0.25 mg capsule preparation, i.e. to explain the inconsistent DEX mass balance. The influence
of the filtration and centrifugation (i.e. test one – three), of the mixing step (i.e. test a - d) and
of the swabbing technique (split-up versus combined) (i.e. test e and f) was evaluated. The
powder mixture (i.e. API and excipients) was representative for the preparation of 20 × 0.25 mg
dexamethasone capsules. An agate mortar and pestle were used.
3.6.3.1 Filter and centrifuge influence
The influence of filtration and centrifugation (5 min, 22°C, 3220 x g) in the sample
preparation on the dexamethasone assay was investigated.
A stock-concentration was made by transferring approximately 50.0 mg dexamethasone
into a 250.0 mL volumetric flask and diluted using methanol to just below volume. The flasks
were sonicated for 5 min, diluted to volume using MeOH.
Test one: Of the stock, 10.0 mL was transferred into a 100.0 mL volumetric flask and
diluted to volume using MeOH. 30.0 mL was transferred into a 100.0 mL volumetric
flask and diluted to just below volume using H2O. The flasks were sonicated for 5 min
and then diluted to volume using H2O. An aliquote was transferred into a glass HPLC
vial.
Test two: Of the stock, 10.0 mL was transferred into a 100.0 mL volumetric flask,
diluted to volume using MeOH and filtered/centrifuged. Of this filtrate/supernate, 30.0
mL was transferred into a 100.0 mL volumetric flask and diluted to just below volume
using H2O. The flasks were sonicated for 5 min and then diluted to volume using H2O.
An aliquote was transferred into a glass HPLC vial.
Test three: Similar to test b, but here an amount of excipient diluant B and riboflavin
was added in the 100.0 mL volumetric flask before filtration/centrifugation to imitate
the powder mixture present in the capsules.
3.6.3.2 Influence mixing step only
Test a: Transfer the trituration directly into a volumetric flask
Approximately 50 mg own-made 10%-dexamethasone trituration was transferred into
a 50.0 mL volumetric flask and dissolved/diluted to volume using MeOH. Then 2.0
mL was transferred into a 20.0 mL volumetric flask, diluted to volume using MeOH
and centrifuged (for 5 min at 22°C, 3220 x g). Of this supernate, 3.0 mL was
19
transferred into a 10.0 mL volumetric flask, diluted to volume using H2O. An aliquote
is transferred into a glass HPLC vial.
Test b: Trituration and excipient diluant B: from weighing device to volumetric flask
(in triplicate)
Approximately 50 mg own-made 10%-dexamethasone trituration was weighed into a
weighing device, which was transferred quantitative into a 50.0 mL volumetric flask.
At the same volumetric flask, the amount excipient diluant B needed for DEX capsule
preparation was added, to imitate the powder mixture present in the capsules. After
this, the weighing device was swabbed and the swabs were brought into the same
volumetric flask as the powder mixture. Following steps are similar to test a.
Test c: Trituration and excipient diluant B: from agaat mortar to volumetric flask
(powder mixture not chrushed/grounded/mixed with a pestle) (in triplicate)
Similar to test b, but here the trituration and excipient diluant B were first brought in
the agaat mortar (no crushing/grounding of the powder mixture) and then quantitative
transferred into a 50.0 mL volumetric flask. The mortar, card, desk and gloves were
swabbed as well and brought into the same volumetric flask as the powder mixture.
Test d: Trituration and excipient diluant B: from agaat mortar to volumetric flask
(powder mixture crushed/grounded/mixed with a pestle) (in triplicate)
Similar to test c, but here the powder mixture was crushed/grounded/ mixed with a
pestle. The pestle was swabbed as well and brought into the same flask as the powder
mixture.
3.6.3.3 Influence swabbing technique
Test e: Everything was brought together in one volumetric flask (different swabs +
powder)
The capsules were prepared following section 3.6.3.1 and the working equipments
were swabbed using MeOH wetted cotton. The different swabs and the powder
mixture was brought into a 50.0 mL volumetric flask. Following steps were similar
test a (section 3.6.3.2).
Test f: The swabs were splitted-up in different volumetric flasks
The capsules were prepared following section 3.6.3.1 and the working equipments
were swabbed using MeOH wetted cotton. The swabs were splitted-up in different
volumetric flasks and the swabs sample preparations are diluted, so that their final

20
concentrations are located within the reference solution blocks. The powder mixture
was transferred into a 50.0 mL volumetric flask and following steps are similar to test
a (section 3.6.3.2).
3.6.4 Dexamethasone 0.25 mg capsules
The capsules will be prepared, using the own-made 10%-dexamethasone trituration
(section 3.6.2) and using the commercial 10%-dexamethasone trituration (Fagron, Waregem,
Belgium).
3.6.4.1 Protocol capsule preparation
Twenty capsules (n°2) of 0.25 mg dexamethasone were prepared according to TMF of a
comparable molecule, i.e. fludrocortisones acetate [9]. Following steps were performed:
1: Weigh the amount of the dexamethasone trituration (5% overdosage is included to
compensate the loss during the preparation) and 1 g of excipient diluant B separately
into a weighing device.
2: Crush/ground/mix the excipient diluant B in the mortar with a pestle.
3: Add step by step the dexamethasone trituration and mix carefully after each
addition.
4: Bring the mixture in a measuring cylinder using a paper funnel, without ramming
the powder, and weigh the measuring cylinder.
5: Add, without ramming, excipient diluant B till calibration volume for capsules n°2
(addition of excipient diluant B q.s. ad 7.4 mL volume) and weigh the measuring
cylinder.
6: Bring the content of the measuring cylinder in the mortar and mix homogeneous.
7: Distribute the mixture uniform over the 20 capsules n°2.
3.6.4.2 Swabbing of working area and equipment + swab sample preparation
The swabbing of the working equipments and the swab sample preparation are the same as
in section 3.6.2.2. Only here the capsulation device was swabbed as well.
3.6.4.3 Preparation of reference solutions
The preparation of the dexamethasone reference solutions is the same as in section 3.6.2.3.

21
3.6.4.4 Capsule sample preparation
First ten individual capsules, filled with the API powder mixture, were weighed. Then the
capsules were very carefully opened and the powder content was transferred into a volumetric
flask. The emptied capsules were slightly closed, as some residual powder is still present and
were weighed. The samples are diluted in 30/70 MeOH/H2O and the final concentration was
approximately 0.003 mg/mL.
3.6.4.5 Residual capsule sample preparation
The emptied capsules were re-opened and the two halves were carefully transferred into a
volumetric flask. The samples are diluted in 30/70 MeOH/H2O and the final concentrations are
located within the reference solution blocks.
3.7 DATAMINING
The molecular structures of the 17 UZ Ghent and Ringtest 4 molecules were downloaded
from a chemical database (www.chemspider.com). These three-dimensional molecular
structures were optimized and used for calculating descriptors. A molecular descriptor is
defined as “the final result of a logic and mathematical procedure which transforms chemical
information encoded within a symbolic representation of a molecule into a useful number or
the result of some standardized experiment”. These descriptors can be used to interpret and
explain experimental data [28]. Structural descriptors are calculated through software and can
be classified into 5 blocks [29]:
- O D-descriptors: constitutional descriptors such as molecular weight and count
descriptors.
- 1 D-descriptors: functional group counts.
- 2 D-descriptors: topological descriptors.
- 3 D-descriptors: geometrical descriptor.
- Other: charge descriptors and molecular properties.
Constant descriptors, i.e. having no discriminating value, were eliminated. Each descriptor-
dataset was also corrected for molecular weight (dividing the individual uncorrected descriptor
values by the molecular weight of the corresponding compound). Finally, a z-score
normalization was performed:
22
In this equation, xi is the value of a data point, xm is the mean and SD is the standard
deviation of the data set. In this way, all descriptors are N (0,1) distributed.
Stepwise multiple linear regression (MLR) was used, each time a more specific descriptor
selection was made. Principal component analysis (PCA) was performed using all descriptors
(n=33) withheld in one or more MLR models. A partial least squares (PLS) model was
constructed, modeling the median assay values in function of the 33 withheld descriptors.
23
4. RESULTS AND DISCUSSION
4.1 METHOD VERIFICATION
The UPLC method used for HC, TRI & DEX assay was found to be linear (R2>0.99).
Repeatability was in compliance with in-house requirements (% RSD 2.67; n=9). Limit of
quantification, i.e. 2.55x10⁻⁵
mg/mL, indicated sufficient sensitivity for our API loss
investigation purposes.
4.2 HYDROCORTISONE
4.2.1 Hydrocortisone 10 mg capsules
4.2.1.1 % label claim capsules
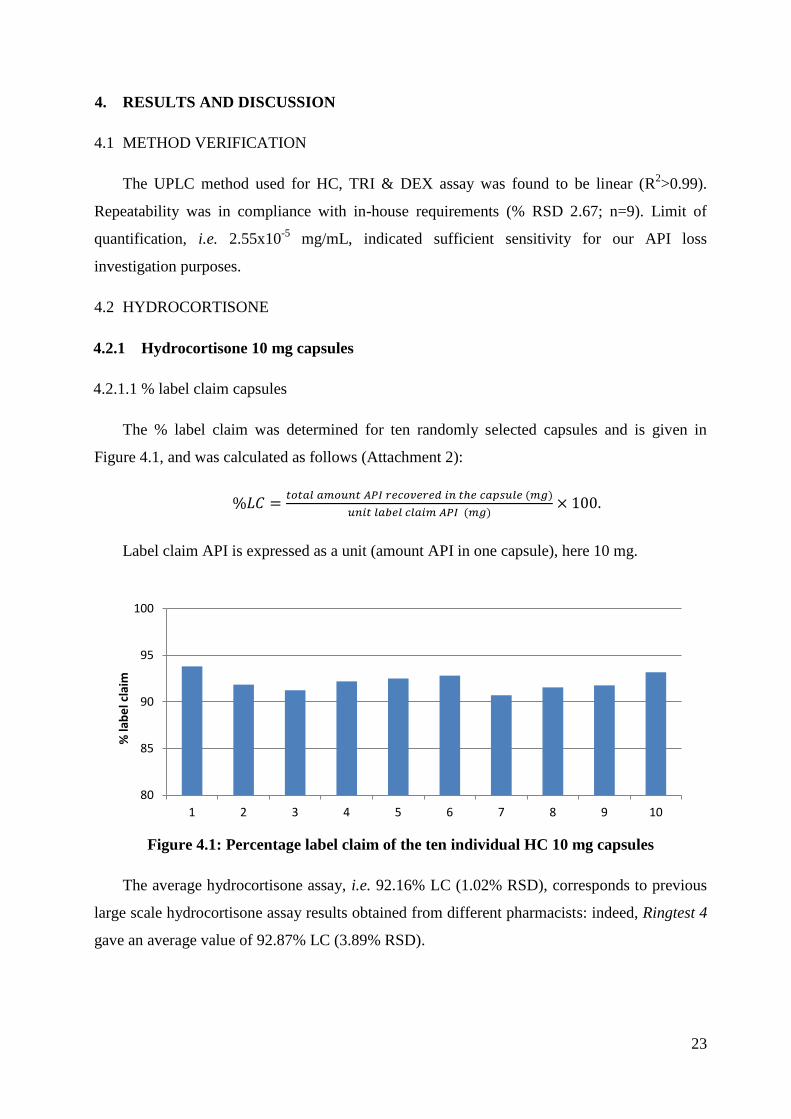
The % label claim was determined for ten randomly selected capsules and is given in
Figure 4.1, and was calculated as follows (Attachment 2):
Label claim API is expressed as a unit (amount API in one capsule), here 10 mg.
Figure 4.1: Percentage label claim of the ten individual HC 10 mg capsules
The average hydrocortisone assay, i.e. 92.16% LC (1.02% RSD), corresponds to previous
large scale hydrocortisone assay results obtained from different pharmacists: indeed, Ringtest 4
gave an average value of 92.87% LC (3.89% RSD).
80
85
90
95
100
1 2 3 4 5 6 7 8 9 10
% la
be
l cla
im

24
4.2.1.2 API mass balance
The total amount of hydrocortisone, recovered in the capsules and swabs is compared to
the hydrocortisone amount initially weighed before capsule preparation. For this, the total
hydrocortisone mass recovered in the 10 capsules was extrapolated to 20 capsule, as 20
capsules were prepared in total. Details regarding this API mass balance are given in Table 4.1.
The % API mass balance is calculated as follows:
.
Here the theoretical amount API is the total amount API initially weighted.
Table 4.1 API mass balance overview (10 mg hydrocortisone capsules)
Description Recovered HC mass (mg) API mass balance (%)1
20 Capsules
Bulk powder HC 181.72 90.01
Residual HC 2.59 1.28
Weighing device 0.85 0.42
Measuring cylinder 0.61 0.30
Mortar, pestle and flexible plastic card 14.10 6.98
Capsulation device 1.02 0.51
Desk 0.04 0.02
Overall 200.93 99.52
1: total amount hydrocortisone initially weighed, i.e. 201.9 mg
A total API mass balance of 99.52% was obtained. From this API mass balance, it can be
seen that the vast majority of the API loss occurs at the mortar, pestle and flexible card. In total,
84.86% of the observed API losses was seen at this step.
4.2.2 Hydrocortisone 20 mg capsules
4.2.2.1 % label claim capsules
The % label claim was determined for ten randomly selected capsules (Attachment 3) and
is given in Figure 4.2.

25
Figure 4.2: Percentage label claim of the ten individual HC 20 mg capsules
The average hydrocortisone assay is 91.97% LC (2.20% RSD).
4.2.2.2 API mass balance
The total amount of hydrocortisone, recovered in the capsules and swabs are compared to
the hydrocortisone amount initially weighed before capsule preparation. Details regarding this
API mass balance are given in Table 4.2.
Table 4.2 API mass balance overview (20 mg hydrocortisone capsules)
Description Recovered HC mass (mg) API mass balance (%)1
20 Capsules
Bulk powder HC 363.19 90.48
Residual HC 4.69 1.17
Weighing device 0.63 0.16
Measuring cylinder 0.49 0.12
Mortar, pestle and flexible plastic card 19.93 4.97
Capsulation device 1.90 0.47
Desk 0.23 0.06
Paper funnel 0.04 0.01
Overall 391.11 97.44
1: total amount hydrocortisone initially weighed, i.e. 401.39 mg
A total API mass balance of 97.44% was obtained. From this API mass balance, it can be
seen that the vast majority of the API loss occurs at the mortar, pestle and flexible card, as was
80
85
90
95
100
1 2 3 4 5 6 7 8 9 10
% la
be
l cla
im

26
also the case with the 10 mg hydrocortisone capsules. In total, 85.80% of the observed API
losses was seen at this step.
4.2.2.3 Comparison of hydrocortisone concentration in bulk and residual powder
In pediatrics and geriatrics, capsules are often opened (i.e. children cannot swallow the
capsules), so the amount API that remains at the capsule surface plays an important role. As
can be seen from previous sections, the global API content inside a capsule was calculated from
(i) the bulk powder (section 3.4.1.4) and from (ii) the residual powder sticking to the inside of
the capsule (section 3.4.1.5). The hydrocortisone concentration in both the individual bulk and
residual powders was calculated in order to detect a specific absorption phenomenon
(Attachment 4). In order to dissolve the residual powder of the individual capsules, the capsules
are immersed in MeOH, rendering the weighing of the capsules after this extraction process
impossible. Therefore, the average weight of 30 empty capsules (i.e. did not came into contact
with powder mixture) was taken as the weight of an empty capsule and was found to be 57.863
mg (RSD:1.57%). The HC concentration in bulk powder and in residual powder (%) is given in
Figure 4.3.
Figure 4.3: HC concentration in bulk powder and residual powder (%)
The average hydrocortisone concentration, in bulk powder is characterized by a very
narrow 95% confidence interval, due to low variability in both hydrocortisone amount
recovered (RSD: 2.16%) as well as the weight of the bulk powder (RSD: 1.67%).
The average hydrocortisone concentration in residual powder has a broader 95%
confidence interval, due to higher variability in both hydrocortisone amount recovered (RSD:
18.38%) as well as the weight of the bulk powder (RSD: 18.81%).
0
2
4
6
8
10
12
HC
co
nce
ntr
atio
n in
(b
ulk
/re
sid
ual
) p
ow
de
r (%
)
HC conc in bulk powder (%) HC conc in residual powder (%) error bar: 95% confidence interval
27
A statistically significant higher hydrocortisone concentration in the bulk powder than in
the residual powder is observed. Thus, those appears to be no selective concentration of
hydrocortisone occurring at the capsule surface. On the contrary, an concentration of
hydrocortisone in the bulk powder is observed, and a concentration of diluents to the capsule
surfaces. The amount API that sticks at the capsule shell (i.e. approximately 1%) is important
for the pediatrics and geriatrics, so they can take that information into account. Our data
indicates that this “loss” is not a specific HC loss but rather a powder-loss.
4.2.3 Concentration effect
The quantification and % API mass balance of 10 mg hydrocortisone capsules versus 20
mg hydrocortisone capsules can be found in Table 4.1 en Table 4.2. Theoretically, the total
powder mixture volume of both preparations should be constant (i.e. 20×0.37 mL), therefore
the hydrocortisone concentration in the 20 mg capsules powder mixture should be two-fold
higher than in the 10 mg capsules powder mixture. The influence of this difference in API
concentration on the different API loss steps is investigated.
If there is no selective hydrocortisone loss/adsorption (20 vs. 10 mg capsules):
recovered hydrocortisone mass (mg) x 2
hydrocortisone mass balance (%) is identical/similar
If there is a selective hydrocortisone loss/adsorption (20 vs. 10 mg capsules):
recovered hydrocortisone mass (mg) differs from x 2
hydrocortisone mass balance (%) differs/is not similar
In order to determine whether a concentration-effect is present at the different loss steps, it
is better to consider the mass balance approach as this already compensates for the different
amounts of hydrocortisone initially weighed.
The amount of API recovered from the 10 and 20 mg capsules (i.e. from bulk +
residual powder), differs by approximately a factor 2 and hence, the % API mass
balance is very similar between both concentrations.
The absolute API mass loss observed at the capsulation device has approximately
doubled and thus the % API mass balance remains the same. Therefore, a
concentration-effect is present at this step: the API mass balance will be approximately
similar for both dosages, hence API loss for 20 mg dosage will be higher.
28
The weighing device does not show this concentration-effect. This can be rationalized
by the fact that only a single area of the weighing device comes into contact with the
API powder, independently of the amount API weighed.
The API loss at the mortar (pestle + flexible plastic card) does not have a direct
proportional relationship to the hydrocortisone dosage increase. The API loss observed
at this step with the 20 mg hydrocortisone powder mixture is only 70.67 % from the
theoretical loss value as extrapolated from the API loss seen with the 10 mg
hydrocortisone powder mixture
). A possible hypothesis for
this observation is that API loss at the mortar surface, which is most likely a physical
phenomenon, see section 4.2.4, can be satisfied by API powder.
The desk area swabbed during the 10 mg hydrocortisone capsules preparation (20×50
cm = 1000 cm²) was approximately 5.5 times smaller than the desk area swabbed in 20
mg hydrocortisone capsules (100×55 cm = 5500 cm²). When taking this difference in
surface area in to account, a similar absolute mass loss is observed on the desk (0.04
mg x 5.5 ~ 0.22 mg).
The paper funnel cannot be compared due to the lack of an paper funnel in the 10 mg
hydrocortisone capsules. However, the loss at this point was very minimal.
The measuring cylinder used in the 10 mg hydrocortisone capsules differs from the
measuring cylinder used in the 20 mg hydrocortisone capsules. So the results of the
measuring cylinder cannot be compared.
4.2.4 Mortar influence
From sections 4.2.1.2 and 4.2.2.2 can be seen that, the largest API loss occurs at the
mortar. Therefore, this mortar variable was investigated further, by comparing four mortars,
differing in mortar material and mortar usage (Attachment 5). The % API mass balances
obtained from the different swabs for each preparation are given in Figure 4.4 and 4.5. For
objectively interpreting these results, a statistic analysis was performed using a chi² goodness-
of-fit test, see Table 4.3.

29
Figure 4.4: Hydrocortisone API mass balance during 10 mg capsule preparation
Figure 4.5: Hydrocortisone API mass balance loss during 20 mg capsule preparation
Table 4.3 Statistical analysis
Description 10 mg HC 20 mg HC
χ2
p-value χ2
p-value
Pestle 0.08 0.995 0.99 0.803
Card 0.15 0.985 0.62 0.891
Mortar 6.08 0.108 20.9 0.00011
Overall 2.55 0.466 12.21 0.00669
Significance level is 0.05. P-values < 0.05 are in bold and underlined.
0
1
2
3
4
5
6
7
8
M4 M2 M1 M3
% H
C m
ass
bal
ance
Overall Card Pestle Mortar
0
1
2
3
4
5
6
7
8
M4 M2 M1 M3
% H
C m
ass
bal
ance
Overall Card Pestle Mortar

30
From these figures, it is clear that significant hydrocortisone API mass loss occurs at the
mortar step. The % API loss at the card and pestle is fairly constant. The variability in overall
% API mass balance is mainly dependent on the mortar.
The results demonstrate that mortar 4 (agate mortar) has the lowest overall API mass
balance and mortar 3 (old mortar) has the highest overall API mass balance. In mortar 2 (new
mortar) the % API loss from the three different swabs (i.e. card, pestle and mortar) are
approximately the same.
The API loss as a function of the mortar (i.e. surface roughness) is given in Figure 4.6.
Figure 4.6: Percentage API loss of the mortar as a function of surface roughness
Two conclusions are made from Figure 4.6. The first conclusion is that the type of material
has an influence on the API mass balance, here the agate mortar has a lower API mass balance
than the porcelain mortar, even a new one. This is probably due to physical differences, but
chemical interactions cannot be ruled out. The second conclusion is that the used state of the
mortar also plays an important role on API loss, here the old, extensively used mortar has
approximately a five times higher API loss than the new, not used mortar. As the type of mortar
material is the same, this difference can only be attributed to a physical phenomenon in which
the powder mixture fills the space of the small scratches on the mortar surface. These scratches
are caused by the friction between pestle and mortar during mixing, in which certain hard
crystalline powders can cause additional stress on the mortar surface.
4.2.5 Suggestion for improvement of hydrocortisone capsule preparations
A suggestion of a new working instruction, which could possible reduce the % loss API
during hydrocortisone capsule preparations is given below:
0
1
2
3
4
5
6
M4 M2 M1 M3
% A
PI l
oss
mo
rtar
10 mg HC 20 mg HC

31
1: Calculate the mass excipient diluant B needed for the calibration volume for 20
capsules n°2 with the help of the density, instead of using a measuring cylinder to
determine the amount excipient diluant B needed for the calibration volume for 20
capsules n°2.
2: Place a paper under the capsulation device and place a paper at the bottom surface
area of the capsulation device on which the bottom part of the capsules are resting, to
catch any lost powder. Distribute the remaining powder mixture from the papers over
the 20 capsules n°2.
4.3 TRIAMCINOLONE
4.3.1 Triamcinolone 4 mg capsules
4.3.1.1 % label claim capsules
The % label claim was determined for ten randomly selected capsules (Attachment 6) and
is given in Figure 4.7.
Figure 4.7: Percentage label claim of the ten individual TRI 4 mg capsules
The average triamcinolone assay, i.e. 96.90% LC (RSD: 2.38%), closely corresponds to
previous large scale triamcinolone assay results obtained from Ringtest 4 (97.0% (RSD:
4.39%)). The average triamcinolone assay value here is higher than the one obtain with
hydrocortisone, although identical compounding materials, e.g. mortar, pestle, etc., were used.
This can possibly be attributed to a molecule specific effect and will be investigated further in
section 4.5.
80
85
90
95
100
105
1 2 3 4 5 6 7 8 9 10
% la
be
l cla
im
32
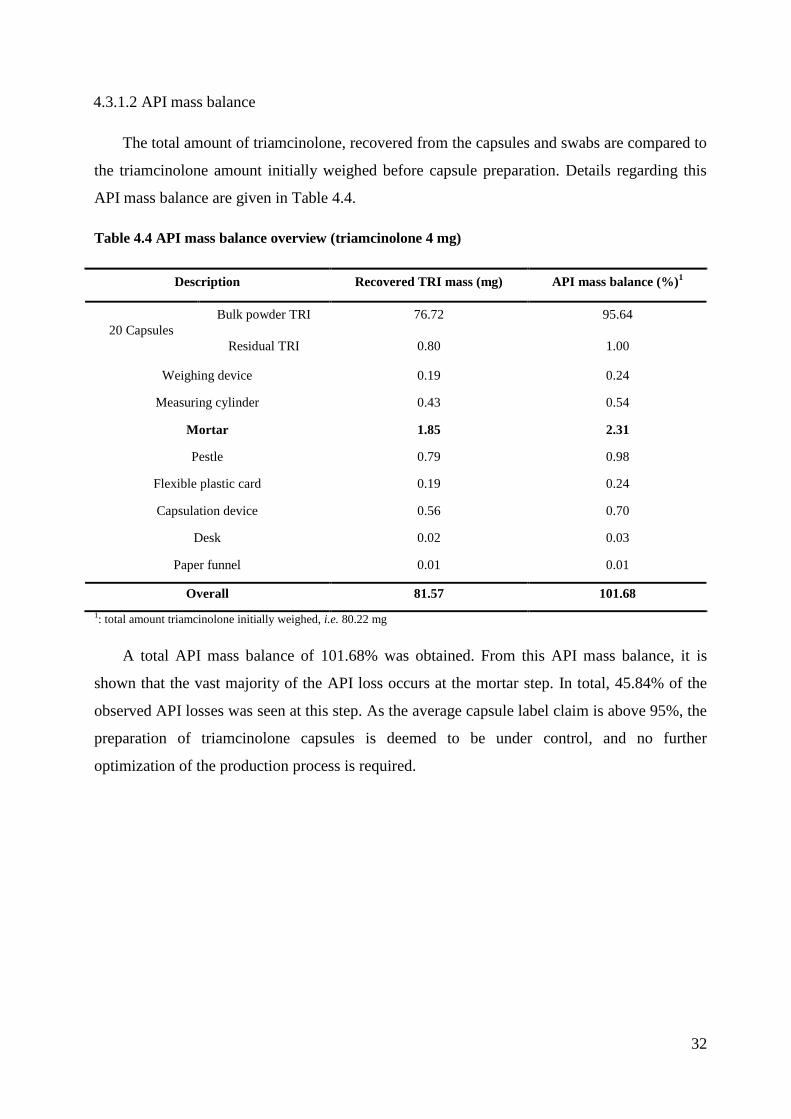
4.3.1.2 API mass balance
The total amount of triamcinolone, recovered from the capsules and swabs are compared to
the triamcinolone amount initially weighed before capsule preparation. Details regarding this
API mass balance are given in Table 4.4.
Table 4.4 API mass balance overview (triamcinolone 4 mg)
Description Recovered TRI mass (mg) API mass balance (%)1
20 Capsules
Bulk powder TRI 76.72 95.64
Residual TRI 0.80 1.00
Weighing device 0.19 0.24
Measuring cylinder 0.43 0.54
Mortar 1.85 2.31
Pestle 0.79 0.98
Flexible plastic card 0.19 0.24
Capsulation device 0.56 0.70
Desk 0.02 0.03
Paper funnel 0.01 0.01
Overall 81.57 101.68
1: total amount triamcinolone initially weighed, i.e. 80.22 mg
A total API mass balance of 101.68% was obtained. From this API mass balance, it is
shown that the vast majority of the API loss occurs at the mortar step. In total, 45.84% of the
observed API losses was seen at this step. As the average capsule label claim is above 95%, the
preparation of triamcinolone capsules is deemed to be under control, and no further
optimization of the production process is required.

33
4.4 DEXAMETHASONE
4.4.1 Own-made 10%-dexamethasone trituration
4.4.1.1 Dexamethasone content in own-made trituration
The dexamethasone content of the own-made trituration is given in Table 4.5. The % m/m
of the own-made dexamethasone triuration is calculated as follows:
Table 4.5: Dexamethasone content in the own-made trituration
# 10%-DEX trituration weighed (mg) DEX content (mg) (experimental) % (m/m)
1 50.35 5.07 10.08
2 50.75 4.98 9.81
3 50.56 5.07 10.03
Average 9.97
Stdev 0.14
%RSD 1.42
The mean dexamethasone concentration of the own-made trituration (n=3) is calculated to
be 9.97% (m/m).
4.4.1.2 Swabs dexametasone content and % API mass balance
The dexamethasone content in the different swabs (section 3.6.2.2) are given in Table 4.6.
The dexamethasone present in the trituration (mg) is calculated as follows:
.
The powder mass balance (%) is calculated as follows:
.

34
Table 4.6 % API mass balance (10% self made dexamethasone trituration)
Swab # Description Recovered DEX content (mg) % API mass balance1
1 Weighing device 0.77 0.15
2 Mortar 10.84 2.17
3 Pestle 6.09 1.22
4 Flexible plastic card 1.93 0.39
5 Desk + gloves 1.67 0.33
6 Trituration 492.16 98.45
Total 513.47 102.72
1: the total amount dexamethasone initially weighed. i.e. 499.89 mg
From these results, it is clear that the largest dexamethasone API mass loss occurs at the
mortar. A total API mass balance of 102.72% was obtained.
A powder mass balance of the 98.70% was found for the own-made 10%-dexamethasone
trituration, indicating limited losses of the overall powder mixture during the different
preparation steps.
4.4.2 Analytical development and pilot recovery experiments
4.4.2.1 Sample solvent strength influence
The influence of the different sample solvents and strengths, were evaluated based upon
the ratio of the small shoulder peak and large dexamethasone API peak. However, no statistical
significant effect could be seen for the use of different sample solvents and strengths, hereby
demonstrating the robustness of the sample solvent in dexamethasone assay method.
4.4.2.2 Filter and centrifuge influence
To investigate any additional API losses, which could explain the previously observed low
dexamethasone mass balance, the filter and centrifuge influence was investigated. The
influence of filtering or centrifuging the dexamethasone sample preparation is given in Table
4.7.
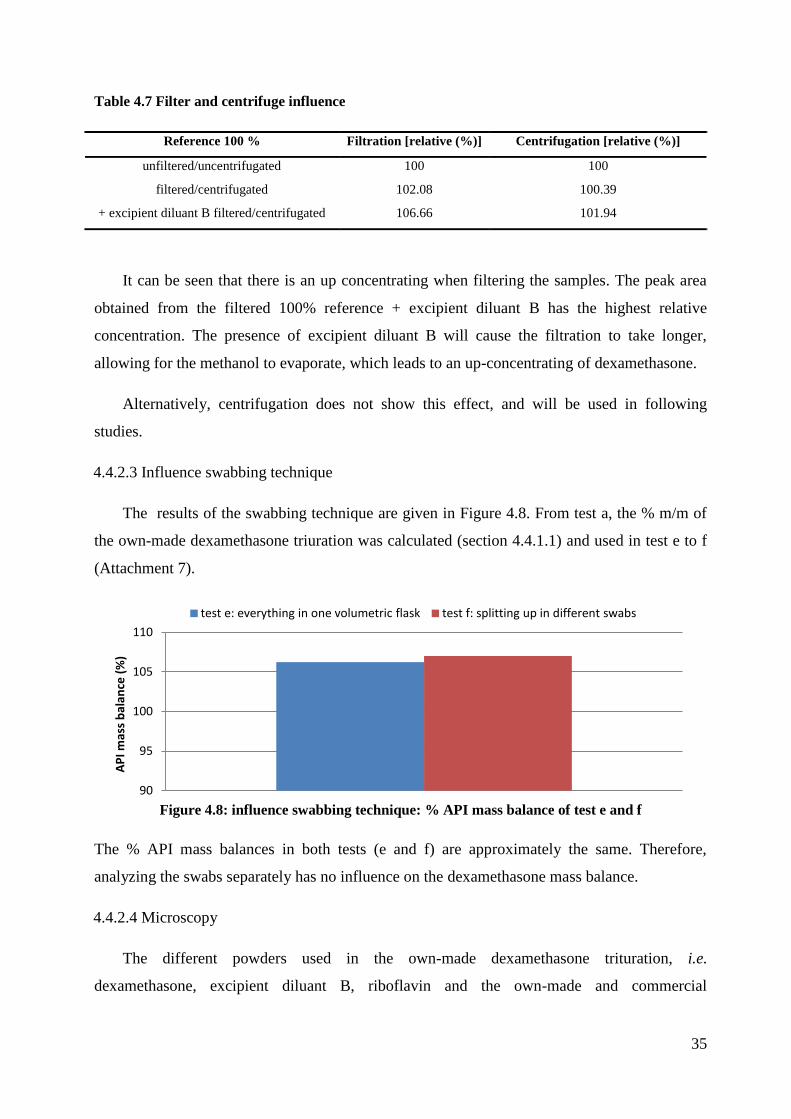
35
Table 4.7 Filter and centrifuge influence
Reference 100 % Filtration [relative (%)] Centrifugation [relative (%)]
unfiltered/uncentrifugated 100 100
filtered/centrifugated 102.08 100.39
+ excipient diluant B filtered/centrifugated 106.66 101.94
It can be seen that there is an up concentrating when filtering the samples. The peak area
obtained from the filtered 100% reference + excipient diluant B has the highest relative
concentration. The presence of excipient diluant B will cause the filtration to take longer,
allowing for the methanol to evaporate, which leads to an up-concentrating of dexamethasone.
Alternatively, centrifugation does not show this effect, and will be used in following
studies.
4.4.2.3 Influence swabbing technique
The results of the swabbing technique are given in Figure 4.8. From test a, the % m/m of
the own-made dexamethasone triuration was calculated (section 4.4.1.1) and used in test e to f
(Attachment 7).
Figure 4.8: influence swabbing technique: % API mass balance of test e and f
The % API mass balances in both tests (e and f) are approximately the same. Therefore,
analyzing the swabs separately has no influence on the dexamethasone mass balance.
4.4.2.4 Microscopy
The different powders used in the own-made dexamethasone trituration, i.e.
dexamethasone, excipient diluant B, riboflavin and the own-made and commercial
90
95
100
105
110
AP
I mas
s b
alan
ce (
%)
test e: everything in one volumetric flask test f: splitting up in different swabs
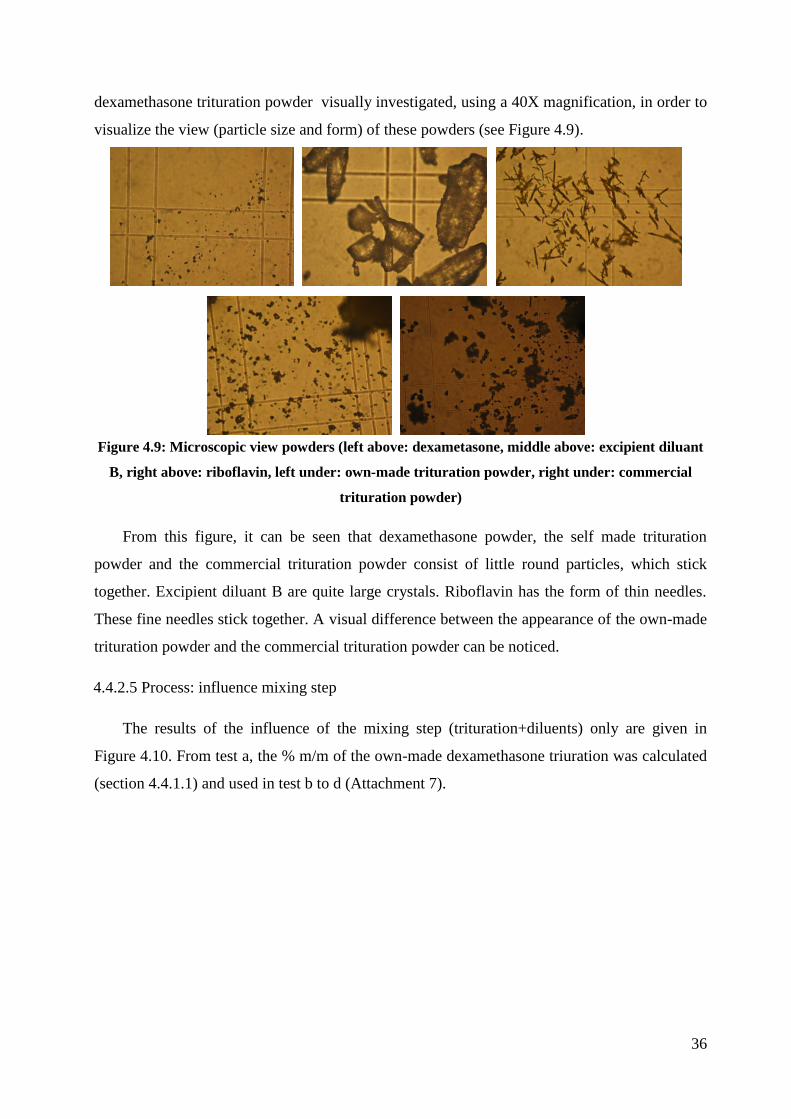
36
dexamethasone trituration powder visually investigated, using a 40X magnification, in order to
visualize the view (particle size and form) of these powders (see Figure 4.9).
Figure 4.9: Microscopic view powders (left above: dexametasone, middle above: excipient diluant
B, right above: riboflavin, left under: own-made trituration powder, right under: commercial
trituration powder)
From this figure, it can be seen that dexamethasone powder, the self made trituration
powder and the commercial trituration powder consist of little round particles, which stick
together. Excipient diluant B are quite large crystals. Riboflavin has the form of thin needles.
These fine needles stick together. A visual difference between the appearance of the own-made
trituration powder and the commercial trituration powder can be noticed.
4.4.2.5 Process: influence mixing step
The results of the influence of the mixing step (trituration+diluents) only are given in
Figure 4.10. From test a, the % m/m of the own-made dexamethasone triuration was calculated
(section 4.4.1.1) and used in test b to d (Attachment 7).

37
Figure 4.10: influence mixing step only: % API mass balance of test b, c and d
From these results, it’s clear that no significant API loss occurs when mixing
dexamethasone and the excipients.
These experiments evaluated the presence of untraceable dexamethasone loss during
capsule preparation. No such untraceable API loss was observed during the different steps in
the capsule preparation process. So the 0.25 mg dexamethasone capsules were prepared.
4.4.3 Dexamethasone 0.25 mg capsules using 10% own-made trituration
4.4.3.1 % label claim capsules (own-made trituration)
The % label claim was determined for ten randomly selected capsules (Attachment 8) and
is given in Figure 4.11.
Figure 4.11: Percentage label claim of the ten individual DEX 0.25 mg capsules (own-made
trituration)
100
101
102
103
104
105
106
AP
I mas
s b
alan
ce (
%)
test b: trit + exc dil B ( from weiging device to volumetric flask)
test c: trit + exc dil B (from agaat mortar to volumetric flask, no mixing with a pestle)
test d: trit + exc dil B (from agaat mortar to volumetric flask, mixing with a pestle)
error bar: 95% CI
80
85
90
95
100
105
1 2 3 4 5 6 7 8 9 10
% la
be
l cla
im

38
The average dexamethasone assay, i.e. 98.00% LC (RSD: 1.74%), does not correspond to
previous large scale dexamethasone assay results obtained from Ringtest 4 (88.93% (RSD:
8.47%)). Furthermore, the 98.00% LC result underlines the importance of the dexamethasone
over-dosing step, as stipulated by TMF guidelines (section 3.6.4.1), in order to obtain capsules
containing the required API amount.
In a parallel study within Ringtest 4, a commercially available dexamethasone trituration
(10% m/m) was used, resulting in significantly better and less variable dexamethasone assay
results (96.87% (RSD: 4.16%)). The 0.25 mg dexamethasone capsules will be prepared using a
commercial trituration (section 4.4.4), so the obtained results can be compared with the results
of Ringtest 4.
4.4.3.2 API mass balance (own-made trituration)
The total amount of dexamethasone, recovered in the capsules and swabs are compared to
the dexamethasone amount initially weighed before capsule preparation. Details regarding this
API mass balance are given in Table 4.8.
Table 4.8 API mass balance overview (own-made trituration)
Description Recovered DEX mass (mg) API mass balance (%)1
20 capsules
Bulk powder DEX 4.85 89.91
Residual DEX 0.0482 0.89
Weighing device 0.0530 0.98
Measuring cylinder 0.0175 0.32
Mortar 0.2052 3.80
Pestle 0.0586 1.09
Flexible plastic card 0.0067 0.13
Capsulation device 0.0202 0.37
Desk + gloves 0.0019 0.03
Paper funnel 0.0003 0.01
Overall 5.2632 97.54
1: total amount dexamethasone initially weighed, i.e. 5.40 mg
A total API mass balance of 97.54% was obtained. From this API mass balance, it is
confirmed that the vast majority of the API loss occurs in or at the mortar. In total, 56.47% of
the observed API losses was seen at this step.
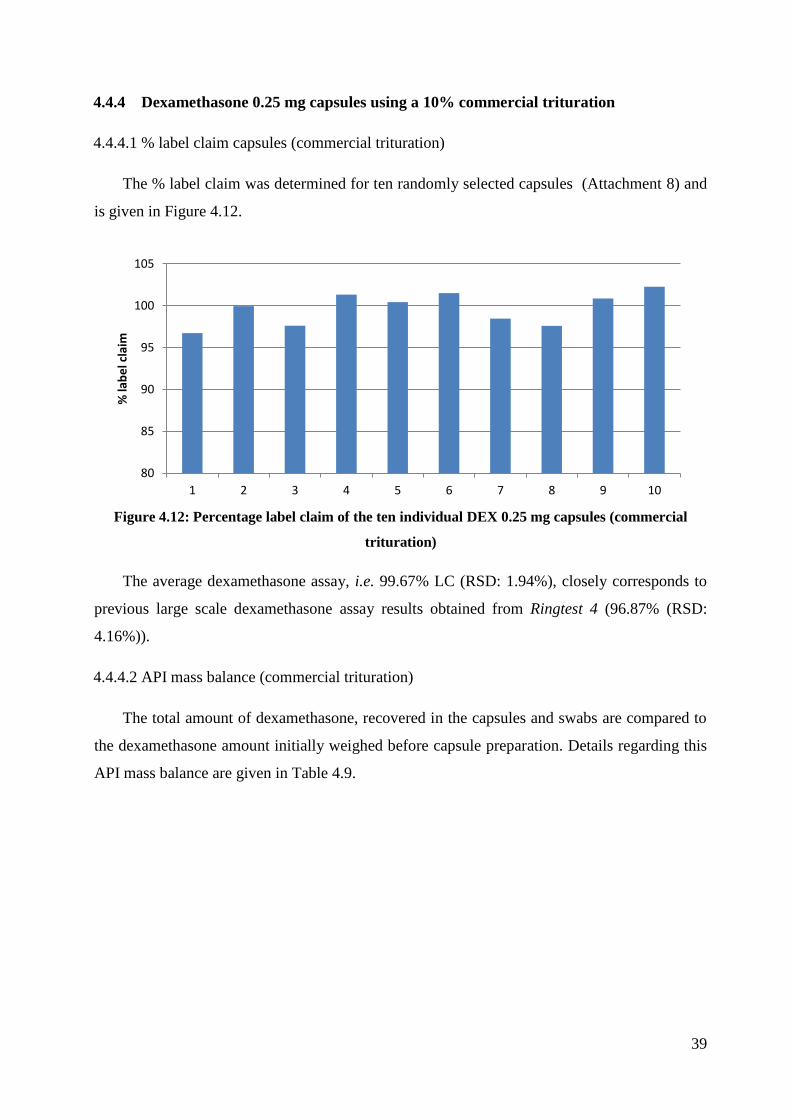
39
4.4.4 Dexamethasone 0.25 mg capsules using a 10% commercial trituration
4.4.4.1 % label claim capsules (commercial trituration)
The % label claim was determined for ten randomly selected capsules (Attachment 8) and
is given in Figure 4.12.
Figure 4.12: Percentage label claim of the ten individual DEX 0.25 mg capsules (commercial
trituration)
The average dexamethasone assay, i.e. 99.67% LC (RSD: 1.94%), closely corresponds to
previous large scale dexamethasone assay results obtained from Ringtest 4 (96.87% (RSD:
4.16%)).
4.4.4.2 API mass balance (commercial trituration)
The total amount of dexamethasone, recovered in the capsules and swabs are compared to
the dexamethasone amount initially weighed before capsule preparation. Details regarding this
API mass balance are given in Table 4.9.
80
85
90
95
100
105
1 2 3 4 5 6 7 8 9 10
% la
be
l cla
im

40
Table 4.9. API mass balance overview (commercial trituration)
Description Recovered DEX mass (mg) API mass balance (%)1
20 capsules
Bulk powder DEX 4.92 91.12
Residual DEX 0.0646 1.20
Weighing device 0.0669 1.24
Measuring cylinder 0.0135 0.25
Mortar 0.1616 2.99
Pestle 0.0464 0.86
Flexible plastic card 0.0176 0.33
Capsulation device 0.0117 0.22
Desk + gloves 0.0022 0.04
Paper funnel 0.0015 0.03
Overall 5.30 98.27
1: total amount dexamethasone initially weighed, i.e. 5.40 mg
A total API mass balance of 98.27% was obtained. From this API mass balance, it can be
seen that the vast majority of the API loss occurs in or at the mortar. In total, 50.28% of the
observed API losses was seen at this step.
4.4.5 Comparison of the own-made and commercial trituration
Results the own-made trituration (section 4.4.3) and the results of the commercial
trituration (section 4.4.4) were compared.
Using a commercial trituration gave reasonable capsule assay values (99.67% LC), which
corresponds with the results obtained with the own-made trituration (98.00% LC). The loss
distribution of the swabs are given in Figure 4.13.

41
Figure 4.13: Loss distribution (left: own-made trituration and right: commercial trituration)
From Figure 4.13, it is clear that the loss distribution of the swabs in both triturations
(own-made and commercial) are similar. So no difference was noticed between the own-made
and commercial trituration.
4.5 INFLUENCE OF CHEMICAL STRUCTURE (DATAMINING)
4.5.1 Data
The data distribution of the assay results obtained with 17 different compounds were
investigated. In the Ringtest 4 study, certain preparations contain an overdose of API, therefore
a correction is made to these assay results. In order to eliminate other influences on the API
loss (e.g. mortar, API concentration, etc.), the median of the assay results for each molecule
was taken. This representative value will be modeled in function of the molecule’s descriptors.
A global overview of the 17 median assay values is given in Figure 4.14. Median values below
95% are indicted in red.
0,03
3,80
1,09
0,13
0,37
0,32
0,98 0,01 0,04
2,99
0,86
0,33
0,22
0,25
1,24
0,03 Desk + gloves
Mortar
Pestle
Card
Capsulation device Measuring cilinder Weighing device Paper funnel
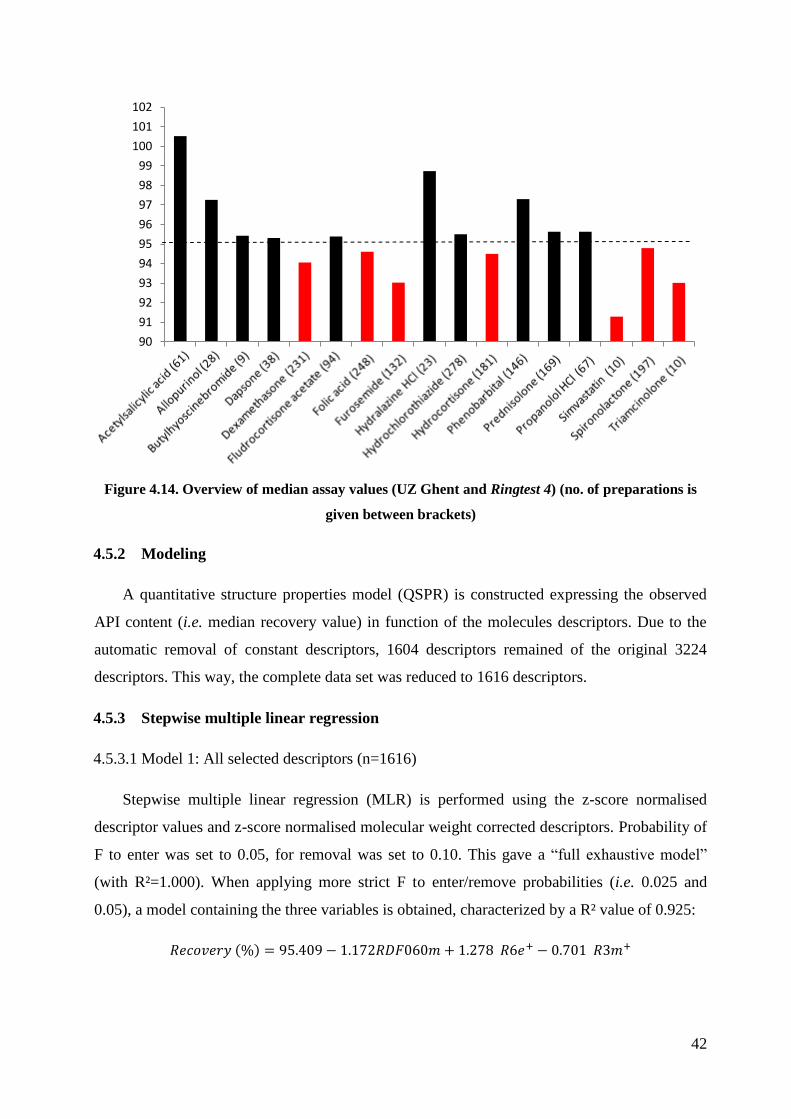
42
Figure 4.14. Overview of median assay values (UZ Ghent and Ringtest 4) (no. of preparations is
given between brackets)
4.5.2 Modeling
A quantitative structure properties model (QSPR) is constructed expressing the observed
API content (i.e. median recovery value) in function of the molecules descriptors. Due to the
automatic removal of constant descriptors, 1604 descriptors remained of the original 3224
descriptors. This way, the complete data set was reduced to 1616 descriptors.
4.5.3 Stepwise multiple linear regression
4.5.3.1 Model 1: All selected descriptors (n=1616)
Stepwise multiple linear regression (MLR) is performed using the z-score normalised
descriptor values and z-score normalised molecular weight corrected descriptors. Probability of
F to enter was set to 0.05, for removal was set to 0.10. This gave a “full exhaustive model”
(with R²=1.000). When applying more strict F to enter/remove probabilities (i.e. 0.025 and
0.05), a model containing the three variables is obtained, characterized by a R² value of 0.925:
90
91
92
93
94
95
96
97
98
99
100
101
102

43
The summary of this model output (enter/removal: 0.025 and 0.05) is given Attachment 9.
This smaller model includes the RDF060m descriptor which was removed during the
construction of the first model (obtained with standard 0.05/0.10 F probability settings).
However, RDF085m was a relatively important descriptor in the “full-model”, with a similar
sign of coefficient (negative) and the highest standardized coefficient value i.e. -1.025. The
magnitude of the RDF060m coefficient is different from RDF085m coefficient, i.e. -1.172 vs. -
2.239. The R6e+ and R3m+ descriptors were also included within the full exhaustive model,
with similar coefficient signs and magnitude as in the smaller model. Descriptor explanation:
Radial distribution Function (RDF): “These descriptors are based on the distance
distribution in the geometrical representation of a molecule and constitute a radial
distribution function code that shows certain characteristics. The RDF in this form is
independent of the number of atoms (i.e. molecule size), unique regarding the 3D
arrangement of the entire molecule and invariant against translation and rotation of the
entire molecule” [30].
- RDF060m: Radial Distribution Function - 6.0 / weighted by atomic masses
- RDF085m: Radial Distribution Function - 8.5 / weighted by atomic masses
R-GETAWAY Autocorrelation descriptors (R): “This descriptor is based on spatial
autocorrelation formulas which weight the molecule atoms in such a way as to account for
atomic mass, polarizability, van der Waals volume, and electronegativity together with 3D
information encoded by the elements of the molecular influence/distance”[30].
- R6e+: R maximal autocorrelation of lag 6 / weighted by atomic Sanderson electro
negativities
- R3m+: R maximal autocorrelation of lag 3 / weighted by atomic masses
4.5.3.2 Model 2: selected descriptor groups (n=355)
A number of descriptor groups were selected. The summary of the model output is given in
attachment 10. The obtained model variables still cannot be directly related to a structural
characteristic of the molecule. A more selective descriptor screening is performed next.
4.5.3.3 Model 3: selected descriptors (n=55)
A number of descriptors, focusing on van der Waals interactions, polarity, dipole
influences and electrostatic descriptors, were selected. Summary of the obtained model is given
in Attachment 11.

44
4.5.4 Principal component analysis (PCA)
PCA was performed using all descriptors (n=33) withheld in one or more MLR models.
Explanatory R² values of the three PC are: 48.13%, 13.45% and 9.62%, respectively, or a
cumulative value of 71.20%. A PLS model was constructed, modeling the median assay values
in function of the 33 withheld descriptors. Score and loading plots are given in Attachment 12.
Explanatory and predictive R² and Q² values are given in Attachment 13. Clearly, the PLS
model indicates a strong influence of RDF060m and RDF085m, meaning the presence of heavy
(mass) atoms at a spherical distance of 6.0 Å and 8.5 Å from the geometrical centre of each
molecule. In general, higher RDF060m and RDF085m values are linked to compounds with
lower median recovery values. On the other hand, a higher hydration energy, i.e. energy
released when dissolving the compound in water, has a positive effect on the median assay
values. The hydration energy, combined with the lattice energy, determines whether or not a
compound dissolves in water (dissolves if hydration energy > lattice energy).
4.5.5 Discussion of models
One way ANOVA analysis of the individual molecule assay sets reveal a statistically
significant difference between the individual mean assay values of the 17 different molecules
(Attachment 14). By using the median of the complete assay data set for each molecule, an
assumption was made that other variables, including mortar condition at moment of use, are
smoothed out and that this is the best centrality estimate for the different data sets. Under this
assumption, this observed difference between the molecules mean assay values can only be
attributed to intrinsic molecule properties (be it chemical or physical). Post-hoc Tukey-Kramer
analysis of the ANOVA results indicates which molecules mean assay values differ statistically
significantly. A summary of the results are given in Attachment 14.
The obtained stepwise MLR model explains approximately 92.5% of the observed API
recovery variability within the 17 molecule data set. The obtained PCA model has a
comparable R² value of 0.95 and is described by 3 principal components. Both models indicate
that it is possible to model the 17 median assay values in function of intrinsic chemical
properties using only a limited set of factors. An overall average recovery of 95% is deduced
from the intercept of the model. The inter-molecule assay variability’s were compared using
homogeneity of variance test, i.e. Levene’s test (variance calculated relative to the mean value)
and Brown-Forsythe test (variance calculated relative to the median value). Both tests found
that the assay variability between the different molecules assay sets differs statistically
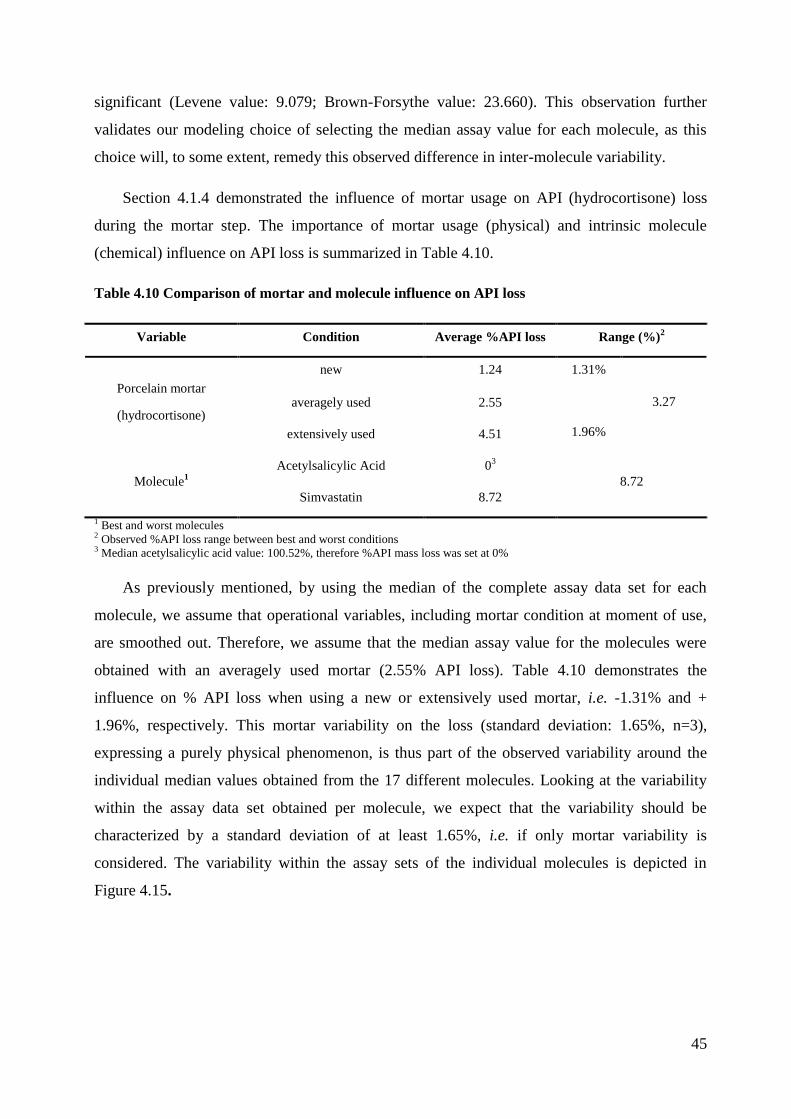
45
significant (Levene value: 9.079; Brown-Forsythe value: 23.660). This observation further
validates our modeling choice of selecting the median assay value for each molecule, as this
choice will, to some extent, remedy this observed difference in inter-molecule variability.
Section 4.1.4 demonstrated the influence of mortar usage on API (hydrocortisone) loss
during the mortar step. The importance of mortar usage (physical) and intrinsic molecule
(chemical) influence on API loss is summarized in Table 4.10.
Table 4.10 Comparison of mortar and molecule influence on API loss
Variable Condition Average %API loss Range (%)2
Porcelain mortar
(hydrocortisone)
new 1.24 1.31%
3.27 averagely used 2.55
1.96% extensively used 4.51
Molecule1
Acetylsalicylic Acid 03
8.72
Simvastatin 8.72
1 Best and worst molecules 2 Observed %API loss range between best and worst conditions 3 Median acetylsalicylic acid value: 100.52%, therefore %API mass loss was set at 0%
As previously mentioned, by using the median of the complete assay data set for each
molecule, we assume that operational variables, including mortar condition at moment of use,
are smoothed out. Therefore, we assume that the median assay value for the molecules were
obtained with an averagely used mortar (2.55% API loss). Table 4.10 demonstrates the
influence on % API loss when using a new or extensively used mortar, i.e. -1.31% and +
1.96%, respectively. This mortar variability on the loss (standard deviation: 1.65%, n=3),
expressing a purely physical phenomenon, is thus part of the observed variability around the
individual median values obtained from the 17 different molecules. Looking at the variability
within the assay data set obtained per molecule, we expect that the variability should be
characterized by a standard deviation of at least 1.65%, i.e. if only mortar variability is
considered. The variability within the assay sets of the individual molecules is depicted in
Figure 4.15.

46
Figure 4.15 Variability (as standard deviation) within individual molecule assay data (no. of
preparations is given between brackets – dashed line: mortar variability)
From this, it is clear that the expected mortar variability is indeed present within each of
the individual assay data sets of the 17 molecules. However, statistical analysis of the mortar
variance and the individual variances of the 17 molecules, only indicate a statistically
significant difference for fludrocortisone acetate (Levene’s test). This additional variability can
be attributed to other operational factors, and gives an indication of the molecules robustness
towards these operational factors. The larger the variability, the more sensitive the compound is
for these operational variables. Some examples of operational variables are no. of preparations
(n), mortar condition, API concentration, no. of capsules produced, personnel, capsulation
device.
4.6 FUTURE PERSPECTIVES
Estimation of the mortar condition (scratches, surface roughness,...). So that this
critical parameter can be kept under control. This should be preferably a single and
semi-qualitative limit test.
It would be interesting to investigate other variables as well, for example the
capsulation device (plastic and metal). In order to see if there is an influence on the
API loss. It might be that lower quality equipment would give lower recoveries.
0
1
2
3
4
5
6
7
8
9
10 St
and
ard
de
viat
ion
(%
)

47
5. CONCLUSION
The experimental part of this study confirms that there is an API loss present during the
capsule preparation. Of the three capsule preparations, hydrocortisone gave a loss of API assay
in the final capsules. The % label claim of hydrocortisone (±92%) was lower compared to the
% label claim of triamcinolone (±97%) and dexamethasone (±98%). For each of the three
molecules (hydrocortisone, triamcinolone and dexamethasone), the highest API loss was seen
at the mortar step (approximately 6.98% loss (HC), 2.31% loss (TRI) and 3.80% loss (DEX)).
Due to this observation, the mortar was investigated separately, using hydrocortisone as API.
From this study, a important role of the type of material and the used state of the mortar on API
loss was noticed. Two conclusions could be drawn from this experiment. First, use of the agate
mortar results in a lower API loss when compared to using a porcelain mortar. Secondly, the
older/more used the mortar becomes, the higher the API loss will be. Another interesting result
was that there was no concentration of the amount API at the capsule shell (approximately 1%),
which is important for the pediatric field. No difference between the own-made and
commercial dexamethasone trituration was noticed.
The influence of intrinsic molecular properties on the API loss observed during capsule
preparations was investigated using a dataset of 17 molecules, obtained from UZ Ghent and
from a previous ringtest study. Median assay values for the 17 molecules were calculated,
effectively smoothing out other variables during the capsule production process. ANOVA
analysis demonstrated the presence of a molecule (chemical) effect on the median assay values.
This molecule effect was modeled, by expressing the 17 median assay values in function of
corresponding molecular descriptors, using stepwise MLR and PCA techniques. The obtained
MLR model, containing 3 variables (RDF060m, R6e+ and R3m
+) explained 92.5% of the
observed % API loss variability, whereas the PCA model explained 95%.
Future research efforts are needed to improve the API loss during capsule preparation, i.e.
to decrease the loss as well as its variability.

48
6. REFERENCES
1. Art. 1 van de Belgische Wet van 25 maart 1964 op de geneesmiddelen.
2. Buren, C.v., Een korte geschiedenis van tweehonderd jaar geneesmiddelen en
apothekers. 2007.
3. Mignani, S., et al., Expand classical drug administration ways by emerging routes using
dendrimer drug delivery systems: A concise overview. Advanced Drug Delivery
Reviews, 2013.
4. Mrsny, R.J., Oral drug delivery research in Europe. Journal of Controlled Release,
2012. 161(2): p. 247-253.
5. Isha, C., et al., Oral sustained release drug delivery system: an overview. International
Research Journal of Pharmacy, 2012. 3(5): p. p. 57-62.
6. Merck Manual Medisch Handboek. 2 ed. 2005. 1970.
7. Elling, H., Inleiding in de farmacotherapie. 2009: Bohn Stafleu van Loghum.
8. European Pharmacopoeia 7th edition.
9. Therapeutisch Magistraal Formularium. uitgave 2010 ed.
10. Pharmaceutical Capsules. second ed. 288.
11. Al-Tabakha, M.M., HPMC Capsules: Current Status and Future Prospects. Journal of
Pharmacy and Pharmaceutical Sciences, 2010. 13(3): p. 428-442.
12. Cole, E.T., D. Cad, and H. Benameur, Challenges and opportunities in the
encapsulation of liquid and semi-solid formulations into capsules for oral
administration. Advanced Drug Delivery Reviews, 2008. 60(6): p. 747-756.
13. The Chicago Tylenol Murders. Available from: http://historicmysteries.com/the-
chicago-tylenol-murders/ (10-4-2013)
14. Magistrale bereidingen, in Test Gezondheid. December 2010/ Januari 2011. p. 18-22.
15. Arseus Haalt dit jaar 80 % omzet uit eigen merken, in De Gids voor de Beste Belegger.
Maart 2013. p. 26-31.
16. Capehart, K.D., A Laboratory Exercise in Capsule Making. American Journal of
Pharmaceutical Education, 2008. 72(5).
17. Pifferi, G., P. Santoro, and M. Pedrani, Quality and functionality of excipients.
Farmaco, 1999. 54(1-2): p. 1-14.
18. Sudah, O.S., et al., Mixing of cohesive pharmaceutical formulations in tote (bin)
blenders. Drug Dev Ind Pharm, 2002. 28(8): p. 905-18.

49
19. Bauman, I., D. Curic, and M. Boban, Mixing of solids in different mixing devices.
Sadhana-Academy Proceedings in Engineering Sciences, 2008. 33(6): p. 721-731.
20. Marshall, S.J., et al., A review of adhesion science. Dent Mater. 26(2): p. e11-6.
21. Susana, L., P. Canu, and A.C. Santomaso, Development and characterization of a new
thief sampling device for cohesive powders. International Journal of Pharmaceutics,
2011. 416(1): p. 260-267.
22. van der Velden, V.H., Glucocorticoids: mechanisms of action and anti-inflammatory
potential in asthma. Mediators Inflamm, 1998. 7(4): p. 229-37.
23. Cirillo, N., et al., Characterization of a novel oral glucocorticoid system and its
possible role in disease. J Dent Res. 91(1): p. 97-103.
24. Yanamandra, R., et al., A New Rapid and Sensitive Stability-Indicating UPLC Assay
Method for Tolterodine Tartrate: Application in Pharmaceuticals, Human Plasma and
Urine Samples. Sci Pharm. 80(1): p. 101-14.
25. Novakova, L., L. Matysova, and P. Solich, Advantages of application of UPLC in
pharmaceutical analysis. Talanta, 2006. 68(3): p. 908-918.
26. Wren, S.A.C., Peak capacity in gradient ultra performance liquid chromatography
(UPLC). Journal of Pharmaceutical and Biomedical Analysis, 2005. 38(2): p. 337-343.
27. Boonen, J., et al., A critical quality parameter in quantitative fused-core
chromatography: The injection volume. Journal of Pharmaceutical Analysis, (0).
28. What is a molecular descriptor. Available from:
http://www.moleculardescriptors.eu/tutorials/what_is.htm (23-4-2013).
29. Baert, B., et al., Transdermal penetration behaviour of drugs: CART-clustering, QSPR
and selection of model compounds. Bioorg Med Chem, 2007. 15(22): p. 6943-55.
30. Todeschini, R. and V. Consonni, Descriptors from Molecular Geometry, in Handbook
of Chemoinformatics. 2008, Wiley-VCH Verlag GmbH. p. 1004-1033.
Knowledge based on:
- Course Artsenijbereidkunde (prof C. Vervaet)
- Course Instrumentele Analytische Chemie (prof L. Thienpont)
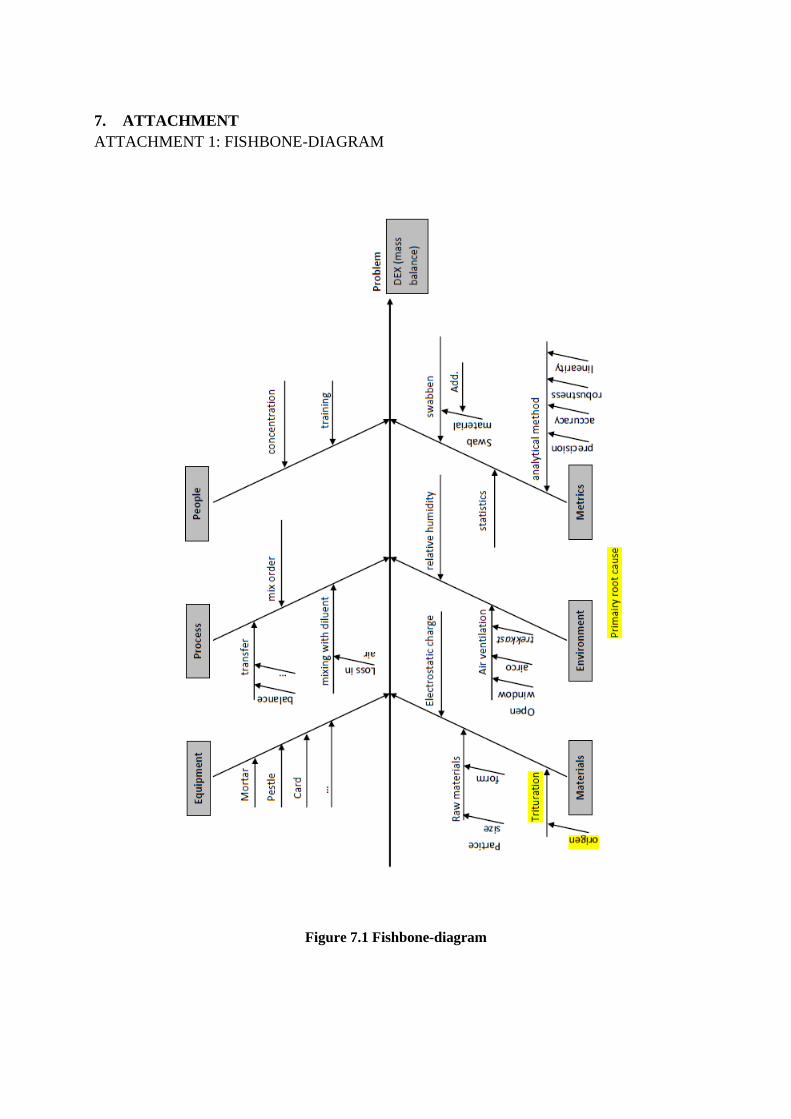
7. ATTACHMENT
ATTACHMENT 1: FISHBONE-DIAGRAM
Figure 7.1 Fishbone-diagram
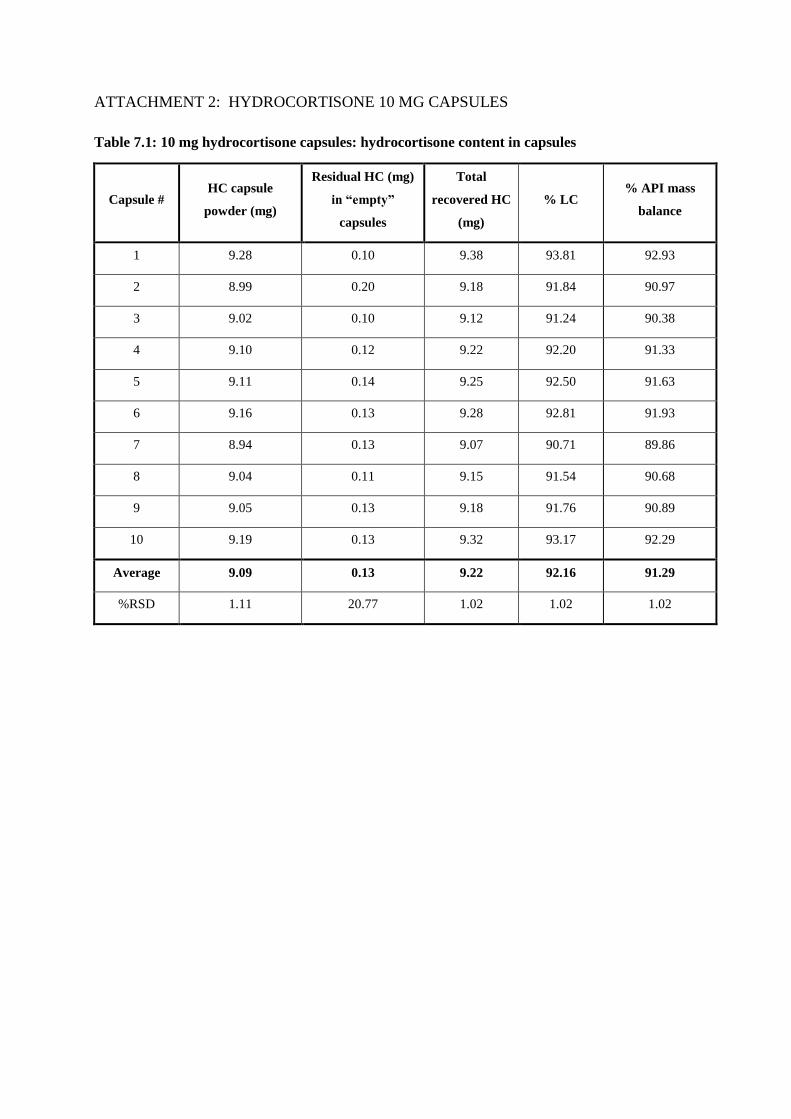
ATTACHMENT 2: HYDROCORTISONE 10 MG CAPSULES
Table 7.1: 10 mg hydrocortisone capsules: hydrocortisone content in capsules
Capsule # HC capsule
powder (mg)
Residual HC (mg)
in “empty”
capsules
Total
recovered HC
(mg)
% LC % API mass
balance
1 9.28 0.10 9.38 93.81 92.93
2 8.99 0.20 9.18 91.84 90.97
3 9.02 0.10 9.12 91.24 90.38
4 9.10 0.12 9.22 92.20 91.33
5 9.11 0.14 9.25 92.50 91.63
6 9.16 0.13 9.28 92.81 91.93
7 8.94 0.13 9.07 90.71 89.86
8 9.04 0.11 9.15 91.54 90.68
9 9.05 0.13 9.18 91.76 90.89
10 9.19 0.13 9.32 93.17 92.29
Average 9.09 0.13 9.22 92.16 91.29
%RSD 1.11 20.77 1.02 1.02 1.02

ATTACHMENT 3: HYDROCORTISONE 20 MG CAPSULES
Table 7.2: 20 mg hydrocortisone capsules: hydrocortisone content in capsules
Capsule # HC capsule
powder (mg)
Residual HC (mg)
in “empty”
capsules
Total
recovered HC
(mg)
% LC % API mass
balance
1 18.66 0.27 18.93 94.67 94.34
2 18.44 0.32 18.75 93.77 93.45
3 18.02 0.25 18.28 91.39 91.07
4 17.78 0.23 18.00 90.02 89.71
5 18.21 0.18 18.39 91.96 91.64
6 18.42 0.17 18.59 92.96 92.64
7 18.35 0.23 18.58 92.88 92.56
8 18.12 0.21 18.33 91.66 91.35
9 17.29 0.23 17.51 87.57 87.26
10 18.30 0.26 18.56 92.81 92.49
Average 18.16 0.23 18.39 91.97 91.65
%RSD 2.16 18.38 2.20 2.20 2.20

ATTACHMENT 4: HYDROCORTISONE CONCENTRATION IN BULK AND
RESIDUAL POWDER
Table 7.3: 20 mg hydrocortisone capsules: hydrocortisone concentration in bulk powder
Capsule # HC bulk powder (mg) Bulk powder (mg)1 HC conc in bulk powder (%)
2
1 18.66 163.36 11.42
2 18.44 168.16 10.96
3 18.02 164.75 10.94
4 17.78 161.72 10.99
5 18.21 169.74 10.73
6 18.42 167.36 11.01
7 18.35 166.42 11.02
8 18.12 169.23 10.71
9 17.29 162.63 10.63
10 18.30 166.39 11.00
Average 18.16 165.98 10.94
%RSD 2.16 1.67 2.04
95% CI of average HC conc. in bulk (%) 10.78 to 11.10
1: capsule weight (full) – capsule weight (without bulk powder)
2:
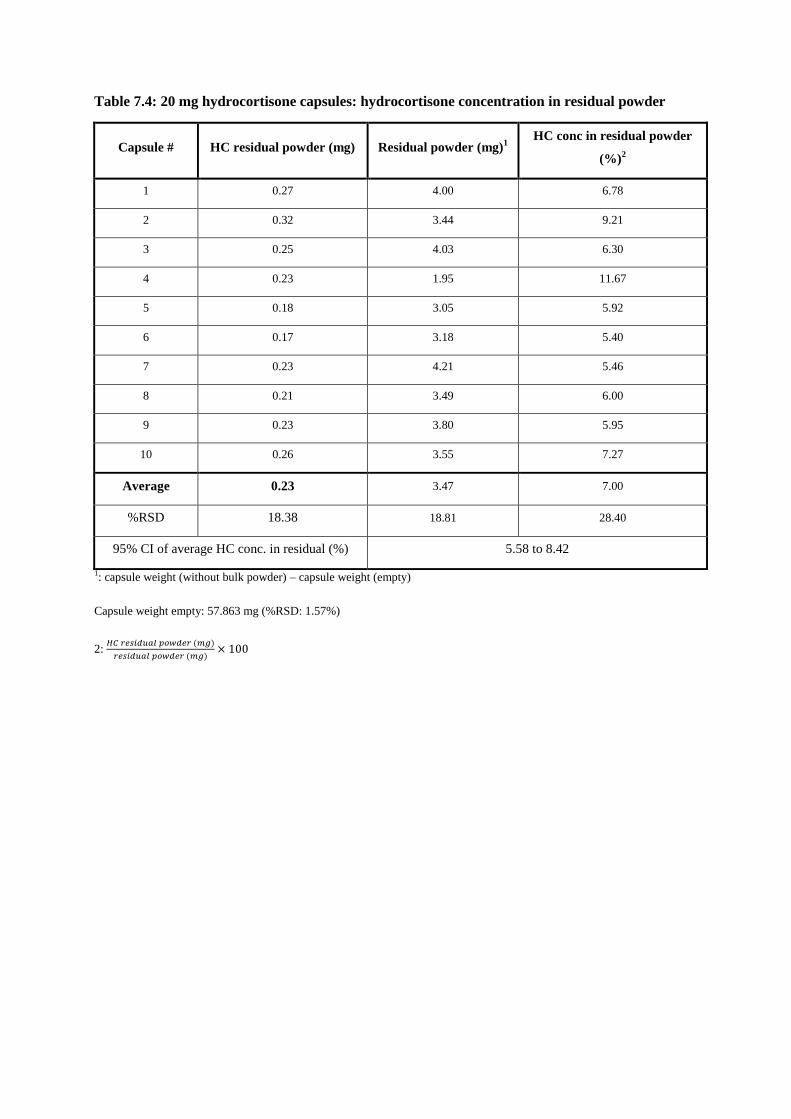
Table 7.4: 20 mg hydrocortisone capsules: hydrocortisone concentration in residual powder
Capsule # HC residual powder (mg) Residual powder (mg)1
HC conc in residual powder
(%)2
1 0.27 4.00 6.78
2 0.32 3.44 9.21
3 0.25 4.03 6.30
4 0.23 1.95 11.67
5 0.18 3.05 5.92
6 0.17 3.18 5.40
7 0.23 4.21 5.46
8 0.21 3.49 6.00
9 0.23 3.80 5.95
10 0.26 3.55 7.27
Average 0.23 3.47 7.00
%RSD 18.38 18.81 28.40
95% CI of average HC conc. in residual (%) 5.58 to 8.42
1: capsule weight (without bulk powder) – capsule weight (empty)
Capsule weight empty: 57.863 mg (%RSD: 1.57%)
2:

ATTACHMENT 5: MORTAR INFLUENCE
Table 7.5: Mortar influence: hydrocortisone content in swabs in mortar 1: DruQuaR
Swab # Description HC content (mg)
(10 mg HC caps.)
%API
mass
balance
HC content (mg)
(20 mg HC caps.)
% API
mass
balance
1 Flexible plastic card 2.80 1.39 3.12 0.78
2 Pestle 2.68 1.33 4.30 1.07
3 Mortar 4.95 2.46 10.59 2.46
Overall 10.43 5.18 18.00 4.49
Table 7.6: Mortar influence: hydrocortisone content in swabs in mortar 2: New
Swab # Description HC content (mg)
(10 mg HC caps.)
% API
mass
balance
HC content (mg)
(20 mg HC caps.)
% API
mass
balance
1 Flexible plastic card 2.12 1.05 4.40 1.10
2 Pestle 2.84 1.42 3.94 0.98
3 Mortar 2.53 1.26 4.89 1.22
Overall 7.49 3.73 13.23 3.30
Table 7.7: Mortar influence: hydrocortisone content in swabs in mortar 3: Old
Swab # Description HC content (mg)
(10 mg HC caps.)
% API
mass
balance
HC content (mg)
(20 mg HC caps.)
% API
mass
balance
1 Flexible plastic card 2.05 1.02 2.90 0.73
2 Pestle 2.29 1.14 6.59 1.65
3 Mortar 7.72 3.84 20.69 5.17
Overall 12.06 6.00 30.18 7.54

Table 7.8: Mortar influence: hydrocortisone content in swabs in mortar 4: Agate
Swab # Description HC content (mg)
(10 mg HC caps.)
% API
mass
balance
HC content (mg)
(20 mg HC caps.)
% API
mass
balance
1 Flexible plastic card 2.39 1.19 4.65 1.16
2 Pestle 2.39 1.19 4.08 1.02
3 Mortar 1.17 0.59 2.22 0.55
Overall 5.96 2.98 10.94 2.73
ATTACHMENT 6: TRIAMCINOLONE 4 MG CAPSULES
Table 7.9 Triamcinolone content in capsules
Capsule # TRI capsule
powder (mg)
Residual TRI (mg)
in “empty”
capsule
Total TRI
(mg) % LC
% API mass
balance
1 3.81 0.04 3.84 96.12 95.86
2 3.92 0.06 3.99 99.68 99.41
3 3.97 0.04 4.01 100.17 99.90
4 3.90 0.05 3.95 98.69 98.42
5 3.81 0.04 3.85 96.17 95.91
6 3.73 0.05 3.77 94.29 94.03
7 3.91 0.04 3.95 98.68 98.41
8 3.77 0.03 3.79 94.77 94.51
9 3.71 0.03 3.75 93.68 93.42
10 3.84 0.03 3.87 96.77 96.50
Average 3.84 0.04 3.88 96.90 96.64
%RSD 2.26 27.24 2.38 2.38 2.38

ATTACHMENT 7: DEXAMETHASONE: SIX EXPERIMENTS
Table 7.10: Test b: API mass balance (%)
#
10%-DEX
trituration weighed
(mg)
DEX content (mg)
present in the
trituration
(theoretical)1
DEX content
recovered (mg)
(experimental)
% API mass
balance2
1a 50.77 5.06 5.17 102.07
2b 50.14 4.81 5.00 103.98
3b 50.06 4.80 4.95 103.05
Average 103.03
Stdev 0.955
% RSD 0.927
a: DEX trituration concentration: 9.97% m/m (analyzed on 25/4/2013)
b: DEX trituration concentration: 9.59% m/m (analyzed on 26/4/2013)
Table 7.11: Test c: API mass balance (%)
#
10%-DEX
trituration weighed
(mg)
DEX content
present in the
trituration (mg)
(theoretical)1
DEX content
recovered (mg)
(experimental)
% API mass
balance2
1a 50.68 5.05 5.25 103.81
2b 49.95 4.79 4.98 103.85
3b 50.15 4.81 5.03 104.55
Average 104.07
Stdev 0.416
% RSD 0.400
a: DEX trituration concentration: 9.97% m/m (analyzed on 25/4/2013)
b: DEX trituration concentration: 9.59% m/m (analyzed on 26/4/2013)
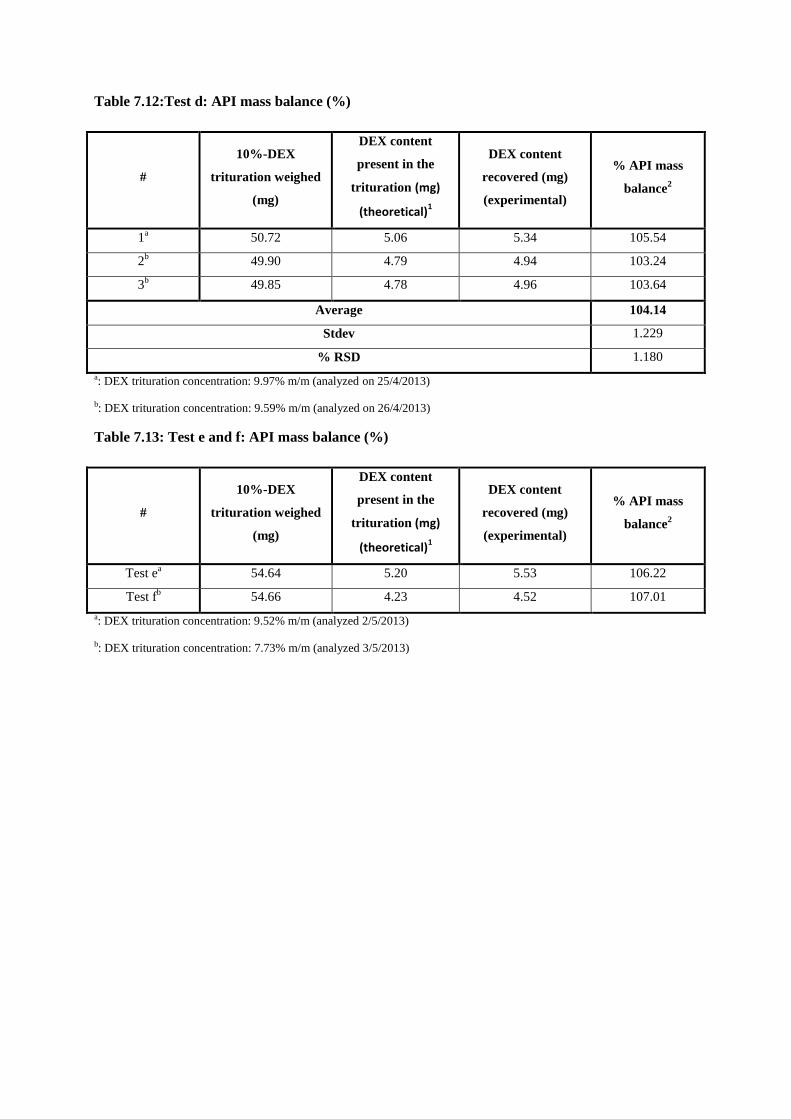
Table 7.12:Test d: API mass balance (%)
#
10%-DEX
trituration weighed
(mg)
DEX content
present in the
trituration (mg)
(theoretical)1
DEX content
recovered (mg)
(experimental)
% API mass
balance2
1a 50.72 5.06 5.34 105.54
2b 49.90 4.79 4.94 103.24
3b 49.85 4.78 4.96 103.64
Average 104.14
Stdev 1.229
% RSD 1.180
a: DEX trituration concentration: 9.97% m/m (analyzed on 25/4/2013)
b: DEX trituration concentration: 9.59% m/m (analyzed on 26/4/2013)
Table 7.13: Test e and f: API mass balance (%)
#
10%-DEX
trituration weighed
(mg)
DEX content
present in the
trituration (mg)
(theoretical)1
DEX content
recovered (mg)
(experimental)
% API mass
balance2
Test ea
54.64 5.20 5.53 106.22
Test fb
54.66 4.23 4.52 107.01
a: DEX trituration concentration: 9.52% m/m (analyzed 2/5/2013)
b: DEX trituration concentration: 7.73% m/m (analyzed 3/5/2013)

ATTACHMENT 8: DEXAMETHASONE 0.25 MG CAPSULES
Table 7.14: Dexamethasone content in capsules (own-made trituration)
Capsule # DEX bulk powder
(mg)
Residual DEX
(mg)
Total DEX
(mg) %LC
% API mass
balance
1 0.240 0.003 0.242 96.94 89.83
2 0.241 0.002 0.243 97.18 90.05
3 0.244 0.002 0.246 98.56 91.33
4 0.241 0.002 0.244 97.43 90.28
5 0.241 0.002 0.244 97.49 90.34
6 0.239 0.003 0.242 96.71 89.62
7 0.246 0.002 0.248 99.12 91.85
8 0.238 0.003 0.241 96.33 89.27
9 0.242 0.003 0.245 97.97 90.78
10 0.253 0.002 0.256 102.23 94.73
Average 0.243 0.002 0.245 98.00 90.81
%RSD 1.80 8.24 1.74 1.74 1.74
; LC: label claim DEX, i.e. 0.25 mg
% API mass balance:
; theoretical DEX in one capsule (mg):
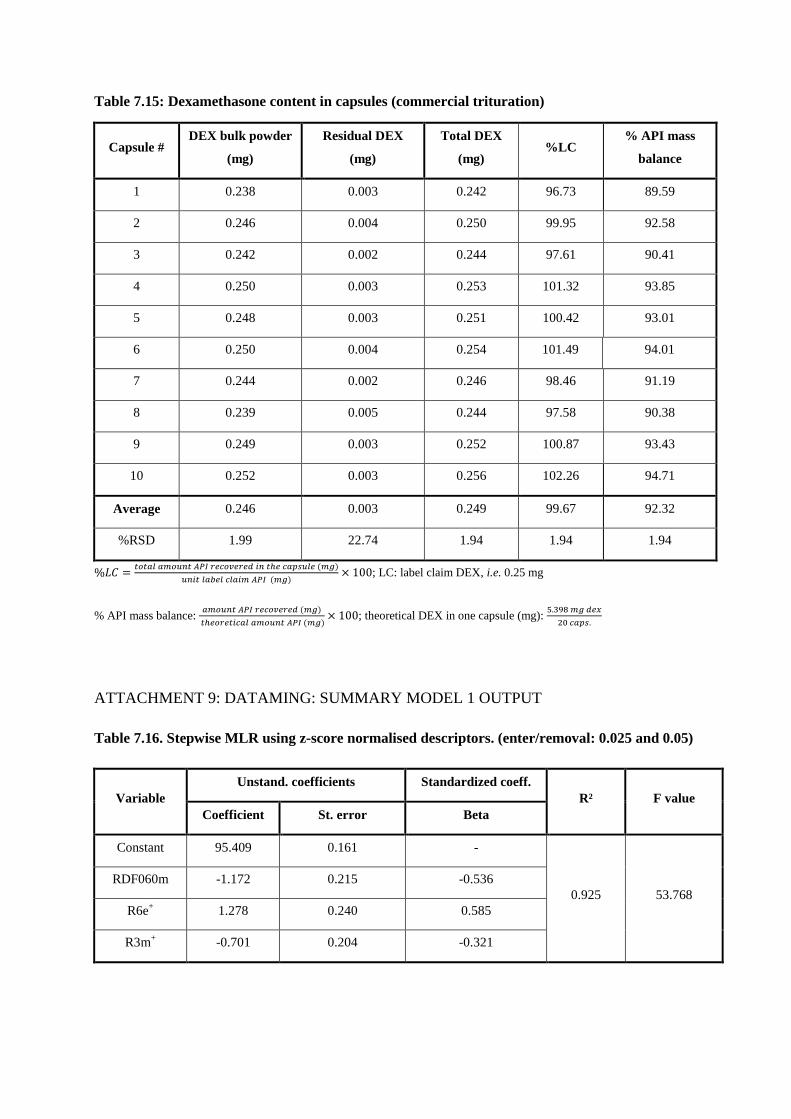
Table 7.15: Dexamethasone content in capsules (commercial trituration)
Capsule # DEX bulk powder
(mg)
Residual DEX
(mg)
Total DEX
(mg) %LC
% API mass
balance
1 0.238 0.003 0.242 96.73 89.59
2 0.246 0.004 0.250 99.95 92.58
3 0.242 0.002 0.244 97.61 90.41
4 0.250 0.003 0.253 101.32 93.85
5 0.248 0.003 0.251 100.42 93.01
6 0.250 0.004 0.254 101.49 94.01
7 0.244 0.002 0.246 98.46 91.19
8 0.239 0.005 0.244 97.58 90.38
9 0.249 0.003 0.252 100.87 93.43
10 0.252 0.003 0.256 102.26 94.71
Average 0.246 0.003 0.249 99.67 92.32
%RSD 1.99 22.74 1.94 1.94 1.94
; LC: label claim DEX, i.e. 0.25 mg
% API mass balance:
; theoretical DEX in one capsule (mg):
ATTACHMENT 9: DATAMING: SUMMARY MODEL 1 OUTPUT
Table 7.16. Stepwise MLR using z-score normalised descriptors. (enter/removal: 0.025 and 0.05)
Variable
Unstand. coefficients Standardized coeff.
R² F value
Coefficient St. error Beta
Constant 95.409 0.161 -
0.925 53.768
RDF060m -1.172 0.215 -0.536
R6e+ 1.278 0.240 0.585
R3m+ -0.701 0.204 -0.321
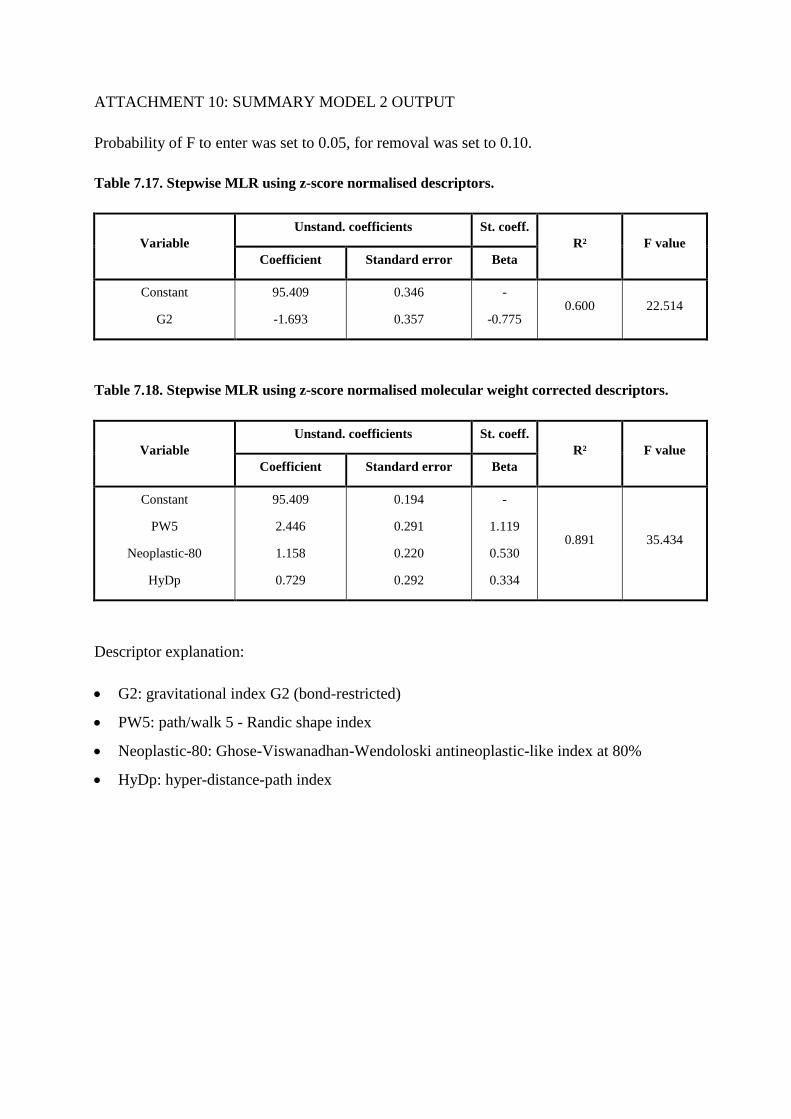
ATTACHMENT 10: SUMMARY MODEL 2 OUTPUT
Probability of F to enter was set to 0.05, for removal was set to 0.10.
Table 7.17. Stepwise MLR using z-score normalised descriptors.
Variable
Unstand. coefficients St. coeff.
R² F value
Coefficient Standard error Beta
Constant
G2
95.409
-1.693
0.346
0.357
-
-0.775 0.600 22.514
Table 7.18. Stepwise MLR using z-score normalised molecular weight corrected descriptors.
Variable
Unstand. coefficients St. coeff.
R² F value
Coefficient Standard error Beta
Constant
PW5
Neoplastic-80
HyDp
95.409
2.446
1.158
0.729
0.194
0.291
0.220
0.292
-
1.119
0.530
0.334
0.891 35.434
Descriptor explanation:
G2: gravitational index G2 (bond-restricted)
PW5: path/walk 5 - Randic shape index
Neoplastic-80: Ghose-Viswanadhan-Wendoloski antineoplastic-like index at 80%
HyDp: hyper-distance-path index

ATTACHMENT 11: SUMMARY MODEL 3 OUTPUT
Probability of F to enter was set to 0.05, for removal was set to 0.10.
Table 7.19. Stepwise MLR using z-score normalised descriptors (standard F probability)
Variable
Unstand. coefficients St. coeff.
R² F value
Coefficient Standard error Beta
Constant
G2
95.409
-1.693
0.346
0.357
-
-0.775 0.600 22.514
As only 1 variable is selected in the model (Table 7.15), the standard F probability values are
altered to allow more variables to enter the model. Probability of F to enter was set to 0.15,
for removal was set to 0.30. Summary of the obtained model is given in Table 7.16.
Table 7.20. Stepwise MLR using z-score normalised descriptors (adjusted F probability)
Variable
Unstand. coefficients St. coeff.
R² F value
Coefficient Standard error Beta
Constant
G2
nHBonds
ALogP2
nHDon
Hydratation Energy
MLogP
95.409
-0.339
-0.587
-2.069
-2.789
-1.907
0.628
0.175
0.288
0.194
0.376
0.603
0.486
0.274
-
-0.155
-0.269
-0.947
-1.276
-0.873
0.287
0.932 22.736

Table 7.21. Stepwise MLR using z-score normalised molecular weight corrected descriptors.
(standard F probability)
Variable
Unstand. coefficients St. coeff.
R² F value
Coefficient Standard error Beta
Constant
Ms
nHBonds
AROM
S
95.409
2.491
-0.520
1.174
-1.668
0.235
0.556
0.255
0.325
0.627
-
1.140
-0.238
0.537
-0.763
0.852 17.304
Descriptor explanation:
G2 or gravitational index G2 (bond-restricted) ranges from 7 to 21 in the original
descriptor matrix. This descriptor represents the uniformity of mass distribution
throughout the molecule. However, from the calculation it can be seen that this G2
descriptor is correlated with the molecular weight of the molecules (R² of 0.958 when
plotting MW vs. G2). Therefore, the entire descriptor set was corrected for the molecular
weight.
Ms or mean electrotopological state (Si)
nHBonds or number of hydrogen bonds ranges from 0 to 1 and is based on the possible
number of intramolecular hydrogen bonds.
AROM or aromaticity index ranges from 0 to 0.93 in the original descriptor matrix. It is
calculated based on the bond lengths and bond orders of the compounds.
S or the Abrahams dipolarity/polarizability descriptor ranges from 0.25 to 2.86 in the
original descriptor matrix.

ATTACHMENT 12: SCORE AND LOADING PLOTS PCA AND PLS
Figure 7.2. Score plot of PCA analysis
Figure 7.3. Loading plot of PCA analysis.
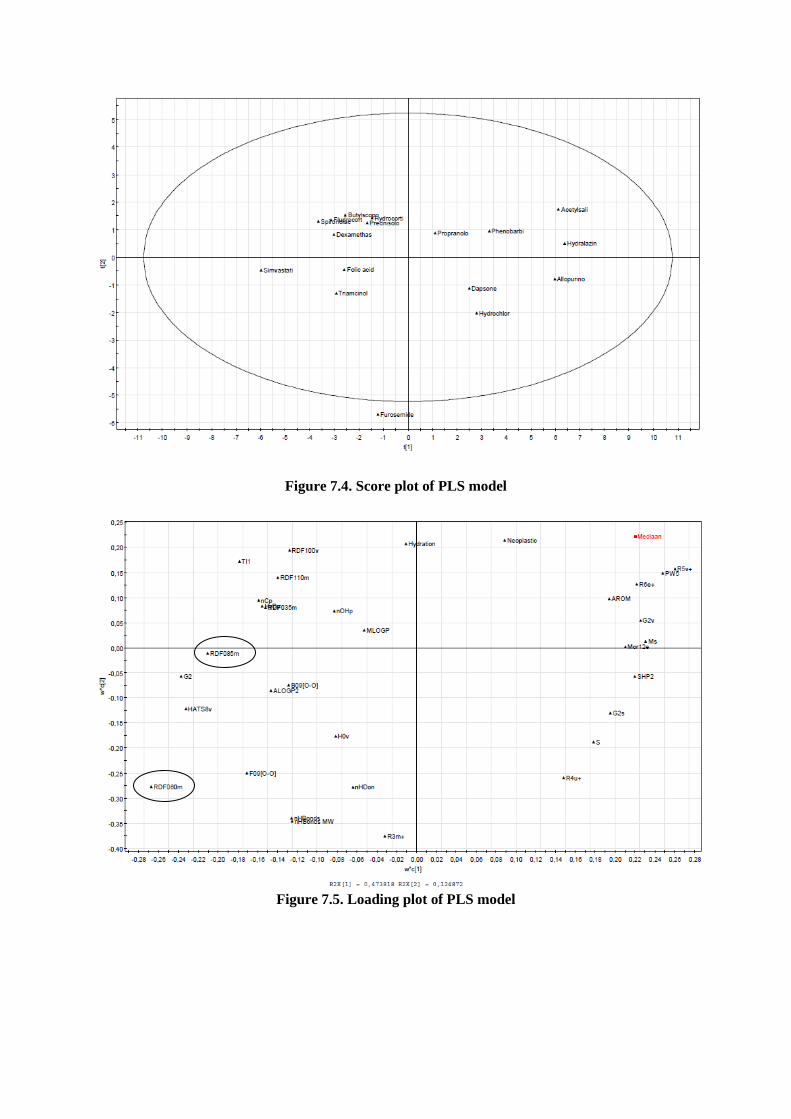
Figure 7.4. Score plot of PLS model
Figure 7.5. Loading plot of PLS model

ATTACHMENT 13: EXPLANATORY (R²) AND PREDICTIVE (Q²) PCA MODEL
VALUES
Figure 7.6 Explanatory (R²) and predictive (Q²) PCA model values
ATTACHMENT 14: ANOVA
Table 7.22 One way ANOVA using assay data sets from the 17 different molecules
Sum of Squares df Mean Square F Sig.
Between groups 4621.524 16 288.845 23.515 0.000
Within groups 23399.517 1905 12.283 - -
Total 28021.041 1921 - - -
Note: The 17 mean assay values are within the same range as the corresponding 17 median assay values (i.e. ± 1%)

Table 7.23 Post hoc ANOVA analysis by Tukey-Kramer method
A
SA
All
op
.
Bu
tylh
.
Da
ps.
Dexa
.
Flu
dro
.
Fo
lic
A.
Fu
ro.
Hy
dra
l.
Hy
dro
ch
l.
HC
Ph
eno
b.
Pred
n.
Pro
pr.
Sim
v.
Sp
iro
no
Tria
m.
ASA X X X X X X X X X X X X X X X
Allop. X X X X X X X X
Butylh. X X
Daps. X X X
Dexa. X X X X X X X X X
Fludro. X X X X X X
Folic A. X X X X X X X X
Furo. X X X X X X X X X X X
Hydral. X X X X X X X X
Hydrochl. X X X X X X X X
HC X X X X X X X X
Phenob. X X X X X X X X X
Predn. X X X X X
Propr. X X X X
Simv. X X X X X X X X X X X X X X
Spirono. X X X X X X
Triam. X X X X
X: statistically significant difference (0.05 significance level)

8. EVENING LECTURES: INTERNATIONALISATION AT HOME
Evening lecture 1: “Biedt het kiwi-model een oplossing voor de financiële problemen van
de sociale zekerheid?” by Dirk Duppen
The Kiwi-model was originated in New Zealand. Here the government will look at what
is needed, they will perform a scientific need-analysis and based on evidence-based medicines
(EBM), they choose the best product. After which, they will use the combined purchasing
power of the community to agree a correct price with the companies through a public
quotation request. Since Dirk Duppen has released his book “de cholesteroloorlog”, in which
he pleads for the Kiwi-model, more attention is paid to the Kiwi-model in Belgium. Thanks to
the Kiwi-model: for the same drugs, some huge price differences were noticed.
My opinion about the Kiwi-model is that it is well thought and that interesting results can
be obtained. It’s good that the cost of the medicines can be brought down and that the
obstacles in the medicine policy can be handled. For example the fall in price of the human
papillomavirus-vaccine provides a higher vaccination degree, which is good for the
healthcare. So I’m for a Kiwi-model in Belgium. I was also surprised that a lot of studies hold
back information or manipulate their study to get a good result. I didn’t thought that this
happened in so many studies.
Evening lecture 2: “Registration of new vaccines in the EU: not an easy task.” by Pieter
Neels
This evening lecture was about the importance of vaccines and that they are different
from medicines. They are extremely efficient and have a high impact on the health. A vaccine
is mostly given to healthy people (often to young infants) and they have a preventive action,
they are not used to cure a disease. Vaccines must have a good quality and be safe to meet the
requirements. An ideal vaccine has a high efficiency, is safe, has no side effects (which is
almost impossible), has a long protection time, exist preferably out of one dose, is preferably
at room temperature and is as cheap as possible. There exist different types of vaccines,
namely live vaccines and non living vaccines. And still new vaccines are in progress.
I’m for vaccination, because I think it reduces the mortality and that some severe diseases
could disappear. It’s important to vaccinate your child, because it protect your child against
diseases like measles, mumps, rubella, tetanus, hepatitis, … I find it less terrible to have some
side-effects of the vaccine, then to undergo the disease.
Evening lecture 3: “Innovating for a better and sustainable heathcare” by Rudi Pauwels
Rudi Pauwels is a pharmaceutical scientist. He founded already a few companies: namely
Tibotec-Vicro, Galapagos and Biocartis. On March 22, 2013 he obtained a honoray doctorate.
He is a HIV researcher and
Rudi Pauwels talked about how each people is different and that we need to become more
personal and detach from the idea that one drug will be good for a lot of diseases. There is a
large genetically diversity. It is important to know why people are sick and what are the
causes of mortality. He also talked about his latest product Apollo, which is a diagnostic
platform.
This was an interesting lecture. I agree with Rudi Pauwels that way of treatment needs to
be changed, it needs to become more patient-related.
Evening lecture 4: “Hospital admissions related to medication” by Patricia van den
Bremt
In this lecture Patricia van den Bremt talked about how drugs can harm us. There are two
ways in which a drug can harm: intrinsic and extrinsic toxicity. The intrinsic toxicity means
that there are always side effects (ADR=Adverse Drug Reaction) which are non-avoidable
and which are no errors. With extrinsic toxicity, they means the errors were you do something
wrong with the drug (wrong dosage, wrong indication). Such medication errors can harm us
(not necessary) and such errors are avoidable. An adverse drug event (ADE) is a combination
of ADR (non-avoidable harm) and medication errors (avoidable harm). It is important to have
clear definitions so no confusion can occur and no mistakes will be made. Patricia van den
Bremt thinks we should be focused on the avoidable harm, which I agree. She also talked
about a HARM (Hospital Admission related to medication) study. The aim of this study is to
identify the costs, the risk factors and the frequency and potential preventability. The results
are that there is still quite a lot of improvement possible and that a good communication is
important.
I think it is important to know why a drug is chosen and how to prescribe it, so the drug
would be used for the correct reasons and the preventable harm would reduce. And I agree
with Patricia van den Bremt that it is important to improve the medication safety.
