ghana poverty reduction strategy 2003 annual...
TRANSCRIPT

Ghana Poverty Reduction Strategy 2003
Annual Progress Report
March 2004
NATIONAL DEVELOPMENT PLANNING COMMISSION

a
ACRONYMS ADB African Development Bank ADR Alternative Dispute Resolution AESD Agricultural Engineering Services Directorates AG Attorney General’s Department APR Annual Progress Report ART Anti-Retro-viral Therapy AS Audit Service BADEA Arab Bank for Economic Development in Africa BESIP Basic Education Sector Improvement Programme BoG Bank of Ghana BPEMS Budget and Public Expenditure Management CAGD Controller and Accountant General’s Department CBO Community Based Organization CEPA Centre for Policy Analysis CEPS Customs Excise and Preventive Service CG Consultant Group CHPS Community Health Planning and Services CHRAJ Commission for Human Rights and Administrative Justice CIDA Canadian International Development Agency CPI Consumer Price Index CRMAS Community Resource Management Areas CRT Criterion Referenced Test CSOs Civil Society Organisations CWIQ Core Welfare Indicators Questionnaire CWSA Community Water and Sanitation Agency DACF District Assemblies Common Fund DANIDA Danish Aid Agency DAs District Assemblies DFID Department for International Development (UK) DHS Demographic and Health Survey DMTDP District Medium Term Development Plan DP Development Partners DPCU District Planning Coordinating Unit DPMG District Poverty Monitoring Group DSW Department of Social Welfare DWST District Water and Sanitation Team EFA Education For All EMIS Education Management Information System ESP Education Strategic Plan EXIM Export Import FCUBE Free Compulsory Universal Basic Education FOB Free On Board GACC Ghana Anti-Corruption Coalition GBB Government Book of Business GCB Ghana Commercial Bank GDHS Ghana Demographic and Health Survey GDP Gross Domestic Product GER Gross Enrolment Rate GET FUND Ghana Education Trust Fund GHDS Ghana Health and Demographic Survey GHS Ghana Health Service GIDA Ghana Irrigation Development Authority GLSS Ghana Living Standards Survey GoG Government of Ghana GPRS Ghana Poverty Reduction Strategy GSS Ghana Statistical Service GTZ German Technical Assistance HIRDP High Impact Rapid Delivery Programme

b
HIPC Heavily Indebted Poor Country Initiative HIV Human Immunodeficiency Virus HMIS Health Management Information System HRD Human Resource Development ICCES Integrated Community Centres for Employable Skills ICT Information and Communication Technologies IDA International Development Agency IGR Internally Generated Revenue ILO International Labour Organization IMF International Monetary Fund ISODEC Integrated Social Development Centre ITTU Intermediate Technology Transfer Unit KfW Kreditanstalt fur Wiederaufbau KIA Kotoka International Airport LAP Land Administration Project LPG Liquefied Petroleum Gas LTU Large Taxpayers Unit M&E Monitoring and Evaluation MCT Ministry of Communication and Technology MDAs Ministry(ies), Department(s) and Agency(ies) MDBS Multi Donor Budget Support MDGs Millennium Development Goals MLGRD Ministry of Local Government and Rural Development MMR Maternal Mortality Ratio MOE Ministry of Education MOEYS Ministry of Education Youth and Sports MOF Ministry of Finance MOFA Ministry of Food & Agriculture MOFEP Ministry of Finance and Economic Planning MOH Ministry of Health MOTI Ministry of Trade and Industry MOWCA Ministry of Women and Children Affair MPSD Ministry of Private Sector Development MRT Ministry of Roads and Transport NDAP National Decentralization Action Plan NGP National Governance Program NIPMG National Intra-Agency Poverty Monitoring Group NTR Non Tax Revenue OVC Orphans and Vulnerable Children PEM Public Expenditure Management PFM Public Financial Management PLWHA People Living With HIV/AIDS PPB Public Procurement Board PRGF Poverty Reduction and Growth Facility PRSC Poverty Reduction Support Credit PSD Private Sector Development PSI Presidential Special Initiative PSIA Poverty and Social Impact Assessment PURC Public Utilities Regulatory Commission PWDS Persons With Disabilities REDP Rural Enterprise Development Program SEA Strategic Environmental Assessment SHEP Self Help Electrification Project TIN Tax Identification Number TOR Tema Oil Refinery TPD Transaction Price Databases UNICEF United Nations International Children Educational Fund VCT Voluntary Counselling and Testing
9.0

c
TABLE OF CONTENTS
EXECUTIVE SUMMARY 1 INTRODUCTION ...........................................................................................................19
1.1 Background ..............................................................................................................19 1.2 GPRS Monitoring and Evaluation ...........................................................................20 1.3 Data Collection Process and Challenges..................................................................20
1.3.1 National Core Welfare Monitoring Survey.................................................................21 1.3.2 Ghana Demographic and Health Survey 2003...........................................................21
1.4 GPRS M&E Institutional Arrangements .................................................................21 1.4.1 National Intra-Agency Poverty Monitoring Group (NIPMG) ....................................22 1.4.2 Civil Society Organizations ........................................................................................23 1.4.3 Regional Poverty Monitoring Groups ........................................................................23
1.5 GPRS Dissemination ...............................................................................................23 1.6 Poverty and Social Impact Analysis ........................................................................24 1.7 Strengthening the M&E Process..............................................................................25 1.8 GPRS Core Indicators..............................................................................................26 1.9 Sections of the report ...............................................................................................31
2. THE LINKS BETWEEN THE GPRS AND THE 2003 BUDGET ................................32 2.1 Introduction..............................................................................................................32 2.2 Discretionary Budget for 2003 and the Medium Term Priorities? ..........................32 2.3 Donor Resources and GPRS Priorities?...................................................................36 2.4 Conclusions..............................................................................................................37
3. MACRO-ECONOMIC STABILITY...............................................................................38 3.1 Introduction..............................................................................................................38 3.2 Trends In Macro stability Indicators........................................................................38 3.3 Poverty Reduction Impact........................................................................................44 3.4 Macro-Stability Policy Developments.....................................................................46 3.5 Recommended Policy Initiatives .............................................................................50
4. PRODUCTION AND GAINFUL EMPLOYMENT.......................................................52 4.1 Introduction..............................................................................................................52 4.2 Outcome/Impact Indicators......................................................................................52 4.3 Policy Developments/Measures/Triggers ................................................................58
4.3.1 Rural Development Based On Modernised Agriculture ..................................62 4.3.2 Environmental Protection through Re-Aforestation........................................65 4.3.3 Enhanced Infrastructural Development...........................................................66 4.3.4 Strengthened Private Sector ............................................................................72
4.4 Recommended Policy Initiatives .............................................................................74 5 HUMAN RESOURCE DEVELOPMENT AND BASIC SERVICES............................76
5.1 Introduction..............................................................................................................76 5.2 Education Sector ......................................................................................................76
5.2.1 Achievements in the Education Sector........................................................................79 5.2.2 Policy Measures..........................................................................................................80 5.2.3 Recommended Policy Initiatives .................................................................................85
5.3 Health Sector............................................................................................................85 5.3.1 Progress and Achievements in the Health Sector .......................................................87 5.3.2 Policy Measures..........................................................................................................89
5.4 Improve Access to Safe Water and Sanitation in Rural Areas ................................92 5.5 Recommended Policy Initiatives .............................................................................94
6 GOVERNANCE..............................................................................................................96

d
6.1 Introduction..............................................................................................................96 6.2 Policy Priorities, Measures And Activities..............................................................96 6.3 Progress On Policy Implementation On Security And Rule Of Law ......................99 6.4 Nature of Interventions ..........................................................................................100
6.4.1 Support to the Police Service....................................................................................100 6.4.2 Strengthening the Attorney General’s Office............................................................101 6.4.3 The Campaign Against Corruption...........................................................................101 6.4.4 Support to Parliament...............................................................................................101
6.5 Recommended Policy Initiatives ...........................................................................102 6.6 Decentralisation .....................................................................................................102 6.7 Nature of Interventions ..........................................................................................103
6.7.1 Strengthening the Administrative capacity of District Assemblies ...............103 6.7.2 Deepening District Assembly association with civil society. ........................104
6.8 Recommended policy initiatives............................................................................104 6.9 Public Sector Reforms ...........................................................................................104
6.9.1 Recommended policy initiatives.....................................................................105 6.10 Monitoring the GPRS ............................................................................................105 6.11 Policy Recommendation ........................................................................................106
7 THE VULNERABLE AND THE EXCLUDED ...........................................................106 7.1 Introduction............................................................................................................106 7.2 Progress On Priorities Of Social Justice, Equity, Hiv/Aids And Disability ..........108 7.3 Nature of Interventions ..........................................................................................111 7.4 Recommended Policy Initiatives ...........................................................................113
8 PERFORMANCE OF DISTRICT ASSEMBLIES .......................................................115 8.1 Introduction............................................................................................................115 8.2 Financial Performance ...........................................................................................115
8.2.1 Sources of Funds to Districts.........................................................................115 8.3 An Assessment of Utilization of HIPC Relief Savings .........................................117
8.3.1 HIPC Savings............................................................................................................117 8.3.2 Allocations HIPC Funds by MDAs...........................................................................117 8.3.3 Release of HIPC Funds to District Assemblies.........................................................119 8.3.4 Details of type of projects .........................................................................................120 8.3.5 Key Issues & Observations in the Mgt of HIPC Funds and Projects .......................122
9 PROGRESS ON THE MILLENNIUM DEVELOPMENT GOALS ............................124 10 SUMMARY OF POLICY RECOMMENDATIONS................................................130
10.1 Macro Economic Stability .....................................................................................130 10.2 Production & Gainful Employment .......................................................................131 10. 3 Human Resource Devt & Basic Services...........................................................131 10. 4 Good Governance ..............................................................................................132 10. 5 Vulnerable & The Excluded ..............................................................................133 10. 6 District Assembly HIPC Fund Utilization Policy..............................................134
11 TECHNICAL APPENDICES....................................................................................135 Appendix 1: Status report on HIPC Completion Point..............................................136 Appendix 2: Status Report on PRSC2 Triggers.........................................................141 Appendix 3: Status Report On MDBS 2004..............................................................148 Appendix 4 : Summary Report Of The PSIA Studies ...............................................155
4.1 PSIA on Tackling Vulnerability and Exclusion in Ghana.........................................155 4.2 PSIA on Energy Sector Reform In Ghana : Electricity Tariffs .................................156 4.3 PSIA on Enhancing Capacity for Pro-Poor Decentralization..................................157 4.4 PSIA on Economic Transformation of the Agricultural Sector ................................158 4.5 Common Issues from the PSIA Studies .....................................................................158

e
LIST OF TABLES LINKING 2003 BUDGET TO GPRS Table 2.1: Distribution of Total Discretionary Expenditure: 2001-2003 Table 2.2: Distribution of Total GOG Expenditure 2001-2003 Table2 3: Expenditures in Priority Areas as % of Total Expenditure Table 2.4: Poverty Reduction Expenditures by Sector and Source Table 2.5: Distribution of Total Donor Expenditure: 2001-2003 Table 2.6: Utilization of Discretionary Payments ¢Billion MACROECONOMIC STABILITY Table 3.1: Selected Macroeconomic Stability Indicators Table 3.2: Welfare Indicators 2003 Table 3.3: Unemployment Rates Table 3.4: Policy Objectives of MTP, HIPC, PRSC-2, and MDBS PRODUCTION AND GAINFUL EMPLOYMENT Table 4.1: Production and Gainful Employment Indicators Table 4.2: Difficulty with Food Needs Table 4.3: Policy Developments Matrix for MTP, HIPC, PRSC, and MDBS Table 4.4: CWIQ Result on Household Land Ownership Table 4.5: Impact of Roads Conditions on Poverty Table 4.6: Activities in the Road Sector Table 4.7: Kilometres of Feeder Roads Improved HUMAN RESOURCE AND PROVISION OF BASIC SERVICES Table 5.1: Summary of Status of Priority Indicators in the Education Sector Table 5.2: Trends in Gross Primary School Enrolment Ratio. Table 5.3: Primary Gross Enrolment Ratio for Girls (PGER), 2001/02-2002/03 Table 5.4: Trends in Quality Education Indicators Table 5.5: Summary of Status of Access Indicators Table 5.6: Summary of Status of Reducing Gender Disparities Indicators Table 5.7: Summary of Status of Improving Skills Training Indicators Table 5.8: Summary of Status of Efficiency and Equity of Financing Education Indicators Table 5.9: Summary of Status of Priority Health Indicators in 2003 Table 5.10: Basic Health Sector Indicators, 1988-2003 (%) Table 5.11: Proportion of Supervised Deliveries by Health Professionals, 1998 and 2003 Table 5.12: Summary of Status of Enhancing Delivery and Access to Health Indicators Table 5.13: Summary of Status of Indicators for Ensuring Sustainable Health Care Financing that Protects the Poor Table 5.14: Summary of Indicators on Access to Safe Water in Rural Areas Table 5.15: Achievements in Water Facility Delivery, 2002 and 2003 Table 5.16: Trends in the Reported Cases of Guinea Worm GOVERNANCE VULNERABLE AND EXCLUDED Table 6.1: Status of Governance Indicators Monitored (MTPs, PRSC2, MDBS, HIPC) Table 7.1: Status of Vulnerable & Excluded Indicators Monitored (MTPs, PRSC2, MDBS, HIPC) Table 7.2: Comparative Welfare Services Provided to the Vulnerable and Excluded by Year Table 7.3: Statistics of Cases Reported to Women and Juvenile Unit (WAJU) Ghana Police Service from January 1999 to December 2003 Table 7.4: Legal Aid Target Indicators

f
LIST OF FIGURES HUMAN RESOURCE DEVELOPMENT AND BASIC SERVICES Fig. 5.1 Percentage of Children Malnourished (underweight) by Region Fig. 5.2 Access to Safe Water by Regions, 2003 Fig. 5.3 Access to Adequate Sanitation by Region (2003) GOVERNANCE VULNERABLE AND EXCLUDED Fig. 6.1a Crime Statistics Fig. 6.1b Crime Statistics Fig. 7.1 Access to Water Fig. 7.2 Access to Health Services by Region

1
EXECUTIVE SUMMARY Introduction The Ghana Poverty Reduction Strategy (GPRS) is the key development policy framework for the country. The implementation of the GPRS, which began in 2002, has been geared towards achieving the medium term priorities of the Government. With an increased awareness of the importance of the GPRS, it has been used to inform all key policy and budgetary decisions both at the national and the district levels. The Annual Progress Report (APR) provides a framework for the systematic review of the GPRS programmes and projects implementation and their impacts on the socio-economic development of the country for the year. Given the significant resources required to fund the GPRS, the Government has prioritised the GPRS through the Medium Term Priorities (MTPs), which have been used to inform the budget. The APR uses MTP’s and the relevant 52 indicators identified in the GPRS M&E Plan as its main frame of reference. The APR also comments on the status of the GPRS-based triggers and targets for assessing performance in the Donor support programmes such as the Poverty Reduction Support Credit (PRSC), the Multi Donor Budget Support (MDBS), the Poverty Reduction and Growth Facility (PRGF), and for meeting the floating HIPC completion point. In addition the APR provides an assessment of our performance in achieving the Millennium Development Goals. While the triggers and targets may be specific to funding programmes they are essentially monitoring tools for assessing the GPRS implementation process, so monitoring them are as important to the Government of Ghana as they are to the relevant Development Partners. The primary sources of information for this report are the sector ministries, departments and agencies. The report also uses data from earlier surveys of the Government Statistical Service (GSS) as well as two new surveys conducted by the GSS in the first quarter of 2003 - the Core Welfare Indicators Questionnaire (CWIQ2) Monitoring Survey, and the Ghana Demographic and Health Survey (GDHS) conducted later in the year. Although progress has been made in establishing the GPRS M&E system, there still remain challenges that need to be addressed. There is the need to facilitate the harmonization of data and other information collected as part of the M&E exercise. Data inconsistency and availability from different sources was viewed as a major challenge in the monitoring exercise. The dissemination activities of the GPRS to the public have improved through the development of a GPRS communication strategy, which is being implemented. Additionally, there is active participation of the Ministries, Department and Agencies through the establishment of National Intra-Agency Poverty Monitoring Groups based on the GPRS thematic areas. These groups are inter-sectoral and include both government and non-government representatives selected for their knowledge of the thematic area. The poverty monitoring groups have held a series of meetings, which have helped to deepen the involvement of MDA’s in the GPRS M&E process. Members have had the opportunity to comment on the APR and provided significant input to baselines, targets & indicator achievements.

2
Policy makers are increasingly looking for evidence to support decisions and to evaluate the impact of resources, which have been utilized. This support for evidence-based policy decision-making has also been demonstrated by growing enthusiasm of key stakeholders in the poverty and social impact assessment studies. Five studies have been commissioned as follows and a summary of the findings of four of the studies that have been completed is presented in the technical appendices section: a. Energy Sector Reform in Ghana: Electricity Tariffs; b. Tackling Vulnerability and Exclusion In Ghana; c. Assessment of the Distributional Impact and Effects of Ghana’s Petroleum Pricing
Policy; d. Economic Transformation of the Agricultural Sector; and e. Enhancing Capacity for Pro-Poor Decentralization. The APR provides evidence on the impact of government programmes and projects in the five thematic areas of the GPRS, namely: Macroeconomic Stability; Production & Gainful Employment; Human Resources Development and the Provision of Basic Services; Vulnerability and Exclusion and Good Governance. It also describes the policies, programmes and projects of the GPRS within each thematic area, and presents evidence on their progress. In assessing progress, the APR uses input, output or outcome indicators to assess the extent to which the programmes and projects have been implemented. The report is summarized below by thematic area. Macro-Economic Stability The macroeconomic indicators reveal that macro-stability has favourably been on track. The favourable macroeconomic environment has been attributed to improved fiscal management, increased cocoa production and higher world prices for cocoa and gold. The 5.2% growth rate of GDP in 2003 exceeded the target of 4.7% set at the beginning of the year and the GPRS target of 4.9%. This relatively high growth rate was largely attributed to growth in agriculture specifically in the cocoa sector. The growth in the food crop sub-sector in 2003 of 5.3% was marginally above the growth experienced in 2002. Thus real per capita food crop growth rate increased marginally. The growth in agricultural production may also have been cause or effect of the unprecedented growth in credit to agricultural sector. Credit to the sector grew at 51% in 2003 after dipping to 9% in 2002 compared with the 21% growth rate in 2001. The growth in domestic revenue has been significant since 2000. As a percentage of GDP the growth of domestic revenue increased constantly between 2000 and 2003 exhibiting a smooth steady rise. In 2003 the debt burden decreased from a domestic debt/GDP ratio of 29.1% in 2002 to 22.6%. This reduction in domestic debt, an important policy objective of the GPRS, had spill over effects on other sectors of the economy. For example, it contributed partly to the reduction in inflation and the decline in interest rates. In spite of institutional bottlenecks, the reduction in the domestic debt yielded some relief to the private sector through the growth of credit to the sector from –11% in 2001 to 37.5% in 2003. The overall budget deficit was 4.9% of GDP against a target of 4.3%, a decline from 6.8% in 2002. In 2003 budget the target was to reduce inflation from 15.2% at the end of 2002 to 9.0% at the end of 2003. However, the 90.4% increase in petroleum prices in February 2003 led to a
3
revision of the inflation target from 9.0% to 22%. By the end of 2003 inflation rate was 23.6%. There was an increase in the food price inflation from 15% in 2002 to 21.5% at the end of 2003. In nominal terms the cedi was fairly stable against the US dollar depreciating by 4.7 per cent by December 2003. It depreciated by 22.5 per cent and 13.0 per cent against the euro and the pound sterling respectively. Policy Actions The favourable macroeconomic environment was the result of a number of macro measures put in place by the government including efforts to reduce and restructure the domestic debt, improve public expenditure management, improve fiscal resource mobilisation, and pursue price and exchange rate stability. Reducing And Restructuring The Domestic Debt: The Government undertook several measures to reduce and restructure the domestic debt including using ¢144 billion of HIPC savings for domestic debt payment. In terms of restructuring the GoG Index Linked Bond and the Cocoa bills introduced since 2002 continued to be implemented in 2003. Improving Public Expenditure Management: Several activities were undertaken by Government in 2003 to improve public expenditure management. These include: • Strengthening budget control systems, and training MDA Budget Committees and
members of the Budget Development unit on the need for the Budget to be driven by the priorities of the GPRS. Expenditure Initiation Forms were introduced as a basis for requesting for release of funds for all expenditures except wages. This was to ensure that MDAs conformed to their planned programmes and activities.
• As part of the process of modernising the PEM Regulatory Framework, the Financial Administration Bill was passed into law at the end of December 2003.
• Strengthening budget execution and reporting by submitting mmonthly reports with no more than 8 weeks lag. Reports on cash expenditures and commitments by MDAs classified by function were published monthly in the government gazette, following implementation of a new reporting system.
• The implementation of a Budget and Public Expenditure Management System in MFEP and CAGD continued in earnest in 2003.
• Regulatory and oversight body to implement new procurement code was established. Improving Fiscal Resource Mobilization: The Government instituted two programmes to improve fiscal mobilization: Revenue collection institutions & DAs for tax collection were strengthened and the
implementation of the Tax Identification Number (TIN) and the Large Taxpayers Unit (LTU) is being launched in 2 phases.
Proper accounting for Non Tax Revenues collections to improve collection of non-tax revenues.

4
Pursue Price and Exchange Rate Stability: A Monetary Policy Committee (MPC) was established. The Committee uses the prime rate to signal the market expectations of inflation and hence interest rate. The independence of the Bank of Ghana in its pursuit of monetary policy has been reinforced in the new Bank of Ghana Law. Recommended Policy Initiatives for Macro-Economic Stability
The government is committed to and has succeeded in maintaining macro-economic stability. Without losing control over macro-stability the government will simultaneously pursue more ambitious growth policies, which will propel the economy to a higher growth rate than hovering around 5%. The government will also continue to reduce the debt burden by increasing revenue collection through further improvements in the efficiency of the revenue collecting agencies.
The government will use TOR Debt Recovery Fund, which is expected to yield 1.2 trillion cedis to partly fund the subsidies for the delayed petroleum price adjustments. The government also plans to close the unplanned financing gap through fiscal adjustments which consist of curtailing discretionary expenditures but protecting poverty reduction expenditures, reducing net domestic debt repayments from 2.2% of GDP to about 1.5%, and finding more sources of revenue (non-tax revenue) through accelerated divestiture and increased dividends from state-owned companies.
Government expenditures generally reflected the GPRS priorities. However these expenditures as published do not clearly show the extent to which the poor benefited, especially the deprived areas of Northern, Upper east and Upper West and Central Regions. A more detailed breakdown of expenditure will be provided to forge a closer link between budget allocations and beneficiary targets.
The areas of budget formulation, execution and reporting still need upgrading and the link between the budget and GPRS would be strengthened further. The Budget and Public Expenditure Management System will be expanded to six other MDAs by November 2004.
As part of the Public Financial Management Reform Programme the Ministry of Finance and Economic Planning will operationalise the Financial Administration Act, the Internal Audit Agency Act and the Public Procurement Act as well as enhance the activities of the External Audit Act. The government expects timely disbursement of pledges by Development Partners and will encourage donors that are not party to the MDBS to join.
The Bank of Ghana will work to diffuse the inefficient institutional structures in the financial sector to allow for a well-functioning financial sector which impacts on growth and thus helps to reduce poverty.
The unemployment rate is a critical macro indicator of welfare but is not routinely reported on. Government will work hard to ensure that labour market information be made available more frequently. Production and Gainful Employment The Production and Gainful Employment thematic area focuses on policies designed to reduce poverty and stimulate growth by (i) the development of the rural economy through

5
modernising agriculture; (ii) sustained environmental protection through re-afforestation; (iii) enhancing infrastructural development; and (iv) creating an enabling environment for private sector activities and development. The effects of the policy actions in the four areas as well as new policy initiatives are discussed below: Modernised Agriculture Provision of irrigation facilities: An additional 1200ha of land has been irrigated in 2003. The total land area under irrigation is currently estimated at 0.08%, which indicates that the percentage of land irrigated has doubled since 2002. Rural Sector Farm and Non-Farm Growth: The farm gate price of cocoa was increased to 69% of FOB in the 2003/2004 cocoa-season to accelerate economic growth in the rural areas. Mechanised Agriculture: The farmer-tractor ratio improved from 1:180,000 to 1:150,000, and farmers had greater access to mechanised tillage, harvesters and processing equipment. Environmental Protection Through Re-Afforestation Re-aforestation: Indicators in this area suggest that progress is being made in decreasing the rate of deforestation per year from 65,000 to 50,000 hectares. Good progress towards reforestation targets is also being made with respect to replanting in forest reserves and urban areas, with 1300 hectares of urban area planted while 25,691 hectares of degraded forest reserves were planted. Land Reform: There has been some progress in land reform with respect to the issuing of Land Title certificates to individuals, and the establishment of 2 customary land administration units in 2003. Infrastructural Development Information and Communication Technology: Good progress has been made in this area, the provision of fixed phone lines has increased from 200,000 in 2002 to 283,000 in 2003 and 257 schools have been provided with ICT in 2003 compared with no schools being provided for in 2002. Energy: The implementation of the energy sector reform resulted in a number of actions including automatic price adjustments in electricity and full cost recovery, in the price of petroleum products. With respect to boosting energy for industrial development, progress has been minimal. Roads - Motorable Feeder Roads: The length of motorable feeder roads is 32,601 kilometres of which 36% are in good condition, 26% fair, and 38% in poor condition. There were considerable improvements in the routine and periodic maintenance of feeder roads achieving 88.8% of targets in 2003 compared to 53.8% in 2002.

6
Strengthening The Private Sector: There has been some profound progress in the area of reduced trade-related administrative barriers. The clearance time at customs in Tema and Takoradi ports has reduced from 2 days to one day. In addition, time spent on business registration procedures has been decreased by 34%. Policy Actions Rural Development Based on Modernised Agriculture Irrigation: By 2003, 713 out of 1309 boreholes, dugouts, water storage, stream diversions, stream and tube well pumping facilities, which were under construction had been completed. Rehabilitation of Tono and Vea dams in the Upper East region were completed at a cost of ¢950 million. Mechanization: The Agricultural Engineering Services Directorate (AESD) has rehabilitated 100 universal tractors; initiated the process of importing 200 tractors from India; awarded contracts for the local manufacture of silos, mill threshers for rice and maize graters and pressers for cassava and palm kernel processing. These programmes have been funded by a total of ¢48.2 billion from the HIPC savings. Acquisition of land for commercial farming: In 2002, very little progress was made with respect to releasing/acquiring land for commercial use. In 2003, MOFA in conjunction with Ministry of Lands and Forestry initiated a project to help in the acquisition of land for commercial farming. Aquaculture: Despite the increase in area under fish farming, the indicator on quantity of fish produced shows no progress from 2002 to 2003 thus one might infer that the policy measures put in place in 2003 have not yet translated into improved output. Access to Improved Inputs (Crops and Livestock) and Services: To improve access to inputs for livestock and crop production several projects including credit for livestock and rice farming, animal vaccines, mass cocoa spraying, ostrich farming and improved seedlings were undertaken in 2003. Promotion of the production of high value crops: Not much progress has been achieved in the promotion of the production of high value crops, even though several projects were embarked upon in 2003 such as the introduction of new varieties of exportable fruits such as pineapple, screening of planting materials and the development of production guides. Improvement in Rural Sector Farm and Non-Farm Growth: The government policy of increasing the farmers’ share of the FOB price of cocoa culminated in the increase of farmers’ share of the FOB price to 69%. Policies of providing insecticides and the mass spraying of cocoa farms were also introduced. The policy initiatives resulted in increased output by cocoa farmers of 496,793 metric tonnes during the 2002/2003-crop season.

7
Facilities to reduce post harvest losses: There has been some progress in this area. About 218 out of 253 sub-projects comprising drying floors, cooling plants, crop processors, storage facilities have been completed since 2002. Infrastructure Development ICT For Development: To increase telephone access outside the urban centres, the Ghana Telecom initiated a programme to roll out an additional 400,000 fixed-lines within 3 years. This is intended to support extension of broadband connectivity to towns with Senior Secondary Schools and Training Colleges to facilitate extension of computer literacy facilities in the schools. As of November 2003, the cumulative number of fixed-lines in the country was 283,000 indicating that 83,000 additional lines had been installed during the year. A total of 257 schools were equipped with ICT. Energy: The activities and measures for ensuring a reliable supply of high quality energy include implementation of cost recovery pricing for energy, continuation of the rural electrification programme, promotion of energy efficiency, and supporting development of renewable energy. The implementation of the automatic price adjustment mechanism to keep the energy sector viable has been put in place and implemented on quarterly basis by PURC to reflect changes in market prices. There was an 18% increase in prices for end users in 2003. Cross subsidisation for LPG, kerosene, pre-mix marine gasoline for artisan fishermen is being implemented. Roads: The activities to be undertaken in the context of the GPRS are the construction of major highways, enhancing access to markets through improved farm and feeder roads and enhancing access to urban markets. With regard to the major highways projects, construction, maintenance and reconstruction started on all the three major trunk roads radiating from Accra. These are Accra-Kumasi, Accra-Yamoransa and Accra-Aflao roads. To reduce the cost of bringing agricultural production to the market, a number of feeder road projects were undertaken during 2003. About 15,200km of road as a routine was maintained in 2003 while about 4,278 km of feeder roads were either re-gravelled, rehabilitated or underwent spot improvement. Strengthening the Private Sector: Measure to remove key regulatory and administrative barriers for investment were introduced, reducing the time to start a business from 129 to 85 days. The modernisation of customs continued in earnest with the installation of GCNET at the ports. Policy Initiatives: Production & Gainful Employment Crop production is largely rain-fed and traditional techniques of production tend to dominate. To improve production the government will encourage private commercial farming based on proper mechanised and irrigation systems. The Ministry of Trade, industry and PSI will encourage the establishment of industrial estates and clusters emphasizing agricultural machinery development.
There will be an intensification of infrastructural development, especially in feeder roads rehabilitation, construction and maintenance to provide market access to rural agriculture.

8
For the re-aforestation of degraded lands will be an early commencement of the Phase II of the Natural Resource Management Programme at the Ministry of Lands and Forestry
The Ministry of Mines has been detached from Energy and currently the budget is too small for the activities geared towards poverty alleviation. The government will assess the feasibility of using a percentage of the Mineral Development Fund as seed money outside GoG expenditures to finance poverty reduction projects and the Ministry‘s activities will be highlighted in the GPRS update. Again, the activities of the Ministry of Tourism are not fully captured in the GPRS and will also be fully integrated in the GPRS during the update for the 2006-2008.
Data collection has been a major problem and it is recommended that MDAs are resourced to maintain units, which will be required to provide quarterly information in a standard framework.
The Ghana Statistical Service is the government agency mandated to provide quality data. The Service lacks the capacity for data collection. There is a need to strengthen and deepen the involvement of the Service in major government-sponsored data collection projects. For example, the Service could have been involved in the PSIAs in the data collection components, and the analysis left to independent consultants.
To be able to continually monitor the progress of the implementation of the GPRS, the CWIQ could be conducted annually, but with a reduced sample size.
Currently, the Ministry of Food and Agriculture captures data for only food crops. There is a need to expand the coverage of the Annual Survey to include non-food crops. The capacity to capture additional data is required. In the area of processing of agricultural produce, the Ministry of Trade, Industry and Presidential Initiatives has not achieved much. The emphasis has now being shifted to the Rural Enterprise Development Programme, which involves the establishment of three enterprises each in all the 110 districts.
Human Resource and Provision of Basic Services The Human Resources and Provision of Basic Services thematic area focuses on policies in (i) access and quality education; (ii) access to health care; (iii) provision of potable drinking water; and (iv) provision of sanitary environment. The effects of the policy actions in the four areas as well as new policy initiatives are discussed below Education Most of the policy measures in education implemented in 2003 were expected to impact positively on primary school enrolments and reduce the gender gap in enrolments, especially in the most deprived regions. Analysis of the Gross Primary Enrolment Ratio (GPER) nation-wide shows that GPER increased from 79.5% in 2001/2002 to 81.1% in 2002/2003 academic year. There was a tremendous leap in the gross primary enrolment rates in the three deprived regions far in excess of the nation-wide growth rate. For example the GPER in the Upper West Region increased by 6.5 percentage points from 63.1% in 2001/2003 academic year to 69.6% in the 2002/2003 academic year exceeding the GPRS target for 2005 projected at 63%.

9
The analysis of GPER with regard to progress towards the achievement of gender parity in education points to similar trends. The national GPER for girls increased from 77% in 2001/2002 to 77.7% in 2002/2003 while the Upper West Region registered a rate of 70.3% in 2002/2003 up from the 63% rate for 2001/2002. This leap in the GPER for the deprived regions of the country and especially for girls reflects the tremendous effort of government in reducing the regional and gender disparity in access to education in the country. With regard to improving quality of education the situation is mixed. The pass rate for Criteria Reference Test (CRT) still remain very low given that only 9% of pupils in public schools were able to achieve masterly scores in Maths and 12% mastery scores in English in 2001/2002 academic year and the national PTR is falling rather than increasing towards its target. However, there was some appreciable increase in the proportion of trained teachers in primary schools from 69.9% in 2001/2002 to 73.5% in 2002/2003 academic year. Among the factors affecting quality of education is the large number of trained teachers who go on study leave annually and teacher attrition. Policy Actions Most of the policy actions in education implemented in 2003 were expected to impact positively on primary school enrolments and reduce the location and gender gaps in enrolments by enhancing access across regions and gender. Enhancing access to education To improve access to primary education, a total of 685 3-unit classroom blocks were constructed in 2003. An amount of 39 billion cedis from HIPC fund and 14.9 billion cedis contribution from the GETfund was disbursed during the year towards construction of an additional 440 six-unit classroom blocks. To ensure equity in access to quality education at the SSS level, the Ministry of Education selected 31 senior secondary schools located in deprived districts for upgrading to model schools in 2002. A total amount of 48 billion cedis was disbursed to implement the project. Information available in 2003 show that works on the first batch of 31 schools is progressing steadily. The following teacher retention schemes were implemented in 2003. • Measures were put in place to reduce the number of trained teachers on study leave with
pay. A total of 5,000 teachers went on study leave in the 2003/2004 academic year, compared to a higher figure of 6,033 in the 2001/2002 academic year.
• Distance Education and Sandwich programmes were implemented as a strategy for reducing the number of teachers applying for study leave. The number of teachers enrolling for these programmes increased from 750 in 2001/2002 academic year to 3,618 in 2003/2004 academic year. This is additional to the 4,500 students mainly teachers admitted into the Cape Coast University and Winneba distance education programmes, which received an allocation of 839.3 million cedis from the GETFund.
• Incentive packages were provided for teachers in deprived areas. These included: -5,000 radio cassette players -5,000 sets of cooking utensils -14, 400 bicycles

10
• To ease the perennial accommodation problems faced by teachers who are posted to deprived districts, a total of 56-teacher accommodation units were constructed in 2003, with 23% located in the three Northern regions.
• One initiative adopted for ensuring teacher retention involves the sponsorship of teacher trainees by districts. The beneficiaries of the district teacher-training programme are required to return to the districts after training. The teachers are bonded to teach in the districts for at least three years after being sponsored. 2000/2001: 76% of teacher trainees admitted to the programme 2002/2003: 91% of teacher trainees admitted to the programme 2003/2004: All teacher trainees to be sponsored under the district programme
Reducing gender disparity in education In the 2003/2004 academic year, an amount of ¢8.885 billion from the GET fund was allocated to the Ministry of Education, Youth and Sports to provide scholarships for pupils in basic schools. The fund has not yet been disbursed. However, the proposed formula for disbursement in 2004 is expected to lead to more girls accessing financial support and reducing drop out rates among them as the distribution criteria favours girls. Recommended Policy Initiatives The analysis clearly shows increases in GPER nationally and reduction in disparity across regions and gender in line with the objectives of the GPRS. The monitoring of quality of education indicators however shows mixed results. Government will continue to pursue the current policies to ensure more equity in access. Special attention will be paid now to quality issues in the next round of GPRS implementation. Teacher retention is key to ensuring quality education and reducing school drop out. Impact assessment of the teacher retention schemes will be conducted regularly to ascertain the differential impact of the different schemes being implemented. Health The indications are that both infant and childhood mortality rates have increased in the last past years. Infant mortality increased from 57 per 1000 live births in 1998 to 64 per 1000 births in 2003, an increase of about 12.3%. The increase in childhood mortality was smaller-from 108 per 1000 live births in 1998 to 118 per 1000 live births in 2003. There are many reasons that may account for the observed increases in infant mortality and childhood mortality. These include lack of access to clean water and sanitation; poor access to health services (including immunization coverage); child malnutrition; and lack of money to cover health expenses. The phenomena requires a more detailed analysis of the 2003 DHS mortality data and further studies by the Ghana Statistical Service. Coupled with increases in infant and child mortality, is the emerging phenomenon of child malnutrition. The level of child malnutrition as measured by the proportion of children underweight has increased by 10.5 percentage points in the last five years. Analysis by region reveals that child malnutrition increased in all the regions, except the three northern regions; and prevalence is above the national average in the Ashanti (46%), Greater Accra (40.4%) and Western (36.9%) regions. In the area of Water and Sanitation, the available data indicates that progress towards increasing access to safe water to the rural population is steadily on course. The proportion of

11
rural population with access to safe water increased from 40.0% in 2000 to 46.6% in 2003. However, reported cases of guinea worm, a water-borne disease increased from 5,545 in 2002 to 8,000 in 2003 suggesting the need to increase access and improve on the quality of water accessible to the rural population, which is a function of the type of water delivery system. Trend in access to safe sanitation remains very low with a national average of just over 55 percent. Access to adequate sanitation in the three northern deprived regions is around 20 percent or lower. Policy Actions The government’s effort to enhance the delivery and increasing access to health services continued in 2003. Measures undertaken include the provision of at least one model health centre in each district; replacing the cash and carry system; increasing the coverage of exemptions; carry out rapid delivery programmes to reduce under-five and maternal mortality; and improving access to safe water, especially in Guinea worm endemic areas. . Provision of one model health centre in each district In 2003, fifteen Health Centres and two District Hospitals (Bimbilla and Begro) were completed for use through the support of the OPEC Fund and Ghana Government. An additional fifteen health centres, which started under the Saudi Phase II, are expected to be completed by January 2004. Work on upgrading three Health Centres at Juabeso, New Edubiase and Nkwanta was also initiated and will be completed by June 2004 Replacing the cash and carry system In line with Government policy of replacing the ‘cash and carry’ system with an Insurance Scheme, Parliament passed the National Health Insurance Act during the year under review. With regard to implementation of the scheme, 45 districts have been piloting the scheme. Out of the 45 districts
-10 are managing benefits and claims -15 are at the stage of registration of members and collection of contributions -7 are coding streets and houses -8 are sensitising their communities -5 have started their stakeholder consultations.
In addition an amount totalling 41.6 billion cedis of HIPC funds was released to 108 districts, including 12 sub-metros in Kumasi, Accra and Sekondi-Takoradi to facilitate the implementation of 120 District Mutual Health Insurance Schemes. Increasing coverage of Exemption Recurrent budget spent on exemption increased from 12.8 billion cedis in 2002 to 24 billion cedis in 2003. An additional amount of 17.2 billion cedis was provided by the Government to cover exemptions in the deprived Northern regions and the Central region. The Ministry of Health in collaboration with UNICEF are currently implementing a high Impact and Rapid Delivery Programmes to reduce under-five and maternal mortality in all districts in two deprived regions (Northern and Upper East regions).
12
Improving access to safe water In order to improve access to safe water and sanitation the following activities were under taken in rural and peri-urban communities with emphasis on guinea worm endemic areas.
-1290 new boreholes were constructed -115 boreholes were rehabilitated - 61 new hand-dug wells were constructed. -65 small community/town pipe systems were completed.
Recommended Policy Initiatives It is essential to review health sector priorities to take into account the recent increases in infant and childhood mortality rates in the country. Due to the observed positive correlation between child malnutrition and under-five mortality, child nutritional programmes will be strengthened and expanded. The full implementation of the National Health Insurance Scheme will be accelerated to ensure that poor people have access to quality health services. Access to adequate sanitation remains very low in the country. Sanitation issues will be given special attention in the next phase of the GPRS implementation. Governance The key areas of focus under governance in the GPRS are Security and the Rule of law; Decentralisation and Public Sector Reform. Security and Rule of Law As a result of the changes that have taken place in the police service including recruitment of new personnel, increase in logistics, creation of neighbourhood watch committees and increased patrol, the police have reported a reduction in the crime rate across the country. The effort to extend the coverage of policing across the country included the provision of 470 new vehicles and communication equipment. This has greatly expanded the fleet of patrol vehicles from a low figure of 100 in 2000 to close to 700 by the end of 2003. The Women and Juvenile (WAJU) Unit extended its presence beyond the regional capitals. It opened new offices in Tema (regional), a District office in Swedru and has established WAJU desks in Dansoman and Odorkor. The expansion of the Unit is bringing help closer to more women and children who suffer all forms of abuse at the sub-regional levels. The activities of civil society organisations have heightened awareness about issues of corruption and have created a vigilante disposition in the public services. To gain firm ground for the discharge of its anti-corruption responsibilities, the Ghana Anti-Corruption Coalition undertook a major restructuring exercise. It acquired a permanent office, installed ICT equipment and strengthened its staff situation by recruiting an Executive Secretary and the full staff complement. It also undertook a follow-up survey to its initial Anti-Corruption study and published and disseminated the proceedings of its 5th Governance Workshop.

13
Decentralisation The capacity building efforts within the district assemblies are helping to improve service delivery and increase the efficiency in resource use. District Assemblies are becoming more proactive and more responsive to the needs of their local communities. An equally important activity aimed at improving efficiency of the DAs is the preparation of district composite budgets. During the course of the year the Ministry of Local Government initiated action in 3 pilot districts, Dangme East, Dangme West and Akuapem North, to prepare composite budgets. A new area of cooperation that has developed between civil society and district assemblies is that of budget advocacy. Civil society organisations such as the Centre for Budget Advocacy (ISODEC) have worked very closely with many district assemblies to bring citizen voice into the budget formulation process both at the district and national levels. Public Sector Reforms The leadership of the Civil Service made up essentially of Chief Directors is currently being developed to become more forward-looking and performance oriented. The chief directors have been made to enter into performance contracts with the Public Services Commission for purposes of improving service delivery and performance orientation based on clearly defined output targets and for enhancing skills and capacity. A system of regular monthly meetings of chief directors has been institutionalised. Reorganisation of the Structure of the Civil Service was one of its first points of entry. In this direction, it focused on improving the capacity of the leadership of the Civil Service. Old Chief Directors were reassigned new portfolios and new ones were hired. The National Development Planning Commission has improved its monitoring and evaluation responsibilities. The dissemination of the 2002 APR improved public understanding of the GPRS and helped to secure public interest in monitoring the implementation of the strategy. Policy actions Policy actions under good governance in support of Security and Rule of Law and Decentralisation for GPRS and Decentralised Government and Public Sector reforms in 2003 are as follows: Support to the police: As part of the efforts to extend the coverage of policing across the country, 470 new vehicles and some communication equipment were procured for the Police service in 2003 leading to an increase in the fleet of police patrol vehicles from as low as 100 in 2000 to about 700 by end of 2003. Strengthening the AG’S office: In order to deepen the rule of law, the Ministry of Justice and Attorney Generals department, undertook a number of activities including the following: • Organisation of Legal Aid Clinics by the Legal Aid Board in all regions to give advice to
the poor • Handling of 4500 cases in court for the poor

14
• Laying of the foundation by the Legal Aid Board for the publication and distribution of brochures on legal aid in seven Ghanaian languages
Also training programmes in Performance Management, Alternative Dispute Resolution, Court Automation, Case Management and Change Management were organized for some key staff of the Judicial Service. Campaign Against Corruption: The Ghana Anti-Corruption Coalition in a bid to strengthen its capacity to discharge its anti corruption responsibilities undertook a major restructuring exercise. It recruited an Executive Secretary and a fulltime of staff, acquired a permanent office and installed ICT equipment. Also an accountability office in the Office of the President to provide advice on ethical compliance issues to political appointees has been established. Support to Parliament: Parliament being one of the key governance institutions had thirty-five Parliamentarians trained in computing and change management under the National Governance Programme, The NGP also provided the Office of Parliament with ICT equipments and user licenses, library software and technology for the proposed parliamentary radio station. Decentralisation: The capacity of the District Assemblies have been enhanced through activities including the following: • A draft National Decentralization Action Plan (NDAP) prepared and initiated
consultations with stakeholders on it. • A presidential Advisory Committee has been set up to provide the necessary policy
guidance • Morale of the District staff in the local government system has been raised with the
passage of the local government Service Bill. • The preparation of composite budgets in three districts. Recommended Policy Initiatives Security and Rule Of Law
To promote a faster pace towards good governance, greater dissemination of information about policies, programmes and services will be mounted to inform the public about their rights, their obligations and the nature of services available.
Similarly, public forums to discuss issues of governance in relation to justice, accountability and security will be intensified. In this sense, public forums such as the Peoples’ Assembly, which involves the President interacting with ordinary citizens and which are replicated at the regional and in some instances, the district level, will be made a regular feature of the governance programme. Also, good governance enhancers such as the ‘Meet the Press’ series, which afford the media the opportunity to listen to and discuss issues with incumbent ministers, will continue. Indeed, more use will be made of the mass media as well as already existing civil society groups in rural and urban areas, including professional associations to discuss such matters.
It is noted that enhancement of governance should go beyond law and order. Other governance institutions are playing significant roles in expanding public space for dialogue, promoting administrative justice, upholding human rights and facilitating smooth transitions

15
in the political order. As a policy goal, the governance indicators will be revised in future to present a more comprehensive representation of all the other players.
Decentralisation Many communities are becoming more empowered to demand accountability from public office holders at the District assembly level. These are all positive spin-offs from the support to district assemblies, which will be sustained to deepen citizen participation in decision-making and ensure equity in resource allocation. Public Sector Reform The main thrust of public sector reform will be the adjustment of central government structures and organisation to make the central machinery of government more efficient, effective, and private sector-friendly. Government’s capacity to facilitate and set the development agenda will be strengthened to pave the way for private sector and other social partners to fully contribute to the national development effort. Programmes and Projects for the Vulnerable and the Excluded Progress has been made in the creation of opportunities for the vulnerable and excluded including the assertion of rights; access to services and to decent livelihood; and improvement in the quality of live of the victims of HIV/AIDS. Increased Resources for the protection of the rights of Women and Children As many as 500,000 women improved their income earning opportunities through receiving a total of ¢10 billion from the Women’s Development Fund administered by the Ministry of Women and Children’s Affairs. The Ministry has also created 50,000 new jobs for women across the country. In pursuit of its role in protecting the rights of children and reducing vulnerability, the Ministry of Women Affairs successfully undertook a programme of returning trafficked children from coastal communities around the Volta Lake to their homes. It also assisted mothers to withdraw their children and enrol them in schools and supported these women with over C825million as part of its micro-finance programme. Utilisation of Legal Aid Services In 2002, the Legal Aid Board provided legal assistance to about 4225 persons. The number has increased to above 5000 in 2003. The bulk of these cases were handled in court and some are yet to be completed because of the nature of the court process. A lot of these cases were also concluded through the ADR process. HIV/AIDS The policy objective here is the prevention of the spread of HIV/AIDS and the improvement of the quality of life of people living with HIV/AIDS and Orphans of AIDS victims. The specific interventions by the Ghana Aids Commission in 2003 were as follows:
• Information, Education and Communication • Advocacy • Peer Education • Voluntary Counselling and Testing

16
• Capacity Building for CSO • Care and support for PLWHAs • Training and technical support for beneficiary groups
The Ministry of Health in collaboration with the Ghana AIDS Commission and other civil society organisations mounted programmes during the year to increase awareness of the risk of the epidemic in the general population. The results of the Ghana Demographic and Health Survey (2003) shows that general awareness of AIDS is nearly universal among men and women in the reproductive ages in Ghana and 96 per cent of women and 98 per cent of men are conscious of a range of contraceptives for avoiding contracting AIDS. Many more Voluntary Counselling and Testing (VCT) centres were opened in a number of hospitals and clinic to assist PLWHAs with advice and drug therapy. The Ministry of Health also implemented a programme for the prevention of mother to child transmission in 19 sites and provided Anti-Retro-viral Therapy (ART) to AIDS patients in Korle Bu Teaching Hospital, Komfo Anokye Teaching Hospital, Atua Government Hospital and St. Martin De Porres Hospital, Agomenya. Of the 62000 persons that need treatment less than 1 per cent (550) receive treatment. In spite of these efforts the sero-prevalence rate of HIV/AIDS increase in sentinel sites from 3.4 to 3.6 per cent in 2003. The disease is deepening the susceptibility of the poor to lead a normal life. Policy Actions Three polices areas were monitored on vulnerability namely: Attainment of Social Justice, Prevention and control of spread HIV/AIDS and recognizing the rights of persons with Disability. Attainment of Social Justice: This focused on the utilization of legal aid service, NGO founding for Legal Aid and Increased resources for the protection of the rights of women and children. The Legal Aid Board’s offices were computerized and networked with assistance from USAID. Support to Women and Children: The Ministry of Women and Children’s affairs established a Women’s Development Fund with an initial capital of ¢21 billions. Recognizing the rights of persons with Disability: A Disability Bill has been developed and is being discussed. The Department of social Welfare was also able to provide 653 PWD with employable skills in 2003 compared to 593 in 2002. Also 108 of the trained PWD were assisted to be self-employed in 2003 compared to 80 in 2002. HIV/AIDS: To prevent the spread of HIV/AIDS and improve the quality of life of PLWHA and Orphans of HIV/AIDS, four sentinel sites namely: Atua Hospital, St. Martin’s Hospital, KATH and Korle Bu are providing ART and 19 sites are providing prevention of mother to child transmissions to prevent HIV transmission to children. Recommended Policy Initiatives

17
The logistics situation and service conditions of staff of the Legal Aid Board and the Department of Social Welfare will be improved to help expand their services especially to the vulnerable and the excluded. Rights of the destitute and prisoners with no access to legal services will remain violated if the welfare and legal services do not reach them in adequate measure. An aspect of the provision of social assistance to vulnerable and excluded groups which seems to have been taken for granted is the mainstreaming of assistance to such groups. The fact that these are crosscutting issues calls for far greater collaboration between agencies in the social sector as well as economic sectors than is currently the case. The Poverty Monitoring Groups will play the unique role of cross-fertilisation to promote poverty reduction and rights protection of the vulnerable and excluded. It is important to continue to improve coordination between the various interest groups working on the anti-HIV/AIDS campaign, in order to ensure a harmony of messages. Recent allegations and counter-allegations by the Ghana AIDS Commission and NGOs working on HIV/AIDS raise serious questions about the Anti-HIV/AIDS Campaign. The Commission would strive to find new ways of monitoring and evaluating the activities of its partners in the Campaign to avoid the dissipation of scarce resource through fraudulent deals. The overarching need to reduce the spread of the virus and to offer support to the infected as rapidly as possible and the objective of seeking cooperation with other social partners compelled the GAC to enter into partnership with groups of dubious credentials. A more vigorous proposal vetting and organisation screening arrangements will be considered in commissioning groups to participate in providing service to patients. Contracting will also be made more rigorous and sanctions enforced in the event of misapplication of resources. Performance of District Assemblies District Assemblies continued to implement poverty reducing programmes and projects in line with their district medium term development plans (DMTDP) and along the objectives of the GPRS. They continue to depend on their traditional sources of funds to execute their medium term development plans, with substantial portions coming from GoG, development partners, the DACF, HIPC relief, and internally generated funds. The timely release of the DACF by the MOF improved in the year 2003 and definite arrangement were put in place to clear arrears. The financial management of the fund by District Assemblies has improved due to strict supervision by the office of the Administrator of the DACF. Internally generated funds (IGF) of districts totalled ¢178.7 billion for the year 2003, an increase from the figure of ¢155.1 billion for 2002. This consisted mainly of revenue from fees & fines, rates, lands and licences. There were however marked declines in revenues generated in Volta, Northern and Upper East regions, which need to be investigated by the MLGRD. Cumulative figures since the start of release of HIPC funds show that notable areas that have received funds are the District Assemblies (20.6%), Education (17.0%), Water (9.7%), Roads (7.87%) and Health (6.47%). The proportion that has been used for Domestic Debt payment is 20.3%.

18
Recommended Policy Initiatives Project Selection, Design & Costing: A clear-cut approach to project selection will be provided to the Das to ensure that projects are chosen from the District Medium Term Development Plan.
Regional Coordinating Council (RCC) will represent the MLGRD to approve projects at the regional level in order to reduce the length of the approval process. The RCC will then be better informed to carry out its monitoring and coordinating role.
Funds Transfer and Communication flow: The communication process and audit processes will be significantly improved. There will be a single point of contact to check and clarify funds, which are due and have been transferred to the Districts.
Micro Credit Support: Funds will be channelled through a local Rural Commercial Bank and the bank paid a management fee, to manage the process on behalf of the DA. A Project Coordinator from the DA should be identified to manage the relationship to ensure that Micro Credit poverty reduction objectives achieved.
HIPC Completion Point, the Poverty Reduction Support Credit (PRSC) and the Multi-Donor Budget Support (MDBS) Government received support from both bilateral and multilateral donors in support of the GPRS. The HIPC Initiative was to provide debt relief in support of poverty reduction and the World Bank’s PRSC programme was also to support the implementation of the GPRS. As mentioned elsewhere 9 bilateral donors agreed last year to severally provide development assistance through budget support. This gave birth to the Multi-Donor Budget Support (MDBS) Initiative. Releases from the 3 major donor support programmes were made contingent upon a set of agreed GPRS-based performance triggers and targets. The performance of government with respect to these triggers and targets are summarized in the Technical Appendices. But for a few unanticipated implementation difficulties, all the triggers and targets were met. For instance, it is clear from Technical Appendix 1 that the triggers that government was expected to meet prior to reaching the HIPC completion point have either being fully met or in some cases have exceeded the targets and the government needs to be applauded for these efforts.

19
1 INTRODUCTION 1.1 BACKGROUND
The Ghana Poverty Reduction Strategy (GPRS) is the operational development policy framework for the country. The implementation of the GPRS, which began in 2002, has been geared towards achieving the Medium Term Priorities of the government. The Annual Progress Report (APR) of the GPRS provides a framework for the systematic review of the programme and project implementation and their impacts on the socio-economic development of the country for the year. The APR provides a platform for the monitoring and evaluation of the achievements of the GPRS targets as well as the outcomes and impacts of government policies through a set of indicators. The APR also identifies weaknesses that are likely to hinder the achievement of the goals and objectives of the GPRS and, proposes policy recommendations to help address the concerns. With an increased awareness of the importance of the GPRS, it has been used to inform all key policy and budgetary decisions both at the national and the district levels. The GPRS now is at the core of the national planning process. The budget formulation process has been enhanced, through the linkage of the MTEF and the GPRS and the use of the Annual Progress Report as a major input in the preparation of the annual budget. This process is to be strengthened in the coming year. Once the Annual Progress Report has been approved by Cabinet and endorsed by parliament, the APR will be disseminated widely as part of the ongoing GPRS dissemination process. This APR will be used to inform: • The Medium Term Expenditure Framework (MTEF) process for the preparation of the
next annual budget, to ensure that resources are refocused appropriately; • Any revisions to the 2004 annual budget; • The process of updating the GPRS, which is to begin in the fourth quarter of 2004; and • Future HIPC allocations to the District Assemblies. Given the significant resources required to fund the GPRS, the Government has prioritised the GPRS through the Medium Term Priorities (MTPs), which have been used to inform the budget. The APR uses MTP’s and the relevant 52 indicators identified in the GPRS M&E Plan as its main frame of reference. The APR also comments on the status of the GPRS-based triggers and targets for assessing performance in donor support programmes such as the Poverty Reduction Support Credit (PRSC), the Multi Donor Budget Support (MDBS), the Poverty Reduction and Growth Facility (PRGF), and for meeting the floating HIPC completion point. In addition the APR provides an assessment of the country’s performance in achieving the Millennium Development Goals. While the triggers and targets may be specific to funding programmes they are essentially monitoring tools for assessing the GPRS

20
implementation process, so monitoring them are as important to the Government of Ghana as they are to the relevant Development Partners. The 2003 APR builds on that of 2002 and provides: Data on baselines and targets including some that were not available for reporting in the
2002 APR; An update on the GPRS core indicator achievements during the year; The linkage between the 2003 Annual Budget and the GPRS; An update on GPRS Medium Term Priority programmes and projects implemented in
2003; The status of triggers and targets of the Poverty Reduction Strategy Credit (PRSC), the
Multi Donor Budget Support (MDBS); the HIPC completion point; and the Millennium Development Goals (MDG);
The status of the poverty and social impact analysis (PSIA); The summary of progress and developments with respect to monitoring & evaluation; and Recommended policy initiatives.
1.2 GPRS MONITORING AND EVALUATION
The need for monitoring & evaluating the impact of the government policies through the implementation of programs and projects has become even more critical as Ghana searches for ways to maximise the use of its limited resources. Policy makers are increasingly looking for evidence to support decisions and to evaluate the impact of resources utilised. This support for evidence-based policy decision-making has also been demonstrated by growing enthusiasm of key stakeholders in the on-going poverty and social impact studies and National Intra-Agency Poverty Monitoring Group meetings. While the monitoring and evaluation plan of the GPRS was established in 2002, its implementation began in 2003. Work is still being undertaken to strengthen data collection and analysis processes in order to provide an effective evaluation of the GPRS implementation on a timely basis. 1.3 DATA COLLECTION PROCESS AND CHALLENGES
The primary sources of information for this report were the sector ministries, departments and agencies. Although progress has been made in establishing the GPRS M&E system, there still remain challenges that need to be addressed. Through participation in the poverty monitoring group sessions, members have identified the urgent need to facilitate the harmonization of data and other information collected as part of the M&E exercise. Data inconsistency and availability from different sources was viewed as a major challenge in the monitoring exercise. Other challenges include: Problems related to accuracy and timeliness of data coming from primary and secondary
sources; Lack of motivation of staff in the MDA’s and Districts to institutionalise the collection
and provision of data; In-frequent national outcome/impact surveys by GSS due to inadequate resources; and The challenge of reporting on several indicator/trigger achievements for a number of
programs i.e. GPRS MTPs, PRSC, MDBS, HIPC and MDGs.

21
The report also uses data from earlier surveys of the GSS as well as two new surveys conducted by the GSS in the first quarter of 2003 - the Core Welfare Indicators Questionnaire (CWIQ2) Monitoring Survey, and the Ghana Demographic and Health Survey (GDHS) conducted later in the year. 1.3.1 National Core Welfare Monitoring Survey The second round of the national Core Welfare monitoring survey using the Core Welfare Indicator Questionnaire (CWIQ) was undertaken between February and April 2003 to provide information at the district level. The CWIQ survey was administered to 49,000 households, of which 67% were rural and 37% urban, with 51.3% of total sample population being female and 48.7% male. The survey which is qualitative in nature covered income or consumption poverty, education, health, nutrition, access to safe water & sanitation as part of the set of core indicators. It also includes indicators on disability, vulnerability and social exclusion. Data is also provided on other key non-income indicators of poverty such as access to basic infrastructure services and levels of unfulfilled basic needs. The results of the survey provide a comprehensive baseline for assessing the outcome and impact of GPRS in the future since it essentially reflects the situation at the beginning of the full implementation of the GPRS. 1.3.2 Ghana Demographic and Health Survey 2003 The 2003 Ghana Demographic and health Survey (GDHS) was carried out from late July to late October 2003 on a nationally representative sample of more than 6,6oo households. All women age 15-49 and all men age 15-59 in these households were individually interviewed, in addition to the data collected from interviews, the individuals were also tested for the human immunodeficiency virus (HIV). All women age 15-49 and children under age 5 were also tested for anaemia. The 2003 GDHS collected data on fertility levels, marriage, sexual activity, fertility preferences, awareness and use of family planning methods, breastfeeding practises, nutritional status of women and young children, childhood mortality, maternal and child health and awareness regarding AIDS and other sexually transmitted diseases. New features present in the 2003 GDHS that were not present in previous demographic health surveys include collection of information on female and male circumcision, malaria and mosquito nets usage, haemoglobin and HIV testing. Data from the GDHS enhances the information available on the HIV/AIDS epidemic, infant mortality rate and child malnutrition in Ghana. 1.4 GPRS M&E INSTITUTIONAL ARRANGEMENTS
The M&E institutional arrangements have been designed to facilitate active participation of stakeholders to ensure that policy recommendations are relevant and actually contribute to policy formulation and resource allocation that are geared toward the reduction of poverty and wealth creation. The following initiatives have been established and are operating in support of NDPC’s GPRS Monitoring & Evaluation activities:

22
National Intra-Agency Poverty Monitoring Groups (NIPMG) chaired by representatives of MDA’s;
GPRS Strategic Environment Assessment; GPRS Dissemination Committee; and PSIA Technical and Advisory Committees.
1.4.1 National Intra-Agency Poverty Monitoring Group (NIPMG) The GPRS M&E plan proposed the establishment of poverty monitoring groups at the national, regional and district levels. Five groups based on the GPRS thematic areas have been established at the national level currently. These groups are inter-sectoral and include both governmental and non-governmental representatives selected for their knowledge of the thematic area, (PPMED’s, Development Agency staff, Ghana Statistical Service and knowledgeable researchers). A process is underway to fully include civil society representation. Table 1.1 NIMPG Group and Composition
NIPMG
Composition
Macro-Economic Stability Chair: Min of Finance & Economic Planning, Secretary: GSS
Ministry of Finance & Economic Planning, Bank of Ghana, Ministry of Trade & PSI, Revenue Agency Governing Board, GSS, CIDA
Production & Gainful Employment
Chair: Min of Food & Agriculture Secretary: Tourism
Ministry of Food and Agriculture, Mines, Trade & PSI, Energy, Land and Forestry, Private Sector Development, Roads & Transport, Ports & Harbours, Environment and Science, Communications and Technology, Tourism, CIDA
Human Resource Development & Basic Services
Chair: Min of Health Secretary: Min of Education
Ministry of Education, Youth and Sports, Health, Works and Housing, Women and Children Affairs, Ghana Aids Commission, GSS, Community Water & Sanitation, World Bank
Governance Vulnerable & Excluded
Chair: Audit Service Secretary: NCWD
Ministry of Justice, Audit Service, Parliamentary Affairs, Electoral Commission, CHRAJ, PURC, WAJU, Interior, Public Service Commission, Office Parliament, Local Government and Rural Development, Ministry of Women and Children Affairs, National Commission on Children, Ghana Prison Service, Social Welfare, Ministry of Manpower Development and Employment, DFID & DANIDA
Some of the main functions of the poverty monitoring groups include the following: • Highlighting the importance of monitoring and evaluating the GPRS within the relevant
MDAs • Providing data towards an update of the selected indicators and policy interventions. • Reviewing and validating data, as well as policy recommendations. The monitoring groups have held a series of meetings since the inauguration of the NIPMG in mid 2003. Deliberations at these meetings have helped to deepen the involvement of MDA’s in the GPRS M&E process. Members have had the opportunity to comment on the APR and provided significant input to baselines, targets & indicator achievements. These

23
meetings have been useful starting points having provided fora to discuss results of data collected, as well as the validation of analysis contained in this APR. 1.4.2 Civil Society Organizations A lot of support has been received for the Poverty Monitoring Groups at the national level. There is however the need to strengthen the process by including civil society, who have a crucial role to play in the process. By having access to monitoring and evaluation results, civil society organizations can generate participatory review of the poverty reduction efforts that should increase accountability and transparency of public resource allocation and utilization. The inclusion of CSO’s in the process is to be undertaken during the second quarter of 2004, by concluding the interactions with key representatives of the Civil Society Organizations. Given the number of CSO’s and their differing interests, forums will be held to ensure that an effective mechanism is established to enable effective representation of CSOs in the M&E process. 1.4.3 Regional Poverty Monitoring Groups To deepen the GPRS M&E process, the M&E institutional arrangements will be rolled out to the regions over the coming year. This will be done by expanding the Regional Planning Coordinating Units (RPCUs) to play additional role as the regional poverty monitoring groups. The Regional Poverty Monitoring Groups membership will expand the RPCU and will include among others the Regional Heads of the Ghana Statistical Services (GSS), the regional representative of the relevant MDAs, representatives of NGOs and CSOs, the Regional Representative of the NDPC and a representative of the Regional House of Chiefs. The role of the regional poverty monitoring groups will include:
• Receive, collate and evaluate data from District level M&E for onward transmission to the national level;
• Evaluate, recommend and support M&E capacity building for the District Assemblies;
• Review data to ensure accuracy and consistency • Facilitate dissemination of relevant feedback to all districts and stakeholders; • Ensure that gender based analysis is undertaken in all districts; • Hold bi-annual workshops to involve all DAs within the region for cross District
GPRS review and policy recommendations; and • Provide bi-annual regional poverty status reports and make recommendations for
policy review 1.5 GPRS DISSEMINATION
A comprehensive communication strategy was developed at the end of the third quarter of 2003, to inform and educate all stakeholders about the GPRS. The strategy was based on a communication needs assessment conducted at the national, district and community levels. The strategy has the following objectives: To effectively create the awareness about the goals, objectives, benefits as well as the
monitoring and evaluation process of the GPRS

24
to solicit stakeholder support and sense of ownership to regularly inform stakeholders about the progress of GPRS and to create forums to solicit feedback
The implementation of the communication strategy, which targets various stakeholders at the National, Regional, District and the Community levels, has begun. To facilitate dissemination of the GPRS, a simplified version was prepared and translated into local languages. 1.6 POVERTY AND SOCIAL IMPACT ANALYSIS
As part of the process of determining the impact of the socio-economic policies on the poor, poverty and social impact analysis (PSIA) studies are being undertaken. The PSIA’s are targeted at various social issues aimed at analysing the distributional impact and outcome on the welfare of the poor as a result of new policy reforms. The findings of these studies will aid evidence-based policymaking. It is hoped that the transparent conduct of these PSIAs and its results will stimulate and provoke public debate on policies. The National Development Planning Commission (NDPC) with the support of Development Partners has commissioned five Poverty & social impact analysis (PSIA) studies to find out, ex-ante as well as post facto, the impacts of certain policy reforms carried out under the GPRS. The aims of the PSIAs that have been commissioned are contained in the Table1.2 below. Table: 1.2 Poverty & Social Impact Analysis Studies commissioned by the NDPC STUDY
AIMS OF THE STUDY
1 Energy Sector Reform in Ghana: Electricity Tariffs
Effectiveness of current subsidy to protect the poor Effects of tariff increases on residential consumers Affordability of current tariffs
2 Tackling Vulnerability And Exclusion In Ghana
The nature and extent of vulnerability and social exclusion in Ghana
The conditions, events and underlying trends that present risks to individuals and households and exclude them from effective participation in mainstream economic, social and political activities
Deepen the understanding of coping mechanisms and strategies of individuals and households when risks materialise and how these could be strengthened and enhanced.
3 Assessment of the Distributional Impact and Effects of Ghana’s Petroleum Pricing Policy
To analyse the distributional impact of current petroleum pricing reforms on the welfare of different stakeholder groups, particularly the vulnerable and excluded
To assess the effectiveness of the targeting mechanism under the prevailing regime
To bolster the existing capacity for evidence-based policy making, national ownership and sustainable pro-poor policy formulation
4 Economic Transformation of the Agricultural Sector
The extent to which the Economic Transformation of the Agricultural Sector will compound or mitigate the constraints facing smallholder / subsistence farmers
Trade-offs between production-oriented and poverty-oriented agricultural policies
Allows for poor farmers to access and benefit from

25
mechanisms to increase production The Impact on food security and vulnerability Whether guidelines for the allocation of HIPC funds
sufficient to meet aims of growth and poverty reduction 5 Enhancing Capacity for Pro-Poor
Decentralisation Are decentralization measures designed to improve poverty
reduction strategies at the local level
PSIA Technical Committees have been established made up of representatives from the various stakeholder organizations. The committees are providing support to the Researchers undertaking the studies. A Steering Committee, made up of Ministers and Heads of institutions, have oversight responsibility for the studies. The Steering Committee will also spearhead the effort to get recommendations from the studies implemented. Table 1.3 Technical Committees for PSIA
Poverty & Social Impact Analysis Studies
Membership of Technical Committee
Energy Sector Reform in Ghana: Electricity Tariffs
Ministry Of Energy, Energy Commission, PURC, MOFEP, Consumers Association, VRA, ECG, NED NDPC & World Bank
Tackling Vulnerability And Exclusion In Ghana
Ministry Of Manpower & Employment; Dept of social Welfare; Ministry of Women & Children; MOFEP; NADMO; Min. of Food &Agric; DFID & NDPC
Assessment of the Distributional Impact and Effects of Ghana’s Petroleum Pricing Policy
Ministry of Energy; Energy Commission; Ministry Of Environment and Science; CSIR (STEPRI); Office Of The President; TOR; PURC; Consumers Association; UNDP, NDPC
Economic Transformation of the Agricultural Sector
Ministry Of Food And Agriculture; GEPC; MOFEP; NADMO; CSIR; NDPC, DFID
Enhancing Capacity for Pro-Poor Decentralisation
MLGRD; MOFEP; Management Services Division- Head of Civil Service; NALAG; Office Of The President, GTZ/KFW, NDPC
1.7 STRENGTHENING THE M&E PROCESS
To strengthen the M&E process it is important that the results of the process are disseminated widely and made relevant to various stakeholders. Thus a key factor to consider in the coming year will be establishing an effective feedback loop that allows the M&E results to be fed back to the various stakeholders. The feedback will be targeted at decision makers at the national level through the Cabinet, MDAs and Parliament and to the regional and district levels through the Regional Poverty Monitoring Groups. Thus the following additional activities are planned:
• Review workshops will be organized for a selected group of stakeholders to canvass ideas to improve the M&E process. The feedback issue is even more critical at the regional and district levels where most people feel left out in the process.
• To promote the culture of evidence-based policy making, orientation sessions will be held for policy decision makers in the MDAs
• To augment the efforts to date and to coordinate the national M&E efforts, the Technical Committee proposed in the M&E plan will be established and the initial committee will be made up of senior representatives from NDPC, More, GSS, MLGRD, and Coop.

26
• Results of the M&E process will be disseminated widely to policy makers, program managers, program beneficiaries, development partners, the media, CSOs and research community;
• Beyond broad dissemination, a well-established process to feed M&E results back to policy makers is crucial if results are to be used in formulating policy. Since key policy decisions are made at the time of budget formulation, key M&E results should be available then. Thus in addition to the 2003 APR, the third quarter GPRS M&E Quarterly Bulletin for 2004 will be completed in time to be used in the preparation of the 2005 Annual Budget.
1.8 GPRS CORE INDICATORS
The next table provides a comprehensive list of the core indicators for monitoring and evaluating the GPRS. The table provides targets, indicator levels for 2002 and the status for 2003. This list has been extended from the original 52 core indicators, to include an additional seven indicators for Agriculture and two indicators for the Environment. The new indicators are: Agriculture
− Percentage of post harvest losses − Tonnes of silo space established − Extension officer farmer ratio − Area under fish farm − Percent of arable land under irrigation − Number of dugouts constructed − Level of Mechanisation: tillage, harvesters & processing equipment
Environment
− Rate of deforestation − Hectares of degradable forest reserve planted
The additional indicators were selected based on following factors:
• The availability of data • The extent to which they provided a balance between input, output and outcome
indicators • The views of stakeholders • The links of the indicator to the Medium Term Priorities of the GPRS

27
Tab
le 1
.4
Sum
mar
y of
Pro
gres
s - G
PRS
Cor
e In
dica
tors
In
dica
tor
Ta
rget
In
dica
tor L
evel
20
02
Stat
us
2003
Pr
ogre
ss
tow
ard
targ
et
1.
Real
per
cap
ita G
DP
grow
th ra
te
2.1%
1.
8%
2.6%
-
2.
Food
pric
e in
flatio
n 15
%
22%
21
.5
Targ
et
not
achi
eved
3.
G
row
th o
f Dom
estic
reve
nue
N/A
28
.8%
56
.2%
-
4.
Gro
wth
of c
redi
t to
agric
ultu
re
N/A
9.
04%
51
.12%
-
5.
Tim
ely
disb
urse
men
t of b
udge
ted
MD
A a
lloca
tion
N/A
N
/A
N/A
6.
Prop
ortio
n of
tota
l res
ourc
es g
oing
to k
ey G
PRS
sect
ors
64.7
5 79
.6
74.7
8 A
chie
ved
7.
Are
a of
deg
rade
d la
nds &
wat
er b
odie
s rec
laim
ed th
roug
h re
fore
stat
ion
N/A
N
/A
N/A
-
8.
Rate
of d
efor
esta
tion
65
,000
ha p
er y
r 50
,000
ha p
er y
r -
9.
Ha
of d
egra
dabl
e fo
rest
rese
rve
plan
ted
60,0
00ha
25,6
91 h
a O
n tra
ck
10.
Peop
le w
ith a
cces
s to
non
woo
d fu
el
N/A
N
/A
43.4
%
- 11
.N
umbe
r of s
mal
l sca
le a
gro-
proc
essin
g fir
ms
N/A
N
/A
N/A
-
12.
Real
per
cap
ita a
gric
ultu
re g
row
th ra
te
1.9%
1.
8%
3.5%
13.
Real
per
cap
ita fo
od c
rop
grow
th ra
te
2.2%
2.
6%
2.7%
Im
prov
ing
14.
Leng
th o
f mot
orab
le fe
eder
road
s
32
,601
km
(36%
goo
d, 2
6% fa
ir, 3
8% p
oor)
Im
prov
ing
15.
Num
ber o
f fun
ctio
ning
em
ploy
men
t cen
tres
N/A
N
/A
N/A
16.
Num
ber o
f com
mun
ity re
sour
ce m
anag
emen
t are
as
esta
blis
hed
N/A
2
1 -
17.
Life
line
pric
ing
for e
lect
ricity
sec
tor d
evel
oped
and
im
plem
ente
d N
/A
In P
lace
In
Pla
ce
Ach
ieve
d
18.
Feed
er ro
ads c
ontra
ct ti
me
lags
N
/A
N/A
N
/A
19
.Pe
rcen
tage
of p
ost h
arve
st lo
sses
15
-20%
C
erea
ls: 2
5-30
%
Peris
habl
es:
35%
-40%
20-2
5%
35-3
8%
Mod
est
prog
ress
20.
Tone
s of s
ilo sp
ace
esta
blis
hed
35m
t 35
mt
35m
t N
o pr
ogre
ss
21.
Exte
nsio
n of
ficer
farm
er ra
tio
1:40
00
1:45
00
The
ratio
rem
ains
1 to
450
0 be
caus
e hu
man
reso
urce
m
anag
emen
t dire
ctor
ate
did
not r
ecei
ve th
e go
ahe
ad
to re
crui
t add
ition
al e
xten
sion
age
nts a
nd a
gric
ultu
ral
offic
ers
No
prog
ress
22.
Are
a un
der f
ish
farm
45
0ha
350-
400h
a 45
0ha
Targ
et

28
In
dica
tor
Ta
rget
In
dica
tor L
evel
20
02
Stat
us
2003
Pr
ogre
ss
tow
ard
targ
et
achi
eved
23
.Pe
rcen
t of a
rabl
e la
nd u
nder
irrig
atio
n 0.
12%
(33,
000h
a)
0.04
%(1
1,00
0h)
An
addi
tiona
l 120
0ha
of la
nd ir
rigat
ion
in 2
003,
tota
l la
nd a
rea
unde
r irr
igat
ion
is c
urre
ntly
est
imat
ed a
t 0.
08
Goo
d pr
ogre
ss
24.
Num
ber o
f dug
outs
con
struc
ted
262
237
713
out o
f 130
9 (b
oreh
oles
, dug
outs
, wat
er st
orag
e,
stre
am d
iver
sion
, stre
am &
tube
wel
l pum
ping
)
25.
Farm
er a
cces
s to
mec
hani
zed
tilla
ge
Acc
ess t
o ha
rves
ters
A
cces
s to
proc
essi
ng e
quip
men
t
15%
5%
30
%
Less
than
5%
Le
ss th
an 2
%
20%
8% in
2003
2%
in 2
003
24%
in 2
003
mad
e up
of:
1. C
assa
va p
roce
ssin
g 2.
Pa
lm o
il pr
oces
sing
equ
ipm
ent 3
.Ric
e Th
resh
ers a
nd
mill
s 4.T
omat
o pr
oces
sing
equ
ipm
ent
Goo
d pr
ogre
ss
-
26.
Num
ber o
f cur
rent
land
cas
es c
oncl
uded
R
educ
ed
by
35,0
00
(200
8)
60,0
00 c
urre
ntly
in
cou
rt N
/A
-
27.
Child
mal
nutri
tion
(em
phas
is o
n po
ores
t reg
ions
) 20
26
35
.8
Not
on
track
28
.In
fant
mor
talit
y ra
te
50/1
000
57/1
000
64/1
000
Not
on
track
29
.G
ross
enr
olm
ent r
atio
in p
re-s
choo
l and
bas
ic s
choo
ls
(prim
ary
/ JSS
) 88
.5
79.5
81
.1
On
track
30.
Surv
ival
rate
to P
6 an
d JS
S 3
N/A
N
/A
N/A
-
31.
Redu
ctio
n in
the
repo
rted
case
s of G
uine
a w
orm
0
5,54
5 8,
000
(44.
3% in
crea
se si
nce
2002
) N
ot o
n tra
ck
32.
Perc
ent o
f rur
al h
ouse
hold
with
acc
ess t
o sa
fe w
ater
- G
SS-
CWIQ
54
49
.5 (1
997)
63
.0
Exce
eded
33.
Perc
ent o
f hou
seho
lds w
ith a
cces
s to
adeq
uate
toile
t fac
ilitie
s (f
lush
or K
VIP
) -
16.8
(199
7)
33.1
%
-
34.
Perc
ent o
f dep
rived
bas
ic sc
hool
s (pr
imar
y/JS
S) im
prov
ed,
with
em
phas
is o
n th
e 3
Nor
ther
n re
gion
s 30
% -
2004
20
%
685
clas
sroo
ms b
lock
con
stru
cted
in 2
003.
42
0 of
685
(61.
3%) o
f cla
ssro
oms c
onst
ruct
ed w
ere
loca
ted
in th
e 3
Nor
ther
n re
gion
s
Exce
eded
35.
Perc
ent o
f tra
ined
teac
hers
in p
re-s
choo
ls a
nd b
asic
sch
ool
(prim
ary/
JSS)
70
.6
69.6
-
-
36.
Imm
uniz
atio
n co
vera
ge (D
PT3)
90
87
.9
91.1
Ex
ceed
ed
37.
Prop
ortio
n of
supe
rvis
ed d
eliv
erie
s 55
44
.3
47.1
O
n tra
ck
38.
Num
ber o
f new
func
tiona
l wat
er s
yste
ms
Bor
ehol
es
622
65
1290

29
In
dica
tor
Ta
rget
In
dica
tor L
evel
20
02
Stat
us
2003
Pr
ogre
ss
tow
ard
targ
et
Wel
ls
Pipe
s
29
61
65
-
39.
Perc
ent o
f tot
al g
over
nmen
t exp
endi
ture
on
heal
th in
crea
sed
from
5.7
% 2
000
to 7
% b
y 20
04
7 10
.5
11.8
Ex
ceed
ed
40.
At l
east
10%
incr
ease
in th
e am
ount
bud
gete
d fo
r exe
mpt
ion
fees
12.8
Bill
ion
Incr
ease
d to
24
Bill
ion.
17.
2 bi
llion
was
pro
vide
d as
ad
ditio
nal m
oney
by
the
Gov
ernm
ent t
o in
crea
se
cove
rage
to th
e de
priv
ed N
orth
ern
and
cent
ral r
egio
ns
On
track
41.
The
num
ber o
f fun
ctio
nal W
ater
and
San
itatio
n B
oard
s;
Dis
trict
Wat
er a
nd S
anita
tion
Com
mitt
ees;
Com
mun
ity W
ater
an
d Sa
nita
tion
Com
mitt
ees
N/A
N
/A
N/A
N
/A
42.
Inci
denc
e of
pov
erty
32
%
39%
- (2
000)
N
/A
-
43.
Inci
denc
e of
ext
rem
e po
verty
21
%
27%
-N
/A
- 44
. H
IV A
IDS
Prev
alen
ce
3.6%
3.
8%
3.6%
Ex
ceed
ed
targ
et
45.
Acc
essi
bilit
y of
serv
ices
(dis
aggr
egat
ed to
serv
ices
, reg
ion,
di
stric
ts)
Som
e da
ta is
ava
ilabl
e fr
om th
e 20
03 C
WIQ
, but
not
en
ough
to e
stab
lish
leve
ls
-
46.
Acc
ess o
f ext
rem
e po
or to
serv
ices
(disa
ggre
gate
d to
serv
ices
, re
gion
, dis
trict
s
So
me
data
is a
vaila
ble
from
the
2003
CW
IQ, b
ut n
ot
enou
gh to
est
ablis
h le
vels
-
47.
Dru
g Ba
sed
treat
men
t ava
ilabl
e fo
r peo
ple
with
AID
S
4
Sen
tinel
Site
s are
pro
vidi
ng A
RT
for P
LWH
A a
nd 1
9 se
ntin
el si
te a
re im
plem
entin
g a
prog
ram
me
for t
he
prev
entio
n of
mot
her t
o ch
ild tr
ansm
issi
on
On
track
48.
Ade
quat
e se
curit
y an
d pr
otec
tion
for w
omen
and
chi
ldre
n
5,51
6 ca
ses
hand
led
by W
AJU
6,29
8 ca
ses h
andl
ed b
y W
AJU
. WA
JU e
stab
lishe
d in
all
Reg
ions
, Des
k of
fice
in O
dork
or a
nd D
anso
man
and
a
Dis
trict
Off
ice
in S
wed
ru
On-
track
49.
Bud
gets
ava
ilabl
e to
inst
itutio
ns c
arin
g fo
r vul
nera
ble
and
Excl
uded
16
7,96
9,86
6 ce
dis s
ecur
ed so
far
-
50.
App
ropr
iate
indi
cato
rs d
evel
oped
to m
onito
r cha
nge
in w
ell
bein
g of
vul
nera
ble
and
excl
uded
, acr
oss t
he e
ntire
GPR
S
PS
IA c
urre
ntly
on
goin
g an
d in
dica
tors
are
bei
ng
deve
lope
d O
n tra
ck
51.
Leve
l of p
erce
ived
cor
rupt
ion
in k
ey G
PRS
func
tiona
l are
as
No
surv
ey c
ondu
cted
yet
-
52.
Gov
ernm
ent E
xpen
ditu
re R
epor
ts p
ublis
hed
R
epor
t pub
lishe
d m
onth
ly in
gaz
ette
O
n tra
ck
53.
Loca
l saf
ety
and
secu
rity
inst
itutio
ns in
pla
ce: p
olic
e/ci
tizen
ra
tio
1:92
5 B
y 20
04
1:11
42
1:1,
121
Po
lice
/citi
zen
ratio
O
n tra
ck
54.
Dis
sem
inat
ion
of P
arlia
men
tary
deb
ates
on
pove
rty a
nd
deve
lopm
ent
Dis
sem
inat
ion
occu
rred
thro
ugh
inte
ract
ion
with
uni
t co
mm
ittee
mem
bers
, mas
s and
prin
t med
ia.
On
track
55.
Util
izat
ion
of L
egal
Aid
Ser
vice
s
4225
45
00 c
ases
– U
tiliz
atio
n by
poo
r inc
reas
ing
but n
ot
On
track

30
In
dica
tor
Ta
rget
In
dica
tor L
evel
20
02
Stat
us
2003
Pr
ogre
ss
tow
ard
targ
et
adeq
uate
56.
Func
tioni
ng E
lect
roni
c Tr
acki
ng S
yste
m
2 M
DA
s Est
ablis
hed
in M
OFE
P &
CA
GD
O
n tra
ck
57.
Com
posi
te b
udge
t dev
elop
ed a
nd s
ubm
itted
Yet
to b
e im
plem
ente
d 3
pilo
t dis
trict
s. A
ctio
n w
as in
itiat
ed 3
pilo
t dis
trict
s -
Dan
gme
East
and
Wes
t and
Aku
apem
Nor
th
On
track
58.
Parli
amen
tary
Com
mitt
ee o
n Po
verty
Red
uctio
n es
tabl
ishe
d C
omm
ittee
to
be
set u
p in
200
2
Ad
hoc
Com
mitt
ee
esta
blis
hed
and
disc
usse
d th
e G
PRS
Doc
umen
t
Ad
hoc
Com
mitt
ee in
pla
ce a
nd m
et in
Nov
embe
r 200
3.
Effo
rts a
re b
eing
mad
e to
mak
e it
a St
andi
ng
Com
mitt
ee
Ach
ieve
d
59.
Dem
ocra
tic e
ffec
tiven
ess o
f the
Dis
trict
Ass
embl
ies
Incr
ease
D
AC
F to
7.
5% o
f Ta
x R
even
ue
5%
DA
CF
incr
ease
d to
7.5
%.
All
DA
s mee
t reg
ular
ly a
s ens
hrin
ed in
the
LIs.
Ach
ieve
d
60.
Polic
y Fe
edba
ck fr
om M
&E
syst
em
20
02 A
nnua
l Pr
ogre
ss R
epor
t,
Com
mun
icat
ion
Stra
tegy
, Qua
rterly
B
ulle
tin, 2
002
APR
was
use
d to
in
fluen
ce 2
004
budg
et
2003
APR
pre
pare
d.
On
track

31
1.9 SECTIONS OF THE REPORT
The report is structure as follows:
• Section I provides an overview of the key activities supporting the monitoring and evaluation processes of the GPRS;
• Section II analyses the extent to which 2003 Annual Budget reflected the poverty reduction development strategies of the GPRS;
• Section III analyses the Macroeconomic thematic area and deals with the overarching macroeconomic indicators that are seen as essential for poverty reduction in the country.
• Section IV is on Production and Gainful Employment, which deals mainly with modernization of agriculture, infrastructure development, energy and the development of small-scale agro-processing.
• Section V reviews policies, projects and activities relating to education, health, water & sanitation, and HIV/AIDS under the Human Resource Development and Basic Services thematic area;
• Section VI is on Governance and it deals with security and rule of law, decentralization, corruption and support for parliament;
• Section VII focuses mainly on the protection and human rights of the Vulnerable and the Excluded;
• Section VIII is on Performance of the District Assemblies;
• Section IX provides the progress of the Millennium Development Goals;
• Section X provides a summary of the policy recommendations.

32
2. THE LINKS BETWEEN THE GPRS AND THE 2003 BUDGET
2.1 INTRODUCTION
In the 2002 Annual Progress Report (APR) the extent to which the 2002 Annual Budget reflected the policy thrust of the GPRS was discussed. This part of the 2003 Annual Progress Report looks at whether the 2003 budget reflected the thrust of GPRS. This will give an indication of whether government is persistent in its poverty reduction strategy and whether resources are allocated appropriately. The assessment of the consistency of the budget with the GPRS will be from the perspective of: a) The distribution of total discretionary expenditure; b) Sectoral distribution of Government of Ghana’s (GoG) resources; c) Distribution of donor allocations and; d) The distribution of expenditures by item of expenditure: personnel emoluments (item 1),
administration (item 2), service (item3), and investments (item 4).
2.2 DISCRETIONARY BUDGET FOR 2003 AND THE MEDIUM TERM PRIORITIES?
A comparison between the GPRS 2003 sector targets and the 2003 budget outturns by sectors shows a clear link between the budget and the GPRS. There was very close correspondence between the GPRS targets and the budget allocations in the sector allocations. However the link between GPRS projects and programmes and the Budget is not easily discernible. Table 2.1 shows the distribution of total discretionary expenditure and Table 2.2 the distribution of GoG only expenditure to each sector for the 2001-2003 period. As shown in Table 2.1 the broad sector shifts in resource allocations show a clear linkage between the GPRS targets and the 2003 budget outturns. Budget allocation to Administration declined in 2003 from 19.79% in 2002 to 14.84% in 2003 as expected and was very close to the GPRS target of 14.2%. Allocation to the Social Service sector has increased consistently since the beginning of the implementation of the GPRS and was 38.67% slightly higher than the GPRS target of 38.1%. This consistent increase in resource allocation to the Social Services sector translated into an increase in resources going to the vulnerable and excluded, and also increases in spending on education and health underscoring the importance of social service access and delivery as the core of the GPRS. Infrastructure’s share of discretionary expenditure increased from 11.64% in 2001 to 17.2% in 2002 and then declined to 15.5% in 2003 much lower than the 17.2% projected by the GPRS. On the other hand the Public Safety sectors allocation increased from 9.67% in 2002 to 11.52% in 2003 and exceeding the GPRS target of 11.1%. The increased allocation to the public safety sector reflects the importance of upholding the rule of law, public order and safety as major pillars of the GPRS. The sector that did not receive its expected share of resources was the Economic Services sector. The sector’s allocation declined by almost 50 percent from18.02% in 2002 to 9.06% in 2003. Whereas this allocation is somewhat in line with the GPRS target of 9.07% that target needs to be reviewed. It is worth noting that allocations to agriculture, which is a sub-sector of the Economic Services sector, have declined tremendously and the agricultural sector’s share is almost half of what it used to be in 2001. To the extent that the poor relies on

33
agriculture and related activities, the decline in the share of resources to agriculture has negative implications for the poor.
While the government’s policy of providing relief and safety nets to the poor and vulnerable through increased allocation to Social Services has crowded out resources to the economic services sector which supports wealth creation and sustained poverty reduction. There is therefore the need to augment the resources to agriculture and economic sectors in the next and subsequent years to enhance growth and sustain poverty reduction.
Table 2.1: Distribution of Total Discretionary Expenditure: 2001-2003
2001 2002 GPRS 2003
Target 2003Budget
outturns Administration 34.86% 19.79% 14.2% 14.84%
o/w Ministry of Local Government Rural Development 3.31% 2.35% 2.75%o/w Ministry of Finance 2.20% 3.15% 2.23%o/w General govt Services 21.19% 5.07% - -
Economic 14.99% 18.02% 9.7% 9.06%o/w Ministry of Food & Agriculture 7.17% 4.69% 3.91%
Infrastructure 11.64% 17.20% 17.2% 15.53%Social 30.18% 34.71% 38.1% 38.67%
o/w Ministry of Education 1 22.44% 24.14% 26.85%o/w Ministry of Health 6.67% 9.38% 10.89%
Public Safety 7.94% 9.67% 11.1% 11.52%Utilities - - 2.7% 2.69%Revenue Agencies - - - 3.08%Contingency 0.39% 0.62% 6.9% 4.62%Grand Totals 100.00% 100.00% 100.00% 100.00%Source: Appropriation Act and Budget Statements of 2001,2002,2003 Table 2.2: Distribution of Total GOG Expenditure 2001-2003 2001 2002 2003Administration 41.5% 25.8% 16.4%
o/w Ministry of Local Government Rural Development 2.4% 1.7% 1.8%o/w Ministry of Finance 2.9% 4.0% 1.9%o/w General govt Services 27.8% 8.3% 0
Economic 5.3% 6.8% 5.4%o/w Ministry of Food & Agriculture 1.4% 2.3% 1.7%
Infrastructure 4.4% 3.7% 3.8%Social 37.2% 47.4% 45.8%
o/w Ministry of Education 1 28.4% 35.3% 33.4%o/w Ministry of Health 0.0% 10.3% 11.2%
Public Safety 11.0% 15.3% 14.8%Utilities - - 3.6%Revenue Agencies - - 4.1%Contingency 0.5% 1.0% 6.1%Grand Totals 100.0% 100.0% 100.0%Source: Appropriation Act and Budget Statements of 2001, 2002, 2003

34
Table 2 3: Expenditures in Priority Areas as % of Total Expenditure 2001 2002 2003 Economic services 14.99 18.02 9.06 Social Services 30.18 34.71 38.67 Infrastructure 11.64 17.2 15.33 Public Safety 7.94 9.67 11.53 TOTAL 64.75 79.6 74.78
Source: Ministry of Finance and Economic Planning As indicated in Table 2.3 the expenditures on the priority sectors as a percentage of total expenditures have increased although there was an apparent decline from 79.6% to 75% between 2002 and 2003. The reasons are that in 2002 no separate allocation was made for utilities and Revenue Agencies and that Contingencies was increased as a cushion to possible shock. Alleviation of poverty requires infusion of resources not only to the broad priority sectors, but should be directed into programmes and projects in the areas known to be poor. Table 2.4 shows GoG poverty reduction expenditures from various sources including HIPC, DACF, and the Road Fund in 2003. This constituted about 29% of total government expenditures in 2003 and exceeded the planned expenditures of 25.8% for the year. The poverty related expenditures were made in such sectors as Basic Education, Primary Health Care, Agriculture, Rural water, Feeder Roads and Rural Electrification. They constituted large proportions of expenditures made in their respective sectors, ranging from 40% for feeder roads to 99% of total agriculture expenditure earmarked for poverty-focused agriculture. Although actual recorded poverty expenditures as shown in Table 2.4 were higher than planned in 2003, 68% of the poverty related expenditures consisted of personnel emoluments, which might have mitigated the impact of the better services for the poor because of the low non-salary component of the expenditures. While the link between the GPRS and the budget was not as strong as expected in 2003, this realisation has influenced the 2004 Budget resulting in an increase in poverty related expenditures in 2004 budget by 27 percent and a one-to-one link between budget expenditures and the MTP programmes and projects.

35
Tab
le 2
.4: P
OV
ER
TY
RE
DU
CTI
ON
EX
PEN
DIT
UR
ES
BY
SE
CT
OR
AN
D S
OU
RC
E
PLA
NN
E D
200
3 PE
T
OT2
-4
HIP
C
GE
TF
DA
CF
RD
FUN
D
CO
CO
AR
T
OT
AL
SEC
TO
R
BA
SIC
ED
UC
ATI
ON
15
69.8
7 10
9.02
78
.88
58.8
94
.7
0 0
1911
.27
PRIM
AR
Y H
. CA
RE
523.
29
94.1
13
2.6
0 76
.22
0 0
826.
21
POV
ERTY
FO
CU
SED
AG
RIC
87.9
5 33
.54
20.4
0
0 0
0 14
1.89
RU
RA
L W
ATE
R
7.
12
4.51
82
.96
0 14
.44
0 0
109.
03
FEED
ER R
OA
DS
4.
45
17.5
3 40
.8
0 20
.2
144
15
241.
98
RU
RA
L EL
ECTR
ICIT
Y
1.
21
8.34
40
.8
0 41
.57
0 0
91.9
2
OTH
ER P
OV
ERTY
388.
07
144.
39
147.
56
0 17
.9
0 0
697.
92
TO
TA
L P
OV
ER
TY
EX
PEN
DIT
UR
ES
2581
.96
411.
43
544
58.8
26
5.03
14
4 15
40
20.2
2
AC
TU
AL
200
3
%
of s
ecto
r ex
pend
iture
s
SEC
TO
R
PE
TO
T2-4
H
IPC
G
ET
F D
AC
F R
DFU
ND
C
OC
OA
R
TO
TA
L
BA
SIC
ED
UC
ATI
ON
60.
23
2,08
6.45
27
.08
155.
81
34.5
4 91
.93
0 0
2395
.81
PRIM
AR
Y H
. CA
RE
77.
91
544.
62
19.1
8 20
5.77
0
65.6
3 0
0 83
5.2
POV
ERTY
FO
CU
SED
AG
RIC
9
8.88
83
.06
12.6
4 27
.75
0 0
0 0
123.
45
RU
RA
L W
ATE
R
5
5.45
4.
64
2.88
27
.15
0 9.
81
0 0
44.4
8
FEED
ER R
OA
DS
39.8
7 5.
63
0.01
2 80
.1
0 11
.61
190.
38
15
302.
732
RU
RA
L EL
ECTR
ICIT
Y
92.5
1 0
4.1
25.7
8 0
24.4
8 0
0 54
.36
OTH
ER P
OV
ERTY
4.64
33
0.5
79.7
9 18
5.29
0
112.
55
0 0
708.
13
TO
TA
L P
OV
ER
TY
EX
PEN
DIT
UR
ES
3054
.9
145.
68
707.
65
34.5
4 31
6.01
19
0.38
15
44
64.1
62
Sour
ces:
Min
istr
y of
Fin
ance
and
Eco
nom
ic P
lann
ing
and
2004
Bud
get A
ppen
dix
Not
es: P
E –
pers
onne
l em
olum
ents
, HIP
C- H
ighl
y In
debt
ed P
oor
Cou
ntry
, DA
CF-
Dis
tric
t Ass
embl
y C
omm
on F
und,
RD
FUN
D- R
oad
Fund
, CO
CO
AR
- Coc
oa R
oad
Reh
abili
tatio
n

36
2.3 DONOR RESOURCES AND GPRS PRIORITIES?
As shown in Table 2.5 donor resources to sectors of the economy in 2003 were in broad conformity with the GPRS sector distribution. Despite relative increases in allocations to the Ministry of Finance, projected allocations to the Administration sector as a whole declined while Infrastructure and Social Service sector allocations went up. Allocations to the Public Safety sector by donors continues to rise, reflecting the understanding of the need to uphold the rule of law and order and security from crime and protection of life and property.
Table 2.5: Distribution of Total Donor Expenditure: 2001-2003 2001 2002 2003 Administration 17.5% 10.4% 9.9%
O/w Ministry of Local Government Rural Development 5.7% 3.4% 5.5% O/w Ministry of Finance 0.5% 1.8% 3.3% O/w General govt Services 3.8% 0.0% 0.0%
Economic Services 40.2% 35.4% 20.3% O/w Ministry of Food & Agriculture 22.3% 8.5% 10.7%
Infrastructure 30.5% 38.2% 51.5% Social Services 11.8% 15.0% 16.7%
O/w Ministry of Education 6.9% 6.8% 6.7% o/w Ministry of Health 4.9% 8.0% 9.9%
Public Safety 0.0% 1.0% 1.6% Utilities - - - Revenue Agencies - - - Contingency - - - Grand Totals 100.0% 100.0% 100% Source: Appropriation Act and Budget Statements of various years
Distribution of Total Expenditures by Type of Expenditure Table 2.6 shows that although the sector allocations may broadly reflect GPRS priorities, personnel emoluments, which constitute 43.7%, still dominate expenditures. Allocation for Investment declined. There is the need to maintain an appropriate balance between expenditures on overheads (i.e. personnel emoluments and administrative expenses) on the one hand and expenditures on services and investment on the other. An increase in investments that results in employment creation could contribute to poverty reduction substantially and should therefore be a better proposition. The low priority given to investments by GoG reveals that the linkage between the 2003 budget and the GPRS is not as strong as expected. For example, the investment expenditures of individual MDAs are not close to cost estimates for the medium-term priority projects and programmes of the GPRS. For 2003 the budgeted investment was only 64% of the estimated cost of funding the MTPs for 2003. The ratio of domestic financed investments to total investments was only 14.5% with the rest being foreign financed. Thus despite the decline in dependence on donor funds, it still accounts for a greater part of the nation’s investment expenditure thus rendering development efforts extremely susceptible to the vagaries of donor resource flows. To the extent that donor funds continue to form a greater proportion of investment expenditure and to avoid the possibility of

37
development agenda being susceptible to resource inflows, the MDBS needs to be strengthened and more donors encouraged to join.
Table 2.6: Utilization of Discretionary Payments ¢billion 2002 2003 Actual % 2003 ITEM ¢ bn ¢ bn Personal Emoluments 4197.1 5661.3 43.7 Administration and Service 1452.4 1762.9 13.6 o/w Service 372.7 662.7 5.1 Investment 1951.2 3600.7 27.8 o/w domestic financed 299.6 524.9 4.0 o/w foreign financed 1651.5 3075.7 23.7 Utility price subsidies 449.9 272.5 2.1 HIPC financed Expenditure 175.1 866.3 6.7 Others 545.3 797.3 6.1 Total 8771 12961 100
Source: 2004 Budget, Appendix Table 2
2.4 CONCLUSIONS
A closer examination of the details of the 2003 budget suggests that while sectoral allocations reflect the broad priorities of the GPRS, the link between GPRS projects and programmes and budget expenditures cannot be clearly discerned. There was no direct link between the GPRS projects and programmes. Although the link between the 2003 budget and the GPRS was not particularly strong, it was an improvement on the 2002 budget. This apparent weak link was improved upon in the formulation of the 2004 budget which saw a better alignment with the GPRS and the MDA budgets better reflecting the GPRS priorities as will be evident in the 2004 APR.
Donor funding is critical and any disruptions in donor financing will undermine the implementation of key development programmes and projects. But while in the long term over reliance on donor funding might have to be reduced, domestic financing of investment in the short run appears to entail the risks of being expensive and having a crowding out effect on private investment This will mean that in the short run, reliance on external sources of financing investment might continue but a switch to grant funding or concessionary loans need to be encouraged

38
3. MACRO-ECONOMIC STABILITY 3.1 INTRODUCTION
This section focuses on the Macroeconomic Stability thematic area. The focus of macro-stability in the medium term is to ensure prudent fiscal and monetary policy management to achieve price stability, maintain interest rate levels that are conducive to both savings and investments, and to ensure stable yet competitive exchange rates and a fiscally sustainable debt burden. The GoG with its development partners have defined a number of macroeconomic targets and measures, which fall under broad policy objectives. In line with the Medium Term Priority (MTP) in the GPRS, the Highly Indebted Poor Country’s’ (HIPC) Initiative, the Multi Donor Budgetary Support (MDBS) initiative, the Poverty Reduction and growth Facility (PRGF) and the Poverty Reduction Support Credit (PRSC) process, various policy objectives have been set to achieve macro-stability.
The macro-economic indicators reveal that macro-stability has favourably been on track. The favourable macroeconomic environment has been attributed to improved fiscal management, increased cocoa production and higher world prices for cocoa and gold. The 5.2% growth rate of GDP in 2003 is largely attributed to growth in agriculture specifically in the cocoa sector and stable conditions that facilitated production generally. One would expect this growth to lead to increases in incomes and employment especially in the cocoa growing areas. The growth in incomes and employment coupled with increased expenditures to various sectors directed to poverty reduction are expected to affect poor households very favourably.
3.2 TRENDS IN MACRO STABILITY INDICATORS
Tables 3.1 and 3.2 present the performance of selected macroeconomic and financial indicators for the period 2000-3. Generally, the indicators point out that macro stability is on track. Real GDP/Per Capita Growth The GDP growth rate in 2003 was 5.2% exceeded the budget projection of 4.7% for the year, and is better than the GPRS target of 4.9% for the medium term. An important contributor of this growth was the increased growth in agriculture from 4.4% to 6.1%. Growth in the industrial sector also showed an improvement from 4.7% in 2002 to 5.1% in 2003 fuelled by increased construction activity recording a 6.1% growth rate as against 5.0% in 2002. The growth of the service sector in 2003 remained at 4.7%. With an assumption of a stable population growth of 2.6%, per capita growth rate improved from below 2% since 2001 to 2.6% in 2003. While per capita growth still remains low the increase will nonetheless impact favourably on the conditions of the poor.

39
T
able
3.1
: Gha
na:
Sele
cted
Eco
nom
ic a
nd F
inan
cial
Indi
cato
rs, 2
000
- 200
8
Econ
omic
/ Fi
nanc
ial I
ndic
ator
s 20
00
2001
20
02
2003
20
04
2005
Pr
oj.
2006
Pr
oj.
2007
Pr
oj.
2008
Pr
oj.
Prog
1
Est.
Prog
1
Rev
Pro
j
(A
nnua
l %ta
ge c
hang
e un
less
oth
erw
ise sp
ecifi
ed)
Nat
iona
l Inc
ome
& p
rice
s
Rea
l GD
P 3.
7 4.
2 4.
5 4.
7 5.
2 5.
0 5.
2 5.
0 5.
0 5.
0 5.
0 R
eal G
DP
Per C
apita
1.
2 1.
6 1.
9 2.
1 2.
6 2.
4 2.
6 2.
4 2.
4 2.
4 2.
4 N
omin
al G
DP
31.9
40
.2
28.3
33
.6
35.4
18
.9
18.9
13
.5
11.3
11
.4
11.4
G
DP
defla
tor
27.2
34
.6
22.8
27
.6
28.6
13
.3
13.0
8.
1 6.
0 6.
1 6.
1 C
onsu
mer
Pric
e In
dex
(Ann
ual A
vg)
25.2
32
.9
14.8
26
.4
26.7
8.
6 10
.8
6.0
5.0
5.0
5.0
Con
sum
er P
rice
Inde
x (E
nd o
f per
iod)
40
.5
21.3
15
.2
22.0
23
.6
7.0
7.7
5.0
5.0
5.0
5.0
Ext
erna
l Sec
tor
Ex
ports
(fob
) -3
.5
-3.6
10
.2
10.7
20
.1
4.0
8.1
7.0
6.2
3.9
4.3
Impo
rts (f
ob)
-15.
2 2.
6 -4
.1
17.5
20
.1
5.3
10.7
8.
5 6.
1 4.
4 4.
9 Ex
port
volu
mes
1.
0 -1
.3
-2.1
-4
.8
-6.8
6.
6 10
.8
6.2
6.3
3.4
3.4
Impo
rt vo
lum
es
-26.
0 10
.0
-6.8
5.
2 6.
9 7.
8 5.
4 11
.4
6.6
4.1
4.5
Term
s of T
rade
-1
6.6
4.8
9.4
4.1
14.8
-0
.2
-7.0
3.
3 0.
4 0.
2 0.
5 N
omin
al e
ffec
tive
exch
ange
rate
(avg
) -4
6.3
-24.
0 -1
1.7
…
…
…
…
…
…
…
…
Rea
l eff
ectiv
e ex
chan
ge ra
te (a
vg)
-35.
5 0.
6 -0
.6
…
…
…
…
…
…
…
…
Ced
is p
er U
SD (a
vg)
5,43
1 7,
179
7,94
4 …
8,
682
…
…
…
…
…
…
Gov
ernm
ent B
udge
t
Dom
estic
Rev
enue
(exc
ludi
ng g
rant
s)
42.9
43
.5
27.5
58
.4
56.2
24
.6
32.3
13
.6
9.9
10.9
9.
8 To
tal e
xpen
ditu
re
39.6
65
.5
2.4
50.1
52
.5
11.8
17
.0
4.5
7.3
10.0
8.
4 C
urre
nt e
xpen
ditu
re
48.9
50
.5
28.8
37
.7
34.2
6.
0 15
.1
-5.7
5.
0 9.
1 8.
4 C
apita
l exp
endi
ture
and
net
lend
ing
24.1
95
.7
-38.
7 90
.3
104.
5 25
.2
20.7
26
.0
11.0
11
.4
8.3

40
Econ
omic
/ Fi
nanc
ial I
ndic
ator
s 20
00
2001
20
02
2003
20
04
2005
Pr
oj.
2006
Pr
oj.
2007
Pr
oj.
2008
Pr
oj.
Prog
1
Est.
Prog
1
Rev
Pro
j
(A
nnua
l %ta
ge c
hang
e un
less
oth
erw
ise
spec
ified
)
M
oney
& C
redi
t
Net
dom
estic
ass
ets 2
/ 49
.1
13.5
22
.9
-7.2
-1
8.6
1.9
2.3
1.2
-0.7
0.
0 0.
7 C
redi
t to
gove
rnm
ent 2
/ 57
.7
0.0
30.7
0.
0 -8
.2
-7.9
11
.4
-5.7
-6
.0
-5.8
-4
.8
Cre
dit t
o pu
blic
ent
erpr
ises
2/ 3
/ 20
.9
11.0
-9
.5
2.8
11.2
0.
6 -2
.5
0.4
0.4
0.4
0.4
Cre
dit t
o th
e pr
ivat
e se
ctor
2/ 3
/ 29
.7
14.2
18
.2
17.9
16
.4
19.1
17
.7
12.1
10
.9
6.5
6.9
Bro
ad m
oney
(exc
ludi
ng fo
reig
n cu
rren
cy d
epos
its)
33.4
48
.4
49.6
25
.1
40.9
18
.9
19.2
13
.0
12.4
11
.7
11.1
R
eser
ve m
oney
(ex
clud
ing
fore
ign
curr
ency
dep
osits
) 52
.6
31.3
42
.6
24.6
33
.4
18.8
20
.5
12.9
12
.3
11.7
11
.1
Vel
ocity
(GD
P/en
d-of
-per
iod
broa
d m
oney
) 5.
1 4.
8 4.
1 4.
4 4.
0 4.
4 4.
0 4.
0 4.
0 3.
9 4.
0 Tr
easu
ry B
ill y
ield
(in
%ta
ge; e
nd o
f per
iod)
42
.0
28.9
28
.1
…
22.5
…
…
…
…
…
…
Inve
stm
ent &
Sav
ings
(In
%ta
ge o
f GD
P un
less
oth
erw
ise
spec
ified
)
G
ross
inve
stm
ent
24.0
26
.6
19.7
22
.3
23.2
23
.0
23.1
23
.8
24.0
24
.1
24.2
Pr
ivat
e
14.8
13
.8
13.6
13
.6
14.0
13
.8
13.8
14
.2
14.6
14
.7
15.0
Pu
blic
9.
2 12
.8
6.1
8.7
9.2
9.2
9.3
9.6
9.5
9.5
9.3
Gro
ss n
atio
nal s
avin
g 15
.6
21.3
20
.2
21.9
24
.9
22.0
23
.5
22.9
23
.1
23.2
23
.1
Priv
ate
14
.3
16.1
19
.0
16.3
19
.2
14.2
15
.7
12.6
12
.5
12.7
12
.7
Publ
ic
1.3
5.1
1.2
5.6
5.7
7.8
7.8
10.3
10
.6
10.5
10
.4
Gov
ernm
ent B
udge
t
Tota
l rev
enue
17
.7
18.1
18
.0
21.4
20
.8
22.4
23
.1
23.2
22
.9
22.8
22
.4
Gra
nts
2.1
6.9
3.1
4.8
4.7
3.8
4.3
3.5
3.2
2.9
2.7
Tota
l exp
endi
ture
27
.7
32.7
26
.1
29.3
29
.4
27.6
28
.5
26.2
25
.3
25.0
24
.3
Ove
rall
bala
nce
(exc
ludi
ng g
rant
s) 4
/ -1
0.0
-14.
6 -8
.1
-8.0
-8
.2
-5.2
-5
.4
-3.1
-2
.4
-2.2
-1
.9
Ove
rall
bala
nce
(incl
udin
g gr
ants)
5/
-9.7
-9
.0
-6.8
-4
.3
-4.5
-1
.7
-1.5
-0
.8
-0.5
-0
.4
-0.7
D
omes
tic p
rimar
y ba
lanc
e 2.
6 3.
8 2.
0 1.
8 2.
2 2.
3 1.
7 1.
9 1.
3 1.
3 0.
9 D
ives
titur
e re
ceip
ts 1.
2 0.
0 0.
0 0.
7 0.
6 0.
5 0.
5 0.
0 0.
0 0.
0 0.
0 N
et d
omes
tic fi
nanc
ing
8.5
2.3
4.8
0.0
-0.1
-2
.2
-1.4
-2
.6
-2.5
-2
.0
-1.7

41
Econ
omic
/ Fi
nanc
ial I
ndic
ator
s 20
00
2001
20
02
2003
20
04
2005
Pr
oj.
2006
Pr
oj.
2007
Pr
oj.
2008
Pr
oj.
Prog
1
Est.
Prog
1
Rev
Pro
j
(I
n %
tage
of G
DP
unle
ss o
ther
wis
e sp
ecifi
ed)
Ext
erna
l Sec
tor
Cu
rren
t acc
ount
s bal
ance
6/
-8.4
-5
.3
0.5
-0.4
1.
7 -1
.0
0.4
-0.9
-0
.9-0
.9
-1.1
N
PV o
f ext
erna
l deb
t out
stan
ding
(in %
of e
xpor
ts o
f goo
ds &
serv
ices
) …
…
…
14
3.5
178.
7 78
.6
115.
7 11
6.2
116.
611
7.9
118.
3 (in
% o
f gov
ernm
ent r
even
ue)
…
…
…
258.
6 35
7.1
124.
3 19
8.4
191.
4 18
9.5
184.
2 18
0.5
Exte
rnal
deb
t ser
vice
due
, inc
ludi
ng to
the
Fund
11
.2
8.5
7.8
6.1
5.9
4.9
6.0
5.0
4.3
3.9
3.6
(in %
of e
xpor
ts o
f goo
ds &
and
non
-fac
tor s
ervi
ces)
23
.0
18.9
18
.4
16.8
16
.8
14.1
14
.1
13.3
11
.911
.2
10.2
(in
% o
f gov
ernm
ent r
even
ue)
56.5
34
.1
37.1
24
.2
24.2
18
.8
18.8
17
.2
15.1
14.1
12
.5
(in
Mill
ions
of U
SD u
nles
s ot
herw
ise
spec
ified
)
Curr
ent A
ccou
nt b
alan
ce 6
/ -4
19
-283
30
-2
8 12
6 -8
9 34
-8
1 -9
1-1
04
-131
O
vera
ll ba
lanc
e of
pay
men
ts
-123
17
40
20
2 50
2 -6
3 -1
03
-56
-22
5 5
Chan
ge in
ext
erna
l arr
ears
(dec
reas
e - )
27
34
-6
1 0
0 0
0 0
00
0 G
ross
Inte
rnat
iona
l res
erve
s (en
d of
per
iod)
26
4 34
4 63
5 10
95
1427
12
84
1541
17
47
1972
2106
22
32
(in m
onth
s of i
mpo
rts o
f goo
ds &
serv
ices
) 0.
9 1.
2 1.
9 3.
2 3.
9 3.
5 3.
9 4.
2 4.
54.
6 4.
6 N
omin
al G
DP
(in b
illio
ns o
f ced
is)
27,1
53
38,0
71
48,8
62
65,2
62
66,1
58
77,6
20
78,6
50
89,2
43
99,3
41
110,
633
123,
275

42
Table 3.2: Selected Macroeconomic Stability Indicators 2001 2002 2003
Target 2003 Actual
Real GDP Growth rate 4.2 4.5 4.7 5.2 Real Per capita GDP growth rate 1.6 1.9 2.1 2.6 Real Agric growth rate (%)` 4.0 4.4 6.1 Real Per capita Agric growth rate 1.4 1.8 1.9 3.5 Food crop growth rate Real Per capita Food Crop growth rate
5.0 2.4
5.2 2.6
4.8 2.2
5.3 2.7
Food Price Inflation 16.7 22 15 21.5 Growth of Domestic revenue Growth of domestic revenue as % of GDP
43.5 18.16
27.5 18.42
58.4 56.2 21.28
Growth of Credit to Agriculture 20.83 9.04 51.12 Proportion of total resources going to key GPRS sectors * 64.75 79.6 74.78 Domestic Debt to GDP ratio 26.8 29.1 22.6
*Key GPRS sectors: Economic services, Social Services, Infrastructure and Public Safety Source: various Budget Statements Trends In Inflation In 2003 budget the target was to reduce inflation from 15.2% at the end of 2002 to 9.0% at the end of 2003. However, the 90.4% increase in petroleum prices in February 2003 led to a revision of the inflation target from 9.0% to 22%. By the end of 2003 inflation rate was 23.6% slightly above the revised rate. There was an increase in the food price inflation from 15% in 2002 to 21.5% at the end of 2003. These inflationary pressures may have affected the poor negatively and the distributional effect of the increase in the price of petroleum products is being assessed through a PSIA, which is currently underway. External Developments The strength of the cedi in relation to the major currencies broadly reflected the strengths of those currencies on the international market. In nominal terms the cedi was fairly stable against the US dollar. On the inter-bank market, it depreciated by 4.7 per cent by December 2003. The relative strengths of the euro and the pound sterling on the international markets, and the fact that Ghanaian traders use more of those currencies for importation from Europe resulted in higher depreciation of the cedi against those currencies at 22.5 per cent and 13.0 per cent respectively. The accumulation of international reserves exceeded $1 billion in 2003 for the first time in Ghana’s history, due to bumper cocoa crop, together with strong international prices for cocoa and gold and strong private remittances from abroad. The reserves can cover 3.9 months of imports. External debt service declined from 7.8% of GDP in 2002 to 5.9% in 2003 and in percentage of exports of goods and non-factor services declined from 18.4% in 2002 to 16.8% in 2003. Government budget Budget Deficit Table 3.1 shows that the overall budget deficit was 4.5% of GDP against a target of 4.3%, a decline from 6.8% in 2002.

43
Net domestic financing declined from 4.8% of GDP in 2002 to 0.1% net repayment, exceeding the target of zero financing for 2003. Domestic Revenue Trends The growth of domestic revenue has been significant since 2000, exceeding 40% in 2001. In 2002 there was a decline to 27.5%. However the rate of growth doubled to 56.2% in 2003. As a percentage of GDP, the growth of domestic revenue showed a smooth and steady growth. Trends In Domestic Debt In 2003 total domestic debt, exclusive of revaluation stock, decreased by 298.2 billion cedis. The debt burden decreased from a domestic debt/GDP ratio of 29.1% in 2002 to 22.6% in 2003. This reduction in domestic debt, which is one of the important policy objectives of the GPRS, had spill over effects on other sectors of the economy and contributed partly to the reduction in inflation. As a result of the easing inflationary pressures, the Monetary Policy Committee reduced the Treasury bill rate. The 91-day Treasury bill rate fell from 35.3% in June 2003 to 18% at the end of the year.
Due to the existence of structural and institutional bottlenecks, the reduction in the domestic debt did not automatically create the opportunity for commensurate increase in access by the private sector to credit. In spite of this constraint the reduction in the domestic debt yielded some relief to the private sector through the growth of credit to the sector from –11% in 2001 to 37.5% in 2003.
Real Agricultural/Per Capita Growth Rate The 5.2% growth rate in GDP was attributed to a satisfactory agricultural growth of 6.1% as against a 4.4% growth in 2002. This strong performance of the Agriculture Sector was propelled by the strong recovery of the cocoa sub-sector, which improved, from a decline of 0.5 per cent in 2002 to a remarkable 16.4 per cent positive growth in 2003. This performance is mainly attributed to the cumulative favourable impact of the continued mass spraying exercise initiated by the Government in 2001. Growth in the other remaining sub-sectors similarly exceeded their 2002 levels. The growth in agricultural output in 2003 was more than double the growth in population meaning an increased per capita agriculture growth Real Food Crop/Per Capita Growth The growth in the food crop sub-sector in 2003 of 5.3% was marginally different from the growth experienced in 2002. Thus real per capita food crop growth rate increased marginally. The growth in the food crop sector is dependent on the weather. Thus the need to pursue modernised agriculture with emphasis on irrigation. Credit to Agriculture After a decline in the growth of credit to the agricultural sector in 2002 to only 9% from a 21% growth in 2001, credit to the sector picked up again in 2003 reaching 51%. Increased credit is one of the policies of the GPRS to enhance agricultural production. While the 6.1% growth in the agricultural sector has be partly explained other factors including mass spraying of cocoa farms, the increased credit to the sector and increasing access to financial services by the private operators could also be a contributory factor.

44
3.3 POVERTY REDUCTION IMPACT
To reduce poverty in Ghana, the GPRS aims to improve real GDP growth to 5.0% and per capita income from 1.4% in 2001 to 2.4% in 2005. The growth of 5.2% exceeded the GPRS target. This growth was fuelled by the growth in agriculture of 6.1%. A majority of the rural households derive the bulk of their income from the sector. Thus the good agricultural performance meant household incomes improved in the agricultural community. The growth in agriculture was attributed to increased cocoa production. The year 2003 also witnessed increases in cocoa producer prices, reaching 69% of f.o.b. This meant that the incomes of cocoa farmers increased in 2003, contributing substantially to poverty reduction in the cocoa producing areas. Thus the distribution of the increased GDP growth was skewed towards the cocoa growing areas benefiting households in Ashanti, Brong-Ahafo and Western regions. The poverty endemic areas did not benefit much from the growth of the economy. Results of the 2003 CWIQ were used to investigate the relationship between growth and economic conditions of households and the levels of unemployment. At the micro level using the 2003 CWIQ data one can discern changes in economic conditions of households in different regions of the country and on rural and urban households. (Tables 3.3 and 3.4) In spite of the weaknesses in the 2003 CWIQ data1 one can glean something interesting from the data. The proportion of households, which indicated they were worse off at the beginning of 2003 than in 2002, was greater than those whose economic conditions improved irrespective of the region and whether the location was urban or rural. But the degree of deterioration of economic conditions, measured by the difference between the worse now and better now was less serious for Ashanti, Brong-Ahafo, Northern and Upper East regions. The relatively better performance of Ashanti and Brong-Ahafo can partly be explained by the performance of the cocoa sector, while good food crop yields and infusion of government poverty reduction expenditures may explain the conditions in the Northern and Upper East regions. Employment Employment is a way of increasing incomes. But instruments for tracking trends in employment are not available on annual basis. Thus, one has to rely on data from CWIQ surveys, which tend to understate the extent of unemployment. While from the two CWIQ surveys unemployment increased between 1997 and 2003 from 3.9% to 5.4% respectively, and was worse for females than males, unemployment among the urban poor declined, with a greater decline for males from 12.5% to 6.4%. Among the four poverty endemic areas, the Northern and Central regions experienced declines in unemployment rates while the Upper West, and Upper East experienced increases. 1 It must be emphasised that the 2003 survey was conducted during the first quarter of 2003 and thus the results cannot be generalised for the whole year. Secondly, the energy price shocks of February 2003 and the discussions that it engendered might have impacted on peoples’ perception of their economic conditions. Thirdly the definition of unemployment used relies on an individual’s own assessment of whether he/she is unemployed, rather than the standard ILO definition

45
Table 3.3: Welfare Indicators 2003 Household economic situation compared to one year ago
Total Rural Rural Poor Urban
Urban Poor
worse now 51.5 51.6 52.2 51.4 53.1 better now 27 28.9 26.9 24.6 26.4
WR CR GR VR ER AS BA NR UE UW
worse now 51.5 48.6 49.7 58 68.7 57.9 40.6 47 45.9 45.9 59.3 better now 27 27.5 27.6 16.3 13.1 27.5 36.7 35.7 29.9 26 26.3
Difference 26.5 21.1 22.1 41.7 55.6 30.4 3.9 11.3 16 19.9 33 Source: Ghana Statistical Service, 2003 CWIQ data
Table 3.4: Unemployment Rates
2003 CWIQ Total Rural Rural poor Urban
Urban poor
Unemployed 5.4 3.5 4.1 7.6 7
Male 5.1 3.3 4.4 7.4 6.4 Female 5.6 3.7 4.1 7.8 7.6
Underemployed 13.6 14.9 8.9 12.1 10.7
Male 14.3 16 9.5 12.2 9.5 Female 13 13.9 8.4 12 11.7
1997 CWIQ
Unemployed 3.9 2.2 2.6 7 9 Male 4.7 2.3 3.1 9.2 12.5
Female 3.2 2.2 1.3 5.2 7 2003 CWIQ Total WR CR GR VR ER AS BA NR UE UW Unemployed 5.4 4.9 3.1 8.8 4.4 3.7 6.5 3 2 13.2 4
Male 5.1 4.6 3.1 9.2 3.9 3.2 5.6 2.3 1.7 14.4 4.5 Female 5.6 5.1 3 8.4 4.8 4.1 7.2 3.6 2.3 12.1 3.6
Underemployed 14 14.3 12.1 13.2 12.6 16.4 17 15 6.7 13.2 8.4
Male 14 14.6 11.6 13.4 12.9 18 18 17 7.5 14.1 9.5 Female 13 14 12.6 13 12.4 15.1 16 13 5.9 12.3 7.5
1997 CWIQ
Unemployed 4.6 4.8 3.2 7.8 3.9 4.9 7 3 2.9 0.4 0.5 Male 5.5 7.1 4 10.1 4.7 3.5 7.2 4.1 3.9 0.3 0.6
Female 4.1 2.7 2.6 5.8 3.3 5.8 6.8 2.2 2 0.5 0.3 Underemployed 1.1 1.2 1.4 2 2.4 0.9 0.5 0.6 0.4 0.1 0.5
Male 1.5 1.5 1.8 2.8 2.6 1.7 0.8 0.8 0 0.3 0.8 Female 0.8 0.9 1.2 1.3 2.2 0.4 0.3 0.5 0.7 0 0.3
Source: Ghana Statistical Service, 1997 and 2003 CWIQ dat.

46
3.4 MACRO-STABILITY POLICY DEVELOPMENTS
The favourable macroeconomic environment was the result of a number of macro measures put in place by government. These fall under the following broad objectives:
• Reduce and restructure the domestic debt, • Improve Public Expenditure Management, • Improve fiscal resource mobilization and • Pursue price and exchange rate stability.
Table 3.5 provides a summary of the policy objectives and the various measures adopted to achieve macro stability. Reduce and Restructure the Domestic Debt The Government undertook several activities to reduce and re-structure the domestic debt including paying-down the domestic debt including the use of HIPC savings, and developing medium and long-term instruments. HIPC Savings and Development of Medium and Long Term Instruments Disbursements of HIPC funds amounted to ¢850.79 billion by the end of the year, out of which ¢144 billion (representing 17% of disbursements) was used for domestic debt payment. As at the end of 2003, 225 billion cedis of domestic interest payments had been financed through HIPC savings. With regard to restructuring the debt, the GoG Index Linked Bond and Cocoa bills introduced since 2002 enabled the government shift away from 90-day to medium and long-term credit regimes.

47
Tab
le 3
.5: P
olic
y O
bjec
tives
of M
TP,
HIP
C, P
RSC
-2, M
DB
S Po
licy
Obj
ectiv
e M
easu
re/A
ctiv
ity/T
rigg
ers
Stat
us
MT
P
Red
uce
and
rest
ruct
ure
the
dom
estic
deb
t Pa
y do
wn
the
dom
estic
deb
t ¢1
44 b
illio
n w
as p
aid
to re
duce
dom
estic
deb
t
D
evel
op m
ediu
m a
nd lo
ng te
rm in
stru
men
ts
GoG
inde
x lin
ked
bond
Coc
oa B
ills c
ontin
ued
Impr
ovin
g Pu
blic
Ex
pend
iture
Man
agem
ent
Revi
ew, r
efin
ance
and
stre
ngth
en im
plem
enta
tion
of M
TEF
and
PUFM
AR
P Fi
nanc
ial i
nfor
mat
ion
proj
ect t
hat w
ill h
ouse
the
BPE
MS
oper
atin
g sy
stem
is 6
5%
com
plet
ed d
ue to
lack
of
fund
s H
IPC
Prep
arat
ion
of a
full
PRSP
and
satis
fact
ory
impl
emen
tatio
n fo
r at l
east
on
e ye
ar a
s evi
denc
ed b
y th
e jo
int s
taff
ass
essm
ent o
f the
cou
ntry
's an
nual
pr
ogre
ss re
port
The
GPR
S w
as fi
nalis
ed in
Feb
ruar
y 20
03 a
nd t
he E
xecu
tive
Boa
rd a
t the
co
nclu
sion
of t
he 2
003
Arti
cle
IV c
onsu
ltatio
n, e
ndor
sed
it in
May
200
3
M
acro
-eco
nom
ic st
abili
ty- C
ontin
ued
mai
nten
ance
of m
acro
-eco
nom
ic
stabi
lity
as e
vide
nced
by
satis
fact
ory
impl
emen
tatio
n of
the
PRG
F-su
ppor
ted
prog
ram
me
Mac
ro e
cono
mic
sta
bilit
y fo
r 200
3 ha
s fav
oura
bly
been
on
track
: GD
P gr
owth
rate
of
5.2
%,
Agr
icul
tura
l gro
wth
rate
0f 6
.1%
, bud
get d
efic
it of
3.4
%, c
edi d
epre
ciat
ion
rate
of
4.7%
aga
inst
the
dol
lar,
decr
ease
d do
mes
tic d
ebt-G
DP
ratio
of 2
2.6%
, gro
wth
of
dom
estic
reve
nue
of 5
6.2%
.
Use
of b
udge
tary
savi
ngs i
n pr
iorit
y ar
eas a
nd m
onito
red.
Info
rmat
ion
publ
ishe
d in
tim
e fo
r an
annu
al p
ublic
hea
ring
as a
n in
put t
o an
nual
pr
ogre
ss re
port
on G
PRS.
Budg
etar
y Sa
ving
s has
bee
n us
ed in
prio
rity
area
s
Pub
lic E
xpen
ditu
re
man
agem
ent
Elec
troni
c ex
pend
iture
repo
rting
sys
tem
insta
lled
in M
oF, C
AG
D a
nd a
t le
ast t
wo
key
sect
or m
inis
tries
Th
e re
porti
ng s
yste
m h
as b
een
inst
alle
d at
MFE
P an
d C
AG
D
PRSC
2
Red
uce
dom
estic
deb
t and
cr
eate
room
for p
rivat
e se
ctor
cre
dit a
nd sc
ope
for
finan
cing
pov
erty
ex
pend
iture
s
Impl
emen
t 200
3 do
mes
tic d
ebt r
educ
tion
to re
leas
e re
sour
ces f
or fu
ndin
g gr
owth
and
pov
erty
redu
cing
act
iviti
es
Out
stan
ding
stoc
k of
Gov
ernm
ent s
ecur
ities
fell
from
17%
of G
DP
in 2
002
to 1
6.1%
of
GD
P in
200
3
Stre
ngth
enin
g Pu
blic
Ex
pend
iture
Man
agem
ent
(a) M
oder
nize
PEM
Re
gula
tory
Fra
mew
ork
Begi
n Im
plem
enta
tion
of th
e Fi
nanc
ial A
dmin
istra
tion
Bill
ena
cted
by
Parli
amen
t and
tabl
e C
entra
l Int
erna
l Aud
it B
ill
The
Fina
ncia
l adm
inis
tratio
n B
ill w
as p
asse
d in
to la
w a
t the
end
of D
ecem
ber
(b) S
tren
gthe
n Bu
dget
Fo
rmul
atio
n St
anda
rdiz
e ac
tiviti
es to
sim
plify
MTE
F an
d ad
opt m
easu
res t
o al
ign
func
tiona
l cla
ssifi
catio
n of
Bud
get w
ith G
FS
Hea
lth a
nd E
duca
tion
min
istrie
s lim
ited
thei
r out
puts
cons
ider
ably
. Lin
kage
s of
MTE
F &
GPR
S w
ere
enha
nced
as b
udge
t vol
umes
incl
uded
sum
mar
ies o
f MD
A
obje
ctiv
es a
nd re
late
d G
PRS
MTP
and
exp
endi
ture
by
GPR
S th
emat
ic a
reas
, MTP
an
d so
urce
s of f
und
C
ondu
ct P
ER
PER
was
don
e on
the
road
s se
ctor
. Doc
umen
t is a
lmos
t rea
dy fo
r prin
ting

48
Polic
y O
bjec
tive
Mea
sure
/Act
ivity
/Tri
gger
s St
atus
Furth
er in
crea
se c
ompa
red
to 2
003
budg
et, i
n po
verty
redu
ctio
n bu
dget
ed
expe
nditu
res a
s sha
re o
f dom
estic
ally
fina
nced
exp
endi
ture
s (in
clud
ing
HIP
C)
A 2
7% i
ncre
ase
in 2
004
over
200
3 bu
dget
in p
over
ty re
duct
ion
expe
nditu
res
(c) S
tren
gthe
n Bu
dget
ex
ecut
ion
and
repo
rtin
g Pr
epar
e m
onth
ly (c
omm
itmen
t and
exp
endi
ture
) bud
get e
xecu
tion
repo
rt re
conc
iled
with
BoG
, with
no
mor
e th
an 8
wee
ks la
g.
Mon
thly
repo
rts a
re su
bmitt
ed w
ith n
o m
ore
than
8 w
eeks
lag
Ex
pand
BPE
MS
to c
over
3 m
ain
MD
As i
n A
ccra
(Edu
catio
n, H
ealth
and
R
oads
and
Hig
hway
s)
Impl
emen
tatio
n of
a b
udge
t and
Pub
lic E
xpen
ditu
re M
anag
emen
t Sys
tem
in M
FEP
and
CA
GD
con
tinue
d
Dis
sem
inat
e bu
dget
info
rmat
ion
in si
mpl
ified
form
at to
bro
ader
aud
ienc
e (e
.g. r
adio
, pam
phle
ts e
tc.)
Budg
et H
ighl
ight
s pr
oduc
ed fo
r pre
ss, p
rinte
d in
the
Dai
ly G
raph
ic, p
oste
d on
the
inte
rnet
, Reg
iona
l peo
ples
Ass
embl
y co
nduc
ted
and
an e
xhib
ition
for t
he p
ublic
at
Foye
r of t
he P
arlia
men
t Hou
se.
MD
BS
(a) S
tren
gthe
ning
Pub
lic
Expe
nditu
re M
anag
emen
t Fu
rther
incr
ease
com
pare
d to
200
3 bu
dget
, in
pove
rty re
duct
ion
budg
eted
ex
pend
iture
s as s
hare
of d
omes
tical
ly fi
nanc
ed e
xpen
ditu
res (
incl
udin
g H
IPC
)
A 2
7% i
ncre
ase
in 2
004
over
200
3 bu
dget
in p
over
ty re
duct
ion
expe
nditu
res
(c) T
rans
pare
ncy
and
valu
e fo
r mon
ey in
Pub
lic
Expe
nditu
re
Begi
n im
plem
enta
tion
of th
e ne
w P
rocu
rem
ent B
ill e
nact
ed b
y Pa
rliam
ent
by e
stab
lishi
ng a
nd ,m
akin
g op
erat
iona
l Pub
lic P
rocu
rem
ent I
nstit
utio
ns
Regu
lato
ry a
nd o
vers
ight
bod
y to
impl
emen
t new
pro
cure
men
t cod
e ha
s bee
n es
tabl
ishe
d

49
Improving Public Expenditure Management To improve public expenditure management several activities were undertaken by Government These included: • Strengthening budget control systems and training of MDA Budget Committees and members of
the Budget Development unit on the need for the Budget to be driven by the priorities of the GPRS. Expenditure Initiation Forms were introduced as a basis for requesting for release of funds for all expenditures except wages. This was to ensure that MDAs conformed to their planned programmes and activities.
• As part of the process of modernising the PEM Regulatory Framework, the Financial
Administration Bill was passed into law at the end of December 2003. • Strengthening Budget Execution and reporting included submission of monthly reports with no
more than 8 weeks lag. Reports on cash expenditures and commitments by MDAs classified by function have been published monthly in the government gazette, following implementation of a new reporting system.
Implementation of a Budget and Public Expenditure Management System in MFEP and
CAGD continued. Among the activities towards the implementation of BPEMS are: A computer-based financial management information system to underpin the new
expenditure reporting system is being implemented on a pilot basis starting with MoF and Controller and Accountant-General’s Department (CAGD); the Ministry of Health will be added in April and Roads and Transport and Education in May 2004. It is envisaged by the end of November 2004, the BPEMS would have been extended to Ministries of Interior, Local Government, Communications and Works and Housing. There is no timetable yet for the remaining ministries.
Re-design of accounting and budgeting forms for use by the remaining MDA sites for subsequent entry into the system at designated sites;
Customisation of the Public Sector Budgeting Module to enable it perform activity based budgeting;
Completion of an Interim Data Centre to cater for the day-to-day operations of the servers until the Financial Information Centre is completed; and
Regulatory and oversight body to implement new procurement code has been established
While the government has fulfilled several obligations under the various programmes, the full implementation of the PUFMARP program in general and the BPEMS component in particular has been delayed with its unfavourable implications for improved expenditure monitoring and financial management due to technical difficulties, Preliminary assessment of the success of the public expenditure management reforms indicates that Ghana has achieved 7 out of 16 Public Expenditure Management (PEM) benchmarks in 2003 compared with 1 out of 15 in 2001, and has improved on 8 of these indicators.

50
Improve Fiscal Resource Mobilization The Government has instituted two programmes to improve fiscal mobilization: Revenue collection institutions & DAs tax collection units have been strengthened and the
implementation of the Tax Identification Number (TIN) in all revenue agencies is now functional. In addition the Large Taxpayers Unit (LTU) is being launched in 2 phases.
There has been an improvement in collection of non-tax revenues through proper accounting for Non Tax Revenues collections. NTR accounts have been opened for all Ministries, Departments and Agencies at the Bank of Ghana and all MDAs are expected to transfer all their collections including those from the regions and districts into these accounts on a regular basis. As a result of these measures, NTR lodgement into the consolidated fund in 2003 exceeded the 2002 lodgement by 44 per cent.
Pursue Price And Exchange Rate Stability A Monetary Policy Committee (MPC) has been established and it meets every two months. The Committee uses the prime rate to signal the market expectations of inflation and hence interest rate. In response to policy initiatives of the MPC, interest rate declined in the latter part of 2003 (from 27.0% through 24.0% to 21.5% by December 2003). Furthermore the independence of the Bank of Ghana in its pursuit of monetary policy has been reinforced in the new Bank of Ghana Law. The law only allows government to borrow not more than 10% of the previous years revenues, thus limiting the extent of government borrowing. 3.5 RECOMMENDED POLICY INITIATIVES
The government is committed to and has succeeded in maintaining macro-economic stability and intends in 2004 to maintain the macro-economic stability achieved in 2003. To strengthen the government’s continued effort to stabilize the economy, the following policy measures will be undertaken.
First, without losing control over macro-stability the government will simultaneously pursue more ambitious growth policies, which will propel the economy to a higher growth rate than hovering around 5%. Second, the government will continue to reduce the debt burden by increasing revenue collection through further improvements in the efficiency of the revenue collecting agencies. Third, the government will use an optimum mix of appropriate fiscal and monetary policies to deliver on inflation and other macroeconomic targets and continue to strengthen public expenditure management.
Notwithstanding these efforts there are a few challenges that the government will face in 2004 including the delayed petroleum price adjustments. The challenges will be managed carefully so as not to disturb the macro objectives of 2004. The government plans to use the TOR Debt Recovery Fund, which is expected to yield 1.2 trillion cedis to partly fund the subsidies for the delayed petroleum price adjustments. The government also plans to close the unplanned financing gap through fiscal adjustments which consist of curtailing discretionary expenditures but protecting poverty reduction expenditures, reducing net domestic debt repayments from 2.2% of GDP to about 1.5%, and finding more sources of revenue (non-tax revenue) through accelerated divestiture and increased dividends from state-owned companies.

51
Government expenditures generally reflected the GPRS priorities. However these expenditures as published do not clearly show the extent to which the poor benefited, especially the deprived areas of Northern, Upper east and Upper West and Central Regions. A more detailed breakdown of expenditure will be provided to forge a closer link between budget allocations and beneficiary targets.
The areas of budget formulation, execution and reporting still need upgrading and the link between the budget and GPRS would be strengthened further. The Budget and Public Expenditure Management System will be expanded to six other MDAs by November 2004.
As part of the Public Financial Management Reform Programme the Ministry of Finance and Economic Planning will operationalise the Financial Administration Act, the Internal Audit Agency Act and the Public Procurement Act as well as enhance the activities of the External Audit Act. The government expects timely disbursement of pledges by Development Partners and will encourage donors that are not party to the MDBS to join.
The Bank of Ghana will work to diffuse the inefficient institutional structures in the financial sector to allow for a well-functioning financial sector which impacts on growth and thus helps to reduce poverty.
The unemployment rate is a critical macro indicator of welfare but is not routinely reported on. Government will work hard to ensure that labour market information be made available more frequently.

52
4. PRODUCTION AND GAINFUL EMPLOYMENT 4.1 INTRODUCTION
The Production and Gainful Employment thematic area focuses on policies designed to reduce poverty and stimulate growth by (i) the development of the rural economy through modernising agriculture, (ii) sustained environmental protection through re-aforestation (iii) enhanced infrastructural development, and (iv) creating an enabling environment for private sector activities and development. Following discussions with representatives from Ministries, Departments and Agencies (MDA’s) in the Production and Gainful Employment thematic area, the indicators and targets corresponding to the programmes and activities of the Medium Term Priorities (MTP’s) were revised and updated where appropriate. The indicators and targets for Agriculture, Energy, Lands and Forestry and Roads and Transport in particular, have been substantially revised to reflect the concerns and comments of stakeholders. 4.2 OUTCOME/IMPACT INDICATORS
Table 4.1 summarises the status of impact indicators for the four areas of agriculture modernisation, environmental protection through re-aforestation, infrastructural development and strengthened private sector.

53
Tab
le 4
.1:
PR
OD
UC
TIO
N A
ND
GA
INFU
L E
MPL
OY
ME
NT
IND
ICA
TO
RS
Sect
or
In
dica
tor
Tar
get
Indi
cato
r Le
vel 2
002
Indi
cato
r Le
vel 2
003
Prog
ress
Tow
ards
Tar
get
Food
secu
rity
% o
f pos
t har
vest
loss
es
15-2
0%
Cer
eals
: 25-
30%
Pe
risha
bles
:35-
40%
20
-25%
35
-38%
Mod
est p
rogr
ess
To
nes o
f silo
spac
e es
tabl
ishe
d 35
mt
35m
t 35
mt
No
prog
ress
Ex
tens
ion
offic
er fa
rmer
ratio
1:
1200
1:
2200
Th
e ra
tio re
mai
ns 1
to 2
200
N
o pr
ogre
ss
Fish
erie
s Q
uant
ity o
f fis
h pr
oduc
ed p
er u
nit
area
of p
ond
per c
ycle
3
tonn
es
/ha/
yr
2.5t
onne
s/ha
/yr
2.5t
onne
s/ha
/yr
O
n tra
ck
A
rea
unde
r fis
h fa
rm
450h
a 35
0-40
0ha
450h
a Ta
rget
ach
ieve
d
No
of h
atch
erie
s con
stru
cted
4
3 3
No
prog
ress
Qua
ntity
of f
inge
rling
s pr
oduc
ed
per u
nit a
rea
of fi
sh c
ycle
15
0,00
0 B
asel
ine
in 2
003
Prov
isio
n of
Irrig
atio
n
faci
litie
s Pe
rcen
t of a
rabl
e la
nd u
nder
irr
igat
ion
0.12
%(3
3,0
00ha
) 0.
04%
(11,
000h
a)
curr
ently
est
imat
ed a
t 0.0
8%
Goo
d pr
ogre
ss
N
umbe
r of d
ugou
ts c
onst
ruct
ed
262
237
713
out o
f 130
9(bo
re h
oles
, dug
outs
, w
ater
stor
age,
stre
am d
iver
sion
, stre
am
and
tube
wel
l pum
ping
) wer
e co
mpl
eted
Impr
ove
rura
l Sec
tor f
arm
an
d no
n fa
rm g
row
th
PRSC
2
Farm
gat
e pr
ice
of C
ocoa
69
% o
f FO
B
Th
e fa
rm g
ate
pric
e of
coc
oa w
as
rais
ed to
69%
of F
OB
Ta
rget
met
In
crea
sed
expo
rts o
f cas
h cr
op:
Coc
oa
Expo
rts o
f coc
oa in
crea
sed
by 1
1%
Goo
d pr
ogre
ss
Incr
ease
d M
echa
niza
tion
in A
gric
ultu
re
Farm
er a
cces
s to
mec
hani
zed
tilla
ge
15%
Le
ss th
an 5
%
8% in
2003
G
ood
prog
ress
A
cces
s to
harv
este
rs
5%
Less
than
2%
2%
in 2
003
No
prog
ress
Acc
ess t
o pr
oces
sing
equ
ipm
ent
30%
20
%
24%
in
On
track
Fa
rmer
trac
tor r
atio
1:
90,0
00
1:18
0,00
0 C
urre
ntly
the
ratio
stan
ds a
t 1:1
50,0
00
N
o of
hec
tare
s pla
nted
(MTP
in
dica
tor)
40
,000
ha/2
008
17,0
00ha
30
,326
ha
Goo
d pr
ogre
ss
LAN
DS
AN
D
FOR
ESTR
Y
Ref
ores
tatio
n R
ate
of d
efor
esta
tion
65
,000
per
yea
r 50
,000
per
yea
r G
ood
prog
ress
Num
ber o
f CR
MA
S* e
stab
lishe
d (G
PRS
indi
cato
r)
1 2
1 N
o pr
ogre
ss
H
a of
urb
an a
reas
pla
nted
20
,000
ha/2
008
13
00ha
So
me
prog
ress
H
a of
deg
rade
d fo
rest
rese
rve
plan
ted
60,0
00
/200
8
25,6
91ha
O
n tra
ck
A
mt.
of p
erm
anen
t em
ploy
men
t 10
0,00
0job
95
,000
jobs
O
n tra
ck

54
Sect
or
In
dica
tor
Tar
get
Indi
cato
r Le
vel 2
002
Indi
cato
r Le
vel 2
003
Prog
ress
Tow
ards
Tar
get
gene
rate
d.
s
No
of re
gist
ered
and
title
d ur
ban
land
s to
indi
vidu
als
1,30
0,00
0par
cels
of
land
/200
8
11
31 c
ertif
icat
es is
sued
in 2
003
Targ
et a
ppea
rs to
o am
bitio
us
Land
Adm
inis
tratio
n N
o. o
f tit
led
and
regi
ster
ed
allo
dial
titl
es to
stoo
ls, s
kins
and
te
ndam
bas c
lans
50 (2
008)
15
N
o pr
ogre
ss
N
umbe
r of c
urre
nt la
nd c
ases
co
nclu
ded
Red
uced
by
35,0
00(2
008)
6000
0 cu
rren
tly in
cou
rt A
ltern
ativ
e D
ispu
te R
esol
utio
n co
mm
ence
s in
2nd
Qua
rter
Not
muc
h pr
ogre
ss
N
umbe
r of c
usto
mar
y la
nd
adm
inis
tratio
n un
its e
stab
lishe
d 50
esta
blis
hed
(200
8)
7 es
tabl
ishe
d 2
esta
blis
hed
(Gba
we.
, Was
sa A
men
fi)
On
track
N
umbe
r of r
egio
nal l
and
cour
ts
esta
blis
hed
10(2
008)
1
In p
ropo
sal s
tage
Info
rmat
ion
&
Com
mun
icat
ion
Tech
nolo
gy
Prov
idin
g IC
T fo
r sch
ools
N
o. o
f sch
ools
pro
vide
d fo
r 51
4/20
05
0 25
7 G
ood
prog
ress
No.
of f
ixed
tele
phon
e lin
es
inst
alle
d 40
0,00
0/20
05
200,
000
283,
000
Som
e pr
ogre
ss
Ener
gy
En
hanc
ed in
fras
truct
ural
de
velo
pmen
t/ en
sure
re
liabl
e su
pply
of h
igh
qual
ity e
nerg
y se
rvic
es
Rat
io o
f ene
rgy
dem
and
to e
nerg
y su
pply
-
-
0.73
Pe
ople
with
acc
ess t
o no
n-w
ood
fuel
ene
rgy(
over
68%
of t
otal
en
ergy
con
sum
ed in
Gha
na is
fr
om w
ood
fuel
s)
43.4
%
H
ouse
hold
s with
ele
ctric
ity
50.6
%
Tota
l ele
ctric
ity p
ower
ge
nera
ted(
meg
awat
ts
1,65
2
Li
felin
e pr
icin
g fo
r ele
ctric
ity
sect
or d
evel
oped
and
im
plem
ente
d
Don
e Ta
rget
met
Ph
ase
out b
udge
t sub
side
s to
petro
leum
sect
or
Proc
ess t
o re
mov
e su
bsid
ies i
n pl
ace
( Pric
e of
Pet
role
um p
rodu
cts
incr
ease
d by
90.
4% in
200
3)
PRSC
-2
Red
uce
syst
em lo
ss
26%
/200
2
N/A
Enha
nced
acc
ess t
o m
arke
ts th
roug
h im
prov
ed fe
eder
road
s
Leng
th o
f mot
orab
le fe
eder
road
s
32
,601
.8 k
ms
Goo
d 36
%
Fair
26%
Po
or 3
8%

55
Sect
or
In
dica
tor
Tar
get
Indi
cato
r Le
vel 2
002
Indi
cato
r Le
vel 2
003
Prog
ress
Tow
ards
Tar
get
Priv
ate
Sect
or
Dev
elop
men
t /Tr
ade
and
Indu
stry
Stre
ngth
en th
e Pr
ivat
e Se
ctor
Im
prov
e ac
cess
and
incr
ease
vo
lum
e of
cre
dit a
t aff
orda
ble
pric
es
In
pro
gres
s
R
educ
e bo
ttle
neck
s to
priv
ate
sect
or d
evel
opm
ent
In
stitu
tiona
l and
lega
l bo
ttlen
ecks
rem
oved
In p
rogr
ess
Pr
omot
e en
trepr
eneu
rshi
p in
agr
o –b
usin
ess
N
o. o
f gra
duat
e of
terti
ary
inst
itutio
ns v
entu
ring
into
se
lf em
ploy
men
t
PRSC
2
Impr
ove
the
inve
stm
ent
clim
ate
Impl
emen
t firs
t yea
r tra
nche
of
appr
oved
tim
e- b
ound
im
plem
enta
tion
plan
to re
mov
e ke
y re
gula
tory
and
adm
inis
trativ
e ba
rrie
rs
1Bus
ines
s R
egis
tratio
n an
d ap
prov
al
refo
rm in
itiat
ed
2.La
nd re
form
initi
ated
in 2
003
3.Ta
xatio
n an
d C
usto
ms
Adm
inis
tratio
n re
form
initi
ated
in
2003
Impr
ove
Trad
e fa
cilit
atio
n In
crea
sed
expo
rt gr
owth
Incr
ease
d ex
port
grow
th
2003
:US$
2,31
mill
ion
R
educ
ed tr
ade
rela
ted
adm
inis
tratio
n ba
rrie
rs
R
educ
ed a
dmin
istra
tion
time
Cle
aran
ce ti
me
at c
usto
ms r
educ
ed a
t Te
ma
and
Tako
radi
from
2da
ys to
one
da
y
Goo
d pr
ogre
ss
Impr
ove
inve
stm
ent
clim
ate
Incr
ease
d pr
ivat
e in
vest
men
t
Fore
ign
Dire
ct in
vest
men
t
R
educ
ed T
ime
for
Bus
ines
s reg
istra
tion
Tim
e de
crea
sed
by 3
4%
MD
BS
Im
prov
e th
e in
vest
men
t cl
imat
e A
ppro
val b
y C
abin
et o
f med
ium
te
rm p
rivat
e se
ctor
dev
elop
men
t st
rate
gy w
ith a
ctio
n pl
an a
nd
mon
itorin
g an
d ev
alua
tion
mat
rix
Fina
l dra
ft do
cum
ent s
ubm
itted
To p
rovi
de p
roce
ssin
g eq
uipm
ent t
o m
icro
and
sm
all –
scal
e pr
oduc
ers
No.
of s
mal
l- sc
ale
agro
- pr
oces
sing
firm
s es
tabl
ishe
d
50
(200
4)
In p
rogr
ess.
Sour
ce: G
PRS,
MD
As,
PRSC
, MD
BS.
*
CR
MA
S –
Com
mun
ity R
esou
rce
Man
agem
ent A
reas

56
Modernized Agriculture The status of fifteen indicators has been reported here as per Table 4.1. These indicators are not exhaustive. The choice reflects data availability, the views of stakeholders in the sector and the extent to which the indicators are linked with the MTP. These indicators include measures like the percent of post-harvest losses, tons of silo space constructed and the farmer extension ratio. Food Security There was not much improvement in the three measures of food security. The percentage of post harvest losses declined only marginally for both cereals and perishables. Indicator levels in 2003 show that no new silo space was created in 2003. The extension officer-farmer ratio remained at 1 to 2,200. However a total of 107 farmers, agricultural extension agents and students from tertiary institutions have been trained in animal traction technologies at Nyankpala in the Northern Region, Nkwanta in the Volta Region and the Agricultural Research Station of the University of Ghana, Legon, In terms of people’s perception on difficulty with food needs, data from the 2003 CWIQ (Table 4.2) indicate that the poor had greater difficulty, especially the rural poor. In terms of regional distribution, Upper East, Upper West and the Volta Regions were the regions with the greatest difficulty with their food needs. Table 4.2: Difficulty with Food Needs Total WR CR GR VR ER AS BA NR UE UW R RP U UP
Difficulty with food needs (%) 12.8 9.5 10.3 12.1 21.9 10.8 12.2 5.4 8.7 40.3 23.3
13.8
22.5
11.6
13.7
Source: 2003 CWIQ data. Notes: R – rural, RP- rural poor, U –urban, UP – urban poor, WR to UW indicate Regions Fisheries There was no increase in the number of fish hatcheries from 2002 to 2003. The area under fish farming increased to the extent that the target for 2004 of 450 hectares was achieved in 2003. Despite this increase, the quantity of fish produced per unit area of pond per cycle showed no increase from 2002 to 2003. Overall there was slight increase in the growth of the fishing sector from 2.8% in 2002 to 3.0% in 2003. It is unlikely that aquaculture contributed much to this growth. Provision of irrigation facilities The percent of land under irrigation was 0.04% in 2002. An additional 1200ha of land has been irrigated in 2003. The total land area under irrigation is currently estimated at 0.08%, which indicates that the percentage of land irrigated has doubled since 2002. The increase in arable land under irrigation can partly explain the increase in food crop production in 2003. However, the increase could also have resulted from factors such as good weather. The PSIA on Modernised Agriculture currently in progress will shed some light on the causal linkages being surmised here. Mechanised Agriculture The farmer-tractor ratio improved from 1:180,000 to 1:150,000, and farmers had greater access to mechanised tillage, harvesters and processing equipment.

57
There is good progress in terms of irrigation and mechanization, however while the increase in arable land under irrigation and access to tractor may have contributed in part to the increased crop production the causal links have not been established. The results of the PSIA on Modernised Agricultural currently in progress will hopefully shed some light on the link. Rural Sector Farm and Non-Farm Growth The farm-gate price of cocoa was increased to 69% of FOB for the 2003/2004 cocoa season. Environmental Protection through Re-Aforestation Re-aforestation Indicators in this area suggest that progress is being made in decreasing the rate of deforestation per year from 65,000 to 50,000 hectares. Good progress towards reforestation targets is also being made with respect to replanting in forest reserves and urban areas, with 1300 hectares of urban area planted while 25,691 hectares of degraded forest reserves were planted. However, there has not been much progress with respect to establishing Community Resource Management Areas (CRMAS). Only one CRMAS was established in 2003. Land Reform The Land Administration Project was instituted in April 2003. There has been some progress in this area with respect to the issuing of Land Title certificates to individuals, and the establishment of 2 customary land administration units in 2003. At the present rate the target of 50 land administration units by 2008 will not be achieved. No progress has been made in the proposal to establish regional land courts. Infrastructural Development The availability of good, efficient and equitably distributed infrastructure is key to poverty reduction. The provision of ICT permits greater access to information and easier communication. Improved energy sources such as electricity permits the introduction of new technologies and services. The range of production opportunities is expanded making possible the processing of the products of the rural sector. Rural and feeder roads have impact on poverty alleviation. They open up rural areas to wider markets, and provide access to inputs for production. Transport costs are also reduced. Information and Communication Technology Good progress has been made in this area, the provision of fixed phone lines has increased from 200,000 in 2002 to 283,000 in 2003 and 257 schools have been provided with ICT in 2003 compared with no schools being provided for in 2002. Energy In this area, the indicators provide information on the ratio of energy demand to energy supply, people with access to non-wood fuel, households with electricity, total power generated in megawatts, development and implementation of lifeline pricing for electricity and budget subsidies to petroleum sector, On the supply side the available capacity is estimated at 1,484MW (hydro and thermal) while the installed capacity is 2,064 Megawatts. The peak demand ever recorded on the other hand is 1,090

58
MW. Based on these figures, the ratio of energy demand to energy supply is 73 percent (or .73 to 1). This implies an excess supply of power of about 27 percent. It is important to note that the peak demand only refers to individuals and customers already on the grid, hence it reflects actual demand as opposed to desired demand. Information from the 2003 CWIQ survey indicates that overall there was an increase in the percentage of households using non-wood fuel for cooking, however among the rural and urban poor percentages declined in the use of non-wood fuel. Using the 1997 and 2003 CWIQ data, about 51% of the households in 2003 had electricity compared with 37% in 1997. There was a slight improvement for the rural poor (7.2% in 2003 and 6.2% in 1997 and a decrease for the urban poor. With respect to life line pricing for the poor (completed in 2002), a Poverty & Social Impact analysis study on “Electricity tariffs and the poor” currently in progress should provide some more information on this indicator. Roads - Motorable Feeder Roads The feeder road system is to ensure that rural and farming communities transport needs are adequately met. The length of motorable feeder roads is 32,601 kilometres of which 36% are in good condition, 26% fair, and 38% in poor condition. Strengthening The Private Sector Regarding the outcome indicators in this sector, there has been some progress in the area of reduced trade related administration barriers, where clearance time at customs in Tema and Takoradi ports has been reduced from 2 days to one day. Also, time spent on business registration procedures has been decreased by 34%. 4.3 POLICY DEVELOPMENTS/MEASURES/TRIGGERS
Policy objectives, actions and measures for achieving the desired impact of reducing the incidence of poverty, improving the standard of living in the urban and rural areas under Production and Gainful Employment have been summarised in Table 4.3 and the major ones discussed below.

59
TA
BL
E 4
.3 :
POL
ICY
DE
VEL
OPM
EN
TS
MA
TR
IX F
OR
MT
P, H
IPC
, PR
SC, M
DB
S Po
licy
Obj
ectiv
e A
ctiv
ity &
Mea
sure
s St
atus
AG
RIC
ULT
UR
E M
TP
Mod
erni
zed
Agr
icul
ture
bas
ed o
n ru
ral
deve
lopm
ent
Prom
ote
farm
mec
hani
zatio
n Pr
ovid
e irr
igat
ion
faci
litie
s A
cqui
re la
nd fo
r Com
mer
cial
farm
ing
Reh
abili
tate
fish
hat
cher
ies.
Impr
ove
acce
ss to
inpu
ts fo
r liv
esto
ck a
nd c
rop
prod
uctio
n.
Prom
ote
the
prod
uctio
n of
hig
h va
lue
crop
s
The
farm
er –
tract
or ra
tio im
prov
ed fr
om
1:18
0,00
0 to
1:1
50,0
00
Tota
l lan
d un
der i
rrig
atio
n is
0.08
% o
f ar
able
land
(targ
et o
f 0.1
2 fo
r 200
5)
Inve
ntor
y of
agr
icul
tura
l lan
d a
cqui
red
by
govt
. und
erta
ken
Seve
ral o
n-go
ing
proj
ects
wer
e co
ntin
ued.
N
ot m
uch
prog
ress
ach
ieve
d th
ough
seve
ral
proj
ects
em
bark
ed o
n PR
SC
Impr
ove
rura
l sec
tor F
arm
and
Non
-Far
m
Gro
wth
Rev
iew
targ
et a
reas
mar
ket a
cces
s, ex
tens
ion
serv
ices
tech
nolo
gy e
tc) t
o up
date
ope
ratio
nal p
lan
Purs
ue re
form
s to
incr
ease
farm
er g
ate
pric
es o
f coc
oa to
69%
of F
.O.B
.
Don
e C
ocoa
pric
e in
crea
sed
to 6
9% o
f .FO
.B.
MD
BS
Beg
in im
plem
enta
tion
of M
OFA
Stra
tegi
c Pl
an, c
oste
d w
ith c
lear
link
s to
GPR
S ta
rget
. Pl
an p
repa
red
and
dist
ribut
ed
MTP
In
crea
se e
nviro
nmen
tal
Prot
ectio
n th
roug
h re
-for
esta
tion
Prov
ide
mat
eria
l and
fina
ncia
l sup
port
for r
e-fo
rest
atio
n of
deg
rade
d fo
rest
s, ab
ando
ned
min
ing
area
s and
maj
or ri
ver b
anks
The
LAP
proj
ect
in p
rogr
ess
INFR
AST
RU
CTU
RA
L D
EVEL
OPM
ENT
ICT
, M
TP
Impr
ove
com
mun
icat
ions
for p
rodu
ctio
n an
d hu
man
dev
elop
men
t
Pro
vide
info
rmat
ion
com
mun
icat
ion
tech
nolo
gy fo
r sch
ools
. In
crea
se te
leph
one
acce
ss o
utsi
de th
e ur
ban
cent
res
257
scho
ols
83,0
00 te
leph
ones
inst
alle
d
ENER
GY
M
TP
Ensu
re re
liabl
e su
pply
of h
igh
qual
ity
ener
gy se
rvic
es
Ener
gy P
rovi
sion
to B
oost
Indu
stria
l D
evel
opm
ent
Impl
emen
t cos
t rec
over
y pr
icin
g fo
r ene
rgy.
C
ontin
ue ru
ral e
lect
rific
atio
n pr
ogra
mm
e.
Supp
ort d
evel
opm
ent o
f ren
ewab
le e
nerg
y
Don
e In
pro
gres
s In
pro
gres
s B
ui D
am, W
est A
fric
a G
as P
ipel
ine,
etc
pl
anne
d H
IPC
A
utom
atic
pric
e ad
just
men
t mec
hani
sm in
pla
ce.
A st
rate
gy fo
r ful
l eco
nom
ic p
ricin
g in
the
elec
trici
ty se
ctor
incl
udin
g lif
elin
e pr
icin
g to
ens
ure
affo
rdab
ility
for l
ow-in
com
e us
ers.
Don
e D
one
PRSC
M
aint
ain
impl
emen
tatio
n of
tarif
f adj
ustm
ent m
echa
nism
, with
life
line
prot
ectio
n fo
r the
poo
r. La
unch
pow
er se
ctor
refo
rm a
nd im
plem
ent 1
st y
ear a
gree
d ac
tions
M
aint
ain
imp.
Of a
utom
atic
pric
e ad
just
men
t( in
Pet
role
um)m
echa
nism
to k
eep
sect
or v
iabl
e, w
hile
pro
vidi
ng c
ross
sub
sidi
zatio
n in
favo
ur o
f the
poo
r
Don
e In
pro
gres
s In
pro
gres
s

60
Polic
y O
bjec
tive
Act
ivity
& M
easu
res
Stat
us
MD
BS
Acc
eler
ate
the
prog
ram
s for
der
egul
atio
n of
the
petro
leum
sec
tor.
Sust
ain
incr
emen
tal e
ffor
ts a
t ach
ievi
ng a
nd m
aint
aini
ng fu
ll co
st re
cove
r in
elec
trici
ty a
nd w
ater
util
ity p
ricin
g as
wel
l as i
mpr
ovin
g th
e ef
ficie
ncy
of th
e ut
ility
com
pani
es.
Pric
ing
form
ulas
for e
lect
ricity
and
wat
er c
ontin
ue to
be
adm
inis
tere
d by
the
PUR
C.
In p
rogr
ess
In p
rogr
ess
Don
e
RO
AD
S M
TP
Enha
nce
infr
astru
ctur
al d
evel
opm
ent t
o fa
cilit
ate
prod
uctio
n an
d di
strib
utio
n,
intra
regi
onal
trad
e an
d ac
cess
to p
orts
Dev
elop
and
reha
bilit
ate
maj
or h
ighw
ays i
nclu
ding
Acc
ra –
Kum
asi,
Acc
ra –
Y
amor
ansa
and
Acc
ra –
Afla
o –
Noe
pe
Con
stru
ct a
nd re
habi
litat
e on
e go
od ro
ad li
nkin
g ru
ral a
nd u
rban
mar
kets
in
ever
y re
gion
Im
prov
e fa
rm ro
ads t
o m
arke
ts th
roug
h Re
grav
ellin
g, sp
ot im
prov
emen
ts
And
upg
radi
ng o
f fee
der r
oads
.
In p
rogr
ess
On
cour
se
On
cour
se
MD
BS
Impr
ovin
g Pe
rfor
man
ce o
f Rur
al S
ecto
r in
Inte
rest
of t
he P
oor
Impr
ove
Feed
er a
nd T
runk
road
con
ditio
n m
ix in
dex
Con
ditio
n w
orse
ned
Trad
e Fa
cilit
atio
n R
evie
w ta
rget
ed a
reas
( car
go h
andl
ing,
stev
edor
ing,
etc
.) an
d de
velo
p im
plem
enta
tion
plan
to im
prov
e pe
rfor
man
ce.
Red
uce
leng
th o
f cus
tom
pro
cedu
res b
y ex
tend
ing
GSM
S/G
CN
et a
t Tak
orad
i an
d Te
ma
Ports
. Im
plem
ent c
ompu
teriz
ed ri
sk m
anag
emen
t sys
tem
und
er th
e de
stin
atio
n in
spec
tion
Cus
tom
s pro
cedu
res r
educ
ed to
1-2
day
s In
pro
gres
s
Stre
ngth
enin
g of
Priv
ate
Sect
or
MTP
Impr
ove
acce
ss a
nd in
crea
se v
olum
e of
cre
dit a
t aff
orda
ble
pric
es
Red
uce
bottl
enec
ks to
priv
ate
sect
or d
evel
opm
ent
Prom
ote
entre
pren
eurs
hip
Impr
oved
acc
ess t
o cr
edit
prog
ram
mes
in
prog
ress
A
ctiv
ities
to re
duce
bot
tlene
cks i
n pr
ogre
ss
Act
iviti
es in
pro
gres
s PR
SC
Impr
ove
the
Inve
stm
ent C
limat
e Im
plem
ent F
irst Y
ear T
ranc
he o
f app
rove
d tim
e-bo
und
Impl
emen
tatio
n Pl
an to
re
mov
e ke
y re
gula
tory
and
adm
inis
trativ
e ba
rrie
rs
Aut
omat
ion
and
com
pute
rizat
ion
of
Reg
iste
r Gen
eral
Dep
t in
prog
ress
. Ti
me
boun
d pl
an to
rem
ove
key
regu
lato
ry
and
adm
inis
trativ
e ba
rrie
r inc
orpo
rate
d in
to
med
ium
Ter
m N
atio
nal P
rivat
e Se
ctor
D
evel
opm
ent.
Stra
tegy
M
DB
S C
abin
et a
ppro
val o
f med
ium
-term
Priv
ate
sect
or d
evel
opm
ent S
trate
gy
Don
e

61
Polic
y O
bjec
tive
Act
ivity
& M
easu
res
Stat
us
MO
TI
MTP
D
evel
opm
ent o
f agr
o-pr
oces
sing
Prov
idin
g pr
oces
sing
equ
ipm
ents
to m
icro
and
sm
all-
scal
e pr
oduc
ers
Prom
ote
the
deve
lopm
ent o
f agr
i-bus
ines
s zon
es
Faci
litat
ing
acce
ss to
cre
dit
Enco
urag
ing
expo
rts o
f MSE
s
Not
on
cour
se
Not
on
cour
se
No
info
rmat
ion
No
info
rmat
ion
PRSC
Im
prov
e Tr
ade
Faci
litat
ion
A
ctiv
ities
in p
rogr
ess

62
4.3.1 Rural Development Based On Modernised Agriculture The Ministry of Food and Agriculture is the lead Ministry in the implementation of the GPRS policy objective of “Rural Development based on Modernized Agriculture” Elements of this policy objective include:
Increased access to irrigation services Improved Agricultural Mechanization Acquisition of land for commercial farming. Aquaculture Increasing access to Improved inputs ( livestock and crop) and services Promotion of production of High yield varieties Encourage the development of Non-Traditional Exports Provision of storage facilities to reduce post harvest losses. Improvement of market access and extension services
These policies are aimed at increasing productivity and expansion in output of the agricultural sector. Some progress has been made in the implementation of these policies but it is too early to assess their impacts. Provision of Irrigation Facilities By 2003, 713 out of 1309 boreholes, dugouts, water storage, stream diversion, stream and tube well pumping facilities, under construction were completed. Rehabilitation of Tono and Vea dams in the Upper East region were completed at a cost of ¢950 million, new models of micro irrigation were developed on 80 hectares of land in 3 districts and 80 Water Users Associations in the Upper East region were formed and trained on agronomic and water management practices Mechanization The Agricultural Engineering Services Directorate (AESD) has Rehabilitated 100 universal tractors, initiated the process of importing 200 tractors from India, awarded contracts for the local manufacture of silos, and awarded contracts for the local manufacture of mill threshers for rice and maize graters and pressers for cassava and palm kernel processing. These programmes have been funded by a total of ¢48.2 billion from the HIPC Fund. Acquisition of Land for Commercial Farming In 2002, very little progress was made with respect to releasing/acquiring land for commercial use. In 2003, MOFA in conjunction with the Ministry of Lands and Forestry initiated a project to acquire land for commercial farming. Activities undertaken in 2003 include an inventory of all agricultural lands acquired by government. The project is expected to end in 2006 Aquaculture To rehabilitate fisheries and support aquaculture development, the following projects were undertaken in 2003
Three dams in the Upper East Region were stocked with 32,000 fingerling of tilapia and catfish
20- fishponds at Tono project area have been rehabilitated 13 ponds were constructed in the Eastern Region 2100 fingerling were produced and used in restocking community dams in the
Northern Region, and 1030 fingerlings were distributed to farmers in the Volta Region

63
Despite the increase in area under fish farming, the indicator on quantity of fish produced shows no progress from 2002 to 2003 thus one might infer that the policy measures implemented in 2003 have not yet translated into improved output Access to Improved Inputs (Crops and Livestock) and Services To improve access to inputs for livestock and crop production several projects including credit for livestock and rice farming, animal vaccines, mass cocoa spraying, ostrich farming and improved seedlings were undertaken in 2003. In an effort to provide ready market for rice farmers, the Ministry through the ‘Smallholder Credit Input Supply and Marketing Project’ (SCIMP) has provided an amount of ¢7.6 billion to specialized companies and individuals with technical know-how in the purchasing, processing, storage and marketing of locally produced rice.
To serve as a catalyst to assist the private sector to increase the production of grains e.g. rice, maize, tubers, affordable credit to support farmers was provided under the following: • The Food Crop Development Project (FCDP) through which an amount of ¢4.898 billion was
disbursed to 3,391 farmers for the cultivation of 3134 hectares of cereals and legumes while an amount of ¢1.252 billion was disbursed as credit to 76 marketing groups consisting of 611 traders in the Nkwanta, Ejura, Wenchi and Damongo Districts to ensure ready market for farm produce.
• The SCIMP, continued to advance funds to qualified rural and community banks in 38 districts in the Volta, Ashanti, Brong-Ahafo, Western, Eastern and Central Regions for on lending to identified groups.
• In the implementation of the Coconut Development Project, a total of 168 hectares out of the annual target of 340 hectares were replanted for 162 farmers in 29 communities in the 6 participating districts in the Western and Central Region during the period under review.
In 2003 the main activities undertaken include: • The Animal Production Directorate in collaboration with the Ghana Standards Board (GSB) and
the Animal Research Institute (ARI) established feed quality standards to ensure that commercial feed manufacturers produce good quality feed.
• The Ministry facilitated the access to funding through SCIMP for the importation of three incubators for hatching ostrich eggs at Sogakope in the Volta Region and Lashibi in the Greater Accra Region.
• The Ministry procured dairy equipment for dairy farmers and trained 425 dairy farmers, processors and vendors in hygienic milking, handling and processing, thus enabling them to produce yoghurt, flavoured and pasteurised milk, butter and cheese and thereby improving their income.
An amount of ¢253.0 billion was spent to protect cocoa farms against capsid and black pod The exercise which was expected to cover an area of 1.6 million hectares of which black pod control was approximately 750,000 hectares while capsid control was 850,000 hectares. During the period, there were two applications of capsid control while black pod had three applications. Promotion of the production of high value crops Not much progress has been achieved in the promotion of the production of high value crops, even though several projects were embarked upon in 2003 such as the introduction of new varieties of exportable fruits such as pineapple, screening of planting materials and the development of

64
production guides. As at the end of 2003, Production guides were upgraded and Farmers were identified to multiply screened seeds. Improvement in Rural Sector Farm and Non-Farm Growth The government policy of increasing the cocoa farmers share of the FOB price culminated in the increase of producer prices five times since 2001 to increase the farmers’ share of the FOB price to 69% in 2003/2004 Crop Season in October. This translates into a producer price of ¢9.0 million per metric tonne. The increased producer price of cocoa to 69% of F.O.B impacts on the incomes of the agricultural labour force and consequent improvement in welfare. Policies of providing insecticides and the mass spraying of cocoa farms were introduced. The policy initiatives resulted in increased output by cocoa farmers of 496,793 metric tonnes during the 2002/2003 Crop season, the country’s second highest cocoa production in history surpassed only by the record 580,869 metric tonnes produced in the 1964/65 Crop Season, almost 40 years ago. This significant achievement has restored the country to the position of second biggest producer of cocoa beans in the world. Despite the high production of cocoa during the 2002/2003 season, the volume of exported cocoa beans in 2003 grew by only 11.4 per cent due to the policy to add more value domestically. As a result cocoa products recorded 54.0 per cent growth in value. Encouraging the Development of Non-Traditional Exports Under the Root and Tuber Improvement Project (RTIP) improved cassava planting materials have been supplied to the Ayensu Starch Company Limited (ASCo) under the President’s Special Initiative (PSI) on Starch for planting 464 hectares. o increase the export volume of pineapple, observation trials of Maya Gold, MD2 and Cowboy varieties were undertaken. In addition, five pineapple cooperative groups of FARMAPINE have been trained in plastic mulch technique to achieve higher yields and exportable weights of pineapple. There was also successful facilitation of production and supply of 12,860 exportable mango seedlings. Facilities to reduce post harvest losses There has been some progress in this area. About 218 out of 253 sub-projects comprising, drying floors, cooling plants, crop processors, storage facilities have been completed since 2002. Improvement of Market Access and Extension services Activities in this area for 2003 include: A total of 47.7 kilometres of roads in the Upper West Region constructed. 516 Km of feeder roads and 124 village and district level markets constructed under VIP Improvement at the Kasoa Market in Central Region at a cost of 1 billion cedis Research-Extension Liason Committees (RELCs) established in all the 10 regions Farmer based organizations (FBO0 and EDF committees active in 10 selected districts.
Land ownership One important indicator, which may provide some information on the trends in poverty, is land ownership. A large percentage of Ghanaians depend on the land for their livelihood, and thus access to land will be an indicator of poverty in the agricultural areas. In an attempt to avoid poverty, households may make distress sale of their land and other assets. Information from the 2003 CWIQ survey indicates as per Table 4.4 that on the average, more people (2.9%) indicated an improvement in land ownership than those who lost out on land (2.6%), with the rural poor being the greatest

65
beneficiaries of improved land ownership. In terms of regional distribution, apart from the Upper East region, the other three regions with the highest incidence of poverty, a greater percentage of households gained more land than those who became worse off, indicating some improvement in poverty. Table 4.4: CWIQ Result on Household Land ownership (a) Rural-Urban Total R RP U UP Land owned compared to one year ago Less now 2.6 3.8 5.1 1.2 2.5 More now 2.9 4.1 7.1 1.4 2.7
(b) Regional Distribution Land owned compared to one year ago Total WR CR GR VR ER AS BA NR UE UWLess now 2.6 5.7 1.8 0.5 2.8 1.1 1.2 1.6 5.3 12.3 4.4More now 2.9 5.3 2.5 1.1 2 1.3 1.4 3.1 10.7 2 4.5
4.3.2 Environmental Protection through Re-Aforestation The key MDAs whose activities fall under this policy objective are the Ministry of Lands and Forestry, the Ministry of Environment and Science and to a lesser extent the Ministry of Mines. The objective is to provide material and financial support for reafforestation of degraded forests, abandoned mining areas and major riverbanks. Thus the two main policy objectives are re-afforestation and land reform. As part of the reforestation policy, the Ministry of Lands and Forestry embarked on a Forest Plantation Development Programme in 2003. This project, is being funded with approved budget of 41 billion cedis. In 2003 493.8million cedis from the HIPC Fund was spent on the project. Replanting in forest reserves and urban areas are being undertaken, thus decreasing the rate of deforestation from 65,000 to 50,000 hectares a year. Land reform is intended to help support socio- economic development by developing a comprehensive national land use plan to tackle issues of weak land administration, the multiplicity of land disputes and inadequate regulatory and policy framework amongst others. In April 25, 2003 the Ministry of Lands and Forestry, initiated a Land Administration Program to reduce poverty and enhance economic/social growth by developing a sustainable and well functioning land administration system that is fair, efficient, cost effective and decentralized. It is estimated that it would take at least fifteen (15) years to complete the implementation of the Land Administration Program (LAP). The International Development Association, Nordic Development Fund, Canadian International Development Agency (CIDA), and Department support the LAP for International Development (DFID), the German Technical Cooperation (GTZ) and KfW.

66
Achievements in this area include: • A stretch of land from Dawhenya to Dawa in the Greater Accra Region and from Winneba
through Kwanyarko, Swedru up to Bundumburam in the Central Region has been identified and negotiations with the customary owners commenced in March 2003 with the view to encouraging them to use those lands as equity in new ventures. These lands will form part of the government’s land bank project.
• Since May 2003, the Government of Ghana has been taking inventory of stock of public lands to determine those lands suitable for retention and the quantum of compensation payable. Once established to be suitable, those lands would be utilized as land banks.
• Offices of the Land Title Registry are being opened in Sekondi-Takoradi and Koforidua in addition to the existing ones in Accra and Kumasi.
• A public education programme, which aims at educating the Traditional rulers and family heads to release land for investors started in August 2003. It is in the form of consultative meetings and phase one is targeting the three northern regions of Ghana.
4.3.3 Enhanced Infrastructural Development This section evaluates the progress of policies for fulfilling infrastructure goals. The MDAs whose activities are geared towards this GPRS policy are Ministry of Communication and Technology, the Ministry of Energy, and Ministry of Roads and Highways, Ministry of Works and Housing, Ministry of Ports and Harbours. ICT for Development To increase Telephone Access outside the Urban Centres and Provide ICT to Schools In 2003 Ghana Telecom initiated a programme to roll out an additional 400,000 fixed lines within 3 years. This is intended to support extension of broadband connectivity to towns with Senior Secondary Schools and Training Colleges to facilitate extension of computer literacy facilities in the schools. As of 2002, the country had a total of 200,000 fixed telephone lines. It is expected that by 2005, this number will increase to at least 400,000. As of November 2003, the cumulative number of fixed lines was 283,000 indicating that 83,000 lines had been installed during the year. The Kofi Annan ICT Centre was completed in 2003 and commissioned in early 2004. In 2003, a total of 257 schools were equipped with ICT. The target for 2005 is 514 schools. Energy The main policy objectives of the sector are:
• Ensure Reliable Supply of High Quality Energy • Energy Provision to Boost Industrial development • Expand Supply of Energy Services Economically, while protecting the Poor
Ensure Reliable Supply of High Quality Energy The activities and measures for ensuring reliable supply of high quality energy include:
implementation of cost recovery pricing for energy, continuation of the rural electrification programme, promotion of energy efficiency, and supporting development of renewable energy.

67
Automatic price adjustment formula for electricity which is one of the triggers in the energy sector has been developed and being implemented. A National Petroleum Tender Board has been established. To continue the rural electrification programme Phase 3 of the SHEP 3 project was implemented in 2003 and under the first phase of SHEP 4, survey work for the extension of electricity to communities was completed and work on the High voltage, Low voltage and Pole mounted substations was completed in 84 communities. Phase one of SHEP 4 is expected to benefit 190 communities. In SHEP 3 Phase 3, 572 towns were connected. With regards to renewable energy technology, the Ministry of Energy facilitated the installation of solar PV systems in schools, clinics, homes and for streetlights. Off-grid communities benefited from the installation of 4500 solar PV. Energy Provision to Boost Industrial Development To increase the availability of energy, to boost industrial growth and production, various energy sources are being considered. • Bui Dam - A cabinet committee has been set up to oversee the process of constructing the Bui
Dam and the tendering process has been initiated; • Takoradi Thermal Plant –progress is slow; • Rural Kerosene Distribution Improvement Programme – 700 out of the planned 1800 kerosene
surface tanks were distributed to the rural areas in all 110 districts. • West Africa Gas Pipeline -The performance in this policy area was positive; negotiations are at
an advanced stage • Buipe – Bolga pipeline project. Parliament has approved a $38.2 million loan agreement between
the government and the Export – Import (EXIM) Bank of Korea for the construction of the Buipe Bolgatanga Petroleum Products Pipeline Project. The loan is before Parliament, awaiting approval..
Expand Supply of Energy Services Economically while Protecting the Poor Lifeline protection is under implementation and consumers within the lifeline threshold enjoy concessionary rate. CWIQ data from 1997 and 2003 indicates that 51% of the households in 2003 had electricity compared with 37% in 1997. The rural electrification programme and the lifeline subsidies may account for the increased use of electricity by households. A PSIA on electricity pricing is in progress. Cabinet approved the Power Sector Reform in 2003. A Power Reform Secretariat has been established. Power reform programme is being implemented on schedule. Other actions carried out as a follow up to the launching of the power sector reform include:
the development of Public Education and Awareness Strategy, the formation of the VRA holding company with a review of the underlying legal
framework, the restructuring of a large share of the debt obligations of he VRA and ECG o government, the preparation of a performance-based management contract with ECG to improve financial
management, commercial and technical operations. The implementation of automatic price adjustment mechanism to keep the energy sector viable has been put in place and implemented on quarterly basis by PURC to reflect changes in market prices. Price formulas for electricity and water continue to be administered by the PURC. There was thus an 18% increase in prices for end users. For the petroleum sector, automatic price adjustments have been delayed. Thus TOR has to be subsidised. The Government will have to transfer TOR Debt Recovery Fund to make up for the under recovery emanating from TOR.

68
Cross subsidisation from premium to LPG was not implemented, and diesel fuel is being subsidised. A National Petroleum Deregulation Committee has been formed to oversee the de-regulation process. Roads The focus of the roads sector under the Ghana Poverty Reduction Strategy is primarily to provide access through better distribution of the road network with special emphasis on high poverty areas in order to reduce road transport disparities between the urban and rural communities. The programmes of the road sector have been strategised to address the observed poverty trends and sustain economic growth through the provision of safe, reliable, efficient and affordable services for all road users. The GPRS has also identified the lack of effective transport system linking member ECOWAS countries, and the need for interconnecting roads to open up the country and introduce competition. Thus in addition to the maintenance of trunk and feeder roads, there has been some emphasis on non-maintenance expenditure involving large infrastructural projects in the form of major highway construction. Good infrastructure raises productivity and lowers costs as it has been estimated that a 1% growth in infrastructure development leads to a 1% growth in GDP. Impact of Roads on Poverty From Table 4.5 a linkage of poverty with poor road condition can be established. Poor Regions tend to have poor roads. The Government’s priority with regards to roads in the Ghana Poverty Reduction Strategy is to focus more attention on the four regions where the incidence of poverty is high. In this connection the priority of the Ministry of Roads and Transport is at least to increase investment in feeder roads in the three northern regions and also in the Western and Eastern regions where a bulk of cocoa are produced to help address those deficiencies. Table 4.5 :Impact of Roads Conditions on Poverty
Region Area (sq. km) % below poverty line Length in poor conditions
% of poor roads
Upper East 8,842 88.2 1620.70 65.0 Upper West 18,376 83.9 1662.67 59.4 Northern 70,384 69.2 4234.89 64.1 Brong Ahafo 39,557 35.8 2941.62 39.0 Ashanti 24,389 27.7 3350.33 40.9 Volta 20,570 37.7 1487.70 34.5 Eastern 19,323 43.7 2140.36 47.3 Greater Accra 3,245 5.2 1005.14 33.0 Central 9,826 48.4 1375.07 35.8 Western 23,921 27.3 2644.77 45.0 Roads lengths in poor condition do not include on-going works under Ghana Highway Authority & Department of Urban Roads. Source: Ministry of Roads and Transport, 2003 Review Report Road Condition Mix Index The trunk road condition mix in 2003 was given as 29.4% in good condition, 29.8% in fair condition and 40.8% in poor condition compared with 26%, 27%, and 47% respectively in 2002. The feeder road condition mix in 2003 was 36% in good condition, 26% in fair condition and 38% in poor condition compared with 33%, 19%, 48% in 2002 respectively. The condition of the national road network as at end of 2003 indicates a network that is generally poor. A breakdown of the network indicates that the majority of roads in poor condition are the gravel network of trunk (secondary) roads, with only 3% in good condition. Thus for the roads sector

69
to have the desired impact on poverty the Ministry of Road and Transport may have to revisit its focus of investment on feeder roads only and consider the entire network. The activities to be undertaken in the context of the GPRS are the construction of major highways, enhanced access to markets through improved farm and feeder roads and enhanced access to urban markets. The specific roads, constructed, rehabilitated and maintained in 2003 and the status are reported in Table 4.6. Construction of Major Highways With regard to major highway construction, maintenance and reconstruction started on all the three major trunk roads radiating from Accra. These are Accra – Kumasi, Accra – Yamoransa and Accra – Aflao roads.
Accra – Kumasi: The Bunso – Anyinam section of the road was completed in 2003. Also 62 per cent and 28 per cent works were completed on the Apedwa – Bunso and Konongo – Anyinam sections respectively.
Accra – Yamoransa
Works started in December 2003 on the dual carriageway section from Mallam – Kasoa. The remaining section from Kasoa towards Yamoransa is to be constructed in two phases; the first phase of 41km from Kasoa to Ankamu also started in December, 2003.
Accra – Aflao
Work is progressing steadily on the Tema – Sogakope section. As at 31st December 2003, 36 per cent of the physical works had been completed at a cost of ¢60.0 billion.

70
Table 4.6: Activities in the Road Sector Programme Objectives
Programme Activities Implementation Status in 2002
Implementation Status in 2003
Construction of major Highways: Tetteh Quarshie Interchange Accra-Kumasi ( divided into eight sections) 1. Kwame Nkrumah
Circle-Achimota(7km) 2. Achimota-
Ofankor(5.7km) 3. Ofankor-
Nsawam(17.6km) 4. Nsawam-
Apedwa(41.6km) 5. Apedwa-Bunso(23km)
6. Bunso-Anyinam(11km)
7. Anyinam-
Konogo(85km) 8. Konongo-Ejisu-
Kumasi(53km)
Kwame Nkrumah Circle-Achimota –GoG awaiting World Bank authorization Achimota-Ofankor – tender documents completed, no funding available Ofankor-Nsawam – no funding as of April 2003 Nsawam-Apedwa – appraised for possible funding by ADB Apedwa-Bunso – 20% complete as of Feb. 2003 Bunso –Anyinam – 30% complete as of Feb. 2003 Anyinam-Konongo – funding secured, work expected to start Sept. 2002 Konongo-Ejisu-Kumasi – evaluation of tenders in place, work expected to start Sept. 2003
45% completed Kwame Nkrumah Circle-Achimota - 15 % completed
Achimota-Ofankor – IDA Funding proposed Ofankor-Nsawam – Contract signed on 20th January 2004 Nsawam-Apedwa - Procurement of supervision consultant in progress. Apedwa-Bunso – 62 % completed Bunso –Anyinam – 100% completed Anyinam-Konongo – 28% completed Konongo-Ejisu-Kumasi –contractor mobilizing
9. Accra-Yamoransa (divided into two sections)
10. Accra-Kasoa 11. . Kasoa- Wineba-
Yamoransa(98.2km)
Accra-Kasoa – evaluation reports & draft tender documents fowarded to World Bank for authorization Kasoa- Wineba -Yamoransa - Design for first section of road completed. Detailed design for 2nd section to be completed by Sept. 2004
Accra-Kasoa – work started in December 2003 Kasoa-Wineba–Yamoransa – The Kasoa-Ankuma(41km) section of the road began in December 2003
12. Accra-Aflao-Noepe( divied into three sections)
13. Tema-Sogakope (88km) 14. Sogakope-Akasti(22km) 15. Akasti-Aflo(56km)
Tema-Sogakope – work has commenced Sogokope-Akasti – project yet to be funded by KfW.Funding dependant on GoG fulfilling some conditionalities. Akasti-Aflao – project in early stages design and review.
Contractor mobilizing Tema- Sogakope – 36% of physical work completed at the end of December2003 Sogakope-Akasti – Draft contract for design review and supervision submitted to KfW for “No objection” Akasti-Aflo – Awaiting “No objection” on proposal
Construction or Rehabilitation of one good road linking Rural-Urban markets in every region:
1. Navrongo-Chuchuliga-Kupuli
2. Wa-Han-Tumu 3. Hwidiem-Keyanasi No
1-Atonie-Suyani 4. Asokwa-Bodwesango-
Gyadem-Ofoase-Juaso 5. Kpando-Worawora-
Kete-Krachi 6. Twifo Praso-Dunkwa 7. Bawdie-
Asankragua(34km) 8. Mpraeso-Adaweso-
Donkorkrom 9. Fufulso-Sawla 10. Amasaman-Obeyeyie-
Ayikai-Doblo-Odukponkpehe
1. 2.4% funding (of estimated cost) secured
2. 15% funding (of estimated cost) secured
3. 36.5% funding (of estimated cost) secured
4. 11.4% funding (of estimated cost) secured
5. 20% funding (of estimated cost) secured
6. 100% funding (of estimated cost) secured
7. Began in December 2002 8. No funding secured yet 9. 11.6% funding (of estimated
cost) secured 10. No funding secured yet
2. Gravelling on Wa - Han section completed 5. 25% of Kpando-Worawora section completed
7. 48% completed
Enhanced infrastructure Development
Access to market through improvements in farm roads to market through re-gravelling, spot filling
54% of target completed

71
Programme Objectives
Programme Activities Implementation Status in 2002
Implementation Status in 2003
Construction or Rehabilitation of Trunk Roads
1. Wenchi – Sampa (30km)
2. Wenchi – Bamboi 3. Tamale – Yendi (53km) 4. Abuakwa – Bibiani 5. Axim Junction – Tarkwa
(62.4km) 6. Jasikan –Brewaniasi
(33km) (Dzindzinso-Dodo Papase section -Volta 7. Kwahu Tafo- Adawso 8. Bekwai – Kuntunase –
Ejisu 9. Ejura – Nkoranza 10. Aframso–Sekyedumase-
Nkoranza 11. Mankranso – Tepa
(AshR) 12. Bole – Tinga 13. Bolgatanga – Bongo –
Feo 14. Wa – Dorumum 15. Ayanfuri – Diaso 16. Bamboi - Bole(53km) 17. Takoradi – Agona
Junction 18. Bibiani – Abuakwa 1
(74km) 19. Pantang-Mamfe(30km)
Invitations advertised in national dailies 5. Work began in June 2003 6 . Work began in December 2002
16. work began in December2002 17. work began in July 2002
18. Work began in June 2003
1. 70% completed 2. 32% completed 3. 27% completed 4. 7% completed 5. 9% completed
6. 16% completed
7. 15% completed 8. 54% completed
9. 36% completed
10. 19% completed
11. 76% completed
12. 22% completed 13. 5% completed
14. 30% completed 15. 50% completed
16. 25% completed 17. 100% completed
18. 7% completed
19. ADB’s no objection
awaited
Improving Feeder Roads to Enhance Access to Urban Markets To reduce the cost of bringing agricultural production to the market a number of feeder roads maintained. Over 15,000 kilometres of feeder roads were routinely maintained (Table 4.7). In addition to covering 15,200km of the routine maintenance works, about 4,278 km of feeder roads were either re-gravelled, rehabilitated or underwent spot improvement. Table 4.7: Kilometres of Feeder Roads Improved
Target (km)
Achievement (km)
2002 % of target
Target (km)
Achievement (km)
2003 % of target
Routine maintenance
13,700 10,459 76.3 17,100 15,200 89
Periodic maintenance
5,750 2,687 46.7 4,820 4,278 88.7
Total 19,450 10,459 53.8 21,920 19,478 88.8 Source: Ministry of Roads and Transport, 2002, and 2003 Review Reports Under the small streams bridge development programme, 14 composite bridges, 28 steel bridges and 11 box culvert bridges were constructed to improve access to farm gates and marketing centres in Western and Central regions:

72
Enhanced Access to Urban Markets The government’s programme of improving spatial access to urban markets by constructing and rehabilitation of one good road linking rural and urban markets is on course with a total of 1,092.5kms slated for construction over the 2002-2004 period. In 2003 gravelling on the Wa-Han section of the Wa-Tumu road was completed, while 45% and 25% of the Bawdie-Asankragua and the Kpando-Worawora roads have been respectively completed. Rehabilitation works are expected to continue in 2004. 4.3.4 Strengthened Private Sector One of the key objectives of the GPRS is to strengthen the private sector in an active way to ensure that it is capable of acting effectively as the engine of growth and prosperity. This is to lead to the creation of wealth at a faster rate in order to reduce poverty in a sustained manner. The Ministries of Private Sector Development and Trade, Industry and PSI perform the function. The Ministry for Private Sector Development (MPSD) is mandated to cooperate with the various MDAs, NGOs, private sector entrepreneurs and other stakeholders in bringing into fruition the “Golden Age of Business” and thereby achieving the objective of the GPRS. Performance with respect to private sector development was marginal in 2002. There has been substantial progress in this area in 2003 The focus of the Ministry in the realization of the development of a vibrant private sector in the medium-term is in three major areas namely: - Facilitating private sector access to long term finance at affordable rates; - Facilitating the reduction of bottlenecks in private sector development; and - Promoting Entrepreneurship. To improve access and increase volume of credit at affordable prices and to increase sources of long-term funding for Micro, Small and Medium Enterprises the Ministry of Private Sector Development has facilitated access to credit through the African Development Foundation (ADF), an Italian Credit facility of 10,000,000 Euros and a $17 million from the SOFITEL BANK of the USA. The Ministry has established an Institutional and Legal Reform Division to reduce bottlenecks to private sector development as well as facilitate the collaboration between the public and private sector towards the drafting of a number of reform bills (including the Companies Code, the Insolvency Bill, Money Laundering Bill and Insurance Bill. Improved Investment Climate The time bound implementation plan to remove key regulatory and administrative barriers for investment has been incorporated in the Medium Term National Private Sector Development Strategy (2004 – 2008). Some of these plans have been implemented. They include: • The modernisation of customs operations; • The drafting of a development strategy for the financial sector; • The signing into law of a new Labour Act, amending and consolidating existing legislation
and establishing a National Labour Commission with a mandate to address issues related to tripartite dialogue.
• Other barriers reduced include the time to start a business falling from 129 to 85 days.

73
Improved Trade Facilitation A reduction in the turnaround time at the ports is a major factor in improving the business environment. The GCNET is in operation at the Kotoka International Airport (KIA) and the Tema Port. Turn around time at the Tema Port is now between 24 to 48 hours whilst KIA is now 4 hours. The GCNET has been extended to the Takoradi Port and is in the trial phase in other road borders. A programme to install and operate another X-Ray Scanner at the Tema Port has been initiated. All the four destination Inspection companies have now implemented the Computerized Risk Management System (CRMS). A Destination Inspection Scheme Technical Review Team, which evaluated the scheme, submitted its recommendations to the Ministry of Trade, Industry and PSI on the 15th July 2003. Implementation of recommendations, which aim at improving the scheme started on 20th July 2003. The processing of Final Classification and Valuation Reports (FCVRs) by the Inspection Companies now ranges between 2 and 4 days. CEPS offices at Tema Harbour and KIA are linked to the Transaction Price Databases (TPDs) of the Inspection Companies via the Internet. Trade (a) Agro-Processing The Lead Ministry in this sector is the Ministry of Trade, Industry and President Special Initiative (PSI). Some of the activities undertaken to enhance the achievement of the GPRS Policy objective of increasing production and gainful employment through the promotion of agro-processing and other manufacturing activities include : 378 entrepreneurs assisted with loans amounting to ¢209,729,000 under various financial
schemes being operated by the NBSSI Thirteen districts in Northern, Brong-Ahafo and Ashanti Regions have received Logistics,
technical and financial support for Soya bean cultivation under HIPC support. The Ghana Standards Board (GSB) is accredited to certify fish and fish products exported from
Ghana into the European Union (EU) and other foreign markets 1,175 high-risk goods were tested by GSB under the Destination Inspection Scheme to ensure consumer safety.
Under the PSI on Salt, community sensitisation programmes were organized for all salt producing areas while two workshops on capacity building were organized for 102 industry operators. In addition, six production zones were identified and fifteen production units were registered.
The Ministry indicated in 2002 that it would establish 4 agro-business zones in the Northern and Brong-Ahafo regions. An amount of ¢10 billion was allocated to this activity. Data obtained from the Ministry indicates that this target was not achieved in 2003. (b) ECOWAS AND AGOA Increased external market access depends on strengthening ECOWAS as a regional market. About 25% of Ghana’s non-traditional exports go to destinations within ECOWAS. For Ghana to succeed with an export-based industrial strategy, she will need to work at the ECOWAS level to make tariff harmonization and trade liberalization effective. The US Africa Growth and Opportunity Act (AGOA) extends duty-free access to a broad range of Ghana’s products, as well as duty-free and quota-free access to apparel assembled in Africa from US or African fabrics/yarns up to 1.5% of US apparel imports increasing to 3.5 percent. Ghana will have to be certified annually on the basis of economic and social policies in order to receive these preferences.

74
Small and Medium Scale Industry Growth In the area of agro-processing the Ministry of Trade, Industry and PSI embarked on the Rural Enterprises Development Programme (REDP), which envisages the establishment of 3 businesses each in all the 110 districts. The NBSSI implemented several programmes to promote small and medium scale enterprises: 400 businesses were incorporated into the formal sector, NBSSI facilitated the establishment of 120 new businesses, An amount of about 210 million cedis of loans granted to 378 entrepreneurs.
Gender and Production The Ministry of Women and Children’s Affairs (MOWCA) is mandated to ensure increased participation of women and children in the development of the country. The policy thrust of the Ministry is to enhance women’s access and control of productive resources. In 2003, MOWCA established the Women’s Development Fund (WDF) with an initial sum of ¢21 billion out of which ¢10 billion was disbursed to 20,00 women farmers. Financial support was also provided for women engaged in commercial activities, agricultural production and processing. In all, 500,000 women have so far benefited from this fund with 50,000 new jobs created for women throughout the country. Manpower and Development In Skills Development and employment placement, the ministry achieved the following:
The Skills Training and Employment Placement Programme (STEP) saw a total of 3,500 people throughout the country trained in various skills under the first phase of the programme.
The National Vocational Training Institute (NVTI) trained and tested about 10,000 students in Technical Vocational Skills in 2003.
The Opportunities Industrialization Centre trained One thousand youth in various vocational skills.
The Ministry spearheaded the dissemination of the new labour law. 4.4 RECOMMENDED POLICY INITIATIVES
Some progress has been made in the Production and Gainful Employment area, but additional policy initiatives could be introduced to enhance the sector. Crop production is largely rain-fed and traditional techniques of production tend to dominate. To improve production the government will encourage private commercial farming based on proper mechanised and irrigation systems. The Ministry of Trade, industry and PSI will encourage the establishment of industrial estates and clusters emphasizing agricultural machinery development.
There will be an intensification of infrastructural development, especially in feeder roads rehabilitation, construction and maintenance to provide market access to rural agriculture.
For the re-aforestation of degraded lands will be an early commencement of the Phase II of the Natural Resource Management Programme at the Ministry of Lands and Forestry
The Ministry of Mines has been detached from Energy and currently the budget is too small for the activities geared towards poverty alleviation. The government will assess the feasibility of using a percentage of the Mineral Development Fund as seed money outside GoG expenditures to finance

75
poverty reduction projects and the Ministry‘s activities will be highlighted in the GPRS update. Again, the activities of the Ministry of Tourism are not fully captured in the GPRS and will also be fully integrated in the GPRS during the update for the 2006-2008.
Currently, the Ministry of Food and Agriculture captures data for only food crops. There is a need to expand the coverage of the Annual Survey to include non-food crops. The capacity to capture additional data is required. In the area of processing of agricultural produce, the Ministry of Trade, Industry and Presidential Initiatives has not achieved much. The emphasis has now being shifted to the Rural Enterprise Development Programme, which involves the establishment of three enterprises each in all the 110 districts.

76
5 HUMAN RESOURCE DEVELOPMENT AND BASIC SERVICES 5.1 INTRODUCTION
The policy objectives and activities under the HRD thematic area are geared towards creating conditions for the development of the human capital of the nation. Priority policy measures under HRD are in the areas of education and health. In the education sector priority measures include enhancing access to education; reducing gender disparities in education; and improving skills through training. In the health sector priority measures include enhancing access to and delivery of health services; increasing access to safe drinking water in rural areas; and improving sanitation. 5.2 EDUCATION SECTOR
The goal of the education sector is the provision of relevant education for all Ghanaians to enable them acquires skills, which will make them functionally literate and productive to facilitate poverty reduction and promote wealth creation. To this end, the main policy objectives of education in the GPRS have been to (a) enhance access to basic education, with special emphasis on gender and geographical equity and (b) to improve the quality of basic education in terms of human, material and financial resources. This section of the report provides a verification review of the policy actions in education in 2003. The verification process consists of tracking and evaluating the status of the various policy measures. Table 5.1 presents a summary of the status of education indicators monitored in this report.

77
Tabl
e 5.
1: S
umm
ary
of S
tatu
s of P
riorit
y In
dica
tors
in th
e Ed
ucat
ion
Sect
or
Prog
ram
me
Are
a Po
licy
Obj
ectiv
es
Indi
cato
r T
arge
t In
dica
tor
Leve
l 20
02
Stat
us In
200
3 Pr
ogre
ss
Tow
ards
Ta
rget
s G
PRS
MTP
Incr
ease
d En
rolm
ent
Gro
ss P
rimar
y en
rolm
ent r
atio
: N
atio
nal
88.5
79.5
81.1
Not
on
trac
k
Gro
ss P
rimar
y en
rolm
ent r
atio
for G
irls:
N
atio
nal
88.5
77
77.7
Not
on
track
En
hanc
e A
cces
s to
Edu
catio
n N
umbe
r of c
lass
room
s reh
abili
tate
d /c
onst
ruct
ed
with
furn
iture
pro
vide
d
- -
685
3-un
it cl
assr
oom
s bl
ocks
con
stru
cted
in 2
003
O
n tra
ck
Shar
e of
the
thre
e N
orth
ern
regi
ons i
n th
e re
habi
litat
ion
/con
stru
ctio
n of
prim
ary
clas
sroo
ms
20%
42
0 of
685
(61.
3%) o
f 3-u
nit c
lass
room
s con
stru
cted
w
ere
loca
ted
in th
e 3
Nor
ther
n re
gion
s Ex
ceed
ed
Num
ber o
f SSS
dev
elop
ed u
pgra
ded
to m
odel
sec
scho
ols
Wor
k on
the
first
bat
ch o
f 31
scho
ol b
egan
and
it is
pr
ogre
ssin
g st
eadi
ly
On
track
Q
ualit
y ed
ucat
ion
Pupi
l: Te
ache
r rat
io
33.1
32
.9
31.3
N
ot o
n tra
ck
Pass
rate
for C
RT
at m
aste
ring
leve
l in
publ
ic
scho
ols f
or M
aths
/ En
glis
h 6.
4% /
11
%
9% /
12%
N
/A
-
Perc
enta
ge o
f tra
ined
teac
hers
in p
rimar
y sc
hool
s 70
.6
69.6
73
.5
Exce
eded
Red
uce
gend
er
disp
arity
In
cent
ive
sche
mes
for g
irls i
n pr
imar
y sc
hool
s in
itiat
ed b
y th
e en
d of
PR
SC2
- -
¢8,8
85 b
illio
n of
GET
Fun
d pr
ovid
ed in
200
3/20
04
acad
emic
yea
r to
prov
ide
scho
lars
hip
for g
irls i
n ba
sic
scho
ols.
Oth
er in
clud
e m
ater
ial s
uppo
rt, sc
hool
feed
ing
and
prov
isio
n of
bic
ycle
On
track
Im
prov
e sk
ills
train
ing
Incr
ease
bud
geta
ry re
sour
ces t
o vo
catio
nal /
te
chni
cal s
choo
ls
- -
¢18.
7 bi
llion
of G
ET F
und
allo
cate
d fo
r reh
abili
tatio
n of
w
orks
hops
in v
ocat
iona
l sch
ools
O
n tra
ck
Gra
nts f
rom
pov
erty
pro
gram
mes
pro
vide
d fo
r sk
ills t
rain
ing
- -
4,80
0 un
empl
oyed
rece
ived
trai
ning
in v
ario
us sk
ills l
ead
by M
ME
O
n tra
ck
PRSC
2 Im
prov
e ef
ficie
ncy
and
equi
ty
Firs
t yea
r edu
catio
n st
rate
gic
plan
impl
emen
ted
by th
e en
d of
PR
SC 2
- -
- C
ompl
eted
in 2
003
Ach
ieve
d
Scho
ol m
appi
ng in
10
addi
tiona
l dis
trict
s co
mpl
eted
by
the
end
of P
RSC
2
M
appi
ng c
ompl
eted
for 5
out
of 1
0 ta
rget
ed d
istri
cts.
Map
ping
of t
he re
mai
ning
5 d
istri
cts t
o be
com
plet
ed b
y th
e en
d of
Mar
ch
On
track
Incr
ease
reso
urce
s del
iver
ed to
at l
east
10
depr
ived
dis
trict
s by
the
end
of P
RSC
-2
Act
ual n
on-s
alar
y re
curr
ent e
xpen
ditu
re to
40
depr
ived
di
stric
ts in
crea
sed
from
73%
to 9
1% in
200
3
Ach
ieve
d
Teac
her r
eten
tion
sche
mes
eva
luat
ed a
nd
impl
emen
ted
in m
ost d
epriv
ed d
istric
ts b
y en
d of
-
- A
num
ber o
f ret
entio
n sc
hem
es w
ere
impl
emen
ted
in
2003
. Spe
cial
atte
ntio
n w
as g
iven
to th
e th
ree
Nor
ther
n O
n tra
ck

78
Prog
ram
me
Are
a Po
licy
Obj
ectiv
es
Indi
cato
r T
arge
t In
dica
tor
Leve
l 20
02
Stat
us In
200
3 Pr
ogre
ss
Tow
ards
Ta
rget
s PR
SC2
regi
ons
Exec
utio
n ra
te o
f rec
urre
nt n
on-s
alar
y ex
pend
iture
not
less
than
75%
in 2
003
75
63
.6
The
exec
utio
n of
non
-sal
ary
recu
rren
t exp
endi
ture
in
crea
sed
to 9
1.1%
. A
chie
ved
Terti
ary
finan
cing
pol
icy
in p
lace
-
- A
com
mitt
ee e
stab
lishe
d &
uni
vers
ity s
tude
nts a
re
cont
ribut
ing
26%
of c
ost o
f goo
ds a
nd se
rvic
es a
s ac
adem
ic u
ser f
ees
On
track
Sour
ce: M
TPs –
GPR
S- 2
003-
2005
, PR
SC. -
2001
-200
4

79
5.2.1 Achievements in the Education Sector This section evaluates the outcomes of efforts to enhance access to quality education in the education sector in 2003. Table 5.2 provides trends in Gross Primary Enrolment Ratio (GPER). The national GPER showed an increase by 1.6 percentage points from 79.5% in 2001/2002 to 81.1% in 2002/2003 academic-year. However there was a marked improvement in the GPER in the deprived regions. For the three deprived Northern regions, the ratios showed faster growth than the national average. As shown in the Table the GPER in the Upper West Region increased by 6.5 percentage points from 63.1% in 2001/2003 academic year to 69.6% in the 2002/2003 academic year exceeding the GPRS target for 2005 of 63%.
Table 5.2: Trends in Gross Primary School Enrolment Ratio. 2001/2002 2002/2003 Target 2005 Progress National 79.5% 81.1% 88.5% Not on track Northern Region 64.8% 67.7% 70% On track Upper East Region 69.5% 72.2% 79% On track Upper West Region 63.1% 69.6% 63% Exceeded Source: Ministry of Education, 2003 Performance Report.
The analysis of GPER with regard to progress towards the achievement of gender parity in education points to similar trends. The national GPER for girls increased from 77% in 2001/2002 to 77.7% in 2002/2003 while the northern regions registered high rates with Upper West registering a rate of 70.3% in 2002/2003 up from 63% rate in 2001/2002. (Table 5.3).
Table 5.3: Primary Gross Enrolment Ratio for Girls (PGER), 2001/02-2002/03 2001/2002 2002/2003 Target 2005 Progress National 77% 77.7% 88.5% Not on track Northern Region 55% 59.1% 70% On track Upper East Region 69% 72.1% 79% On track Upper West Region 63% 70.3% 63% Achieved
Source: Ministry of Education, 2003 Performance Report. The leap in GPER generally in the 3 most deprived regions and those of Girls in the regions in particular underscores the tremendous effort of government in ensuring regional and gender equity in access to education in the country. Quality of Education Indicators The beneficial impact of expanding access to education can be achieved only if education is of good quality and parents/guardians perceive good returns to investment in their children’s education. If parents believe that their children are not receiving quality and relevant education, they will not send their children to school. Table 5.4 presents information on selected quality of education indicators. The Table shows that the results of effort towards increasing quality of education is mixed. The pass rate for Criteria Reference Test (CRT) still remains very low given that only 9% of pupils in public schools were able to achieve masterly scores in Maths and 12% mastery scores in English in 2001/2002 academic year and the national PTR is falling rather than increasing towards its target. However, there was some appreciable increase in the proportion of trained teachers in primary schools from 69.9% in 2001/2002 to 73.5% in 2002/2003 academic year. Among the factors affecting quality of education is the large number of trained teachers who go on study leave annually and teacher attrition. Measures taken to address this issue in 2003 are evaluated in the next section of the report.

80
Table 5.4 Trends in Quality Education Indicators Indicator 2005 Target 2000/2001 2001/2002 2002/2003 Percentage of trained teachers in public primary schools
-------- 68.6 69.9 73.5
Pupil teacher ratio (PTR) 33.1 32.9 31.3 Pass rate for CRT at mastering level in public schools: ---Maths --- English
6.4% 11%
4.0% 8.7%
9% 12%
n/a n/a
Source: Ministry of Education, 2003 Performance Report. 5.2.2 Policy Measures The government has recognized the problems confronting the educational sector and the following medium term policy measures were implemented in 2003 to address some of these problems. This section assesses the status of these measures. The assessment is done in line with GPRS policy objectives of enhancing access to education; reducing gender disparities in education; and improving efficiency and equity in education financing. Enhancing Access to Education The GPRS document outlines five key strategies for enhancing access to education in the medium term: rehabilitation/construction of primary school classrooms, development of one model senior secondary school with libraries and science laboratories in each of the 110 districts in Ghana, and implementation of teacher retention schemes. Table 5.5: Summary of status of Access Indicators
Policy Objective
Indicator Target 2005
Indicator Level 2002
Indicator Status 2003
Progress
Enhance access to education
Number of classrooms rehabilitated /constructed with furniture provided
-
-
685 3 unit classrooms blocks constructed in 2003
On track
Share of the three Northern regions in the rehabilitation /construction of primary classrooms increased from 20% to 30% in 2004
30%
20%
420 of 685 (61.3%) of classrooms constructed were located in the 3 Northern regions
Exceeded
Number of SSS developed upgraded to model sec schools
31 schools selected for upgrading
Work on selected schools progressing steadily in 2003
On track
Teacher retention schemes evaluated and implemented in most deprived districts by end of PRSC2
-
-
A number of retention schemes were implemented in 2003. Special attention was given to the three Northern regions
On track
First year education strategic plan implemented by the end of PRSC 2-
-
-
Completed in 2003 Achieved
Source: Ministry of Education, 2003 Performance Report. Number of classrooms rehabilitated/constructed with furniture To improve access to primary education, a total of 685 3-unit classroom blocks were constructed in 2003. An amount of 39 billion cedis from HIPC fund and 14.9 billion cedis contribution from the GETfund was disbursed during the year towards construction of an additional 440 six-unit classroom blocks.

81
Share of the three Northern regions in the rehabilitation/construction of primary classrooms. Out of the National total of 685 3-unit classrooms constructed in 2003, 420 of them (representing 61.3%) were built in the three deprived Northern regions, already exceeding the HIPC target of 30% in 2004. Out of the National total of 440 six-unit classroom blocks under construction nationwide, 96 projects (representing 21.8%) are in the three deprived Northern regions. Rehabilitate/develop selected SSS to model school Data from the 2003 CWIQ indicate that Secondary school enrolment rate of 50.4 % in urban areas and only 28.7% in rural areas. The same survey reported that whereas 82.4% of respondents in urban areas were satisfied with the quality of secondary education, the corresponding proportion for rural areas was 67%. To ensure equity in access to quality education at the SSS level, the Ministry of Education selected 31 senior secondary schools located in deprived districts for upgrading to model schools in 2002. A total amount of 48 billion cedis was disbursed to implement the project. Information available in 2003 show that works on the first batch of 31 schools is progressing steadily. Teacher retention schemes in most deprived districts Evaluation of the teacher retention schemes under the FCUBE was completed in 2002. Key findings from the evaluation exercise were as follows:
-general satisfaction with the scheme -reduction in the number of absenteeism of teachers -increase morale and motivation among teachers -attendance at school and meetings more regularly.
On the basis of the results of the evaluation, specific measures were undertaken in 2003 to enhance teacher retention in deprived districts. These measures included: • The implementation of policy and programmes to reduce the number of teachers on paid study leave.
-the criteria for paid study leave were revised to favour teachers in deprived districts. A two-year service in a deprived district was introduced as one of the conditions for the granting of study leave with pay. A total of 5,000 teachers benefited from such leave in the 2003/2004 academic year, compared to a higher figure of 6,033 in the 2001/2002 academic year. There are plans to reach a target of 3,000 teachers in 2004/2005 academic year. - Distance Education and Sandwich programmes were implemented as a strategy for reducing the number of teachers applying for study leave. The number of teachers enrolling for these programmes increased from 750 in 2001/2002 academic year to 3,618 in 2003/2004 academic year. This is addition to the 4,500 students mainly teachers admitted into the Cape Coast University and Winneba distance education programmes, which received an allocation of 839.3 million cedis from the GETFund.
• Provision of material incentives for teachers. The incentive packages include:
• 5,000 radio cassette players • 5,000 sets of cooking utensils • 14, 400 bicycles
A total of 24,400 teachers have benefited from these incentive packages since 2002. Out of this number, 25% were from the three regions in the North.
• Teacher accommodation To ease the perennial accommodation problems faced by teachers who are posted to deprived districts, a total of 56-teacher accommodation units were constructed in 2003, with 23% located the three Northern regions.
• District Sponsorship of Teacher Trainees Programme. One initiative adopted for ensuring teacher retention involves the sponsorship of teacher trainees by districts. The beneficiaries of the district teacher-training programme are required to return to the districts

82
after training. The teachers are bonded to teach in the districts for at least three years after being sponsored. − 2000/2001: 76% of teacher trainees admitted to the programme − 2002/2003: 91% of teacher trainees admitted to the programme − 2003/2004: All teacher trainees to be sponsored under the district programme
First year Education Strategic Plan The Education Strategic Plan (ESP) is a major initiative designed to provide a strategic framework for the development of the education sector and also provide the basis for the adoption of a sector wide approach to education financing. The plan was completed in 2003. The 2004 Education sector budget has been geared towards the implementation of the ESP, which will facilitate the achievement of the government objective of providing universal primary education by 2015 and gender parity in enrolments by 2005. Reducing Gender Disparities in Education One key objective of Government in the education sector is to reduce the gender gap in school enrolment. A proposed strategy for achieving this objective in the medium term is to develop scholarship and other incentive schemes to ensure the retention of girls in schools once enrolled. Progress towards this measure is presented below. Table 5.6: Summary of Status of Reducing Gender Disparities Indicators
Indicator Target 2005
Indicator Level 2002
Indicator Status 2003
Progress
Incentive schemes for girls in primary schools initiated by the end of PRSC2
- - ¢8.885 billion of GET Fund provided in 2003/2004 academic year to provide scholarship for girls in basic schools. Others include material support, school feeding and provision of bicycles.
Fund not disbursed.
Source: Ministry of Education, 2003 Performance Report. Scholarship schemes for girls in primary schools In the 2003/2004 academic year, an amount of ¢8.885 billion from the GET fund was allocated to the Ministry of Education, Youth and Sports to provide scholarships for pupils in basic schools. The fund has not yet been disbursed. However, the proposed formula for disbursement in 2004 is expected to lead to more girls accessing financial support and reducing drop out rates among them as the distribution criteria favours girls. -Proposed formula for disbursement: Sixty percent to be used for girls in primary schools Thirty-five percent to be used for girls in Junior Secondary schools. Five percent for special needs such as the handicapped. -Material Support for girls 5,500 needy girls benefited from school uniforms and bags, exercise books and pens, pencil erasers; 24,169 basic schoolgirls benefited from the distribution of food rations in exchange for school attendance; 888 girls received bicycles, 80% of which were to girls in the three Northern regions (additional 650 to benefit in 2003/2004). Improving Skills Training One key strategy in the GPRS for reducing poverty and developing human capital is to provide support for vocational and technical skills training. Additional proposals include the provision of

83
marketable skills to the unemployed youth using the traditional apprenticeship system. The status of these measures during the period under review is presented below. Table 5.7: Summary of Status of Improving Skills Training Indicators
Indicator Target 2005
Indicator Level 2002
Indicator Status 2003
Progress
Increase budgetary resources to vocational / technical schools
- - ¢18.7 billion of GET Fund allocated for rehabilitation of workshops in vocational schools
On track
Grants from poverty programmes provided for skills training
- - 4,800 unemployed received training in various skills lead by MMDE
On track
Source: Ministry of Education, 2003 Performance Report. Budgetary resources to vocational /technical schools In 2003, an amount of 18.7 billion cedis from the GETfund was allocated to support skills and training programmes in vocational technical schools. The fund was used mainly for the rehabilitation of workshops in vocational schools. Grants from poverty programmes for skills training An amount of 11.16 billion cedis was allocated to the Ministry of Manpower and Employment in 2003 to implement a skills training and employment placement programme. Trainees were identified through an unemployment registration exercise undertaken earlier in 2002. A total of 4,800 people have so far acquired various skills training under this programme. However, information on job placements is not currently available. Street Children A community based poverty reduction project (CPRP) is being implemented on a pilot basis, in ten-selected district in the country to address three important poverty related issues. One main issue is the phenomenon of street children. This component seeks to learn how to effectively deliver packages of essential services that will reintegrate street children in the communities and within their families. The programme is being implemented in 4 pilot districts in Greater Accra, Northern, Ashanti and Western regions. Improving Efficiency and Equity of Financing Education with Attention to Greater Poverty Impact To bridge the equity gap in access to education the following measures were implemented: school mapping to identify disadvantaged districts; and increased resources to disadvantaged communities.

84
Table 5.8: Summary of Status of Efficiency and Equity of Financing Education Indicators
Indicator Target 2005
Indicator Level 2002
Indicator Status 2003
Progress
School mapping in 10 additional districts completed by the end of PRSC2
Mapping completed for 5 out of 10 targeted districts by end of the year
Not Achieved
Increase resources delivered to at least 10 deprived districts by the end of PRSC-2
Actual non-salary recurrent expenditure to 40 deprived districts increased from 73% to 91% in 2003
Achieved
Execution rate of recurrent non-salary expenditure not less than 75% in 2003
63.6
The execution of non-salary recurrent expenditure increased to 91.1% -Slightly below target
Achieved
Tertiary financing policy in place
- - A committee established & university students are contributing 26% of cost of goods and services as academic user fees
On track
Source: Ministry of Education, 2003 Performance Report. School mapping in 10 additional districts This measure was not completed in 2003. School mapping in only five out of targeted 10 deprived districts had been completed at the time of this report. The 5 districts were:
• Bolga, Bongo, Bawku West, Savelugu-Tatale, Zabzugu However, there are indications that mapping of the remaining 5 districts may be completed by the end March 2004. Resources delivery to at least 10 deprived districts
There was improvement on the 2002 performance with regard to the delivery of resources to deprived districts as shown below:
Budgeted Non-Salary (Items 2-4) to 40 deprived districts increased from 41,236 million cedis in 2002 to 57,886 million in 2003, a 40% increase.
Actual Non-Salary recurrent expenditure (Items 2-4) to the 40 deprived districts increased from 73% in 2002 to 91% in 2003, an increase of 18%.
Recurrent non-salary expenditures
The execution rate of budgeted non-salary recurrent expenditure improved from 63.6% in 2002 to 91.1% in 2003, a exceeding the targeted 75% in 2003.
Tertiary financing policy
A tertiary financial policy is not yet in place. However, a committee has been established to prepare a financial strategy for tertiary education and final proposals are expected by the end of June 2004. Ahead of that, university students are currently contributing 26% of the cost of goods and services as academic user fee- a 30% increase on previous year.

85
5.2.3 Recommended Policy Initiatives The analysis clearly shows increases in GPER nationally and reduction in disparity across regions and gender in line with the objectives of the GPRS. The monitoring of quality of education indicators however shows mixed results. Government will continue to pursue the current policies to ensure more equity in access. Special attention will be paid now to quality issues in the next round of GPRS implementation. Teacher retention is key to ensuring quality education and reducing school drop out. Impact assessment of the teacher retention schemes will be conducted regularly to ascertain the differential impact of the different schemes being implemented. 5.3 HEALTH SECTOR
The Government of Ghana’s social policies under the health sector are designed to improve the health status of the Ghanaian population and thereby ensure a healthier population for social and economic development. In the medium term, the Government intends to accomplish this goal through carefully selected measures. These measures include:
• Enhancing efficiency in delivery and increased access to health services • Ensuring sustainable financial arrangements that protect the poor • Improving access to safe water in rural and peri-urban communities
Table 5.9 provides a summary of the status of the indicators used to track progress with the above measures in 2003.

86
Tab
le 5
.9: S
umm
ary
of S
tatu
s of P
rior
ity H
ealth
Indi
cato
rs in
200
3 Pr
og.
Are
a Po
licy
Obj
ectiv
e In
dica
tor
Tar
get
2005
20
02
Indi
cato
r St
atus
200
3 Pr
ogre
ss
MTP
Infa
nt M
orta
lity
50/1
000
57/1
000
64/1
000
Not
on
track
U
nder
five
mor
talit
y 95
/100
0 10
8/10
00
111/
1000
N
ot o
n tra
ck
Chi
ld M
alnu
tritio
n 20
.0
26.0
35
.8
Not
on
track
Im
mun
izat
ion
Cov
erag
e 90
.0
62.0
69
.4
On
track
Pr
opor
tion
of su
perv
ised
del
iver
ies
55.0
44
.3
47.1
O
n tra
ck
In
crea
se
Acc
ess t
o he
alth
serv
ices
Num
ber o
f mod
el h
ealth
cen
tres p
rovi
ded
/upg
rade
d -
- 15
mod
el h
ealth
cen
tres a
nd 2
dist
rict h
ospi
tals
wer
e co
mpl
eted
fo
r use
in 2
003.
Add
ition
al 1
5 st
arte
d to
be
com
plet
ed in
200
4.
On
track
A t
leas
t 2 d
epriv
ed re
gion
s to
be fu
lly c
over
ed u
nder
the
HIR
DP
by th
e en
d of
PR
SC2
- -
Com
plet
ed fo
r PR
SC2-
MO
H a
nd U
NIC
EF a
re im
plem
entin
g th
e pr
ogra
mm
e in
Nor
ther
n an
d U
pper
Eas
t reg
ions
A
chie
ved
At l
east
20%
cov
erag
e of
Com
mun
ity H
ealth
Pla
nnin
g an
d Se
rvic
es (C
HPS
) by
the
end
of P
RSC2
20
%-
2003
Out
of 1
30 z
ones
, onl
y 47
are
cur
rent
ly b
eing
cov
ered
in 2
004
of w
hich
28
are
in th
e de
priv
ed a
reas
N
ot
achi
eved
Ensu
re
sust
aina
ble
heal
th c
are
finan
cing
Nat
iona
l Hea
lth In
sura
nce
esta
blis
hed
and
oper
atio
nal
- -
Parli
amen
t pas
sed
the
Nat
iona
l Hea
lth In
sura
nce
Act
45
dis
trict
s ha
ve b
een
pilo
ting
the
sche
me
On
track
Hea
lth e
xpen
ditu
re in
crea
sed
from
5.7
in 2
000
to 7
% o
f to
tal g
over
nmen
t exp
endi
ture
in 2
003
7
10.5
11
.8
Exce
eded
Im
prov
e A
cces
s to
safe
w
ater
/s
anita
tion
Perc
enta
ge o
f rur
al p
opul
atio
n w
ith a
cces
s to
safe
wat
er
sour
ces
54
41.2
8 46
.4
On
track
Perc
enta
ge o
f rur
al p
opul
atio
n w
ith a
cces
s to
adeq
uate
sa
nita
tion
Inci
denc
e of
gui
nea
wor
m re
porte
d re
duce
d 0
5,54
5 8,
000
(44.
3% in
crea
se si
nce
2002
) N
ot o
n tra
ck
PRSC
2
Prog
ram
mes
to p
rom
ote
relo
catio
n an
d re
tent
ion
of h
ealth
pr
ofes
sion
als t
o m
ost d
epriv
ed re
gion
s app
rove
d by
cab
inet
an
d in
clud
ed in
200
4 bu
dget
by
the
end
pf P
RSC
2
- -
Com
plet
ed in
200
3-an
d ¢2
2 bi
llion
ced
is a
lloca
ted
in 2
004
budg
et to
pro
vide
sala
ry in
cent
ive
to h
ealth
wor
kers
in se
lect
ed
dist
ricts
.
Fina
ncia
l ana
lysi
s of t
he n
atio
nal p
ublic
hea
lth b
udge
t and
na
tiona
l hea
lth in
sura
nce
sche
me
com
plet
ed b
y th
e en
d of
PR
SC-2
- -
Com
plet
ed b
y M
inis
try o
f Hea
lth in
col
labo
ratio
n w
ith IL
O
Mon
ey d
isbu
rsed
for e
xem
ptio
n fe
e in
crea
sed
and
exem
ptio
ns fo
r mat
erna
l del
iver
y in
trodu
ced
in a
ll re
gion
s by
the
end
of P
RSC
2
- ¢1
2.8
Bill
ion
Incr
ease
d to
¢24
bill
ion.
¢17
.2 b
illio
n w
as p
rovi
ded
as
addi
tiona
l mon
ey b
y th
e G
over
nmen
t to
incr
ease
cov
erag
e to
th
e de
priv
ed N
orth
ern
and
cent
ral r
egio
ns
New
recu
rren
t exp
endi
ture
form
ula
in p
lace
by
the
end
of
PRSC
2 -
- C
ompl
eted
and
ado
pted
in th
e 20
04 b
udge
t
Sour
ce:
MTP
s and
HIP
C: G
PRS
2003
-200
5, P
RSC
2: P
RSC
-200
1-20
04

87
5.3.1 Progress and Achievements in the Health Sector This section reports on progress towards the achievement of key outcome and output indictors in the health sector. Table 5.10 presents the trend in basic health indicators for the country. Table 5.10: Basic Health Sector Indicators, 1988-2003 (%) 1988 1993 1998 2003 Infant mortality rate 77 66 57 64 Under five mortality rate 155 119 108 111 Immunization coverage (DPT3) 43 62 69.4 Child malnutrition (underweight) 24 27 25 35.8 Maternal mortality rate 240 214 214 n.a Crude death rate 17 12.5 10 n.a Life expectancy 54 56 58 60 Crude birth rate 47 44 39 n.a Total fertility rate 6.4 5.5 4.6 4.4 Source: DHS, WDR and health sector Program of Work in Ghana-Facts and Figures Infant and Childhood Mortality Table 5.10 shows that the gains in both infant and childhood mortality rates in the 1990s seem to have been eroded in the last five years (1998-2003). Infant mortality increased from 57/1000 in 1998 to 64/1000 in 2003, an increase of about 12.3%. The increase in childhood mortality was smaller-about 2.8%. There are many reasons that may account for the observed increases in infant mortality and childhood mortality. These include poor access to health services (including lack of money to cover health expenses) and child malnutrition (see section on child health below). Figure 5.1 shows that access to health care remains poor with a national average of just over 50 percent. The proportion of people with access to health care is far lower in the three northern regions.
Table 5.11: Access to Health Care by Region Regions 2003 Western 46.9 Central 67.2 Greater Accra 80.9 Volta 49.5 Eastern 60.1 Ashanti 69.0 Brong Ahafo 53.8 Northern 35.0 Upper East 26.7 Upper West 30.4 National 57.6 Source: CWIQ 2003 Preliminary Report

88
Figure 5.1: Percent Access to Health Care by Region - 2003
0102030405060708090
Nation
al
Wester
n
Centra
l
Greater
Accra
Volta
Easter
n
Ashan
ti
Brong A
hafo
Northe
rn
Upper
East
Upper
West
Source: CWIQ 2003 Preliminary Report
The phenomena, however, requires a more detailed analysis of the 2003 DHS mortality data and further studies by the Ghana Statistical Service. Child Health Inadequate immunization coverage and poor nutritional status of children are among the important factors that may influence the observed high levels of childhood mortality in Ghana. The indications are that efforts to increase immunization coverage are yielding results. The proportion of children 0 to 12 months who are fully immunized increased from 62.0 percent in 2002 to 69.0 percent in 2003. (Table 5.10) However, the level of child malnutrition as measured by the proportion of children underweight has increased by 10.5 percentage points in the last five years. Analysis by region in Figure 5.2 reveals that child malnutrition increased in all the regions, except the three northern regions; and prevalence is above the national average in the Ashanti (46%), Greater Accra (40.4%) and Western (36.9%) regions. The lack of progress towards reducing childhood malnutrition may be due to problems associated with the delivery of community nutritional health programmes and/or household access to adequate and nutritious food.
05
101520253035404550
Perc
enta
ges
Wes
tern
Cen
tal
Gt A
ccra
Volta
Eas
tern
Ash
anti
Bro
ng A
hafo
Nor
ther
n
Upp
er E
ast
Upp
er w
est
Nat
iona
l
Figure 5.2: Percentage of children malnourished (underweight by region)
19972003

89
Source: GSS- 1997 / 2003 CWIQ report A community based poverty reduction project (CPRP) is being implemented on a pilot basis, in four selected district in the country to address three important poverty related issues one of which is nutrition and food security. The districts include Sefwi Wiawso, Bongo, Kadjebi and Komenda/Edina/Eguafo/Abirim. Ten communities were selected in each pilot district. The nutrition and food security component is mainly aimed at strengthening the capacity of communities to achieve, on a sustainable basis, adequate nutrition and food security most importantly for pregnant and lactating women and children under five years. The programme is being implemented in 40 communities. Out of the 40 participating communities, Community Nutrition Workers (CNWs) were trained in 26 at end of 2003 mainly to promote growth, through growth monitoring for children, counselling on health, and hygiene education issues. Also a strategy was adopted to empower mothers and other caregivers to implement pieces of advice given during training sessions hence a Local Initiative Fund (LIF) is being established as a sub component. This fund will aim at identifying care givers who need financial assistance in form of small loans to enable them improve their income generation activities and thereby earn sufficient income to feed their children. Maternal Mortality Available statistics indicate high maternal mortality rates in Ghana (Table 5.10). Behind this aggregate figure are also wide geographical variations in the risk of maternal death. The GPRS identifies the three northern regions and the central region as needing most attention in efforts to improve maternal health. Two important correlates of poor maternal health outcomes are inadequate antenatal care coverage and unsupervised deliveries. In the past year, the government continued to invest in programmes aimed at increasing uptake of antenatal care and coverage of supervised deliveries by health professionals. As a result, there has been significant increase in the proportion of mothers benefiting from antenatal health care and supervised deliveries. Overall, 69 percent of antenatal coverage was achieved in 2003 as against 62 percent in 2002 (CWIQ, 2003). Results from the same survey indicate about 47% of births were delivered under the supervision of health professionals, an increase of about 3% from the 1998 figure of 44%. Regional trends show low but steady increases in coverage in the three deprived northern regions. Central region is the only region that recorded decrease in coverage from 40% in 1998 to 38.5% in 2003 (Table 5.12). Table 5.12: Proportion of supervised deliveries by health professionals, 1998 and 2003
1998 2003 National 44.3 47.1 Central 40.0 38.5 Northern 11.1 18.3 Upper West 22.1 27.8 Upper East 16.1 33.3
Source, 1988GDHS, and 2003 GDHS Preliminary Report.
5.3.2 Policy Measures A number of medium term policy measures were implemented in the in 2003 to facilitate progress towards the achievement of the targets set for the above outcome and output health indicators. This section evaluates the status of these measures in 2003. The evaluation is organized around the key medium term policy objectives of enhancing access to health services; ensuring sustainable financial arrangement that protects the poor; and improving access to safe water in rural and peri-urban communities.

90
Enhance Delivery and Increase Access to Health Services. The Government’s effort to enhance the delivery and increasing access to health services continued in 2003 with the strengthening of measures to (i) provide one model health centre in each district (ii) implement high impact and rapid delivery programmes to reduce under-five mortality and maternal mortality PRSC targets under this section are (i) expand the coverage of community health planning and services and (ii) develop programmes to promote the relocation and retention of health professionals. The status of each of these measures is provided below.
Indicator Target 2005
Indicator Status 2003 Progress Towards Target
Number of model health centres provided /upgraded
- 15 model health centres and 2 district hospitals were completed for use in 2003. Additional 15 started to be completed in 2004.
On track
A t least 2 deprived regions to be fully covered under the High Impact Rapid Delivery Programme (HIRDP) by the end of PRSC2
- Completed for PRSC2- MOH and UNICEF are implementing the programme in Northern and Upper East regions
Achieved
At least 20% coverage of Community Health Planning and Services (CHPS) by the end of PRSC2
20%-2003
Out of 130 zones, only 47 are currently being covered in 2004 of which 28 are in the deprived areas
Not achieved
Programmes to promote relocation and retention of health professionals to most deprived regions approved by cabinet and included in 2004 budget by the end pf PRSC2
- Completed in 2003-and ¢22 billion cedis allocated in 2004 budget to provide salary incentive to health workers in selected districts.
Achieved
Source: 2003 Ministry of Health Performance Report
Model Health Centres In 2003, fifteen Health Centres and two District Hospital (Bimbilla and Begro) were completed for use through the support of the OPEC Fund and Ghana Government. An additional fifteen health centres, which started under the Saudi Phase 11, are expected to be completed by January 2004. Work on upgrading three Health Centres at Juabeso, New Edubiase and Nkwanta was also initiated to be completed by June 2004. Deprived regions to be fully covered under the HIRDP This measure can be considered completed for PRSC-2. The Ministry of Health in collaboration with UNICEF are currently implementing the programme in all districts in the in two deprived regions (Northern and Upper East regions). Community Health Planning and Services (CHPS) The CHPS is a key strategy in the GPRS for addressing regional differentials in health outcomes and increasing the poor’s access to health services. The 2003 survey reveals that access is poor in the three northern deprived regions and among the rural poor. To date the PRSC-2 target of 20% has not been achieved. CHPS is currently being implemented in 47 zones, 28 of which are in the deprived regions. To meet the PRSC target of 20% coverage, an additional 83 zones need to be completed, of which 26 are in deprived areas. Relocation and retention of health professionals in most deprived regions A programme for relocation ant retention of teachers in deprived regions was finalized and approved by cabinet. Specifically, the programme involved the identification of 55 deprived districts, including all districts in the deprived regions for interventions to retain health professionals and attract new ones. The 2004 budget allocates 22

91
billion cedis to provide a salary incentive to all health workers currently in the selected districts. In addition, 19 billion cedis from the HIPC fund will be utilized to attract new health workers to the district. The District Assemblies will administer the funds for the programme. There are, however, concerns that salary incentives alone may not be sufficient to ensure success of the programme. Other incentives that have been suggested in the package jointly by the Ministry of Health and Ghana Health Service are good schools for children, availability of basic services such as water and electricity, travel time to home districts and funding for personal housing. To inform the revision of the programme under PRSC-3, a system of monitoring and evaluation will be put in place to assess the effectiveness of this measure. Ensure Sustainable Health Care Financing that Protects the Poor To achieve the goal of ensuring sustainable health care financing that protects the poor, the following measures, which were adopted in 2002, continued to be emphasized in 2003: (i) replacement of the cash and carry system with health insurance scheme (ii) increase coverage of exemptions to include maternity delivery (iii) application of health expenditure allocation formula that favours most disadvantaged regions (iv) increase health expenditure as total of government expenditure. Table 5.14: Summary of Status of indicators for Ensuring Sustainable Health Care Financing that protects the poor
Indicator Target 2005
2002 Indicator Status 2003 Progress
National Health Insurance established and operational
- - Parliament passed the National Health Insurance Act 45 districts have been piloting the scheme
On track
Financial analysis of the national public health budget and national health insurance scheme completed by the end of PRSC-2
- - Completed by Ministry of Health in collaboration with ILO
Achieved
Money disbursed for exemption fee increased and exemptions for maternal delivery introduced in all regions by the end of PRSC2
-
¢12.8 Billion
Increased to ¢24 billion. ¢17.2 billion was provided as additional fund by the Government to cover exemptions for maternity delivery in the deprived northern and central regions
On track
New recurrent expenditure formula in place by the end of PRSC2
-
-
Completed and adopted in the 2004 budget
Achieved
Health expenditure increased from 5.7 in 2000 to 7% of total government expenditure in 2003
7
10.5
11.8
Exceeded
Source: 2003 Ministry of Health Performance Report

92
National health insurance In line with Government policy of replacing the ‘cash and carry’ system with an Insurance Scheme, Parliament passed the National Health Insurance Act during the year under review. With regard to implementation of the scheme, 45 districts have been piloting the scheme. Out of the 45 districts • 10 are managing benefits and claims • 15 are at the stage of registration of members and collection of contributions • 7 are coding streets and houses • 8 are sensitising their communities • 5 have started their stakeholder consultations.
In addition an amount totalling 41.6 billion cedis of HIPC funds was released to 108 districts, including 12 sub-metros in Kumasi, Accra and Sekondi-Takoradi to facilitate the implementation of 120 District Mutual Health Insurance Schemes. Other notable measure taken in 2003 to enhance the implementation of the Health Insurance Scheme include the preparation of instruments for the accreditation of health institutions and stakeholder consultations on minimum benefit package for the scheme. Financial analysis of the national pubic health budget and the National Health Insurance Scheme The Ministry of Health in collaboration with ILO have completed financial analysis of the public health budget and the national insurance scheme. The key conclusions of the analysis include: • Possibility of public health expenditure growing rapidly over the next ten years. The expected increase in
utilization of insured persons will lead to increase in overall expenditure that will outpace growth of resources and consequently create a financial gap.
• To ensure financial equilibrium, government’s financial commitment to the health sector should not be reduced. New sources of revenues should be considered as additional resources.
• In the longer term, the government may either have to bear a higher share of the public health expenditure or would have to introduce higher contributions to the district health insurance scheme.
Exemption fees Recurrent budget spent on exemption increased from 12.8 billion cedis in 2002 to 24 billion cedis in 2003. An additional amount of 17.2 billion cedis was provided by the Government to cover exemptions in the deprived Northern regions and the Central region. Progress has been made with this measure in terms of (i) releasing resources to the districts (ii) setting up regional systems that spell out packages, amount to be granted for exemption and the procedure for reimbursement. New recurrent expenditure allocation formulae A new recurrent expenditure allocation formula to provide additional funding for health programmes in deprived areas has been adopted and applied in the 2004 budget. Expenditure allocation in the new formula is based on population adjusted for health needs (as measured by the levels of U5MR and IMR) and level of deprivation (as defined by population below the poverty line). Health expenditure as percent of total government expenditure in 2003 In line with the Government’s objective of improving the level and distribution of health resources, the proportion of non-wage recurrent expenditure on health increased from 10.5% in 2002 to 11.8% in 2003. Thus the target of 7% set for the HIPC in 2003 was exceeded by 4.8%. 5.4 IMPROVE ACCESS TO SAFE WATER AND SANITATION IN RURAL AREAS
One strategy for sustaining poverty reduction under the GPRS is improvement in rural population access to safe water and sanitation through the provision of water and sanitation facilities at the district and community levels, with emphasis in Guinea worm endemic areas. This section reports on the progress made in the water and sanitation sector.

93
Table 5.15: Summary of Indicators on Access to Safe Water in Rural Areas
Indicator Target 2005
1998 Indicator Status 2003
Progress
Percentage of rural population with access to safe water sources
46%
40% (2000)
46.4%
On track Exceeded HIPC trigger
Percent of rural population with access to adequate sanitation
--- 45.8% 55.0% Slow progress
Incidence of guinea worm reported reduced
0 5,545 2002
8,000 (44.3% increase since 2002)
Not on track
Source: 2003 Annual Report, Ministry of Health 2003 Performance Report, GSS- 1997 / 2003 CWIQ reports
Rural population with access to safe water
Government’s effort to accelerate the provision of safe water in rural communities has been very successful. Rural population with access to safe water increased from 40% in 2000 to 46.4% in 2003, exceeding the HIPC completion point target of 46% (Table 5.15). In spite of the dramatic increase in access to drinking water in rural communities, guinea worm infections are on the rise. This suggests the need to look carefully at the quality dimension of the water that is made accessible to the rural folks especially looking at the type of delivery systems.
This positive trend in access to safe water is the outcome of substantial improvement in the construction of water infrastructure in rural communities, especially new boreholes (Table 5.14)).
0102030405060708090
Perc
enta
ges
Wes
tern
Cen
tral
Gt A
ccra
Volta
East
ern
Asha
nti
Bron
g Ah
afo
Nor
ther
n
Upp
er E
ast
Upp
er w
est
Nat
iona
l
Figure 5.3: Access to safe water (2003)
2003
Source: GSS-2003 CWIQ report Table 5.16: Achievements in water facility delivery, 2002 and 2003
Facility 2002 Achievements 2003 Achievements New boreholes constructed 622 1290 Boreholes rehabilitated 407 115 New hand-dug wells 65 61 Hand-dug wells rehabilitated 2 6 Small community pipe systems completed 4 19 Small town pipe systems completed 25 46
Source: 2003 Annual Report, Community Water and Sanitation

94
Incidence of guinea worm Data from the Ministry of Health indicates a disturbing trend in this indicator. Table 5.17 reveals that the reported number of Guinea worm infections increased by 44.3% between 2002 and 2003. The most affected endemic areas in the country are in the Volta, Northern and Brong Ahafo regions. In an effort to arrest the increasing cases of Guinea worm, an amount of 29.2 billion cedis was released by the government in 2003 for the construction of 245 boreholes in guinea worm endemic areas.
Table 5.17: Trends in the reported cases of Guinea Worm
Year Reported cases Percent Increase
2001 4,738 ---- 2002 5,545 17.0 2003 8,000 44.3 Source: MOH, 2003 Performance reports.
Rural population with access to adequate sanitation Table presents data on access to safe sanitation. The data indicates that access remains very low with a national average of just over 55 percent. Access in the three northern deprived regions is around 20 percent or lower.
0102030405060708090
Perc
enta
ges
Wes
tern
Cen
tral
Gt A
ccra
Vol
ta
Eas
tern
Ash
anti
Bro
ng A
hafo
Nor
ther
n
Upp
er E
ast
Upp
er w
est
Nat
iona
l
Figure 5.4: Access to adequate sanitation by region (2003)
2003
Source: GSS-2003 CWIQ report 5.5 RECOMMENDED POLICY INITIATIVES
It is essential to review health sector priorities to take into account the recent increases in infant and childhood mortality rates in the country. Due to the observed positive correlation between child malnutrition and under-five mortality, child nutritional programmes may need to be strengthened and expanded.
To have the greatest impact on health outcomes, there is the need for a system to identify and concentrate the location of health facilities in the most vulnerable districts.
To ensure significant improvement in the health status of the most poor and vulnerable, access to exemptions could be enhanced through better targeting of the poor. There is currently no system to identify the most poor and it is important that the situation is addressed quickly.

95
There is the need to accelerate the full implementation of the National Health Insurance Scheme to ensure that poor people have access to quality health services. Introduction of a targeting system would be important to ensure that the most poor and vulnerable benefit from planned subsidies to cover the cost of premiums. Access to drinking water has improved considerable. However, incidence of guinea worm infections, a water-borne disease is on the rise. This suggests the need to take a critical look at the safety concerns of the water that is being made accessible to the rural population. Government will investigate this oxymoron further and immediate action taken to ensure not only access to water but also access to quality water. Access to adequate sanitation remains very low in the country. Sanitation issues need particular attention in the next phase of the GPRS implementation.

96
6 GOVERNANCE 6.1 INTRODUCTION
The practice of governance requires leadership and citizens at every level and in every aspect of state life to act in accordance with the universal principles of accountability, transparency, participation and equity in resource distribution within the confines of the law. For good governance to occur governance institutions at both national and sub-national levels should develop the ethos and the appropriate levels of capacity needed to properly manage public policy. As a complement, adequate institutionalised opportunities are needed especially at the local or community level for citizen participation in the decision-making processes. It is also essential for there to be law and order as well as a secure environment for the conduct of business and for normal everyday activities. In the same way as over concentration of decision-making authority undermines the drive to reduce poverty and the effort to promote sustainable development at the local and community levels, operational and allocative inefficiency in resource use at the decentralized level also inhibit progress towards good governance. These factors were essential considerations in the development of policies in the governance programme of the GPRS, and for the Poverty Reduction Support Credit (PRSC). This section reviews the implementation of the governance activities and the outcomes in relation to the goal of poverty reduction. The Policy areas, indicators and the activities of the two programmes are included in Table 6.1 below. 6.2 POLICY PRIORITIES, MEASURES AND ACTIVITIES
The priorities for the implementation of good governance under the GPRS include two policy areas: a) Security and Rule of Law and b) Decentralisation. Those for the PRSC 2 focus on a) Decentralised Government and b) Public Sector reforms. Each of these has defined measures and the set of activities required to achieve the policy objectives. These have been consolidated in Table 6.1 below.

97
Tab
le 6
.1: S
umm
ary
of S
tatu
s of P
rior
ity In
dica
tors
Gov
erna
nce
Prog
ram
A
rea
O
bjec
tives
T
arge
t In
dica
tor
Leve
l 20
02
Indi
cato
r Le
vel
2003
Prog
ress
tow
ards
Tar
get
MTP
Lo
cal s
afet
y an
d se
curit
y in
pla
ce
1:
925
by
2004
1:
1142
1:
1121
G
radu
ally
mov
ing
tow
ards
ta
rget
Equi
p an
d tra
in th
e po
lice
10
0 ve
hicl
es in
20
00
470
vehi
cles
pro
cure
d, 8
54 re
crui
ted
&
train
ed
On
track
St
reng
then
the
capa
city
of t
he A
ttorn
ey -G
ener
als'
offic
e
Tr
aini
ng a
nd o
ffic
e eq
uipm
ent p
rovi
ded
for A
Gs o
ffic
e Su
ppor
t pro
vide
d
St
reng
then
cam
paig
n ag
ains
t cor
rupt
ion
Coa
litio
n A
gain
st C
orru
ptio
n re
crui
ted
Exec
utiv
e Se
cret
ary
and
othe
r sta
ff a
nd
proc
ured
off
ice
equi
pmen
t
Supp
ort p
rovi
ded
Pr
ovid
e su
ppor
t ser
vice
s to
Parli
amen
t
Tr
aini
ng, I
CT
equi
pmen
t and
equ
ipm
ent
for r
adio
stat
ion
prov
ided
Su
ppor
t pro
vide
d
D
AC
F in
crea
sed
to 7
.5%
of T
ax re
venu
e 7.
5%
5%
7.5%
Pa
rliam
enta
ry h
as
reco
mm
ende
d an
incr
ease
an
d Pa
rliam
ent h
as e
ndor
sed
it. B
ut w
ill n
ot ta
ke e
ffec
t un
til n
ext y
ear
Lo
cal G
over
nmen
t Ser
vice
Bill
pas
sed
B
ill b
efor
e pa
rliam
ent
Bill
pas
sed
on 1
8th Ju
ly 2
003
and
gaze
tted
on 3
1/12
/03
Don
e
In
stitu
tiona
l pro
cess
es b
etw
een
DA
s and
CSO
s st
reng
then
ed
Inst
itutio
nal p
roce
sses
bei
ng st
reng
then
ed
Slow
PRSC
2
Loca
l Gov
ernm
ent B
ill P
asse
d
Bill
bef
ore
parli
amen
t B
ill p
asse
d D
one
D
ecen
tralis
atio
n A
ctio
n Pl
an a
ppro
ved
Impl
emen
tatio
n A
ctio
n Pl
an u
nder
co
nsid
erat
ion
(ND
AP)
O
n go
ing
Su
bmit
to P
arlia
men
t Ann
ual G
PRS
Prog
ress
Rep
ort
20
02 A
PR
subm
itted
20
03 A
PR u
nder
pre
para
tion
On
track
C
arry
out
3 P
SIA
s
4
PSIA
s com
plet
ed
Targ
et e
xcee
ded
C
ompl
ete
(SEA
) and
iden
tify
next
step
s
SE
A C
ompl
eted
D
one
Fi
nalis
e ce
nsus
, upd
ate
payr
olls
. Esta
blis
h re
liabl
e da
ta
base
of p
ublic
sect
or e
mpl
oym
ent
Cen
sus f
inal
ised
do
ne
MD
BS
Dec
entra
lisat
ion
Secr
etar
iat F
unct
ioni
ng
Secr
etar
iat i
n pl
ace
On-
track
Pres
iden
tial A
dvis
ory
Com
mitt
ee in
augu
rate
d an
d fu
nctio
ning
Pr
esid
entia
l Adv
isor
y Ct
tee
esta
blis
hed
to
advi
se o
n N
atio
nal D
ecen
tralis
atio
n
On-
track
Pi
lot D
istri
ct C
ompo
site
Bud
get i
n 3
dist
ricts
Yet
to b
e im
plem
ente
d C
ompo
site
bud
get i
nitia
ted
in D
angm
e Ea
st, D
angm
e W
est a
nd A
kuap
em N
orth
D
istri
ct. S
trate
gic
Plan
dev
elop
ed
On-
goin
g

98
Prog
ram
A
rea
O
bjec
tives
T
arge
t In
dica
tor
Leve
l 20
02
Indi
cato
r Le
vel
2003
Prog
ress
tow
ards
Tar
get
B
egin
impl
emen
tatio
n of
new
Pro
cure
men
t Bill
en
acte
d by
Par
liam
ent b
y es
tabl
ishi
ng a
nd m
akin
g op
erat
iona
l Pub
lic P
rocu
rem
ent i
nstit
utio
ns
B
ill b
efor
e pa
rliam
ent
Bill
pas
sed
Don
e
Es
tabl
ishm
ent o
f Pub
lic P
rocu
rem
ent B
oard
and
Se
cret
aria
t
Th
e B
oard
is to
be
in p
lace
by
Mar
ch
2004
. A
war
enes
s cre
atio
n on
the
Act
is c
urre
ntly
on
-goi
ng
On
track
Fi
nal d
raft
of F
reed
om o
f Inf
orm
atio
n B
ill p
rese
nted
to
Cab
inet
R
evis
ion
of d
raft
in p
rogr
ess
O
n go
ing
Fi
nal d
raft
of W
hist
le B
low
er B
ill p
rese
nted
to C
abin
et
Rev
isio
n of
dra
ft in
pro
gres
s O
n go
ing
D
isse
min
atio
n of
Ann
ual P
rogr
ess R
epor
t 200
2
APR
200
2 di
ssem
inat
ed
APR
200
3 un
der p
repa
ratio
n O
n tra
ck
D
iagn
ostic
stud
y on
inst
itutio
nal m
anda
tes
of a
nti-
corr
uptio
n ag
enci
es c
omm
issi
oned
D
raft
Term
s of R
efer
ence
pre
pare
d fo
r fo
cus g
roup
dis
cuss
ion
and
revi
ew
On-
goin
g
HIP
C
New
pro
cure
men
t cod
e es
tabl
ishe
d
B
ill b
efor
e pa
rliam
ent
Proc
urem
ent B
ill P
asse
d an
d ga
zette
d O
n tra
ck
Fu
ll In
tern
al S
taff
ing
posi
tion
Full
com
plim
ent o
f sta
ffin
g in
pla
ce b
y M
arch
31
2004
O
n-tra
ck
El
ectro
nic
expe
nditu
re re
porti
ng s
yste
m in
stal
led
in
MoF
, CA
GD
, and
at l
east
two
key
sect
or m
inis
tries
In
stal
led
in M
oF a
nd C
AG
D
On
track
M
inis
try o
f Loc
al G
over
nmen
t Ser
vice
Bill
subm
itted
to
Par
liam
ent
Bill
subm
itted
and
pas
sed
in J
uly
2003
, ga
zette
d 31
/12/
03 a
nd re
ceiv
ed
pres
iden
tial a
ccen
t.
On
track
N
umbe
r of d
istri
cts s
ubm
ittin
g co
mpo
site
bud
gets
Yet
to b
e im
plem
ente
d A
ctio
n w
as in
itiat
ed 3
pilo
t dis
trict
- D
angm
e Ea
st a
nd W
est a
nd A
kuap
em
Nor
th
On
track

99
6.3 PROGRESS ON POLICY IMPLEMENTATION ON SECURITY AND RULE OF LAW
Outcomes of Interventions The governance outcomes monitored indicate that there has been a general improvement in security and the rule of law during 2003. As a result of the changes that have taken place in the police service, to wit, recruitment of new personnel, increase in logistics, creation of neighbourhood watch committees and increased patrol, the police have reported a reduction in the crime rate across the country. The data in Figures 6.1a and 6.1b2 show drops in cases of robberies, stealing, rape and assault during the year. Marginal increases were recorded for fraud (Figure 6.1a) and murder (Figure 6.1b). It is only in cases of defilement that a sharp increase was recorded. Here, the higher numbers seem to point to increased reporting rather that an increase in the commission of the offence, which is suggestive of the growing confidence, the population is developing in the police.
-10,00020,00030,00040,00050,00060,00070,00080,00090,000
100,000
FRAUD STEALING ASSAULT
Figure 6.1a: CRIME STATISTICS
2001 2002 2003
0
500
1000
1500
2000
2500
MURDER ROBBERY RAPE DEFILEMENT
Figure 1b: CRIME STATISTICS
2001 2002 2003
Source: Ministry of Interior Records 2003 The activities of civil society organisations have heightened awareness about issues of corruption and have created a vigilante disposition in the public services. With the passage of the Central Internal Audit Bill,
2 Two charts were constructed because the data range was too wide for effect on one chart.

100
the regulatory and legal environment for public financial management (PFM) has been greatly enhanced. This has cleared the way for efficiency, accountability and transparency in PFM. It is further noted that people are resorting to Alternative Dispute Resolution approaches to resolving conflicts. This will reduce the pressure of the justice administration system and introduce speed and more efficiency in the dispensation of justice in the country. Free legal aid for the poor is also positive effort at extending the rule of law across all manner of persons. What follows are the specific interventions of the policy objective of Security and the Rule of Law undertaken to achieve the outcomes discussed above. 6.4 NATURE OF INTERVENTIONS
6.4.1 Support to the Police Service To enable the institutions charged with the responsibility of ensuring security and maintenance of law and order discharge their functions efficiently, the MTP targeted improving their service delivery capacity3. The effort to extend the coverage of policing across the country included the provision of 470 new vehicles and communication equipment. In this respect, more vehicles were procured in the year. This has greatly expanded the fleet of patrol vehicles from a low figure of 100 in 2000 to close to 700 by the end of 2003. With a donor support of $1.0m the police have increased patrols in both urban and rural areas. This has improved police presence and increased the response rate to distress calls. To complement the work of the police service and to involve citizens in the maintenance of law and order the Police have encouraged and supported the formation of Neighbourhood Watch Committees nationwide. Its support is mainly in retraining members of the Committees in effective patrols, crime combat and crime reporting. There is also progress towards addressing the problem of inadequate communication equipment. It is noteworthy to report that the police service has now opened a website4 to foster better interaction with the public and to raise the profile of the force in general. The public now has an additional opportunity to both acquire and express opinions on police work. The Women and Juvenile (WAJU)5 Unit extended its presence beyond the regional capitals. It opened new offices in Tema (regional), a District office in Swedru and has established WAJU desks in Dansoman and Odorkor. The expansion of the Unit is bringing help closer to more women and children who suffer all forms of abuse at the sub-regional levels. The National Governance Program (NGP)6 has supported training for a number of governance institutions, including the Police Force. A number of Registrars and bailiffs of the Commission on Human Rights and Administrative Justice were trained in change management who in turn offered training to 152 police station officers on how to uphold the rights of citizens. The Ghana Police Service as at December 2003 had staff strength of 15240. By the end of the year the Service recruited 854 new personnel and also put 1,254 potential recruits on stand by for training. The police citizen ratio as at December 2003 was 1:1121. The Service is gradually moving toward achieving its target of police /citizen ratio of 1:925 by 2004. If this progress remains unhindered, the police will achieve the international standard of 1:500 in a few years time. 3 The support to other institutions that support the maintenance of law and order are detailed out in Appendix 1. These include the Narcotics Control Board, the National Disaster Management Organisation, the Prison Service, the Ghana National Fire Service and the Ghana Immigration Service 4 Web address www.Ghanapolice.org 5 WAJU was established in 1998 to offer protection and support for women and children 6 NGP aims at building the capacity of key governance institutions (including Judicial Service, CHRAJ, NCCE, NMC and EC) through training, acquisition and deployment of equipment (including ICT) and outreach activities.

101
6.4.2 Strengthening the Attorney General’s Office To achieve the objective of deepening the rule of law, the Ministry of Justice undertook a number of important activities including
a) the computerisation and the networking of the Registrar-General’s Department b) the organisation of Legal Aid Clinics by the Legal Aid Board in all regions to give advice to the
poor c) the handling of 4500 cases in court for the poor and d) Laying of the foundation by the Board for the publication and distribution of brochures on legal aid
in seven Ghanaian languages. Also, Judges, Magistrates, Registrars, senior staff, regional accountants and administrative staff of the Judicial Service received training in different subjects including, Performance management, Alternative Dispute Resolution, Court automation, Case Management and change management. 6.4.3 The Campaign Against Corruption Two major anti-corruption institution-building activities occurred in 2003. In order to gain firm ground for the discharge of its anti-corruption responsibilities, the Ghana Anti-Corruption Coalition undertook a major restructuring exercise. It acquired a permanent office, installed ICT equipment and strengthened its staff situation by recruiting an Executive Secretary and the full staff complement. It also undertook a follow-up survey to its initial Anti-Corruption study7 and published and disseminated the proceedings of its 5th Governance Workshop. The GACC has initiated a programme of establishing Anti-corruption Youth Clubs in schools as a means of expanding the constituency of citizens imbued with principles and values that reduce the inclination towards corruption. The second major effort to reduce the tendency towards corrupt practices by public officials is the establishment of an Accountability Office in the office of the President. Its remit is to provide advice on ethical compliance issues to political executive appointees.
The press has been active in the campaign to reduce corruption across the system. Interactive radio and television have opened up space for citizen participation in Anti-Corruption debates.
The Central Internal Audit bill, which seeks to rationalise the conduct of audits within the public service, was passed into law during the year. Its implementation began with the setting up of the appropriate institutional structures, recruitment of critical staff and the conduct of audits on the HIPC funds, GPRS and the Ghana AIDS Response Fund. The Audit Service established new District offices which raised the total to 67 offices, audited 21 Ghana Missions and carried out special audit exercises in some selected Districts including West Mamprusi District which averted the loss of huge sums of public funds. 6.4.4 Support to Parliament Under the National Governance Programme, 35 members of parliament were given training in computing and in change management. Library officers of the office of parliament also received upgrading training. The programme supported the office of Parliament with ICT equipment and user licences, library software and technology for the proposed parliamentary radio station. In furtherance of its objective of bringing the business of the legislature to the doorstep of the ordinary Ghanaian, the Ministry of Parliamentary Affairs disseminated government policies and programmes to the unit committee levels of the decentralised administrative system. This is an empowerment process for
7 The report on the follow up survey is not ready yet.

102
citizens far removed from the activities of government business. Information on government policies offers an opportunity for citizens to understand the decision-making process and therefore demand accountability from public office holders. They are also better placed to make informed choices. 6.5 RECOMMENDED POLIC INITIATIVES
To promote a faster pace towards good governance, greater dissemination of information about policies, programmes and services will be mounted to inform the public about their rights, their obligations and the nature of services available.
Similarly, public forums to discuss issues of governance in relation to justice, accountability and security will be intensified. In this sense, public forums such as the Peoples’ Assembly, which involves the President interacting with ordinary citizens and which are replicated at the regional and in some instances, the district level, will be made a regular feature of the governance programme. Also, good governance enhancers such as the ‘Meet the Press’ series, which afford the media the opportunity to listen to and discuss issues with incumbent ministers, will continue. Indeed, more use will be made of the mass media as well as already existing civil society groups in rural and urban areas, including professional associations to discuss such matters.
It is noted that enhancement of governance should go beyond law and order. Other governance institutions are playing significant roles in expanding public space for dialogue, promoting administrative justice, upholding human rights and facilitating smooth transitions in the political order. As a policy goal, the governance indicators will be revised in future to present a more comprehensive representation of all the other players.
6.6 DECENTRALISATION
Outcomes of Interventions The second governance policy objective of decentralisation is meant to bring the act of governing within the reach of citizens who are far removed from the centres of power. The decentralisation process involves a mix of political devolution enshrined in the constitution as well as administrative and technical de-concentration of key service delivery institutions partly underwritten by legal provisions and partly reflecting conventional practices. While the institutional and legal frameworks for decentralisation have made great progress since 1992 when the District Assemblies were established and when the District Assembly Common Fund became operational, no clear trend has been observed to deepen and institutionalise decentralisation efforts of Government. Projects have been largely un-coordinated and approaches to implementation have been divergent. Direct citizen participation in the process of decision-making has been acclaimed to promote and sustain faster local development. To make this work at the level of the district governance institutions, efforts were made in the year to improve the capacity and to introduce mechanisms and structures that would allow citizen involvement. The Ministry of Local Government and Rural Development formulated a National Decentralisation Action Programme (NDAP) which has been approved by Cabinet in September 20038 to promote the convergence of the decentralisation efforts, consolidate processes of resource allocation and management, build capacities for poverty-targeted development and governance at the local level and promote partnership and participation between local government, civil society, the private sector and traditional authorities.
8 See National Decentralisation Action Plan: Towards a Sector-Wide Approach for Decentralization Implementation in Ghana (2003-2005).

103
Strategies for implementing the policy focus on a) political decentralisation, b) Administrative decentralization, c) Fiscal decentralisation, d) Decentralised development planning of public-private partnership in investments. These strategies have been partially implemented with significant progress made in selected areas. In the area of political decentralisation, substantial authority has been successfully decentralised to the district level. However, administrative functions have not yet been fully devolved and MDAs still control their own programmes and activities at the district level through their field officers. Reporting is still vertical between field officers and national level officers. There has been considerable delay in the implementation of the composite budgeting system and this has encouraged uncoordinated sectoral budgeting. The capacity building efforts within the district assemblies are helping to improve service delivery and to increase the efficiency in resource use. District Assemblies are becoming more proactive and more responsive to the needs of their local communities. Citizens are developing the confidence to engage in issues of development value to their local communities and to the nation at large. The processes and interventions that triggered these positive outcomes are detailed out in what follows. The democratisation process is deepening at the local community level. District Assemblies are holding regular meetings and are ensuring that the committees are functioning. This inclusive governance approach has an advantage of promoting efficiency in resource and providing a strong ground for composite budgeting. The passage of the Local Government Service Bill has raised morale of staff in the local government system. Expectations of improved service conditions have the advantage of retaining staff. 6.7 NATURE OF INTERVENTIONS
6.7.1 Strengthening the Administrative capacity of District Assemblies The Local Government Service Bill was passed into an Act and was assented to by the President. The Ministry of Local Government and Rural Development prepared the National Decentralization Action Plan (NDAP) and initiated consultations with stakeholders on it. A presidential Advisory Committee was consequently set up to provide the necessary policy guidance. Cabinet endorsed the NDAP for implementation. Some activities have started with respect to the three of the five strategic areas of the NDAP mentioned above:
• Political decentralisation- to promote efficiency in administering the districts Legislative processes were initiated in 2003 by the Electoral Commission for the creation of 25 new districts and 30 constituencies for administrative and electoral functions respectively. The number of districts now stands at 135
• Administrative decentralisation-the process to divest MDAs of implementation responsibilities and
transfer these to the 22 functional areas of district assemblies was greatly enhanced with the direct transfer of HIPC funds from the Controller and Accountant General to the MMDAs. The districts assume direct responsibility for fund allocation to reflect the district priorities.
• Fiscal decentralisation- an important activity aimed at improving efficiency of the DAs is the
preparation of district composite budgets. During the course of the year the Ministry of Local

104
Government initiated action in 3 pilot districts, Dangme East, Dangme West and Akuapem North, to prepare composite budgets.
6.7.2 Deepening District Assembly association with civil society. District Assembly Civil Society relations improved slightly during the year. In the fight against HIV/AIDS, district assemblies have collaborated extensively with CSOs. They have carried out joint campaigns and undertaken joint monitoring of resource use. Other areas of cooperation include education on bush fire prevention and control. In some sectors such as in community water and sanitation programme DAs and CSOs are assigned direct roles in the implementation and management of projects at the district and sub-district levels. Other civil society organisations, especially international non-governmental organisations and local faith based organisations are making substantial contributions to district development by supporting the preparation and implementation of district development plans. For instance under JICAs Integrated Human Development Plan the six districts in the Upper East were supported with funding and technical expertise to prepare their development plans. A new area of cooperation that has developed between civil society and district assemblies is that of budget advocacy. Civil society organisations such as the Centre for Budget Advocacy (ISODEC) have worked very closely with many district assemblies to bring citizen voice into the budget formulation process both at the district and national levels. At the budget forums organised by ISODEC in the districts, the panel of resource persons always include Budget Officers from District Assemblies. They share knowledge and experience of the district budget formulation and implementation process with the audience, which is usually made up of a cross section of state and non-state actors. The National Governance Project has supported the training of 120 Assembly members and traditional rulers in peace resolution. 6.8 RECOMMENDED POLICY INITIATIVES
There is need to conduct research to establish the system-wide impact of policy measures on improved services by the district assemblies. Many communities are becoming more empowered to demand accountability from public office holders at the District assembly level. These are all positive spin-offs from the support to district assemblies, which will be sustained to deepen citizen participation in decision-making and ensure equity in resource allocation. 6.9 PUBLIC SECTOR REFORMS
Outcomes of Interventions With respect to the objectives of improving the performance of the public sector and securing efficiency in public expenditure management, the evidence shows that considerable progress has been made. The leadership of the Civil Service made up essentially of Chief Directors is currently being developed to become more forward-looking and performance oriented. The Chief Directors have been made to enter into performance contracts with the Public Services Commission for purposes of improving service delivery and performance orientation based on clearly defined output targets and for enhancing skills and capacity. A system of regular monthly meetings of chief directors has been institutionalised. This offers a

105
good opportunity for cross-fertilisation of ideas and for the provision of collegial support in policy interpretation. The forum is also effectively being used to improve service delivery and to improve inter-sectoral policy formulation and implementation. As a result of finalising the census of staff in the public service, approximately 400 fake names have been expunged from the pay roll on non-subvented organisations. Nature of Interventions The process of improving the performance of the public sector begun with the commissioning in March 2003 of an independent evaluation of all previous reform efforts. The consulting firm Price Waterhouse Coopers proposed among others, the setting up of an Advisory Group (AG) to guide the direction of a new reform agenda. The AG under the chairmanship of the Senior Minister, focused on priority areas that possessed intrinsic characteristics of hastening the new reform. Reorganisation of the Structure of the Civil Service was one of its first points of entry. In this direction, it focused on improving the capacity of the leadership of the Civil Service. Old Chief Directors were reassigned new portfolios and new ones were hired. Training was procured for them and new service conditions, intended as incentives, were introduced for them. For the subvented organisations, the new approach involved putting services on the market for value where the services are of commercial value. These agencies have been given performance contracts, which will allow government to determine whether the subvention should be partial or full. The purpose is to cut the commercially viable agencies off government subvention and thus ease the pressure on the public budget. A Subvented Agencies Reform Bill has been drafted and will be submitted to Parliament in the current year. Under the National Governance Programme, the process of critically reviewing the mandates, responsibilities and operational objectives of the ministries, departments and agencies in order to remove duplications, develop new missions and realign their functions with the decentralisation policy was enhanced. The Census of public sector staff was completed during the year and ‘ghost’ names were removed from the payroll. An electronic Tracking system has been established in the Ministry of Finance and Economic Planning and the Controller and Accountant General’s Department. 6.9.1 Recommended policy initiatives The main thrust of public sector reform will be the adjustment of central government structures and organisation to make the central machinery of government more efficient, effective, and private sector-friendly. The capacity of government will be strengthened to facilitate and set the development agenda to pave the way for private sector and other social partners to fully contribute to the national development effort. 6.10 MONITORING THE GPRS
Outcomes of Interventions The National Development Planning Commission has improved its monitoring and evaluation responsibilities. The dissemination of the 2002 APR improved public understanding of the GPRS and helped to secure public interest in monitoring the implementation of the strategy. Nature of Interventions

106
The NDPC submitted the 2002 Annual GPRS Progress Report to parliament and disseminated it widely to other stakeholders. The dissemination of the 2002 APR improved public understanding of the GPRS and helped to secure public interest in monitoring the implementation of the strategy. It commissioned five Poverty and Social Impact Assessments (PSIAs), which are nearing completion, and it, subjected the GPRS to a Strategic Environment Assessment (SEA) of which the report is ready. 6.11 POLICY RECOMMENDATION
Even though there is a multiplicity of indicators in the GPRS for measuring the extent to which good governance is evolving, the biggest challenge remains what form of indicator is best for measuring the intangibles like improvements in the practice of democracy. There will be stakeholder consultation towards ascertaining and harmonising existing indicators with those of the APRM of the NEPAD and the MDGs all of which by virtue of state ratification of protocols have assumed a de jure presence and must be reported on. 7 THE VULNERABLE AND THE EXCLUDED 7.1 INTRODUCTION
Vulnerability typically deals with the inability of the poor to withstand shocks or manage risks that are present in the physical, economic, social and environmental contexts in which they conduct their lives. Its twin concept of exclusion relates to the levels of marginalisation, voicelessness, powerlessness and the injustice suffered by the poor. Lack of assets with which to cope with the risks creates a sense of insecurity for the vulnerable and excluded groups. Creating opportunities for the vulnerable and excluded to either prevent the materialization of the risks or for coping with the shocks is a critical policy objective. The GPRS identifies the most vulnerable and excluded as women, children, people living with HIV/AIDS (PLWHA), persons with disability (PWDs), the chronically poor and children orphaned by AIDS and have therefore formulated policies and programme to reduce vulnerability and exclusion. (See Table 7.1). These policies and programmes focus mainly on a) the attainment of social justice, b) prevention and the control of the spread of HIV/AIDS and c) the recognition of the rights of persons with disability. Programmes for the protection of women and children are spread across several MDAs, but a high concentration of these programmes can be found in the Department of Social Welfare (DSW), the ministry of Women and Children’s Affairs, Ministry of Health and Ministry of Education, Youth and Sports9.
9 For discussion of Ministry of Education and Health see section on Human Resources Development and Provision of Basic Services

10
7
Tab
le 7
.1: S
umm
ary
of S
tatu
s of P
rior
ity In
dica
tors
Vul
nera
ble
and
Exc
lude
d
Prog
ram
Are
a
Obj
ectiv
es
Indi
cato
r L
evel
20
02
Indi
cato
r
Lev
el 2
003
Prog
ress
tow
ards
Tar
get
MTP
Incr
ease
d re
sour
ces f
or th
e pr
otec
tion
of th
e rig
hts o
f wom
en a
nd c
hild
ren
MO
WC
A
rece
ived
¢¢
6.70
9bill
ion
in
2002
MO
WC
A re
ceiv
ed ¢
9.66
9bill
ion
in 2
003
On
track
U
tilisa
tion
of L
egal
Aid
Ser
vice
s 42
25
4500
U
tilis
atio
n by
poo
r in
crea
sing
but
not
ade
quat
e
NG
O fu
ndin
g fo
r Leg
al A
id
A
ll Le
gal A
id o
ffic
es in
the
coun
try a
re
bein
g co
mpu
teriz
ed a
nd n
et-w
orke
d w
ith
assi
stan
ce fr
om U
SAID
Po
pula
tion
with
info
rmat
ion,
cou
nsel
ling
prog
ram
mes
und
erta
ken
98
%
On
track
Pr
ovid
e su
ppor
t for
PLW
HIV
/AID
S
4 se
ntin
el si
tes p
rovi
ding
AR
T
Im
prov
e th
e qu
ality
of l
ife o
f the
phy
sica
lly
hand
icap
ped
D
isab
ility
Bill
dev
elop
ed a
nd b
eing
di
scus
sed
Pr
ovid
e ca
re a
nd su
ppor
t for
stre
et b
egga
rs
and
kaya
yei
Tr
aini
ng in
skill
s pr
ovid
ed
Trai
ning
in V
ocat
iona
l ski
lls h
as b
een
prov
ided
to st
reet
beg
gars
and
hea
d po
tters
MD
BS
Jo
int r
evie
w o
f GO
G re
spon
se to
pan
dem
ic
final
ised
and
key
reco
mm
enda
tions
ado
pted
w
ith th
e ai
m o
f ens
urin
g ef
fect
ive
impl
emen
tatio
n an
d ac
hiev
emen
t of 5
ex
pect
ed o
utco
mes
of t
he G
hana
HIV
/AID
S St
rate
gic
Wor
k 20
01-2
005
Jo
int R
evie
w sc
hedu
led
is b
etw
een
1st
Mar
ch 2
004
& 9
th A
pril
2004
. A b
udge
t of
$218
,00
had
been
set a
side
for i
t with
fu
ndin
g fo
rm d
onor
age
ncie
s lik
e D
FID
JI
CA
, The
Roy
al D
anis
h Em
bass
y,
UN
AID
S, U
SAID
, UN
FPA
H
IV A
IDS
Prev
alen
ce
3.8%
3.
6%
Exce
eded
targ
et
D
rug
Bas
ed tr
eatm
ent a
vaila
ble
for p
eopl
e w
ith A
IDS
4
Sent
inel
Site
s are
pro
vidi
ng A
RT
for
PLW
HA
and
19
sent
inel
site
are
im
plem
entin
g a
prog
ram
me
for t
he
prev
entio
n of
mot
her t
o ch
ild tr
ansm
issi
on

108
7.2 PROGRESS ON PRIORITIES OF SOCIAL JUSTICE, EQUITY, HIV/AIDS AND DISABILITY
Improved Welfare Services Progress has been made in the creation of opportunities for the assertion of rights10 of the vulnerable and the excluded especially those related to access to services and to a decent livelihood. The figures in Table 7.2 show that on average, the Department of Social Welfare has provided service to more vulnerable persons than it did in the preceding year. In the situations where there is a reduction in the number of persons receiving service from the Department, the explanation obtained suggest that there is a reduction in the total number of persons needing service as a result of previous interventions. In a few cases, the low service resulted from improved conduct of offender groups, recourse to alternative means of resolving problems or simply a matter of resource inadequacy. Table 7.2: Comparative Welfare Services Provided To The Vulnerable & Excluded by Year.
Service Outcomes (2002)
Outcomes (2003)
A. Child Welfare Services Juvenile cases investigated 513 217 Probation cases handled 630 662 Juveniles handled in industrial school 61 100 Remand Cases handled 291 315 Children adopted by relatives 242 251 Orphans adopted 53 53 Day Care Centres supervised 2395 1176 Day Care Centres registered 79 50 Paternity cases disposed of 733 480 Maintenance and custody cases disposed of 8493 1030 Families reconciled and strengthened 2649 743 Male un-adoptable children cared for 169 166 Female un-adoptable children cared for 108 92 Family tribunal cases handled 5956 1435 B. Vocational Training for the Youth Boys provided with vocational training 431 548 Girls provided with vocational training 434 549 Street Children rehabilitated 413 466 C. Integrating disadvantaged adults into mainstream society Prisoners provided with welfare services 2072 1185 Paupers assisted with payment of hospital bills and related expenses
Males 937 Females 842
Males 357 Females 157
Destitutes catered for Males 23 Females 3
Males 197 Females 189
Women’s groups assisted through Technology Capitalization 48 23 D. Integrating Persons With Disability (PWDs) into mainstream society PWDs provided with employable skills 593 653 Trained PWDs assisted to be self-employed 80 102 PWDs assisted in communities 104 69 PWDs provided with inclusive education 63 19 Unit Committees members sensitised 55 27
Source: Department of Social Welfare. As alluded to earlier public confidence in the security agencies is growing. Data in the Table 7.3 below shows a gradual increase in the number of cases of abuse reported to the Women and 10 Service provision is driven by a rights based perspective than by the traditional needs-based approach.

109
Juvenile Unit of the Police Service. A lot of advocacy work is largely responsible for the increased confidence in the security institutions. Table 7.3: Statistics of cases reported to Women and Juvenile Unit (WAJU) Ghana Police Service from January 1999 to July 2003
Year Type of Case 1999 2000 2001 2002 2003*
Rape 23 34 58 134 100 Defilement 154 181 204 533 509 Assault 95 86 232 1456 1559 Threatening 21 16 60 652 461 Causing harm 4 6 7 40 28 Causing damage 6 3 6 60 43 Indecent assault 11 17 28 69 49 Incest 5 6 5 16 8 Offensive conduct 4 1 2 175 165 Unnatural canal knowledge
3 2 0 0 5
Failing to supply necessities of health ad life
0 7 17 142 54
Abduction 3 5 9 80 79 Child trafficking 0 0 0 4 4 Child stealing 1 3 0 16 9 Stealing 20 7 12 130 106 Exposing child to harm 1 0 4 67 48 Abortion 1 1 0 5 4 Procuration 1 1 0 0 0 Fraud 6 5 3 1 0 Attempted defilement 0 0 1 1 0 Attempted rape 1 2 3 17 28 Attempted abortion 0 1 0 19 15 Non child maintenance 523 1383 1047 1899 3024
Source: Accra WAJU, Empowered women As many as 500,000 women improved their income earning opportunities through receiving a total of ¢10 billion from the Women’s Development Fund administered by the Ministry of Women and Children’s Affairs. The Ministry has also created 50,000 new jobs for women across the country. Improved Access to Services Examination of the data on access to essential services shows an increase in the number of people with access to water, health services and education. The figures below give a graphic picture of the increased access.

110
Access to Water
82.189 89.4
93.7
77.2 76.5
86.3
74.7
64.6
80.985.4
94 96.7 96.6 97.1
88.895.3
98.491.5
80.2
90 87.7
0
20
40
60
80
100
120
Nat
iona
l
Wes
tern
Cen
tral
Gre
ater
Acc
ra
Volta
East
ern
Asha
nti
Bron
g Ah
afo
Nor
ther
n
Upp
er E
ast
Upp
er W
est
RegionSource:Ghana Statistical Service, Core Welfare Indicator Questionnaire 1997 & 2003
Perc
enta
ge
19972003
Access to Health Services by Region
37.2
28
35.9
77.6
41.7
32.8
43.2
31.9
18.4
8.2
19.8
57.6
46.9
67.2
80.9
49.5
60.1
69
53.8
35
26.730.4
0
10
20
30
40
50
60
70
80
90
National Western Central GreaterAccra
Volta Eastern Ashanti BrongAhafo
Northern Upper East Upper West
Region
Source:Ghana Statistical Service, Core Welfare Indicator Questionnaire 1997 & 2003
Perc
enta
ge
1997 2003

111
The Situation of Children A recently published survey report (2003) on Child Labour in Ghana conducted by ILO/IPEC and the Ghana Statistical Service (GSS) shows that, about 39% of Ghanaian children between ages 5 years to 17 years are economically active. A total of 2,314 children were selected from known sleeping places of street children all over the country for the survey. A summary of the findings on Street Children in the Child Labour Report is given below. • About 10% of the working children interviewed were identified as street children (2,314) • 52% of street children were female; 48% were female • 50% of street children were between ages 15-17 years • 50% of street children were in the Greater Accra Region • 40% of street children were of Mole-Dagbon origin • 32% of street children were of Akan origin • 2% of street children were married • 11% of street children were in school • 70% of street children aged 15-17 years could not read or write • 98% of the street children had been working for the past 12 months • 80% of the street children knew about HIV/AIDS • 30% knew about protection through condoms 7.3 NATURE OF INTERVENTIONS
The Department of Social Welfare Its main programme areas for the year were
• Justice Administration • Child Rights Protection and Promotion • Community Care
To realise its objective of rendering child welfare services, providing skills training to disadvantaged youth and integrating the vulnerable, persons with disabilities and the disadvantaged into mainstream development, the DSW undertook a limited amount of field visits, advocacy and the administration of justice within its limited resources. Its ability to reach larger numbers can be enhanced with increased resources. Support to Women and Children In providing access to productive resources, the Ministry established the Women’s Development Fund with an initial sum of C21 billion out of which C10 billion was disbursed to 20,000 women farmers. Financial support was also provided for women engaged in commercial activities, agricultural production and processing and other related ventures. In pursuit of its role in protecting the rights of children and reducing vulnerability, the Ministry of Women Affairs under its ‘Operation Bring the Children Home’ programme successfully spearheaded the return of trafficked children from coastal communities around the Volta Lake to their homes. It also assisted mothers to withdraw their children and enrol them in schools and supported these women with over C825million as part of its micro-finance programme under the Social Investment Fund

112
Legal Aid Services to the Poor In 2003 the Board was assisted to procure computers for its offices and to have them networked. As mentioned earlier some staff of the Board received training in Alternative Dispute Resolution (ADR) under the National Governance Project which they in turn used in training some police officers at the stations. In 2002, the Legal Aid Board provided legal assistance to about 4225 persons. The number has increased to above 5000 in 2003. The bulk of these cases were handled in court and some are yet to be completed because of the nature of the court process. A lot of these cases were also concluded through the ADR process. Some of the interventions are indicated in Table 7.4 below Table 7.4: LEGAL AID TARGET INDICATORS Activity Status Legal Aid offices established in all 10 regions Completed District courts established country-wide Done Police provided with training in basic prosecution The Board provided some
training to the police. Alternative Dispute Resolution Promoted Litigants are beginning to
adopt ADR in conflict resolution
Small Claims Court established in all District Magistrate Courts
Not completed
Juvenile and Family Courts at the District Level reconstituted
Not done.
Source: Legal Aid Annual Report 2003 HIV/AIDS The policy objective here is the prevention of the spread of HIV/AIDS and the improvement of the quality of life of people living with HIV/AIDS and Orphans of AIDS victims. The specific interventions by the Ghana Aids Commission in 2003 were as follows: • Information, Education and Communication • Advocacy • Peer Education • Voluntary Counselling and Testing • Capacity Building for CSO • Care and support for PLWHAs • Training and technical support for beneficiary groups The Ministry of Health in collaboration with the Ghana AIDS Commission and other civil society organisations mounted programmes during the year to increase awareness of the risk of the epidemic in the general population. The results of the Ghana Demographic and Health Survey (2003) shows that general awareness of AIDS is nearly universal among men and women in the reproductive ages in Ghana and 96 per cent of women and 98 per cent of men are conscious of a range of methods of contraception to help avoid AIDS.

113
Condom use varied with the sexes. The survey found that younger women, never married women, urban women and women living in Greater Accra and the Volta Region are much more likely than other women to report the use of condom during sex with a non-cohabiting partner. The reported level of condom use during sexual encounters with non-cohabiting partners rises sharply with the educational level of women from 11 per cent of women with no education to 48 per cent of those with at least secondary education. A similar pattern was found among men. Given that condom use particularly in high-risk sexual relationships is one of the main means of slowing the spread of HIV/AIDS, the campaign for use of condoms will be maintained. Many more Voluntary Counseling and Testing (VCT) centers were opened in a number of hospitals and clinic to assist PLWHAs with advice and drug therapy. The Ministry of Health also implemented a programme for the prevention of mother to child transmission in 19 sites and provided Anti-Retro-viral Therapy (ART) to AIDS patients in Korle Bu Teaching Hospital, Komfo Anokye Teaching Hospital, Atua Government Hospital and St. Martin De Porres Hospital, Agomenya. World Bank data indicate that of the 62,000 people who need ART, less than 1 percent (550 persons) is receiving treatment. Sentinel site information point to a growth in the sero-prevalence rate of HIV/AIDS from 3.4 to 3.6 percent in 2003 despite effort to bring it down. This establishes a strong case for a more vigorous and widespread IEC programme for the high-risk groups (eg commercial sex workers) in the high prevalence areas. The disease is deepening the inability of the poor to lead a normal life and it's exacting a high toll on orphans and vulnerable children. It needs to be noted that targeting of OVCs is key as these programmes tend to be costly and are not sustainable on a larger scale Many endemic communities have introduced support schemes that depend on traditional institutional arrangements to help orphans and vulnerable children (OVCs). Members of extended families, Queen mothers’ Associations and traditional community groups are providing support to OVCs in the form of shelter, nutrition, health, education etc. This has reduced the need to send the victims into institution-based care eg Homes and Orphanages. 7.4 RECOMMENDED POLICY INITIATIVES
The logistics situation and service conditions of staff of the Legal Aid Board and the Department of Social Welfare will be reviewed. This will help them expand their services especially to the vulnerable and the excluded. Rights of the destitute and prisoners with no access to legal services will remain violated if the welfare and legal services do not reach them in adequate measure. An aspect of the provision of social assistance to vulnerable and excluded groups what seems to have been taken for granted is the mainstreaming of assistance to such groups. The fact that these are crosscutting issues calls for far greater collaboration between agencies in the social sector as well as economic sectors than is currently the case. The Poverty Monitoring Groups provide a unique opportunity for this cross-fertilisation to take place to promote poverty reduction and rights protection of the vulnerable and excluded. Children in ‘difficult circumstances’ are especially vulnerable but there are no indicators to enable effective tracking. Efforts will be made to conduct studies to provide baseline data on the extent of the problem to facilitate assessing changes in the future. The coordination between various interest groups working on the anti-HIV/AIDS campaign will be improved to ensure harmony of messages. GAC should assume a more central role in coordinating the national response to HIV/AIDS in partner coordination seek ways to pool resources.

114
Recent allegations and counter-allegations by the Ghana AIDS Commission and NGOs working on HIV/AIDS raise serious questions about the Anti-HIV/AIDS Campaign. The Commission will strive to find new ways of monitoring and evaluating the activities of its partners in the Campaign to avoid the dissipation of scarce resource through fraudulent deals. The overarching need to reduce the spread of the virus and to offer support to the infected as rapidly as possible and the objective of seeking cooperation with other social partners compelled the GAC to enter into partnership with groups of dubious credentials. A more vigorous proposal vetting and organisation screening arrangements may be considered in commissioning groups to participate in providing service to patients. Contracting will be made more rigorous and sanctions enforced in the event of misapplication of resources.

115
8 PERFORMANCE OF DISTRICT ASSEMBLIES 8.1 INTRODUCTION District Assemblies continued to implement poverty reducing programmes and projects in line with their district medium term development plans (DMTDP) and along the objectives of the GPRS and government’s own medium term priorities. This section explores the performance of District Assemblies based on financial returns lodged with the Ministry of Local Government and Rural Development and the DACF Administrator’s office. These financial reports do not clearly disaggregate figures to show amounts spent in the different priority areas of education, health, and water & sanitation etc. As a result, details of projects and programmes executed by districts with funds from all sources as was available in the last APR, are not immediately available for this report. However, some detailed report and analysis of projects and programmes funded from HIPC savings to districts for the period 2002 to 2003 is given. 8.2 FINANCIAL PERFORMANCE 8.2.1 Sources of Funds to Districts Data for the analysis of financial performance of districts has been obtained from reports submitted by districts to the Ministry of Local Government and Rural Development. Funds for the execution of district development plans came from the major established sources:
1. GoG support to districts for salaries and wages 2. The District Assemblies’ Common Fund, (DACF) 3. Central GoG funds for programmes in districts through MDAs 4. Districts own internally generated funds 5. Enhanced HIPC initiative relief funds 6. Funds from Development Partners 7. Other grants
Resources from the central government continue to be the major source of funds to the districts. These consist of funds flowing to districts through sector ministries for education, health, and feeder roads, etc. and also budgetary support to districts for salaries and wages. Table 8.1 shows the 2003 regional figures for GOG support to districts to pay for salaries and wages of staff in established posts and support from the DACF. Release of the DACF from the Ministry of Finance to districts improved in the year 2003. Districts report a total of ¢449.3 billion of cash coming from the DACF in their transactions. The Administrator of the DACF has instituted strict sanctions for districts that do not submit monthly reports to his office on time. This has resulted in an improvement on the financial management of the fund. Districts applied the DACF to programmes and projects in the areas of education, health, water & sanitation, and for micro credit to groups for production & employment generation. The resources from GOG for paying wages and salaries in 2003 amounted to ¢103.9 billion.

116
Table 8.1: Some GOG Funds to District Assemblies in 2003
REGION GOG SUPPORT TO DISTRICTS FOR SALARIES &
WAGES – 2003
DACF 2003
WESTERN 8,480,262,834 41,447,532,022 CENTRAL 9,145,627,650 49,956,562,420 GAR 29,069,571,340 30,984,717,707 VOLTA 6,574,907,615 37,161,809,982 EASTERN 10,299,005,382 61,944,890,265 ASHANTI 13,907,412,968 79,553,383,698 BRONG AHAFO 12,224,859,548 50,113,914,771 NORTHERN 6,949,326,298 53,869,937,928 UPPER EAST 4,544,349,572 27,053,858,496 UPPER WEST 2,766,071,287 17,200,721,889
TOTALS 103,961,394,494 449,287,329,178 Source: Ministry of Local GRD
The internally generated funds (IGF) of districts totalled ¢178.7 billion for the year 2003, an increase from the figure of ¢155.1 billion for 2002. This consisted mainly of revenue from fees & fines, rates, lands and licences. Districts spend internally generated funds mainly on recurrent expenditure and as counterpart funds to donor-sponsored projects. Programmes sponsored by development partners in the districts and communities were to reduce poverty by providing facilities in the areas of water, sanitation, health, the building of dams, markets, and providing food security. Table 8.2 shows trends in IGF by regions. Revenue generation increased in all regions in 2002 but for the year 2003 there were marked declines in revenues generated in Volta, Northern and Upper East regions. The reasons for these declines in internally generated funds in the three regions should be investigated in order that the problem can be checked.
Table 8.2: Internally generated funds outruns for District Assemblies 2000-2003 Region IGF Collected in
2000 IGF Collected in
2001 IGF Collected in
2002 IGF Collected in
2003 Western 7,321,403,738 8,942,905,281 17,315,653,021 23,991,651,610 Central 3,627,480,097 5,030,190,224 6,750,070,251 7,654,058,042 Greater Accra 30,750,047,304 41,355,335,942 52,023,798,596 61,841,312,418 Volta 3,794,006,825 5,037,532,993 18,366,459,438 6,617,053,372 Eastern 4,776,474,999 5,671,567,217 11,391,726,048 13,188,660,409 Ashanti 10,543,317,235 14,959,976,423 22,763,216,633 30,154,271,768 Brong Ahafo 4,788,926,093 6,505,537,139 10,375,344,273 22,663,441,950 Northern 1,700,136,293 2,493,972,590 8,336,007,437 5,608,194,767 Upper West 1,194,524,631 1,155,416,084 2,035,378,675 4,111,977,394 Upper East 1,860,727,926 4,533,253,998 5,792,563,474 2,831,848,240 TOTAL 70,357,045,141 95,685,687,891 155,150,217,846 178,662,469,970 Source: Ministry of Local Government & Rural Development

117
8.3 AN ASSESSMENT OF UTILIZATION OF HIPC RELIEF SAVINGS
8.3.1 HIPC Savings Ghana through the enhanced HIPC initiative has received substantial debt relief and even debt cancellations. For the year 2003, total transfers into the HIPC Account amounted to US$108.96 million out of the expected US$113.33 million. The balance of US$4.37 million is expected to be lodged in the HIPC account in addition to the savings for 2004. When the ‘completion point’ is reached in mid-2004 debt service will further reduce allowing for more resources for development. 8.3.2 Allocations HIPC Funds by MDAs HIPC fund allocations and transfers to MDAs for the period 2002-2003, and the purposes for which funds have been used are contained in Tables 8.3 & 8.4 below. The Tables are based on data collated from the MOF and by the CAGD and from reports received from MDAs.
Table 8.3: HIPC Fund to MDAs MDA 2002
Amt in cedis2003
Amt in cedisCUMMULATIVE
2002-2003 %
1 Ministry of Communication - 5,854,565,000 5,854,565,000 0.5%2 Ministry of Defence - 846,901,072 846,901,072 0.1%3 Min. of Reg. Co & NEPAD (ESRP) 9,922,500,000 550,000,000 10,472,500,000 0.9%4 Ministry of Education - 188,653,275,075 188,653,275,075 17.0%5 Ministry of Energy 519,758,328 35,111,346,154 35,631,104,482 3.2%6 Ministry of Information 3,501,100,000 8,160,000,000 11,661,100,000 1.0%7 Ministry of Interior 2,491,435,000 18,941,264,192 21,432,699,192 1.9%8 Ministry of Land & Forestry - 10,999,800,000 10,999,800,000 1.0%9 Ministry of Manpower Dev - 7,610,000,000 7,610,000,000 0.7%10 Ministry of Mines 3 ,231,519,000 - 3,231,519,000 0.3%11 Ministry of Private Sector Dev - 8,700,000,000 8,700,000,000 0.8%12 Ministry of Roads & Transport - 87,168,558,128 87,168,558,128 7.8%13 Ministry of Tourism - 5,807,469,479 5,807,469,479 0.5%14 Ministry of Trade, Industry &PSI 4,502,381,000 13,583,133,914 18,085,514,914 1.6%15 Ministry of Women & Children 14,966,362,500 12,000,000,000 26,966,362,500 2.4%16 Ministry of Work & Housing 3,010,128,603 105,123,147,119 108,133,275,722 9.7%17 Ministry of Local Gov & Rural Dev. 126,677,475,568 101,720,478,015 228,397,953,583 20.6%18 Ministry of Food & Agriculture - 16,420,642,575 16,420,642,575 1.5%19 Ministry of Health - 70,827,992,137 70,827,992,137 6.4%20 Office of the Senior Min 18,600,000,000 - 18,600,000,000 1.7%21 DOMESTIC DEBT PAYMENTS 81,400,000,000 144,000,000,000 225,400,000,000 20.3%
TOTALS 268,822,659,999 842,078,572,861 1,110,901,232,859 100%Source: MOF/ Controller and Accountant General’s Department / MDA reports, Feb 2004

118
Table 8.4: HIPC FUNDS to MDAs 2002 and 2003
MDA HIPC fund received
(Amounts in Cedis)
Purpose
BANK OF GHANA ) 225,400,000,000 -DOMESTIC DEBT PAYMENTS
Ministry of Communication 5,854,565,000 -Linking rural communities, SSS IT links
Ministry of Defence 846,901,072 -Construction works-barracks -Construction works-Sunyani & Kumasi -Renovation-3BN Sunyani
Ministry / Regional Coop & NEPAD (ESRP)
10,472,500,000 Micro Credit to Farmers and Traders under the ESRP
Ministry of Education 188,653,275,075 -Upgrading & Rehabilitation of 31 SSS - Subsidy for 2nd Cycle institutions -Youth empowerment programme
Ministry of Energy 35,631,104,482 - Extension of electricity to communities - Payment for supply of HT poles -ECG subsidy for lifeline consumption of electricity
Ministry of Health 70,827,992,137 - Health Insurance Schemes - Construction work for hospitals - Purchase of motorbikes - Health maternal deliveries
Ministry of Information 11,661,100,000
Ministry of Interior 21,432,699,192 -Improvement of sanitation in barracks & prisons -Purchase of sanitary vehicles -Construction of flats -Fire tenders/tanks -Civil disturbances/disasters
Ministry of Land & Forestry 10,999,800,000 -Forest Plantation Development Programme
Ministry of Manpower & Employment
7,610,000,000 -Skills training and employment
Ministry of Mines 3,231,579,000 Mineral’s Commission -Elmina Salt Producers Association
Ministry of Private Sector Dev. 8,700,000,000 - ADF Support Projects
Ministry of Roads & Transport 87,168,558,128 - Construction of feeder roads - Down payment for buses for the mass transportation programme
Ministry of Tourism 5,807,469,479 -Construction of tourism receptive facilities
Ministry of Trade, Industry &PSI 18,085,514,914 - Expenditure on PSI Oil Palm Initiative - Expenditure on 9th Ghana International Trade Fair
Ministry of Women & Children Affairs
26,966,362,500 -Micro Credit facilities- various districts - supply of food processing equipment
Ministry of Work & Housing 108,133,275,722
- Water supply rehabilitation and expansion -Tamale Storm water drainage project -Korle Lagoon Ecological Restoration project -Resettlement of people at Keta - Access to safe water in guinea worm areas
Ministry of Local Government & Rural Dev. 14,540,000,000
Ministry’s HIPC programme in DAs - Bio-gas, Enviro-loo, WC toilets, Boreholes - Sanitation Containers
[District Assemblies] 213,857,953,583 -Sanitation in major cities -Provision basic services in DAs -Education, Health, & safe water
Min. of Food & Agriculture 16,420,642,575 Local production of agro-processing machinery -Development of groundwater schemes for agriculture -Importation of tractors from India
Office of the Senior Min 18,600,000,000 -Micro credit to 43,156 farmers in all 10 regions
TOTAL 1,110,901,292,859
Source: MOF / Controller and Accountant Generals Department / MDA reports

119
The Tables show that during the period 2002 and 2003, a cumulative amount of ¢1,111 billion (One Trillion, One Hundred and Eleven billion cedis) of HIPC funds was transferred to twenty MDAs. Of this total, the largest proportion, 20.6%, was transferred to the Ministry of Local Government and Rural Development to be used by Metropolitan, Municipal, and District Assemblies for projects in core GPRS social sector areas of education, health, and water and sanitation. The total allocation to the MLGRD amounted to ¢228.4 billion cedis of which ¢213.9 billion went directly to the districts and ¢14.5 billion was used by the ministry for its own sanitation programmes. An amount of ¢225.4 billion representing 20.3% of the total HIPC relief has been used for Domestic Debt Payments as envisaged in the GPRS.
The HIPC relief fund was spent on Education (17.0%), water and sanitation (9.7%), roads & transport, 7.87% and Health (6.47%). The picture of proportional distribution is shown in the pie chart.
8.3.3 Release of HIPC Funds to District Assemblies Districts benefited from the HIPC Fund in two ways: (a) by direct allocation to Metropolitan, Municipal, and District Assemblies for projects approved by the MLGRD and the MOF and, (b) through some MDAs who requested HIPC funds to implement particular projects and programmes at the district level.
In the year 2002, the first year of applying HIPC funds, districts were allocated bulk sums for approved projects and received the funds in two tranches. Transfers amounted to an average of ¢1 billion per district. The Metropolitan Assemblies (Accra, Kumasi and Shama Ahanta) received ¢3.5 billion, ¢2.5 billion, and ¢2.0 billion respectively, and four Municipal Assemblies received ¢1.5 billion each.
In the year 2003, districts were allocated funds for selected projects and to undertake other national programmes such as the funding of District Mutual Health Insurance Schemes and exemptions for Maternal Deliveries. Under education facilities were provided for basic education and for teacher accommodation. The Ministry of Education also used funds to provide for food subsidy for boarding schools and for the upgrading of selected schools. The breakdown provided by the MOF is as follows:
CUMULATIVE DISTRIBUTION OF HIPC FUNDS BY SECTOR (2002-2003)
Health6%
Roads8%
Water10%
Districts Assemblies
21%Domestic Debt20%
Education17%
Other18%

120
Table 8.5: Proposed use of HIPC funds by District Assemblies Proportion of
Total HIPC Funds
Purpose
Education 6% - Infrastructure – classrooms & toilet facilities for basic schools and teacher accommodation
Health 7% - Infrastructure - health facilities, posts, - accommodation for health personnel
Water 7% - Rural water – CWSA programmes
Sanitation 4% - Waste disposal and drainage in urban districts - Toilet facilities and drainage in rural districts
Disaster preparedness 1% Funding for relief and emergency supplies
Source: MOF As a result of HIPC relief funds, development projects in Districts have increased. Districts have found HIPC funds very timely and useful for development. This has been possible because of the fact that HIPC funds are readily available in District HIPC accounts and therefore projects can be executed rapidly, and contractors promptly paid upon completion of the project. However, the whole process can be significantly improved to ensure that future disbursements of the funds have an even greater impact on development projects in the Districts. 8.3.4 Details of type of projects A summary of the types of projects being executed is shown below in Table 8.5. It shows that a total of 1516 projects are being executed nationwide. The breakdown is as follows: 609 Education projects, 194 Health projects, 563 Sanitation projects, 141 Water projects. Under production & employment generation, all regions received funds from the Senior Minister’s Office and the Ministry of Women and Children’s Affairs as micro credit funds for farmers, and women trader groups. Districts are executing their projects in line with guidelines supplied to them by the Ministry of Local Government & Rural Development. All projects fall within the stipulated areas of Education, Health, Water, and Sanitation and also the area of Production & Gainful Employment.

121
Tab 8.6: TYPES OF PROJECTS EXECUTED WITH HIPC FUNDS (CUMULATIVE for 2002 and 2003)
TYPE OF PROJECT NR UWR UER WR BA CR AR VR ER GAR Total Education Classroom Blocks 44 20 17 37 78 59 70 55 59 70 509
Furniture 4 1 2 3 4 4 4 22
Dormitory 1 1 2
Library 1 1 1 1 4
Teacher's Common Room 4 4
Teacher’s Quarters 5 2 1 1 2 3 14 3 31
Upgrade School 1 1 9 4 4 5 8 5 37
Education Total 54 21 22 47 83 69 84 70 75 84 609
Health Equipment 1 2 3
Exemptions 6 2 4 3 15
Health Facility 11 5 8 5 15 12 5 3 9 5 78
Health Insurance 4 2 3 6 5 4 6 4 6 6 46
Nurse Quarters 6 2 6 3 4 4 6 13 2 6 52
Health Total 27 11 22 14 24 25 17 20 17 17 194
Production & Employment
Micro Credit Schemes11
Electricity 1 1
Equipment 1 1 2
Craft Village 1 1
Tourism 3 1 4
Production & Employment Total 3 1 1 1 1 1 8
Sanitation Refuse containers 7 1 3 12 5 10 8 2 6 8 62
Drains 2 4 2 8
Refuse Loaders 1 1
Abattoir 4 3 4 11
Toilet 42 8 15 41 25 50 73 54 55 73 436
Incinerator 2 2 3 5 14 5 14 45
Sanitation Total 49 11 18 57 33 65 99 61 71 99 563
Water Borehole 6 5 3 1 8 3 10 18 6 9 69
Pipeline 2 2 2 2 8
Small Town Water 1 1 2 1 5 3 1 14
Hydro-geological Stud 1 1
Water Reservoir 3 2 3 8
Hand Dug Well 1 24 10 3 3 41
Water Total 10 5 3 27 10 16 16 27 12 15 141
Grand Total 141 51 66 145 151 176 216 178 176 216 1516
11 The Ministry of Women & Children’s Affairs and the Office of the Senior Minister transferred HIPC funds to districts for various micro credit schemes.

122
Education Projects All districts undertook the construction of school blocks with HIPC funds. There were as many as 509 new classroom blocks constructed for basic level education. Also some 22 districts procured classroom furniture, and constructed housing facilities for teachers. It is worth noting that construction designs for school buildings included the provision of toilet facilities and urinals. Health Projects Projects under health included the construction of new clinics, hospital wards and living quarters for nurses. Other major projects and programmes undertaken are the initiation of processes to establish Mutual Health Insurance Schemes in all districts, and the provision of funds for exemptions for maternal health deliveries. 78 district hospitals and health centres were either rehabilitated or constructed and 52 nurses quarters were constructed. All districts have now received HIPC funds to start insurance schemes. HIPC funds have also been sent to districts to be used as exemptions fund for maternal deliveries. Water & Sanitation Projects Projects undertaken in the water sector includes the construction of boreholes and hand-dugout wells. Sanitation investments were used to provide for safe liquid and solid waste management, toilet facilities for schools, incinerators and refuse containers. Altogether districts constructed 436 toilets and 45 incinerators across the country. Sixty-nine (69) boreholes were constructed, but additional ones are to be constructed by the CWSA under a programme to eradicate guinea-worm. The Metropolitan and Municipal Assemblies made the largest investments in sanitation. Production & Gainful Employment The programmes under production and gainful employment at the district level consisted mainly of micro credit schemes initiated by the Ministry of Women and Children’s Affairs and the Senior Minister’s Office. The former undertook programmes with women groups (micro credit to women farmer and trader groups, supply of food processing equipment) and the later provided micro credit to 43,156 farmers in all 10 regions. 8.3.5 Key Issues & Observations in the Management of HIPC Funds and Projects The issues, observations and recommendations that need to be addressed to improve the management of HIPC funds are summarized below in the following order: − Project Selection, Design & Costing − Funds Transfer and Communication − Micro Credit Support for Production & gainful employment − DPCU Involvement
Project Selection, Design & Costing • The MLGRD guidelines provide that, projects must be selected from District Medium Term
Development Plans (DMTDP) that are in line with the GPRS. However, for a number of districts choice of projects are inconsistent with development plans.
• Delays in the execution of projects resulted in the increases in the final cost of the projects and DAs then had to find other sources to fund the difference.
Recommended Policy Initiative • A clear-cut definition of project selection will be provided to the Das to ensure projects are
chosen from the District Medium Development Term Plan.

123
• Regional Coordinating Councils (RCCs) will represent the MLGRD at the regional level to approve at the regional level to reduce the length of the approval process. The RCCs will then be better informed to carry out their monitoring and coordinating role
Funds Transfer and Communication flow • Some HIPC funds are transferred to district accounts without the accompanying directives as to
the purpose of fund. This is particularly true for transfers made by MDAs.
• Funds meant for particular districts are sometimes mistakenly lodged into the accounts of other districts. This creates problems during the retrieval of funds, especially when the recipient district has utilized such funds.
• There is a significant lack of information about the HIPC processes at the District level and the perception that there is ineffective coordination of the HIPC funds at the national level. Unlike the DACF, which has an Administrator, HIPC has several players involved, which make it difficult for the DA’s to get the required information on a timely basis.
Recommended Policy Initiatives
• The communication process and audit processes will be significantly improved. There is the need for a single point of contact to check and clarify funds, which are due and have been transferred to the Districts.
• There will be a single national point of contact to coordinate HIPC communication. Detailed
information on the project to be implemented, implementing agency should be given to the beneficiary Metropolitan, Municipal or District Assemblies
Micro Credit Support for Production and gainful employment • The process of giving funds to districts for micro credit to manage, appears not to be effective
and is fraught with difficulties. Apart from the difficulties with access and recovery of funds lent, the process is tainted with lack of transparency and equity. There are also issues of whether DA’s have the skills and capacity to perform the role of micro fund managers i.e. to identify who should benefit, lend and collect funds.
Recommended Policy Initiative
• Funds will be channelled through a local Rural Commercial Bank and the bank paid management fees, to manage the process on behalf of the DA. A Project Coordinator from the DA should be identified to manage the relationship to ensure that Micro Credit poverty reduction objectives are achieved.
Involvement of the District Planning & Coordination Unit • The DPCU is not actively involved in the HIPC process at the District level, although they are
expected to play a critical M&E function to ensure that the HIPC projects have the desired impact on the reduction of poverty.
Recommended Policy Initiative • The role of the DPCU in the HIPC M&E process will be documented, and communicated to the
DA to empower them to ensure that they are formally involved in the process.

124
9 PROGRESS ON THE MILLENNIUM DEVELOPMENT GOALS
Ghana like many sub-Sahara African countries faces a myriad of challenges in its efforts to achieve the MDGs. Efforts Ghana is making towards achieving these goals is shown by the adaptation of the MGDs by linking them to the Ghana Poverty Reduction Strategy (GPRS). The GPRS policies and measures have been outlined for reducing poverty in order to make progress on the MDGs.
Since the start of implementation of the GPRS in mid-2002, resources including funds accruing from HIPC relief have been channelled into pro-poor interventions. Most of the resources have been used in the areas of health, education, water and sanitation. We provide below the progress made towards the achievement of the MDGs. As will become evident, progress toward achieving the goals are mixed.
MDG1• Eradicate Extreme Poverty and Hunger
Indicators: - reduce the proportion of population below the national basic needs, poverty line - reduce the prevalence of Underweight Children
Target: - Halve the proportion of those in extreme poverty by 2015 - Halve the proportion of those in hunger by2015
Status: Objective evidence on the incidence of poverty will be available when the GLSS5 is completed. However there is an encouraging trend in GDP growth rate –. Real Per Capita growth rate has also modestly improved from – 1.6% in 2001 through 1.8% in 2002, to 2.6% in 2003. To significantly reduce poverty by 2015 it is estimated that African economies need to grow their GDP at 7% per annum on average. The progress made in the real GDP growth rate indicates that with persistence at maintaining economic and social stability, Ghana is on track to achieving the required growth rate of 7% per annum and likely to halve poverty by 2015.
Nutrition: The level of child malnutrition as measured by the proportion of children underweight is on the rise – 25% in 1998 to 35.8 in 2003. Child malnutrition is more prevalent in the Ashanti (46%), Greater Accra (40.4%) and Western regions (36.9%). The deteriorating nutritional status of children may be due to the lack of impact of nutritional programmes.
In order to improve the nutritional status, government will vigorously pursue nutrition programmes through the Ministry of Health. Government will also continue and expand the community based poverty reduction project (CPRP), which is being piloted in four districts. This programme is to promote child care, through growth monitoring for children, counselling on health, and hygiene education issues and to establish a fund for mothers who need micro finance assistance to enable them improve on their income generation activities.
Also school based nutrition programmes and other nutrition programmes such as those run by the CRS in schools in the deprived northern regions will be encouraged. Development partners will be encouraged to scale up their food security programmes in the north of the country where the effects of poverty and hunger is highest.
With the current rate of deterioration in child malnutrition and proportion of children underweight , Ghana will not be able to reduce hunger in half by 2015 unless drastic measures are taken to resolve the problem.

125
MDG2• Achieve Universal Primary Education by the year 2015 Indicator: increase the gross primary enrolment ratio (especially for the three most deprived regions) Target: To achieve 100% primary enrolment ratio by 2015 Status: The GPRS indicator for this goal is to increase the gross primary enrolment ratio especially for the three most deprived regions. There has been slight improvement in enrolment ratios for primary schools throughout the country. The national average increased from 79.5% in 2001/2002 to 81.1% in 2002/2003 academic year. The trends in the National Gross Primary School Enrolment Ratio compared with the deprived regions are shown below.
2001/2002 2002/2003 Target
2005 Progress
National 79.5% 81.1% 88.5% On track Northern Region 64.8% 67.7% 70% On track Upper East Region 69.5% 72.2% 79% On track Upper West Region 63.1% 69.6% 63% Exceeded
Trends in Primary Enrolment Ratios: Deprived Regions
0%
10%
20%
30%
40%
50%
60%
70%
80%
90%
100%
Nat ional NR UER UWR
Ministry of Education
2001/ 2002
2002/ 2003
Target 2005
The trend shows that primary school enrolment can be increased 1.6 percentage points per annum. Assuming a leaner ratio for this increment, the GPER will be about 98% by 2015. This means that with some more effort and support from development partners the goal can be achieved.
MDG3:• Promote Gender Equality and Empower Women
Indicator: Increase Gross Primary Enrolment Ratio for girls in primary, junior and senior secondary schools
Target: Achieve equal access for girls and boys in primary, junior and senior secondary schools by 2015 Status:
Equal access to education, among other measures, is a key step toward greater gender equality. Evidence from the three most deprived regions show that girls’ enrolment rate is increasing at a faster rate than that of boys suggesting that progress is being made towards the achievement of

126
gender parity in education. Progress on this goal is on track as shown by the increase in enrolment ratios for girls nation-wide and in the deprived regions and the target is likely to be achieved..
The following charts show the Gross primary enrolment ratios and ratios of girls to boys in primary schools. The performance in enrolment ratios is good and the target will most likely be met.
Gross Enrolment Ratios - Girls to Boys
0%
20%
40%
60%
80%
100%
2001/2002 77.0% 55.0% 69.0% 63.0%
2002/2003 77.7% 59.1% 72.1% 70.3%
Target 2005 88.5% 70.0% 79.0% 63.0%
National NR UER UWR
Gross Enrolment Ratios - Deprived Regions
0%
20%
40%
60%
80%
100%
2001/2002 79.5% 64.8% 69.5% 63.1%
2002/2003 81.1% 67.7% 72.2% 69.6%
Target 2005 88.5% 70.0% 79.0% 63.0%
National NR UER UWR
Source: Ministry of Education MDG4• Reduce Child Mortality by two-thirds by2015 Indicators: - Under-five mortality rates reduced by 66% by 2015
- Infant mortality rate reduced by 66% by 2015 Target: To reduce Under-five mortality rate by 66% Status: The improvements in mortality rates of children under-five experienced in the 90s have slowed down in all regions in Ghana. The result of the 2003 GDHS shows that infant and child mortality rates increased from 57/1000 in 1998 to 108/1000 in 1999. The reason for this is linked to the lack of access to clean water and sanitation facilities; and also the non application of the policy free health care for the under-five. Also poor nutritional status of children also contributes to the increasing mortality rates for children in Ghana. The relevant data for child health are:
1988 1993 1998 2003 Infant mortality rate 77 66 57 64 Under five mortality rate 155 119 108 111 Immunization coverage (DPT3) 43 62 69.4 Source: DHS, WDR and health sector Program of Work in Ghana-Facts and Figures
Unless drastic measures are taken to restore the progress made in earlier years this target cannot be met.

127
MDG5• Improve Maternal Health Indicator: Reduce the Maternal Mortality per 100,000 by 66% by 2015. Target: To reduce the maternal mortality rate by three-quarters by the year 2015. Status:
The Ministry of Health gives a 2003 figure for maternal mortality rate as 1700/100,000 live births. This represents an improvement from the rate of between 2145 and 7406 maternal deaths per 100,000 live births for earlier years. But the rate is still high and action is needed to improve policies and the capacity of the health system to further reduce maternal mortality.
The GDHS 2003, reports that the proportion of mothers who receive antenatal care from health professionals is about the same across regions with a national average of 92%. The proportion of mothers who got assistance from qualified health personnel in their deliveries is rather low at national average of 47%. This proportion is much lower in the deprived regions with the lowest being 18% in the Northern region, 28% in the UER and 33% in the UWR.
With the current high rate of maternal mortality it is unlikely that the target will be met.
MDG 6: Combat HIV/AIDS, malaria and other major diseases Indicator: - Reduce the incidence of HIV/AIDS - Reduce the incidence of malaria Target: - Halt and reverse the spread of HIV/AIDS by2015 Status: The results on HIV/AIDS prevalence is being finalised for publication in the final report of the Ghana Demographic and Health Survey (GDHS) 2003. However the results of monitoring sentinel sites show an upward trend in HIV/AIDS prevalence. The national average for HIV/AIDS prevalence is at 3.6%. As part of the strategy to control the spread, key organizations have adopted a Joint Review Report on HIV/AIDS and Community initiatives for education on HIV/AIDS in deprived regions.
This trend shows that HIV/AIDS could become a serious health problem and could translate into economic and social problems. Notwithstanding the difficulties being encountered with extra effort the target can be met.
MDG7: Ensure Environmental Sustainability Indicator: - Increase the proportion of land area covered by forest - increase the proportion of population to safe drinking water Target: - Integrate the principles of sustainable development into country policies and
programmes and reverse loss of environmental resources by2015. - Reduce and half the proportion of people without access to safe drinking water by2015
Status: The annual rate of loss of forest land is 65,000 hectors per annum and a re-forestation rate of 25,691 ha / annum planted. This point to an unsustainable use of natural resources. Greater

128
understanding of how environmental changes affect poor people is needed among the rural communities in Ghana. In collaboration with the Environmental Protection Agency (EPA), the NDPC also conducted Strategic Environmental Assessment (SEA) of the GPRS to ensure that sound environmental management practices are maintained in its implementation.
Safe water supplies are important for improving health, especially in children. Data from CWIQ data shows that all the regions experienced increases in the percentage of households with access to safe water sources. The proportion of rural population with access to safe water increased from 40% in 2000 to 46.4% in 2003. With extra effort this target can be achieved.
MDG8: Develop a Global Partnership for Development Indicator: Reduce debt service as a percentage of GDP Target: Deal Comprehensively with Debt and make debt sustainable in the long term. Status:
Ghana through the enhanced HIPC initiative has received substantial debt relief and even debt cancellations. The total projected HIPC debt relief /saving expected in the HIPC Account for the year 2003 was US$113.33 million. At the end December 2003, the total transfers into the HIPC Account amounted to US$108.96 million. The expected amount to be lodged in the HIPC account for 2004, including the 2003 balance, is estimated to be US$150.33 million (MOF). When the ‘completion point’ is reached in mid-2004 debt service will further reduce allowing for more resources for development.
In 2003 the burden of domestic debt decreased from a domestic debt/GDP ratio of 29.1% in 2002 to 22.6% in 2003. This reduction in domestic debt had the effects of a reduction in inflation and lending rates, and growth of credit to the private sector from –11% in 2001 to 37.5% in 2003. Total external debt service in also on the decline – 8.5% in 2001 through 7.8% in 2002 to 6.1% in 2003.
With these positive performance both domestic and external debt, the target of dealing comprehensively with debt and make debt sustainable in the long term can be achieved.
Challenges: For many developing countries such as Ghana, the main challenge to building a global partnership for development lies outside their control. Whereas Ghana has adopted development strategies and followed advice given by the multi-lateral financial institutions and other development partners in liberalising and restructuring her economy, there still remain constraints in her efforts to develop. The main constraint to achieving the MDGs is the lack of a congenial global trading system for agricultural produce that Ghana mainly exports.
It has been noted and advocated time and again that developed countries need to do more by fully liberalising their markets - reducing high tariff and removing non-tariff barriers to trade - in order to increase access to markets in rich countries for developing countries. Especially, the removal of agricultural subsidies paid to farmers in rich countries will have a tremendous and positive impact on development in poor countries. These measures, if adopted by rich countries, will help Ghana to achieve the MDGs.
Finally the lack of financial resources with which to fund numerous programmes in education, water and sanitation is also a major constraint to development. Only a small proportion of funds

129
needed for Ghana to fund the GPRS are available. An increase in overseas development assistance (ODA) by the development partner countries will accelerate progress toward achieving the MDGs.
MILLENNIUM DEVELOPMENT GOAL / TARGET GPRS
Target 2003 Remarks
MDG1 •ERADICATE EXTREME POVERTY AND HUNGER Target: Halve the proportion of those in extreme poverty by2015
Likely to be achieved
- Proportion of population below the poverty (national basic needs) line
36 39 Indicators:
Prevalence of Underweight Children -- 35.8
MDG2 • ACHIEVE UNIVERSAL PRIMARY EDUCATION – Target: Achieve Universal Access to Primary Education by 2015
Likely to be achieved
Indicator: Gross Primary Enrolment Ratio 88.5 81.1
MDG3 • PROMOTE GENDER EQUALITY AND EMPOWER WOMEN – Target: Eliminate Gender disparity in primary & secondary schools
Indicator Ratio of females in primary school 88.5 77.7
MDG4 • REDUCE CHILD MORTALITY BY TWO-THIRDS BY 2015– Target: Reduce U5 Mortality by two-thirds by2015
Not on track
Indicators Under-five Mortality Rate 95 111 Infant Mortality Rate 50 64 Immunisation coverage 90 91.1
MDG5 • IMPROVE MATERNAL HEALTH Target: reduce the maternal mortality rate by three-quarters by the year 2015
Not on track
Indicator: Maternal Mortality Rates 170
MDG6 COMBAT HIV/AIDS, MALARIA AND OTHER DISEASES Target: Halt and reverse the spread of HIV/AIDS by2015
Not on track
Indicator: Prevalence of HIV/AIDS 3.2 3.6%
MDG7 ENSURE ENVIRONMENTAL SUSTAINABILITY & INCREASE THE PROPORTION OF LAND AREA COVERED BY FOREST Targets: - Integrate the principles of sustainable development into country policies
- Programmes reverse loss of environmental resources by2015
Likely to be achieved
Proportion of land area replanted and covered by forest 65000 25691 Indicators:
Proportion of population with access to safe water source 75.2
MDG8 DEVELOP A GLOBAL PARTNERSHIP FOR DEVELOPMENT– Target: Deal Comprehensively with Debt and make debt sustainable in the long term
Likely to be achieved
Indicator: Debt service as a percentage of GDP 17.2% 34.1

130
10 SUMMARY OF RECOMMENDED POLICY INITIATIVES Based on the assessment of progress of the implementation of the GPRS the following policy initiatives have been recommended. 10.1 MACRO ECONOMIC STABILITY
The government is committed to and has succeeded in maintaining macro-economic stability and intends in 2004 to maintain the macro-economic stability achieved in 2003. To strengthen the government’s continued effort to stabilize the economy, the following policy measures will be undertaken.
First, without losing control over macro-stability the government will simultaneously pursue more ambitious growth policies, which will propel the economy to a higher growth rate than hovering around 5%. Second, the government will continue to reduce the debt burden by increasing revenue collection through further improvements in the efficiency of the revenue collecting agencies. Third, the government will use an optimum mix of appropriate fiscal and monetary policies to deliver on inflation and other macroeconomic targets and continue to strengthen public expenditure management.
Notwithstanding these efforts there are a few challenges that the government will face in 2004 including the delayed petroleum price adjustments. The challenges will be managed carefully so as not to disturb the macro objectives of 2004. The government plans to use the TOR Debt Recovery Fund, which is expected to yield 1.2 trillion cedis to partly fund the subsidies for the delayed petroleum price adjustments. The government also plans to close the unplanned financing gap through fiscal adjustments which consist of curtailing discretionary expenditures but protecting poverty reduction expenditures, reducing net domestic debt repayments from 2.2% of GDP to about 1.5%, and finding more sources of revenue (non-tax revenue) through accelerated divestiture and increased dividends from state-owned companies.
Government expenditures generally reflected the GPRS priorities. However these expenditures as published do not clearly show the extent to which the poor benefited, especially the deprived areas of Northern, Upper east and Upper West and Central Regions. A more detailed breakdown of expenditure will be provided to forge a closer link between budget allocations and beneficiary targets.
The areas of budget formulation, execution and reporting still need upgrading and the link between the budget and GPRS would be strengthened further. The Budget and Public Expenditure Management System will be expanded to six other MDAs by November 2004.
As part of the Public Financial Management Reform Programme the Ministry of Finance and Economic Planning will operationalise the Financial Administration Act, the Internal Audit Agency Act and the Public Procurement Act as well as enhance the activities of the External Audit Act. The government expects timely disbursement of pledges by Development Partners and will encourage donors that are not party to the MDBS to join.
The Bank of Ghana will work to diffuse the inefficient institutional structures in the financial sector to allow for a well-functioning financial sector which impacts on growth and thus helps to reduce poverty.
The unemployment rate is a critical macro indicator of welfare but is not routinely reported on. Government will work hard to ensure that labour market information be made available more frequently.

131
10.2 PRODUCTION & GAINFUL EMPLOYMENT
Some progress has been made in the Production and Gainful Employment area, but additional policy initiatives could be introduced to enhance the sector. Crop production is largely rain-fed and traditional techniques of production tend to dominate. To improve production the government will encourage private commercial farming based on proper mechanised and irrigation systems. The Ministry of Trade, industry and PSI will encourage the establishment of industrial estates and clusters emphasizing agricultural machinery development.
There will be an intensification of infrastructural development, especially in feeder roads rehabilitation, construction and maintenance to provide market access to rural agriculture.
For the re-aforestation of degraded lands, there will be an early commencement of the Phase II of the Natural Resource Management Programme at the Ministry of Lands and Forestry
The Ministry of Mines has been detached from Energy and currently the budget is too small for the activities geared towards poverty alleviation. The government will assess the feasibility of using a percentage of the Mineral Development Fund as seed money outside GoG expenditures to finance poverty reduction projects and the Ministry‘s activities will be highlighted in the GPRS update. Again, the activities of the Ministry of Tourism are not fully captured in the GPRS and will also be fully integrated in the GPRS during the update for the 2006-2008.
Currently, the Ministry of Food and Agriculture captures data for only food crops. There is a need to expand the coverage of the Annual Survey to include non-food crops. The capacity to capture additional data is required. In the area of processing of agricultural produce, the Ministry of Trade, Industry and Presidential Initiatives has not achieved much. The emphasis has now being shifted to the Rural Enterprise Development Programme, which involves the establishment of three enterprises each in all the 110 districts.
10. 3 HUMAN RESOURCE DEVT & BASIC SERVICES
Education The analysis clearly shows increases in GPER nationally and reduction in disparity across regions and gender in line with the objectives of the GPRS. The monitoring of quality of education indicators however shows mixed results. Government will continue to pursue the current policies to ensure more equity in access. Special attention will be paid now to quality issues in the next round of GPRS implementation. Teacher retention is key to ensuring quality education and reducing school drop out. Impact assessment of the teacher retention schemes will be conducted regularly to ascertain the differential impact of the different schemes being implemented. Health It is essential to review health sector priorities to take into account the recent increases in infant and childhood mortality rates in the country. Due to the observed positive correlation between child malnutrition and under-five mortality, child nutritional programmes may need to be strengthened and expanded.
To have the greatest impact on health outcomes, there is the need for a system to identify and concentrate the location of health facilities in the most vulnerable districts.

132
To ensure significant improvement in the health status of the most poor and vulnerable, access to exemptions could be enhanced through better targeting of the poor. There is currently no system to identify the most poor and it is important that the situation is addressed quickly.
There is the need to accelerate the full implementation of the National Health Insurance Scheme to ensure that poor people have access to quality health services. Introduction of a targeting system would be important to ensure that the most poor and vulnerable benefit from planned subsidies to cover the cost of premiums. Access to drinking water has improved considerable. However, incidence of guinea worm infections, a water-borne disease is on the rise. This suggests the need to take a critical look at the safety concerns of the water that is being made accessible to the rural population. Government will investigate this oxymoron further and immediate action taken to ensure not only access to water but also access to quality water.
Access to adequate sanitation remains very low in the country. Sanitation issues need particular attention in the next phase of the GPRS implementation 10. 4 GOOD GOVERNANCE
Security and Rule of Law To promote a faster pace towards good governance, greater dissemination of information about policies, programmes and services will be mounted to inform the public about their rights, their obligations and the nature of services available.
Similarly, public forums to discuss issues of governance in relation to justice, accountability and security will be intensified. In this sense, public forums such as the Peoples’ Assembly, which involves the President interacting with ordinary citizens and which are replicated at the regional and in some instances, the district level, will be made a regular feature of the governance programme. Also, good governance enhancers such as the ‘Meet the Press’ series, which afford the media the opportunity to listen to and discuss issues with incumbent ministers, will continue. Indeed, more use will be made of the mass media as well as already existing civil society groups in rural and urban areas, including professional associations to discuss such matters.
It is noted that enhancement of governance should go beyond law and order. Other governance institutions are playing significant roles in expanding public space for dialogue, promoting administrative justice, upholding human rights and facilitating smooth transitions in the political order. As a policy goal, the governance indicators will be revised in future to present a more comprehensive representation of all the other players.
Decentralization
There is need to conduct research to establish the system-wide impact of policy measures on improved services by the district assemblies.
Many communities are becoming more empowered to demand accountability from public office holders at the District assembly level. These are all positive spin-offs from the support to district assemblies, which will be sustained to deepen citizen participation in decision-making and ensure equity in resource allocation

133
Public Sector Reform
The main thrust of public sector reform will be the adjustment of central government structures and organisation to make the central machinery of government more efficient, effective, and private sector-friendly. The capacity of government will be strengthened to facilitate and set the development agenda to pave the way for private sector and other social partners to fully contribute to the national development effort.
Monitoring & Evaluation
Even though there is a multiplicity of indicators in the GPRS for measuring the extent to which good governance is evolving, the biggest challenge remains what form of indicator is best for measuring the intangibles like improvements in the practice of democracy. There will be stakeholder consultation towards ascertaining and harmonising existing indicators with those of the APRM of the NEPAD and the MDGs all of which by virtue of state ratification of protocols have assumed a de jure presence and must be reported on.
10. 5 THE VULNERABLE & THE EXCLUDED
The logistics situation and service conditions of staff of the Legal Aid Board and the Department of Social Welfare will be reviewed. This will help them expand their services especially to the vulnerable and the excluded. Rights of the destitute and prisoners with no access to legal services will remain violated if the welfare and legal services do not reach them in adequate measure. An aspect of the provision of social assistance to vulnerable and excluded groups what seems to have been taken for granted is the mainstreaming of assistance to such groups. The fact that these are crosscutting issues calls for far greater collaboration between agencies in the social sector as well as economic sectors than is currently the case. The Poverty Monitoring Groups provide a unique opportunity for this cross-fertilisation to take place to promote poverty reduction and rights protection of the vulnerable and excluded. Children in ‘difficult circumstances’ are especially vulnerable but there are no indicators to enable effective tracking. Efforts will be made to conduct studies to provide baseline data on the extent of the problem to facilitate assessing changes in the future. The coordination between various interest groups working on the anti-HIV/AIDS campaign will be improved to ensure harmony of messages. GAC should assume a more central role in coordinating the national response to HIV/AIDS in partner coordination seek ways to pool resources. Recent allegations and counter-allegations by the Ghana AIDS Commission and NGOs working on HIV/AIDS raise serious questions about the Anti-HIV/AIDS Campaign. The Commission will strive to find new ways of monitoring and evaluating the activities of its partners in the Campaign to avoid the dissipation of scarce resource through fraudulent deals. The overarching need to reduce the spread of the virus and to offer support to the infected as rapidly as possible and the objective of seeking cooperation with other social partners compelled the GAC to enter into partnership with groups of dubious credentials. A more vigorous proposal vetting and organisation screening arrangements may be considered in commissioning groups to participate in providing service to patients. Contracting will be made more rigorous and sanctions enforced in the event of misapplication of resources.

134
10. 6 DISTRICT ASSEMBLY HIPC FUND UTILIZATION POLICY
Project Selection, Design & Costing
A clear-cut definition of project selection will be provided to the DAs to ensure projects are chosen from the District Medium Development Term Plan.
Regional Coordinating Councils (RCCs) will represent the MLGRD at the regional level to approve at the regional level to reduce the length of the approval process. The RCCs will then be better informed to carry out their monitoring and coordinating role
Funds Transfer & Communication Flow The communication process and audit processes will be significantly improved. There is the need for a single point of contact to check and clarify funds, which are due and have been transferred to the Districts. There will be a single national point of contact to coordinate HIPC communication. Detailed information on the project to be implemented and implementing agency should be given to the beneficiary Metropolitan, Municipal or District Assemblies
Micro Credit Support for Production & Gainful Employment Funds will be channelled through a local Rural Commercial Bank and the bank paid management fees, to manage the process on behalf of the DA. A Project Coordinator from the DA should be identified to manage the relationship to ensure that Micro Credit poverty reduction objectives are achieved. Involvement of the DPCU The role of the DPCU in the HIPC M&E process will be documented, and communicated to the DA to empower them to ensure that they are formally involved in the process.

135
11 TECHNICAL APPENDICES
As mentioned elsewhere, the Ghana Poverty Reduction Strategy is the current operational development policy framework for the country. As a result all programmes with development partners both multi-lateral and bi-lateral, are based on the GPRS. For instance, the implementation of the GPRS is directly linked with the IMF and the World Bank’s Enhanced HIPC Initiative that the government signed unto in February 2002; and the Multi-donor budget support (MDBS) initiative which represents a shift from a sector and project-driven approach in bilateral support to the Government of Ghana to a budget support regime. Support from each of the three donor groups, the IMF, the World Bank and the MDBS group, including the debt relief from the Enhanced HIPC Initiative, especially upon reaching the HIPC completion point were all to support the implementation of the GPRS. As a result release of funds and increased flow of debt relief have all been made contingent upon agreed sets of GPRS-based prior actions to be taken by the government of Ghana. In these technical annexes we provide a summary report on the status of the prior actions, triggers, and targets towards reaching the HIPC completion points, and for meeting the PRSC and the MDBs triggers. We also include in this section, a summary of the 4 poverty and social impact studies that have been completed. The studies were commissioned by the government with support from the donor community however, the summary of the findings and recommendations reported here are those of the authors and not necessarily shared by the Government of Ghana or by the Donor that funded the study.

136
APPENDIX 1: STATUS REPORT ON HIPC COMPLETION POINT
Background In February 2002, Ghana entered an agreement with the World Bank and the International Monetary Fund (IMF) to support a comprehensive debt package for the country under the Enhanced Heavily Indebted Poor Countries Initiatives (HIPC). The IMF and World Bank have determined that a nationally owned participatory poverty reduction strategy (GPRS) should form the basis for concessional lending and debt relief under the HIPC initiative. Presented below is the progress made in 2003 towards the achievement of the various triggers and targets under the various policy areas for reaching the HIPC Completion point. They are also summarized in Table 11.1.
a. Macroeconomic stability Trigger 1: Preparation of a full PRSP and satisfactory implementation for at least one year as evidenced by the joint staff assessment of the country annual progress report. Status: This trigger has been met. The GRPS was finalized in February 2003 and endorsed by the World Bank and the IMF. The first Annual Progress Report (APR) was completed in March 2004. Trigger 2: Continued maintenance of macroeconomic stability as evidenced by satisfactory implementation of the PRGF-supported programme. Status: Overall, the indicators for macroeconomic stability registered continued progress in 2003.A new three-year PRGF arrangement was approved in May 2003 and the first review completed in December 2003. Trigger 3: Use and monitor budgetary savings in priority areas; ensure timely publication of information for an annual public hearing and use information as input to annual progress report on the GPRS. The increase in total spending on these priorities must equal or exceed HIPC relief. Status: Budget savings have been used for poverty reduction expenditures. The information on this is available in the 2004 Budget Statement and was extensively incorporated in the 2003 Annual Progress Report on the GPRS. Spending in poverty related activities exceeded HIPC relief.
b. Governance Trigger 4: Procurement reform- establish new procurement code with regulatory oversight body . Status: A regulatory oversight body has been put in place to implement a new Procurement lawl, which has been passed into law by Parliament and gazetted the position of the Chief Executive of the Secretariat to the Board has already been advertised. Members of the Public Procurement Board (PPB) have been nominated and approved by the President and await concurrence of the Council of State. Inauguration of the PPB is currently planned to take place in June 2004 . Trigger 5: Strengthen the capacity of the Internal Audit Unit through full staffing of existing internal audit positions

137
Status: Existing positions have been fully staffed
c. Public Expenditure Management
Trigger 6: Government expenditure reports published monthly in government gazette following the implementation of a new reporting system. Status: New reporting system implemented and reports are published in the gazette monthly Trigger 7: Establish functioning electronic expenditure tracking systems in the Ministry of Finance (MOF), the Controller and Accountant General’s Department (CAGD) and at least two other key Ministries. Status: The system has been installed and operational in the MoF and CAGD. Actions are being taken to complete installation in the Ministries of Health, Education, and Roads and Transport by mid 2004.
d. Decentralization of Government Functions Trigger 8: Devolve responsibilities to local districts as evidenced by (i) submission to Parliament of a Local Government Bill and (ii) development district composite budgets in pilot districts. Status: A Local Government Bill was submitted to Parliament and passed in July, 2003 and gazetted on 31/12/2003. District composite budgets have been prepared in 3 pilot districts namely Dandme East, Dagme West and Akwapim North.
e. Education
Trigger 9: Increase girls’ enrolment in primary schools from 72% in 2000 to 74%.. Status: The target of 74% in Gross Primary Enrolment Ratio (GPER) for girls has already been exceeded. A GPER of 77.7% was recorded in 2003.
f. Health
Trigger 10: Increase the percentage of rural population with access to safe water from 40% in 2000 to 46%. Status: The indications are that 46% target has been exceeded. Rural population with access to safe water is now 46.38%. Trigger 11: Recurrent health expenditure at district and lower level governments have risen from 42 percent of the total recurrent health budget in 2000 to 45 percent. Status: . Total recurrent health expenditure at district and lower level as proportion of total government recurrent expenditure has reached 49.6 % in 2003.
g. Energy

138
Trigger 12: An automatic price adjustment mechanism has been put in place and implemented monthly to reflect changes in international market prices in local currency in the petroleum sector, and includes all taxes incorporated into the adjustment formula at end-March 2002. Status: . Price adjustment mechanism has been put in place in 2003 but has not been implemented. . Trigger 13: A strategy for full economic pricing in the electricity sector, including lifeline pricing to ensure affordability for low-income users in place. Status: A strategy has been put in place and implemented since August 2002. PSIA on electricity pricing in progress and awaiting draft report. Meanwhile, a lifeline protection measure has been instituted to protect low- income users. It is clear from the status on the triggers reported here the triggers that the government was expected to meet prior to reaching the HIPC completion point have, except for petroleum pricing, been fully met and in some cases gone the extra mile and the government needs to be applauded for these efforts. With these reported compliance with triggers it is fervently hoped that reaching the HIPC completion point is a matter of time.

139
Table 11.1Summary of progress on HIPC Triggers
Policy Area /HIPC Trigger
Indicator Status of indicator (2003)
Macroeconomic Stability Preparation of a full PRSP and
satisfactory implementation for at least one year as evidenced by the joint staff assessment of the country’s annual progress report
Preparation of a full PRSP and satisfactory implementation for at least one year
GPRS was finalised in February 2003 and the executive board consultation endorsed it in May 2003. The 2003 APR was completed in March 2004.
Macro-economic stability. Continued maintenance of macro-economic stability as evidenced by satisfactory implementation of the PRGF-supported programme.
Continued maintenance of macro-economic stability as evidenced by satisfactory implementation of the PRGF
Macroeconomic stability for 2003 has favourably been on track. A new 3-year PRGF was approved in May 2003 and the review completed in December 2003.
Use of budgetary savings in priority areas and monitored. Information published in time for an annual public hearing as an input to annual progress report on GPRS.
Use of budgetary savings in priority areas and monitored input to annual progress report on GPRS.
The budget savings have been used on poverty reduction expenditures. The information has been published in the 2004 Budget Statement and it served as an input in the 2003 Annual Progress report
18 Governance Procurement reform- New
procurement code established Regulatory and oversight body to
implement new procurement code established
Regulatory and oversight body put in place. Procurement Bill Passed by parliament and gazetted. The position of Chief Executive of the Secretariat has been advertised.
Internal audit. Operational internal audit capacity established through full staffing of existing internal audit positions
Full internal audit capacity established
Existing positions have been fully staffed
19 Public expenditure management
Government expenditure reports published
Reports on cash expenditures and commitments by MDAs published monthly in government gazette following implementation of new reporting system
New reporting system implemented and reports published in Gazette monthly.
Functioning Electronic expenditure tracking system
Electronic expenditure reporting system installed in MoFEP, CAGD, and at least two key sector ministries
Achieved- Ministry of Finance and Economic Planning (MOFEP) and Controller and Accountant General Department (CAGD) have established the system. Actions are being taken to complete installation by mid-2004 in three additional MDAs.
20 Decentralisation of government functions
Devolution of responsibilities to local districts
Devolution of responsibilities to local districts, as evidenced by (i) submission to Parliament of a Local Service Bill; (ii) development of district composite budgets in pilot districts
Local government service Bill submitted and passed in July 2003, gazetted, 31/12/03. Composite budget prepared in 3 districts
21 Education Increase girl’s enrolment in
primary schools Primary Gross enrolment rate for girls
increased from 72% in 2000 to 74% in 2004
Target for 2004 (74%) exceeded in 2003 which recorded 77.7%
22. Health Increase access to safe water in
rural areas The percentage of households with
access to safe water in rural areas increased from 40% in 2000 to 46% in 2004
Target exceeded: CWSA recorded 46.38.
Increase in health recurrent Share of health recurrent expenditures at Target exceeded.

140
expenditure at district and lower levels of government as percent of total recurrent health budget from 42 % in 2000 to 45 %.
district level increased to 49.5 % in 2003.
23. Energy Automatic price adjustment
mechanism in place and implemented
Phase out budget subsidies to petroleum sector
Adjustment mechanism has been put in place but is not being implemented.
A strategy for full economic pricing in the electricity sector, including lifeline pricing to ensure affordability for low income users
Reduce subsidies by 50 billion in 2003. Reduce system loss
Strategy has been put in place and life-line protection instituted

141
APPENDIX 2: STATUS REPORT ON PRSC2 TRIGGERS
The government negotiated the initial Poverty Reduction Support Credit (PRSC 1) in 2003. During the negotiation prior actions for PRSC 2 and PRSC 3 were also negotiated. These actions are captured in the Matrix below and the results of their implementation are noted. This review reveals a strong commitment on the part of government to ensure that most of the triggers are either fully met or action effectively on going. The matrix of triggers is under 3 main themes: Promoting growth, Income and employment; improving service delivery; and Improving Governance and Public Sector Management.
A. Improving Growth, Incomes and Employment The major triggers under this theme are in the areas of private sector credit and budget allocation, energy supply, trade facilitation and improving investment climate. Government effort to reduce domestic debt in order to free resources for funding growth and crowding-in the private sector is in progress. The outstanding stock of government securities has been reduced from 17% of GDP in 2002 to 16.1% in 2003. To provide protection for the poor while undertaking a rational expansion of energy services, government continued the extension of the lifeline concessionary support to the poor. Cabinet approved the Power Sector Reform programme and established a Secretariat to oversee implementation of the agreed 1st year actions. Phasing out the budget subsidies has been constrained by the rapid increase in petroleum prices and the risk of creating sudden shock by increases in petroleum prices. With respect to trade facilitation, government has worked hard to reduce clearance time at both the air and seaports. Similarly, sustained efforts are in progress to automate the Registrar-Generals Department to remove administrative barriers that tend to frustrate offshore investors. To achieve efficiency in public resource use government was required to ensure a good Public Expenditure Management regulatory framework. In fulfilment of this government passed the Financial Administration Bill and the Central Internal Audit Bill were passed into law in 2003. Budget formulation and execution processes were also considerably improved in the year. The linkage between the MTEF and the GPRS has been improved in the sense that the MDA objectives have been harmonized with the GPRS MTPs. Government budget allocation for poverty reduction in 2003 over that of 2002 increased by 27 %. Public education exercises were undertaken through the media and face-to-face interactions with the general public for purposes of increasing budget literacy and to democratise fiscal policymaking.
B. Improving Service Delivery
Promoting efficiency and equity financing of education and health with a focus on achieving greater poverty impact, received a boost in the year under review. The non-salary recurrent expenditure in education was increased to 91.1% and the Community Health Planning and Services (CHIPS) was extended to 47 zones raising the coverage to 20%.
C. Improving Governance and Public Sector Management
Government is also keeping to its commitment to ensure increased operational efficiency in key institutions dealing with governance and corruption. Major efforts in this direction include a) presentation of the Freedom of Information and Whistle Blower Bill to Cabinet b) commissioning

142
a Diagnostic study on Institutional mandates of anti-corruption agencies c) Passing of the Local Government Bill d) development of a Scheme of Service for local government staff and approving a National Decentralization Action Plan. All of the above changes are significant milestones in the achievement of the triggers in the PRSC 2. These are captured in the tables below.

14
3
T
able
11.
2
STA
TU
S O
F PO
VE
RT
Y R
ED
UC
TIO
N S
UPP
OR
T C
RE
DIT
2 IN
DIC
AT
OR
S A
ND
TR
IGG
ER
S
POL
ICY
OB
JEC
TIV
E
ME
ASU
RE/
AC
TIV
ITY
/TR
IGG
ER
S IN
DIC
ATO
R
IND
ICA
TOR
ST
AT
US
IN20
03
PRO
GR
ESS
Prom
otin
g G
row
th,
Inco
me
and
Empl
oym
ent
Incr
easi
ng sc
ope
for f
inan
cing
de
velo
pmen
t (pr
ivat
e se
ctor
cre
dit a
nd
budg
et a
lloca
tion
Impl
emen
t 200
3 do
mes
tic d
ebt r
educ
tion
to re
leas
e re
sour
ces f
or fu
ndin
g gr
owth
and
pov
erty
redu
cing
ac
tiviti
es
Out
stan
ding
stoc
k of
G
over
nmen
t Sec
uriti
es fe
ll fr
om 1
7% o
f GD
P in
200
2 to
16.
1% o
f GD
P in
200
3
On-
goin
g
Mai
ntai
n im
plem
enta
tion
of ta
riff
adju
stm
ent m
echa
nism
, with
life
-line
pr
otec
tion
for t
he p
oor
Laun
ch p
ower
sect
or re
form
and
impl
emen
t 1s
t yea
r agr
eed
actio
ns
Red
uce
subs
idie
s 50
billi
on in
200
3. R
educ
e sy
stem
loss
200
2 (a
ctua
l) 26
% 2
005
plan
ned)
22%
Con
sum
ers
with
in th
e lif
e lin
e th
resh
old
enjo
y co
nces
sion
ary
rate
On
track
Im
plem
enta
tion
on
sche
dule
Expa
nd su
pply
of e
nerg
y se
rvic
es e
cono
mic
ally
whi
le
prot
ectin
g th
e po
or
Mai
ntai
n im
plem
enta
tion
of a
utom
atic
pric
e ad
just
men
t mec
hani
sm to
kee
p se
ctor
vi
able
, whi
le p
rovi
ding
cro
ss-s
ubsi
diza
tion
in fa
vour
of t
he p
oor)
Phas
e ou
t bud
get s
ubsi
dies
to p
etro
leum
sect
or
2002
(act
ual)
2.9%
of G
DP
N
ot o
n tra
ck
Impr
ove
trad
e fa
cilit
atio
n
Rev
iew
targ
eted
are
as (c
argo
han
dlin
g,
stev
edor
ing,
etc
.) an
d de
velo
p an
im
plem
enta
tion
plan
to im
prov
e pe
rfor
man
ce
Incr
ease
d ex
port
In p
rogr
ess
R
educ
e le
ngth
of c
usto
m p
roce
dure
s by
exte
ndin
g G
CM
S/G
CN
et a
t Tak
orad
i and
Te
ma
ports
Cle
aran
ce ti
me
redu
ced
as fo
llow
s:
KIA
from
24h
rs to
2 h
rs
Tem
a an
d Ta
kora
di fr
om 2
day
s to
one
day
KIA
– 2
HR
S Te
ma
– 24
-48h
rs
Tako
radi
– in
tria
l pha
se
Impl
emen
ted
Impr
ove
the
Inve
stm
ent
Clim
ate
Impl
emen
t firs
t yea
r tra
nche
of a
ppro
ved
time-
boun
d im
plem
enta
tion
plan
to re
mov
e ke
y re
gula
tory
and
adm
inis
trativ
e ba
rrie
rs
Adm
inis
trativ
e ba
rrie
rs to
inve
stm
ents
rem
oved
A
utom
atio
n an
d co
mpu
teriz
atio
n of
Re
gist
rar’
s Gen
eral
s’ D
ept.
On-
goin
g

14
4
Impr
ove
rura
l sec
tor f
arm
and
non
-far
m
grow
th
Rev
iew
targ
et a
reas
(mar
ket a
cces
s, ex
tens
ion
serv
ices
, tec
hnol
ogy,
etc
.) to
upd
ate
an o
pera
tiona
l pl
an
Don
e O
n tra
ck
Impr
ovin
g pe
rfor
man
ce o
f ru
ral s
ecto
r in
inte
rest
of
rura
l poo
r
Fa
rmer
gat
e pr
ices
of c
ocoa
incr
ease
d to
69%
of
F.O
.B.
Coc
oa p
rice
incr
ease
d to
69
% o
f F.O
B
Don
e
Incr
ease
d ex
ports
of c
ash
crop
: Coc
oa
Expo
rt of
coc
oa in
crea
sed
by 1
1%
Goo
d pr
ogre
ss
Mod
erni
ze P
EM re
gula
tory
fr
amew
ork
Beg
in im
plem
enta
tion
of th
e Fi
nanc
ial
Adm
inis
tratio
n B
ill e
nact
ed b
y Pa
rliam
ent
and
tabl
e Ce
ntra
l Int
erna
l Aud
it A
genc
y B
ill
Th
e Fi
nanc
ial
Adm
inis
tratio
n B
ill w
as
pass
ed in
to L
aw a
t the
end
of
200
3
On
track
Stan
dard
ize
activ
ities
to si
mpl
ify th
e M
TEF
and
adop
t mea
sure
s to
alig
n fu
nctio
nal
clas
sific
atio
n of
bud
get w
ith G
FS
M
OE
& M
OH
lim
ited
thei
r ou
tput
con
side
rabl
y Li
nkag
e of
MTE
F an
d G
PRS
wer
e en
hanc
ed
as
the
budg
et
volu
mes
in
clud
ed
sum
mar
ies
of
MD
A
obje
ctiv
es
and
rela
ted
GPR
S M
TPs
and
expe
nditu
re
by
GPR
S th
emat
ic a
reas
, M
TPs
and
sour
ces
of fu
nd
St
reng
then
bud
get
form
ulat
ion
Furth
er in
crea
se, c
ompa
red
to 2
003
budg
et,
in p
over
ty re
duct
ion
budg
eted
exp
endi
ture
s as
shar
e of
dom
estic
ally
-fin
ance
d ex
pend
iture
s (in
clud
ing
HIP
C)
A
27%
incr
ease
in 2
004
over
200
3 bu
dget
in p
over
ty
redu
ctio
n ex
pend
iture
s
On
track
C
ondu
ct P
ER
PE
R w
as d
one
on th
e ro
ads
sect
or. D
ocum
ent i
s alm
ost
read
y fo
r prin
ting
On
track
Prep
are
mon
thly
(com
mitm
ent a
nd
expe
nditu
re) b
udge
t exe
cutio
n re
port
reco
ncile
d w
ith B
oG, w
ith n
o m
ore
than
8
wee
ks la
g
Mon
thly
repo
rts a
re su
bmitt
ed b
y C
AG
D w
ith n
o m
ore
than
8 w
eeks
M
onth
ly re
ports
are
su
bmitt
ed w
ith n
o m
ore
than
8 w
eeks
On
track
St
reng
then
bud
get e
xecu
tion
and
repo
rting
Expa
nd B
PEM
S to
cov
er 3
mai
n M
DA
s in
Acc
ra (E
duca
tion,
Hea
lth, a
nd R
oads
and
H
ighw
ays)
Im
plem
enta
tion
of a
bud
get
and
Publ
ic e
xpen
ditu
re
man
agem
ent s
yste
m in
M
FEP
and
CA
GD
co
ntin
ued

14
5
C
AG
D su
bmits
fina
l acc
ount
s and
fina
ncia
l st
atem
ents
for 2
003
to A
udito
r Gen
eral
w
ithin
stat
utor
y tim
efra
me
Redu
ce ti
me
lag
in
subm
issi
on o
f ann
ual a
udits
to
Par
liam
ent
Aud
itor-
Gen
eral
subm
its o
utst
andi
ng 2
002
audi
ted
acco
unts
for t
he C
onso
lidat
ed F
und
and
MD
A’s
Lette
r fro
m A
udito
r Gen
eral
of t
he G
hana
Aud
it Se
rvic
e su
bmitt
ing
D
isse
min
ate
budg
et in
form
atio
n in
si
mpl
ified
form
at to
bro
ader
aud
ienc
e (e
.g.
radi
o, p
amph
lets
, etc
.)
Pr
oduc
ed b
udge
t hig
hlig
hts
for t
he p
ress
Pr
inte
d in
the
Dai
ly G
raph
icPo
sted
on
the
inte
rnet
Re
gion
al P
eopl
es
Ass
embl
y w
as c
ondu
cted
A
n ex
hibi
tion
of B
udge
t w
as c
ondu
cted
for t
he
publ
ic a
t the
Foy
er o
f the
Pa
rliam
ent H
ouse
On
track
Impr
oved
ope
ratio
nal
effic
ienc
y of
key
inst
itutio
ns
deal
ing
with
Gov
erno
r an
d C
orru
ptio
n
Con
tinue
impl
emen
tatio
n of
act
iviti
es
aim
ed a
t red
ucin
g fr
aud
and
com
batin
g co
rrup
tion
(inc
ludi
ng a
dopt
ion
of F
reed
om
of In
form
atio
n B
ill)
Fina
l dra
ft of
Fre
edom
of I
nfor
mat
ion
Bill
pr
esen
ted
to C
abin
et
2. F
inal
Dra
ft of
Whi
stle
Blo
wer
Bill
pre
sent
ed to
C
abin
et
3. D
iagn
ostic
stu
dy o
n in
stitu
tiona
l man
date
s of
anti-
corr
uptio
n ag
enci
es c
omm
issi
oned
Revi
sion
of d
rafts
in
prog
ress
Re
visi
on o
f dra
fts in
pr
ogre
ss
Dra
ft Te
rms O
f R
efer
ence
Pre
pare
d Fo
r Fo
cus G
roup
Dis
cuss
ion
And
Rev
iew
On-
goin
g O
n-go
ing
On-
goin
g
Firs
t Yea
r edu
catio
n st
rate
gic
plan
im
plem
ente
d
Ach
ieve
d Im
prov
e ef
ficie
ncy
and
equi
ty o
f fin
anci
ng e
duca
tion
with
atte
ntio
n to
gre
ater
po
vert
y im
pact
Shar
e of
thre
e N
orth
ern
regi
ons i
n re
habi
litat
ion/
cons
truct
ion
of p
rimar
y cl
assr
oom
s in
crea
sed
from
20%
to 3
0% in
200
4
420
of 6
85 (6
1.3%
) of
clas
sroo
ms c
onst
ruct
ed in
3
Nor
ther
n R
egio
ns
Exce
eded
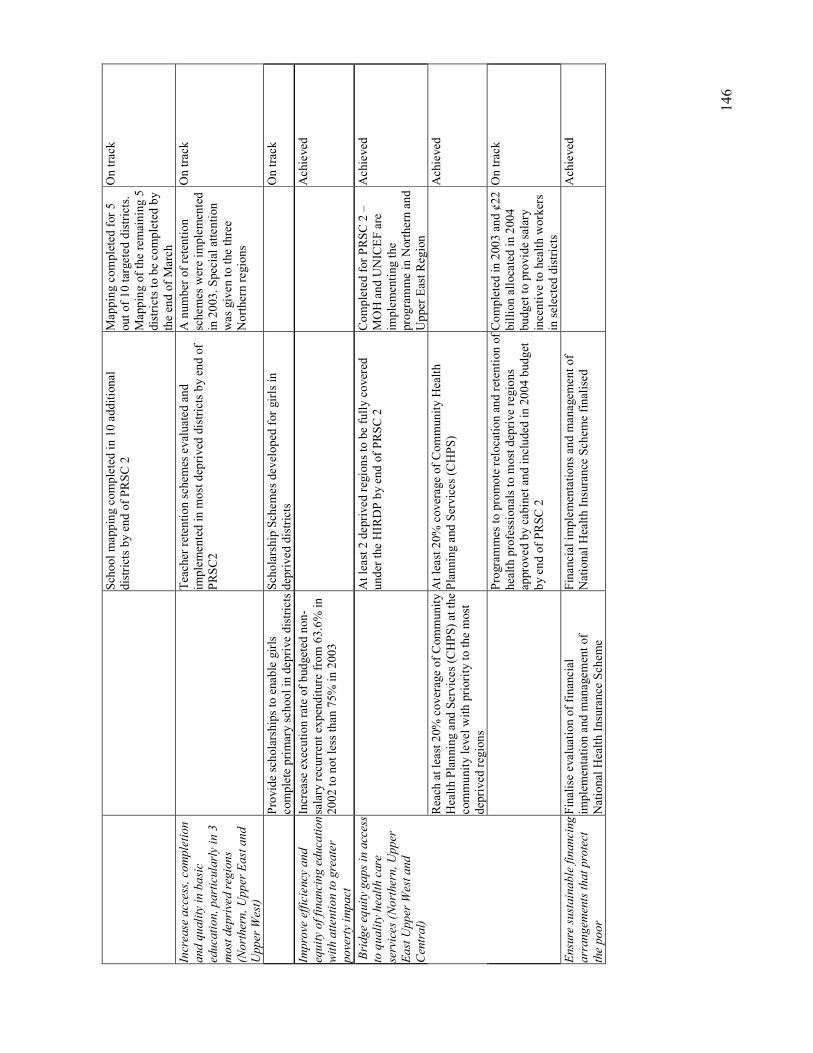
14
6
Scho
ol m
appi
ng c
ompl
eted
in 1
0 ad
ditio
nal
dist
ricts
by
end
of P
RSC
2
Map
ping
com
plet
ed fo
r 5
out o
f 10
targ
eted
dist
ricts
. M
appi
ng o
f the
rem
aini
ng 5
di
stric
ts to
be
com
plet
ed b
y th
e en
d of
Mar
ch
On
track
Incr
ease
acc
ess,
com
plet
ion
and
qual
ity in
bas
ic
educ
atio
n, p
artic
ular
ly in
3
mos
t dep
rived
regi
ons
(Nor
ther
n, U
pper
Eas
t and
U
pper
Wes
t)
Te
ache
r ret
entio
n sc
hem
es e
valu
ated
and
im
plem
ente
d in
mos
t dep
rived
dis
trict
s by
end
of
PRSC
2
A n
umbe
r of r
eten
tion
sche
mes
wer
e im
plem
ente
d in
200
3. S
peci
al a
ttent
ion
was
giv
en to
the
thre
e N
orth
ern
regi
ons
On
track
Pr
ovid
e sc
hola
rshi
ps to
ena
ble
girls
co
mpl
ete
prim
ary
scho
ol in
dep
rive
dist
ricts
Scho
lars
hip
Sche
mes
dev
elop
ed fo
r girl
s in
depr
ived
dis
trict
s
On
track
Impr
ove
effic
ienc
y an
d eq
uity
of f
inan
cing
edu
catio
n w
ith a
ttent
ion
to g
reat
er
pove
rty
impa
ct
Incr
ease
exe
cutio
n ra
te o
f bud
gete
d no
n-sa
lary
recu
rren
t exp
endi
ture
from
63.
6% in
20
02 to
not
less
than
75%
in 2
003
Ach
ieve
d
A
t lea
st 2
depr
ived
regi
ons t
o be
fully
cov
ered
un
der t
he H
IRD
P by
end
of P
RSC
2
Com
plet
ed fo
r PRS
C 2
– M
OH
and
UN
ICEF
are
im
plem
entin
g th
e pr
ogra
mm
e in
Nor
ther
n an
d U
pper
Eas
t Reg
ion
Ach
ieve
d
Rea
ch a
t lea
st 20
% c
over
age
of C
omm
unity
H
ealth
Pla
nnin
g an
d Se
rvic
es (C
HPS
) at t
he
com
mun
ity le
vel w
ith p
riorit
y to
the
mos
t de
priv
ed re
gion
s
At l
east
20%
cov
erag
e of
Com
mun
ity H
ealth
Pl
anni
ng a
nd S
ervi
ces (
CH
PS)
A
chie
ved
Bri
dge
equi
ty g
aps i
n ac
cess
to
qua
lity
heal
th c
are
serv
ices
(Nor
ther
n, U
pper
Ea
st U
pper
Wes
t and
C
entr
al)
Pr
ogra
mm
es to
pro
mot
e re
loca
tion
and
rete
ntio
n of
he
alth
pro
fess
iona
ls to
mos
t dep
rive
regi
ons
appr
oved
by
cabi
net a
nd in
clud
ed in
200
4 bu
dget
by
end
of P
RSC
2
Com
plet
ed in
200
3 an
d ¢2
2 bi
llion
allo
cate
d in
200
4 bu
dget
to p
rovi
de sa
lary
in
cent
ive
to h
ealth
wor
kers
in
sele
cted
dis
trict
s
On
track
Ensu
re su
stai
nabl
e fin
anci
ng
arra
ngem
ents
that
pro
tect
th
e po
or
Fina
lise
eval
uatio
n of
fina
ncia
l im
plem
enta
tion
and
man
agem
ent o
f N
atio
nal H
ealth
Insu
ranc
e Sc
hem
e
Fina
ncia
l im
plem
enta
tions
and
man
agem
ent o
f N
atio
nal H
ealth
Insu
ranc
e Sc
hem
e fin
alis
ed
A
chie
ved

14
7
M
oney
dis
burs
ed fo
r exe
mpt
ion
fee
incr
ease
d an
d ex
empt
ion
for m
ater
nal d
eliv
ery
intro
duce
d in
all
regi
ons
by e
nd o
f PR
SC 2
Incr
ease
d to
¢24
bill
ion.
¢1
7.2
billi
on w
as p
rovi
ded
as a
dditi
onal
mon
ey b
y G
over
nmen
t to
incr
ease
co
vera
ge to
the
depr
ived
N
orth
ern
and
Cent
ral
regi
ons
On
track
Ado
pt n
ew re
curr
ent e
xpen
ditu
re a
lloca
tion
form
ula
favo
urin
g m
ost d
epriv
ed re
gion
s
A
chie
ved
Redu
ce th
e sp
read
of t
he
HIV
/AID
S ep
idem
ic in
mos
t de
priv
ed re
gion
s
C
omm
unity
initi
ativ
es fo
r HIV
/AID
S in
itiat
ed in
de
priv
ed re
gion
s (3
Nor
ther
n an
d C
entra
l reg
ions
) 17
8 (2
6%) o
f CB
Os f
unde
d in
the
coun
try in
the
3 N
orth
ern
and
Cent
ral
Regi
ons
Ach
ieve
d
Beg
in im
plem
enta
tion
of th
e Lo
cal
Gov
ernm
ent S
ervi
ce B
ill e
nact
ed b
y Pa
rliam
ent
Loca
l Gov
ernm
ent B
ill P
asse
d Bi
ll pa
ssed
in Ju
ly 2
003
and
gaze
tted
31/1
2/03
O
n tra
ck
Dec
entr
alis
ed G
over
nmen
t
Cab
inet
app
rova
l of D
ecen
tralis
atio
n Im
plem
enta
tion
Act
ion
Plan
D
ecen
tralis
atio
n A
ctio
n Pl
an a
ppro
ved
O
n-go
ing
Subm
it to
Par
liam
ent A
nnua
l GPR
S Pr
ogre
ss R
epor
t
D
one
Impl
emen
t M&
E pl
an fo
r GPR
S 20
03 A
PR p
repa
ratio
n 20
03 A
PR u
nder
pr
epar
atio
n D
one
Com
plet
e C
WIQ
and
pub
lish
resu
lts
Publ
ishe
d C
WIQ
Res
ults
Don
e
Car
ry o
ut 3
PSI
As
4
PSIA
com
plet
ed
Targ
et e
xcee
ded
Stre
ngth
enin
g th
e ca
paci
ty
to m
onito
r and
eva
luat
e th
e
polic
y ag
enda
Com
plet
e (S
EA) a
nd id
entif
y ne
xt s
teps
Fi
nalis
e SE
A R
epor
t R
epor
t com
plet
ed
Don
e Im
prov
ing
perf
orm
ance
of
the
publ
ic se
ctor
C
abin
et is
sues
pol
icy
stat
emen
t on
PSR,
in
clud
ing
publ
ic se
ctor
pay
and
em
ploy
men
t with
a v
iew
to d
efin
e a
time-
boun
d re
vise
d re
form
pro
gram
me
PSR
to C
abin
et fo
r app
rova
l A
dvis
ory
Gro
up o
n PS
R
is in
the
proc
ess o
f su
bmitt
ing
refo
rm p
olic
y to
Cab
inet
for a
ppro
val
On
track
Fi
nalis
e ce
nsus
, upd
ate
payr
olls
. Est
ablis
h re
liabl
e da
ta b
ase
of p
ublic
sect
or
empl
oym
ent
Re
duct
ion
in n
umbe
r of
peop
le o
n pa
yrol
l by
400
peop
le
On
track

148
APPENDIX 3: STATUS REPORT ON MDBS 2004
Multi Donor Budget Support consists of assistance from development partners (DPs) to finance budgetary operations over the medium-term in support of the Ghana Poverty Reduction Strategy (GPRS). This form of direct budget support represents a shift from a sectoral, project-driven approach towards a more long-term development partnership based on budget support. The Government of Ghana signed a framework memorandum of understanding with nine Development Partners (the African Development Bank, Canada, Denmark, Germany, the European Union, the Netherlands, Switzerland, the UK, and the World Bank). For the first year of operation (2003) the budget support with funding commitments from DP’s totalled 232.6 million euros. The total pledges for 2003 represent 11% of the total government expenditures including interest payments or 40% of ODA. From the perspective of the GoG, the benefits of the MDBS are:
The reduction of transaction costs associated with ODA, particularly those transaction costs arising from meeting the conditions attached to flows of ODA;
Increased predictability of ODA flows, allowing for better long-term planning; Increased institutional capability; and Increased democratic accountability to its electorate. Institutionalised strategic policy dialogue. Increased local ownership to the programme since the GPRS represents a Government-led
process and document For the development partners, MDBS is a key tool for supporting the implementation of the GPRS by strengthening the institutional environment in which GPRS is implemented and by emphasising the importance of public financial management, public sector reform and governance issues.
The budget support is staggered in two tranches. The first tranche, or “base payment” is payable following a positive IMF review. The payment of the second tranche, or “performance payment” depends on the outcome of a progress assessment on five key areas of reform:
Public finance management (PFM),
The budget process,
Decentralisation,
Public sector reform and
Governance.
The status of the various policy measures and indicators on the five key areas of reform as indicated above have been summarised in the Table below. As indicated in the Table the government met all the triggers.

149
Tab
le 1
1.3
PO
LIC
Y M
AT
RIX
: MD
BS
TR
IGG
ER
S A
ND
TA
RG
ET
S
Polic
y O
bjec
tive
M
easu
re/A
ctiv
ity/ T
rigg
ers
Indi
cato
r In
dica
tor
Stat
us
PAR
T 1
: IM
PRO
VIN
G G
OV
ER
NA
NC
E
A
ND
PU
BL
IC S
EC
TO
R M
GT
Lo
cal
Gov
t Se
rvic
e B
ill l
aid
befo
re
Parli
amen
t
Dat
e of
gaz
ette
not
ifica
tion
Loca
l Gov
t Ser
vice
Bill
pa
ssed
by
Parli
amen
t on
Mar
ch 1
4 20
03
1.1
Est
ablis
hmen
t of a
dec
entr
aliz
atio
n
pol
icy
fram
ewor
k to
impr
ove
serv
ice
d
eliv
ery
Dec
entra
lize
Gov
ernm
ent
Com
plet
ed c
ompr
ehen
sive
Act
ion
Plan
for D
ecen
traliz
atio
n (in
clud
ing
fisca
l ref
orm
) be
subm
itted
to
Cab
inet
Cab
inet
en
dors
emen
t of
N
atio
nal
Dec
entra
lizat
ion
Act
ion
Plan
as t
he st
rate
gic
docu
men
t for
furth
er
dece
ntra
lizat
ion
refo
rms a
nd
impl
emen
tatio
n co
mm
ence
d
ND
AP
was
pre
pare
d an
d pr
esen
ted
to D
Ps
and
a jo
int r
espo
nse
from
DPs
subm
itted
to
GoG
N
DA
P be
ing
revi
sed
for
subm
issi
on to
cab
inet
fo
r its
end
orse
men
t.
ND
PC M
&E
stud
y re
port
Zero
Dra
ft of
the
impl
emen
tatio
n of
the
GPR
S
MTD
P ha
ve b
een
prep
ared
and
in
com
plia
nce
with
GPR
S
Tran
slat
e G
PRS
prio
ritie
s int
o pl
ans a
nd
budg
ets a
t Dis
trict
leve
ls
Med
ium
Ter
m D
evel
opm
ent P
lans
an
d A
nnua
l Dis
trict
Act
ion
Plan
s to
be in
com
plia
nce
with
GPR
S gu
idel
ines
& p
riorit
ies
Pilo
t dis
trict
com
posi
te
budg
et in
3 d
istri
cts
Com
posi
te B
udge
t in
itiat
ed in
3 d
istri
cts
and
St
rate
gic
plan
dev
elop
ed

150
Polic
y O
bjec
tive
M
easu
re/A
ctiv
ity/ T
rigg
ers
In
dica
tor
Indi
cato
r St
atus
Im
prov
ing
Perf
orm
ance
of P
ublic
Sec
tor
Cab
inet
issu
es a
pol
icy
stat
emen
t on
a re
focu
sed
Publ
ic S
ecto
r Ref
orm
, in
clud
ing
Publ
ic S
ecto
r Pay
and
Em
ploy
men
t, to
def
ine
a tim
e bo
und
refo
rm p
rogr
amm
e to
impr
ove
gove
rnan
ce a
nd se
rvic
e de
liver
y at
na
tiona
l and
loca
l Le
vels
.
Cab
inet
Pol
icy
Stat
emen
t
Publ
ic S
ecto
r Stra
tegy
se
nt to
Cab
inet
Impl
emen
t a re
focu
sed
Publ
ic S
ecto
r R
efor
ms
Im
prov
e ex
tern
al a
nd in
tern
al A
uditi
ng
cont
rol
Red
uced
tim
e la
g in
the
subm
issi
on
of a
nnua
l aud
its to
Par
liam
ent
Aud
itor G
ener
al su
bmits
20
02 a
udite
d ac
coun
ts fo
r th
e C
onso
lidat
ed F
und
and
MD
As
Aud
it re
ports
in
prog
ress
Fina
l Dra
ft of
Fre
edom
of
Info
rmat
ion
Bill
pre
sent
ed
to C
abin
et
Rev
isio
n of
Dra
ft in
pr
ogre
ss
Impr
oved
ope
ratio
nal e
ffic
ienc
y of
Key
in
stitu
tions
dea
ling
with
Gov
erna
nce
and
Cor
rupt
ion
Con
tinue
impl
emen
tatio
n of
ac
tiviti
es a
imed
at r
educ
ing
frau
d an
d co
mba
ting
corr
uptio
n
Fina
l Dra
ft of
Whi
stle
B
low
er B
ill p
rese
nted
to
Cab
inet
Rev
isio
n of
Dra
ft in
pr
ogre
ss
Stre
ngth
enin
g T
he C
apac
ity to
Mon
itor
and
eval
uate
the
Polic
y ag
enda
R
egul
ar M
& E
of G
PRS
impl
emen
tatio
n
Impl
emen
t M
&E
plan
for
GPR
S as
ev
iden
ced
by
timel
y an
d pu
blic
di
ssem
inat
ion
of
2003
an
nual
pr
ogre
ss re
port
Dis
sem
inat
ion
of o
ther
A
nnua
l Pro
gres
s Rep
ort
2002
2002
APR
dis
sem
inat
ed

151
Polic
y O
bjec
tive
M
easu
re/A
ctiv
ity/ T
rigg
ers
In
dica
tor
Indi
cato
r St
atus
Fu
rther
incr
ease
, com
pare
d to
200
3 bu
dget
in p
over
ty re
duct
ion
budg
eted
exp
endi
ture
s as s
hare
of
dom
estic
ally
fina
nced
exp
endi
ture
s (in
clud
ing
HIP
C)
20
04
Bud
get
Stat
emen
t sh
ows
real
in
crea
se
in
pove
rty
redu
ctio
n bu
dget
ed e
xpen
ditu
res
as
shar
e of
do
mes
tical
ly
finan
ced
expe
nditu
res
Stre
ngth
enin
g Pu
blic
Exp
endi
ture
M
anag
emen
t
S
treng
then
Bud
get E
xecu
tion
and
Rep
ortin
g fo
rmul
atio
n
Prep
are
mon
thly
bud
get e
xecu
tion
Rep
orts
(C
omm
itmen
ts a
nd
Expe
nditu
res)
R
econ
cile
d w
ith B
oG w
ith n
o m
ore
than
8 w
eeks
lag
Mon
thly
repo
rts su
bmitt
ed
by C
AG
D w
ith n
o m
ore
than
8 w
eeks
lag
.
Mon
thly
repo
rts a
re
subm
itted
with
no
mor
e th
an 8
wee
ks la
g
Tran
spar
ency
and
val
ue fo
r Mon
ey In
Pub
lic
Expe
nditu
re
Im
plem
enta
tion
com
men
ced
as e
vide
nced
by
: (1
) Est
ablis
hmen
t of
publ
ic p
rocu
rem
ent b
oard
(P
PB) a
nd se
cret
aria
t. (2
) Est
ablis
hmen
t of E
ntity
Te
nder
com
mitt
ees a
nd
Rev
iew
Ten
der B
oard
s
Beg
in im
plem
enta
tion
of th
e ne
w
Proc
urem
ent B
ill e
nact
ed b
y Pa
rliam
ent B
y es
tabl
ishi
ng a
nd
mak
ing
oper
atio
nal P
ublic
Pr
ocur
emen
t ins
titut
ions

152
Polic
y O
bjec
tive
M
easu
re/A
ctiv
ity/ T
rigg
ers
In
dica
tor
Indi
cato
r St
atus
PA
RT
2: P
RO
MO
TIN
G G
RO
WT
H,
IN
CO
ME
& E
MPL
OY
ME
NT
Im
prov
ing
the
Env
iron
men
t for
Bus
ines
s W
hile
pro
tect
ing
the
Poor
Expa
nd th
e su
pply
of e
nerg
y se
rvic
e
e
cono
mic
ally
whi
le p
rote
ctin
g th
e
P
oor
Gov
ernm
ent t
o co
ntin
ue w
ith
impl
emen
tatio
n of
ene
rgy
sect
or
refo
rms p
revi
ousl
y ap
prov
ed b
y C
abin
et
A
ccel
erat
e th
e pr
ogra
mm
es
for D
ereg
ulat
ion
of th
e pe
trole
um se
ctor
Sust
ain
incr
emen
tal e
ffor
ts
at a
chie
ving
and
mai
ntai
ning
fu
ll co
st
reco
very
in u
tility
pric
ing
as
wel
l as i
mpr
ovin
g th
e ef
ficie
ncy
of u
tility
co
mpa
nies
.
Pric
ing
form
ulas
for e
lect
ricity
and
w
ater
to c
ontin
ue to
be
adm
inis
tere
d by
the
Publ
ic U
tiliti
es R
egul
ator
y C
omm
issi
on (P
UR
C)
Func
tiona
l Nat
iona
l D
ereg
ulat
ion
Com
mitt
ee in
pl
ace
Nat
iona
l Der
egul
atio
n C
omm
ittee
has
bee
n fo
rmed
to o
vers
ee th
e de
regu
latio
n pr
oces
s In
pro
gres
s
Im
prov
e th
e In
vest
men
t Clim
ate
App
rova
l by
Cab
inet
of M
ediu
m-
Term
Sec
tor D
evel
opm
ent S
trate
gy
with
Act
ion
Plan
and
Mon
itorin
g an
d Ev
alua
tion
Mat
rix.
App
rove
d M
ediu
m T
erm
N
atio
nal P
rivat
e Se
ctor
D
evel
opm
ent S
trate
gy fo
r im
plem
enta
tion
Fina
l Dra
ft su
bmitt
ed to
go
vern
men
t on
29th
Dec
20
03, r
ecei
ved
Cab
inet
ap
prov
al o
n 29
th Ja
n 20
04
and
expe
cted
to b
e la
unch
ed b
y en
d of
Mar
ch
2004

153
Polic
y O
bjec
tive
M
easu
re/A
ctiv
ity/ T
rigg
ers
In
dica
tor
Indi
cato
r St
atus
B
egin
im
plem
enta
tion
of M
OFA
St
rate
gic
Plan
, co
sted
with
cle
ar
links
to G
PRS
targ
ets
St
rate
gic
Plan
In p
lace
for
impl
emen
tatio
n
M
OFA
s stra
tegi
c pl
an 2
003
– 20
05 h
as b
een
prep
ared
and
di
strib
uted
. The
cos
t tab
les a
re
bein
g re
view
ed fo
r 200
4 –
2006
Impr
ovin
g pe
rfor
man
ce o
f ru
ral s
ecto
r in
inte
rest
of R
ural
po
or
Impr
ove
rura
l se
ctor
Fa
rm
and
Non
-Far
m g
row
th
Impr
oved
Fee
der a
nd T
runk
Roa
d C
ondi
tion
Mix
Inde
x 20
02(F
eede
r) 2
003(
Feed
er)
Goo
d -
33%
36%
Fa
ir
19
%
26
%
Poor
48%
38%
20
02(T
runk
)
20
03(T
runk
) G
ood
2
6%
29
%
Fair
27%
30%
Po
or
47
%
4
0%
Fe
eder
road
s im
prov
ed a
nd
Trun
k ro
ads d
eter
iora
ting

154
Polic
y O
bjec
tive
M
easu
re/A
ctiv
ity/ T
rigg
ers
In
dica
tor
Indi
cato
r St
atus
PA
RT
3: I
MPR
OV
ING
SE
RV
ICE
DE
LIV
ER
Y
FOR
H
UM
AN
D
EV
T.
Edu
catio
n
I
ncre
ase
acce
ss, c
ompl
etio
n an
d Q
ualit
y
in
Bas
ic E
duca
tion,
Par
ticul
arly
in th
e
thre
e m
ost d
epriv
ed re
gion
s (N
orth
ern,
U
pper
Eas
t and
Upp
er W
est)
Impr
oved
G
ross
Pr
imar
y En
rolm
ent
ratio
in
m
ost
Dep
rived
re
gion
s in
20
03/2
004
com
pare
d to
Pre
viou
s yea
rs
G
PER
incr
ease
d in
the
3 m
ost
depr
ived
regi
ons:
Nor
ther
n: 6
2% to
70%
Upp
er E
ast:
70%
to 7
9%
U
pper
Wes
t: 56
% to
63%
(2
003)
N
R: 6
7.7
UE:
72.
2 U
W: 6
9.6
NR
& U
ER w
ere
on
track
but
UW
R
exce
eded
the
targ
et
Hea
lth
En
sure
sust
aina
ble
finan
cing
ar
rang
emen
ts
th
at p
rote
cts t
he P
oor.
Impr
ove
mat
erna
l
hea
lth
I
mpr
ove
Mat
erna
l Hea
lth
Incr
ease
the
pro
porti
on o
f su
perv
ised
de
liver
ies f
or u
nder
-ser
ved
regi
ons
Prop
ortio
n of
su
perv
ised
de
liver
ies
grea
ter
in 2
003
than
20
02
figur
es
in
unde
rser
ved
regi
ons
(Nor
ther
n,
Upp
er
East
, U
pper
Wes
t, C
entra
l) 20
02 B
asel
ines
: CR
: 40
NR
: 11.
1
U
E: 2
2.1
UW
: 16.
1
(200
3)
CR
: 38.
4 N
R: 1
8.3
UE:
27.
8 U
W: 3
3.3
NR
, UER
and
UW
R
wer
e on
trac
k bu
t it
redu
ced
for C
R.
R
educ
e-St
abili
se th
e sp
read
of t
he
H
IV/A
IDS
epid
emic
in m
ost d
epriv
ed
re
gion
s.
Join
t Rev
iew
of G
oG re
spon
se to
pa
ndem
ic fi
naliz
ed a
nd k
ey
reco
mm
enda
tions
ado
pted
with
the
aim
of
ens
urin
g ef
fect
ive
Impl
emen
tatio
n an
d ac
hiev
emen
t of
th
e 5
expe
cted
out
com
es o
f the
Gha
na
Ado
ptio
n of
joi
nt r
evie
w r
epor
t by
key
org
aniz
atio
ns o
f th
e m
ain
reco
mm
enda
tion
Not
com
plet
ed a
t the
tim
e of
the
repo
rt.
Star
ted
in M
arch
200
4,
Sche
dule
d to
be
com
plet
ed in
Apr
il 20
04

155
APPENDIX 4: SUMMARY REPORT OF THE POVERTY & SOCIAL
IMPACT ANALYSIS (PSIA) STUDIES
The Ghana Government, through the National Development Planning Commission (NDPC), with the support of Development Partners commissioned five Poverty & Social Impact Analysis (PSIA) studies to assess the impacts of specific policy reforms carried out under the GPRS on different stakeholders, especially the poor, the vulnerable and the excluded and to recommend the needed policy actions to address any negative impacts. The PSIA tools are used to analyse and determine the distributional impacts and outcomes on welfare as a result of the new policy reforms. These studies are meant to assess impact of the GPRS implementation of the GPRS and where necessary to recommend policy re-design. It is hoped that the publication and dissemination of the results of the PSIAs will provoke public debate on policies. The summaries of objectives, findings, conclusions, and policy recommendations of four out of five PSIA studies that have been completed are summarized below. The recommendations are those of the researchers and not necessarily endorsed by the NDPC or for that matter the Government of Ghana or the donors that funded the study.
4.1 PSIA on Tackling Vulnerability and Exclusion in Ghana
Objectives of the Study • To find out the nature and extent of vulnerability and social exclusion in Ghana and identify
factors that enhance vulnerability. • To find out the determinants (conditions, events, and other underlying trends) that present risks
to individuals or groups and households (social groups, age groups etc.) and exclude them from effective participation in mainstream economic, social and political activities
• To deepen the understanding of coping mechanisms and strategies of the vulnerable when risks
materialise and how these could be strengthened and enhanced
Findings • Firstly the study found that ‘poverty’ is multi-faceted and therefore a definition of poverty
\should go beyond basic needs (food, clothing and shelter) to encompass access to education, health, and information. The study also found that the denial of rights, inability to exact accountability, lack of opportunity to participate, lack of access to resources and other institutional barriers contribute to vulnerability, to poverty, and to social exclusion.
• Secondly the study identified small-scale farmers as the leading vulnerable group in the country
due to multiple risks (economic, social, and health risks) that can spiral them down into extreme poverty. Their fate has been exacerbated by two decades of SAP that collapsed the rural agricultural economy and rendered them uncompetitive in the new market economy. The study also established a link between gender and poverty; and that rural farmers who are mainly women are the poorest in society.
• Thirdly that the 5.2% growth of the economy in 2003 was predicated on economic indicators
and did not have a ‘trickle-down effect’. This is supported by the increase in the percentage of people who fall in the first poverty quintile to 19%.

156
• Fourthly the study found that coping strategies adopted by the vulnerable includes: sale of
assets, reducing the quality and quantity food intake, recourse to migration, and child labour. These mechanisms however depended on the variety of assets and services available.
Conclusions and Policy Recommendations • The study recommends the need for a clear definition of vulnerability & exclusion so that
policy decisions and interventions can be well targeted and the results can be monitored and measured.
• Due to the multi-dimensional, cross-cutting, and dynamic nature of vulnerability, exclusion and poverty, the GPRS review should emphasis sectoral linkages to help reach consensus on a set of indicators on vulnerability.
4.2 PSIA on Energy Sector Reform In Ghana: Electricity Tariffs Objectives of the Study • Implications and effectiveness of current subsidy schemes to protect the poor • Effects of recent tariff increases on residential consumers including changes in the mix of fuels
being consumed by different customer groups. • To assess the affordability of current tariffs and the sustainability of cross-subsidies • To propose key indicators for monitoring the poverty impact of the energy sector reform
programme Findings • The study found that electricity tariffs lag behind cost of production which gap is to be filled
through transition to full cost-recovery. • That the lifeline programme assumes individual meter users and so shared household meters
and pre-paid meters make the policy ineffective and poor people adopt various coping mechanisms. That there is also no consensus among stakeholders as to how to reform the lifeline policy so that the poor actually benefit.
• That the issue of shared meters results in a lot of dynamics between landlords and tenants and adds to the arbitrariness of the distributional impacts of tariffs which leads to the conclusion that the lifeline tariffs do not target the poor.
• That increase in tariffs does not result in increases of revenue for the utility companies because of inefficiency in the system and low collection rates.
Conclusions and Policy Implications • That in spite of lifeline policy of government, the poor do not have access to electricity.
Consumers complain of high and increasing prices for electricity even though they have not changed their consumption behaviours. This calls for communication and education of so that there is clear understanding as to why bills go up.
• That ability and willingness to pay are dependent on other factors besides income level and therefore these factors need to be considered in policy decisions on appropriateness of existing tariffs for each band of consumers.

157
4.3 PSIA on Enhancing Capacity for Pro-Poor Decentralization The vision of Ghana’s decentralisation in the GPRS is to promote a governance system that is responsible and accountable to the extent that it allows for effective participation, equity in resource allocation and effective delivery of services to the poor. Objectives of the Study • To provide in-depth understanding of the impact of policy reforms and public actions for
enhancing pro-poor decentralization with regard to the core aspects of resource mobilization, management and allocation at the district level and the capacity constraints in delivering pro-poor services on social and poverty outcomes, and
• How alternative policy measures and reforms will affect the impact on target groups • What are the impacts of increased resource availability at the district level on the local
economy and social development? • Are decentralization measures designed to improve poverty reduction strategies at the local
level • To what extent capacity constraints influence the decentralised local government system in
terms of services that support the implementation of the GPRS • To what extent the proposed and implemented schemes for building capacity within local
government are appropriate to respond to possible capacity constraints Findings • The study found that District Assemblies (DAs) do not have the capacities (in quality and
quantity) needed to execute their administrative, legislative and executive functions. • The main activity of the poor local population is agriculture and 77% of them are not aware of
their DAs giving an indication of the low participation in governance. The study finds that poor people have a negative perception of decentralisation.
• There are no local organisations that can to give impetus to participation of local people in development planning or choices
• The study examined the income levels of poor people and found that they do not have adequate income resulting in the adoption of coping mechanisms to provide for basic needs.
Conclusions and Policy Implications • It is necessary to mount programmes to educate local people to be aware of decentralisation
and its benefits. • The lack of coordination and cooperation among sectors at the district level. Policy decisions
should therefore focus on how to resolve this institutional and administrative entanglement since they affect the effective execution of development programmes and projects.
• Policy decision should examine the implement the preference of a majority view that DCEs should be elected. In the interim the accountability mechanisms at the DAs should be strengthened.
• The earlier policy consideration to increase the DACF from 5% to 7.5% should be implemented to increase resources at the local level.
• That pro-poor decentralisation is not just improvement of proximity to government services (creation of more districts) but should encourage strong participation of poor people and local groups and associations; policy decision makers should therefore steer in this direction.

158
4.4 PSIA on Economic Transformation of the Agricultural Sector Objectives • The extent to which the Economic Transformation of the Agricultural Sector will compound or
mitigate the constraints facing smallholder / subsistence farmers • Trade-offs between production-oriented and poverty-oriented agricultural policies allows for
poor farmers to access and benefit from mechanisms to increase production • How food policies impact on food security and vulnerability • Whether guidelines for the allocation of HIPC funds are sufficient to meet aims of growth and
poverty reduction Findings The term Modernization of Agriculture is one of the areas targeted in the GPRS. The concept of agriculture modernisation is taken to mean the process of transforming the traditional agriculture into a commercial venture using technologies and practices that maximise outputs and production and minimize damage to assets and human health. The study found that: • Smallholder peasant farmers are dominant in Ghana’s agriculture sector and therefore
agriculture modernisation policies targeting them will have widespread coverage. • For smallholder farmers to take advantage of the business environment created for their benefit,
they need education on the operation of small-businesses. • Policies should be focus on those that have multiple impacts. Agriculture policies should aim at
those that use technology to increase both employment and output. • That polices that aim at small increases in output by the smallholder farmers are better than
those that aim at large increases in output for large commercial farmers Impact of agriculture modernisation policies directed at commercial farmers has a sporadic effect on the poor.
• That pro-poor agriculture modernisation polices are better at reducing poverty than pro-growth polices.
• That agriculture modernisation policy has indirect impacts like creating employment opportunities, and price stability.
• Policies that are pro-poor policies rather than pro-growth are more beneficial to poor farmers Conclusions and Policy Implications • Given the dominance of smallholder farmers in Ghana, the study recommends the formation of
farmer-based organisations (FBOs) to ensure easy accessibility to services and incentive packages and to participate in policy formulation.
• Policy should make it possible for smallholder farmers to acquire the knowledge and tools necessary to benefit from the environments that are conducive.
• Policies that are pro-poor rather than pro-growth are more beneficial to poor farmers • Agriculture modernisation policy framework should be re-examined to make them more pro-
poor. This will expand participation of small farmers, improve access to goods services and other incentive packages meant for their benefit, and therefore enhance poverty reduction
4.5 Common Issues from the PSIA Studies There are some common issues that may be discerned from the PSIA studies conducted which need to be addressed by policy decision makers.

159
• That there are unclear definitions of concepts and terms (e.g. poverty, vulnerability etc.) • That poor people are mainly in the rural communities and are to a large extent people who
are subsistence, smallholder, and peasant farmers the majority of whom are women. • That poor people lack access to basic needs including information and knowledge. They
are not aware of policies meant for their benefit and do not participate in them. • That poor people sometimes adopt certain coping strategies to mitigate poverty including
borrowing, sale of assets, pulling children out of school, and sending them into child labour. • That there is lack of capacity and other resource constraints at the DA level. This together
with the lack of accountability, coordination, and institutional rivalry hamper the delivery of services to the poor.
• That poverty reduction will be enhanced by adopting pro-poor policies rather than pro-growth policies. That there should be proper targeting of policies to the poor to avoid or reduce leakages.