gevo– january 2021
TRANSCRIPT
October 2021
Beyond Net-ZeroPat Gruber, CEO
Any statements in this presentation about our future expectations, projections, estimates, plans, outlook and prospects, and other statements containing the words “believes,” “anticipates,” “plans,” “estimates,” “expects,” “intends,” “may” and similar expressions, constitute forward-looking statements within the meaning of The Private Securities Litigation Reform Act of 1995. Actual results may differ materially from those indicated by such forward-looking statements as a result of various important factors, including risks relating to: our Net-Zero 1 Project and other projects; our financial projections concerning our Net-Zero 1 Project, including, but not limited to, capital costs, project revenue, Project EBITDA, levered internal rates ofreturn and projected cash distributions; the status of the engineering work for our Net-Zero 1 Project; our growth plans and strategies; our technologies; our ability to obtain and maintain certifications related to our products; our ability to enter into additional contracts to sell our products; the status of our contract discussions and negotiations; memoranda of understanding, discussions and negotiations relating to potential projects; our projected revenues or sales; our ability to perform under current or future contracts; our ability to become profitable; our ability to finance our Net-Zero Projects; and other factors discussed in the “Risk Factors” of our most recent Annual Report on Form 10-K for the fiscal year ended December 31, 2020 and in other filings that we periodically make with the Securities and Exchange Commission. In addition, the forward-looking statements included in this investor presentation represent our views as of the date of this investor presentation. Important factors could cause our actual results to differ materially from those indicated or implied by forward-looking statements, and as such we anticipate that subsequent events and developments will cause our views to change. However, while we may elect to update these forward-looking statements at some point in the future, we specifically disclaim any obligation to do so. These forward-looking statements should not be relied upon as representing our views as of any date subsequent to the date of this investor presentation.
2
FORWARD LOOKING STATEMENTS

“Make the World A Better Place By Improving the Standard of Living For All People”
Whitney McMillan, Chairman of Cargill, 1989 to a group of new employees that included me
3

Gaining Perspective and Framing the Problem

5
KEY ISSUES TO CONSIDER
Food and Nutrition
Clean Water
Sanitation
Clothing
EnergyHeatingCooking
Food StorageTransportation
Production of GoodsServices
Pollutants
Human Health
Greenhouse Gasses

6
LOTS OF INTERRELATIONSHIPS
Food and Nutrition
Clean Water
Sanitation
Clothing
EnergyHeatingCooking
Food StorageTransportation
Production of GoodsServices
Pollutants
Human Health
Greenhouse Gasses

7
GAINING PERSPECTIVE: 73% OF GLOBAL GHG EMISSIONS COME FROM THE BURNING OF FOSSIL FUELS
Source: OurWorldinData.org

IN THE US: ELECTRICITY, TRANSPORTATION, AND INDUSTRY NEED TO BEPRIMARY TARGETS FOR GHG REDUCTION—WE NEED TO REPOWER (FASTER)
8Source: https://cfpub.epa.gov/ghgdata/inventoryexplorer/
Industry: 50% of this Industry GHG’s is due to burning fossil fuel. Can be eliminated with renewable energy
Transportation: Can be eliminated with renewable energy (electricity, green hydrogen, RNG and hydrocarbons)
Electricity: Can be eliminated with wind, solar, CHP of renewables like RNG, (and nuclear?)
Agriculture: Can be improved with soil management, reduced chemical inputs, and lower carbon fertilizers
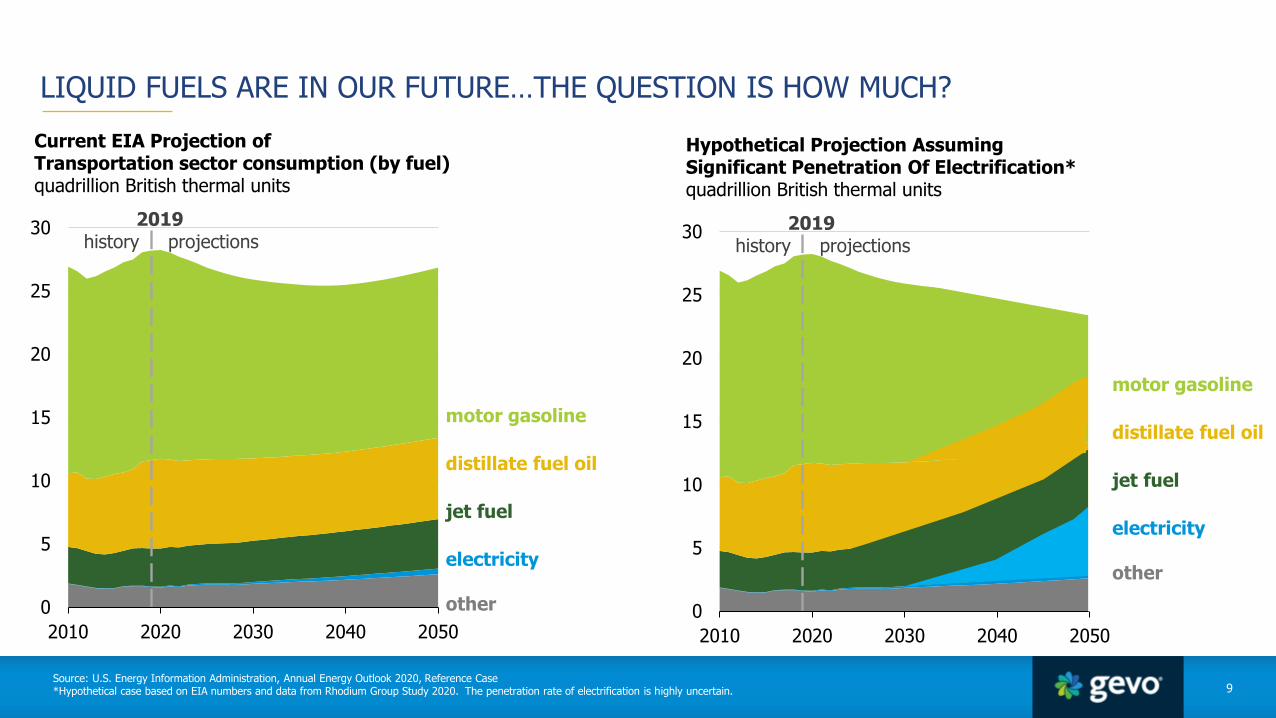
LIQUID FUELS ARE IN OUR FUTURE…THE QUESTION IS HOW MUCH?
9Source: U.S. Energy Information Administration, Annual Energy Outlook 2020, Reference Case*Hypothetical case based on EIA numbers and data from Rhodium Group Study 2020. The penetration rate of electrification is highly uncertain.
0
5
10
15
20
25
30
2010 2020 2030 2040 2050
Current EIA Projection ofTransportation sector consumption (by fuel)quadrillion British thermal units
2019history projections
motor gasoline
distillate fuel oil
jet fuel
electricity
other 0
5
10
15
20
25
30
2010 2020 2030 2040 2050
Hypothetical Projection AssumingSignificant Penetration Of Electrification*quadrillion British thermal units
2019history projections
motor gasoline
distillate fuel oil
jet fuel
electricity
other

10
(1) Source: BP Energy Outlook 2020. Reflects Business-as-usual scenario.(2) Based on BP Energy Outlook 2020. Net Zero scenario assumes that global carbon emissions fall by over 95% by 2050 broadly in line with a range of scenarios limiting temperature rise to 1.5 degrees Celsius. Net Zero
assumes EV adoption rate of 80%+ and renewable energy share of ~59% by 2050E. Based on Project Net-Zero 1 planned capacity.
ENORMOUS TOTAL ADDRESSABLE MARKET
Even with the most optimistic projections of the adoption of EV, fuel cells, etc., the need for hydrocarbons will still be
very large.
We should de-fossilize the remaining gallons

11
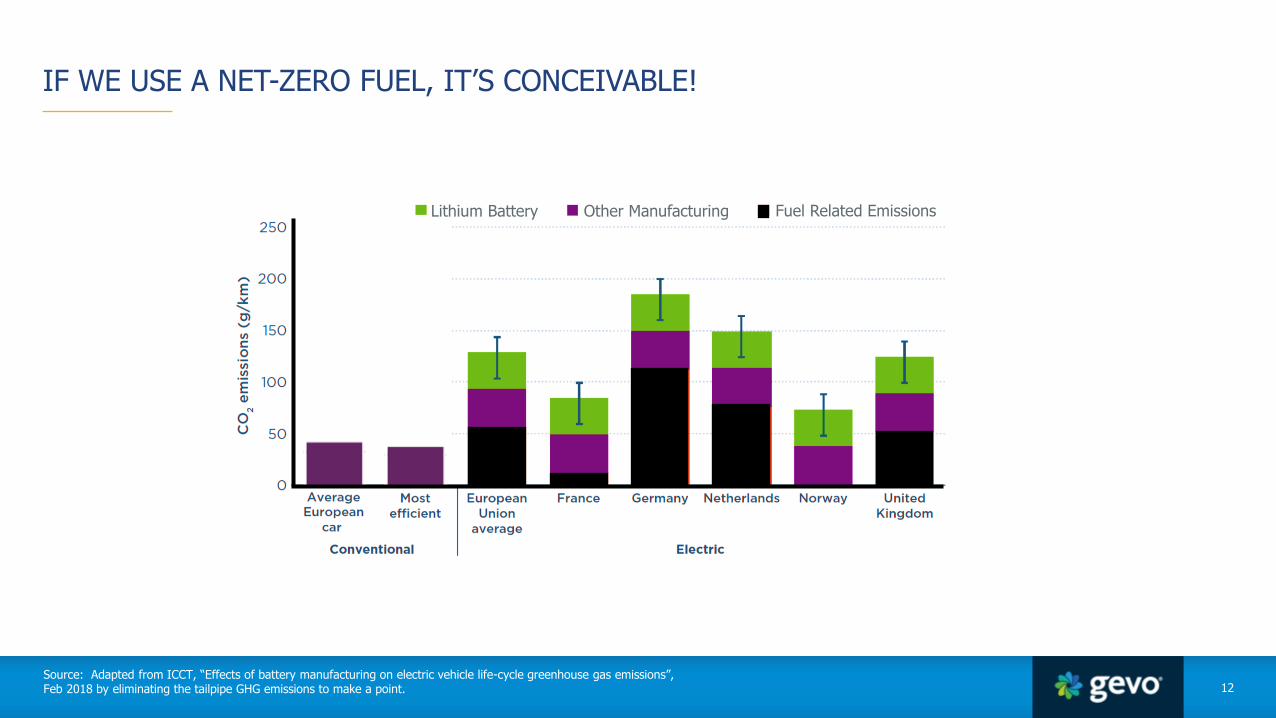
THINKING ABOUT CARS: WHAT IF WE COULD ELIMINATE THE TAILPIPE EMISSIONS OF CARS ON A FULL LIFE CYCLE BASIS?
Source: ICCT, “Effects of battery manufacturing on electric vehicle life-cycle greenhouse gas emissions”, Feb 2018
Lithium Battery Other Manufacturing Fuel Related Emissions
12
IF WE USE A NET-ZERO FUEL, IT’S CONCEIVABLE!
Source: Adapted from ICCT, “Effects of battery manufacturing on electric vehicle life-cycle greenhouse gas emissions”, Feb 2018 by eliminating the tailpipe GHG emissions to make a point.
Lithium Battery Other Manufacturing Fuel Related Emissions
13
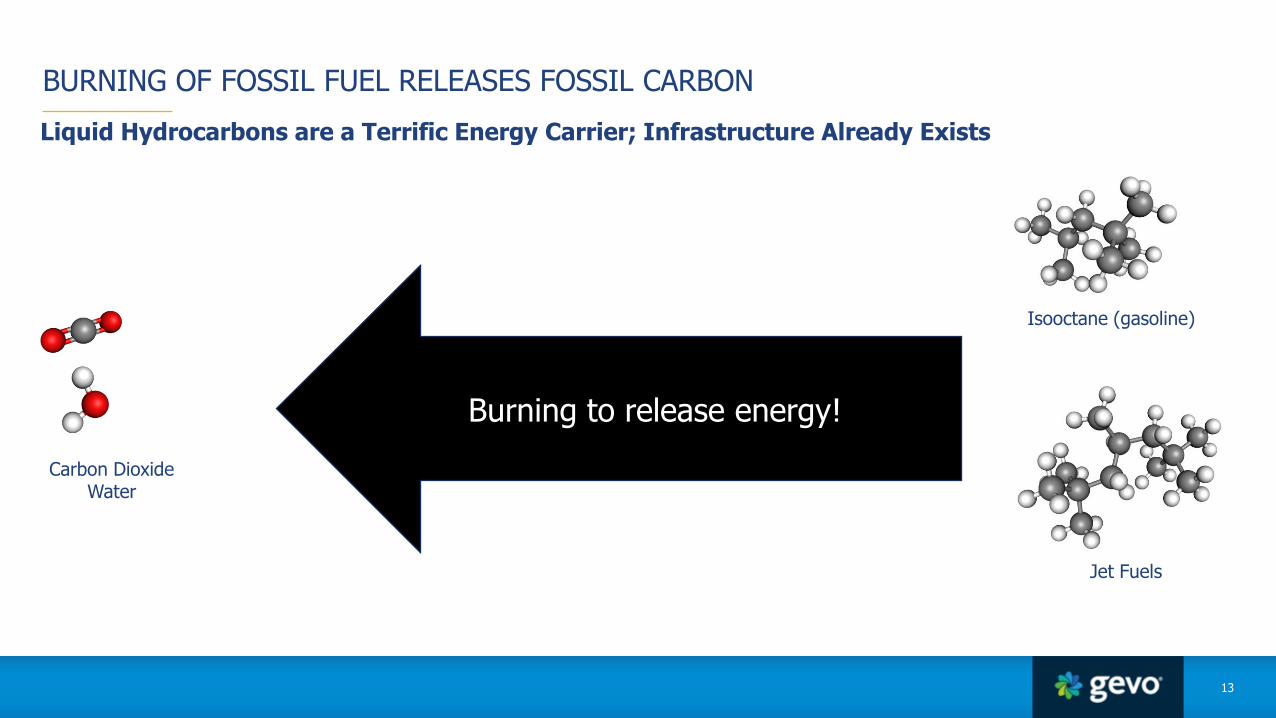
Liquid Hydrocarbons are a Terrific Energy Carrier; Infrastructure Already Exists
BURNING OF FOSSIL FUEL RELEASES FOSSIL CARBON
Carbon DioxideWater
Isooctane (gasoline)
Jet Fuels
Burning to release energy!

14
HOW TO SOLVE THE PROBLEM
Carbon Dioxide
Isooctane (gasoline)
Jet Fuels
Requires renewable carbon and renewable energy to achieve Net-Zero
Capture of CO2
from productionCapture of CO2
during production of raw materials
Capture of CO2
during energy production
The inherent energy to do the reverse of burning
(connecting carbons together, eliminating oxygen,
adding hydrogen)
Process Energy
To Move Beyond Net-Zero GHG’s

Benzene
Toluene
Xylenes
Aromatics
Unsaturated Polyesters
Polypropylene
Jet Fuel
Gasoline
Diesel
Source: Adapted from Nexant
Natural Gas Steam Cracking Olefins
PyrolysisGasoline
meta-Xylene
para-Xylene
ortho-Xylene
Methyl Methacrylate
Toluene Diamine
Cyclohexane
Ethyl Benzene
Cumene
Acrylonitrile
Propylene Oxide
Isobutene
Ethanol
alpha-Olefin
Polyols
Phenol
Acetone
Styrene
Adipic Acid
Caprolactam
Toluene Diisocyanate
Phthalic Anhydride
Isophthalic Acid
Terephthalic Acid
Ethylene Glycol
MTBE
Polyesters (PET)
Plasticizers
Polyurethane
Nylon 6
Nylon 66
SB Latex
ABS
Polystyrene
Butadiene-Styrene
Polybutadiene
Polyacrylonitrile
Polyisobutylene
Polyester
Poly(vinyl cloride)
Polyethylene
Ethylene
Propylene
Butylenes
Butadiene
Vinyl Chloride
Crude Oil
Ethylene Oxide
EDC
Hydrocarbon Fuels
Naphtha
Chemicals and Materials
Distillation
• Chemicals, solvents, plastics, and materials are made from a few “building blocks”
• Fuels also are made from the “building blocks”
15
PROCESSES USED TODAY TO MAKE PETROCHEMICALS AND FUELS

CO2 +
FROM JUST ISOBUTANOL (IBA) AND ETHANOL MOST CHEMICALS AND FUELS CAN BE MADE COST-EFFECTIVELY IF CARBON VALUE IS TAKEN INTO ACCOUNT
Source: Adapted from NexantNote: Chemicals shaded green denote those which can be made from ethanol and or isobutanol derived building blocks.
Benzene
Toluene
Xylenes
Aromatics
Unsaturated Polyesters
Polypropylene
Jet Fuel
Gasoline
Diesel
Natural Gas Steam Cracking Olefins
PyrolysisGasoline
meta-Xylene
para-Xylene
ortho-Xylene
Methyl Methacrylate
Toluene Diamine
Cyclohexane
Ethyl Benzene
Cumene
Acrylonitrile
Propylene Oxide
Isobutene
Ethanol
alpha-Olefin
Polyols
Phenol
Acetone
Styrene
Adipic Acid
Caprolactam
Toluene Diisocyanate
Phthalic Anhydride
Isophthalic Acid
Terephthalic Acid
Ethylene Glycol
MTBE
Polyesters (PET)
Plasticizers
Polyurethane
Nylon 6
Nylon 66
SB Latex
ABS
Polystyrene
Butadiene-Styrene
Polybutadiene
Polyacrylonitrile
Polyisobutylene
Polyester
Poly(vinyl cloride)
Polyethylene
Ethylene
Propylene
Butylenes
Butadiene
Vinyl Chloride
Crude Oil
Ethylene Oxide
EDC
Hydrocarbon Fuels
Naphtha
Chemicals and Materials
Distillation
16
17
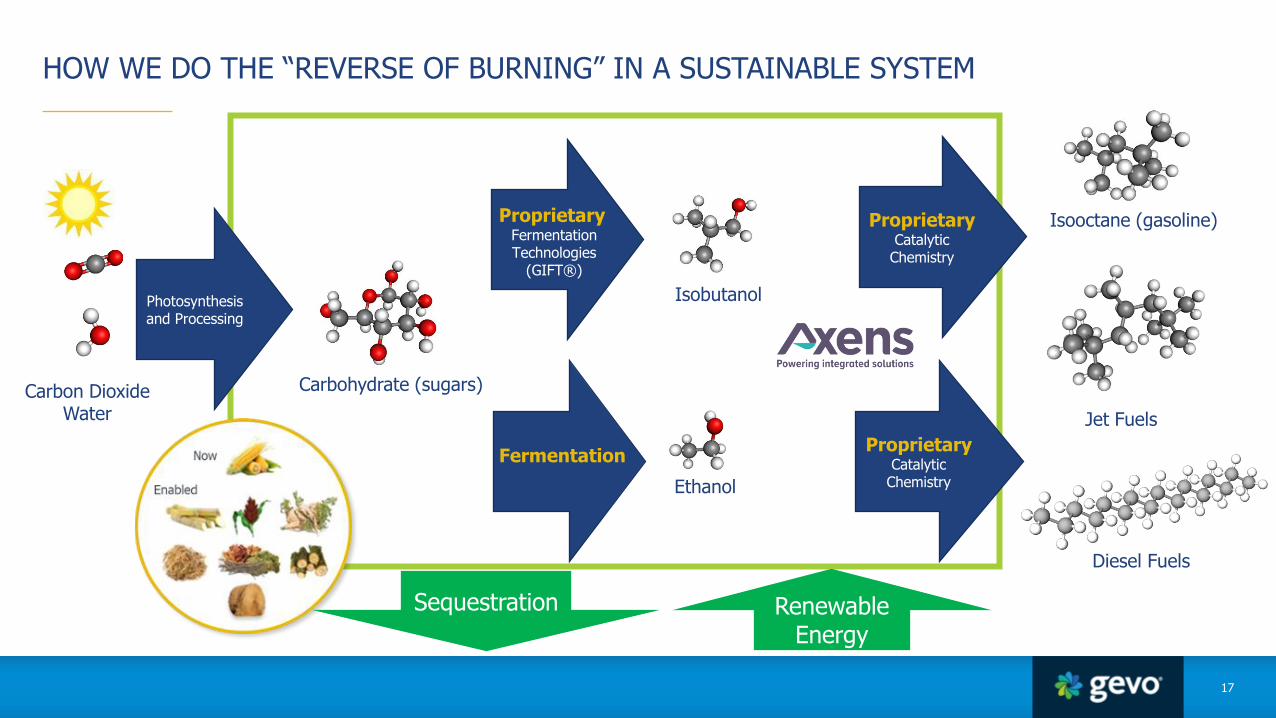
HOW WE DO THE “REVERSE OF BURNING” IN A SUSTAINABLE SYSTEM
ProprietaryCatalytic
Chemistry
Carbon DioxideWater
Carbohydrate (sugars)
ProprietaryFermentationTechnologies
(GIFT®)
Isooctane (gasoline)
Jet Fuels
IsobutanolPhotosynthesis and Processing
Renewable Energy
ProprietaryCatalytic
Chemistry
Fermentation
Diesel Fuels
Ethanol
Sequestration
© 2017 Gevo, Inc. | 18
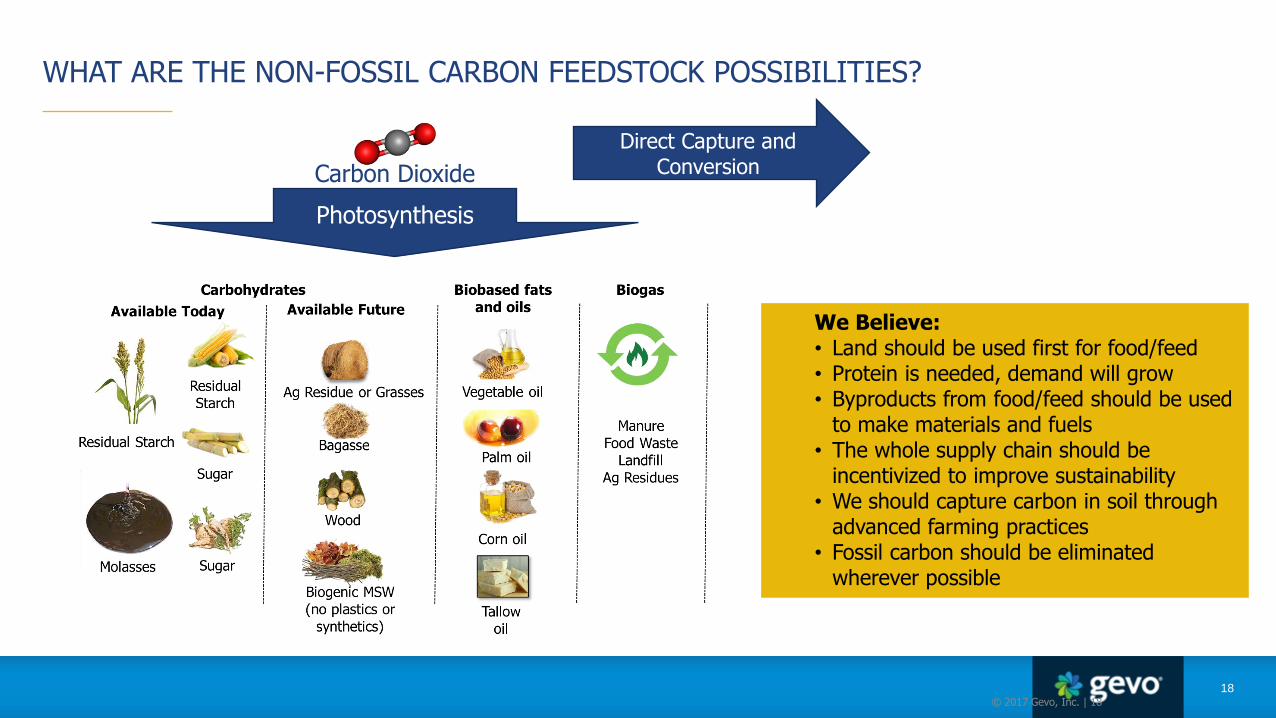
WHAT ARE THE NON-FOSSIL CARBON FEEDSTOCK POSSIBILITIES?
Carbon Dioxide
We Believe:• Land should be used first for food/feed• Protein is needed, demand will grow• Byproducts from food/feed should be used
to make materials and fuels • The whole supply chain should be
incentivized to improve sustainability• We should capture carbon in soil through
advanced farming practices• Fossil carbon should be eliminated
wherever possible
Photosynthesis
Direct Capture and Conversion
18
19
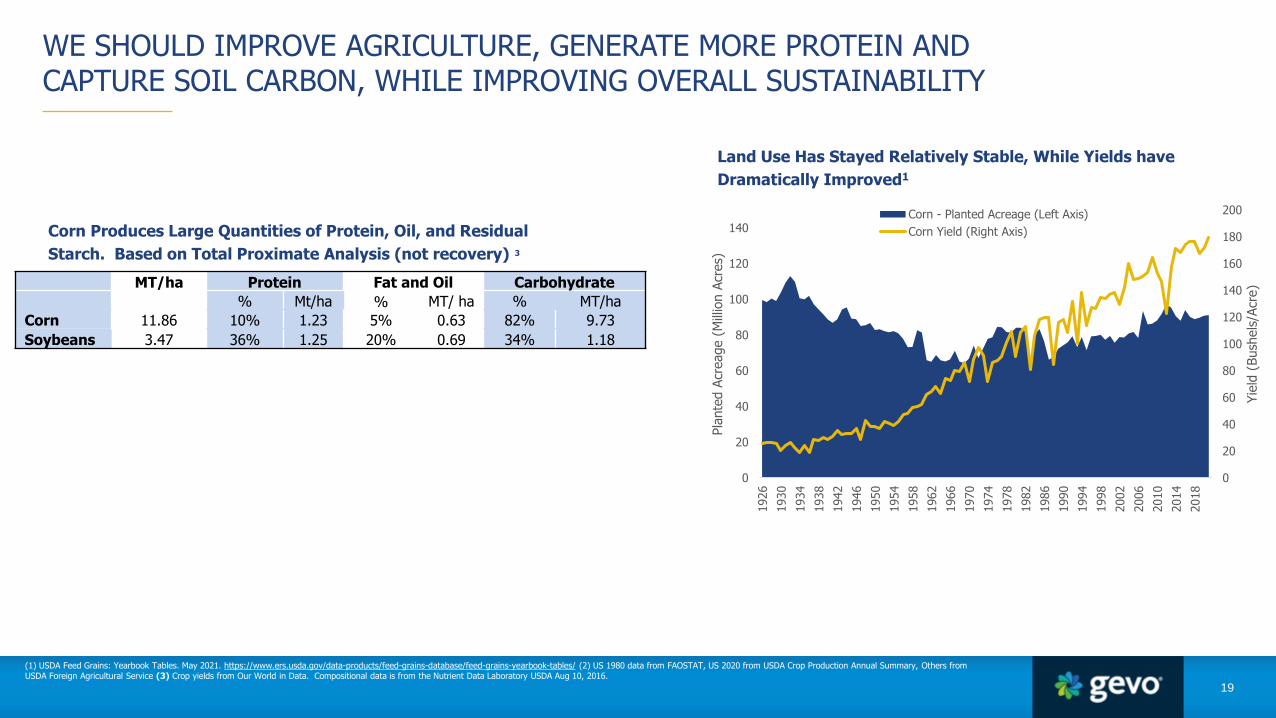
WE SHOULD IMPROVE AGRICULTURE, GENERATE MORE PROTEIN AND CAPTURE SOIL CARBON, WHILE IMPROVING OVERALL SUSTAINABILITY
Land Use Has Stayed Relatively Stable, While Yields have
Dramatically Improved1
Corn Produces Large Quantities of Protein, Oil, and Residual
Starch. Based on Total Proximate Analysis (not recovery) 3
0
20
40
60
80
100
120
140
160
180
200
0
20
40
60
80
100
120
140
1926
1930
1934
1938
1942
1946
1950
1954
1958
1962
1966
1970
1974
1978
1982
1986
1990
1994
1998
2002
2006
2010
2014
2018
Yie
ld (
Bush
els
/Acr
e)
Pla
nte
d A
creage (
Mill
ion A
cres)
Corn - Planted Acreage (Left Axis)
Corn Yield (Right Axis)
(1) USDA Feed Grains: Yearbook Tables. May 2021. https://www.ers.usda.gov/data-products/feed-grains-database/feed-grains-yearbook-tables/ (2) US 1980 data from FAOSTAT, US 2020 from USDA Crop Production Annual Summary, Others from USDA Foreign Agricultural Service (3) Crop yields from Our World in Data. Compositional data is from the Nutrient Data Laboratory USDA Aug 10, 2016.
MT/ha Protein Fat and Oil Carbohydrate
% Mt/ha % MT/ ha % MT/ha
Corn 11.86 10% 1.23 5% 0.63 82% 9.73
Soybeans 3.47 36% 1.25 20% 0.69 34% 1.18

20
WE SHOULD IMPROVE AGRICULTURE, GENERATE MORE PROTEIN AND CAPTURE SOIL CARBON, WHILE IMPROVING OVERALL SUSTAINABILITY ACROSS THE WHOLE WORLD
(1) USDA Feed Grains: Yearbook Tables. May 2021. https://www.ers.usda.gov/data-products/feed-grains-database/feed-grains-yearbook-tables/ (2) US 1980 data from FAOSTAT, US 2020 from USDA Crop Production Annual Summary, Others from USDA Foreign Agricultural Service (3) Crop yields from Our World in Data. Compositional data is from the Nutrient Data Laboratory USDA Aug 10, 2016.
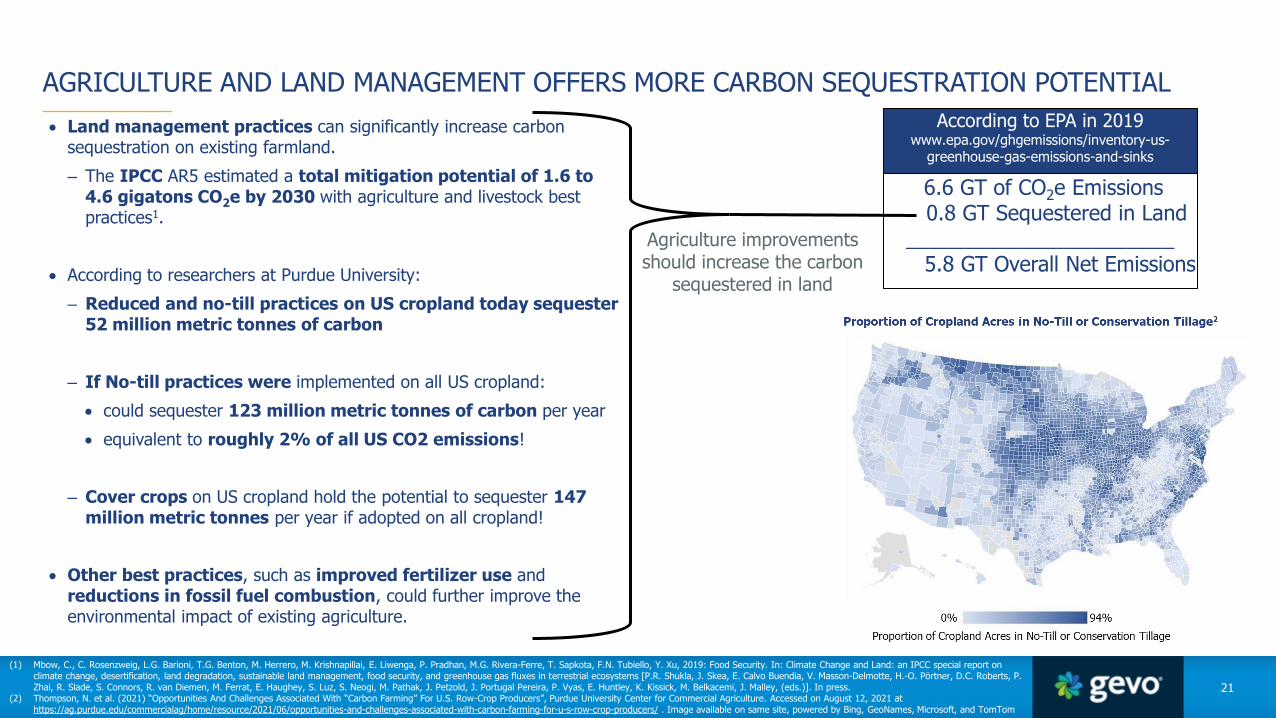
• Land management practices can significantly increase carbon sequestration on existing farmland.
– The IPCC AR5 estimated a total mitigation potential of 1.6 to 4.6 gigatons CO2e by 2030 with agriculture and livestock best practices1.
• According to researchers at Purdue University:
– Reduced and no-till practices on US cropland today sequester 52 million metric tonnes of carbon
– If No-till practices were implemented on all US cropland:
• could sequester 123 million metric tonnes of carbon per year
• equivalent to roughly 2% of all US CO2 emissions!
– Cover crops on US cropland hold the potential to sequester 147 million metric tonnes per year if adopted on all cropland!
• Other best practices, such as improved fertilizer use and reductions in fossil fuel combustion, could further improve the environmental impact of existing agriculture.
AGRICULTURE AND LAND MANAGEMENT OFFERS MORE CARBON SEQUESTRATION POTENTIAL
21
(1) Mbow, C., C. Rosenzweig, L.G. Barioni, T.G. Benton, M. Herrero, M. Krishnapillai, E. Liwenga, P. Pradhan, M.G. Rivera-Ferre, T. Sapkota, F.N. Tubiello, Y. Xu, 2019: Food Security. In: Climate Change and Land: an IPCC special report on climate change, desertification, land degradation, sustainable land management, food security, and greenhouse gas fluxes in terrestrial ecosystems [P.R. Shukla, J. Skea, E. Calvo Buendia, V. Masson-Delmotte, H.-O. Pörtner, D.C. Roberts, P. Zhai, R. Slade, S. Connors, R. van Diemen, M. Ferrat, E. Haughey, S. Luz, S. Neogi, M. Pathak, J. Petzold, J. Portugal Pereira, P. Vyas, E. Huntley, K. Kissick, M. Belkacemi, J. Malley, (eds.)]. In press.
(2) Thompson, N. et al. (2021) “Opportunities And Challenges Associated With “Carbon Farming” For U.S. Row-Crop Producers”, Purdue University Center for Commercial Agriculture. Accessed on August 12, 2021 athttps://ag.purdue.edu/commercialag/home/resource/2021/06/opportunities-and-challenges-associated-with-carbon-farming-for-u-s-row-crop-producers/ . Image available on same site, powered by Bing, GeoNames, Microsoft, and TomTom
6.6 GT of CO2e Emissions0.8 GT Sequestered in Land
_______________________5.8 GT Overall Net Emissions
According to EPA in 2019www.epa.gov/ghgemissions/inventory-us-
greenhouse-gas-emissions-and-sinks
Agriculture improvements should increase the carbon
sequestered in land
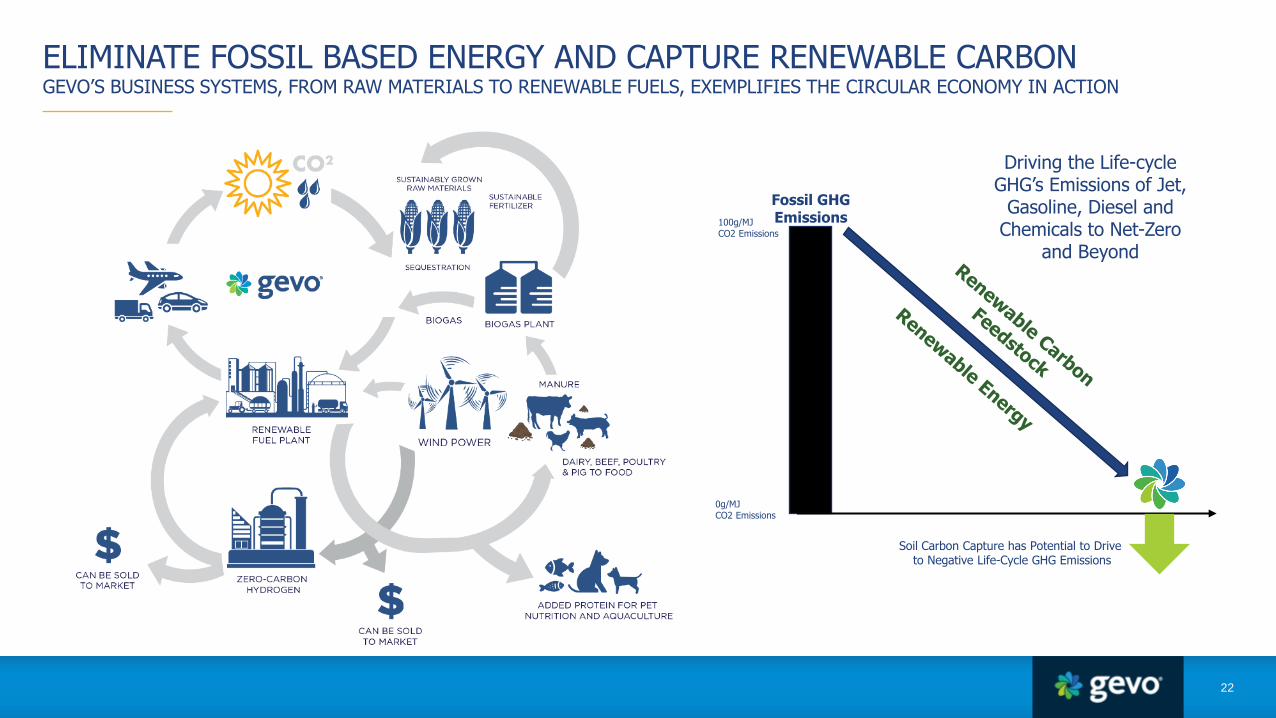
ELIMINATE FOSSIL BASED ENERGY AND CAPTURE RENEWABLE CARBONGEVO’S BUSINESS SYSTEMS, FROM RAW MATERIALS TO RENEWABLE FUELS, EXEMPLIFIES THE CIRCULAR ECONOMY IN ACTION
22
Fossil GHG Emissions100g/MJ
CO2 Emissions
0g/MJ CO2 Emissions
Soil Carbon Capture has Potential to Drive to Negative Life-Cycle GHG Emissions
Driving the Life-cycle GHG’s Emissions of Jet,
Gasoline, Diesel and Chemicals to Net-Zero
and Beyond

23
NET-ZERO 1 PRODUCT GHG SOURCES (BASE CASE)
*
Tillage Practices Near
Net-Zero 1 Site (2)
Corn iLUC Better Land Management Chemicals Hydrogen T&D Electricity Biogas ThinStillage Total Carbon Score
Net
Zero
Lin
e
Note: Gevo is actively working with Argonne to publish GHG values for Net-Zero 1 and future plants.(1) Better management defined by Argonne on average as low farming CI, and sustainable farming practices like cover crops.(2) Depending on corn portfolio Gevo has, the -31gCO23/MJ value shown here will vary between 0 and -62. On average Gevo is assuming a conservative portfolio that mainly sources low tillage corn.
H2
gCO
2e/M
J
No Till21%
Low Till52%
StandardTill
27%
Why DOE Argonne GREET Model?• Best scientific model• State of the art• Updated regularly to reflect new
science• Not politicized

24
(1) EcoEngineers is in process of a detailed review and analysis.(2) EcoEngineers, USDA – NRCS 2019 South Dakota Cropping Systems Inventory Report.
WE NEED TO CAPTURE EVEN MORE CARBON IN THE SOILSUSTAINABLE AGRICULTURE OFFERS POTENTIAL UPSIDE IN COMBINATION OF RENEWABLE ENERGY IN PRODUCTION
Tillage Practices Near
Net-Zero 1 Site (2)
Based on data and trials by LOCUS, a company who believe soil organic carbon (SOC) can be dramatically increased by building root systems and other soil amendments. If true, the amount of carbon capture per gallon could be in the 10’s of kgs per gallon. We are working with them and other companies to figure it out.
Impact of Agricultural Practice on Total Life-Cycle GHG Emissions for Hydrocarbons Burned for Transportation Energy (1)
Low Till No Till
If all Strip-Till or Low-Till If all No-Till
Impact of Soil Carbon Capture
Technology
If Wastes Products
A Base Mix of Tillage Practices
Near NZ1
-5 -7
-190
6
-35
No Till21%
Low Till52%
StandardTill
27%
Agriculture improvements are practical and being done
• Sequester carbon in the soil
• Higher yield
• Less inputs
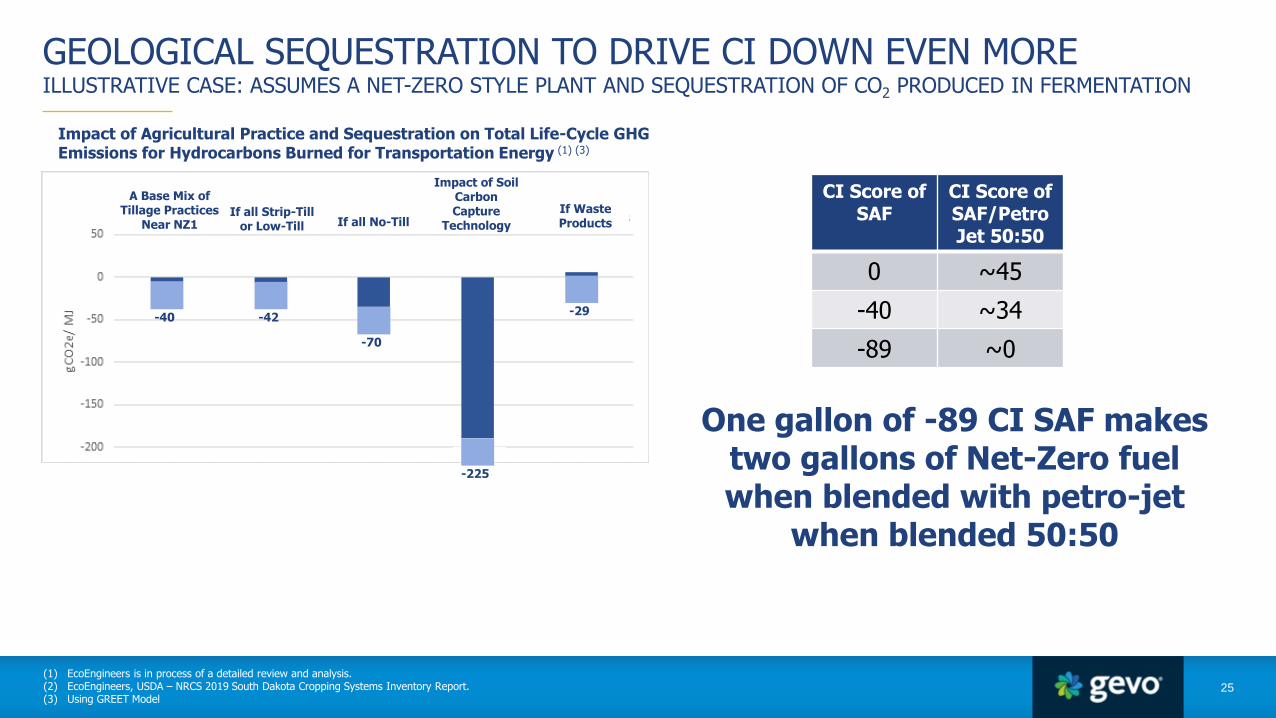
CI Score of SAF
CI Score of SAF/Petro Jet 50:50
0 ~45
-40 ~34
-89 ~0
25
GEOLOGICAL SEQUESTRATION TO DRIVE CI DOWN EVEN MOREILLUSTRATIVE CASE: ASSUMES A NET-ZERO STYLE PLANT AND SEQUESTRATION OF CO2 PRODUCED IN FERMENTATION
(1) EcoEngineers is in process of a detailed review and analysis.(2) EcoEngineers, USDA – NRCS 2019 South Dakota Cropping Systems Inventory Report.(3) Using GREET Model
Impact of Agricultural Practice and Sequestration on Total Life-Cycle GHG Emissions for Hydrocarbons Burned for Transportation Energy (1) (3)
If all Strip-Till or Low-Till If all No-Till
Impact of Soil Carbon Capture
Technology
If Waste Products
A Base Mix of Tillage Practices
Near NZ1
-40 -42
-70
-29
-225
One gallon of -89 CI SAF makes two gallons of Net-Zero fuel when blended with petro-jet
when blended 50:50

TRACKING CARBON AND SUSTAINABILITY ACROSS THE BUSINESS SYSTEM
26
Savingsdue to
digitalization& automation
EncodedData
Tamper-proof Avoid Green-washing
and Double Counting
TruckScale
CornStorage
Fermenta-tion
Processing StorageRail &Truck
Corn Slurry& Cook
Farmer Cloud
Automated Data Input
Manual Data Input
DLTmiddleware
PI WebREST API
Data Historian
Node
GEVO.com
Nodesin otherplants
Gevo is partnering with Blocksize Capital to establish a blockchain
technology for tracking sustainability, building trust
and setting the higheststandards for the industry

Purpose of Gevo’s outreach
27
WE BELIEVE IN SUSTAINABILITY AUDITS AND CERTIFICATIONS
RSB ISCC
ISCC PLUS certification enables Gevo to validate the responsible nature of its liquid transportation fuels and to highlight the traceability, qualifying that such fuels are produced in a sustainable manner
ISCC principles:
•Principle 1: Protection of biodiverse. and carbon rich areas
•Principle 4: Compliance with Human, Labor and Land rights
•Principle 5: Compliance with Laws and. International Treaties
•Principle 6: Good Management. Practices and Continuous Improvement
RSB certifies that Gevo adheres to the United Nation’s 12 Principles:

GEVO & WHAT WE DO
29
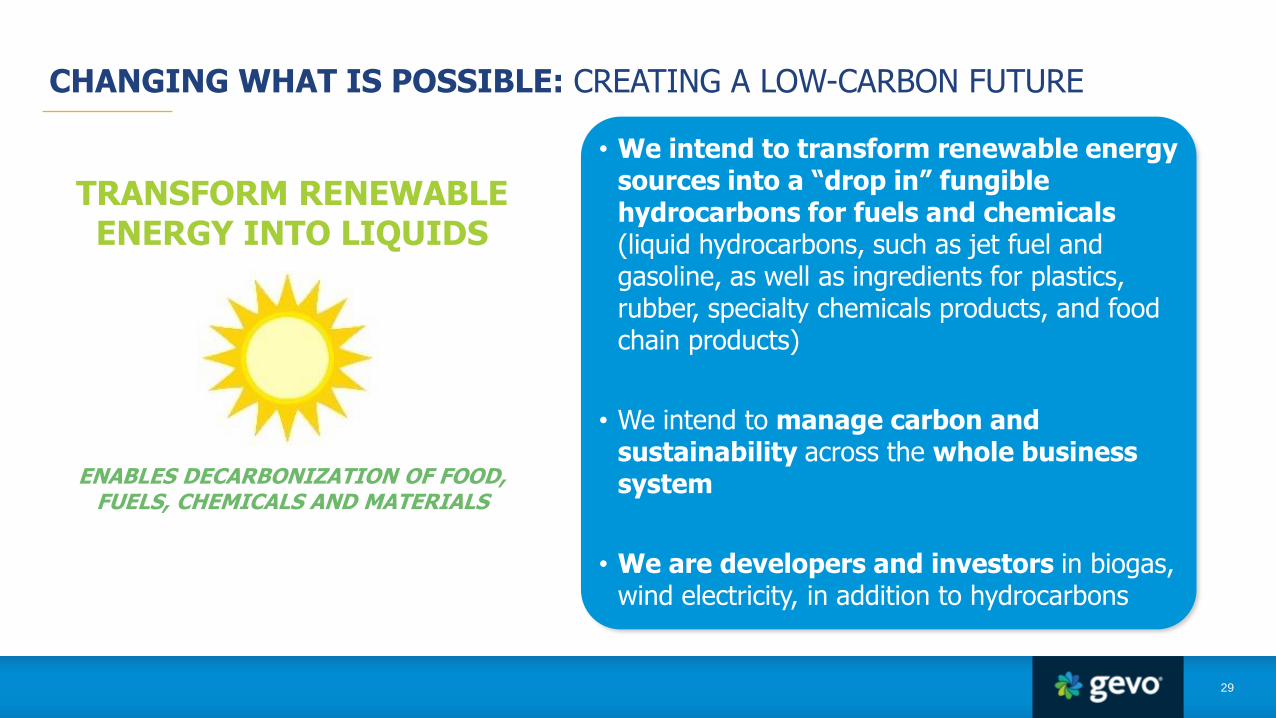
CHANGING WHAT IS POSSIBLE: CREATING A LOW-CARBON FUTURE
TRANSFORM RENEWABLE ENERGY INTO LIQUIDS
24
• We intend to transform renewable energy sources into a “drop in” fungible hydrocarbons for fuels and chemicals (liquid hydrocarbons, such as jet fuel and gasoline, as well as ingredients for plastics, rubber, specialty chemicals products, and food chain products)
• We intend to manage carbon and sustainability across the whole business system
• We are developers and investors in biogas, wind electricity, in addition to hydrocarbons
ENABLES DECARBONIZATION OF FOOD, FUELS, CHEMICALS AND MATERIALS

30
THIS IS WHAT WE ARE WORKING TOWARDS
1 Billion Gallons of Low Fossil Carbon Hydrocarbons or More Per Year by 2030
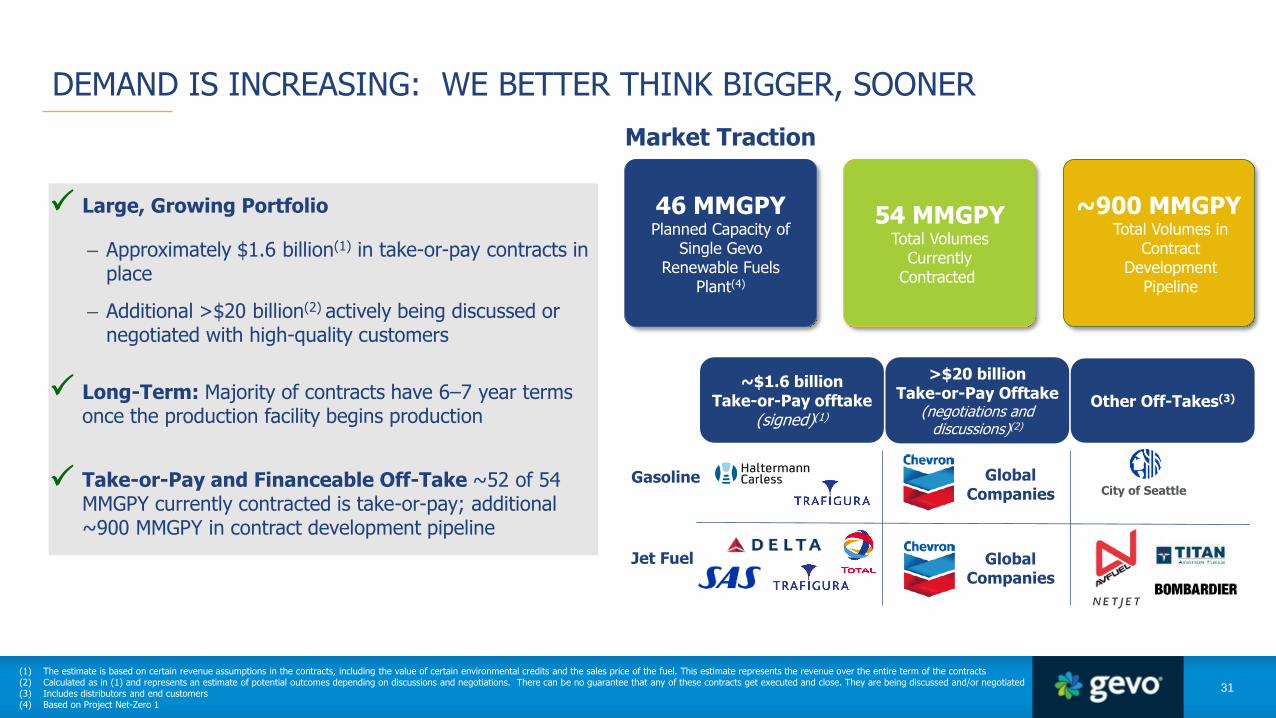
• Large, Growing Portfolio
– Approximately $1.6 billion(1) in take-or-pay contracts in place
– Additional >$20 billion(2) actively being discussed or negotiated with high-quality customers
• Long-Term: Majority of contracts have 6–7 year terms once the production facility begins production
• Take-or-Pay and Financeable Off-Take ~52 of 54 MMGPY currently contracted is take-or-pay; additional ~900 MMGPY in contract development pipeline
~900 MMGPYTotal Volumes in
Contract Development
Pipeline
31
(1) The estimate is based on certain revenue assumptions in the contracts, including the value of certain environmental credits and the sales price of the fuel. This estimate represents the revenue over the entire term of the contracts(2) Calculated as in (1) and represents an estimate of potential outcomes depending on discussions and negotiations. There can be no guarantee that any of these contracts get executed and close. They are being discussed and/or negotiated(3) Includes distributors and end customers(4) Based on Project Net-Zero 1
DEMAND IS INCREASING: WE BETTER THINK BIGGER, SOONER
P
P
P
Market Traction
54 MMGPYTotal Volumes
Currently Contracted
46 MMGPYPlanned Capacity of
Single GevoRenewable Fuels
Plant(4)
City of Seattle
Jet Fuel
Gasoline
>$20 billionTake-or-Pay Offtake
(negotiations and discussions)(2)
~$1.6 billionTake-or-Pay offtake
(signed)(1)
Other Off-Takes(3)
Global Companies
Global Companies

An “Off-the-Grid” Renewable Protein, Oil, Chemical and Hydrocarbon Plant VIA Isobutanol Route**
32
SCOPE OF NET-ZERO 1*
*Currently Planned for Lake Preston, volumes of inputs and products are subject to change. **The plant would be connected to the grid to supply energy to the grids, and also to take energy from the grids if needed. The plant is being designed to be self sufficient for its energy between what can be generated on-site and from the planned off-site wind farm. Gevo may also bring RNG to the plant from its RNG project.
+340 Million lbs (154KT) of Value-added Nutritional Protein Products
~30 Million lbs (14KT) of Vegetable oil
~46 Million Gallons (~3,300 bbl/d or ~136KT) of Jet and Isooctane
Waste-Water
Biogas
Biogas
Low Carbon Corn
~30 Million Bu(1.68B lbs,
764KT)
Residual Starch Slurry
Water Electricity Hydrogen
Production Processes
Energy, Utilities, Water
Processes
Protein & Oil
Alcohol thenChemical/Hydrocarbon
Production
On-Site Water Treatment/Biogas
Production
On-Site Electricity Production
Off-Site Wind Electricity Production
Renewable Hydrogen Production
~44 Million lbs (20KT) of IBA
Carbon Sequestration
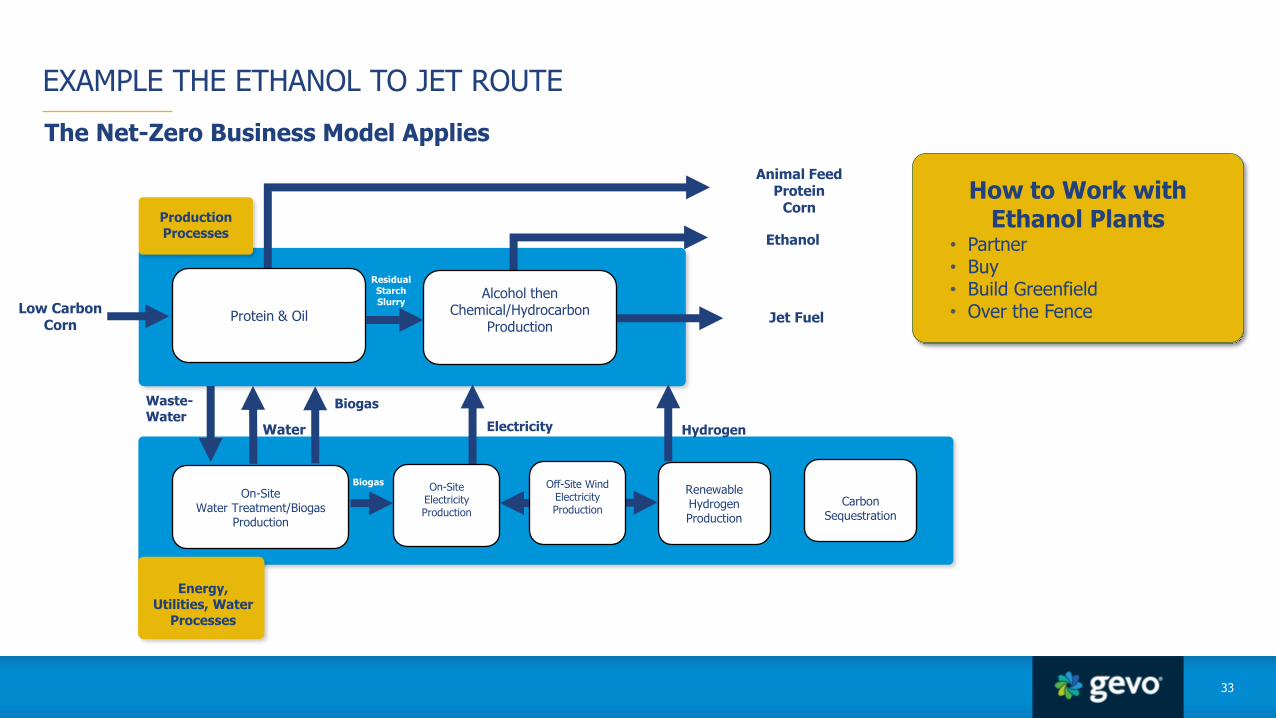
The Net-Zero Business Model Applies
33
EXAMPLE THE ETHANOL TO JET ROUTE
Waste-Water
Biogas
Biogas
Low Carbon Corn
Residual Starch Slurry
Water Electricity Hydrogen
Production Processes
Energy, Utilities, Water
Processes
Protein & Oil
Alcohol thenChemical/Hydrocarbon
Production
On-Site Water Treatment/Biogas
Production
On-Site Electricity Production
Off-Site Wind Electricity Production
Renewable Hydrogen Production
Carbon Sequestration
Animal FeedProtein
Corn
Ethanol
Jet Fuel
How to Work with Ethanol Plants
• Partner• Buy• Build Greenfield• Over the Fence

Description
34
GEVO COMMERCIALIZING RENEWABLE ENERGY
Status
✓Under Construction and ON TRACK✓Start-up expected in early 2022✓Sales & purchase agreement in place with bp
(1) Projected project-level leveraged internal rate of return based on project financing structure and assumptions around offtake contract pricing, number of cows producing manure, carbon value, capital costs, and operating costs, all of which are subject to change and revisions. The returns assume that at least 50% of the RNG is sold into CA for transportation use.
bp authorized the use of bp logo in this presentation
• 355,000 MMBtu/yr RNG
• Multiple dairy farms with over 20,000 milking cows combined
• Gas upgrading system to be located adjacent to Northern Natural Gas pipeline
• Sell RNG to LCFS market and to augment Gevo renewable fuels production
Wind Tower Servicing Gevo’s Luverne, MN Plant
Gevo Northwest Iowa RNG LLC

35
RECENT PRESS
“Make the World A Better Place By Improving the Standard of Living For All People ”
Eliminate fossil-based emissions of fuels and chemicals, and related pollutants while enhancing nutrition, land, water.
Make renewable energy more available to more people, and more affordable
Let’s do it!

Purpose of Gevo’s outreach
37
NET ZERO 1 (1:52): https://vimeo.com/540736374Gevo – Solving Energy (2:00): https://vimeo.com/531083659Working Toward Zero Carbon Footprint (2:46): https://vimeo.com/440219829Food and Fuel (1:19): https://vimeo.com/440220247Where we are so far (1:21): https://vimeo.com/416215170Our Process (1:01): https://vimeo.com/416215010Replacing Fossil Based Carbon (2:07): https://vimeo.com/396232536Farming Carbon & Soil Conservation (1:54): https://vimeo.com/379773448Sustainable Jet Fuel (1:59): https://vimeo.com/379896308Partners with Mother Nature (1:49): https://vimeo.com/416215170Going After the Whole Gallon(0:50): https://vimeo.com/451342705We are Recycling Carbon (0:45): https://vimeo.com/451341985Our Circular Economy (0:48): https://vimeo.com/451341499
www.gevo.com
These short videos explain more about Gevo, our process, business system, and how we think about sustainability
FUTUREPAST
FOR ADDITIONAL INFORMATION ABOUT GEVO