getting under the covers! - mattioliwoods.com final results 2018... · earnings before interest,...
TRANSCRIPT

September 2018
FINAL RESULTSFor the year ended 31 May 2018
Getting under the covers!
Ian Mattioli MBE, Chief Executive Officer
Nathan Imlach, Chief Financial Officer

FINAL RESULTS | IMPORTANT NOTICE
2
These presentation slides contain forward-looking statements and forecasts with respect to the financial
condition and the results of Mattioli Woods plc.
These statements are forecasts involving risk and uncertainty because they relate to events and depend upon
circumstances that may or may not occur in the future.
There are a number of factors that could cause actual results or developments to differ materially from those
expressed or implied by these forward-looking statements and forecasts. Nothing in this presentation should
be construed as a profit forecast.
Nothing in this presentation should be seen as a promotion or solicitation to buy shares in Mattioli Woods plc.
It should be remembered that the value of shares can fall as well as rise and therefore you could get back less
than you invested.
Information in this presentation reflects the knowledge and information available at the time of its presentation.

FINAL RESULTS | AGENDA
3
• Our vision and model
• Highlights
• Financial results
• Our goals
• Organic growth
• Acquisitions
• Investment case

FINAL RESULTS | OUR VISION
4
Our business model creates
great client outcomes because
we use our own products and
advice when they are best and we
use other providers’ products and
advice when better
We take care of over
£8.7 billion
of clients’ assets
FINAL RESULTS | A PLATFORM FOR GROWTH
5
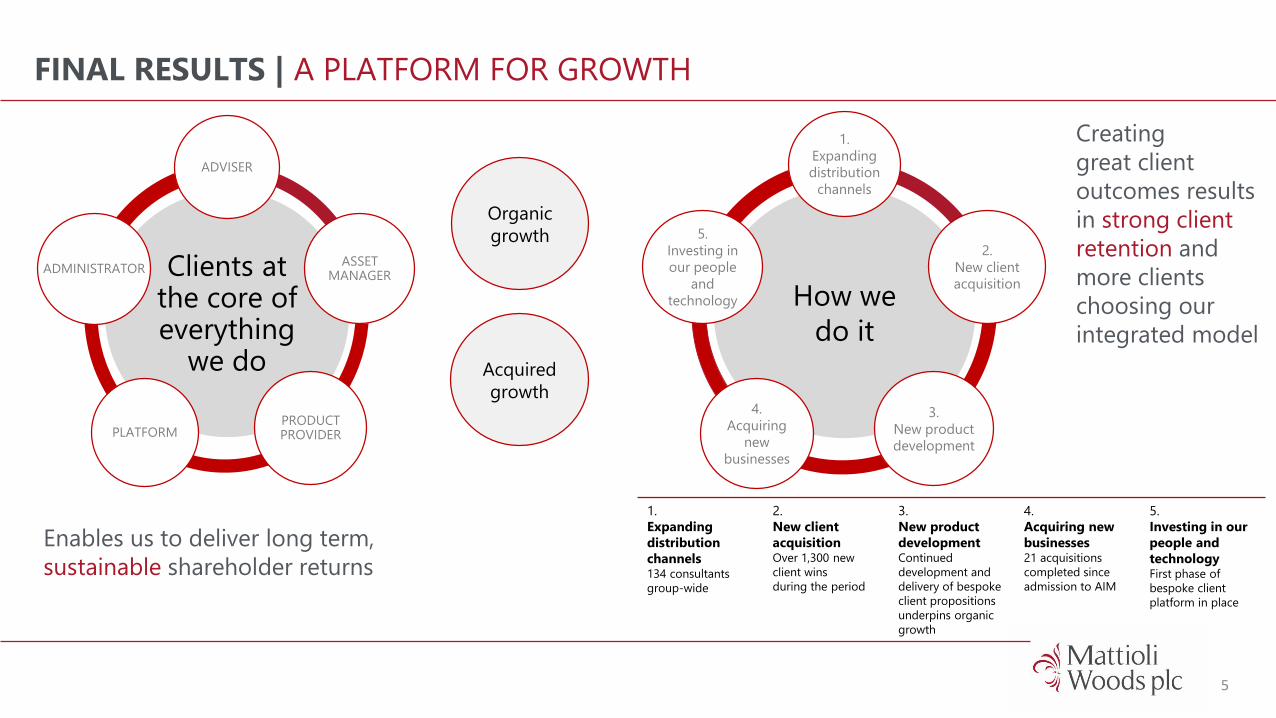
Clients at the core of everything
we do
ADVISER
ASSET MANAGER
PRODUCT PROVIDERPLATFORM
Organic
growth
Acquired
growth
How we
do it
1.
Expanding
distribution
channels
2.
New client
acquisition
3.
New product
development
4.
Acquiring
new
businesses
5.
Investing in
our people
and
technology
1.
Expanding
distribution
channels134 consultants
group-wide
2.
New client
acquisitionOver 1,300 new
client wins
during the period
3.
New product
developmentContinued
development and
delivery of bespoke
client propositions
underpins organic
growth
4.
Acquiring new
businesses21 acquisitions
completed since
admission to AIM
5.
Investing in our
people and
technologyFirst phase of
bespoke client
platform in place
Creating
great client
outcomes results
in strong client
retention and
more clients
choosing our
integrated model
Enables us to deliver long term,
sustainable shareholder returns
ADMINISTRATOR

FINAL RESULTS | HIGHLIGHTS
6
Double-digit growth• Sustained demand for advice
• Strong new business flows
• Maturing consultancy team
• Recent acquisitions performing well
• Lowering clients’ costs
• Building brand and reputation
Revenue
£58.7m
2017: £50.5m +16.2%
Organic revenue growth5
15.6%
2017: 11.6%
Recurring revenues6
84.8%
2017: 85.1%
Adjusted EBITDA1,2
£12.5m
2017: £10.8m +15.7%
Adjusted EBITDA margin1
21.3%
2017: 21.4%
Strong financial position
Net cash £20.2m
2017: £23.0m
Adjusted EPS3,4
37.0p
2017: 33.3p +11.1%
Total dividend
17.0p
2017: 14.1p +20.6%
1. Earnings before interest, taxation, depreciation, amortisation, impairment, changes in valuation of Amati option and acquisition-related costs, including share of Amati profits (net of tax).
2. Earnings before interest, taxation, depreciation, amortisation and impairment +22.1% to £12.7m (2017: £10.4m).
3. Before acquisition-related costs, amortisation and impairment of acquired intangibles, changes in valuation of Amati option and notional finance income and charges.
4. Basic EPS up 27.3% to 31.2p (2017: 24.5p).
5. Excluding acquisitions completed in the current and prior financial years.
6. Annual pension consultancy and administration fees; ongoing adviser charges; level and renewal commissions; banking income; property, discretionary portfolio and other annual management charges.

FINAL RESULTS | HIGHLIGHTS
7
AuM/A/A1
£8.73bn
2017: £7.93bn +10.1%
Gross discretionary AuM
£2.34bn
2017: £1.81bn +29.3%
August 2017
Lowered custody charges
and launched Mattioli
Woods’ multi-asset funds
Amati AuM2
£313.0m
2017: £165.9m +88.7%
Custodian Capital now manages
over
£0.5bnof property assets
Recent acquisitions
performing well and
extending strategic
geographic footprint
Doing more across the
value chain positions us
to succeed in our chosen
markets
Continued investment in
technology, compliance
and training
1. Includes £286.0m (2017: £153.8m) of net funds under management by Amati, excluding £27.0m (2017: £12.1m) of Mattioli Woods’ client investment and
£12.1m (2017: £9.8m) of cross-holdings between the TB Amati Smaller Companies Fund and the Amati AIM VCT plc.
2. Gross assets under management by Amati, excluding £12.1m (2017: £9.8m) of cross-holdings between the TB Amati Smaller Companies Fund and the Amati
AIM VCT plc.
Mattioli Woods Structured
Products Fund AuM
£213.8m2017: £98.4m +117.2%
Sustainable modelInherent flex within our business
model allows us to adapt quickly

FINAL RESULTS | INNOVATION AND GROWTH
8
Advice and products designed around our clients’ needs
CUSTODIAN REIT – CONSOLIDATED £100M OF PROPERTY SYNDICATESHas become £0.5bn listed property fund.
More secure, more liquid with high, fully-covered dividend.
AMATI VCTs AND SMALLCAP FUND Excellent team, great performance and strong growth in gross AuM to over £325m.
MATTIOLI WOODS STRUCTURED PRODUCTS FUND£214m AuM in unique investment proposition for retail investors.
PRIVATE INVESTORS CLUB£59m invested in asset-backed investment opportunities.
Expanding across the value chain, lowering clients’ costs
FINAL RESULTS | SEGMENTAL REVENUE
9
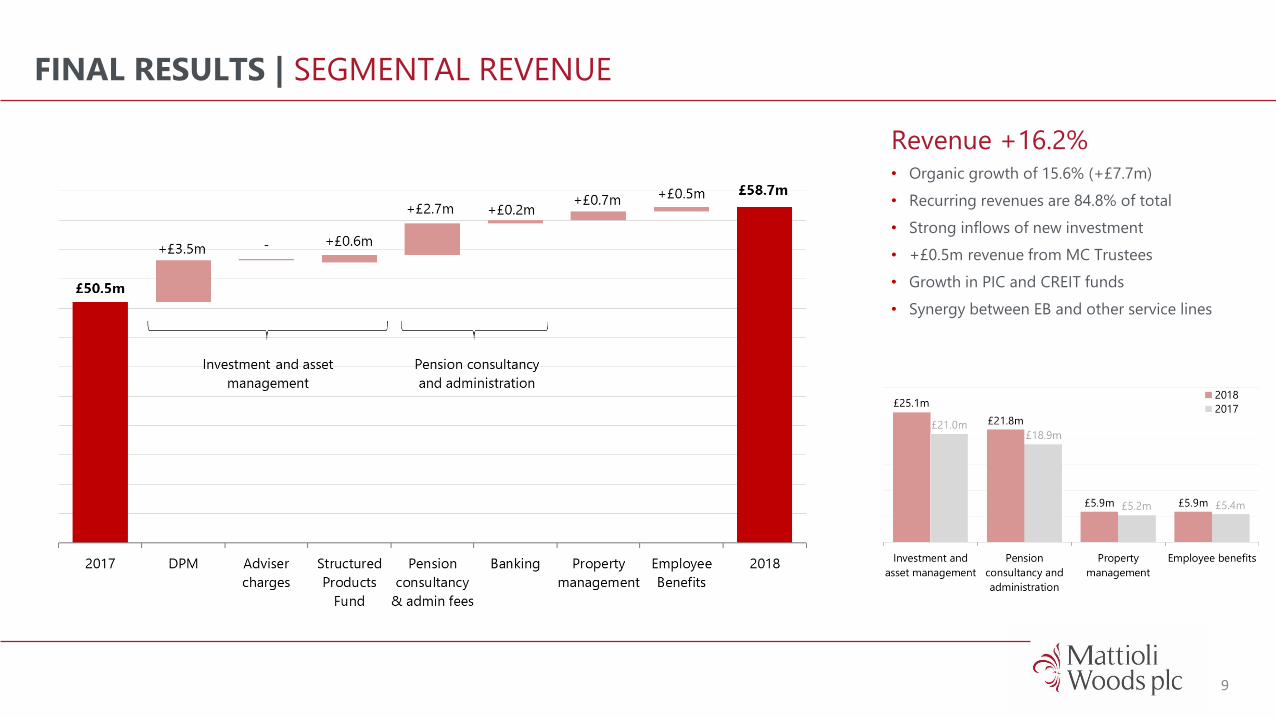
Revenue +16.2%• Organic growth of 15.6% (+£7.7m)
• Recurring revenues are 84.8% of total
• Strong inflows of new investment
• +£0.5m revenue from MC Trustees
• Growth in PIC and CREIT funds
• Synergy between EB and other service lines
FINAL RESULTS | FINANCIAL RESULT
10
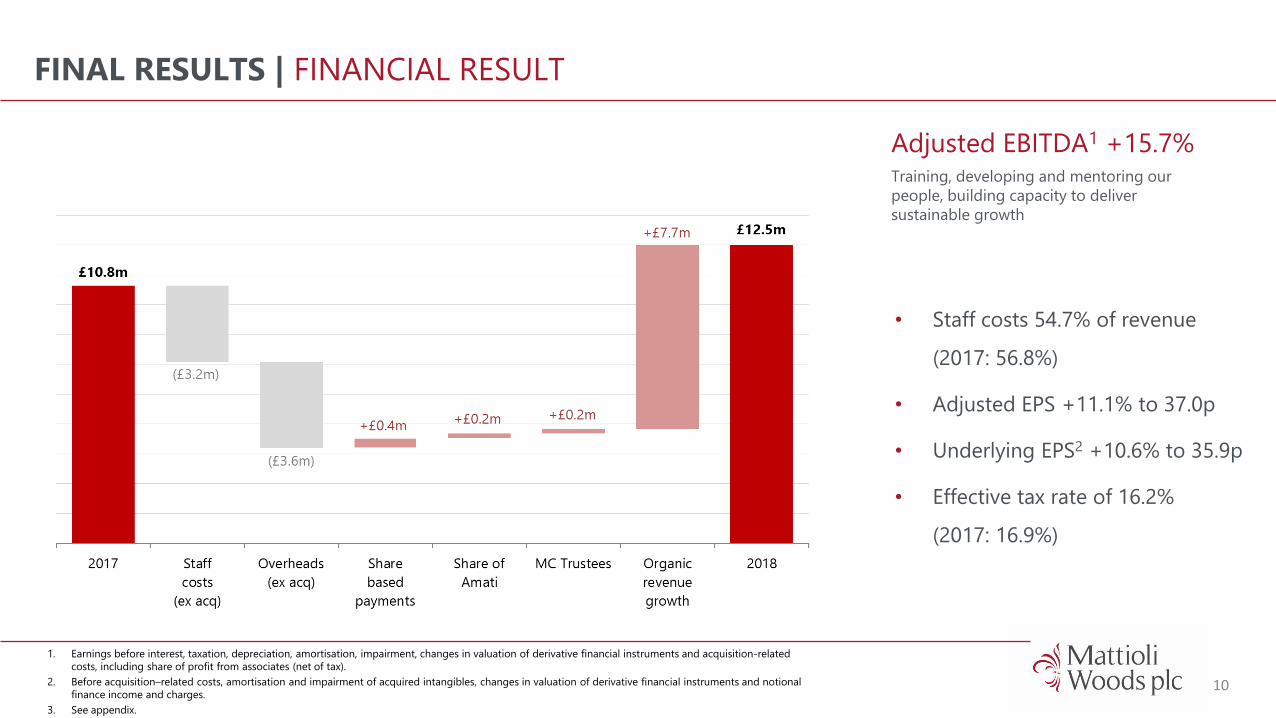
Adjusted EBITDA1 +15.7%Training, developing and mentoring our
people, building capacity to deliver
sustainable growth
1. Earnings before interest, taxation, depreciation, amortisation, impairment, changes in valuation of derivative financial instruments and acquisition-related
costs, including share of profit from associates (net of tax).
2. Before acquisition–related costs, amortisation and impairment of acquired intangibles, changes in valuation of derivative financial instruments and notional
finance income and charges.
3. See appendix.
• Staff costs 54.7% of revenue
(2017: 56.8%)
• Adjusted EPS +11.1% to 37.0p
• Underlying EPS2 +10.6% to 35.9p
• Effective tax rate of 16.2%
(2017: 16.9%)

FINAL RESULTS | FINANCIAL RESULT
11
Highly cash generativeCash conversion 143% of EBITDA (2017: 100%)
Proposed total dividend +20.6% to 17.0p
• Decrease in working capital:
‐ £5.1m increase in payables
‐ (£1.0m) increase in receivables
‐ £0.4m increase in provisions
• £7.0m capex on New Walk office
• £1.0m capex on software and IT
development
• £3.5m of deferred consideration
paid in year

FINAL RESULTS | OUR GOALS
12
• Great client outcomes:
‐ Passion for looking after our clients’ aspirations and their assets
‐ Proactive, advice-led proposition
‐ Bespoke, personalised service
• Strong, sustainable shareholder returns:
‐ Broadening our proposition
‐ Increasing organic operations
‐ Recent acquisitions performing well
‐ Continuing to review acquisition opportunities
‐ Smaller strategic board, stronger management team
• Lower TERs:
‐ Reduced custody, product and adviser charges
‐ VAT exemption for pension schemes that are SIFs
‐ New range of multi-asset funds
Medium term goals£15bn total client assets
£100m revenue
20% EBITDA margin
To create a 21st century
financial services business built
with expertise and integrity,
and delivered with passion

FINAL RESULTS | ORGANIC GROWTH +15.6%
13
• Strong flow of new business:
‐ Progressive training and development programmes
‐ 875 (2017: 764) direct SSAS/SIPPs, assets of £365m (2017: £337m)
‐ 291 (2017: 350) personal clients, assets of £67m (2017: £69m)
‐ 52 (2017: 104) corporate clients
‐ Doing business tomorrow with people we don’t know today
• Ownership of distribution:
‐ Nationwide network of introducers
‐ Long-term client relationships
‐ Strategic partnerships
‐ Direct marketing
• Developing our brand:
‐ 27-year history, recognised as a trusted adviser
‐ Branded bespoke products and services
Robust and sustainable
business model
FINAL RESULTS | CONSULTANCY DEVELOPMENT
14
1. New WM consultants over the last five years.
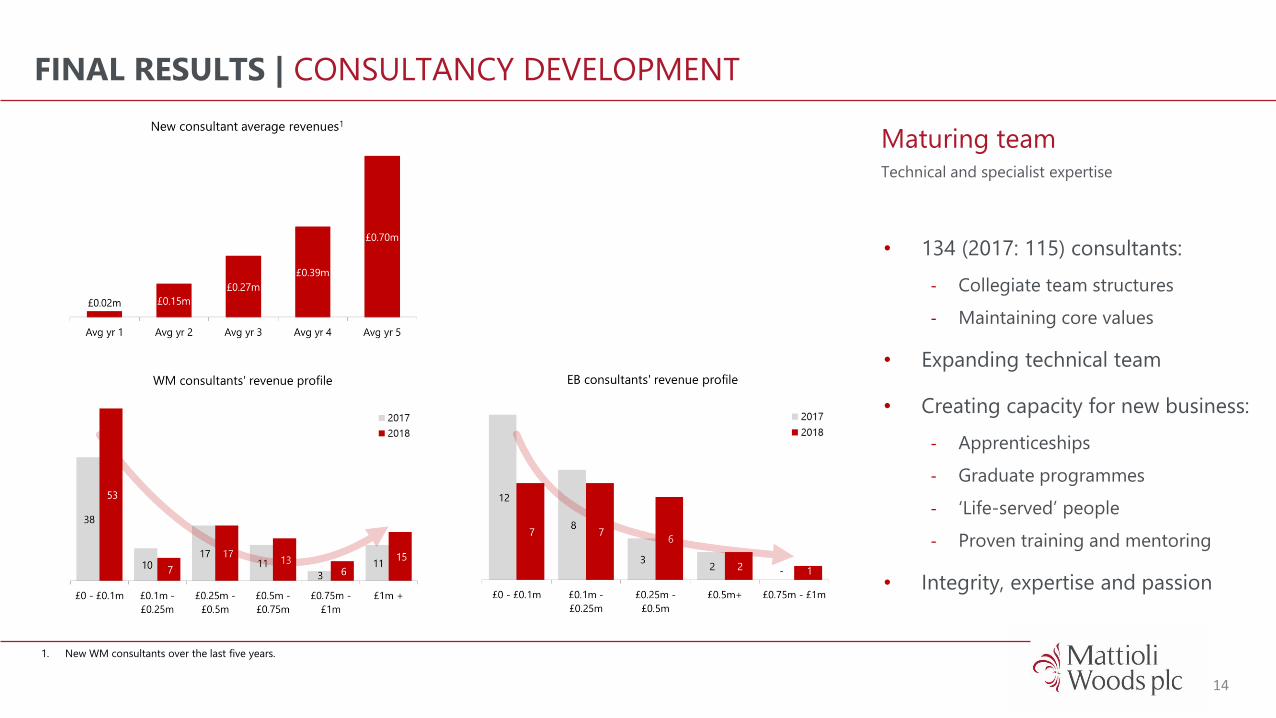
Maturing teamTechnical and specialist expertise
• 134 (2017: 115) consultants:
‐ Collegiate team structures
‐ Maintaining core values
• Expanding technical team
• Creating capacity for new business:
‐ Apprenticeships
‐ Graduate programmes
‐ ‘Life-served’ people
‐ Proven training and mentoring
• Integrity, expertise and passion

FINAL RESULTS | ACQUISITIONS
15
• Broughtons Financial Planning:
‐ 250 clients with over £120m of assets under advice
‐ Total consideration of up to £4.0m
‐ £1.3m deferred over two years, subject to EBITDA hurdles
• Amati Global Investors:
‐ Award-winning specialist fund manager
‐ Own 49%
‐ Total AuM3 of £313m at year end (£120m at investment)
‐ £0.2m share of profit in year
• MC Trustees:
‐ SIPP and SSAS administration
‐ Revenue of £1.7m, EBITDA of £0.5m in first full year
‐ Deferred consideration of up to £0.5m
Pipeline of new
opportunitiesStrong balance sheet offers flexibility
to make further value-enhancing
acquisitions
Fragmented markets
Larger opportunities
Well-defined criteria
1. Return on invested equity, calculated as Adjusted PBT2 divided by equity less intangibles at book value plus intangibles at consideration paid.
2. Profit before taxation, amortisation and impairment of intangibles, share based payments, profit/(loss) on disposals and acquisition-related costs.
3. Gross assets under management by Amati, excluding £12.1m (2017: £9.8m) of cross-holdings between the TB Amati Smaller Companies Fund and the Amati AIM VCT plc.

PROPOSITION
Great client outcomes
FINAL RESULTS | FIVE STRATEGIC PILLARS
16
TECHNOLOGY
One platform,one solution
PEOPLE
Right people, right place, right time
GROWTH
Doing business tomorrow with
people we don’t know today
ORGANISATION
High performance and competitive
advantage
Medium term goals: £100m revenue, £15bn AuM/A/A, 20% sustainable EBITDA margin
FINAL RESULTS | INVESTMENT CASE
17
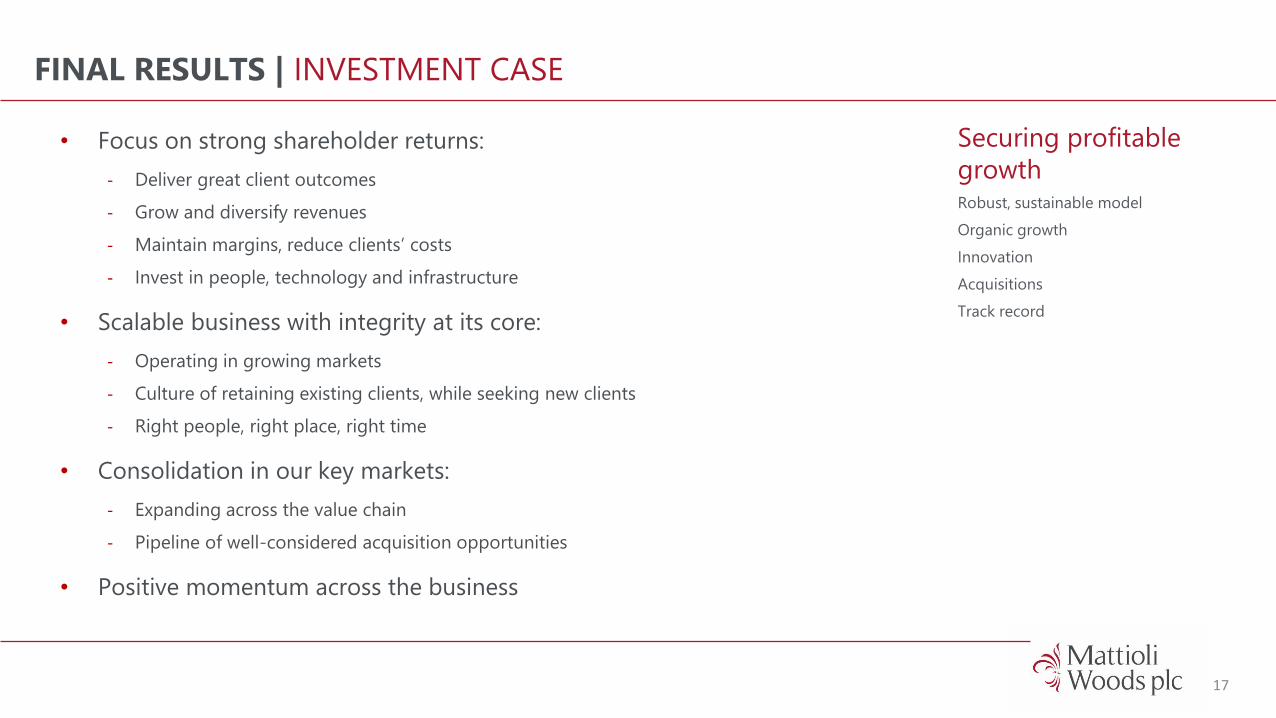
• Focus on strong shareholder returns:
‐ Deliver great client outcomes
‐ Grow and diversify revenues
‐ Maintain margins, reduce clients’ costs
‐ Invest in people, technology and infrastructure
• Scalable business with integrity at its core:
‐ Operating in growing markets
‐ Culture of retaining existing clients, while seeking new clients
‐ Right people, right place, right time
• Consolidation in our key markets:
‐ Expanding across the value chain
‐ Pipeline of well-considered acquisition opportunities
• Positive momentum across the business
Securing profitable
growthRobust, sustainable model
Organic growth
Innovation
Acquisitions
Track record

APPENDICESFinal Results 2018
Getting under the covers!
FINAL RESULTS | APPENDICES
19
• Income statement and underlying EPS
• Dividend
• Segment results
• Client assets
• Revenue yields
• Mattioli Woods Structured Products Fund
• Technology
• Regulation
• Acquisitions
• Shareholders
Robust, sustainable
modelAllows us to deliver great client
outcomes and secure further
profitable growth

FINAL RESULTS | INCOME STATEMENT
201. Note certain figures in the table above may not add due to roundings.
2018
£m
2017
£m %
Recurring
revenues
Investment and asset management 25.1 21.0 +19.5 81.7%
Pension consultancy and administration 21.8 18.9 +15.3 87.7%
Property management 5.9 5.2 +13.5 89.8%
Employee benefits 5.9 5.4 +9.3 81.4%
Revenue 58.7 50.5 +16.2 84.8%
Employee benefits expense (32.1) (28.7) +11.8
Other administrative expenses (12.3) (9.5) +29.5
Share based payments (1.5) (1.9) -21.1
Loss on disposal of property, plant and equipment (0.1) (0.1) -
EBITDA 12.7 10.4 +22.1
Share of profit from associates, net of tax 0.2 0.1 +100.0
Gain on revaluation of Amati option (0.5) (0.1) +500.0
Acquisition-related costs 0.1 0.4 -75.0
Adjusted EBITDA 12.5 10.8 +15.7
Depreciation, amortisation and impairment (3.0) (2.6) +15.4
Net finance costs (0.1) (0.2) -50.0
Share of profit from associates, net of tax 0.2 0.1 +100.0
Profit before tax 9.8 7.7 +27.3
Income tax expense (1.6) (1.3) -23.1
Profit for the period (PAT) 8.2 6.4 +28.1
Strong revenue
and profit growthHigh recurring revenues
Maintaining target margins

FINAL RESULTS | UNDERLYING EARNINGS
21
1. Note certain figures in the table above may not add due to roundings.
2018
£m
2018
pps
2017
£m
2017
pps
in
EPS
Reported profit before tax 9.8 37.2 7.7 29.5
Income tax expense (1.6) (6.0) (1.3) (5.0)
Statutory PAT / Basic EPS 8.2 31.2 6.4 24.5 27.3%
Amortisation on acquired intangibles 1.7 6.7 1.7 6.7
Gain on revaluation of Amati option (0.5) (2.0) (0.1) (0.4)
Notional finance costs 0.2 0.6 0.3 1.0
Acquisition-related costs 0.1 0.5 0.4 1.5
Adjusted PAT / Adjusted EPS 9.7 37.0 8.7 33.3 11.1%
Adjust income tax expense to standard rate (0.3) (1.1) (0.3) (0.8)
Underlying PAT / Underlying EPS 9.4 35.9 8.4 32.5 10.5%
Basic weighted average number of shares 26.2m 26.0m
Effective tax rate 16.2% 16.9%
Standard rate of tax 19.0% 19.8%
Underlying
earnings +10.5%Like-for-like comparison to prior year
£0.5m gain on revaluation of option
Lower acquisition-related costs

FINAL RESULTS | DIVIDEND
22
• Cash generative business
• Proposed total divided of 17.0p (2017: 14.1p)
• Remains well-covered:
‐ 1.8x basic EPS (2017: 1.7x)
‐ 2.2x adjusted EPS (2017: 2.4x)
‐ 3.7x operating cash flow (2017: 2.4x)
• Progressive policy:
‐ 19.4% CAGR in total dividend over last 5 years
‐ 21.2% CAGR in total dividend since IPO
Proposed total
dividend +20.6%Committed to growing the
dividend, while maintaining an
appropriate level of cover

FINAL RESULTS | SEGMENT RESULTS
23
Investment
and asset
management
£m
Pension
consultancy
and admin
£m
Property
management
£m
Employee
benefits
£m
Total
segments
£m
Corporate
costs
£m
Consolidated
£m
AuditedYear ended 31 May 2018
Revenue 25.1 21.8 5.9 5.9 58.7 - 58.7
Segment profit before tax 8.3 3.7 1.0 0.1 13.1 (3.3) 9.8
AuditedYear ended 31 May 2017
Revenue 21.0 18.9 5.2 5.4 50.5 - 50.5
Segment profit before tax 5.0 3.6 1.2 0.5 10.3 (2.6) 7.7
Revenue
synergiesNew business referred
between segments

FINAL RESULTS | INVESTMENT AND ASSET MANAGEMENT
24
• Discretionary portfolio management:
‐ AuM increased to £1.34bn (2017: £1.14bn)
‐ Initial and ongoing charges of £14.2m (2017: £10.7m)
‐ Launched multi-asset funds, reduced custody charges from 1 Aug 2017
• Mattioli Woods Structured Products Fund:
‐ Annual management charges of £0.8m (2017: £0.2m)
‐ Inflows of £115.4m, increasing AuM to £213.8m
• Adviser charges of £10.1m (2017: £10.1m):
‐ Gross assets under advice increased to £2.04bn (2017: £1.52bn)
‐ Increasing proportion invested in CREIT, MW SPF and Amati funds
• Enhancing quality of earnings:
‐ Recurring revenues linked to value of AuM/A
‐ Migrating assets under advice to AuM in acquired portfolios
Revenue +19.5%
to £25.1mStrong investment performance
Lower adviser charges and TERs

FINAL RESULTS | PENSION CONSULTANCY AND ADMINISTRATION
25
• Direct fees +17.7% to £16.6m (2017: £14.1m):
‐ 13.5% increase to 5,834 schemes
‐ Strong client retention, overall attrition rate of 2.6%
• Admin-only fees +4.3% to £4.8m (2017: £4.6m):
‐ Scheme numbers fell to 4,699 (2017: 4,881)
‐ Winding-up distressed portfolios
‐ Stadia Trustees’ clients starting to receive FSCS compensation
• Reclaimed £3.5m of VAT on clients’ behalf
• Banking revenue of £0.4m (2017: £0.2m)
• Future growth opportunities:
‐ Consolidation in sector
‐ Change and complexity driving demand for advice
Over 10,500
SSAS and SIPP
schemesadministered by the Group

FINAL RESULTS | PROPERTY MANAGEMENT
26
• Property investment services:
‐ Discretionary manager of Custodian REIT
‐ Direct investment on behalf of client syndicates
‐ Consultancy and administration
‐ Private Investors Club (PIC)
‐ Property insurance
• Custodian REIT:
‐ £0.5bn portfolio of real estate
‐ High yield, coupled with potential for capital growth
‐ Custodian Capital’s fees linked to NAV
• Private Investors Club:
‐ Sophisticated investors only
‐ Asset-backed and equity investment opportunities
‐ 8 (2017: 5) new syndicates, investing £26.3m (2017: £20.4m)
Revenue +13.5%
to £5.9mFacilitating pooled and direct
property investment

FINAL RESULTS | EMPLOYEE BENEFITS
27
• Consultancy replacing traditional broking service:
‐ Flexible benefits
‐ Workplace advice to address “advice gap”
‐ Multi-generational engagement
‐ Reduced pension-related revenues
• Diversifying ancillary revenues:
‐ Specialist sectors, e.g. charities
‐ Health insurance
‐ MW Private Pension
• Strategic business aims:
‐ Cross-referral between other service lines
‐ Add services to existing clients
‐ Increase referrals from Worldwide Broker Network
‐ £20m revenue, 2,000 clients
Revenue +9.3% to £5.9mAttract, retain, motivate, engage
83%
56%
28%
of employers feel that employees would benefit from financial advice1
of employers plan to do more to help employees make informed choices1
of employers anticipate including financial advice for employees in their budget1
1. Source: Mattioli Woods’ 2017 Employee Benefits Insight Report.

FINAL RESULTS | CLIENT ASSETS
28
Assets under management,
administration and advice
SIPP and
SSAS
£m
Employee
benefits
£m
Personal
wealth and
other assets
£m
Sub-total
£m
Amati1
£m
Total
£m
At 1 June 2017 5,031.3 1,102.3 1,638.1 7,771.7 153.8 7,925.5
Net inflow, including market
movements454.6 135.6 81.3 671.5 132.2 803.7
At 31 May 2018 5,485.9 1,237.9 1,791.4 8,443.2 286.0 8,729.2
Assets under
management
DPM
£m
Custodian
REIT
£m
Mattioli
Woods
SPF
£m
Amati
£m
Gross
AuM
£m
Cross-
holdings
in DPM2
£m
Cross-
holdings
in Amati
funds3
£m
Net
AuM
£m
At 1 June 2017 1,144.8 391.4 98.4 175.7 1,810.3 (76.9) (9.8) 1,723.6
Inflows 273.7 49.1 115.4 103.8 542.0 (44.1) (2.3) 495.6
Outflows (88.7) - - (2.9) (91.6) - - (91.6)
Market movement 11.3 22.1 - 48.5 81.9 - - 81.9
At 31 May 2018 1,341.1 462.6 213.8 325.1 2,342.6 (121.0) (12.1) 2,209.5
1. Assets under management of £286.0m (2017: £153.8m) excludes £27.0m (2017: £12.1m) of Mattioli Woods’ client investment included within SIPP and SSAS, employee benefits and personal
wealth and other assets and excludes £12.1m (2017: £9.8m) of cross-holdings between the TB Amati Smaller Companies Fund and the Amati AIM VCT plc.
2. Comprises £30.4m (2017: £28.3m) invested in Custodian REIT, £69.2m (2017: £36.7m) in the Mattioli Woods Structured Products Fund and £21.4m (2017: £11.9m) in Amati funds.
3. Cross-holdings between the TB Amati Smaller Companies Fund and the Amati AIM VCT plc.
Total client assets
+10.1% to £8.73bnGross AuM +29.3% to £2.34bn

FINAL RESULTS | REVENUE YIELDS
29
Client assets
Average annual
…….revenue yield
2018 2017 2018 2017
By division £bn £bn bps bps
Wealth Management1 7.20 6.67 73 68
Employee Benefits2 1.24 1.10 47 49
Total (excluding Amati) 8.44 7.77 69 65
By segment3 £bn £bn bps bps
Pension consultancy and administration 5.49 5.03 40 38
Investment and asset management 3.60 2.77 70 76
Property management 0.54 0.44 109 116
1. Comprises pension consultancy and administration, investment and asset management and property management.
2. Employee benefits revenues are not typically linked to the value of client assets.
3. Certain assets are included in more than one segment (for example, assets under advice held within a client’s pension scheme are included in “pension consultancy and
administration” and “investment and asset management”).
Integrated modelAddressing more of the value
chain, with the aim of lowering
clients’ TERs

FINAL RESULTS | STRUCTURED PRODUCTS FUND
30
• Assets under management now exceed £200m
• Builds on existing structured product initiative
• Adds the benefits of:
‐ Collateralisation
‐ Instant diversification
‐ Continuous availability
‐ Liquidity
• Collateral in the form of UK Gilts
• Target average annual return is 3m GBP LIBOR + 6% over a rolling three-year period
Developing our
funds businessInnovative product development

FINAL RESULTS | TECHNOLOGY
31
• Recent successful implementations:
‐ Cloud migration to Azure
‐ Workday HR and payroll system
• Further projects to transform landscape:
‐ Group-wide Client Relationship Management system
‐ Client portal
‐ Enhancement of MWeb
• Key outcomes:
‐ Consolidated view of all a client’s assets on web-based or mobile app
‐ No servers in any of our offices, significantly improved security
‐ Operational efficiencies
• Expenditure in line with budget:
‐ Capex of £1.0m on IT development
Scalable, agile
and stableOne platform, one solution
FINAL RESULTS | REGULATION
32
• Regulated by FCA:
‐ C3 “flexible portfolio” firm
‐ P3 firm (prudentially non-significant)
‐ IFPRU €50k limited licence firm
‐ Custodian Capital is an AIFM
• Regulatory landscape:
‐ FS18/8 and CP18/9 Asset Management Market Study
‐ FCA CP18/17 Retirement Outcomes Review
‐ FCA/tPR (Pensions Regulator) Campaign on pension scams and banning cold calling
‐ FCA DP18/5 Duty of Care
‐ Pushing burden onto providers to ensure products are suitable for ultimate intended customer
Strong compliance
culturePeriod of unprecedented change

FINAL RESULTS | REGULATION
33
• Withdrawn from giving transfer advice on DB pensions:
‐ FCA continue to review market
‐ Increasing costs of regulation and resources required
‐ Evolving professional indemnity insurance market
• MiFID II in effect from 3 Jan 2018:
‐ Inducements
‐ Costs and charges
‐ Product governance
‐ Role of compliance
• Managing conflicts - our policy:
‐ Transparent client communication and disclosure
‐ Suitability checks on products and services
‐ Delivering fair client outcomes
‐ Remuneration structures avoid bias
Integrated model to
deliver better client
outcomesRegulator recognises demand for
advice
RDR facilitates vertically-
integrated models
Designed for long-term
sustainability
Reducing client costs

FINAL RESULTS | REGULATORY CAPITAL REQUIREMENT
34
Regulatory capital
2018
£m
2017
£m
CET1 capital after adjustments1 29.7 23.4
Pillar 1 minimum capital requirement 10.1 9.1
Surplus before Pillar 2A 19.6 14.3
Incremental Pillar 2A requirement 0.8 0.9
Regulatory capital requirement 10.9 10.0
Surplus 18.8 13.4
Surplus as % of requirement 172% 134%
• Flexibility to pursue acquisitions:
‐ Broughtons acquisition reduces surplus by £3.2m
• Common Equity Tier 1 (CET1) capital:
‐ Total equity less intangibles
• Pillar 1 own funds requirement:
‐ Credit risk
‐ Market risk
‐ Operational risk
• Pillar 2A requirement:
‐ Stress-testing key risks over a one year horizon
1. Common Equity Tier 1 (“CET1”) capital including: shares issued during the period and admitted to CET1 capital following the year end,
proposed dividends and retained earnings for the year.
Understanding our
capital positionStrong balance sheet

0
100
200
300
400
500
600
700
800
900
1000
May 05 May 06 May 07 May 08 May 09 May 10 May 11 May 12 May 13 May 14 May 15 May 16 May 17 May 18
Shar
e p
rice
(p
)
Share price since IPO
FINAL RESULTS | ACQUISITIONS
35
Jan 2006:
Acq of
Suffolk Life
portfolio
£0.7m
Jan 2008:
Acq of JB
Group
£1.8m
Jan 2010:
Appointed to
Freedom
SIPP
Aug 2010:
Acq of City
Pensions
£2.1m
June 2012:
Appointed to
Pilgrim SIPP
July 2013:
Acq of
Atkinson
Bolton
£6.2m
Sept 2015:
Acq of Taylor
Patterson
£8.3m
Aug 2014:
Acq of
UKWM
Pensions
£0.4m
Jan 2016:
Acq of
MMH
£0.2m
Feb 2017
Acq of 49%
of Amati
£3.3m
Jul 2007
Acq of
Pension
Consulting
£2.0m
Apr 2010
Acq of CP
Pensions
£0.7m
Aug 2011
Acq of
Kudos
£10.0m
Apr 2013
Acq of
Ashcourt
Rowan
Pensions £1.2m
Jun 2013
Appointed to
HD SIPP
Jan 2015:
Acq of
Torquil Clark
Pensions
£1
Jun 2015:
Acq of Boyd
Coughlan
£7.0m
Oct 2015:
Acq of
Lindley
Trustees
£0.2m
Feb 2016:
Appointed to
Stadia
Trustees
£0.2m
Sep 2016:
Acq of MC
Trustees
£2.4m
Track record of
adding value21 acquisitions since IPO
Track record of successful
integration
£4m acquisition of
Broughtons Financial
Planning in Aug 2018
Aug 2018
Acq of
Broughtons
£4.0m
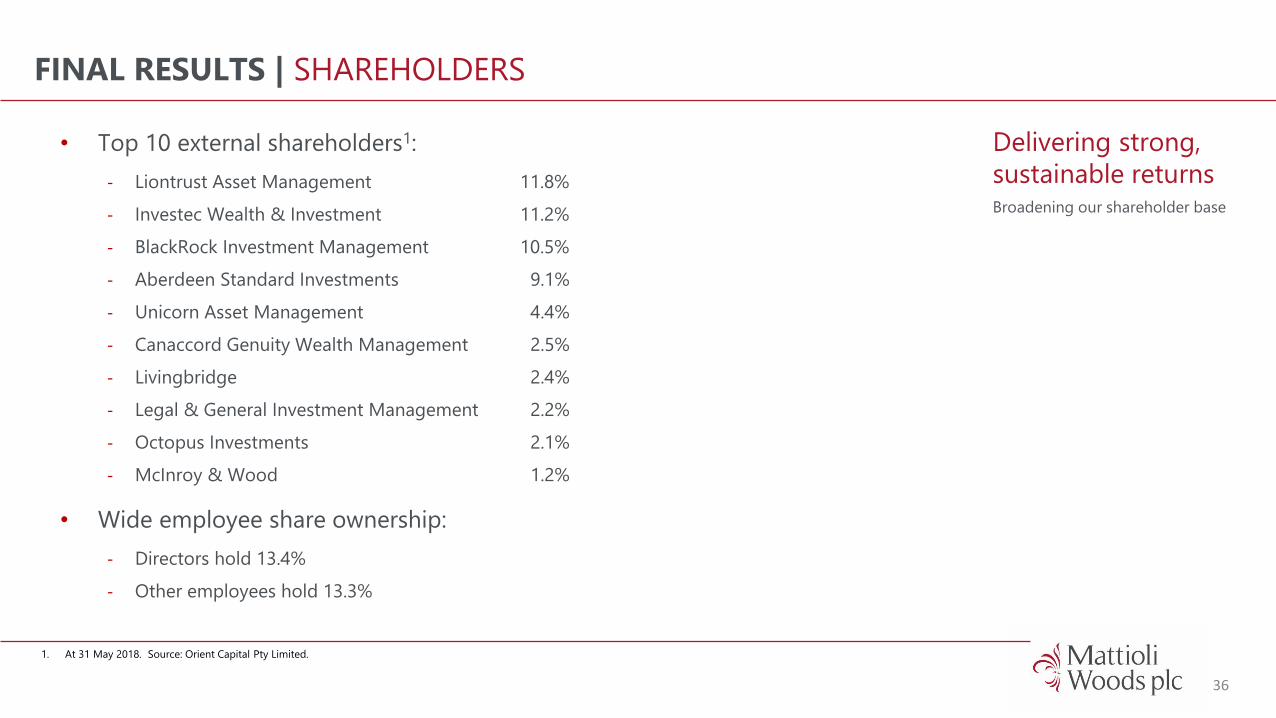
FINAL RESULTS | SHAREHOLDERS
36
• Top 10 external shareholders1:
‐ Liontrust Asset Management 11.8%
‐ Investec Wealth & Investment 11.2%
‐ BlackRock Investment Management 10.5%
‐ Aberdeen Standard Investments 9.1%
‐ Unicorn Asset Management 4.4%
‐ Canaccord Genuity Wealth Management 2.5%
‐ Livingbridge 2.4%
‐ Legal & General Investment Management 2.2%
‐ Octopus Investments 2.1%
‐ McInroy & Wood 1.2%
• Wide employee share ownership:
‐ Directors hold 13.4%
‐ Other employees hold 13.3%
Delivering strong,
sustainable returnsBroadening our shareholder base
1. At 31 May 2018. Source: Orient Capital Pty Limited.