getting students ready for algebra 1
DESCRIPTION
Getting STudents Ready for AlgebraTRANSCRIPT

SouthernRegionalEducationBoard
592 10th St. N.W.Atlanta, GA 30318(404) 875-9211www.sreb.org
HIGH SCHOOLS
THAT WORK
MAKING
MIDDLE GRADES
WORK
MAKING SCHOOLS
WORK
Getting Students Readyfor Algebra I:
What Middle Grades Students Need to Know and Be Able to Do

Visits in the last several years to well over 100 middle grades schools indicate that the schools’ goals andpriorities often are unclear to teachers, students and the community. States have set content and per-
formance standards in each core academic area, but these standards need to be translated into daily work inthe classroom. Identifying readiness indicators for Algebra I is one way to translate middle school mathemat-ics content standards for the classroom. It is also a way to guide high schools in planning and imple-menting catch-up courses in mathematics for incoming ninth-graders. The Southern RegionalEducation Board (SREB) worked with a panel of teachers and experts from the Educational Testing Service(ETS) to develop Algebra I readiness indicators.
Based on their objective judgments, the panel members — using the National Assessment ofEducational Progress (NAEP) as a reference — developed definitions of the Basic, Proficient and Advancedlevels of proficiency. The panel used these definitions to evaluate items on the Middle Grades Assessment —which uses publicly-released items from NAEP — and to define what students should know and be able todo to be successful in Algebra I. The SREB panel used its definitions of Basic, Proficient and Advanced todetermine the proficiency level for each item in the Benchmark Proficiency Progression charts, the LearningActivities and Applications, and the Proficiency Level Illustrations in this report. The process the SREBpanel used was less complex than the process NAEP uses. Therefore, the panel’s determinations of theproficiency levels are not to be construed as equivalent to the NAEP process.
This report is not intended to answer all curriculum-related questions or to serve as a complete teachingplan. Instead it is designed to assist curriculum planners, principals and teachers. It is intended to help themdevelop frameworks, course syllabi, lesson plans, assignments, assessments and staff development activitiesthat will enable students to meet the demands of the high-level mathematics courses they will encounterafter leaving the middle grades. This report is a tool to help middle grades and high schools set goalsand priorities for mathematics that will get all students ready for Algebra I and help them complete itsuccessfully by the end of ninth grade.
States that are a part of SREB are committed to reaching every student through a series of 12 goals designedto lead the nation in educational achievement. One of these 12 goals specifically addresses the middle grades:
Achievement in the middle grades for all groups of students exceeds national averages and performance gaps are closed.
In the 2002 High Schools That Work (HSTW ) survey, 32 percent of career/technical students reportedtaking some form of Algebra I by the end of grade eight. According to the NAEP 2000 MathematicsAssessment, about 25 percent of eighth-graders nationally took Algebra I.1 Two-thirds of the nation’s eighth-grade students are at or above the Basic level in mathematics as measured by NAEP, but on NAEP’s mostrecent assessment, students as a whole from only four SREB states performed at that level. One-fourth ofeighth-graders nationally are at or above the Proficient level in mathematics as measured by NAEP, but stu-dents as a whole from only three SREB states performed at that level. Based on the most recent NAEP stateassessment in mathematics, in SREB states using Basic as the level of readiness for Algebra I, the percentagesof students ready for Algebra I range from 41 percent in Mississippi to 70 percent in North Carolina. InSREB states using Proficient as the level of readiness for Algebra I, the percentages of students range fromnine percent in Mississippi to 36 percent in North Carolina.
This report provides guidance for a rigorous mathematics program in the middle grades and for catch-up mathematics courses at the high school level. High quality mathematics instruction based on a solid setof essential standards can prepare all students to perform at least at the Basic level of proficiency and anincreasing percentage of students to perform at the Proficient level.
Gene BottomsSenior Vice PresidentSouthern Regional Education Board
1 National Center for Education Statistics, National Assessment of Educational Progress (NAEP), 2000Mathematics Assessment at http://nces.ed.gov/nationsreportcard/mathematics/results.
Foreword
i

ii
Why Develop Readiness Indicators for Algebra I? . . . . . . . . . . . . . . . . . . . . . . . . . . . . . . . . . . . . . . . 1
How Were the Readiness Indicators Developed? . . . . . . . . . . . . . . . . . . . . . . . . . . . . . . . . . . . . . . . . . 2
How the Report Is Organized . . . . . . . . . . . . . . . . . . . . . . . . . . . . . . . . . . . . . . . . . . . . . . . . . . . . . . 3
How Can Educators Use this Report? . . . . . . . . . . . . . . . . . . . . . . . . . . . . . . . . . . . . . . . . . . . . . . . . 4
Overarching Mathematics Skills and Concepts . . . . . . . . . . . . . . . . . . . . . . . . . . . . . . . . . . . . . . . . . . 5
Process Readiness Indicators
1. Problem Solving . . . . . . . . . . . . . . . . . . . . . . . . . . . . . . . . . . . . . . . . . . . . . . . . . . . . . . . . . . 6
2. Reading and Communicating . . . . . . . . . . . . . . . . . . . . . . . . . . . . . . . . . . . . . . . . . . . . . . . . 7
3. Estimating and Verifying Answers and Solutions . . . . . . . . . . . . . . . . . . . . . . . . . . . . . . . . . . 8
4. Logical Reasoning . . . . . . . . . . . . . . . . . . . . . . . . . . . . . . . . . . . . . . . . . . . . . . . . . . . . . . . . . 9
5. Using Technology . . . . . . . . . . . . . . . . . . . . . . . . . . . . . . . . . . . . . . . . . . . . . . . . . . . . . . . . 10
Content-specific Readiness Indicators . . . . . . . . . . . . . . . . . . . . . . . . . . . . . . . . . . . . . . . . . . . . . . . 11
Content-specific Readiness Indicator 1. . . . . . . . . . . . . . . . . . . . . . . . . . . . . . . . . . . . . . . . . . . . . . . 12
Proficiency Level Illustrations for Content Indicator 1 . . . . . . . . . . . . . . . . . . . . . . . . . . . . . . . . 13
Content-specific Readiness Indicator 2. . . . . . . . . . . . . . . . . . . . . . . . . . . . . . . . . . . . . . . . . . . . . . . 14
Proficiency Level Illustrations for Content Indicator 2 . . . . . . . . . . . . . . . . . . . . . . . . . . . . . . . . 15
Content-specific Readiness Indicator 3. . . . . . . . . . . . . . . . . . . . . . . . . . . . . . . . . . . . . . . . . . . . . . . 16
Proficiency Level Illustrations for Content Indicator 3 . . . . . . . . . . . . . . . . . . . . . . . . . . . . . . . . 17
Content-specific Readiness Indicator 4. . . . . . . . . . . . . . . . . . . . . . . . . . . . . . . . . . . . . . . . . . . . . . . 18
Proficiency Level Illustrations for Content Indicator 4 . . . . . . . . . . . . . . . . . . . . . . . . . . . . . . . . 19
Content-specific Readiness Indicator 5. . . . . . . . . . . . . . . . . . . . . . . . . . . . . . . . . . . . . . . . . . . . . . . 20
Proficiency Level Illustrations for Content Indicator 5 . . . . . . . . . . . . . . . . . . . . . . . . . . . . . . . . 21
Content-specific Readiness Indicator 6. . . . . . . . . . . . . . . . . . . . . . . . . . . . . . . . . . . . . . . . . . . . . . . 22
Proficiency Level Illustrations for Content Indicator 6 . . . . . . . . . . . . . . . . . . . . . . . . . . . . . . . . 23
Content-specific Readiness Indicator 7. . . . . . . . . . . . . . . . . . . . . . . . . . . . . . . . . . . . . . . . . . . . . . . 24
Proficiency Level Illustrations for Content Indicator 7 . . . . . . . . . . . . . . . . . . . . . . . . . . . . . . . . 25
Content-specific Readiness Indicator 8. . . . . . . . . . . . . . . . . . . . . . . . . . . . . . . . . . . . . . . . . . . . . . . 26
Proficiency Level Illustrations for Content Indicator 8 . . . . . . . . . . . . . . . . . . . . . . . . . . . . . . . . 27
Content-specific Readiness Indicator 9. . . . . . . . . . . . . . . . . . . . . . . . . . . . . . . . . . . . . . . . . . . . . . . 30
Proficiency Level Illustrations for Content Indicator 9 . . . . . . . . . . . . . . . . . . . . . . . . . . . . . . . . 31
Content-specific Readiness Indicator 10. . . . . . . . . . . . . . . . . . . . . . . . . . . . . . . . . . . . . . . . . . . . . . 32
Proficiency Level Illustrations for Content Indicator 10 . . . . . . . . . . . . . . . . . . . . . . . . . . . . . . . 33
Content-specific Readiness Indicator 11. . . . . . . . . . . . . . . . . . . . . . . . . . . . . . . . . . . . . . . . . . . . . . 34
Proficiency Level Illustrations for Content Indicator 11 . . . . . . . . . . . . . . . . . . . . . . . . . . . . . . . 35
Content-specific Readiness Indicator 12. . . . . . . . . . . . . . . . . . . . . . . . . . . . . . . . . . . . . . . . . . . . . . 36
Proficiency Level Illustrations for Content Indicator 12 . . . . . . . . . . . . . . . . . . . . . . . . . . . . . . . 37
Answers to Proficiency Level Illustrations . . . . . . . . . . . . . . . . . . . . . . . . . . . . . . . . . . . . . . . . . . . . . 38
Table of Contents

BasicStudents performing at the Basic level are able to work with the four arithmetic operations in one-
or two-step word problems. They can identify and apply some mathematical definitions on an elemen-tary level. While these students are likely to possess a satisfactory level of competency with computa-tion, they routinely lack a conceptual understanding of many fundamental mathematical concepts andare usually not able to regularly implement simple reasoning and problem-solving strategies.
At the Basic level, students are able to recognize pictorial representations of fractions, read rulersand scales, and recognize which units of measurement are most appropriate for a given situation. Theycan identify geometric shapes and properties of those shapes and can visualize transformations of fig-ures. Students at this level are able to construct graphs, such as bar graphs and pictographs if a scale isgiven in the problem, and can read and interpret information from graphs. They also are able to workwith simple probabilities and can find the mean of a set of numbers. In algebra, students at the Basiclevel can extend simple number patterns, work with positive and negative numbers, evaluate simpleexpressions, and solve equations with one variable. They are beginning to develop an understanding ofrepresentation by locating ordered pairs on a coordinate grid and by constructing number sentences.
ProficientStudents performing at the Proficient level possess a working knowledge of many fundamental mathe-
matical ideas and are beginning to interpret and apply concepts and abstract ideas. They are able to workwith problems containing more than one or two pieces of mathematical information. These students gener-ally exhibit an emerging knowledge and understanding of more formalized algebra topics.
At the Proficient level, students are able to use reasoning in their numerical computations and inworking with data in order to interpret their results in the context of the problem. For example, in aproblem requiring students to find the number of buses needed for a field trip, if the result is 12 1/4buses, students will know that 13 buses will be needed for the trip. They can also extract informationfrom graphs and combine that information with their knowledge of other topics in mathematics to solvea problem. At this level, students are able to work with measurement topics that incorporate severalideas. For instance, they are able to recall that the sum of the three angles of a triangle is 180 degrees andcan apply that information correctly in a problem. In the area of algebra, students can work with repre-sentations to perform operations, such as combining like algebraic terms and solving linear equations intwo variables, and they may be beginning to develop an understanding of algebraic identities.
AdvancedStudents performing at the Advanced level are able to work confidently with abstract representations
of fundamental mathematical concepts. They can work effectively with whole numbers, integers, rationalnumbers and their equivalents. These students are developing mathematical reasoning processes and ana-lytical techniques in order to solve more complex problems, and they may be able to use a more efficientsolution strategy if one is available.
At the Advanced level, students are able to utilize properties in geometry to analyze geometric sit-uations and can begin to recognize the formal structure of geometry. For example, they are able toidentify counterexamples for certain properties of geometric shapes. In algebra, students at theAdvanced level possess a thorough understanding of patterns, such as the ability to generalize patterns,construct algebraic representations of patterns and work with complex patterns involving multipleoperations that may include powers. These students may also be successful in solving some types ofnon-routine problems.
iii
SREB Performance Descriptors for Grade Eight Mathematics
Getting Students Ready for Algebra I

1
Getting Students Ready for Algebra I
As more states increase their high school graduationrequirements in mathematics and as the number of studentsin these states who cannot pass the state algebra test increas-es, more students will not receive high school diplomas.Algebra I is the key — and the barrier — to students’ abilityto complete a challenging mathematics curriculum in highschool. In the 2001 ninth grade follow-up study, 62 percentof students in HSTW sites who took something called “alge-bra” in the middle grades took college-preparatory mathe-matics in grade nine. Of these students, 15 percent failed. Incontrast, 35 percent of students who did not take somethingcalled “algebra” in the middle grades took college-preparatorymathematics in grade nine. Of this group, 27 percent failed.Clearly, students introduced to algebraic skills and conceptsearlier are more likely to succeed in a high school algebracourse if they are given the opportunity to do so.
Also according to the 2001 ninth grade follow-upstudy, 39 percent of students in grade eight who scored inthe two lowest quartiles on the Making Middle Grades Work(MMGW) mathematics assessment and who took college-preparatory mathematics in grade nine made a grade of “D”or “F.” Of the students scoring in these same two lowestquartiles in achievement who took lower-level mathematicsin grade nine, 39 percent made a “D” or an “F.” Thismeans that almost two out of five eighth-graders scoringin the lowest two quartiles in mathematics achievementfail whatever mathematics course they take in gradenine. However, when these students are enrolled inhigher level courses, they are not more likely to fail.Given quality teaching, extra time and help, even more ofthese students could succeed.
Greater percentages of high school graduates areenrolling in postsecondary education programs that requirecompletion of higher levels of mathematics than manyschools currently require for graduation. According to the2002 HSTW survey, 56 percent of career/technical studentscompleted four or more mathematics courses during highschool. This means that 44 percent did not. According toSREB’s Benchmark 2000 series, in every SREB state morethan 20 percent of students entering two-year collegesneeded remedial courses in mathematics.2 The highestremediation rate was more than 70 percent.
A score of 19 is a common standard on the ACT forplacement in remedial courses. In the SREB states where mosthigh school seniors take the ACT, the percentages of studentswho scored below 19 in mathematics ranged from 49 percentto 74 percent. Nationally, 48 percent of students scored below19 in mathematics on the ACT. For four-year colleges anduniversities, the percentages of entering students who took atleast one remedial course in reading, writing or mathematicsranged from 10 percent to more than 40 percent. Clearly,completing a challenging mathematics curriculum isessential to being prepared for postsecondary education.
Obtaining and succeeding in the “good” jobs of today’seconomy require an ever-increasing breadth and depth ofmathematical skills and concepts. According to The SkillsGap 2001 by the National Association of Manufacturers,“Poor reading, writing, math and communication skills weresignificant concerns.”3 Twenty-six percent of respondentscited that one of the most serious deficiencies in currentemployees was inadequate mathematics skills. According toReality Check 2002,4 63 percent of employers give studentsfair or poor ratings in mathematics. These findings supportthe conclusion that success in college-preparatory mathe-matics courses in high school leads to more opportunitiesafter high school. This is not very likely to occur without acorrespondingly rigorous mathematics curriculum in themiddle grades. This middle grades curriculum must helpstudents complete Algebra I in grade eight or prepare forAlgebra I in grade nine.
In many middle grades classrooms, teachers are unsurehow to prepare students for Algebra I. They are teachingmathematics without aligning what they teach to a rigorousmathematics framework aimed at getting students ready forAlgebra I. There are numerous curriculum documents at thenational, state and district levels that provide standards andframeworks regarding what students should learn in middlegrades mathematics. However, these documents give teacherslittle or no guidance about the depth of understanding stu-dents need on the most essential readiness indicators forAlgebra I. As a consequence, far too many middle gradesteachers repeat sixth-grade mathematics content in gradesseven and eight rather than focusing on developing stu-dents’ understanding of these essential readiness indicators.
Why Develop Readiness Indicators for Algebra I?
With state accountability programs now operating or scheduled in every SREB state, states, districts and schools havenever had a more compelling need to raise students’ mathematics achievement — especially in the middle grades —
than they do now. The No Child Left Behind Act of 2001 gives schools a further incentive to improve mathematics achieve-ment. They are required to work toward getting all groups of students to perform at least at the states’ defined levels ofProficient in mathematics.
2 Reducing Remedial Education: What Progress Are States Making?, SREB Educational Benchmark 2000 Series.3 Center for Workforce Success and Andersen, The Skills Gap 2001, National Association of Manufacturers, 2001.4 Reality Check 2002, Public Agenda at www.publicagenda.org.

Getting Students Ready for Algebra I
2
How Were the Readiness Indicators Developed?
This report is based on a review of current state and district curriculum guides in mathematics and discussions with apanel of curriculum developers and expert teachers of algebra and higher-level mathematics.
Any attempt to build a rigorous middle grades mathematics curriculum must begin with these two questions:
� What are the essential mathematics skills and concepts (Readiness Indicators) that studentsmust master by the end of the middle grades, or in a catch-up course in grade nine, in orderto succeed in Algebra I?
� What are some examples of the proficiency levels for each of the mathematics ReadinessIndicators identified?
Preparation of this report began with a review of major mathematics curriculum documents including:
� the National Council of Teachers of Mathematics’ Principles and Standards for School Mathematics,
� curriculum materials underlying the National Assessment of Educational Progress (NAEP), and
� curriculum guides from the SREB Middle Grades Consortium member states and selectedother states.
An analysis of these frameworks yielded a fairly lengthy list of standards for middle grades mathe-matics. An expert panel of classroom teachers and curriculum specialists selected from this list thosestandards that represent the most essential skills and concepts for success in Algebra I. Identifying cur-riculum standards that are most important for high school success ensures that essential material doesnot fall through the cracks — either for lack of time or because it is too challenging. To help panelmembers narrow their selections, they were asked to think about the following questions:
� What knowledge, skills and experiences in mathematics do students entering high school mostoften lack that they should have acquired in earlier grades?
� What skills, knowledge and experiences in mathematics separate students who enter and succeedin a rigorous high school mathematics curriculum from those who do not?
� What skills and knowledge in mathematics that students should acquire in the middle gradestake the most time to reteach?
� What deficiencies in knowledge and understanding are most difficult to remedy and whichones continue to plague students in later courses?
After submitting their responses, panel members met and began discussions to identify the set ofessential mathematics skills and concepts. After numerous telephone conferences and e-mail communi-cations, the panel reached a consensus regarding the essential mathematics skills and concepts for suc-cess in Algebra I — the 17 Readiness Indicators in this report. Then, with the help of ETS and SREBstaff, the panel developed definitions of Basic, Proficient and Advanced levels of mathematics perform-ance at grade eight. (See page iii.) These definitions guided the panel and staff to develop theBenchmark Proficiency Progression charts for each Readiness Indicator and to create the LearningActivities and Applications. Panelists reviewed various assessment items including the publicly-releasedNAEP items and made judgments about which items best illustrated their definitions of the proficien-cy levels. These judgments are not to be construed as equivalent to the NAEP standards of Basic,Proficient and Advanced. The panel also created test items to supplement the publicly-released test-item examples at each proficiency level. Then panel members and other mathematics experts reviewedthe final draft of the report and offered suggestions for making it useful to educators.

3
Getting Students Ready for Algebra I
A Benchmark Proficiency Progression chart listingmajor benchmarks for the indicator at each proficiency levelfollows each description. These charts help teachers andadministrators identify the skills and concepts that studentsshould master to succeed in Algebra I. While many studentsare performing below the Basic level in mathematicsachievement, the Making Middle Grades Work (MMGW)goal is to get all students to achieve at the Basic level and anincreasing percentage to achieve at the Proficient andAdvanced levels. The MMGW initiative believes that underthese conditions, students with quality teaching and qualityextra help and time will be successful in Algebra I.
Next is a list of Learning Activities and Applications thatrepresent suggestions for Basic, Proficient and Advancedassignments. These activities connect the mathematicsReadiness Indicators to mathematics contexts in other sub-jects, to other areas of mathematics and to the world outsideschool. All of these activities and applications encompass oneor more of the first five Process Readiness Indicators — theOverarching Skills and Concepts. Extending mathematics
instruction beyond just drill-type exercises is necessary, notonly to generate student interest, increase motivation andchallenge students intellectually, but also to help studentsrealize the importance of mathematics in their everyday livesand in their futures. This type of instruction also provides acontext of understanding and retaining mathematical knowl-edge. The goal of promoting numeracy across the curricu-lum should be shared by all teachers.
The section containing the 12 Content-specificReadiness Indicators also provides test-item examples calledProficiency Level Illustrations. The sample test items showhow each Content-specific Readiness Indicator translatesinto test items at each level of proficiency.5 Many of theexamples are publicly released items from NAEP; others arepublicly released items from individual state assessments orcurriculum documents, and others have been created specif-ically by the panel for this report.
*Basic
Reached by all students somewherein the beginning of the middlegrades or somewhere around thepoint at which the topic is firstintroduced. Students at this levelmay succeed in Algebra I if givenenough extra help and time.
*Proficient
Reached by more and more studentsat the end of the middle grades. Notall students will achieve this level inthe middle grades, but all should beexposed to the knowledge, materialand assignments associated with it.Students at this level are very likelyto succeed in Algebra I.
*Advanced
Reached by some students by the endof the middle grades and by morestudents by the end of grade 10.
* These three proficiency levels are based on the categories used by the Making Middle Grades Work NAEP-basedassessment of student progress. (See page iii.)
Benchmark Proficiency Progression
How the Report Is Organized
This report is organized around 17 Readiness Indicators; the first set of five Process Readiness Indicators represents theskills and concepts that should be incorporated into mathematics at all grade levels and in all courses. The second set
of 12 Readiness Indicators addresses essential content-specific skills and concepts that prepare students for Algebra I. EachReadiness Indicator is described and includes some examples of how the indicator relates to the preparation for algebra, aswell as suggestions to help teachers teach the skills and concepts that students need.
5 All items were labeled at given proficiency levels by the panel members andnot by the organizations associated with those assessments.
Getting Students Ready for Algebra I
4
Educators can examine current standardized test resultsto see which items their students are not answering correct-ly. This analysis and a comparison to the ReadinessIndicators provide information to help educators targetcontent areas to improve student achievement and preparethem for Algebra I. The Benchmark Proficiency Progressioncharts guide educators to improve standardized test scoresso that all students achieve at least at the Basic level andmore and more achieve at the Proficient and Advanced lev-els. Without a clear and consistent understanding of whatdoes and does not meet standards, it is impossible to claimthat students have met the standards — even if they haveonly the most basic understanding of a topic.
The sample test items at each proficiency level can helpcurriculum planners, principals and teachers analyze howtheir students perform on the various indicators. Educatorscan gather a sample of their own assessments from mathe-matics classes to determine what proportion of their testitems are below the Basic level, or at the Basic, Proficient orAdvanced levels. If students are not assessed in class atthe Basic level or above, then they cannot be expected toperform at these levels on high-stakes tests.
Curriculum planners, principals and teachers can use thesample Learning Activities and Applications at each proficiencylevel to help them evaluate student assignments. By collectinga sample of assignments around one or more of the readinessindicators, they can determine the levels of assignments given.For each indicator they should ask these types of questions:
� What is the most frequent level of assignmentsgiven? What percentage of assignments is at theBasic level or below? What percentage of assign-ments is at the Proficient level or above?
� As a result of looking at the level of assignments,have teachers been more purposeful in giving stu-dents higher level assignments?
� Are assignments limited to drill-type exercises thatstudents have already mastered, or are they designed
to have students practice new concepts and strate-gies to solve more complex problems?
Even students who are considered to be struggling needto be challenged by rigorous materials — especially open-ended problems. If they are not expected to do open-endedproblems in class and for homework, then they cannot beexpected to succeed on them on high-stakes assessments. If students are never given Basic- and Proficient-levelassignments and are not assessed at these levels or higher,then they cannot be expected to achieve at these levels.
Educators need to examine how each of these indica-tors is taught.
� Are students assigned problems in real-world con-texts that engage them in the learning process?
� Are the problems complex enough to force studentsto use logical reasoning and a variety of solutionstrategies and mathematics skills and concepts?
� Are students sharing their ideas for solving prob-lems with their classmates? Are they explainingtheir solution processes to the class?
� Are students using technology to aid them in thesolution process?
Finally, high school educators can use this report todevelop tests that will help them determine the readinessindicators students have mastered and the ones they havenot. To get ready for Algebra I, some students may requiresummer school while those with a greater deficiency mayrequire an 18-week, specially designed catch-up course.
Students need to be challenged by interesting materialsand provided the extra time and help they need to improvetheir achievement. Rather than experiencing low expecta-tions by practicing skills they have already mastered, stu-dents should complete rigorous and challenging work thathelps them meet and exceed higher expectations.
How Can Educators Use this Report?
The 17 Readiness Indicators can guide curriculum planners, principals and teachers in examining what they currentlyteach, how they teach it, and how much time they spend engaging students with each of these skills and concepts.
They can compare the Readiness Indicators with the topics in their local curriculum frameworks and in their teachingplans. They should ask these types of questions:
� Are these essential topics in mathematics given the time and depth of coverage necessary to prepare students for Algebra I?
� Are there other topics that are given too much attention so that topics crucial for success in Algebra I are not fullydeveloped or not included at all?

5
Getting Students Ready for Algebra I
These five Readiness Indicators: problem solving, readingand communicating, estimating and verifying answers
and solutions, logical reasoning, and using technology areprocesses found in all areas of mathematics. Whether in arith-metic, algebra, geometry or calculus, problem-solving skills areessential for analyzing problems and developing solutionstrategies. Students in the middle grades should have prob-lem-solving experiences that promote mathematical learningand reasoning and that prepare them for Algebra I.
Integral to problem solving is reading and communicat-ing. When faced with problems to solve in any area ofmathematics, by the end of the middle grades studentsshould have mastered reading the problem, interpretingwhat the problem states and understanding what is askedfor in the problem. Students must be able to use the lan-guage of mathematics orally and in writing to explain thethinking processes, mathematical concepts and solutionstrategies they use in solving problems.
After solving any problem, students use a variety oftechniques including estimation to verify their answers. Themastery of these techniques in the middle grades helps stu-dents recognize correct answers, check for reasonablenessand identify their mistakes so that they can revise theirwork. After revising their work, students record theiranswers using appropriate units as required by the contextsof the problems. Sometimes the “answers” or solutions toproblems are data sets, graphs or models. These “answers”also must be verified.
Logical reasoning is fundamental to all of mathematics.Middle grades students should have a variety of experiencesthat exemplify the types of reasoning they will encounter intheir further study of mathematics and in other subjectareas. Students, at least informally, should become familiarwith examples of inductive and deductive reasoning.
Finally, while technology is integral to our daily lives, itis especially important in the study of mathematics. Middlegrades students should become proficient in the use of scientific calculators and graphing calculators to enhance their understanding of mathematical ideas and concepts.Technology supports the explorations of mathematical ideas and helps build understanding of these ideas and the use of inductive and deductive methods.
Students will not be able to successfully tackle real-world problems in a variety of contexts without middlegrades teachers who incorporate these Overarching Skills intheir mathematics classrooms. Since these skills promotehigher-level thinking, they are valuable tools in developingan in-depth understanding of key mathematical concepts.Therefore, it is essential that these Overarching Skills notbe seen as extras — that is, things to work on when timeallows — but rather as processes that cut through all aspectsof instruction and assessment to solidify understanding andincrease retention of content-specific skills.
It should be noted that the skills and concepts listed inthe Benchmark Proficiency Progression charts in this sec-tion are categorized by how the Overarching Skill is used,not by the mathematical content.
Overarching Mathematics Skills and Concepts
Process Readiness Indicators:
1. Problem Solving
2. Reading and Communicating
3. Estimating and Verifying Answersand Solutions
4. Logical Reasoning
5. Using Technology
I hear and I forget.
I see and I remember.
I do and I understand.
Chinese proverb

Getting Students Ready for Algebra I
6
Basic
� One- and two-step self-containedproblems
� Problems with extraneous information
� Problems that require using agiven formula
Proficient
� Two-step problems with multiplesolution strategies
� Problems with insufficient information
� Problems that require choosingthe correct formula
Advanced
� Multi-step problems with andwithout multiple solution strategies
� Non-routine problems� Problems with no solution
Benchmark Proficiency Progression
Learning Activities and Applications
� Students discover formulas using hands-on materials. For example, the formula for the area and volume of more com-plex figures (e.g., trapezoids and cones), the formula for finding the total number of degrees inside a polygon, or com-bining formulas for the area of composite figures. Students write a formula then present it to the class. They describetheir solution methods including the frequency with which they repeated the process to derive their formula. (Basic)
� Students determine the minimum number of pieces of drywall (which are manufactured in specific sizes) that arerequired to fully cover the walls of a room or inside an entire house. Students measure a room or rooms at homeor at school. Then they record their steps and explain their answers. (Proficient)
� Students develop a scoring system for multiple-choice tests that discourages wild guessing, such as one that penalizesincorrect answers more than items not attempted. They explore how the system would affect different students, forexample, a student who usually knows about two-thirds of the answers but guesses on the rest, and how the scoringsystem could be further modified so that students do not avoid challenging problems altogether. (Advanced)
Problem Solving
Problem solving is the context in which students apply mathematical skills and concepts to new situations.Problem-solving experiences enhance student understand-ing of the usefulness of mathematics and its power. In thereal world most problems do not involve tricks, but real-world problems require a process to gain control over themso solutions can be explored and found. In 1957 GeorgePolya added a reflection step to his earlier problem-solvingphases which form the foundation of most self-teaching,problem-solving models in mathematics:
� Understand the problem.
� Make a plan.
� Carry out the plan.
� Review and discuss the complete solution.
� Look back and reflect on the solution and the processes.
Students who are prepared for Algebra I need to be able to use with confidence various problem-solving strate-gies, such as writing an equation, making a graph or table,choosing a formula, working backward, using guess-and-check, and finding more than one solution. But this
problem-solving confidence also involves knowing which ofthe strategies or combination of strategies to use and when.As students tackle problems without obvious answers or solu-tion strategies, they also must draw upon their own resource-fulness, organization and ability to think creatively. Problemsthat require applying their knowledge to new or unique con-texts make their problem-solving skills more crucial and visi-ble. These skills are only gained by continuous exposure tonumerous multi-level problems in a variety of contexts.
While some students might claim that solving problemsis the only thing they do in mathematics class, when used todescribe a set of skills and strategies, problem solving meanssomething more than filling in answers to word problems ona worksheet or test. Teaching problem solving in the middlegrades requires consistent modeling of the process that stu-dents use to solve problems and the application of problem-solving strategies. Problem solving readily lends itself to coop-erative learning groups as a way to encourage student think-ing, experimenting and efforts to solve problems. By provid-ing a variety of problem-solving experiences at the Basic,Proficient and Advanced levels, middle school studentsenhance their thinking skills and improve their abilities totackle more difficult problems as they prepare for Algebra I.
1

7
Getting Students Ready for Algebra I
Reading and Communicating
Basic
� Write and discuss brief descrip-tions of their solution strategies.
� Use cause and effect words (e.g.,“if-then,” “because”) in describingreasoning.
Proficient
� Ask appropriate questions regard-ing others’ solutions.
� With some teacher guidance,write clear sequential descriptionsof solution strategies, usingappropriate vocabulary.
Advanced
� Without teacher guidance, write multi-step explanationsindependently.
� Write hypotheses and conclusionsthat include the reasons for mak-ing them.
Benchmark Proficiency Progression
Learning Activities and Applications
� Students use straightedges to draw irregular polygons and then with rulers and protractors measure the sides andangles. Students describe the polygons for others to draw. Students ask questions and then compare the final draw-ings to the originals. (Basic)
� Students describe in their own words the steps to complete a task. For example, students describe ways to solve fora missing value in a proportion. Being prepared to revise their work, students write their descriptions and thenshare them orally with the class. (Basic)
� Students compare the costs of sending packages of different sizes and weights with several different carriers usingrate charts or rate calculators found on the Internet. Students record their data in tables and after doing so, theywrite a brief summary conclusion about which service is better than the others and why. They present their find-ings to the class. (Proficient)
� Students read and discuss books about mathematics or with mathematics-related themes, such as Flatland byEdwin A. Abbott; G is for Googol by David M. Schwartz; and Echoes for the Eye: Poems to Celebrate Patterns inNature by Barbara J. Esbensen. They independently prepare oral and written presentations describing how the con-tent relates to particular topics in mathematics. (Advanced)
Of course general reading ability is a necessity in “doing”mathematics, but like any field, mathematics has its own spe-cialized vocabulary. As students work at higher levels in math-ematics and increase their understanding of mathematicalconcepts, their mathematical vocabulary must grow accord-ingly. Students must become fluent in the preciseness of lan-guage used in presenting mathematics problems, ideas andthinking. Skills in communicating mathematically includeexplaining the reasons for using particular solution strategies,demonstrating an understanding of concepts, defending ideasand thinking, and questioning others’ thinking.
As students move through the middle grades and pre-pare for Algebra I, the presentations of their thinking andsolution strategies for problems progress from informal nar-ratives to more formal, sequential, and well-labeled presenta-
tions. These presentations include appropriate mathematicalvocabulary and models, diagrams, graphs, and tables.
Part of teaching mathematical communication involvesassessing students’ understanding of mathematical vocabu-lary. Students who are unsuccessful in communicating theirunderstanding of and solutions to problems can learnmathematical vocabulary just like they learn reading vocab-ulary. Vocabulary journals, mathematics journals andvocabulary word walls are just a few examples of how teach-ers can help students improve their skills in communicatingmathematically. In the middle grades especially, students arereluctant to express themselves in any way that would leadto embarrassment. Teachers must encourage students to feelcomfortable in expressing their thinking and strategies forsolving problems openly and candidly.
2

Getting Students Ready for Algebra I
8
Estimating and Verifying Answers and Solutions
Basic
� Recognize when answers cannot befractions or mixed numbers (e.g.,numbers of people or buildings).
� Make front-end and roundingestimations.
� Verify that the units in the answer match units called for bythe problem.
� Understand the magnitude of values and units in problems (e. g., the larger the unit thesmaller the converted value).
Proficient
� Recognize when answers can andcannot be negative.
� Know when to use estimationstrategies.
� Recognize shortcuts that canmake computation easier and acalculator unnecessary.
Advanced
� Adjust the precision of answersbased on the situation.
� Explain why there are no answersto a given problem.
Benchmark Proficiency Progression
Learning Activities and Applications
� Students identify large quantities for their classmates to estimate, such as the number of bricks in the side of abuilding, the distances certain animals can travel given their speed or the number of blades of grass on schoolproperty. Students then compare answers and solution methods and discuss the advantages and disadvantages ofthe different methods. (Basic)
� Students devise methods for calculating tips or sales tax mentally. They write explanations for their methods, using exam-ples. They then present their methods to the class. The class compares the ease of the different methods. (Proficient)
� Provide students with measures of the sides of geometric figures such as:
4 cm, 4 cm, 10 cm 5 cm, 6 cm, 13 cm 3 cm, 4 cm, 8 cm 2 cm, 2 cm, 6 cm 2 cm, 4 cm, 10 cm
Students predict the type of geometric figure and its classification. Then they use rulers to draw each figure oncentimeter graph paper and verify each others’ work. Students experiment by altering the measures to obtain thegeometric figures they predicted and record their results. Students then discuss their results, provide an explanationof what happened and determine a rule about triangles. (Advanced)
Sometimes students are so focused on carrying out aparticular process that they do not step back from it tothink about how to determine the reasonableness of theiranswers. Evaluating the reasonableness of an answer mightstrike some as something students should be able to doautomatically. However students’ inability to do so and theresulting mistakes are a common source of complaintamong mathematics teachers. During the middle grades,students should begin developing an understanding thatmore complex problems sometimes involve making a deci-sion about which form of an answer or solution is moreuseful, valuable or relevant. Students should become skilledin using appropriate representations of their answers andsolutions, such as using various number forms or types ofgraphs. In these instances, students use other techniques toverify their work, such as spot checking the items in a dataset, examining the accuracy of a scale used and values com-
puted to create a graph, and analyzing a model to deter-mine whether the model in fact represents what was askedfor in the problem. Knowing when to solve problems men-tally, recognizing when calculators are unnecessary andadjusting the precision of an answer are all skills that stu-dents should master in the middle grades.
When teachers observe and analyze particular patternsof mistakes in student work, they should not dismiss themsimply as “careless,” but should recognize that these mistakesstem from a lack of conceptual understanding of the mathe-matics at hand. More experiences with comparing, ordering,estimating and modeling can help students become moreaccurate in their work. Verifying answers and solutions toproblems is one way for students to revise their work until itis correct and meets proficient or higher standards.
3

9
Getting Students Ready for Algebra I
Logical Reasoning
Basic
� Evaluate other students’ solu-tions and solution strategies.
� Make general predictions (e.g.,the outcome of events or theresulting areas or volumes fromchanges in dimensions).
Proficient
� Make and evaluate basic logicalarguments containing if-then(conditional statements), conjunc-tions, disjunctions and negations.
� Evaluate other students’ reasoning.
Advanced
� Complete simple truth tables.� Identify statements of inductive
and deductive reasoning.
Benchmark Proficiency Progression
Learning Activities and Applications
� Students make conjectures to answer the following questions and devise strategies to answer them. Which is morelikely: typing your initials by hitting the keys on a computer keyboard at random or dialing your phone numberby hitting the keys on a telephone at random? How long would you expect it to take to do each? Students collectdata and look for regularities to support their predictions. (Basic)
� Recently, the president of a large grocery store chain has become concerned about the breakage rate of eggs on thestore shelves. If a single egg is found broken on the shelves, the entire carton must be discarded. The rate is 1 bro-ken egg every 13 cartons of a dozen eggs. One of the executives states that, without doing anything to reduce thenumber of broken eggs, the company could save money if it sold eggs in packages of 8 or 10 instead of 12.Students respond to this claim by listing factors to be considered and identifying different scenarios for when thestatement would be true and when it would not. (Proficient)
� Students review statistical claims made in newspaper and magazine articles and in advertisements. They identify theways in which data have been presented to convey a particular point of view and reasons why the claim might ormight not be true. Students explain why or why not the displays or claims are misleading. (Proficient)
� As an example of inductive reasoning, students find the sums of several series of consecutive whole numbers, suchas 1 to 7, 5 to 9, 10 to 30, and so on. Then they discuss their results and formulate a rule for finding the sum of aset of consecutive whole numbers. The activity can be extended to finding sums of consecutive integers. As anexample of deductive reasoning, students use dot paper to apply Pick’s Theorem (the sum of the number of dotson the sides of a figure divided in half and the number of dots inside a figure - 1 = the area) to investigate the areasof triangles, quadrilaterals, hexagons, and so on. They determine for which kinds of figures the formula is validand verify their results using the traditional formulas for area. (Advanced)
4The rules of logical reasoning that govern mathematics
establish a valid means of manipulating with and conclud-ing from mathematical statements. Logical reasoningincludes formulating conclusions, constructing argumentsand making conjectures based on observed regularities. Assuch, logical reasoning overlaps considerably with problemsolving and communication.
The progression of students’ thinking skills in the mid-dle grades is tied closely to the depth of content. Studentsshould leave the middle grades with sharper reasoning skillsto evaluate conjectures, conclusions and arguments. Theyshould have a basic understanding of the difference
between inductive and deductive reasoning, as well as theability to develop more sophisticated logical arguments toconvince others, especially regarding problems in numbertheory, probability and geometry.
Students’ logical reasoning abilities are best developedand assessed with open-ended problems or performancetasks where they must document their reasoning. Regardlessof the topic, however, teachers must consistently developstudents’ understanding by challenging them to solve morecomplex problems and explain their reasoning to adequate-ly prepare them for Algebra I.

Getting Students Ready for Algebra I
10
Using Technology
Basic
� Use a calculator to perform arithmetic operations.
� Use software to create simple tables.
Proficient
� Use a scientific calculator.� Use software to create spread-
sheets that include totals andmean values.
� Use graphing software to createbar, line, and circle graphs.
Advanced
� Use a graphing calculator tograph simple equations and func-tions and to find the mean andmedian of data.
� Use software to graph functions andexplore other types of equations.
Benchmark Proficiency Progression
Learning Activities and Applications
� Students use 4-function calculators to determine how this type of calculator treats the order of operations. Thenstudents use scientific calculators to repeat the activity and compare their results. Students share their conclusionswith the class. (Basic)
� Students use a spreadsheet program to record outcomes of probability experiments or effects of changes in dimen-sions of regular figures upon perimeter, area and volume. They formulate conclusions and share them with theclass. (Proficient)
� Students gather numerical data over time regarding a topic of their choice. They use graphing calculators to find themean and median. Then they describe their data sets using the appropriate measure of central tendency and range.Students use graphing software to make line graphs of their data and describe any trends. (Advanced)
5Calculators and computers are indispensable tools in
the fields of mathematics, science, technology and in every-day life. They permit searching for solutions to problemsthat without technology would be difficult because of thecomplexity or number of calculations involved. The studyof mathematics and science requires students to use thesetechnologies, but without an understanding of the underly-ing concepts and processes, their usefulness is limited.Technology should supplement and enhance learning, butit should never supplant it.
Technology needs to be an integral part of mathematicsinstruction throughout the middle grades. As students take
on more complex calculations, create more complex expla-nations of solutions and reasoning, and explore differenttypes of relationships, their technological skills must keeppace. As they experience solving problems in a variety ofcontexts with and without technology, they will develop anunderstanding of when technology is useful, when it is notuseful and what its limitations are.
Teachers should guide students in the use of technolo-gy to enhance their learning, especially when graphingequations and inequalities, investigating properties of geo-metric figures, demonstrating and verifying theorems, andperforming simulations in probability experiments.

11
Getting Students Ready for Algebra I
Content-specific Readiness Indicators
These 12 Content-specific Readiness Indicators define what the MMGW initiative believes are the essential content toprepare students for Algebra I. The order of topics in the list is not a teaching sequence, nor is it a ranking of topics
from most important to least important.
1. Read, write, compare, order and represent in a variety of forms: integers, fractions, decimals, percents, andnumbers written in scientific and exponential form.
2. Compute (add, subtract, multiply and divide) fluently with integers, fractions, decimals, percents, andnumbers written in scientific notation and exponential form, with and without technology.
3. Determine the greatest common factor, least common multiple and prime factorization of numbers.
4. Write and use ratios, rates and proportions to describe situations and solve problems.
5. Draw with appropriate tools and classify different types of geometric figures using their properties.
6. Measure length with appropriate tools and find perimeter, area, surface area and volume using appropriateunits, techniques, formulas and levels of accuracy.
7. Understand and use the Pythagorean relationship to solve problems.
8. Gather, organize, display and interpret data.
9. Determine the number of ways events can occur and the associated probabilities.
10. Write, simplify and solve algebraic equations using substitution, the order of operations, the properties ofoperations and the properties of equality.
11. Represent, analyze, extend and generalize a variety of patterns.
12. Understand and represent functions algebraically and graphically.
This section of the report contains the following for each indicator:
� explanation of how the indicator relates to success in Algebra I
� guidance for teaching the indicator
� Benchmark Proficiency Progression chart
� Proficiency Level Learning Activities and Applications
� Proficiency Level Test-item Illustrations
Most of the Proficiency Level Illustrations are from two outside sources, but some were written by the panel for thisreport. In most cases, the items from the outside sources appear as originally published, but in some cases, multiple-choiceitems have been converted to open-ended items or vice versa. These cases are noted. The two outside sources used are:
� The National Assessment of Education Progress (NAEP), Eighth Grade Mathematics Assessment, 1990, 1992,1996, National Center for Education Statistics, U.S. Department of Education, http://nces.ed.gov/nationsreport-card; and
� Competency-Based Education Assessment Series: Mathematics, Ohio Council of Teachers of Mathematics(OCTM), Ohio Department of Education, Columbus, Ohio, 1997.

Getting Students Ready for Algebra I
12
Read, write, compare, order and represent in a variety of forms: integers, fractions,decimals, percents, and numbers written in scientific and exponential notation.
Basic
� Convert between fractions, deci-mals and percents.
� Estimate with fractions, decimalsand percents.
� Use models to show fractions,decimals and percents.
� Compare and order fractions,decimals and percents.
� Understand the concept of integers.
Proficient
� Compare and order integers.� Write numbers in exponential
and standard form.� Write numbers in scientific
notation.� Find square roots of perfect
squares.
Advanced
� Compare and order rational andirrational numbers.
� Estimate square roots of non-per-fect squares.
Benchmark Proficiency Progression
1
Learning Activities and Applications
� Students create and discuss situations and quantities that can and cannot be described by negative integers andthen graph the values on a number line. They compare values in words and with symbols. (Basic)
� Students examine units of measure used for very large quantities and distances (light years, astronomical units) andvery small quantities and distances (microns, nanoseconds). Then they write the measures in more familiar units,using scientific notation. (Proficient)
� Students find the lengths of the diagonals of squares of different sizes by drawing each on graph paper and measur-ing the diagonal. Next they use the Pythagorean relationship to find the lengths of the diagonals using estimation.Then they compare the results. (Advanced)
Because much of students’ future work in mathematicsinvolves using various forms of the same number, it isimperative that by the time they leave the middle grades,students are able to convert quickly from one form toanother. Students should readily be able to convert frompercents to decimals to fractions and from numbers in sci-entific notation to numbers in standard form, and viceversa. Also, they should have mastery of the concepts ofwhole number and decimal place value, exponential nota-tion, and graphing integers on a number line. Not only dothese skills prepare students for the study of rational num-bers and solving problems with very small and very largenumbers in Algebra I, but they help them decide which
solution or form of a solution to a problem is more useful,valuable or relevant. In the elementary grades, studentsspend a great deal of time learning about numbers and howto manipulate them; the focus in the middle grades mustshift to using numbers to solve problems.
Teaching number concepts in the middle grades isimportant so that students can solve applications in algebra,for example. Teachers can use a variety of hands-on materi-als such as base-10 blocks, graph paper, 10-frames, fractionsstrips and fraction calculators to help students understandand master number concepts. Simple applications of verylarge and very small numbers can help engage students inlearning number sense concepts so that they attain mastery.
13
Getting Students Ready for Algebra IB
asic
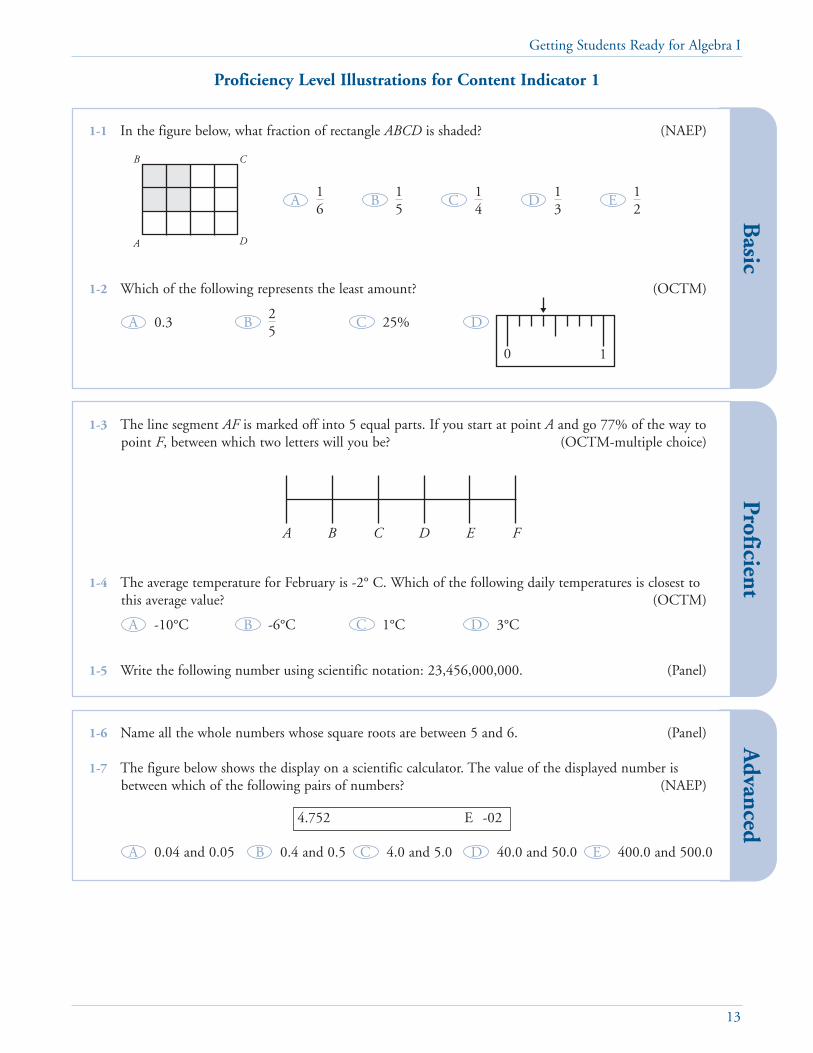
1-1 In the figure below, what fraction of rectangle ABCD is shaded? (NAEP)
1-2 Which of the following represents the least amount? (OCTM)
Proficient
1-3 The line segment AF is marked off into 5 equal parts. If you start at point A and go 77% of the way topoint F, between which two letters will you be? (OCTM-multiple choice)
1-4 The average temperature for February is -2° C. Which of the following daily temperatures is closest tothis average value? (OCTM)
1-5 Write the following number using scientific notation: 23,456,000,000. (Panel)
Advanced
1-6 Name all the whole numbers whose square roots are between 5 and 6. (Panel)
1-7 The figure below shows the display on a scientific calculator. The value of the displayed number isbetween which of the following pairs of numbers? (NAEP)
A
B C
D
16
15
14
13
12
0.325
25%
0 1
A B C D E F
-10°C -6°C 1°C 3°C
0.04 and 0.05 0.4 and 0.5 4.0 and 5.0 40.0 and 50.0 400.0 and 500.0
4.752 E -02
EDA B C
DA B C
DA B C
EDA B C
Proficiency Level Illustrations for Content Indicator 1

Getting Students Ready for Algebra I
14
Compute (add, subtract, multiply and divide) fluently with integers, fractions,decimals, percents, and numbers written in scientific notation and in exponen-tial form, with and without technology.
2
Basic
� Perform computations in one-and two-step word problems.
� Model addition and subtractionof integers.
� Use the order of operations withwhole numbers, fractions anddecimals.
� Compute fluently with decimals,fractions and percentages.
Proficient
� Compute fluently with integers.� Perform computations in multi-
step word problems.� Compute with numbers in scien-
tific and exponential forms withpositive exponents.
� Use the properties of operations.
Advanced
� Compute with numbers in scien-tific and exponential forms withpositive and negative exponents.
Benchmark Proficiency Progression
Learning Activities and Applications
� Using published advertisements for sales, students calculate prices including sales tax, percentage savings and actualsavings (in dollars) for different items. They are given certain amounts of money to spend. (Basic)
� Students create board games in which moving forward a given number of spaces is represented by a positive integerand moving backward is represented by a negative integer. Students write rules for the game and use a spinner ornumber cube to indicate how many spaces a player moves. Students demonstrate their games to the class.(Proficient)
� Students use patterns to write numbers with negative exponents in standard form and write numbers in scientificnotation. Then students research the uses of very small numbers and create and solve problems that require com-putation with the numbers written with negative exponents. (Advanced)
During the middle grades, students should reinforcetheir mastery of computing with whole numbers, fractions,decimals and percents. To be ready for Algebra I, students also need to be able to compute with numbers in scientific notation and in exponential form. As studentsbecome proficient in computational skills, the emphasisshould shift from drill-type exercises to one-step and two-step self-contained problems, and finally to multi-stepproblems in a variety of contexts. The skills students develop in translating words to numbers, operators andsymbols will be increasingly important as they prepare for Algebra I.
If students enter the middle grades unable to performthe four arithmetic operations with whole numbers, frac-tions and decimals, then they should receive extra help andtime outside of — but not instead of — their regular math-ematics class to improve their skills. Also, they should knowwhen to add, subtract, multiply or divide and to use inverseoperations to check their answers. Using number lines, two-color counters and equation mats can help students learnhow to compute with integers. To prepare students to usevariables for unknown quantities (the essence of algebra),they need numerous experiences finding missing values innumber frames and one-step equations in one variable insimple problem-solving contexts.
15
Getting Students Ready for Algebra IA
dvancedP
roficientB
asic
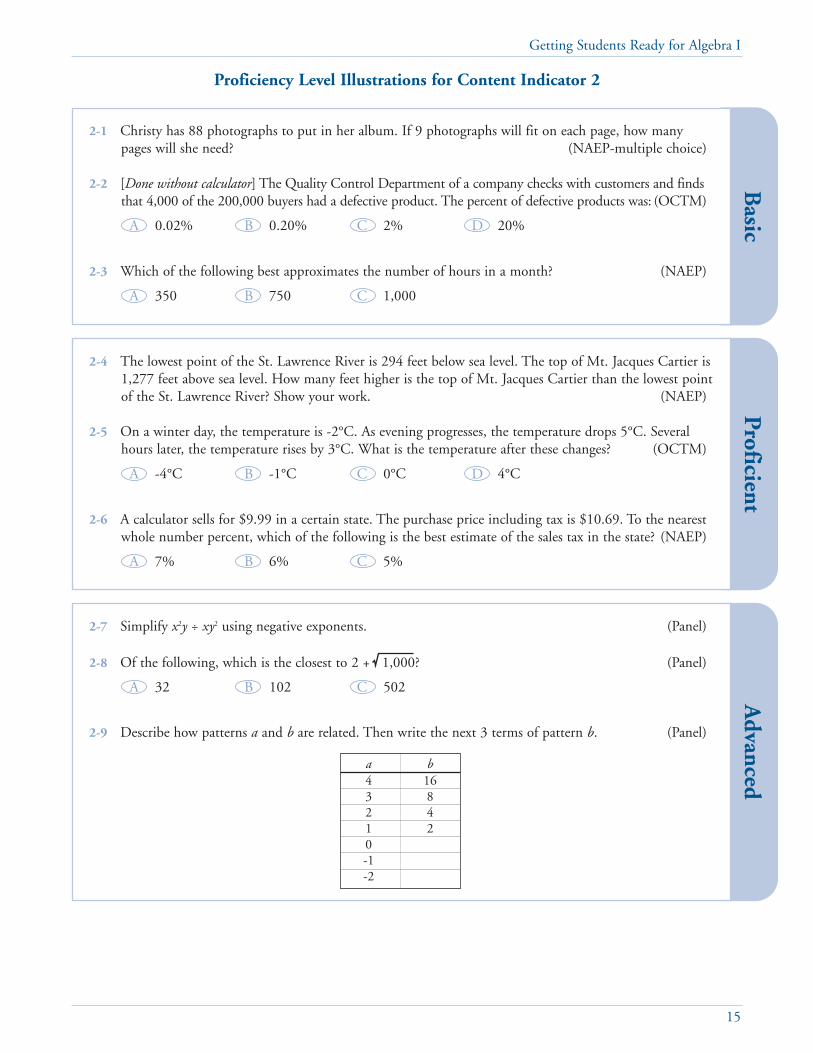
2-1 Christy has 88 photographs to put in her album. If 9 photographs will fit on each page, how manypages will she need? (NAEP-multiple choice)
2-2 [Done without calculator] The Quality Control Department of a company checks with customers and findsthat 4,000 of the 200,000 buyers had a defective product. The percent of defective products was: (OCTM)
2-3 Which of the following best approximates the number of hours in a month? (NAEP)
2-4 The lowest point of the St. Lawrence River is 294 feet below sea level. The top of Mt. Jacques Cartier is1,277 feet above sea level. How many feet higher is the top of Mt. Jacques Cartier than the lowest pointof the St. Lawrence River? Show your work. (NAEP)
2-5 On a winter day, the temperature is -2°C. As evening progresses, the temperature drops 5°C. Severalhours later, the temperature rises by 3°C. What is the temperature after these changes? (OCTM)
2-6 A calculator sells for $9.99 in a certain state. The purchase price including tax is $10.69. To the nearestwhole number percent, which of the following is the best estimate of the sales tax in the state? (NAEP)
2-7 Simplify x2y ÷ xy2 using negative exponents. (Panel)
2-8 Of the following, which is the closest to 2 + 1,000? (Panel)
2-9 Describe how patterns a and b are related. Then write the next 3 terms of pattern b. (Panel)
0.02% 0.20% 2% 20%
350 750 1,000
-4°C -1°C 0°C 4°C
7% 6% 5%
32 102 502
a b4 163 82 41 20-1-2
A B C
A B C
DA B C
A B C
DA B C
Proficiency Level Illustrations for Content Indicator 2

Getting Students Ready for Algebra I
16
Determine greatest common factor, least common multiple and prime factorization of numbers.3
Basic
� Find and use factors and multiples.
� Write powers with bases andexponents.
� Recognize and use the divisibilityrules for 2, 5, and 10.
Proficient
� Identify prime and compositenumbers.
� Use factor trees to write the primefactorization of numbers withexponents.
� Use divisibility rules for 3 and 4.
Advanced
� Use the divisibility rules for 6, 8,9, and 12.
� Solve word problems involvinggreatest common factor, leastcommon multiple, and prime factorization.
Benchmark Proficiency Progression
Learning Activities and Applications
� Students write numbers for others to identify as divisible by 2, 5, and/or 10. Students verify their answers bychecking with a calculator and explain how they know whether the number is divisible by 2, 5, and/or 10 or not.(Basic)
� Students write the prime factorization of numbers using exponents. Then they explain any patterns especially withpowers of a given base, if any, they find to the class. (Proficient)
� Students research the history of the search for methods to identify and factor large prime numbers, including cur-rent efforts that use computers. (Advanced)
Mastering the concepts of greatest common factor andleast common multiple prepares students for factoring andsimplifying rational expressions and equations in algebra.Manipulating the terms in expressions and equations, aswell as recognizing common factors, are basic algebraicskills. In the middle grades, students must master theseskills. Also, they need to understand that whole numberscan be written as products of factors. This, along with theproperties of operations, will help students make a success-ful transition to proportional reasoning and simplifyingalgebraic expressions and equations. Students should recog-nize cases in which simplifying fractions and numerical
expressions can help make computation easier or unlock thesolution to a problem.
Students who are having difficulty in determining thegreatest common factor and the least common multiplewhen combining and simplifying fractions with unlikedenominators may benefit from using fraction strips and/orarrays of counters (a given number of counters arranged ina square or a rectangle). Fraction circles may also help stu-dents understand renaming mixed numbers and wholenumbers as improper fractions. Some students may needextra help and time outside of their regular mathematicsclasses to gain confidence in these concepts.

17
Getting Students Ready for Algebra IB
asic
3-1 Find the greatest common factor of 24 and 32. (Panel)
3-2 Which is the least common multiple of 8, 12, and 15? (Panel)
Proficient
3-3 Write the prime factorization of 856 with exponents. (Panel)
3-4 For each of the numbers listed below, name at least one factor other than 1 or itself. (Panel)
3-5 Which number is prime? (Panel)
Advanced
3-6 Two runners start running at the same time from the start/finish line of a 400-meter oval track. Onerunner runs laps of 1 minute 15 seconds and the other runs laps of 1 minute 45 seconds. How long willit be before the runners cross the start/finish line at the same time? How many laps will each have run?Explain your answer. (Panel)
3-7 A principal wants to send representatives of all the school’s performing arts clubs and the journalismclub to a Broadway musical on tour in a nearby city. Because she wants to be fair, she wants to makesure that the numbers of students from each group who attend are exactly proportional to the numbersof students in each group. Based on the number of students in each group listed below, and assumingthat a student can belong to only one group, is this possible? Why or why not? (Panel)
60 8 15 3
321 264 498
0 1 51 53
Group Number of students
Chorus 42Dance Club 15Drama Club 21Journalism Club 12Orchestra 47Wind Ensemble 51
120
DA B C
A B C
EDA B C
Proficiency Level Illustrations for Content Indicator 3

Getting Students Ready for Algebra I
18
Learning Activities and Applications
� Using written recipes, students write new ingredient lists (and possibly pan sizes) based on a change (both increaseand decrease) in a quantity of one of the ingredients (e.g., if they had only 2 tomatoes instead of the 3 called for inthe recipe) and/or in the number of servings. (Basic)
� Students create spreadsheets and graphs comparing the population of states to the number of their representatives inthe House of Representatives and the Senate. Which states appear to be the most and least powerful in the House? Inthe Senate? What is the historical justification for the difference in proportionality? (Proficient)
� Using the standings in a sports league at different points throughout the season, students project the won-lostrecords of teams at the end of the season based on their records at those points. At the end of the season, theyreview their different projections, compare them to the final records and create related graphs. (Proficient)
� Using scientific or graphing calculators, students complete tables for varying values of A as follows.
Then students write a conclusion based on what they observed about the values in their tables. (Advanced)
Write and use ratios, rates and proportions to describe situations and solve problems.4
Basic
� Write ratios, rates and proportions based on simplegiven situations.
� Solve for missing values in proportions.
Proficient
� Solve for missing measures insimilar figures.
� Use ratios to determine whether geo-metric figures are or are not similar.
� Use ratios and proportions to findmeasures indirectly.
� Use scale factors to make scaledrawings and maps.
Advanced
� Write and solve proportions inword problems and in geometricapplications.
� Use right triangle trigonometricratios for sine, cosine and tangent.
� Analyze scale drawings and mapsfor accuracy.
Benchmark Proficiency Progression
Mastering ratio and proportion is essential for makingthe transition from arithmetic to topics in algebra, geome-try and beyond. Ratios and proportions provide the con-ceptual underpinnings for finding unknown measurementsin similar figures, immeasurable distances, analyzing andrepresenting functions, investigating slope, reductions andenlargements of figures, and numerous other applications.Ratio is fundamental to understanding whether or not analgebraic function is linear or not. In the middle grades, itis essential that students master proportional reasoning toprepare them for the thinking and problem solving theywill need in their further study of mathematics.
To help students gain a basic understanding of ratio itis helpful to use familiar contexts. For example, altering thequantity of the ingredients in a recipe must be proportionalin order to increase or decrease the number of servings
without changing the taste or success of the dish. Anenlargement of a photograph will have a different appear-ance if the length and width are not both increased propor-tionally. (The latter can be demonstrated easily using mostgraphic or photographic software applications.)
Students must have numerous experiences solving formissing values in proportions in addition to writing andsolving proportions in a variety of problem-solving con-texts. Again, using number frames (boxes or answer blanksused for unknown values) may be useful. Proficiency inproportional reasoning can be further developed by com-paring similar geometric figures using measurement toolsand by graphing functions, such as distance, rate and time.Graph paper, graphing calculators and graphing softwarecan aid students’ understanding of ratio and proportion.
angle A sin A cos A sin A tan Acos A

Advanced
4-6 A certain machine produces 300 nails per minute. At this rate, how long will it take the machine toproduce enough nails to fill 5 boxes of nails if each box will contain 250 nails? (NAEP)
4-7 A tennis court is 27 feet wide (for singles) and 78 feet long and the net is 3 feet high at the center of thecourt. A table tennis table is 5 feet wide and 9 feet long and the net is 6 inches high. Are a table tennistable and net proportional to a tennis court and net? Explain your answer.
If you wanted to make a true miniature version of a tennis court, if you used the width of the table ten-nis table (5 feet), how long would it be? How high would the net be? Finally, if you were to make a pro-portional model of yourself for your miniature tennis court, how tall would it be? (Panel)
19
Getting Students Ready for Algebra IP
roficientB
asic
4-1 If = , then n = (NAEP-multiple choice)
4-2 In a group of 1,200 adults, there are 300 vegetarians. What is the ratio of nonvegetarians to vegetariansin the group? (NAEP)
4-3 If = , then, of the following, which is closest to n? (Calculator use permitted) (NAEP)
1 to 3 1 to 4 3 to 1 4 to 1 4 to 3
2.61 3.83 8.76 8.82 12.11
4 min 4 min 6 sec 4 min 10 sec 4 min 50 sec 5 min
4-4 Luis mixed 6 ounces of cherry syrup with 53 ounces of water to make a cherry-flavored drink. Martinmixed 5 ounces of the same cherry syrup with 42 ounces of water. Who made the drink with thestronger cherry flavor? Give mathematical evidence to justify your answer. (NAEP)
4-5 In the model town that a class is building, a car 15 feet long is represented by a scale model 3 inches long. Ifthe same scale is used, a house 35 feet high would be represented by a scale model how many inches high?
(NAEP)
EDA B C
225
nn500
10.35.62
nn4.78
EDA B C
EDA B C
3 5 7 EDA B C4535
353
Proficiency Level Illustrations for Content Indicator 4

Getting Students Ready for Algebra I
20
Learning Activities and Applications
� Students identify and classify geometric figures found in everyday objects (e.g., city streets and blocks, sports fields,windows in their classrooms, decorative patterns). (Basic)
� Students write statements using all, some and none about geometric figures, such as:
All right triangles are scalene triangles.
Some right triangles are scalene triangles.
No right triangles are scalene triangles.
Then they determine which statements are true and which are false. Students share their statements with the class.(Proficient)
� Using graph paper and tagboard, students make models of various geometric plane figures such as rectangles andisosceles triangles. They experiment with translating the figures in the coordinate plane (on graph paper) andrecord all of their observations systematically in tables by indicating the coordinates of each figure at the startingposition and the ending position. They observe any patterns and formulate conclusions about the changes in thecoordinates. They share their observations with the class. (Advanced)
Draw with appropriate tools and classify different types of geometric figuresusing their properties.5
Basic
� Identify, draw and classify geo-metric plane and solid figures.
� Perform transformations of figures.
� Use a protractor to draw andmeasure.
� Identify different types of anglesand triangles.
Proficient
� Recognize and write valid state-ments using “if-then,” “all,”“some,” and “none” about geo-metric figures.
� Classify geometric figures usingtheir properties.
� Predict the outcomes of compos-ite transformations.
Advanced
� Use knowledge of properties ofgeometric figures to construct andexplain basic deductive arguments.
� Determine measures of anglesformed by parallel lines and transversals.
� Perform transformations in thecoordinate plane.
Benchmark Proficiency Progression
In the middle grades, students’ geometric knowledgeand skills should expand and become more formalized.Students need to move from learning about geometricshapes and objects to learning how to classify them basedon their distinguishing characteristics. Making the connec-tion between algebra and geometry is essential for furtherstudy in mathematics because algebraic solutions and theirrelated geometric solutions to problems are essential forbuilding the bridge from algebra and geometry to calculus.As students gain understanding of different types of anglesand lines and their transversals, they can solve problemsinvolving missing angle measures. Requiring students tothink about and describe their reasoning will build the con-ceptual basis for understanding the formal structure of alge-braic and geometric proof. Before students leave the middle
grades, they should begin to construct basic logical argu-ments and use deductive and inductive reasoning.
Instruction in the middle grades should expand stu-dents’ understanding of the properties of both regular andirregular plane figures and culminate with students beingable to perform simple transformations of figures in thecoordinate plane. Students’ experiences with classifyingbasic geometric figures should be expanded to includeinvestigations into their properties. Students should masterdrawing and measuring angles with a protractor, measuringlength with a ruler, and performing one-step transforma-tions of geometric figures. Using pattern blocks, graphpaper and graphing software can help students understandthe properties of figures and their transformations.

21
Getting Students Ready for Algebra IP
roficient
5-4 Explain how you could use each of the sets of tools listed in the table to determine whether figures youare given are squares, rectangles, right triangles, or parallel lines. (Panel)
5-5 Which is not the ratio of the length of a side of an equilateral triangle to its perimeter?(OCTM-free response)
Figure Ruler Protractor, unmarked straightedge, and pencil
Rectangle
Square
Right triangle
Parallel lines
1 : 3 3 to 1 1 to 3DA B C13
Basic
5-1 Which is not a property of a square? (Panel)
5-2 Using a ruler and a protractor, draw a right triangle. (Panel)
5-3 Make a drawing showing when a slide of a figure is the same as a flip. (Panel)
Advanced
5-6 The two angles of a triangle measure 45° each. Can the triangle be a scalene triangle? Explain why orwhy not. Can the triangle be an equilateral triangle? Explain why or why not. Use the number ofdegrees in the sum of the measures of a triangle to classify the triangle by the measure of its angles andthe lengths of its sides. (Panel)
5-7 Triangle ABC is rotated 90° clockwise about the origin. What are the new coordinates of B? (Panel)
Proficiency Level Illustrations for Content Indicator 5
All sides are congruent. All angles are congruent.
Opposite angles are congruent. Opposite angles are complementary.
(-5, 4) (5, 4) (4, 5) (-4, 5)
Ax
y
4
32
1
5
4321 5-4 -3 -2 -1-5
-4
-3
-2
-1
-5
B
C
DA B C
D
A B
C

Getting Students Ready for Algebra I
22
Learning Activities and Applications
� Students develop a plan to estimate the cost of painting the inside and outside walls of their school with two coatsof paint (using brushes and rollers), using measurements from their classroom only and the exterior of their school.They can research or be given the cost of paint and the area covered by a can of paint. They can also develop asimilar plan to estimate the time it would take to complete the job. (Basic)
� Students use graph paper to find all of the possible nets of a cube, rectangular solid and triangular pyramid. Theyshare their results with the class. (Proficient)
� Students use the formula [ density = mass ÷ volume ] to create problems involving the mass, density and volumeof various solids constructed from metals such as gold, silver, iron and so on. Students research the density of vari-ous metals and use the relationship between mass and volume in the metric system. For example, a jeweler is making a gold sphere with a radius of 2 centimeters. The cost of the sphere is determined by theweight (mass) of the gold the jeweler uses. What is the mass of the gold sphere? (Advanced)
Measure length with appropriate tools and find perimeter, area, surface area andvolume using appropriate units, techniques, formulas and levels of accuracy.6
Basic
� Recognize which units of measureare most appropriate for a givensituation.
� Measure and calculate the perime-ter and area of regular polygons.
� Calculate the volume and surfacearea of cubes and rectangular solids.
� Calculate the circumference andarea of circles.
� Read and use rulers, protractorsand compasses.
Proficient
� Calculate the surface area andvolume of cylinders.
� Find perimeter and area of com-bined figures.
� Solve problems involving capacityand volume (e.g., number ofbooks of the same size that fit in agiven box).
Advanced
� Calculate the volume of spheresand cones.
� Apply a level of accuracy usingsignificant digits.
Benchmark Proficiency Progression
Middle grades instruction should focus on solidifyingstudents’ measurement skills, including knowledge andapplication of appropriate units and levels of accuracy.Students’ mastery of basic geometric formulas is related toother topics in mathematics, including ratio and propor-tion, identifying figures and angles, writing and solvingalgebraic equations, and understanding functions. Studentsneed numerous experiences with word problems through-out the middle grades, particularly those dealing with real-world situations involving formulas. Prior to their study ofAlgebra I, students should begin to understand that formu-las are equations. While middle grades students need todevelop the ability to apply formulas, students also need tocommit a certain number of facts and formulas to memory,such as the fact that π is approximately equal to 3.14, andthat the sum of the measures of the three angles of a trian-gle is 180 degrees.
Some students may need extra help and time to gainfacility in using a ruler, metric and customary, and the formu-las for the perimeter, area, and volume of basic geometric fig-ures. While using a ruler is a skill that should be mastered inthe elementary grades, many middle grades mathematicsteachers report that their students have difficulty measuringlength. Although higher level mathematics tends not toinvolve taking direct measurements, the inability to use a rulermay signify conceptual weaknesses. These weaknesses couldbe difficulty with number lines and/or one-to-one correspon-dence or not understanding the concept of measurement asthe process of assigning a number to a characteristic of anobject or figure. These two concepts are very important in thefurther study of mathematics. Using various hands-on materi-als such as graph paper, centimeter cubes, geoboards andgraphing software can help students understand the basic con-cepts of distance, perimeter, area and volume.
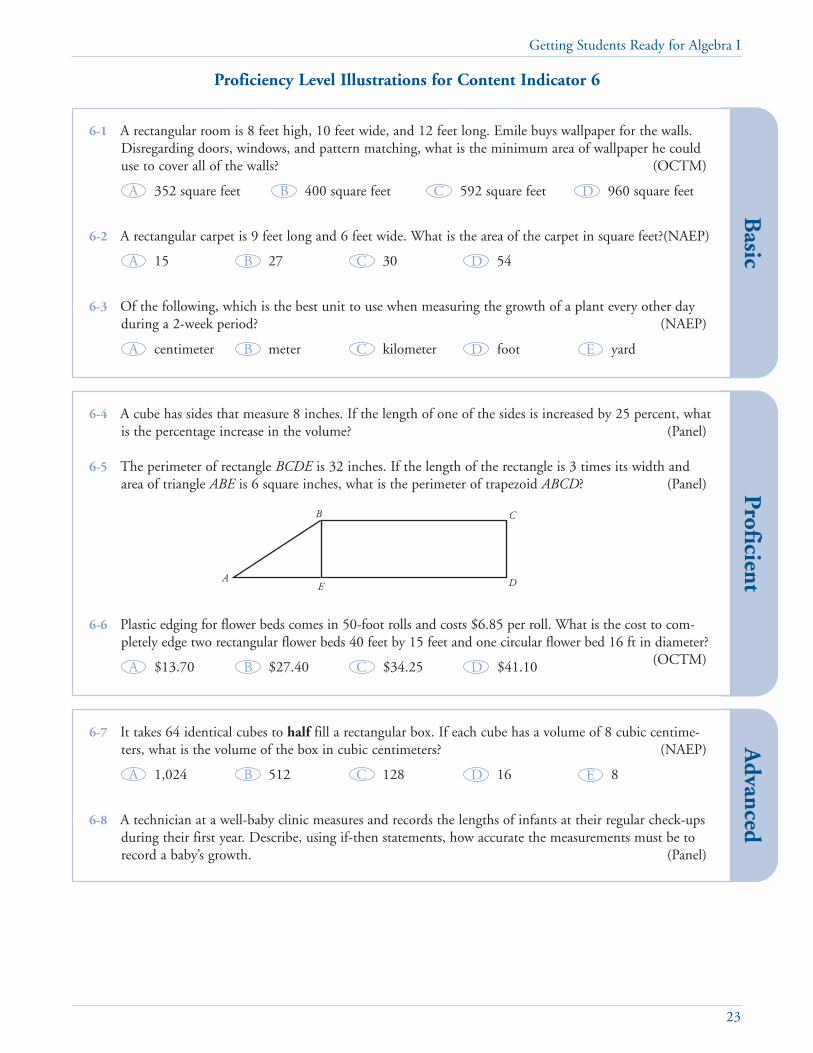
23
Getting Students Ready for Algebra IB
asic
6-1 A rectangular room is 8 feet high, 10 feet wide, and 12 feet long. Emile buys wallpaper for the walls.Disregarding doors, windows, and pattern matching, what is the minimum area of wallpaper he coulduse to cover all of the walls? (OCTM)
6-2 A rectangular carpet is 9 feet long and 6 feet wide. What is the area of the carpet in square feet?(NAEP)
6-3 Of the following, which is the best unit to use when measuring the growth of a plant every other dayduring a 2-week period? (NAEP)
Proficient
6-4 A cube has sides that measure 8 inches. If the length of one of the sides is increased by 25 percent, whatis the percentage increase in the volume? (Panel)
6-5 The perimeter of rectangle BCDE is 32 inches. If the length of the rectangle is 3 times its width andarea of triangle ABE is 6 square inches, what is the perimeter of trapezoid ABCD? (Panel)
6-6 Plastic edging for flower beds comes in 50-foot rolls and costs $6.85 per roll. What is the cost to com-pletely edge two rectangular flower beds 40 feet by 15 feet and one circular flower bed 16 ft in diameter?
(OCTM)
Advanced
6-7 It takes 64 identical cubes to half fill a rectangular box. If each cube has a volume of 8 cubic centime-ters, what is the volume of the box in cubic centimeters? (NAEP)
6-8 A technician at a well-baby clinic measures and records the lengths of infants at their regular check-upsduring their first year. Describe, using if-then statements, how accurate the measurements must be torecord a baby’s growth. (Panel)
Proficiency Level Illustrations for Content Indicator 6
352 square feet 400 square feet 592 square feet 960 square feet
15 27 30 54
centimeter meter kilometer foot yard
$13.70 $27.40 $34.25 $41.10
1,024 512 128 16 8
A
B C
DE
EDA B C
DA B C
EDA B C
DA B C
DA B C

Getting Students Ready for Algebra I
24
Understand and use the Pythagorean relationship to solve problems.7
Basic
� Memorize the Pythagorean relationship.
� Recognize when to use the relationship.
� Find the measure of the third sidein right triangles given the meas-ures of two sides.
Proficient
� Solve word problems involvingright triangle measures.
� Use the Pythagorean relationshipto determine whether triangles areright triangles.
� Memorize Pythagorean triples tosolve problems without a calculator.
Advanced
� Solve problems where the exis-tence of triangles is not obvious.
� Find unknown distances acrosslakes, etc. using the relationship.
Benchmark Proficiency Progression
Learning Activities and Applications
� Using graph paper, students outline large squares on each side of a right triangle and then cut out the small squaresalong the legs to see if the small squares fit inside the large square along the hypotenuse. (Basic)
� Students choose several tall landmarks in the local area (buildings, trees, etc.) and estimate their heights, measure themusing the methods and instruments they researched, and compare their estimates and measurements. (Proficient)
� Students research the various proofs of the Pythagorean relationship and make displays showing the methods theyfound. Students demonstrate their findings to the class. (Advanced)
The Pythagorean relationship has widespread applica-tions in science and in technical and engineering fields. ThePythagorean relationship is used throughout the study ofmathematics, especially in algebra, geometry and trigonom-etry. Finding immeasurable distances is a typical applicationof the Pythagorean relationship.
It is helpful if students have already learned the proper-ties of right triangles and have the ability to find squaresand square roots. The difficulty could come as studentsencounter applications in which it is not obvious that thePythagorean relationship should be used. Encouraging stu-dents to make diagrams of the facts in problems helps them
visualize the existence of right triangles and thus leads themto use the Pythagorean relationship to find missing dis-tances or lengths.
Because computing with squares and square roots issomething more easily done on a calculator, Pythagorean-relationship problems provide a valuable opportunity forstudents to improve their calculator skills. At the sametime, students should understand that calculators are notalways necessary, especially if the problem involves perfectsquares or expressing an answer in radical form. In place ofusing calculators, students can learn to estimate squareroots by averaging.

25
Getting Students Ready for Algebra IB
asic
7-1 A carpenter claims that the wooden deck just completed is a square. The home owner measured thesides as 30 feet and 40 feet, and the diagonal as 50 feet. Is the deck a square? Explain whether or notyou would use the Pythagorean relationship to answer the question. (Panel)
7-2 Of the following, which is the closest approximation of the length of AC in the rectangle below? (NAEP)
Proficient
7-3 What is the diagonal measurement of the TV screen shown in the figure below? (NAEP)
7-4 Is a triangle with sides measuring 3 inches, 5 inches, and 7 inches a right triangle? Explain your answer.(Panel)
7-5 How far apart are the planes? (Panel)
Advanced
7-6 Two students are using a measuring tape to measure the length of a room. They measure it to be 13 feet6 inches. However, the student at one end is holding the tape 9 inches higher than the student at theother end. What is the difference between their measurement and the true length? (Panel)
7-7 What is the approximate length of the pond? (Panel)
Proficiency Level Illustrations for Content Indicator 7
7 inches 9 inches 13 inches
A
B C
D
7 in.
6 in.
25 in. 35 in. 50 in. 70 in. 1,200 in.
81 miles 1,600 miles 1,681 miles 41 miles�
�40 mi
9 mid
40 in.
30 in.
116.3 yd
10 yd
l
2,500 yards 11,025 yards 116 yards 13,525 yardsDA B C
DA B C
EDA B C
A B C
14

Getting Students Ready for Algebra I
26
Learning Activities and Applications
� Students research the Dow Jones Industrial Average. What does it measure? What is it an average of? What are theunits of measure? Students explain whether or not one can predict future performance from a graph of it. (Basic)
� Students compare graphs appearing in newspaper and magazine articles and those in advertisements. How are theydifferent? Is one type clearer than the other? How are the graphs used in the articles and in the advertisements? Dothe graphs in advertisements lead the reader to certain conclusions? Do the graphs from newspaper articles?Students identify and describe the conclusions, if any. (Proficient)
� From the same data sets, students create appropriate graphs of different types. They analyze the different graphsand compare and contrast the conclusions from each. (Advanced)
Gather, organize, display and interpret data.8
Basic
� Make and read single bar graphs,single line graphs, and pictographs.
� Read and interpret circle graphs.� Find the mean, median, mode,
and range of sets of data.� Plot points on a coordinate grid.
Proficient
� Read and make line plots andstem-and-leaf plots.
� Collect and display data for givensituations.
� Make, read and interpret doublebar, double line, and circle graphs.
� Determine when to use mean,median, mode, or range.
� Determine and explain situationsof misleading statistics.
Advanced
� Formulate survey questions andcollect data.
� Evaluate statistical claims in arti-cles and advertising.
� Analyze different displays of thesame data.
Benchmark Proficiency Progression
Besides basic computation, data analysis is arguably thearea of mathematics people are most likely to encounter intheir daily lives. Usually people do not collect their owndata, but they are often faced with graphs, charts, surveyresults and statements regarding statistical information innewspapers, magazines, statements of political candidatesand government officials, and report cards and standardizedtest data. In addition, data analysis is useful in other con-tent areas, especially science and social studies. Data analy-sis becomes more sophisticated when students study alge-bra. Here they learn that most relationships between twovariables are not just exactly linear but approximate linearfunctions. Students also learn that sometimes data relation-ships are non-linear.
In the middle grades, data analysis provides an idealcontext for applying, assessing and reinforcing other mathe-matics skills and concepts. Data analysis should be made
more challenging by integrating numerous other mathemat-ics topics and creating the foundation for more advancedwork in high school. Middle grades students should haveexperiences calculating percent change, using geometricconcepts to make circle graphs, communicating mathemati-cally by presenting their interpretations of data, using logi-cal reasoning to analyze statistical claims, and plottingpoints to create line graphs. Using technology such asgraphing software and calculators can help students displayand interpret data.
Some students may need extra time and help toimprove their data interpretation skills. Using smaller num-bers, fewer data items in a set and guiding students tochoose the appropriate display for the types of data sets aresome ways to help them. Encouraging students to useorganizing displays such as stem-and-leaf plots and line plotscan help them find measures of central tendency and range.
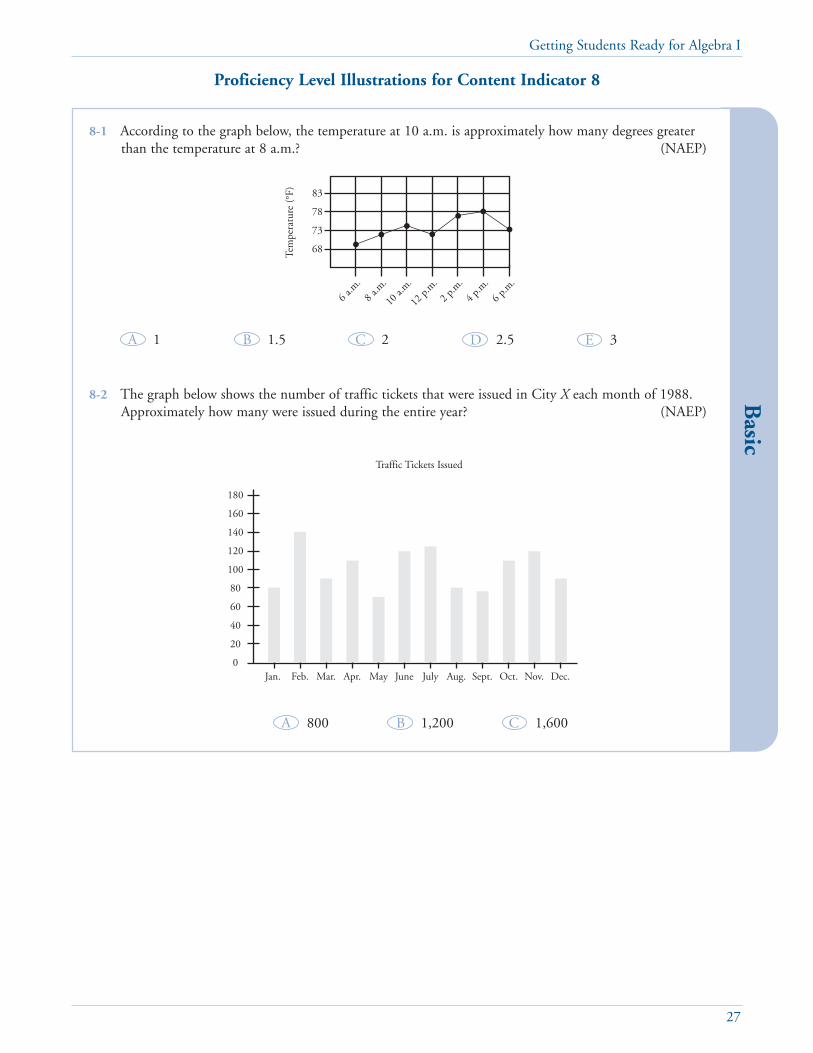
27
Getting Students Ready for Algebra IB
asic
8-1 According to the graph below, the temperature at 10 a.m. is approximately how many degrees greaterthan the temperature at 8 a.m.? (NAEP)
8-2 The graph below shows the number of traffic tickets that were issued in City X each month of 1988.Approximately how many were issued during the entire year? (NAEP)
Proficiency Level Illustrations for Content Indicator 8
1 1.5 2 2.5 3
800 1,200 1,600
83
78
73
68Tem
pera
ture
(°F
)6 a
.m.
8 a.m
.
10 a.
m.
12 p.
m.
2 p.m
.
4 p.m
.
6 p.m
.
180
160
140
120
100
80
60
40
20
0Jan. Feb. Mar. Apr. May June July Aug. Sept. Oct. Nov. Dec.
Traffic Tickets Issued
A B C
EDA B C
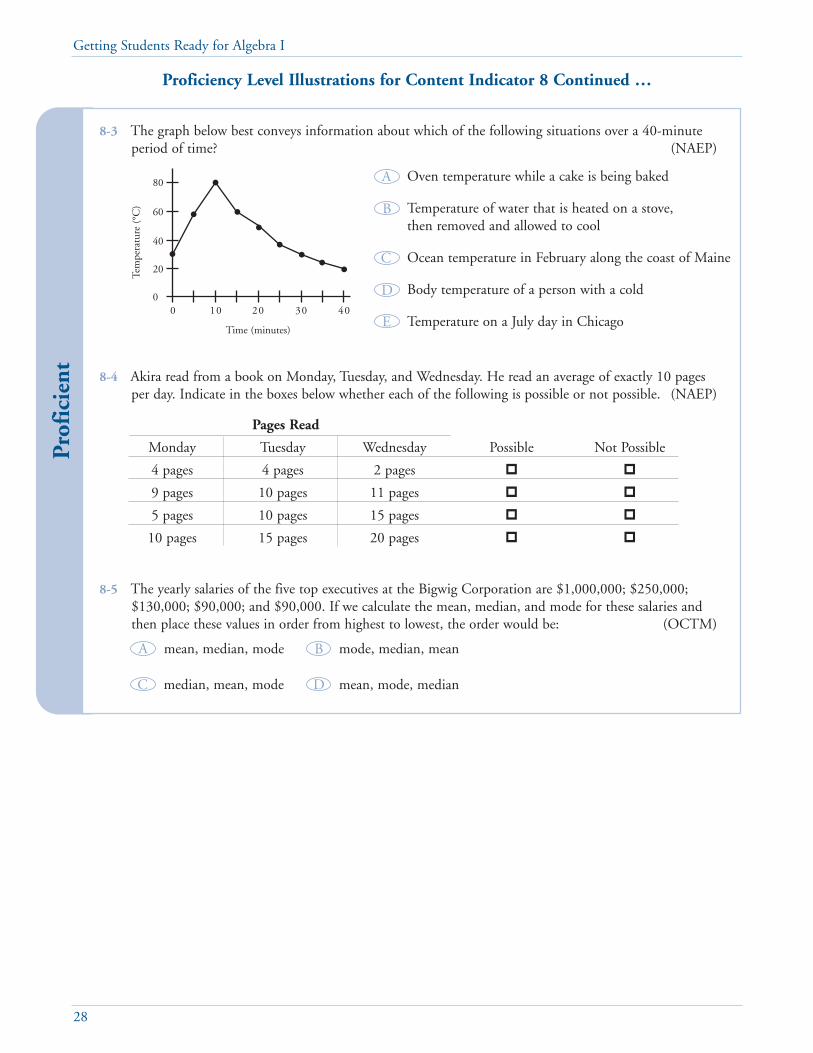
Getting Students Ready for Algebra I
28
Proficiency Level Illustrations for Content Indicator 8 Continued …P
rofi
cien
t
8-3 The graph below best conveys information about which of the following situations over a 40-minuteperiod of time? (NAEP)
8-4 Akira read from a book on Monday, Tuesday, and Wednesday. He read an average of exactly 10 pagesper day. Indicate in the boxes below whether each of the following is possible or not possible. (NAEP)
8-5 The yearly salaries of the five top executives at the Bigwig Corporation are $1,000,000; $250,000;$130,000; $90,000; and $90,000. If we calculate the mean, median, and mode for these salaries andthen place these values in order from highest to lowest, the order would be: (OCTM)
Oven temperature while a cake is being baked
Temperature of water that is heated on a stove, then removed and allowed to cool
Ocean temperature in February along the coast of Maine
Body temperature of a person with a cold
Temperature on a July day in Chicago
80
60
40
20
00 10 20 30 40
Tem
pera
ture
(°C
)
Time (minutes)
Pages Read
Monday Tuesday Wednesday Possible Not Possible
4 pages 4 pages 2 pages � �
9 pages 10 pages 11 pages � �
5 pages 10 pages 15 pages � �
10 pages 15 pages 20 pages � �
mode, median, mean
median, mean, mode mean, mode, median
mean, median, mode
D
A B
C
E
D
A
B
C

29
Getting Students Ready for Algebra I
Proficiency Level Illustrations for Content Indicator 8 Continued …A
dvanced
8-6 The total distances covered by two runners during the first 28 minutes of a race are shown in the graphbelow. How long after the start of the race did one runner pass the other? (NAEP)
8-7 In 1980, the populations of Town A and Town B were 5,000 and 6,000, respectively. The 1990 popula-tions of Town A and Town B were 8,000 and 9,000, respectively.
Brian claims that from 1980 to 1990 the populations of the two towns grew by the same amount. Usemathematics to explain how Brian might have justified his claim.
Darlene claims that from 1980 to 1990 the population of Town A had grown more. Use mathematics toexplain how Darlene might have justified her claim. (NAEP)
1980 Population 1990 Population
Town A ����� Town A ��������
Town B ������ Town B ���������
� = 1,000 people
8-8 The table below provides information about the cost of placing phone calls between certain cities at dif-ferent times during the day. How much more would it cost to place a 10-minute call from Allenville toEdgeton at 3 p.m. on Friday than at 3 p.m. on Saturday? (NAEP)
6
5
4
3
2
1
0
Tota
l Dis
tanc
e(K
ilom
eter
s)
0 4 8 12 16 20 24 28
Runner 1
Runner 2
3 minutes
8 minutes
12 minutes
14 minutes
28 minutes
First Minute Each First Minute Each First Minute EachFrom Additional Additional Additional
Allenville to Minute Minute Minute
Burneyford $.09 $.03 $.07 $.02 $.05 $.02
Camptown $.28 $.09 $.22 $.07 $.17 $.05
Dorning $.37 $.11 $.30 $.09 $.22 $.07
Edgeton $.42 $.12 $.34 $.10 $.25 $.07
DAY RATE
7 a.m. - 5 p.m.Mon-Fri
EVENING RATE
5 p.m. - 11 p.m.Mon-Fri
8 a.m. - 11 p.m.Sat-Sun
NIGHT RATE
11 p.m. - 8 a.m.ALL DAYS
E
D
A
B
C
Telephone Calling Rates

Getting Students Ready for Algebra I
30
Determine the number of ways an event can occur and the associated probabilities.9
Basic
� Find the probability of simpleevents.
� Find the sample space using tree diagrams.
� Find the number of possible outcomes.
Proficient
� Find and record the experimentalprobability of multiple trials ofsimple events.
� Identify and make predictionsusing theoretical probabilities.
� Find combinations.
Advanced
� Identify the sample space andmathematical probability for com-pound events and permutations.
� Distinguish between independentand dependent events.
� Recognize fair and unfair games.
Benchmark Proficiency Progression
Learning Activities and Applications
� Students predict the outcomes and then toss a 1 to 6 number cube 100 times and record their results. Then theycompare their results with the mathematical probability of tossing a 1 to 6 number cube. They share their results withthe class. The activity could be extended by having students predict and then toss a 1 to 4 tetrahedron. (Basic)
� Students conduct different experiments for the same event but with different numbers of trials. For example, onegroup tosses a two-color counter 10 times, another group 20 times, another group 30 times, and so on. They com-pare the different experimental probabilities, represent them graphically and write a conclusion. (Proficient)
� Students calculate the total possible number of telephone numbers in their area code. In one activity, they devise aplan to estimate the number of working numbers a telemarketer could expect to reach by placing 100 calls at ran-dom. In another activity, they devise a plan to investigate whether their area will “run out” of numbers in the nearfuture and propose and evaluate different solutions (e.g., adding another digit, using the # and * keys). (Advanced)
Usually students enter the middle grades with someunderstanding of the probability of simple events. However,students often think that an independent event can beinfluenced by preceding trials, for example, that a coin thathas landed on heads several times in a row is either morelikely to land on heads, because that is what has been hap-pening in previous trials, or more likely to land on tailsbecause it is “due” to do so. Or they may not apply theirknowledge of probabilities to situations and instead rely onsubjective judgments. Students’ understanding of the basicconcepts involved in probability lays the groundwork for
further study in algebra of combinations, permutations,prediction and fair games.
To help them understand the basic concepts of proba-bility, students should have numerous hands-on experienceswhere they predict outcomes, conduct experiments, con-struct sample spaces, record and compare their results tomathematical probabilities. Two-color counters, spinners,number cubes and other such materials are useful in con-structing experiments. It is very important to emphasize thenumber of trials, fairness of the materials used and keepinga record of the outcomes.

31
Getting Students Ready for Algebra IB
asic
9-1 The nine chips shown below are placed in a sack and then mixed up. Madeline draws one chip fromthis sack. What is the probability that Madeline draws a chip with an even number? (NAEP)
9-2 How many possible outcomes are there when choosing a letter in the word STATES? What is the number of favorable outcomes for the event of choosing the letter S? (Panel)
Proficient
9-3 A coin is to be tossed 3 times. What is the probability that 2 heads and 1 tail in any order will come up?(NAEP)
9-4 Dave will choose one sandwich and one drink for lunch. The menu at left shows the choices. List belowall the possible combinations of a sandwich and a drink that Dave might choose. (NAEP)
MENUSandwiches Drinks
Beef MilkTuna JuiceHam
9-5 A bag contains 100 marbles. Some marbles are red and some are yellow. Suppose a student withoutlooking chooses a marble out of the bag, records the color, and then places the marble back in the bag.The student has recorded 8 red marbles and 17 yellow. Using these results which is the best predictionof how many red marbles are in the bag? (Panel)
Advanced
9-6 The two spinners shown below are part of a carnival game. A player wins a prize only when both arrowsland on black after each spinner has been spun once. James thinks he has a 50-50 chance of winning.Do you agree? Justify your answer. (NAEP)
9-7 Of the 60 people in a room, are men and of the people have brown hair. What is the least numberof men in the room who could have brown hair? Solve this problem in two ways. In one way, use adrawing in your solution. Explain both ways. (OCTM)
Proficiency Level Illustrations for Content Indicator 9
1
25 11 32 68DA B C
DA B C2 3 4 5
6 7 8 9
19
29
49
12
23
35

Getting Students Ready for Algebra I
32
Write, simplify and solve algebraic equations using substitution, the order ofoperations, the properties of operations and the properties of equality.10
Basic
� Explore the concept of and differ-ent uses of variables.
� Solve one- and two-step equationsand inequalities in one variable.
� Write and solve equations in onevariable for word problems.
� Know and apply the properties ofoperations.
Proficient
� Graph equations in two variablesusing graphing calculators.
� Solve equations in two variablesalgebraically.
� Understand and use the proper-ties of equalities and inequalities.
Advanced
� Graph linear inequalities usinggraphing calculators.
� Write and solve problems usingsystems of linear equations.
� Graph systems of linear equationsto find their solutions usinggraphing calculators.
� Graph linear equations using theslope-intercept method (y = mx +b) using graphing calculators.
Benchmark Proficiency Progression
Learning Activities and Applications
� Students write as many equivalent equations as they can for a given equation such as x + 7 = 10 or 15 = 3 + y.They use algebra tiles and equation mats to verify their answers and then solve each equation. (Basic)
� Using graphing calculators, students investigate the slopes of several different linear equations to determine howthe graphs change when the sign and value (including the reciprocal) of each slope changes. Students record theirresults and present their findings to the class. (Proficient)
� Students examine different offers from CD clubs, Internet providers or mobile telephone services and representthem using algebraic equations and graphs. They then look at different scenarios (e.g., different numbers of CDsbought per month, different amounts of time spent on the Internet or using the phone each month) and makestatements about when each appears to be cost-effective and ineffective. Looking at two different offers of the sametype (e.g., two different CD clubs), they try to identify points where the costs are equal and where one is betterthan the other. (Advanced)
Experiences that serve as building blocks for algebraare, for example, finding missing values in number frames(e.g., 4 x � = 32), using formulas, the properties of opera-tions, the order of operations, and graphing ordered pairs.During the middle grades, the emphasis should focus onstudents using algebraic symbols to write and solve simpleequations in one variable in problem-solving contexts. Theyshould learn the properties of equality and the order ofoperations to simplify and solve equations. Also, studentsshould have some experiences in solving equations andinequalities in two variables and a basic introduction to theconcept of functions. It is key that students understand that
the graph of an equation is its “picture” so that they beginto understand the relationship between algebra and geome-try for their further studies in mathematics.
Students may benefit from using counters, algebra tiles,and equation mats to help them solve simple equations inone variable. For simple equations and inequalities in twovariables, students should use tables to record their compu-tations for solution pairs and graph paper for their graphs.Graphing calculators and software can help students under-stand the concepts of linear functions and relations.

33
Getting Students Ready for Algebra IB
asic
10-1 What expression can you write for the perimeter of the rectangle below? (OCTM)
10-2 Write two numbers that could be put in the � to make 54 < 3 x � true. (NAEP)
10-3 If n + n + n = 60, what is the value of n? (NAEP)
10-4 If � represents the number of newspapers that Lee delivers each day, which of the following representsthe total number of newspapers that Lee delivers in 5 days? (NAEP)
10-5 Given 3�(� + 5) = 30, the number in the box should be: (OCTM)
Proficient
10-6 Graph the following equation: 3y = 6x + 12 (Panel)
10-7 The cost to rent a motorbike is given by the formula: Cost = ($3 x number of hours) + $2 (NAEP)
Fill in the table at right. Time in Hours Cost in Dollars1 54
17
10-8 Find x if 10x - 15 = 5x + 20 (Panel)
10-9 A plumber charges customers $48 for each hour worked plus an additional $9 for travel. If h representsthe number of hours worked, which of the following expressions could be used to calculate theplumber’s total charge in dollars? (NAEP)
Advanced
10-10 Graph the following inequality: 7y + 14 < 6x + 16 (Panel)
10-11 If d = 110 and a = 20 in the formula d = (2t - 1), then t = (NAEP)
Proficiency Level Illustrations for Content Indicator 10
5 + � 5 x � � ÷ 5 (�+�) x 5
5 6
2 5 10 95
a 3
b
48 + 9 + h 48 x 9 x h 48 + (9 x h) (48 x 9) + h (48 x h) + 9EDA B C
EDA B C
DA B C
DA B C
a2
152
1518
11120

Getting Students Ready for Algebra I
34
Represent, analyze, extend and generalize a variety of patterns.11
Basic
� Complete and extend patternswith pictures or simple numericalprogressions.
� Describe pattern rules informally.
Proficient
� Find missing values in patterns.� Find values from rules of patterns.� Analyze and create rules from
patterns.� Write pattern rules as algebraic
statements.
Advanced
� Analyze and extend complex patterns (e.g., ones involving multiple operations and powers).
� Analyze and use patterns in othercontexts (e. g., Pascal’s triangle).
Benchmark Proficiency Progression
Learning Activities and Applications
� Provide students with a variety of number sequences that are arithmetic (the difference between two consecutiveterms is the same), geometric (the terms are formed by multiplying by a constant factor), or neither. Have studentsexplain the pattern informally and then extend it to the next three terms. (Basic)
� Provide students with two or three algebraic rules for patterns, such as, 2n - 1 where n = the natural numbers, andhave them write the first five terms and another term, such as the tenth term. Then have students write their ownrules for sequences and verify their rules by finding terms of the sequence. (Proficient)
� Have students research Pascal’s Triangle to find out what it is and how it is used. Have students describe the pat-tern of the triangle itself, the pattern of the sum of each of the rows, how it is used to find the probability of anevent with two equally likely outcomes, and how it is used in finding combinations. (Advanced)
The study of patterns in the middle grades shouldprogress from patterns with pictures or simple numbersequences to patterns that relate to linear functions. Linearfunctions indicate constant rates of change and are basic to the study of algebra and geometry. Students also shouldmove from informal descriptions of patterns to writingalgebraic rules for patterns. Students’ experiences with usingpatterns to find the results when multiplying and dividingwhole numbers and decimals by powers of 10 and demon-strating the laws of signed numbers will help them learnhow to use algebraic symbols for patterns.
While finding the rule underlying a pattern may seema matter of intuition, students can greatly increase theirsuccess with understanding patterns through extensiveexperiences. Using tables to systematically record theirresults when extending patterns will help students writerules for patterns. Practice with words that indicateincrease and decrease will help students symbolize theirunderstanding of particular patterns that show a constantrate of change.

35
Getting Students Ready for Algebra IB
asic
11-1 In the pattern, which figure would be next?(NAEP)
11-2 Describe the rule for this pattern. 7, 4.5, 2, -0.5, -3, … (Panel)
Proficient
11-3 If the pattern shown in the table were continued, what number would appear in the box at the bottomof column y next to 15? (NAEP)
11-4 A computer costing $1,500 loses one-third of its value each year. What is its value at the end of thethird year? (Panel)
11-5 Which is the rule for this pattern? 1, 3, 9, 27, 81, … (Panel)
Advanced
11-6 Write a formula to find y for any value of x for the pattern shown in the table. (NAEP)
11-7 If you continue the pattern below, how many blocks will be needed to construct the 20th figure in thesequence? Explain how you found your answer. (OCTM-multiple choice)
Proficiency Level Illustrations for Content Indicator 11
?
3n 3n 3 + n n - 3
x y1 13 55 97 13
15 ?
Answer: ________________
Answer: ________________
x y1 13 55 97 13
15 ?
1st 2nd 3rd 4th
DA B C
DA B C
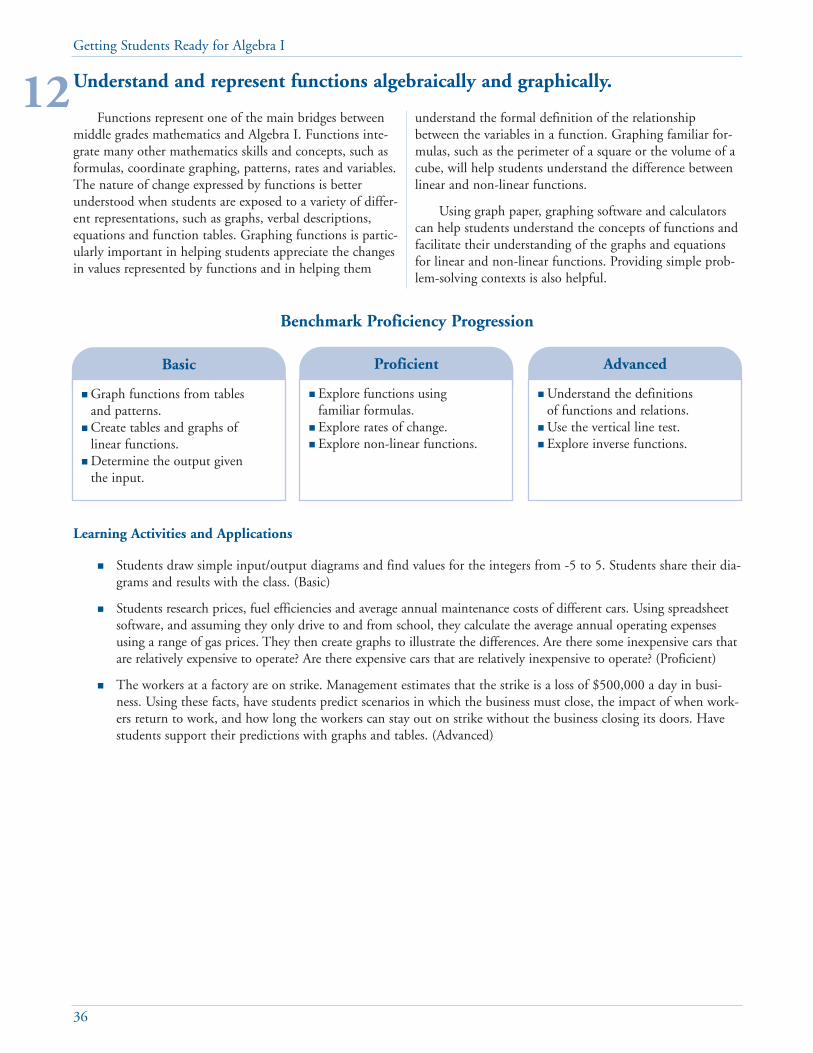
Getting Students Ready for Algebra I
36
Understand and represent functions algebraically and graphically.12
Basic
� Graph functions from tables and patterns.
� Create tables and graphs of linear functions.
� Determine the output given the input.
Proficient
� Explore functions using familiar formulas.
� Explore rates of change.� Explore non-linear functions.
Advanced
� Understand the definitions of functions and relations.
� Use the vertical line test.� Explore inverse functions.
Benchmark Proficiency Progression
Learning Activities and Applications
� Students draw simple input/output diagrams and find values for the integers from -5 to 5. Students share their dia-grams and results with the class. (Basic)
� Students research prices, fuel efficiencies and average annual maintenance costs of different cars. Using spreadsheetsoftware, and assuming they only drive to and from school, they calculate the average annual operating expensesusing a range of gas prices. They then create graphs to illustrate the differences. Are there some inexpensive cars thatare relatively expensive to operate? Are there expensive cars that are relatively inexpensive to operate? (Proficient)
� The workers at a factory are on strike. Management estimates that the strike is a loss of $500,000 a day in busi-ness. Using these facts, have students predict scenarios in which the business must close, the impact of when work-ers return to work, and how long the workers can stay out on strike without the business closing its doors. Havestudents support their predictions with graphs and tables. (Advanced)
Functions represent one of the main bridges betweenmiddle grades mathematics and Algebra I. Functions inte-grate many other mathematics skills and concepts, such asformulas, coordinate graphing, patterns, rates and variables.The nature of change expressed by functions is betterunderstood when students are exposed to a variety of differ-ent representations, such as graphs, verbal descriptions,equations and function tables. Graphing functions is partic-ularly important in helping students appreciate the changesin values represented by functions and in helping them
understand the formal definition of the relationshipbetween the variables in a function. Graphing familiar for-mulas, such as the perimeter of a square or the volume of acube, will help students understand the difference betweenlinear and non-linear functions.
Using graph paper, graphing software and calculatorscan help students understand the concepts of functions andfacilitate their understanding of the graphs and equationsfor linear and non-linear functions. Providing simple prob-lem-solving contexts is also helpful.

37
Getting Students Ready for Algebra IB
asic
12-1 This table shows input/output values. According to the pattern, which is the input for an output of 20?(Panel)
12-2 For the equation y = 3x + 8, create a table of values for x and y. Use five different values of x to find thecorresponding values of y. Draw a graph from your table. (Panel)
Proficient
12-3 This table shows the number of times a person blinks on average. Describe the rate of change in words. (Panel)
12-4 Which function is non-linear? (Panel)
Advanced
12-5 One plan for a state income tax requires those persons with income of $10,000 or less to pay no taxand those persons with incomes greater than $10,000 to pay a tax of 6% only on the part of theirincome that exceeds $10,000. A person’s effective tax rate is defined as the percent of total income thatis paid in tax. Based on this definition, could any person’s effective tax rate be 5%? Could it be 6%?Explain your answer. (Panel)
12-6 A new band, The Old Spice Boyz, has just made a CD. They made it themselves and it cost $12,000 tomake. They have been offered contracts by two different record companies to produce and promote it.One company offers $12,000 and 16 percent of total sales. Another offers $50,000 but only 10 percentof total sales. At what amount of sales will the contracts give the band the same amount of income?
(Panel)
Proficiency Level Illustrations for Content Indicator 12
Input Output4 26 38 412 616 8? 20
40 10 100 5
number of blinks number of minutes25 150 275 3100 4125 5
y = 2x y = 2x y = 2 + x y = DA B C x2
DA B C

Getting Students Ready for Algebra I
38
1-1 D
1-2 C
1-3 between D and E
1-4 C
1-5 2.3456 x 10¹⁰
1-6 26, 27, 28, 29, 30, 31,32, 33, 34, 35
1-7 A
2-1 10 pages
2-2 C
2-3 B
2-4 1,571 feet
2-5 A
2-6 A
2-7
2-8 A
2-9 a represents the expo-nents for the base 2shown in b; 1, ,
3-1 8
3-2 E
3-3 23 x 107
3-4 a) 3, 107b) 2, 3, 6, 8, 11, 24,
33, 44, 88, 132c) 2, 3, 6, 83, 166, 299
3-5 D
3-6 8 minutes 45 seconds;7 laps; 5 laps
3-7 47 is a prime numberso it has no commonfactors other than 1with the other values.
4-1 n = 40
4-2 C
4-3 C
4-4 Martin
4-5 D
4-6 C
4-7 No; the dimensionshave unequal ratios;14.4 feet; 0.55 feet;model would be of the original height.
5-1 D
5-4 measure pairs of oppo-site sides, measureangles as equal or notequal to 90°; measuresides, measure angles asequal or not equal to90°; no entry, measureangles as equal or notequal to 90°; measuredistance between, noentry or draw a trans-versal and measureopposite angles, etc.
5-5 B
5-6 No; sides oppositecongruent angles arecongruent; No; thirdangle is 90°; isoscelesright triangle
5-7 B
6-1 A
6-2 D
6-3 A
6-4 25% if 8 by 8 by 10 or95% if 10 by 10 by 10
6-5 36 inches
6-6 D
6-7 A
6-8 If you measure to thenearest foot, then nogrowth is shown. Ifyou measure to thenearest inch, thengrowth is shown.
If you measure to thenearest half inch, thena more accurate meas-ure of growth isshown. If you measureto the nearest quarterinch, then it will bemore difficult to meas-ure accurately. So tothe nearest half inch isprobably the best forthe accuracy needed.
7-1 No; the sides are not equal.
7-2 B
7-3 C
7-4 No; 9 + 25 49
7-5 D
7-6 about 0.25 inches
7-7 C
8-1 B
8-2 B
8-3 B
8-4 NP, P, P, NP
8-5 A
8-6 D
8-7 Incorrectly used sub-traction to concludethat both grew by3,000; Town A grewby 60% and Town Bgrew by 50% or > .
8-8 $.26
9-1 C
9-2 6; 2
9-3
9-4 beef-milk; beef-juice;tuna-milk; tuna-juice;ham-milk; ham-juice
9-5 C
9-6 No; 25% because there are four possibleoutcomes: WW, WB,BW, BB
9-7 16 men
10-1 P = 2b + 2(a + 3) or P= 2(a + b + 3)
10-2 any number > 18
10-3 n = 20
10-4 B
10-5 B
10-6 (-2, 2), (-4, 4), (0, 6),(1, 8) (2, 10)
10-7 $14; 5 hours
10-8 x = 7
10-9 E
11-1 B
11-2 subtract 2.5
11-3 29
11-4 $222
11-5 B
11-6 y = 2x - 1
11-7 422; to make the nthfigure, make an n by nsquare then add 2blocks or make a n + 1square and subtract 2n -1 blocks
12-1 A
12-2 (-2, 2); (-1, 5); (0, 8);(1, 11); (2, 14)
12-3 25 blinks per minute
12-4 B
12-5 Yes; if the person earns$60,000.
12-6 $633,333 in sales
Answers to Proficiency Level Illustrations
xy
12
14
35
12
38
527

AcknowledgmentsInitial drafts of this publication were prepared by David Nohara, curriculum consultant, and by the SREB panel
for mathematics: Pam Adamson, formerly of the Georgia Department of Education, Atlanta, Georgia.; Henry
Cooke, South Point High School, South Point, Ohio; Dianne Hardy, Habersham High School, Clarksville,
Georgia.; Katherine Mosely, Booker T. Washington High School, Atlanta, Georgia.; Linda Patch, North Carolina
Department of Public Instruction, Raleigh, North Carolina; and Kathleen Carpenter, SREB.
Gene Bottoms, Caro Feagin, Sondra Cooney and Mary Myers of SREB also contributed to this publication.
The publication is supported by funds from the Office of Educational Research and Improvement, U.S.
Department of Education; the Edna McConnell Clark Foundation; The Goldman-Sachs Foundation; the Carnegie
Corporation of New York; and the Wallace-Reader’s Digest Funds. The opinions expressed here do not necessarily
reflect the positions or policies of any of the funding entities, and no official endorsement should be inferred.

(02V52)
Southern Regional Education Board Goals for Education
1. All children are ready for the first grade.
2. Achievement in the early grades for all groups of studentsexceeds national averages and performance gaps are closed.
3. Achievement in the middle grades for all groups of studentsexceeds national averages and performance gaps are closed.
4. All young adults have a high school diploma — or, if not,pass the GED tests.
5. All recent high school graduates have solid academic prepara-tion and are ready for postsecondary education and a career.
6. Adults who are not high school graduates participate in lit-eracy and job-skills training and further education.
7. The percentage of adults who earn postsecondary degreesor technical certificates exceeds national averages.
8. Every school has higher student performance and meetsstate academic standards for all students each year.
9. Every school has leadership that results in improved stu-dent performance — and leadership begins with an effec-tive school principal.
10. Every student is taught by qualified teachers.
11. The quality of colleges and universities is regularly assessedand funding is targeted to quality, efficiency and state needs.
12. The state places a high priority on an education system ofschools, colleges and universities that is accountable.