getting started with sas it service level management 2
TRANSCRIPT
Getting Started with SAS®
ITService Level Management 2
The correct bibliographic citation for this manual is as follows: SAS Institute Inc. 2005.Getting Started with SAS ® IT Service Level Management 2. Cary, NC: SAS Institute Inc.
Getting Started with SAS® IT Service Level Management 2Copyright © 2005, SAS Institute Inc., Cary, NC, USAAll rights reserved. Produced in the United States of America.For a hard-copy book: No part of this publication may be reproduced, stored in aretrieval system, or transmitted, in any form or by any means, electronic, mechanical,photocopying, or otherwise, without the prior written permission of the publisher, SASInstitute Inc.For a Web download or e-book: Your use of this publication shall be governed by theterms established by the vendor at the time you acquire this publication.U.S. Government Restricted Rights Notice. Use, duplication, or disclosure of thissoftware and related documentation by the U.S. government is subject to the Agreementwith SAS Institute and the restrictions set forth in FAR 52.227-19 Commercial ComputerSoftware-Restricted Rights (June 1987).SAS Institute Inc., SAS Campus Drive, Cary, North Carolina 27513.1st printing, October 2005SAS Publishing provides a complete selection of books and electronic products to helpcustomers use SAS software to its fullest potential. For more information about oure-books, e-learning products, CDs, and hard-copy books, visit the SAS Publishing Web siteat support.sas.com/pubs or call 1-800-727-3228.SAS® and all other SAS Institute Inc. product or service names are registered trademarksor trademarks of SAS Institute Inc. in the USA and other countries. ® indicates USAregistration.Other brand and product names are registered trademarks or trademarks of theirrespective companies.
Contents
Chapter 1 � Introduction to SAS IT Service Level Management 1Introducing SAS IT Service Level Management 1
What Is Service Level Management? 2
SAS IT Service Level Management Software Overview 7
Chapter 2 � Transforming IT Data into SLM Intelligence 11Overview of IT Service Level Calculations 11
Understanding the Structure of Your Contract 12
Service Level Objectives 14
Data Adjustments for Outages 19
Extract, Transform, Load (ETL) 20
Chapter 3 � Using the SAS IT Service Level Management GUI 29Overview: Getting Ready to Run SAS IT Service Level Management 30
Starting the GUI 30
Exploring the GUI 33
Using the GUI to Construct a Contract 38
Running ETL 68
Closing SAS IT Service Level Management 68
Chapter 4 � Reporting on Your SLM Data 69Overview of Reporting 69
Baseline Reports 70
Service Level Reports 77
SAS Enterprise Guide Reports 97
Appendix 1 � Recommended Reading 101Recommended Reading 101
Glossary 103
Index 107

iv
1
C H A P T E R
1Introduction to SAS IT ServiceLevel Management
Introducing SAS IT Service Level Management 1What Is Service Level Management? 2
Why Is Service Level Management Needed? 2
Increasing Demands, Fierce Competition 2
Proving the Value of IT Services 3
Continuous Improvement of IT Services 3The Goals of Service Level Management 3
Understanding and Meeting Business Needs 3
Steps for Implementing Service Level Management 4
Ongoing Service Level Management Activities 4
Moving Beyond Good Intentions 4
Effective Contracts 5Delineating Business Needs 5
Establishing Measurable Service Goals 5
Specifying Measurement Techniques 5
Defining Appropriate Reporting Periods and Methods 5
Common Problems with Contracts 6Data Collected by Many Different Tools and for Many Different Purposes 6
Data Not Typically Stored in a Central Location 6
Data Dissimilar in Measurement Type and Format 6
SAS IT Service Level Management Software Overview 7
Makes Disparate Data Easily Accessible 8Transforms Data and Stores It in a Contract Database 8
Calculates Indicators for Service Level Performance Even with Disparate Data 8
Generates Reports That Are Meaningful to Providers and Customers 9
Baseline Reporting 9
Service Level Reporting 9
Enterprise Guide Reporting 9Provides a User-Friendly Graphical User Interface 10
Other SAS IT Management Solutions 10
Introducing SAS IT Service Level Management
SAS IT Service Level Management is a member of the SAS IT ManagementSolutions family. SAS IT Service Level Management supports service level management(SLM) efforts by providing the following:
� the capability to represent every element of your IT contracts to whichperformance measures can be applied
2 What Is Service Level Management? � Chapter 1
� the ability to assign service level objectives and select various methods ofmeasurement for each component, service, service level agreement (SLA), andcontract
� a database where diverse SLM data can be stored and easily accessed
� methods of interpreting the SLM data in terms of established service levelobjectives for availability, response time, throughput, custom objectives, andcomposite objectives
� an easy-to-use graphical user interface (GUI) that makes vital information moreaccessible to all users
� several methods of reporting on the data, including text-based and graphic reportsthat include Baseline reports, Service Level reports, and SAS Enterprise Guidereports.
Note: This document supports the software for SAS IT Service Level Management2.1 and later. �
What Is Service Level Management?Service level management is a paradigm of IT service delivery that focuses on these
goals:
� discovering and outlining the IT services that are needed to fulfill businessrequirements
� establishing measurable goals for each IT component and service that is needed tomeet established business needs
� evaluating the quality of IT services based on how business customers experiencethose services
� producing user-oriented reports that communicate whether the delivered serviceshave met established objectives and fulfilled business needs
Why Is Service Level Management Needed?Over the last two decades, the business world has become increasingly dependent on
a supporting structure of IT services. During the boom years of the last decade, manybusinesses were happy to spend freely on IT services; however, few fully understoodwhat the IT budget was buying. The atmosphere has changed considerably in this newmillennium. In an era of declining budgets and an increasing need for expanded ITservices, every budget dollar must be watched carefully and allocated effectively andefficiently. The IT budget is no exception. SAS IT Service Level Management enablesIT providers and customers to verify that the quality of service that is deliveredjustifies the cost.
Increasing Demands, Fierce CompetitionIT customers today are often more familiar with the vast potential of current
technologies than they were in the past; therefore, they often demand more from the ITproviders that support their lines of business. Customers who are not familiar with thetechnology can also be demanding. An incomplete understanding of the ITinfrastructure can lead to unrealistic demands and a failure to acknowledge outstandingservice. To further complicate matters, the IT customer has a wide range of optionswhen selecting an IT provider. Both technology and highly skilled IT professionals are
Introduction to SAS IT Service Level Management � The Goals of Service Level Management 3
widely available, and the competition is fierce. If a customer is not satisfied with thelevels of IT service provided, other IT providers stand ready to offer alternatives.
Proving the Value of IT ServicesOf course, good customer service should always be a goal. Today, more than ever, it is
to the advantage of IT providers—both internal IT departments and external ITcompanies—to go above and beyond providing merely satisfactory basic services.Providers need to demonstrate to their customers that the IT services that they offerhave the following qualities:
� They are dependable, efficient, and economically reasonable.� They are closely aligned to the needs of the lines of business.� They are likely to result in a clear return on investment.
Continuous Improvement of IT ServicesMany IT providers are turning to SLM to help them increase the quality of their
services, ensure a positive experience for business customers, and improvecommunication and understanding between providers and customers. The followingsections explain how SLM can help IT service providers to accomplish the followinggoals:
� evaluate and understand IT services from the customer’s perspective� develop service level measurement and reporting that are meaningful for
customers� plan future upgrades� discover trends� forestall developing problems
Subsequent chapters demonstrate how SAS IT Service Level Management softwareaddresses some of the common problems of SLM implementation and practice.
Note: For the remainder of the book, the term customer refers to the recipient of ITservices and the term provider or contract provider refers to the provider of thoseservices, whether the provider is part of the same organization as the customer or is anexternal, third-party provider. When the discussion warrants a distinction between aninternal IT department and an external IT provider, this fact will be clearly noted inthe text. �
The Goals of Service Level Management
Understanding and Meeting Business NeedsThe concept of service level management was born out of the mutual need of IT
providers and their customers to fully understand the business needs for IT servicesand to ensure that those needs are met. If providers and customers do not communicateeffectively, inappropriate service goals might be established.
For example, if a provider gauges effectiveness of service based only on theavailability of each IT component, overall service rates could be well above 99.9%, andthe provider might be very proud of an excellent record of availability. At the same timethat the IT department is congratulating itself on superior service, customers could be
4 The Goals of Service Level Management � Chapter 1
experiencing unacceptable service outages due to slow system response time. It ispossible that the repeated failure of a single component, though brief in duration, couldlead to the loss of massive amounts of data. It could also be that a 45-minute outagethat still results in an availability score of 99.9% results in a much longer outage forthe customer.
In reality, no single component functions in isolation. The outage of a major systemcomponent might require additional time to re-establish lost connections and reconfiguredependent systems. Imagine, for example, the effects of a server outage on an onlinecatalog ordering system—especially if the outage occurs during a prime ordering time!A company that experiences such difficulties will probably not be impressed with that99.9% figure. Focusing on equipment performance rather than on service delivery andthe customer experience often provides a skewed view of service quality.
When SLM is implemented properly, providers and customers work together toestablish IT service delivery goals that are directly correlated to the way that businesscustomers actually use and experience IT services. When IT services are evaluated withthe customer’s perspective at the forefront, the focus changes from a disconnectedoverview of all underlying components and services to a more detailed view of thecollective components and services as they directly affect the applications and functionsmost vital to the business.
Steps for Implementing Service Level ManagementSome of the most important steps in the process of implementing SLM include the
following:� Identify business needs. For example, 99.9% availability of catalog ordering
system on a daily basis between the hours of 7:00 a.m. and 10:00 p.m., withscheduled maintenance outages between the hours of 2 a.m. and 4 a.m., if possible.
� Establish measurable service goals for each of the specified components andservices.
� Specify the IT resources that are required to support the business needs.
Ongoing Service Level Management ActivitiesAfter implementation is complete, the ongoing processes of monitoring, documenting,
reporting, and reviewing can begin, enabling you to do the following:� Monitor IT resources with a focus on ensuring that business customers experience
the best possible levels of service.� Document IT performance and report back to customers in a way that is
meaningful and understandable to them.� Review results regularly with the customer and adjust service level goals if needed.� Quickly adjust your SLM processes to accommodate hardware and software
changes and other IT changes.
Moving Beyond Good IntentionsBy implementing SLM, IT providers gain increased sensitivity to customers’ IT
needs. Such providers are better able to anticipate customer requests and exceedcustomer expectations. SLM also helps customers to better understand their own ITrequirements and to have more realistic expectations. Such customers are aware of thereal successes and failures of the IT providers, and they are able to recognize superiorservice. But how can IT providers and their customers move beyond good intentionsand ensure that SLM is effectively implemented? How can they put their IT service
Introduction to SAS IT Service Level Management � Effective Contracts 5
information to work to continually improve the quality of the IT services? Theestablishment of effective, quantifiable contracts is part of the solution.
Effective ContractsSLAs specify service level objectives for one or more IT services that the customer
receives from the provider. A single contract can contain SLAs for several majorservices, such as e-mail, an online catalog ordering system, an intranet, a wide areanetwork, and an internal telephone system. Formalizing service level goals in SLAsenables providers and customers to use the IT service information that they collect toprecisely describe the services and how they will be provided, measured, monitored, andreported on.
Establishing baselines and goals for service levels accomplishes the following:� helps ensure that IT services are aligned with business goals� helps customers to gauge their service level expectations� delineates clear pathways for improvement of service delivery� provides all parties to the SLA with a basis for judging quality of service
Delineating Business NeedsSLAs focus on a required service as the customer uses and experiences it. In other
words, an effective SLA takes into account all of the components and contributoryservices that must be available and functioning in order to deliver the final service thatthe business customer requires.
Establishing Measurable Service GoalsService level objectives are specified for the delivered service. The focus, once again,
is on the quality of service that the customer experiences. Some common types ofservice level objectives that are addressed in SLAs are availability, or the percentage oftime that a system is available to respond to the requests of its users; response time, orthe amount of time between the submission of a request for service and the user’sreceipt of the system’s reply to that request; throughput, or the rate at which requestsfor work are processed by a computer system; a custom objective, or an objective thatmeets your unique business needs; and a composite objective, or an objective thatcombines two or more objectives.
Specifying Measurement TechniquesAfter service level objectives are specified, meaningful measurement techniques must
be adopted. Judgments about how well service level objectives have been met are basedon these measurements. The SLA specifies what aspect of each component and servicewill be measured and how those measurements will be calculated, reported, and usedover time.
Defining Appropriate Reporting Periods and MethodsThe IT provider and the customer should agree on what types of reports will be
prepared, how frequently they will be prepared, and how they will be presented. Themost effective reports provide clear, easy-to-understand information about the overallquality of service that is provided to the customer, even though the data that ispresented might come from disparate sources and be related to diverse equipment,functions, and service components.
6 Common Problems with Contracts � Chapter 1
By agreeing on and recording the service level objectives and the specifics of howprogress toward these objectives will be monitored, measured, and reported on, ITproviders and their business customers improve both the services and the perceptions ofservice success. This understanding accomplishes two objectives:
� It enables providers and customers to work together to fine-tune the alignment ofIT services to the lines of business.
� It facilitates the continued exploration of options and opportunities for continuallyimproving IT services.
Common Problems with ContractsEven after they have completed all the required legwork to create well-structured
contracts, IT providers and their customers face additional difficulties in implementingthe SLAs that are included in their contracts. They often lack the necessarysubstantiating data. Sometimes, they find that it takes so much time to produce andmaintain the necessary reports that reporting is finally dismissed as unfeasible by boththe customer and the provider. The problem is not really lack of data, however. Therecould actually be an excess of data!
The delivery of a specific business capability to a customer is made possible by achain of hardware, software, personnel, information, and other resources. Each of thesefoundational IT components and services contributes to the success or failure of theservice that is covered in the SLA. Among other problems, the complexity of the data isincreased because IT data has the following characteristics:
� It is collected by many different tools and for many different purposes.� It is not typically stored in a central location.� It is dissimilar in measurement type and format.
Yet IT providers and customers must access, filter, manage, analyze, and report onvast amounts of this complex data in order to establish service level objectives andmonitor IT service levels.
The following paragraphs present a closer look at some of these common problems.
Data Collected by Many Different Tools and for Many Different PurposesThere are almost as many tools for collecting IT information as there are hardware
and software manufacturers. But the tools that are created to monitor one device oftenwill not work for devices that are made by a different manufacturer or for different kindsof devices. Also, IT providers must incorporate and interpret data from third-partyproviders such as AT&T, BellSouth, and Cisco. Sifting through so much disparate dataand trying to determine what is “meaningful” is difficult and time-consuming.
Data Not Typically Stored in a Central LocationIn order to access, filter, manage, analyze, and report on data, you have to find it.
After you have decided which data you need in order to calculate service levelperformance, SAS IT Service Level Management enables you to extract the data fromremote or local sources and store it in a contract database.
Data Dissimilar in Measurement Type and FormatThe data that is collected from different components and services is not always
comparable. How does the data from one device really compare to the data from adifferent device, when both are required to deliver a particular service to the customerand the performance of both must be measured for the same purpose?
Introduction to SAS IT Service Level Management � SAS IT Service Level Management Software Overview 7
SAS IT Service Level Management can help you address these and many otherproblems.
SAS IT Service Level Management Software OverviewSAS IT Service Level Management is an easy-to-use, highly scalable, and flexible
SLM solution. Working with SAS IT Resource Management, SAS IT Service LevelManagement enables you to do the following:
� Access IT performance data, no matter how it is collected or where it is locatedand store the data in data source performance databases (PDBs).
� Create a description of your contract and of each component, service, and SLA thatis covered by your contract, including instructions for analyzing the performancedata.
� Simplify the complicated processes of applying service level objectives to the dataand storing the results in contract databases on the SLM server.
� Generate a variety of reports on service level performance as well as contract andservice delivery status.
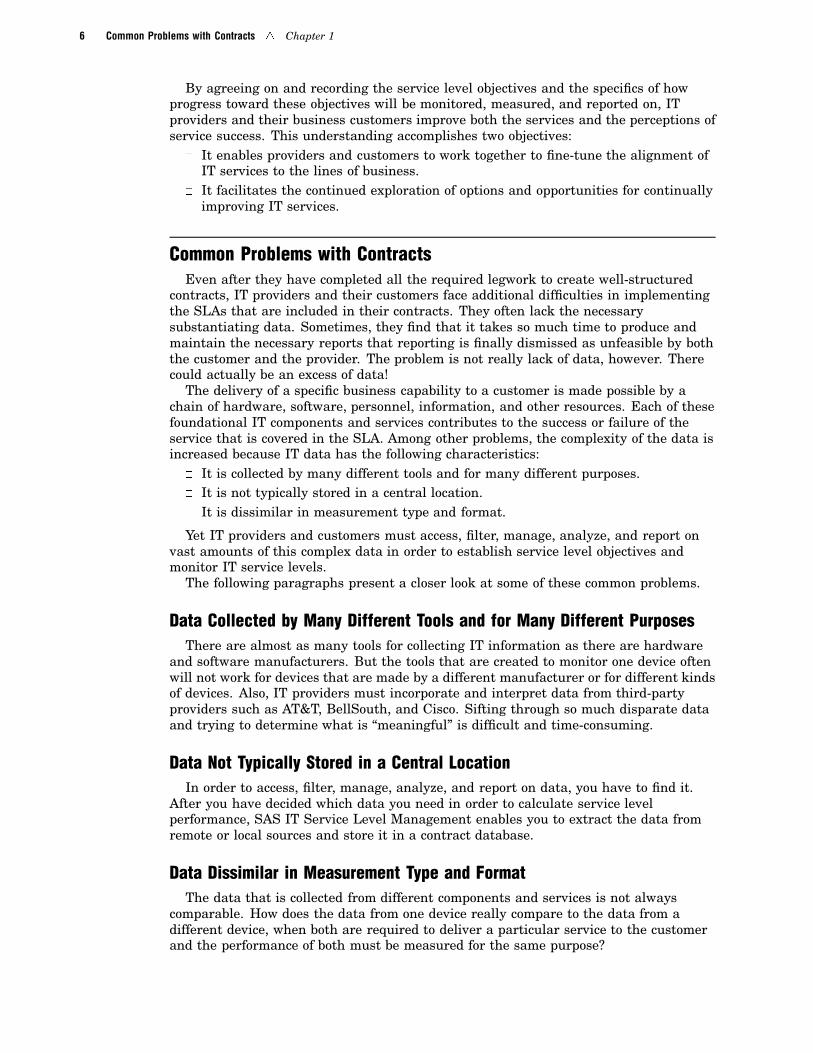
The client/server architecture of SAS IT Service Level Management (see Figure 1.1on page 7) ensures that you are able to access information from your desktop, whilemost of the processing takes place on the SLM server.
Figure 1.1 The SAS IT Service Level Management Client/Server Architecture
ServerPlatform
SAS IT Service LevelManagement Server Software
(includes SAS ITResource Management)
ClientPlatform
Data SourcePlatform
Remote PDBdata sources
Local PDBdata sources
Performancedata
(contractdatabases)
SLMenvironment
database
When you use SAS IT Service Level Management to define a contract and all theSLAs, services, and components that belong to the contract, you also configureinformation for accessing and analyzing the IT data in the data source PDBs. Thisinformation is stored in the environment database. During the SLM extract, transform,and load (ETL) process, illustrated in Figure 1.2 on page 8, SAS IT Service LevelManagement uses the information in the environment database to do the following:
� Make disparate data easily accessible.� Transform data and store it in a contract database.
8 Makes Disparate Data Easily Accessible � Chapter 1
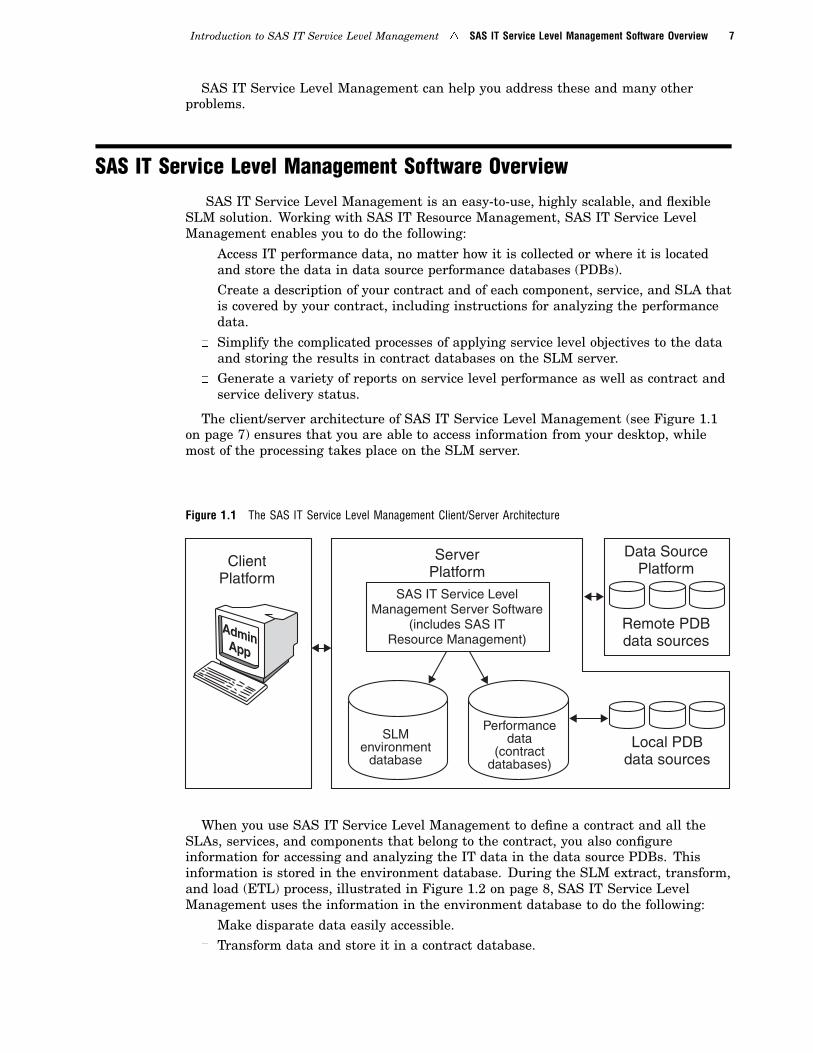
� Calculate service level indicators.
Figure 1.2 SAS IT Service Level Management ETL Process
Data SourceExtraction
Transformationsand SLO Evaluation
ContractDatabase Load
ContractDatabases
Data SourcePDBs
SLMEnvironment
Database
Reports
Makes Disparate Data Easily AccessibleSAS IT Service Level Management uses the flexibility and power of SAS IT Resource
Management. This enables you to access and analyze IT performance data from any ITservice process, no matter where the data resides.
Transforms Data and Stores It in a Contract DatabaseUsing the power of the SAS IT Resource Management batch ETL processes, SAS IT
Service Level Management simplifies the process of extracting the disparate IT data,transforming it, and loading it into the contract database on the SLM server.
Calculates Indicators for Service Level Performance Even withDisparate Data
SAS IT Service Level Management enables you to construct a representation of yourcontract. Using the GUI and detailed information about the IT services and components
Introduction to SAS IT Service Level Management � Generates Reports That Are Meaningful to Providers and Customers 9
that are covered by your contract, you create a description of your contract and of eachcomponent, service, and SLA that is covered by your contract. These descriptions ofeach element of the contract and the graphical representations of these elements arecalled nodes. Your original contract has a hierarchical structure; that is, there is anoverall contract that can contain one or more SLAs. The SLAs cover the specificservices that you offer. Those services are, in turn, a combination of other services orcomponents (or both). The structure of this contract hierarchy is duplicated within SASIT Service Level Management.
SAS IT Service Level Management calculates and reports on service level objectivesfor availability, response time, throughput, custom objectives, and composites of theseobjectives.
A more detailed overview of the contract hierarchy and how values are calculatedand applied throughout the hierarchy is provided in Chapter 2, “Transforming IT Datainto SLM Intelligence,” on page 11.
Generates Reports That Are Meaningful to Providers and CustomersSAS IT Service Level Management uses the relevant data about IT services to
generate reports that clearly communicate to providers and customers how well servicelevel objectives are being met. Baseline reports, Service Level reports, and SASEnterprise Guide reports are provided for comprehensive reporting capabilities.
Baseline ReportingSAS IT Service Level Management generates Baseline reports that display all of the
data that exists in a contract database for a specified contract within the currentenvironment. These graphic reports provide guidance for establishing initial servicelevel targets based on supplied network data.
The Baseline reports are generated in a Web gallery. The gallery enables you to viewhourly, daily, and monthly data in a graphic report. These reports enable you to seetrends for the objectives that are defined in your contract database.
Service Level ReportingSAS IT Service Level Management also generates an interlinked set of Web-based
reports that enable you to view the compliance of service level indicators to theirrespective targets. These reports provide information on all levels of a contracthierarchy and can help you quickly assess compliance by determining whether servicelevel targets have been met. You can drill down from one level of the contract to thenext level and switch from daily to weekly to monthly to yearly reports. Both text-basedand graphic reports are provided.
Enterprise Guide ReportingSAS IT Service Level Management also provides a SAS Enterprise Guide project that
can be used as a template for accessing your data and creating new reportsinteractively. SAS Enterprise Guide reports can be directed to a Web browser, to theEnterprise Guide viewer, or to a viewer of your choice.
Additional information about SAS IT Service Level Management reporting isprovided in Chapter 4, “Reporting on Your SLM Data,” on page 69.
10 Provides a User-Friendly Graphical User Interface � Chapter 1
Provides a User-Friendly Graphical User InterfaceThe GUI enables you to navigate quickly and easily through even the most complex
contracts. In addition to the familiar menu bar, toolbar, and pop-up menus, you willfind a workspaces list and a task list that provide instant access to common tasks.These tasks are carefully organized into related groups and presented in the five mainworkspaces. The other windows that are associated with each of the workspaces enableyou to fine-tune SAS IT Service Level Management to accommodate your existingcontracts.
Using SAS IT Service Level Management does not require an in-depthunderstanding of SAS programming. The flexible GUI enables you to do the following:
� Define the contract and each SLA, service, and component node in the contracthierarchy.
� Select metrics and calculations.� Define service level objectives.� Set targets.� Define range sets and range descriptions for purposes of scoring and reporting.� Adjust data to accommodate both scheduled and unscheduled outages.� Designate customer and provider contacts.� Generate reports.
Other SAS IT Management SolutionsBesides SAS IT Service Level Management, there are several other SAS IT
Management Solutions.� SAS IT Resource Management. Brings your disparate data into a customized
warehouse where it can be used for IT resource management across yourenterprise from your desktop.
� SAS IT Charge Management. Combines IT subscription and transaction-basedcharge information to allocate, audit, and invoice IT usage in specific business costcenters.
For additional information about SAS IT Management Solutions, visit the Web site:http://www.sas.com/solutions/itsysmgmt/.
11
C H A P T E R
2Transforming IT Data into SLMIntelligence
Overview of IT Service Level Calculations 11Understanding the Structure of Your Contract 12
The Structure of the Contract Hierarchy 12
Contract Nodes 13
SLA Nodes 13
Service Nodes 13Component Nodes and Resources 14
Service Level Objectives 14
Indicators 14
Range Descriptions 15
Ranges and Range Sets 16
Scores 17Targets 18
Data Adjustments for Outages 19
Extract, Transform, Load (ETL) 20
Downward Flow of Instructions for Data Extraction and Service Level Calculations 20
Upward Flow of Data and Service Level Calculations 23Summary 26
Overview of IT Service Level CalculationsIn Chapter 1, “Introduction to SAS IT Service Level Management,” on page 1, you
learned that SAS IT Service Level Management enables you to construct asoftware-based contract that mirrors your established IT contract. You also learned thatSAS IT Service Level Management enables you to define service level objectives forevery node in your contract hierarchy and to specify how the performance data will beaccessed and how service level indicators will be calculated. In this chapter, you willfirst learn more about the structure of a contract hierarchy. Next, you will learn moreabout service level objectives. Finally, you will learn about how SAS IT Service LevelManagement performs service level calculations based on the service level objectivesand applies them to each node in the contract during the ETL process.
The information in this chapter will help you to understand the SAS IT Service LevelManagement GUI as depicted in Chapter 3, “Using the SAS IT Service LevelManagement GUI,” on page 29. That chapter introduces the GUI and illustrates themain steps for creating a new service contract and automating the data evaluationprocesses for that contract.
12 Understanding the Structure of Your Contract � Chapter 2
Understanding the Structure of Your ContractBefore you create a contract in SAS IT Service Level Management, you might
already have a written contract. At the very least, you need to formulate a plan thatspecifies the services that you intend to provide to customers and how you will measurethose services. SAS IT Service Level Management can help you develop a contract andset reasonable targets for services by providing Baseline reports that show baselinedata in a contract database.
When you create the contract by using SAS IT Service Level Management, you createa separate node for the contract itself and for each SLA, service, and component thatthe contract covers. This contract mirrors your written contract or plan. If your plancontains multiple levels of complexity, then the contract that you create in SAS ITService Level Management duplicates this level of complexity.
The Structure of the Contract HierarchyThere are four kinds of nodes in the contract hierarchy. These include the component
nodes, the service nodes, the SLA nodes, and the contract nodes. When you create acontract in SAS IT Service Level Management, you create all the nodes that you needto represent all the SLAs, services, and components that your contract covers, and youenter information that clearly establishes the relationships between the nodes.
The contract hierarchy can be visualized as a pyramid, with the contract node,representing your whole contract, at the highest level. The contract node can have anycombination of zero, one, or more SLA, service, and component nodes as its immediatechild nodes. SLA nodes represent the various service level agreements that are coveredby your contract. There can be multiple SLA nodes, and an SLA node can have anycombination of zero, one, or more service and component child nodes. The service nodesrepresent the services that are covered by each SLA. There can be multiple servicenodes, and a service node can have multiple child nodes, which can be services andcomponents. The component nodes represent the various software, hardware, or otherentities that make the delivery of an IT service possible. There can be multiplecomponent nodes, and a component node cannot have child nodes.
Note: See SAS IT Service Level Management: User’s Guide for more detailedinformation about the structure of the contract hierarchy. �
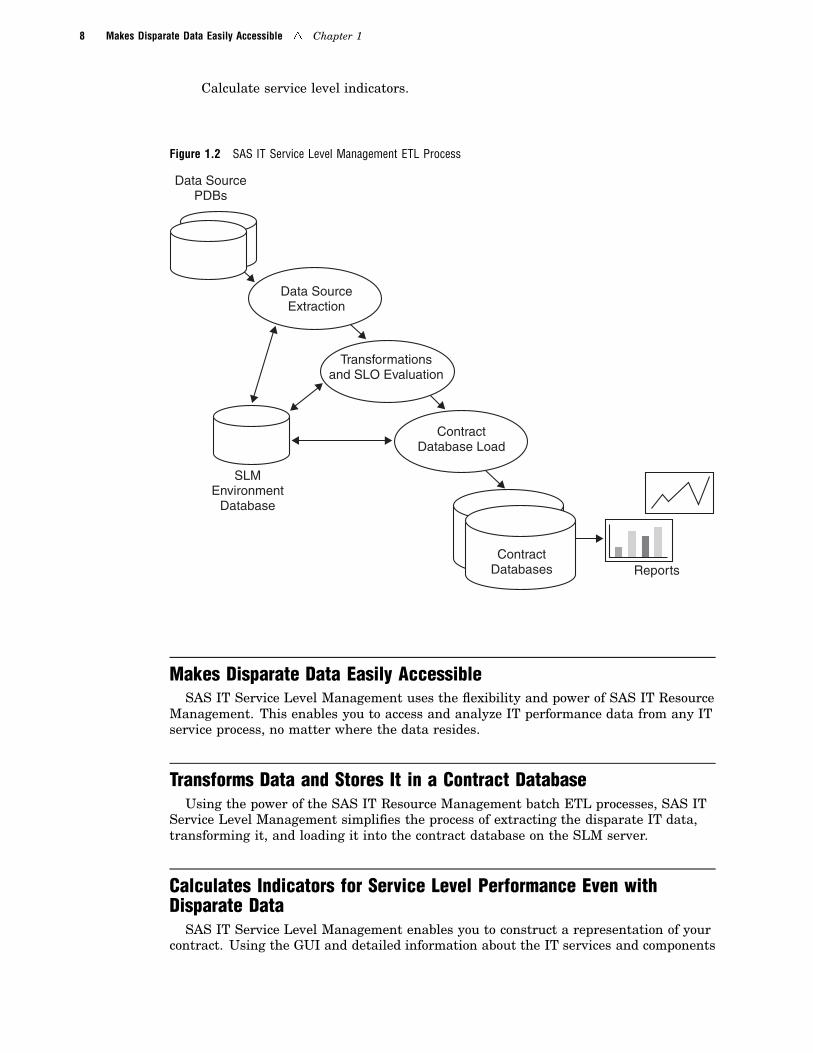
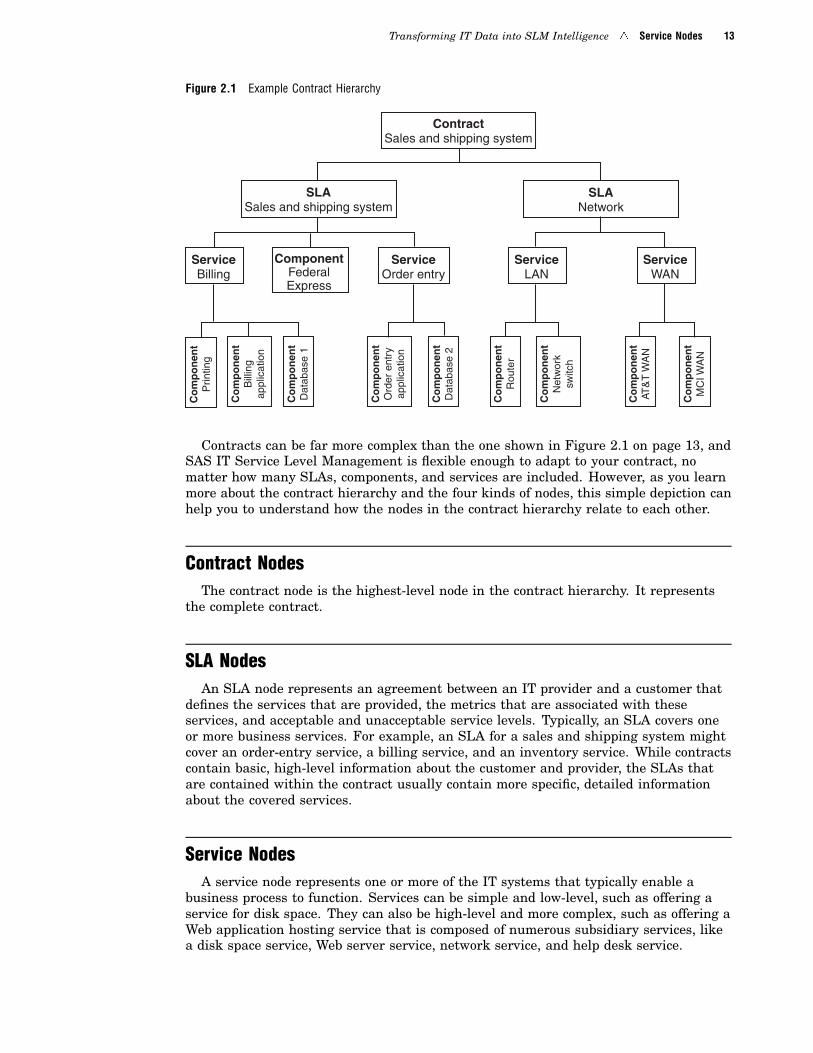
Figure 2.1 on page 13 represents a simple contract hierarchy.
Transforming IT Data into SLM Intelligence � Service Nodes 13
Figure 2.1 Example Contract Hierarchy
ContractSales and shipping system
SLASales and shipping system
SLANetwork
ServiceWAN
ServiceLAN
ServiceOrder entry
ComponentFederalExpress
ServiceBilling
Co
mp
on
ent
Prin
ting
Co
mp
on
ent
Dat
abas
e 1
Co
mp
on
ent
Dat
abas
e 2
Co
mp
on
ent
Rou
ter
Co
mp
on
ent
AT&
T W
AN
Co
mp
on
ent
Bill
ing
appl
icat
ion
Co
mp
on
ent
Ord
er e
ntry
appl
icat
ion
Co
mp
on
ent
Net
wor
ksw
itch
Co
mp
on
ent
MC
I WA
N
Contracts can be far more complex than the one shown in Figure 2.1 on page 13, andSAS IT Service Level Management is flexible enough to adapt to your contract, nomatter how many SLAs, components, and services are included. However, as you learnmore about the contract hierarchy and the four kinds of nodes, this simple depiction canhelp you to understand how the nodes in the contract hierarchy relate to each other.
Contract NodesThe contract node is the highest-level node in the contract hierarchy. It represents
the complete contract.
SLA NodesAn SLA node represents an agreement between an IT provider and a customer that
defines the services that are provided, the metrics that are associated with theseservices, and acceptable and unacceptable service levels. Typically, an SLA covers oneor more business services. For example, an SLA for a sales and shipping system mightcover an order-entry service, a billing service, and an inventory service. While contractscontain basic, high-level information about the customer and provider, the SLAs thatare contained within the contract usually contain more specific, detailed informationabout the covered services.
Service NodesA service node represents one or more of the IT systems that typically enable a
business process to function. Services can be simple and low-level, such as offering aservice for disk space. They can also be high-level and more complex, such as offering aWeb application hosting service that is composed of numerous subsidiary services, likea disk space service, Web server service, network service, and help desk service.
14 Component Nodes and Resources � Chapter 2
Component Nodes and ResourcesComponent nodes usually represent tangible IT hardware and software assets, such
as a Web server or disk farm. Components can be low-level, such as an individualrouter, or high-level, such as an entire LAN/WAN.
For each component node that you define, you must create a list of resources. Theresource list is used to subset the data from the data source PDBs. For example, a Webserver component would have a resource list that identifies the servers in the Webserver farm.
Service Level Objectives
Service level objectives measure the service that the provider delivers to thecustomer. The type of objective indicates what aspect of service is measured in order todetermine a value for the service level indicator. The type of objective is tied to the typeof data measurements that are available to you. Each node can have the followingtypes of objectives, which are based on the data from the child nodes:
Availability the percentage of time that a node is available to respond to therequests of its users.
Response time the amount of time that a node takes to complete a request.
Throughput the volume of work that can be processed by a node within aspecified time.
Custom objective a user-defined objective that measures data that doesn’t typically fitwithin the scope of availability, response time, or throughput, suchas customer satisfaction or mean time between failures (MTBF).
Composite an overall service level measurement, based on scores from anycombination of availability, response time, throughput, and customobjective for the same node.
As you create the nodes for your contract, you also create the service level objectivesfor each node. The service level objectives specify the following:
� calculation methods that are used for the indicator
� range set that is used to determine a score (when scores are used)
� service level target for the objective
Note: Indicators are always calculated for each objective of each node in thecontract, based on the selected objective and calculation methods. An indicator iscompared to a range set in order to obtain a score for each objective of a node. See“Scores” on page 17 for more information about scores, indicators, and ranges. �
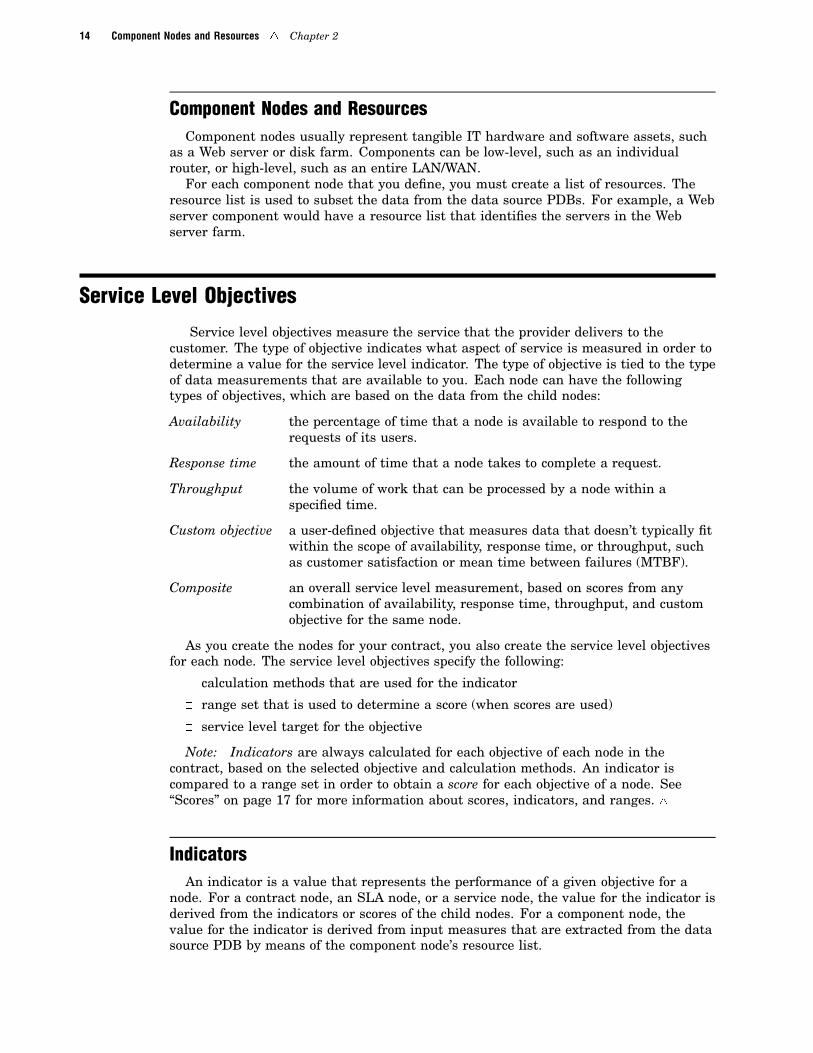
IndicatorsAn indicator is a value that represents the performance of a given objective for a
node. For a contract node, an SLA node, or a service node, the value for the indicator isderived from the indicators or scores of the child nodes. For a component node, thevalue for the indicator is derived from input measures that are extracted from the datasource PDB by means of the component node’s resource list.
Transforming IT Data into SLM Intelligence � Range Descriptions 15
Several calculation methods have been built into the software for each type ofobjective. An appropriate method is set as the default; however, SAS IT Service LevelManagement enables you to select a suitable alternative method to calculate theindicator for each type of objective at each node. You can also specify code for a customcalculation method for any indicator.
Note: More detailed information about appropriate calculation methods is providedin SAS IT Service Level Management: User’s Guide. �
Range DescriptionsRange descriptions enable you to associate common descriptors with range sets for
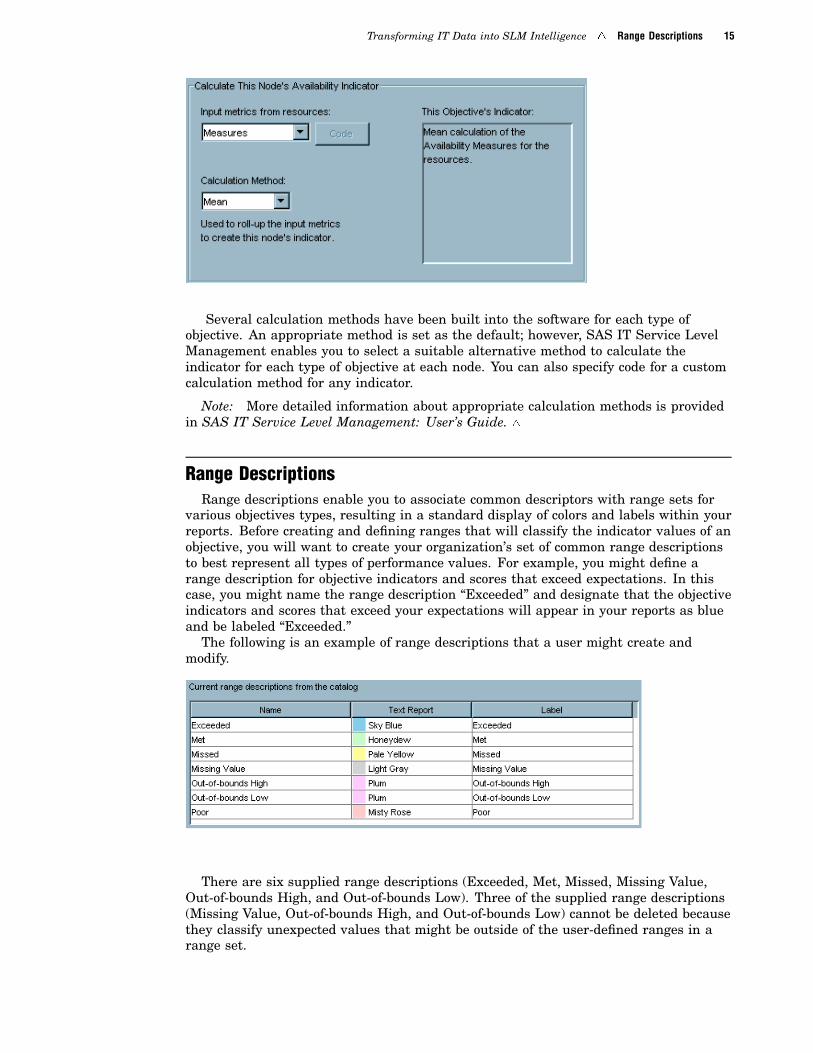
various objectives types, resulting in a standard display of colors and labels within yourreports. Before creating and defining ranges that will classify the indicator values of anobjective, you will want to create your organization’s set of common range descriptionsto best represent all types of performance values. For example, you might define arange description for objective indicators and scores that exceed expectations. In thiscase, you might name the range description “Exceeded” and designate that the objectiveindicators and scores that exceed your expectations will appear in your reports as blueand be labeled “Exceeded.”
The following is an example of range descriptions that a user might create andmodify.
There are six supplied range descriptions (Exceeded, Met, Missed, Missing Value,Out-of-bounds High, and Out-of-bounds Low). Three of the supplied range descriptions(Missing Value, Out-of-bounds High, and Out-of-bounds Low) cannot be deleted becausethey classify unexpected values that might be outside of the user-defined ranges in arange set.
16 Ranges and Range Sets � Chapter 2
Range descriptions are also customizable when defining reports. You can override thedefinitions of range descriptions for specific report specifications, thereby affecting thecolors and labels displayed in reports for the associated contracts. For example, youmight use a range description for all of your reports to display poor performance data inred. However, one of your customers might have a unique requirement or culturalpreference that associates positive values to the color red. You can modify the rangedescription colors for the report specification showing red wherever indicators exceedexpectations, and this change will apply only to contracts within this reportspecification. All report specifications that do not reference that unique customizationwill continue to use the definitions of the original range description that displays poorperformance in red.
Note: For information about how to create and define range descriptions, see “RangeDescriptions” on page 48. More detailed information about range descriptions is alsoavailable in SAS IT Service Level Management: User’s Guide. For more informationabout ranges and range sets, see “Ranges and Range Sets” on page 16. �
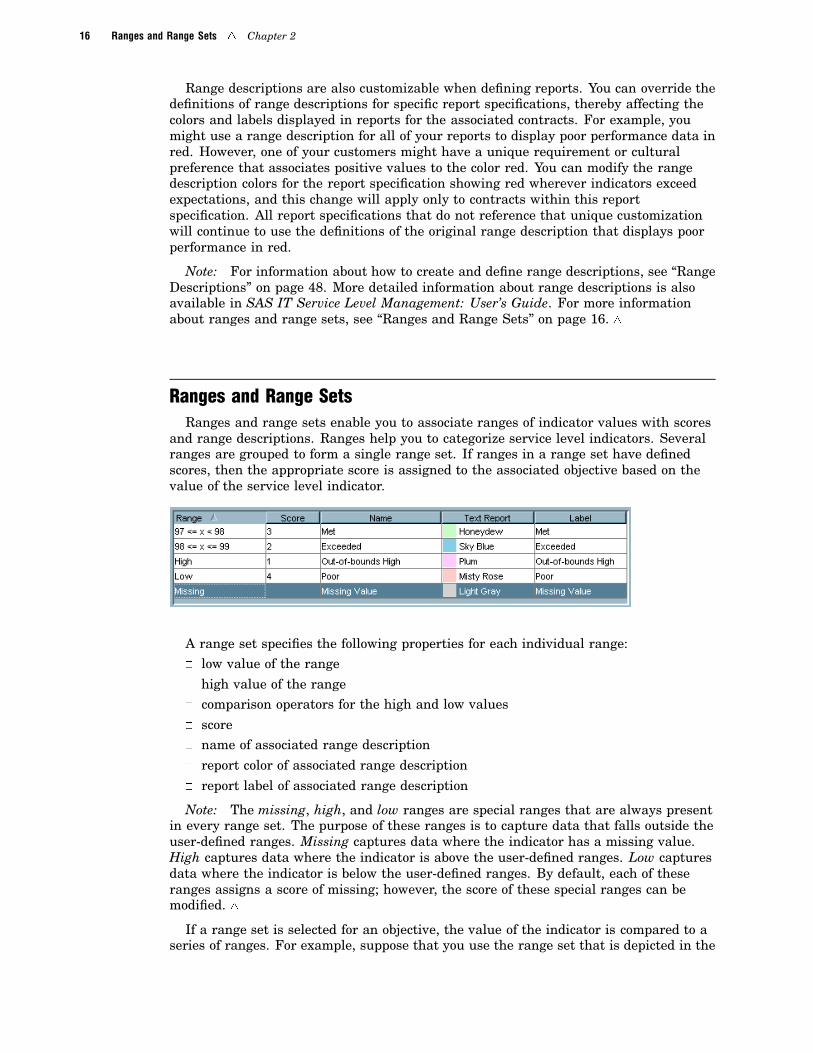
Ranges and Range SetsRanges and range sets enable you to associate ranges of indicator values with scores
and range descriptions. Ranges help you to categorize service level indicators. Severalranges are grouped to form a single range set. If ranges in a range set have definedscores, then the appropriate score is assigned to the associated objective based on thevalue of the service level indicator.
A range set specifies the following properties for each individual range:� low value of the range
� high value of the range� comparison operators for the high and low values
� score� name of associated range description
� report color of associated range description
� report label of associated range description
Note: The missing, high, and low ranges are special ranges that are always presentin every range set. The purpose of these ranges is to capture data that falls outside theuser-defined ranges. Missing captures data where the indicator has a missing value.High captures data where the indicator is above the user-defined ranges. Low capturesdata where the indicator is below the user-defined ranges. By default, each of theseranges assigns a score of missing; however, the score of these special ranges can bemodified. �
If a range set is selected for an objective, the value of the indicator is compared to aseries of ranges. For example, suppose that you use the range set that is depicted in the
Transforming IT Data into SLM Intelligence � Scores 17
sample above. An availability indicator with a value of 99 would receive a score of 2,while an indicator value of 93 would receive a score of 4.
Note: See “Range Sets” on page 49 for information about using the GUI to createrange sets. More detailed information about ranges and range sets is available in SASIT Service Level Management: User’s Guide. �
ScoresA range set can be used to assign a score based on the value of the indicator for the
objective. The score is determined by matching the indicator to the range that includesthe value of the indicator.
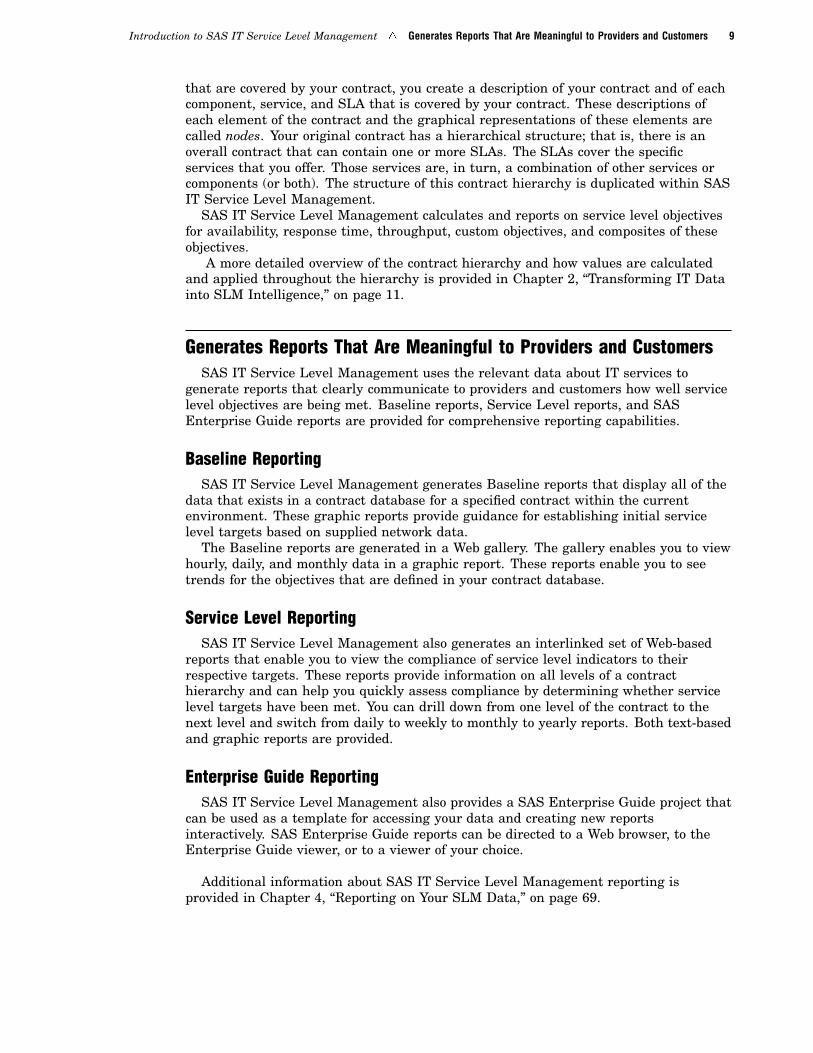
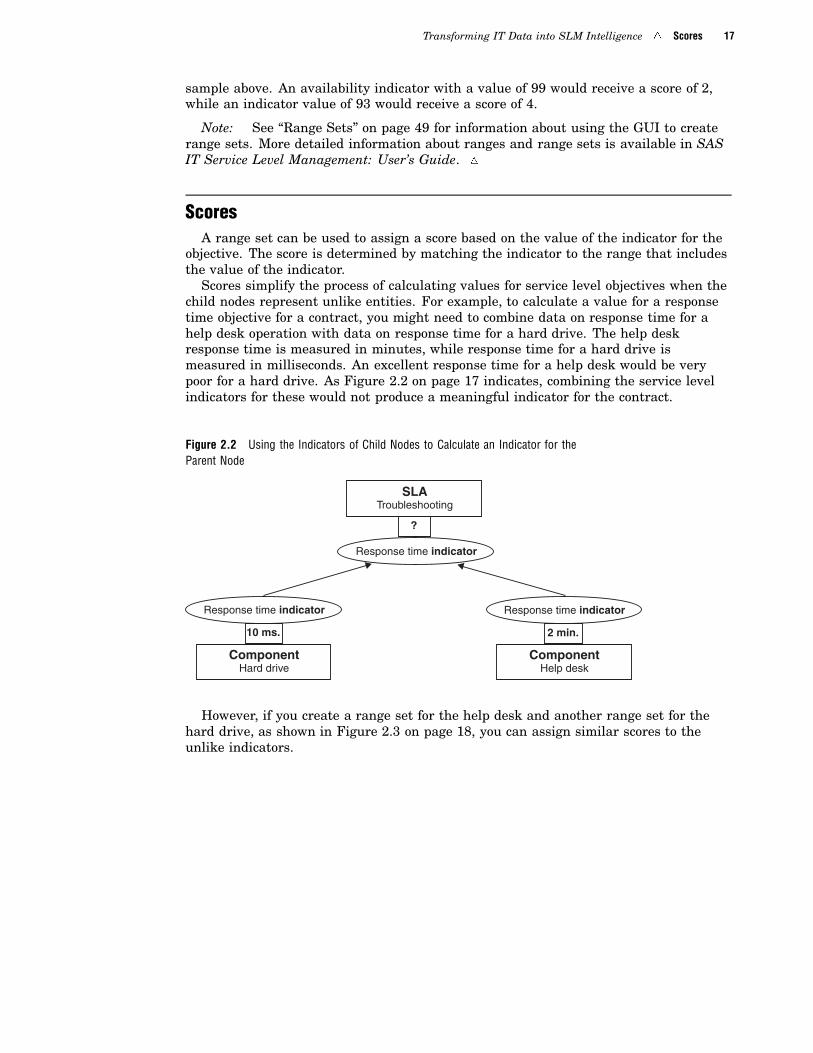
Scores simplify the process of calculating values for service level objectives when thechild nodes represent unlike entities. For example, to calculate a value for a responsetime objective for a contract, you might need to combine data on response time for ahelp desk operation with data on response time for a hard drive. The help deskresponse time is measured in minutes, while response time for a hard drive ismeasured in milliseconds. An excellent response time for a help desk would be verypoor for a hard drive. As Figure 2.2 on page 17 indicates, combining the service levelindicators for these would not produce a meaningful indicator for the contract.
Figure 2.2 Using the Indicators of Child Nodes to Calculate an Indicator for theParent Node
SLATroubleshooting
ComponentHard drive
ComponentHelp desk
Response time indicator Response time indicator
Response time indicator
?
2 min.10 ms.
However, if you create a range set for the help desk and another range set for thehard drive, as shown in Figure 2.3 on page 18, you can assign similar scores to theunlike indicators.
18 Targets � Chapter 2
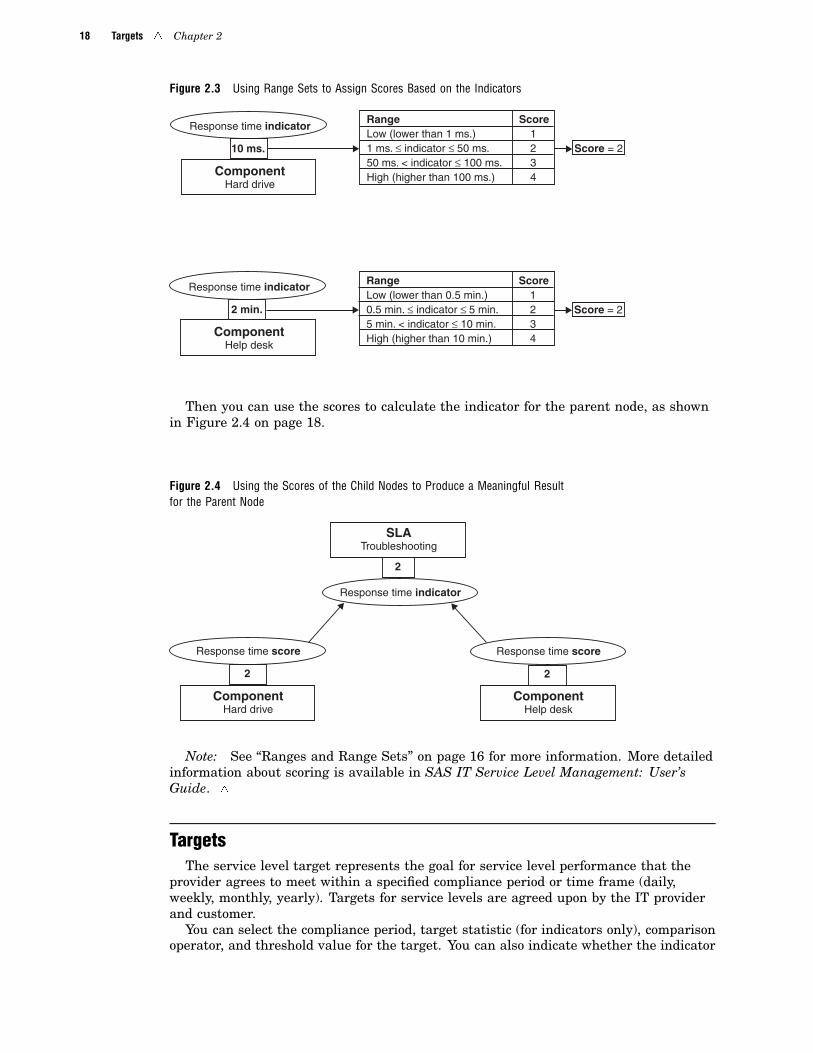
Figure 2.3 Using Range Sets to Assign Scores Based on the Indicators
ComponentHard drive
ComponentHelp desk
Response time indicator
Response time indicator
2 min.
10 ms.
Range ScoreLow (lower than 1 ms.) 11 ms. ≤ indicator ≤ 50 ms. 250 ms. < indicator ≤ 100 ms. 3High (higher than 100 ms.) 4
Score = 2
Range ScoreLow (lower than 0.5 min.) 10.5 min. ≤ indicator ≤ 5 min. 25 min. < indicator ≤ 10 min. 3High (higher than 10 min.) 4
Score = 2
Then you can use the scores to calculate the indicator for the parent node, as shownin Figure 2.4 on page 18.
Figure 2.4 Using the Scores of the Child Nodes to Produce a Meaningful Resultfor the Parent Node
SLATroubleshooting
ComponentHard drive
ComponentHelp desk
Response time score Response time score
Response time indicator
2
22
Note: See “Ranges and Range Sets” on page 16 for more information. More detailedinformation about scoring is available in SAS IT Service Level Management: User’sGuide. �
TargetsThe service level target represents the goal for service level performance that the
provider agrees to meet within a specified compliance period or time frame (daily,weekly, monthly, yearly). Targets for service levels are agreed upon by the IT providerand customer.
You can select the compliance period, target statistic (for indicators only), comparisonoperator, and threshold value for the target. You can also indicate whether the indicator

Transforming IT Data into SLM Intelligence � Data Adjustments for Outages 19
or the score for a particular node is compared to the threshold value to determinewhether the goal for that node has been met.
Compliance reports display lists of contracts and their compliance with the targetsettings. IT providers and customers can use these reports to view the compliance ofservice level performance across all objective types within contracts. See “Service LevelReports” on page 77 for more information about compliance reports.
Note: More detailed information about targets is available in SAS IT Service LevelManagement: User’s Guide. �
Data Adjustments for OutagesSAS IT Service Level Management provides methods for adjusting service level data
to exclude planned and excused outages from calculations of indicators. An outage is anevent during which contracted services are not available for a period of time. Someoutages are necessary or unavoidable, and these outages should not count against theprovider. Necessary outages typically include scheduled outages for required systemsmaintenance or for holidays. These outages are planned in advance, and the providershould not be held responsible for the service interruptions that result. Unavoidableoutages are beyond the control of the provider. These include outages that are caused bynatural disasters such as hurricanes and ice storms. These kinds of unplanned outagesare considered “excused outages,” and the provider is not held accountable for them.
SAS IT Service Level Management enables you to specify the start time and end timeof an outage and the type of outage (scheduled or excused).
20 Extract, Transform, Load (ETL) � Chapter 2
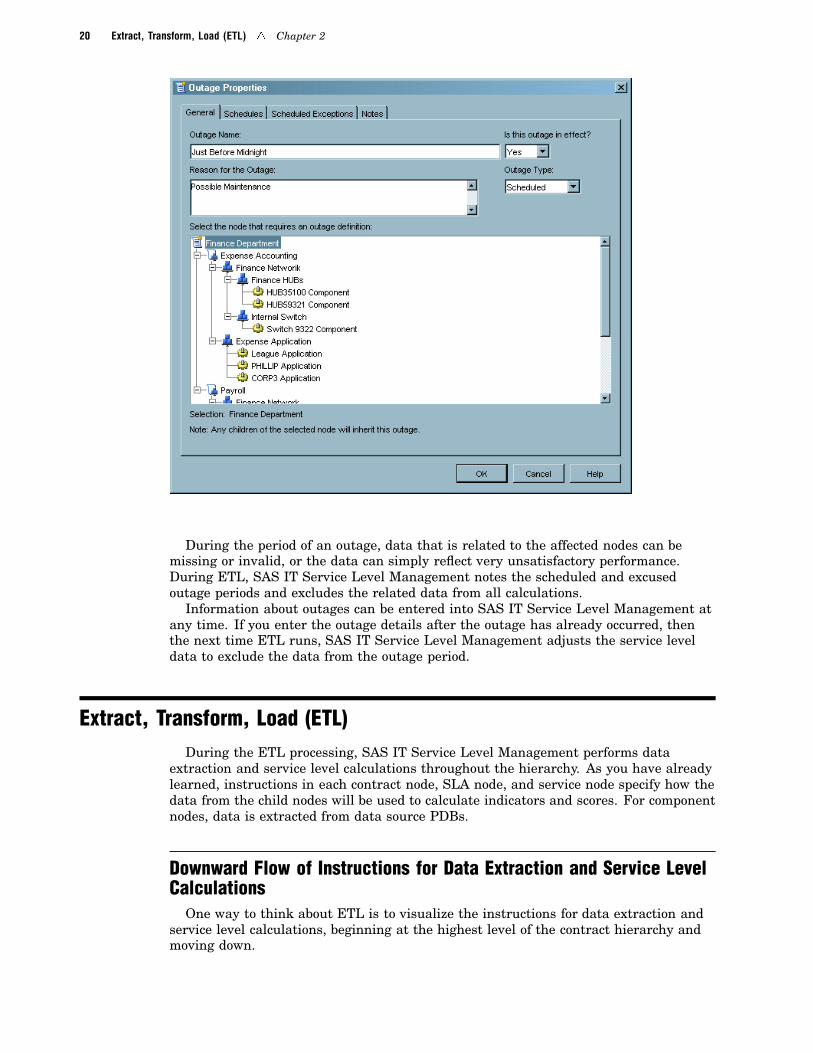
During the period of an outage, data that is related to the affected nodes can bemissing or invalid, or the data can simply reflect very unsatisfactory performance.During ETL, SAS IT Service Level Management notes the scheduled and excusedoutage periods and excludes the related data from all calculations.
Information about outages can be entered into SAS IT Service Level Management atany time. If you enter the outage details after the outage has already occurred, thenthe next time ETL runs, SAS IT Service Level Management adjusts the service leveldata to exclude the data from the outage period.
Extract, Transform, Load (ETL)During the ETL processing, SAS IT Service Level Management performs data
extraction and service level calculations throughout the hierarchy. As you have alreadylearned, instructions in each contract node, SLA node, and service node specify how thedata from the child nodes will be used to calculate indicators and scores. For componentnodes, data is extracted from data source PDBs.
Downward Flow of Instructions for Data Extraction and Service LevelCalculations
One way to think about ETL is to visualize the instructions for data extraction andservice level calculations, beginning at the highest level of the contract hierarchy andmoving down.
Transforming IT Data into SLM Intelligence � Downward Flow of Instructions for Data Extraction and Service Level Calculations 21
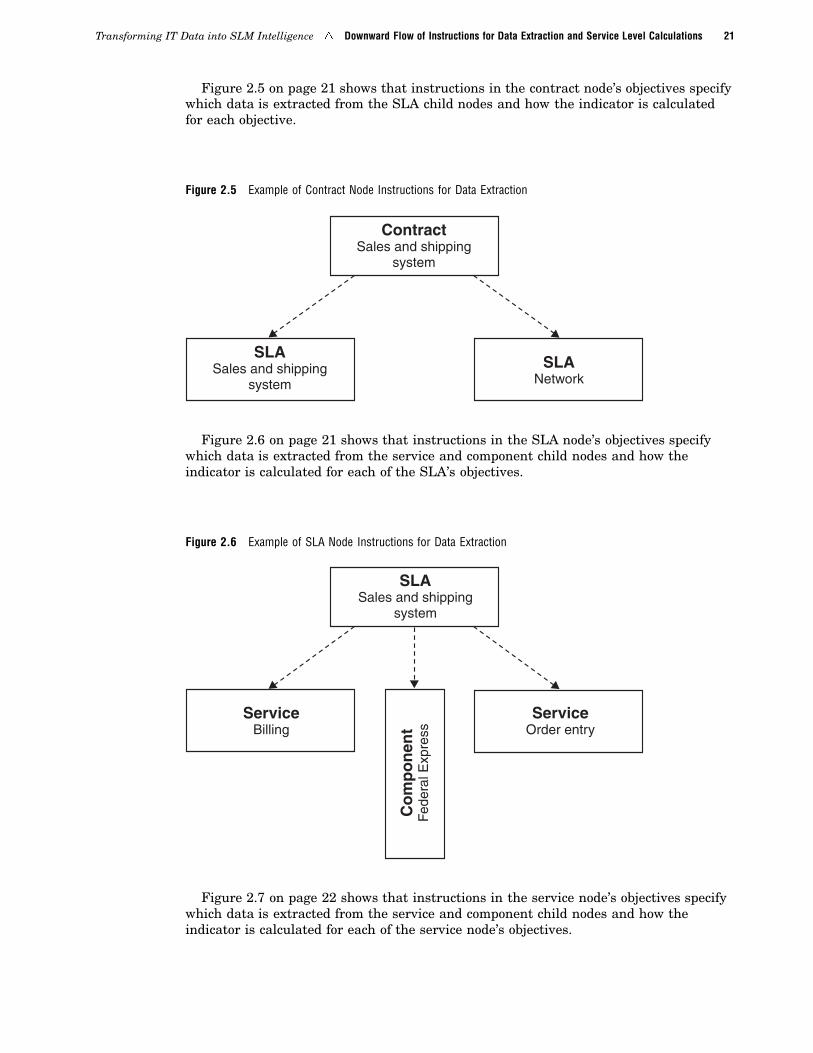
Figure 2.5 on page 21 shows that instructions in the contract node’s objectives specifywhich data is extracted from the SLA child nodes and how the indicator is calculatedfor each objective.
Figure 2.5 Example of Contract Node Instructions for Data Extraction
ContractSales and shipping
system
SLASales and shipping
system
SLANetwork
Figure 2.6 on page 21 shows that instructions in the SLA node’s objectives specifywhich data is extracted from the service and component child nodes and how theindicator is calculated for each of the SLA’s objectives.
Figure 2.6 Example of SLA Node Instructions for Data Extraction
SLASales and shipping
system
ServiceBilling
ServiceOrder entry
Co
mp
on
ent
Fed
eral
Exp
ress
Figure 2.7 on page 22 shows that instructions in the service node’s objectives specifywhich data is extracted from the service and component child nodes and how theindicator is calculated for each of the service node’s objectives.
22 Downward Flow of Instructions for Data Extraction and Service Level Calculations � Chapter 2
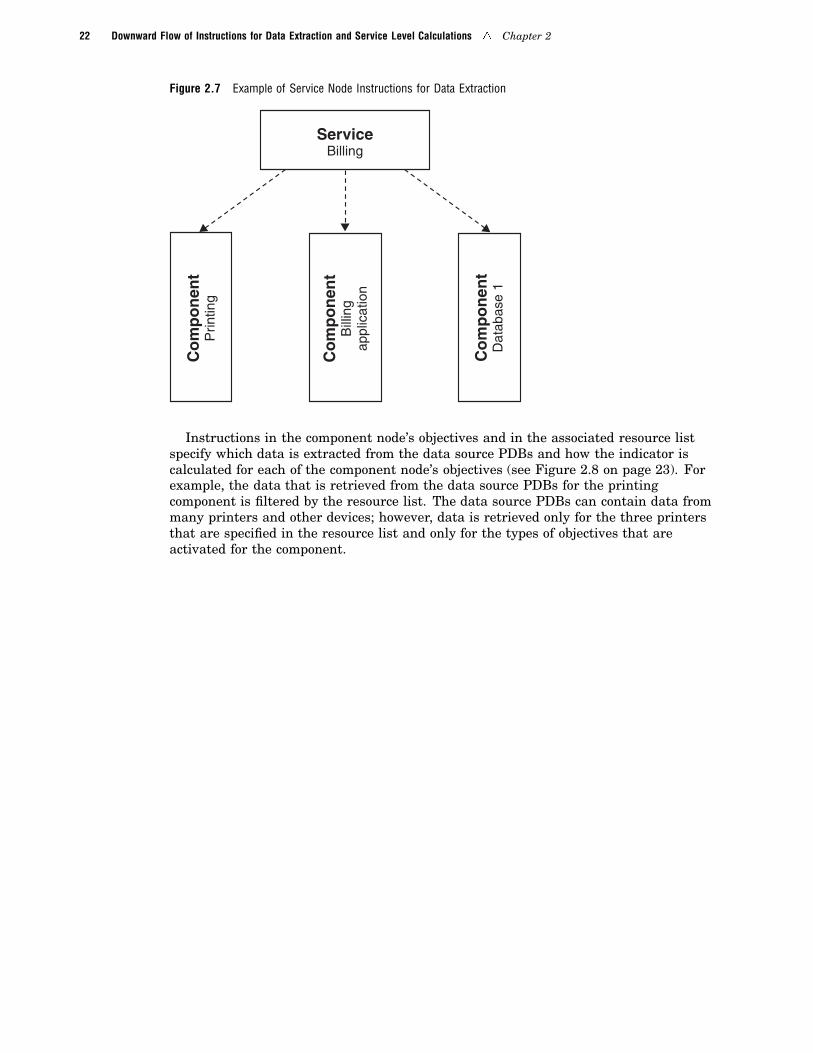
Figure 2.7 Example of Service Node Instructions for Data Extraction
ServiceBilling
Co
mp
on
ent
Prin
ting
Co
mp
on
ent
Dat
abas
e 1
Co
mp
on
ent
Bill
ing
appl
icat
ion
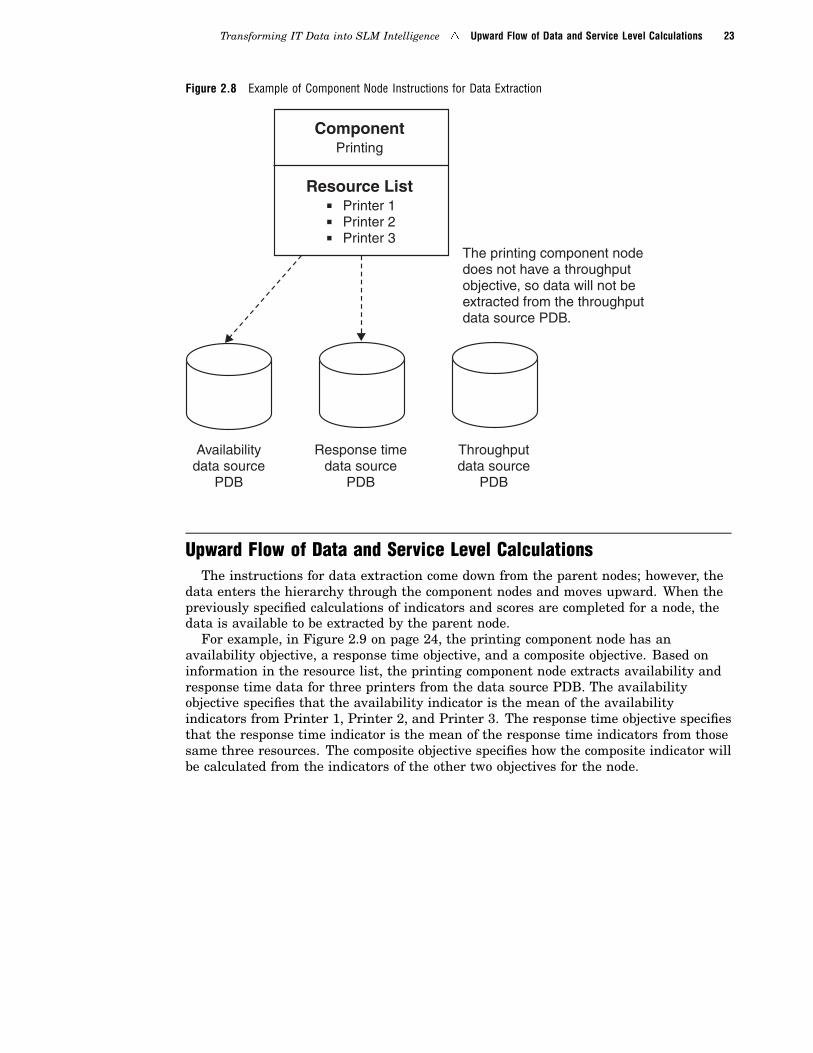
Instructions in the component node’s objectives and in the associated resource listspecify which data is extracted from the data source PDBs and how the indicator iscalculated for each of the component node’s objectives (see Figure 2.8 on page 23). Forexample, the data that is retrieved from the data source PDBs for the printingcomponent is filtered by the resource list. The data source PDBs can contain data frommany printers and other devices; however, data is retrieved only for the three printersthat are specified in the resource list and only for the types of objectives that areactivated for the component.
Transforming IT Data into SLM Intelligence � Upward Flow of Data and Service Level Calculations 23
Figure 2.8 Example of Component Node Instructions for Data Extraction
ComponentPrinting
Resource List. Printer 1. Printer 2. Printer 3
Availabilitydata source
PDB
Response timedata source
PDB
Throughputdata source
PDB
The printing component nodedoes not have a throughputobjective, so data will not beextracted from the throughputdata source PDB.
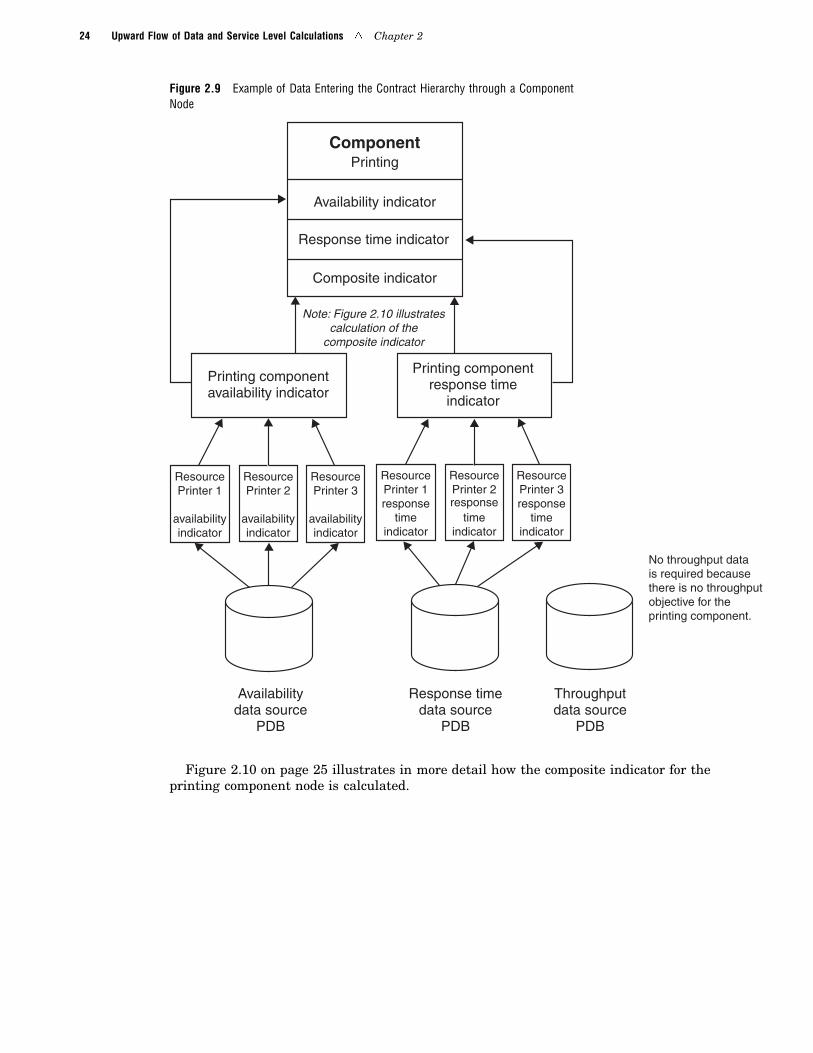
Upward Flow of Data and Service Level CalculationsThe instructions for data extraction come down from the parent nodes; however, the
data enters the hierarchy through the component nodes and moves upward. When thepreviously specified calculations of indicators and scores are completed for a node, thedata is available to be extracted by the parent node.
For example, in Figure 2.9 on page 24, the printing component node has anavailability objective, a response time objective, and a composite objective. Based oninformation in the resource list, the printing component node extracts availability andresponse time data for three printers from the data source PDB. The availabilityobjective specifies that the availability indicator is the mean of the availabilityindicators from Printer 1, Printer 2, and Printer 3. The response time objective specifiesthat the response time indicator is the mean of the response time indicators from thosesame three resources. The composite objective specifies how the composite indicator willbe calculated from the indicators of the other two objectives for the node.
24 Upward Flow of Data and Service Level Calculations � Chapter 2
Figure 2.9 Example of Data Entering the Contract Hierarchy through a ComponentNode
ComponentPrinting
Availability indicator
Response time indicator
Composite indicator
Printing componentavailability indicator
Printing componentresponse time
indicator
Availabilitydata source
PDB
Response timedata source
PDB
Throughputdata source
PDB
ResourcePrinter 2
availabilityindicator
ResourcePrinter 1
availabilityindicator
ResourcePrinter 3
availabilityindicator
ResourcePrinter 2
timeindicator
ResourcePrinter 1response
timeindicator
ResourcePrinter 3response
timeindicator
response
Note: Figure 2.10 illustratescalculation of the
composite indicator
No throughput datais required becausethere is no throughputobjective for theprinting component.
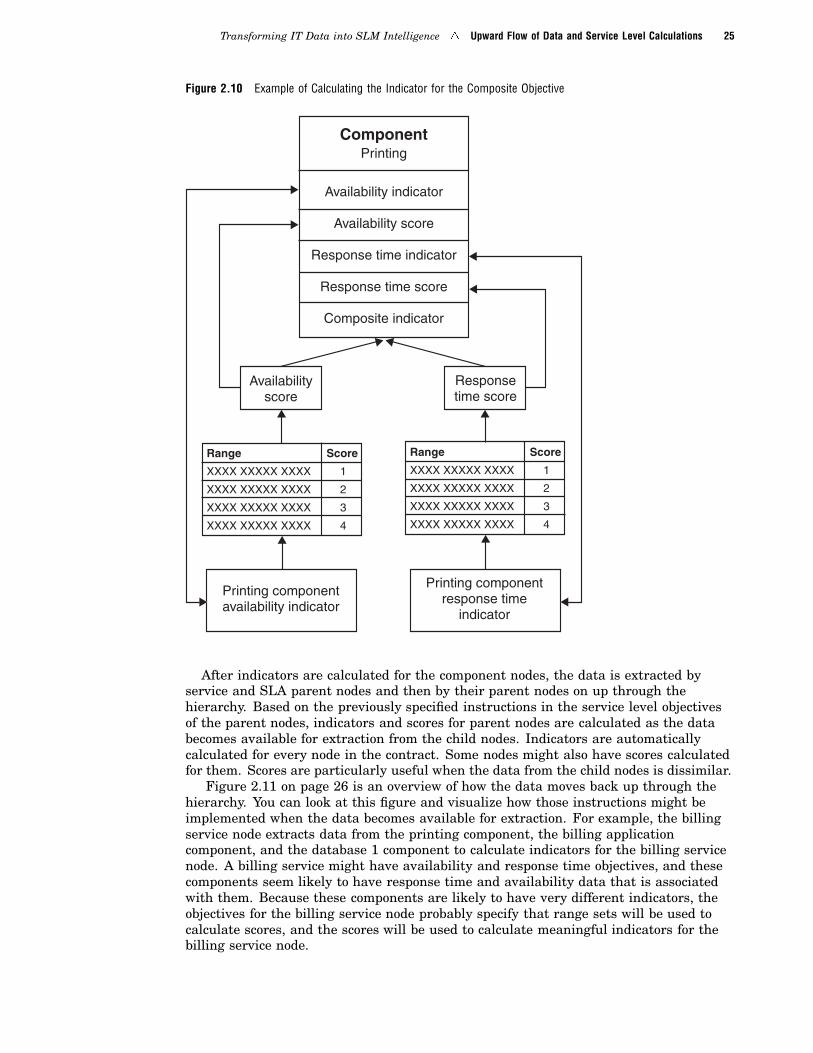
Figure 2.10 on page 25 illustrates in more detail how the composite indicator for theprinting component node is calculated.
Transforming IT Data into SLM Intelligence � Upward Flow of Data and Service Level Calculations 25
Figure 2.10 Example of Calculating the Indicator for the Composite Objective
ComponentPrinting
Availability indicator
Availability score
Response time indicator
Response time score
Composite indicator
Printing componentavailability indicator
Printing componentresponse time
indicator
Availabilityscore
Responsetime score
Range Score
XXXX XXXXX XXXX 1
XXXX XXXXX XXXX 2
XXXX XXXXX XXXX 3
XXXX XXXXX XXXX 4
Range Score
XXXX XXXXX XXXX 1
XXXX XXXXX XXXX 2
XXXX XXXXX XXXX 3
XXXX XXXXX XXXX 4
After indicators are calculated for the component nodes, the data is extracted byservice and SLA parent nodes and then by their parent nodes on up through thehierarchy. Based on the previously specified instructions in the service level objectivesof the parent nodes, indicators and scores for parent nodes are calculated as the databecomes available for extraction from the child nodes. Indicators are automaticallycalculated for every node in the contract. Some nodes might also have scores calculatedfor them. Scores are particularly useful when the data from the child nodes is dissimilar.
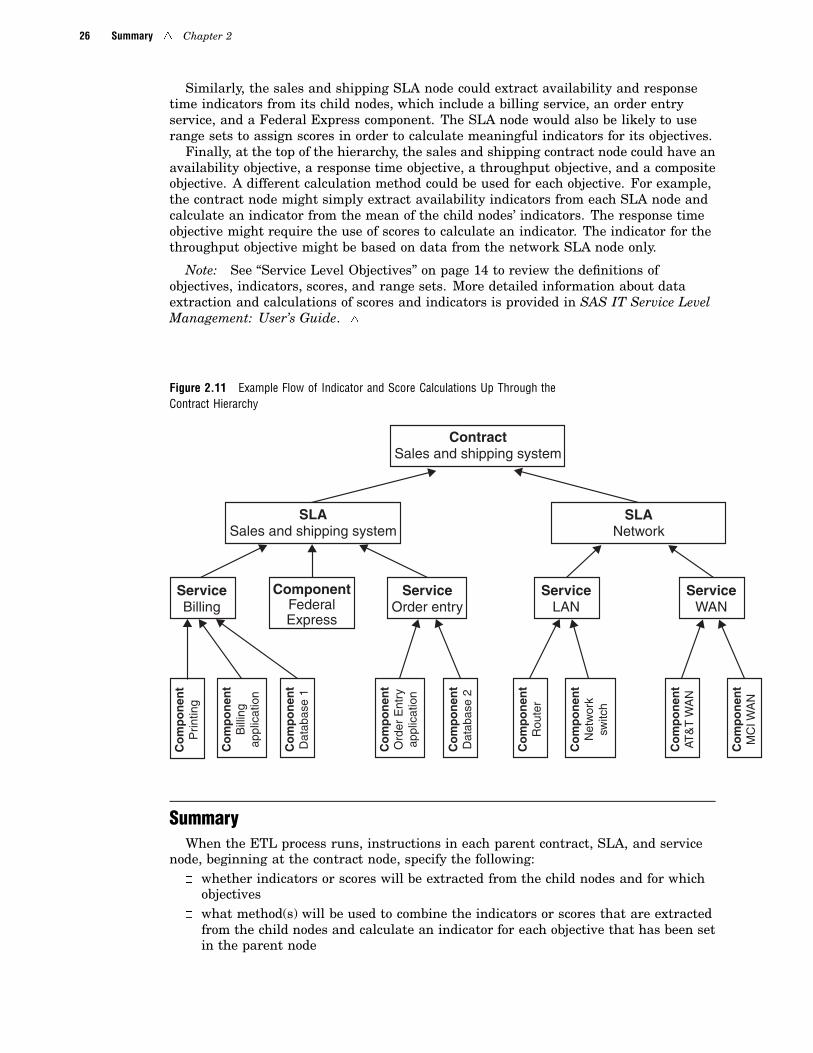
Figure 2.11 on page 26 is an overview of how the data moves back up through thehierarchy. You can look at this figure and visualize how those instructions might beimplemented when the data becomes available for extraction. For example, the billingservice node extracts data from the printing component, the billing applicationcomponent, and the database 1 component to calculate indicators for the billing servicenode. A billing service might have availability and response time objectives, and thesecomponents seem likely to have response time and availability data that is associatedwith them. Because these components are likely to have very different indicators, theobjectives for the billing service node probably specify that range sets will be used tocalculate scores, and the scores will be used to calculate meaningful indicators for thebilling service node.
26 Summary � Chapter 2
Similarly, the sales and shipping SLA node could extract availability and responsetime indicators from its child nodes, which include a billing service, an order entryservice, and a Federal Express component. The SLA node would also be likely to userange sets to assign scores in order to calculate meaningful indicators for its objectives.
Finally, at the top of the hierarchy, the sales and shipping contract node could have anavailability objective, a response time objective, a throughput objective, and a compositeobjective. A different calculation method could be used for each objective. For example,the contract node might simply extract availability indicators from each SLA node andcalculate an indicator from the mean of the child nodes’ indicators. The response timeobjective might require the use of scores to calculate an indicator. The indicator for thethroughput objective might be based on data from the network SLA node only.
Note: See “Service Level Objectives” on page 14 to review the definitions ofobjectives, indicators, scores, and range sets. More detailed information about dataextraction and calculations of scores and indicators is provided in SAS IT Service LevelManagement: User’s Guide. �
Figure 2.11 Example Flow of Indicator and Score Calculations Up Through theContract Hierarchy
ContractSales and shipping system
SLASales and shipping system
SLANetwork
ServiceWAN
ServiceLAN
ServiceOrder entry
ComponentFederalExpress
ServiceBilling
Co
mp
on
ent
Prin
ting
Co
mp
on
ent
Dat
abas
e 1
Co
mp
on
ent
Dat
abas
e 2
Co
mp
on
ent
Rou
ter
Co
mp
on
ent
AT&
T W
AN
Co
mp
on
ent
Bill
ing
appl
icat
ion
Co
mp
on
ent
Ord
er E
ntry
appl
icat
ion
Co
mp
on
ent
Net
wor
ksw
itch
Co
mp
on
ent
MC
I WA
N
SummaryWhen the ETL process runs, instructions in each parent contract, SLA, and service
node, beginning at the contract node, specify the following:� whether indicators or scores will be extracted from the child nodes and for which
objectives� what method(s) will be used to combine the indicators or scores that are extracted
from the child nodes and calculate an indicator for each objective that has been setin the parent node
Transforming IT Data into SLM Intelligence � Summary 27
� whether scores will also be calculated for the parent node and for which objectives
Data enters the contract hierarchy through the component nodes. The resource list ofeach component specifies exactly which data is imported and filters out all the rest.Instructions in the objectives of the component node specify how an indicator iscalculated for the node and whether scores will also be calculated and for whichobjectives.

28

29
C H A P T E R
3Using the SAS IT Service LevelManagement GUI
Overview: Getting Ready to Run SAS IT Service Level Management 30Starting the GUI 30
Exploring the GUI 33
Navigation 34
Menu Bar 34
Toolbar 34Workspaces List 35
Hierarchy Tree Pop-up Menus 35
Task List 35
Tabs 35
Workspaces 35
Contract Workspace 35Catalog Workspace 36
Participants Workspace 37
Data Workspace 37
Reports Workspace 38
Using the GUI to Construct a Contract 38Defining Server Connections and Data Sources 39
Server Connections 40
Data Sources 42
Adding Participants 42
Contacts 43Customers 44
Providers 46
Creating Catalog Items 47
Range Descriptions 48
Range Sets 49
Components 52Services 59
SLAs 60
Creating a Contract 61
The Contract Workspace 61
The Contract Window 62Running ETL 68
Closing SAS IT Service Level Management 68
30 Overview: Getting Ready to Run SAS IT Service Level Management � Chapter 3
Overview: Getting Ready to Run SAS IT Service Level ManagementIn previous chapters, you learned how SAS IT Service Level Management can help
you manage your service level contracts. This chapter describes how to use the GUI todo the following:
� Access IT performance data.� Define all the measurable nodes—components, services, and SLAs—that make up
a contract.� Designate service level objectives for each node.� Select your preferred methods of processing and evaluating the data.
Note: Many of the screen images in this chapter show sample data and settings tohelp you understand how data might appear in your SAS IT Service Level Managementapplication. �
Starting the GUIThe first time you log on to SAS IT Service Level Management, you must select the
existing environment that you want to use or edit properties to define an appropriateenvironment for your needs.
The SLM environment contains the SLM environmental data for a contract.Environmental data describes the software objects that you define and use to create thecontract—that is, the SLAs, services, components, customers, providers, and more.Typically, you need only a single SLM environment. You can have multipleenvironments; however, you cannot open more than one environment at a time.
To start SAS IT Service Level Management, you can use either of these methods:� Select the SAS IT Service Level Management icon on your desktop.� From the Windows taskbar, select Start � Programs � SAS IT Service Level
Management.
The Log On Info dialog box opens.
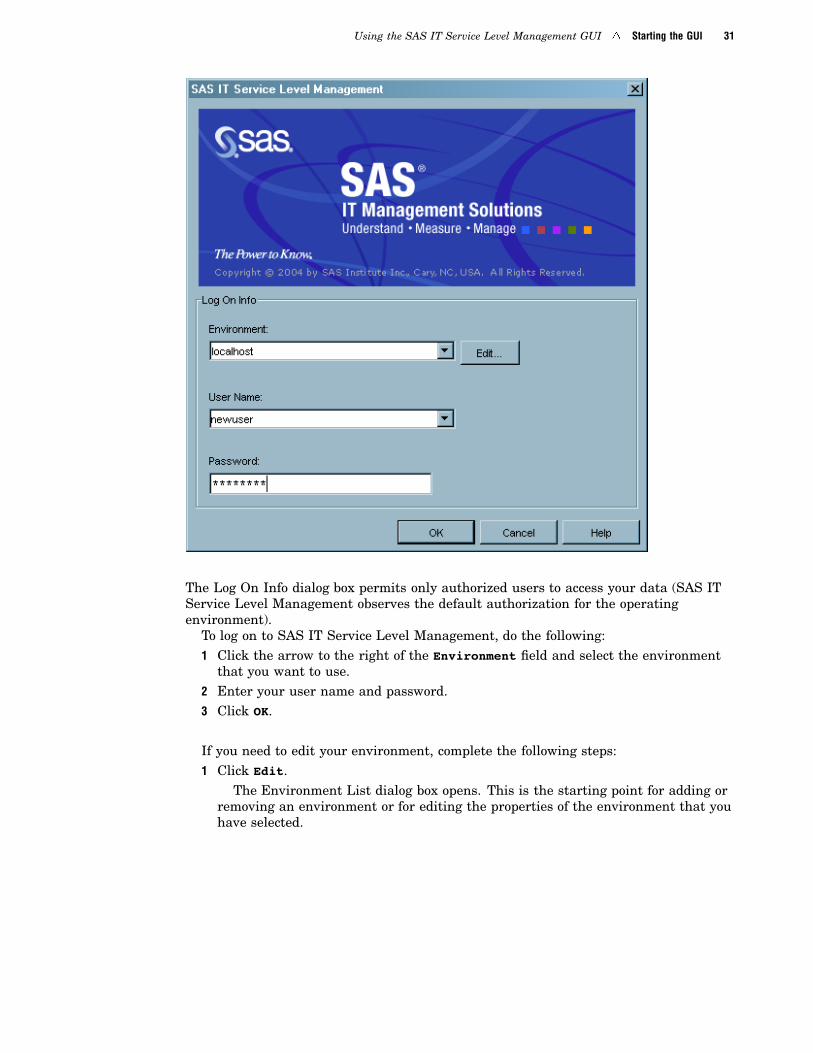
Using the SAS IT Service Level Management GUI � Starting the GUI 31
The Log On Info dialog box permits only authorized users to access your data (SAS ITService Level Management observes the default authorization for the operatingenvironment).
To log on to SAS IT Service Level Management, do the following:1 Click the arrow to the right of the Environment field and select the environment
that you want to use.2 Enter your user name and password.3 Click OK.
If you need to edit your environment, complete the following steps:1 Click Edit.
The Environment List dialog box opens. This is the starting point for adding orremoving an environment or for editing the properties of the environment that youhave selected.
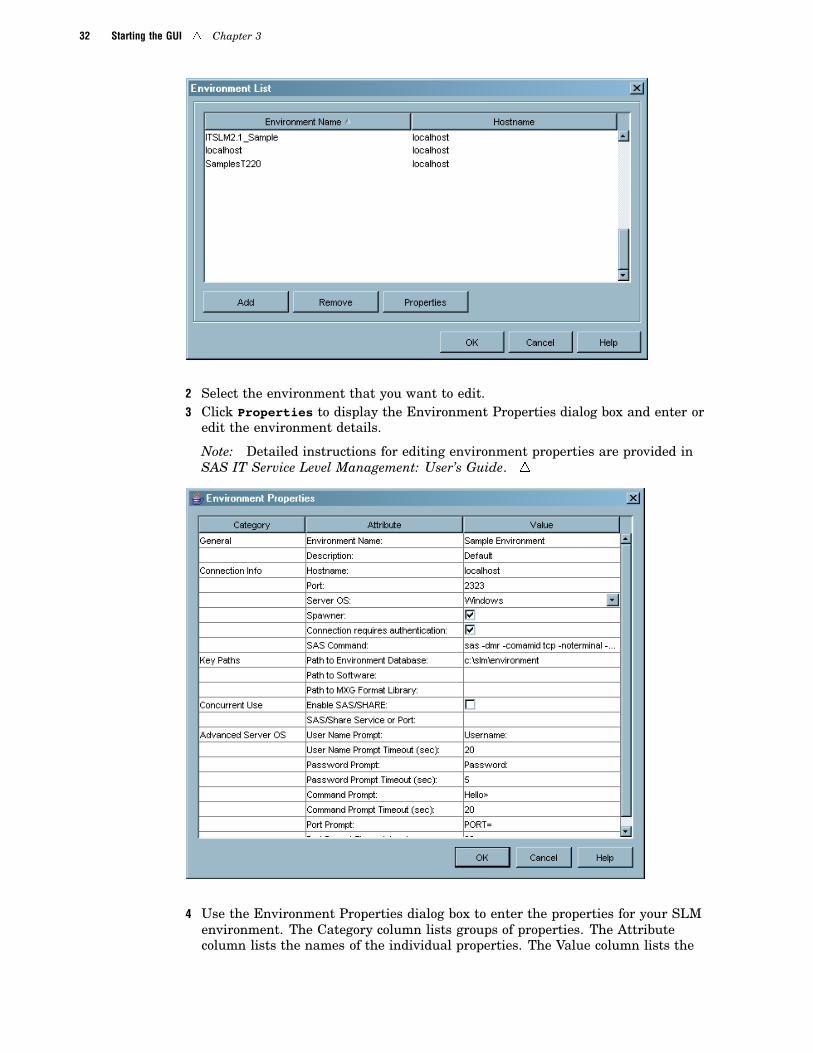
32 Starting the GUI � Chapter 3
2 Select the environment that you want to edit.3 Click Properties to display the Environment Properties dialog box and enter or
edit the environment details.
Note: Detailed instructions for editing environment properties are provided inSAS IT Service Level Management: User’s Guide. �
4 Use the Environment Properties dialog box to enter the properties for your SLMenvironment. The Category column lists groups of properties. The Attributecolumn lists the names of the individual properties. The Value column lists the
Using the SAS IT Service Level Management GUI � Exploring the GUI 33
values of the properties. The environment data is stored on the SLM serverplatform and is accessed by means of the connection to the SLM server. Theenvironmental data is saved and is automatically opened as the defaultenvironment the next time you start SAS IT Service Level Management.
5 Click OK in the Environment Properties dialog box and on the Environment Listdialog box to return to the Log On Info dialog box.
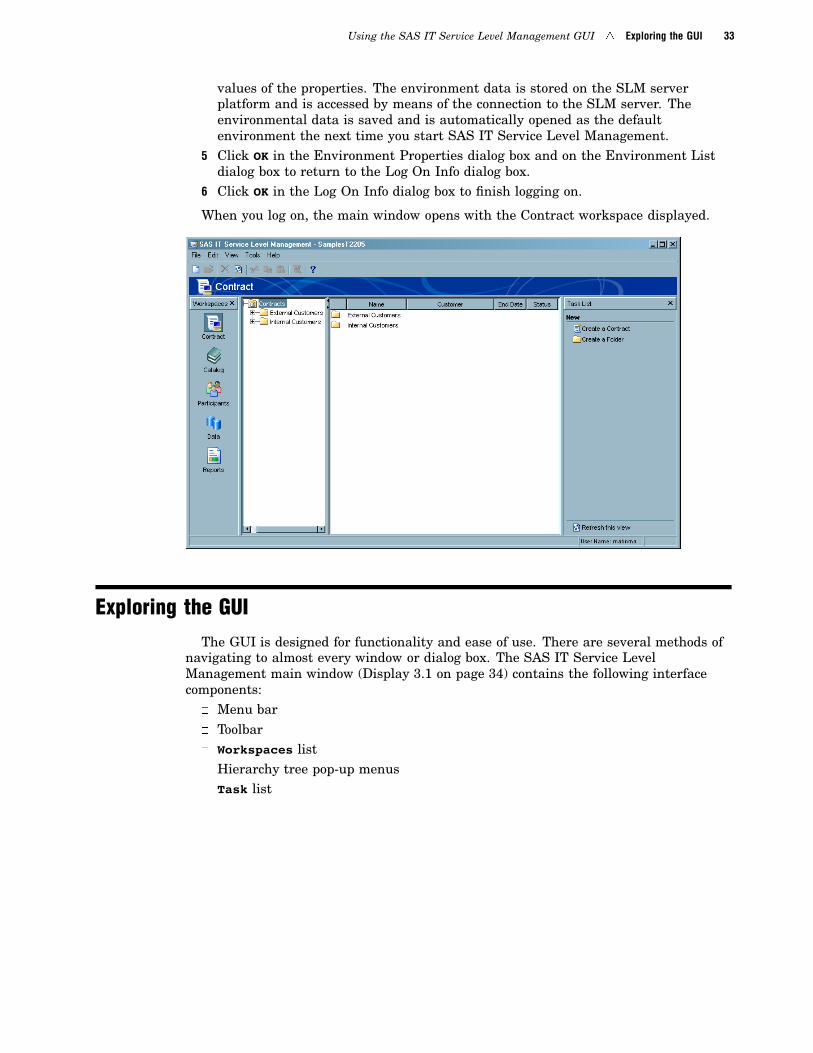
6 Click OK in the Log On Info dialog box to finish logging on.
When you log on, the main window opens with the Contract workspace displayed.
Exploring the GUIThe GUI is designed for functionality and ease of use. There are several methods of
navigating to almost every window or dialog box. The SAS IT Service LevelManagement main window (Display 3.1 on page 34) contains the following interfacecomponents:
� Menu bar� Toolbar� Workspaces list� Hierarchy tree pop-up menus� Task list
34 Navigation � Chapter 3
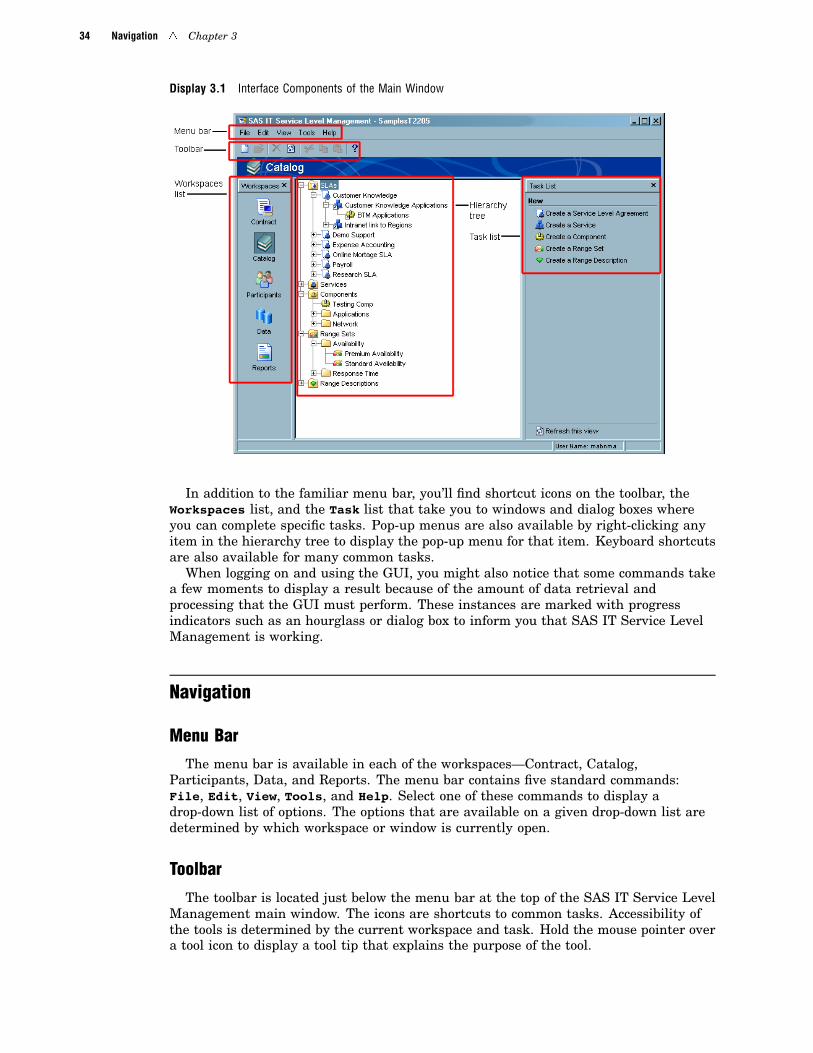
Display 3.1 Interface Components of the Main Window
In addition to the familiar menu bar, you’ll find shortcut icons on the toolbar, theWorkspaces list, and the Task list that take you to windows and dialog boxes whereyou can complete specific tasks. Pop-up menus are also available by right-clicking anyitem in the hierarchy tree to display the pop-up menu for that item. Keyboard shortcutsare also available for many common tasks.
When logging on and using the GUI, you might also notice that some commands takea few moments to display a result because of the amount of data retrieval andprocessing that the GUI must perform. These instances are marked with progressindicators such as an hourglass or dialog box to inform you that SAS IT Service LevelManagement is working.
Navigation
Menu Bar
The menu bar is available in each of the workspaces—Contract, Catalog,Participants, Data, and Reports. The menu bar contains five standard commands:File, Edit, View, Tools, and Help. Select one of these commands to display adrop-down list of options. The options that are available on a given drop-down list aredetermined by which workspace or window is currently open.
Toolbar
The toolbar is located just below the menu bar at the top of the SAS IT Service LevelManagement main window. The icons are shortcuts to common tasks. Accessibility ofthe tools is determined by the current workspace and task. Hold the mouse pointer overa tool icon to display a tool tip that explains the purpose of the tool.
Using the SAS IT Service Level Management GUI � Workspaces 35
Workspaces ListOn the left side of each of the main SAS IT Service Level Management workspaces,
you will find a vertical Workspaces list. Each of the icons on this list is a shortcut toone of the five main workspaces.
Hierarchy Tree Pop-up MenusMany functions can also be accessed by using pop-up menus. When you select a
workspace to display, you’ll see a hierarchy tree. You can right-click an item on the treeto display a pop-up menu. The pop-up menu provides quick and easy access to commontasks for the selected item.
Task ListThe Task list is another easy way to access common tasks quickly and easily. Each
workspace displays a list of the tasks that can be accomplished within that workspace.
TabsNavigation tabs appear on the dialog boxes that open after you select a task from a
workspace. Each dialog box contains a unique set of tabs. For example, the Componentdialog box displays the following tabs: General, Date Filter, Objectives, Data,History, and Notes. By entering information in the fields on these tabs, you completethe task of creating a component.
WorkspacesSAS IT Service Level Management simplifies the creation and maintenance of
contracts by providing five main workspaces—Contract, Catalog, Participants, Data,and Reports. These workspaces represent collections of dialog boxes where the tasks ofcreating, modifying, deleting, and reporting on the building blocks of contracts takeplace.
Contract Workspace
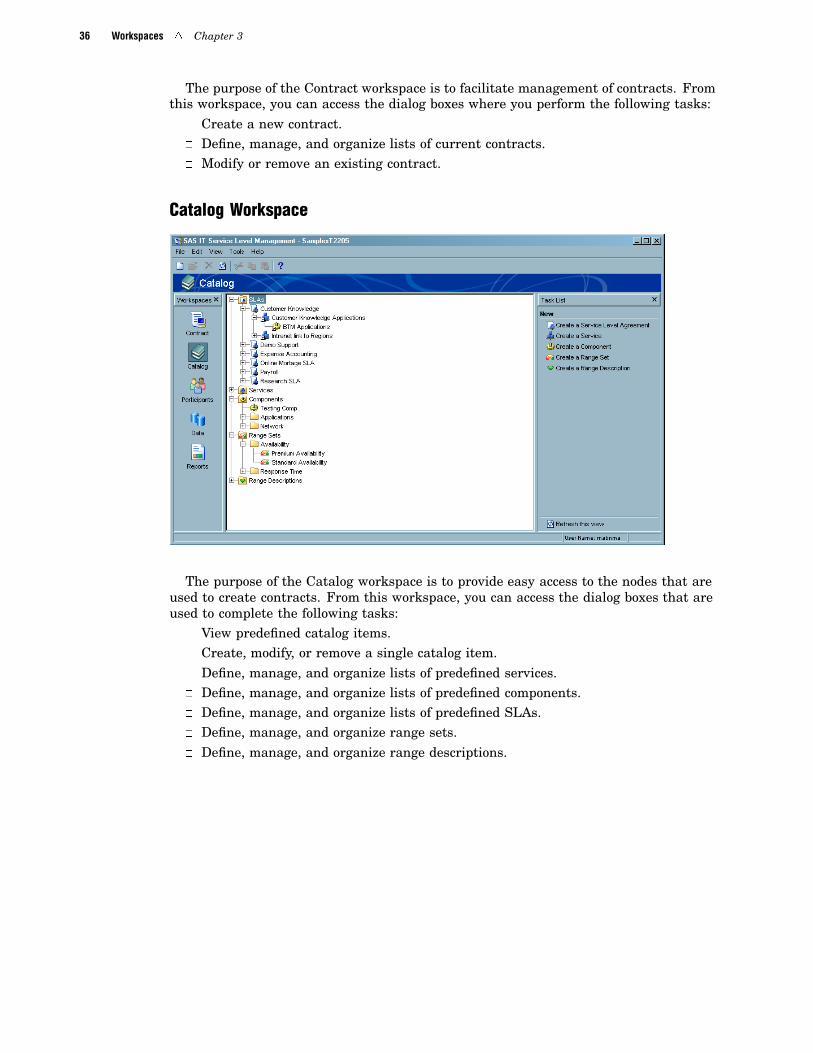
36 Workspaces � Chapter 3
The purpose of the Contract workspace is to facilitate management of contracts. Fromthis workspace, you can access the dialog boxes where you perform the following tasks:
� Create a new contract.� Define, manage, and organize lists of current contracts.� Modify or remove an existing contract.
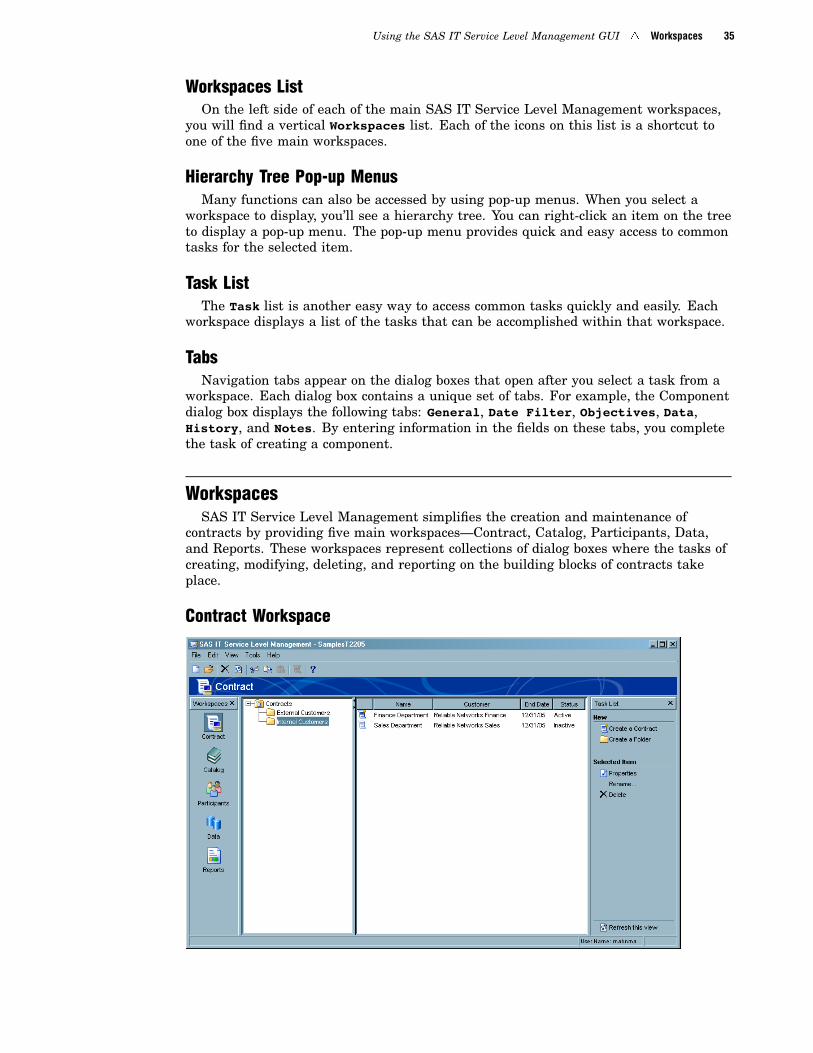
Catalog Workspace
The purpose of the Catalog workspace is to provide easy access to the nodes that areused to create contracts. From this workspace, you can access the dialog boxes that areused to complete the following tasks:
� View predefined catalog items.� Create, modify, or remove a single catalog item.� Define, manage, and organize lists of predefined services.� Define, manage, and organize lists of predefined components.� Define, manage, and organize lists of predefined SLAs.� Define, manage, and organize range sets.� Define, manage, and organize range descriptions.
Using the SAS IT Service Level Management GUI � Workspaces 37
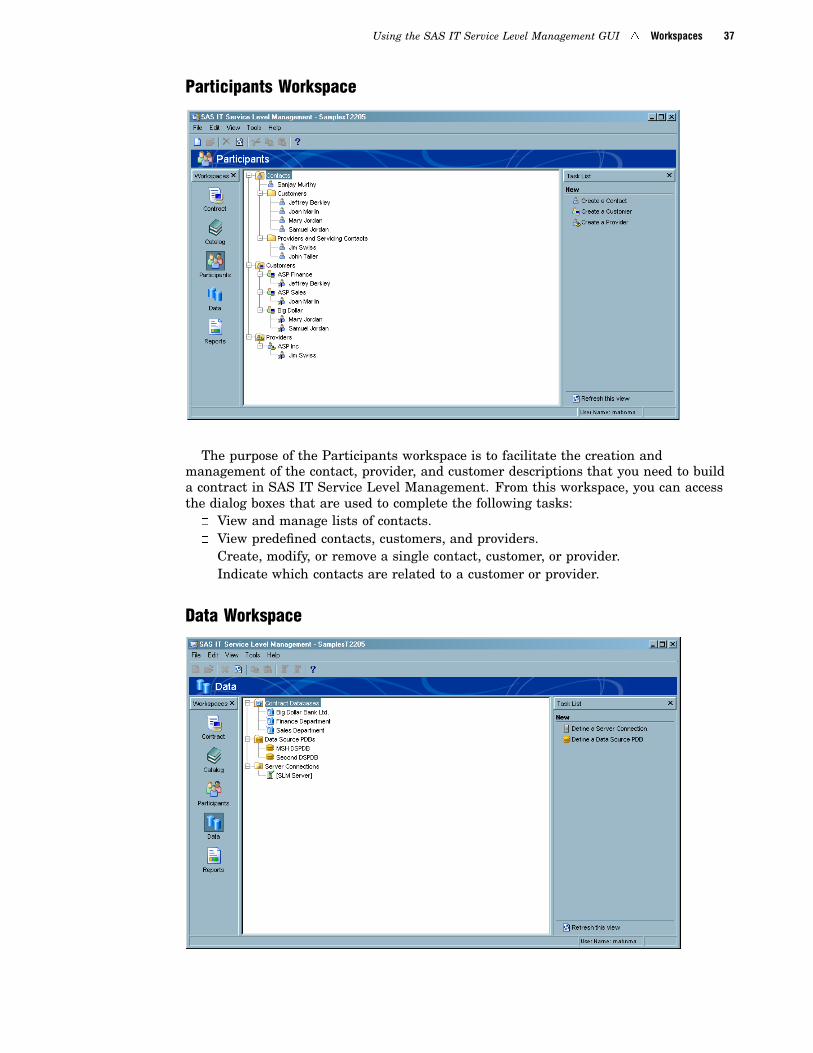
Participants Workspace
The purpose of the Participants workspace is to facilitate the creation andmanagement of the contact, provider, and customer descriptions that you need to builda contract in SAS IT Service Level Management. From this workspace, you can accessthe dialog boxes that are used to complete the following tasks:
� View and manage lists of contacts.� View predefined contacts, customers, and providers.� Create, modify, or remove a single contact, customer, or provider.� Indicate which contacts are related to a customer or provider.
Data Workspace
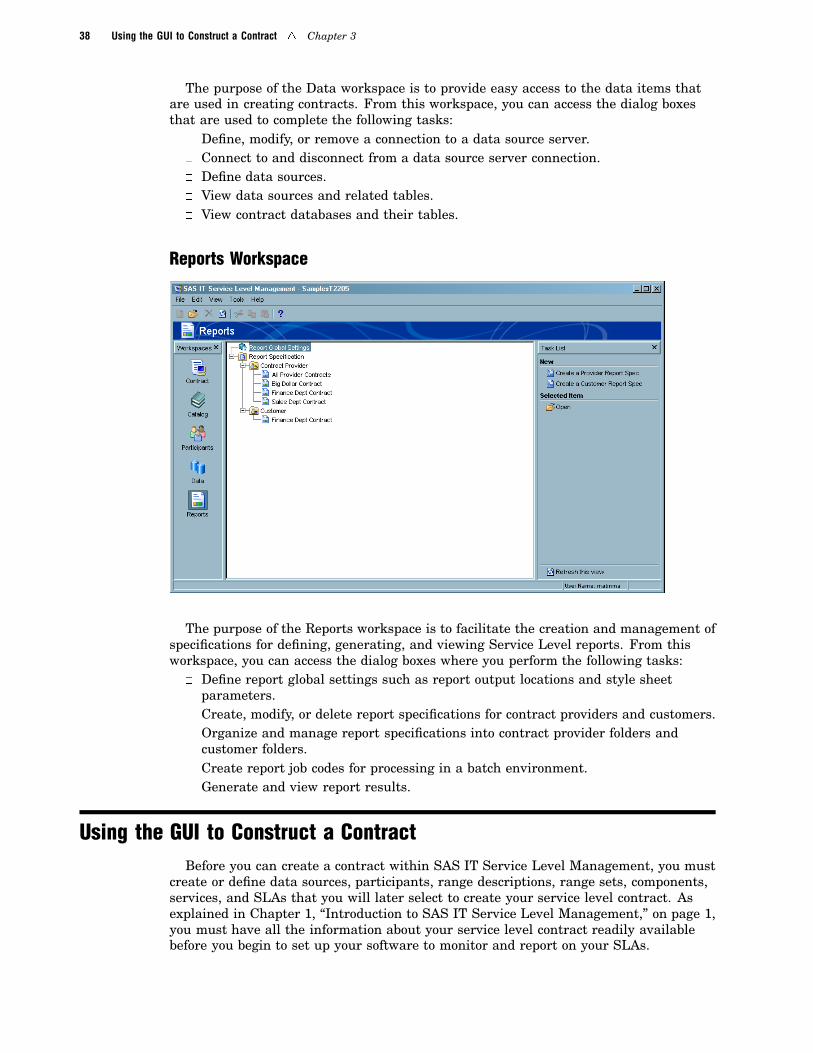
38 Using the GUI to Construct a Contract � Chapter 3
The purpose of the Data workspace is to provide easy access to the data items thatare used in creating contracts. From this workspace, you can access the dialog boxesthat are used to complete the following tasks:
� Define, modify, or remove a connection to a data source server.� Connect to and disconnect from a data source server connection.� Define data sources.� View data sources and related tables.� View contract databases and their tables.
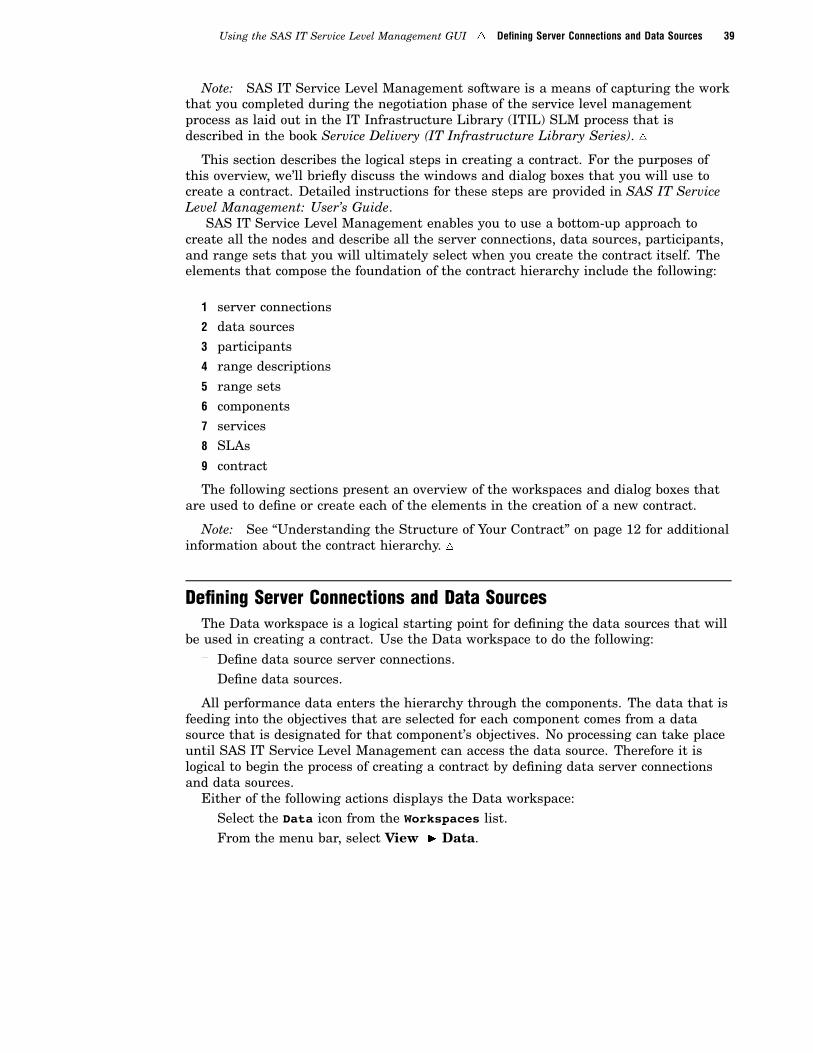
Reports Workspace
The purpose of the Reports workspace is to facilitate the creation and management ofspecifications for defining, generating, and viewing Service Level reports. From thisworkspace, you can access the dialog boxes where you perform the following tasks:
� Define report global settings such as report output locations and style sheetparameters.
� Create, modify, or delete report specifications for contract providers and customers.� Organize and manage report specifications into contract provider folders and
customer folders.� Create report job codes for processing in a batch environment.� Generate and view report results.
Using the GUI to Construct a ContractBefore you can create a contract within SAS IT Service Level Management, you must
create or define data sources, participants, range descriptions, range sets, components,services, and SLAs that you will later select to create your service level contract. Asexplained in Chapter 1, “Introduction to SAS IT Service Level Management,” on page 1,you must have all the information about your service level contract readily availablebefore you begin to set up your software to monitor and report on your SLAs.
Using the SAS IT Service Level Management GUI � Defining Server Connections and Data Sources 39
Note: SAS IT Service Level Management software is a means of capturing the workthat you completed during the negotiation phase of the service level managementprocess as laid out in the IT Infrastructure Library (ITIL) SLM process that isdescribed in the book Service Delivery (IT Infrastructure Library Series). �
This section describes the logical steps in creating a contract. For the purposes ofthis overview, we’ll briefly discuss the windows and dialog boxes that you will use tocreate a contract. Detailed instructions for these steps are provided in SAS IT ServiceLevel Management: User’s Guide.
SAS IT Service Level Management enables you to use a bottom-up approach tocreate all the nodes and describe all the server connections, data sources, participants,and range sets that you will ultimately select when you create the contract itself. Theelements that compose the foundation of the contract hierarchy include the following:
1 server connections2 data sources3 participants4 range descriptions5 range sets6 components7 services8 SLAs9 contract
The following sections present an overview of the workspaces and dialog boxes thatare used to define or create each of the elements in the creation of a new contract.
Note: See “Understanding the Structure of Your Contract” on page 12 for additionalinformation about the contract hierarchy. �
Defining Server Connections and Data SourcesThe Data workspace is a logical starting point for defining the data sources that will
be used in creating a contract. Use the Data workspace to do the following:� Define data source server connections.� Define data sources.
All performance data enters the hierarchy through the components. The data that isfeeding into the objectives that are selected for each component comes from a datasource that is designated for that component’s objectives. No processing can take placeuntil SAS IT Service Level Management can access the data source. Therefore it islogical to begin the process of creating a contract by defining data server connectionsand data sources.
Either of the following actions displays the Data workspace:� Select the Data icon from the Workspaces list.� From the menu bar, select View � Data.
40 Defining Server Connections and Data Sources � Chapter 3
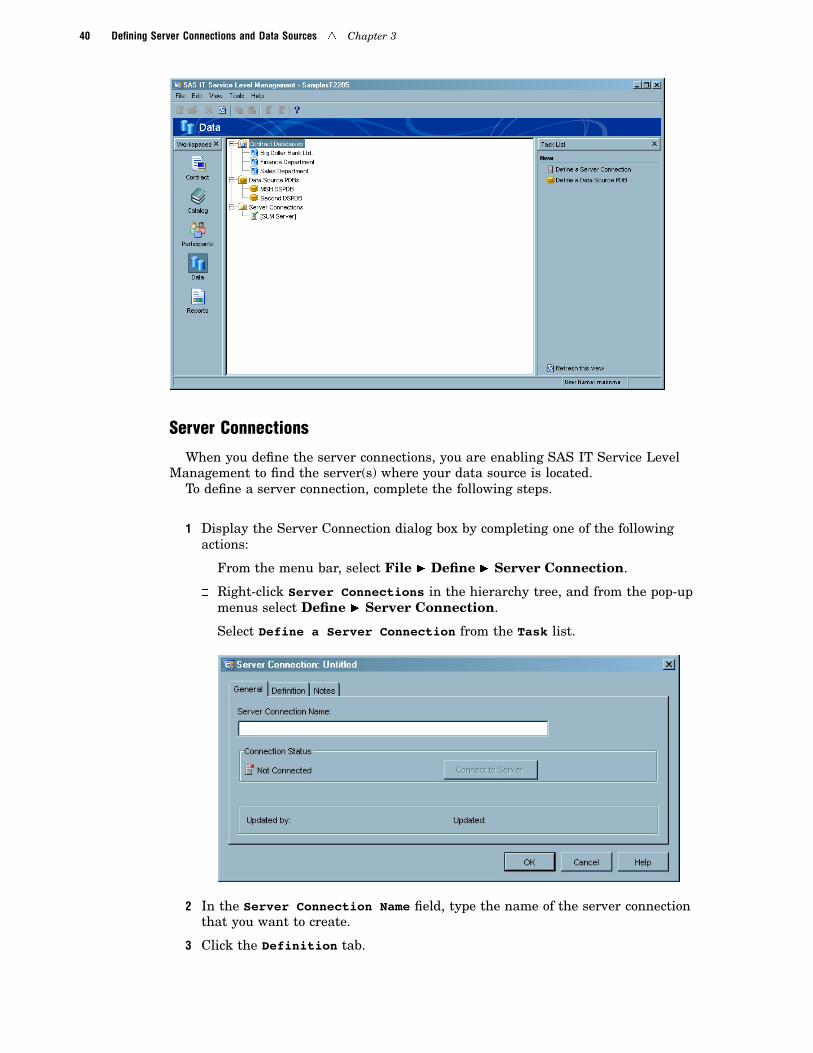
Server Connections
When you define the server connections, you are enabling SAS IT Service LevelManagement to find the server(s) where your data source is located.
To define a server connection, complete the following steps.
1 Display the Server Connection dialog box by completing one of the followingactions:
� From the menu bar, select File � Define � Server Connection.
� Right-click Server Connections in the hierarchy tree, and from the pop-upmenus select Define � Server Connection.
� Select Define a Server Connection from the Task list.
2 In the Server Connection Name field, type the name of the server connectionthat you want to create.
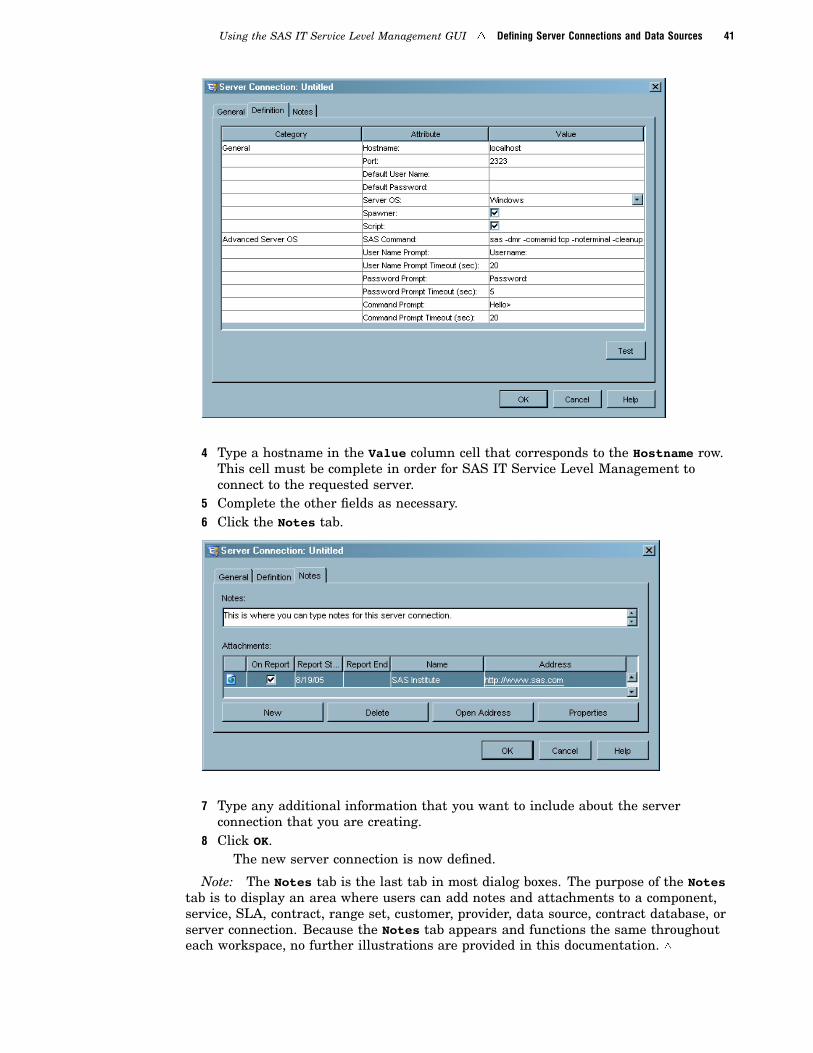
3 Click the Definition tab.
Using the SAS IT Service Level Management GUI � Defining Server Connections and Data Sources 41
4 Type a hostname in the Value column cell that corresponds to the Hostname row.This cell must be complete in order for SAS IT Service Level Management toconnect to the requested server.
5 Complete the other fields as necessary.6 Click the Notes tab.
7 Type any additional information that you want to include about the serverconnection that you are creating.
8 Click OK.The new server connection is now defined.
Note: The Notes tab is the last tab in most dialog boxes. The purpose of the Notestab is to display an area where users can add notes and attachments to a component,service, SLA, contract, range set, customer, provider, data source, contract database, orserver connection. Because the Notes tab appears and functions the same throughouteach workspace, no further illustrations are provided in this documentation. �
42 Adding Participants � Chapter 3
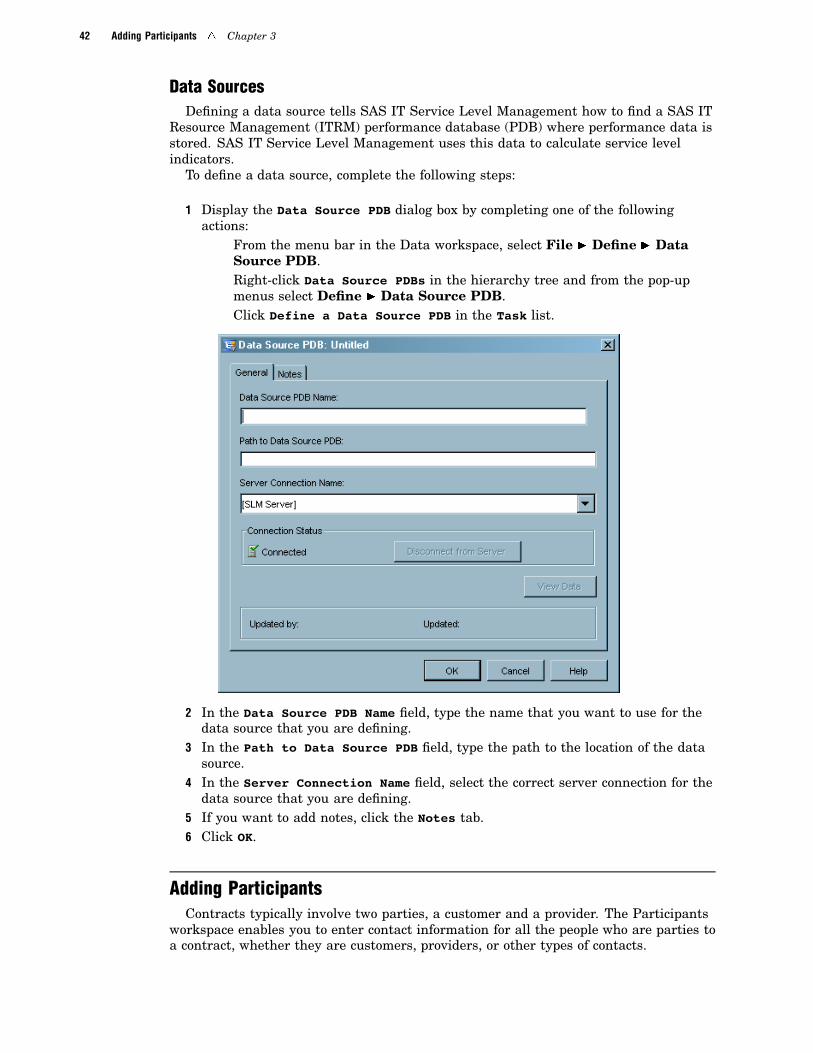
Data SourcesDefining a data source tells SAS IT Service Level Management how to find a SAS IT
Resource Management (ITRM) performance database (PDB) where performance data isstored. SAS IT Service Level Management uses this data to calculate service levelindicators.
To define a data source, complete the following steps:
1 Display the Data Source PDB dialog box by completing one of the followingactions:
� From the menu bar in the Data workspace, select File � Define � DataSource PDB.
� Right-click Data Source PDBs in the hierarchy tree and from the pop-upmenus select Define � Data Source PDB.
� Click Define a Data Source PDB in the Task list.
2 In the Data Source PDB Name field, type the name that you want to use for thedata source that you are defining.
3 In the Path to Data Source PDB field, type the path to the location of the datasource.
4 In the Server Connection Name field, select the correct server connection for thedata source that you are defining.
5 If you want to add notes, click the Notes tab.6 Click OK.
Adding ParticipantsContracts typically involve two parties, a customer and a provider. The Participants
workspace enables you to enter contact information for all the people who are parties toa contract, whether they are customers, providers, or other types of contacts.
Using the SAS IT Service Level Management GUI � Adding Participants 43
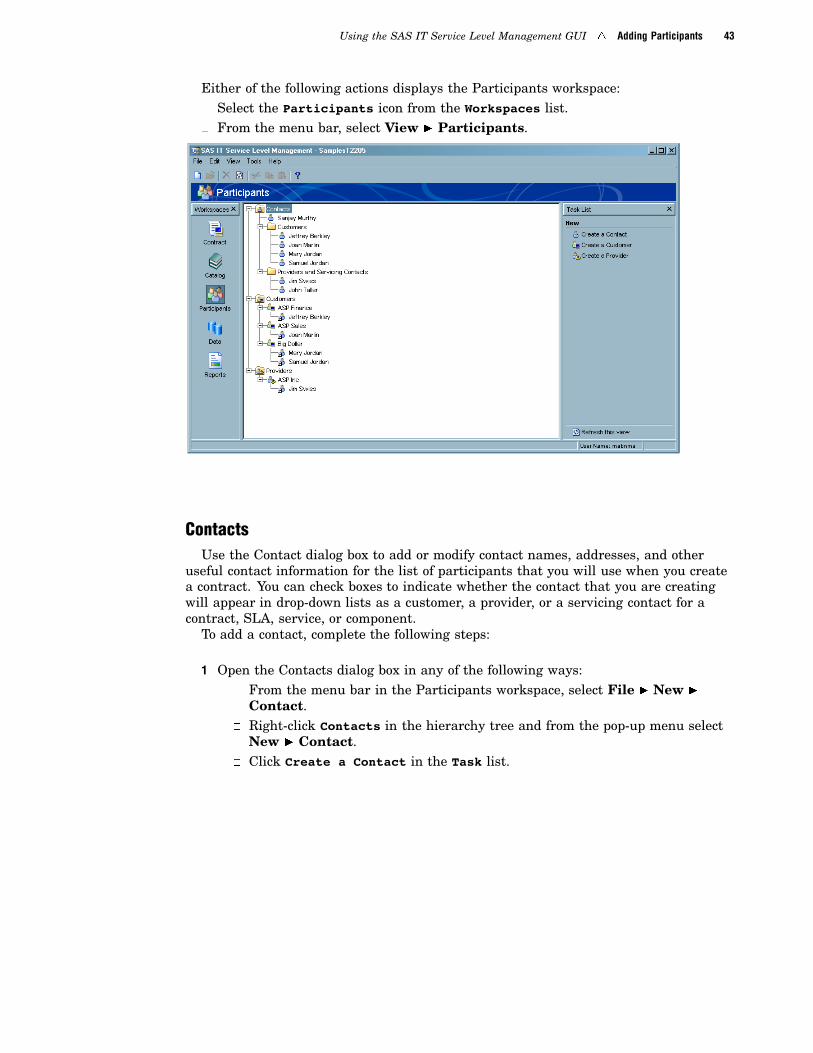
Either of the following actions displays the Participants workspace:� Select the Participants icon from the Workspaces list.� From the menu bar, select View � Participants.
ContactsUse the Contact dialog box to add or modify contact names, addresses, and other
useful contact information for the list of participants that you will use when you createa contract. You can check boxes to indicate whether the contact that you are creatingwill appear in drop-down lists as a customer, a provider, or a servicing contact for acontract, SLA, service, or component.
To add a contact, complete the following steps:
1 Open the Contacts dialog box in any of the following ways:� From the menu bar in the Participants workspace, select File � New �
Contact.� Right-click Contacts in the hierarchy tree and from the pop-up menu select
New � Contact.� Click Create a Contact in the Task list.
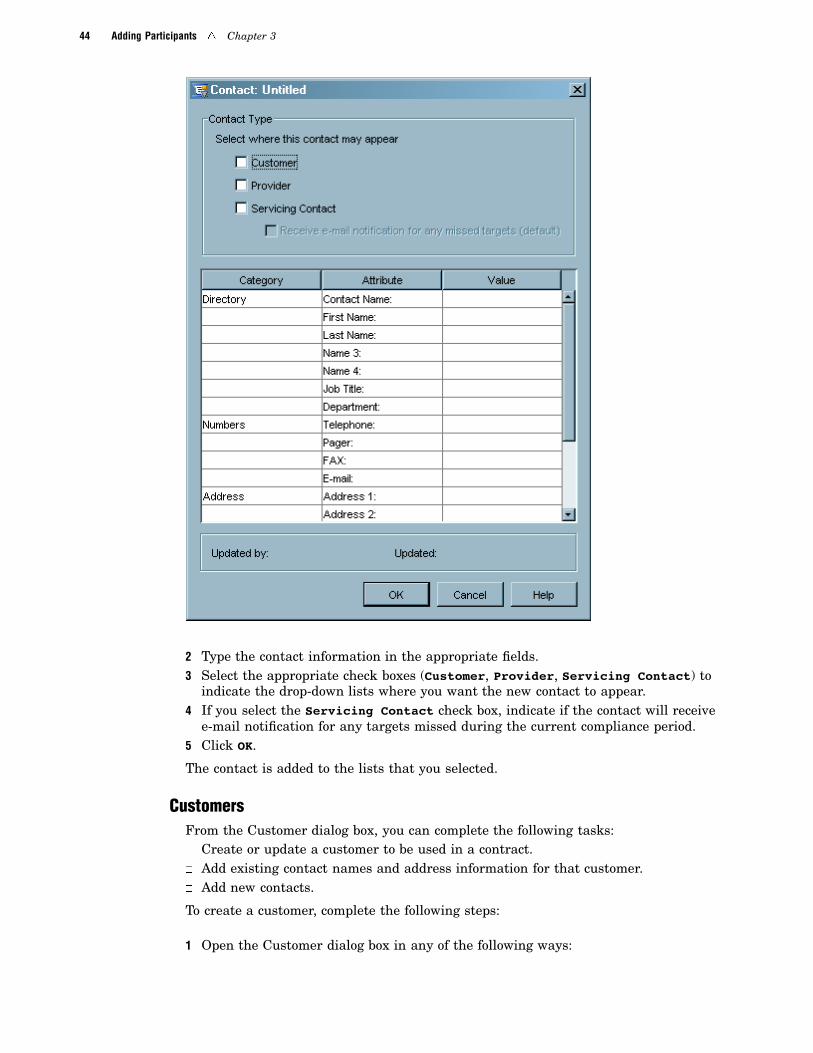
44 Adding Participants � Chapter 3
2 Type the contact information in the appropriate fields.3 Select the appropriate check boxes (Customer, Provider, Servicing Contact) to
indicate the drop-down lists where you want the new contact to appear.4 If you select the Servicing Contact check box, indicate if the contact will receive
e-mail notification for any targets missed during the current compliance period.5 Click OK.
The contact is added to the lists that you selected.
CustomersFrom the Customer dialog box, you can complete the following tasks:� Create or update a customer to be used in a contract.� Add existing contact names and address information for that customer.� Add new contacts.
To create a customer, complete the following steps:
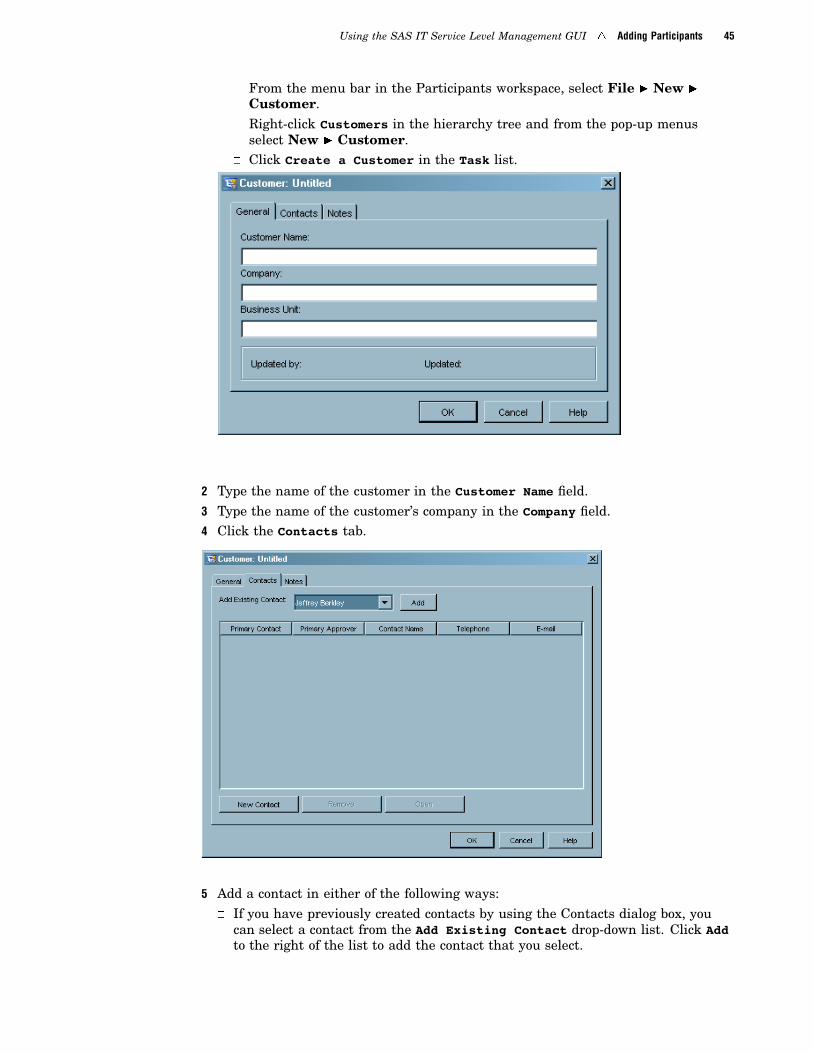
1 Open the Customer dialog box in any of the following ways:
Using the SAS IT Service Level Management GUI � Adding Participants 45
� From the menu bar in the Participants workspace, select File � New �
Customer.� Right-click Customers in the hierarchy tree and from the pop-up menus
select New � Customer.� Click Create a Customer in the Task list.
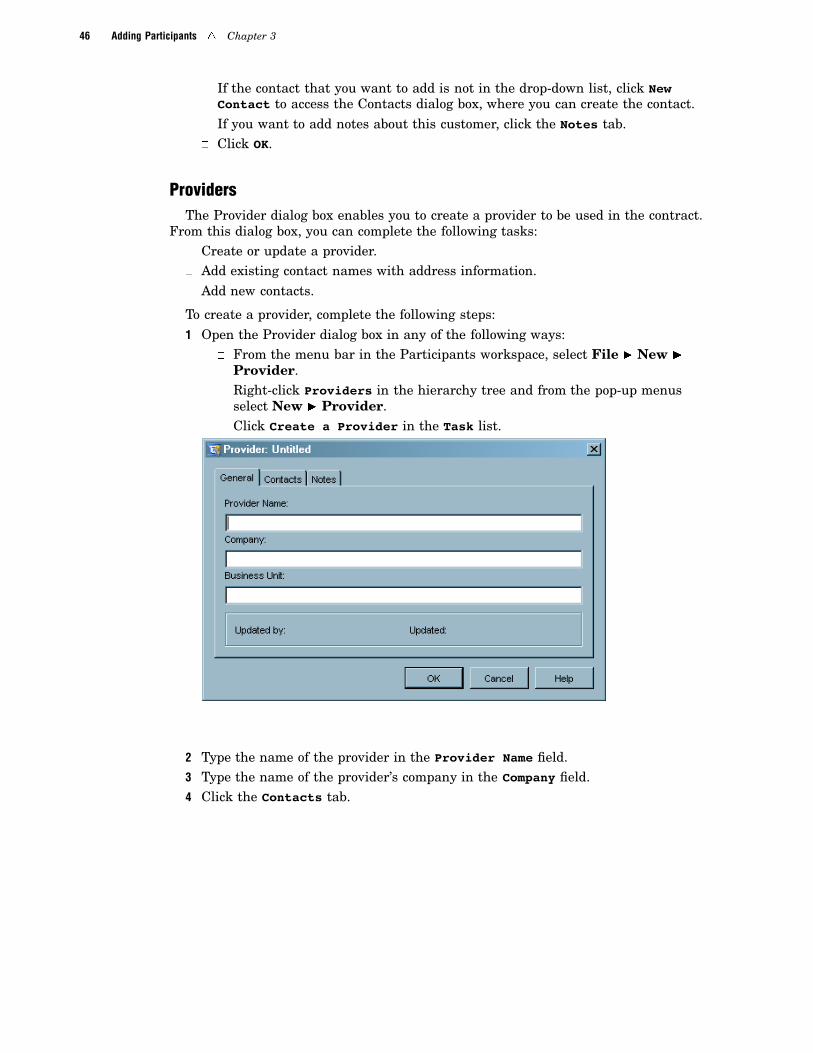
2 Type the name of the customer in the Customer Name field.3 Type the name of the customer’s company in the Company field.4 Click the Contacts tab.
5 Add a contact in either of the following ways:� If you have previously created contacts by using the Contacts dialog box, you
can select a contact from the Add Existing Contact drop-down list. Click Addto the right of the list to add the contact that you select.
46 Adding Participants � Chapter 3
� If the contact that you want to add is not in the drop-down list, click NewContact to access the Contacts dialog box, where you can create the contact.
� If you want to add notes about this customer, click the Notes tab.� Click OK.
ProvidersThe Provider dialog box enables you to create a provider to be used in the contract.
From this dialog box, you can complete the following tasks:� Create or update a provider.� Add existing contact names with address information.� Add new contacts.
To create a provider, complete the following steps:1 Open the Provider dialog box in any of the following ways:
� From the menu bar in the Participants workspace, select File � New �
Provider.� Right-click Providers in the hierarchy tree and from the pop-up menus
select New � Provider.� Click Create a Provider in the Task list.
2 Type the name of the provider in the Provider Name field.3 Type the name of the provider’s company in the Company field.4 Click the Contacts tab.
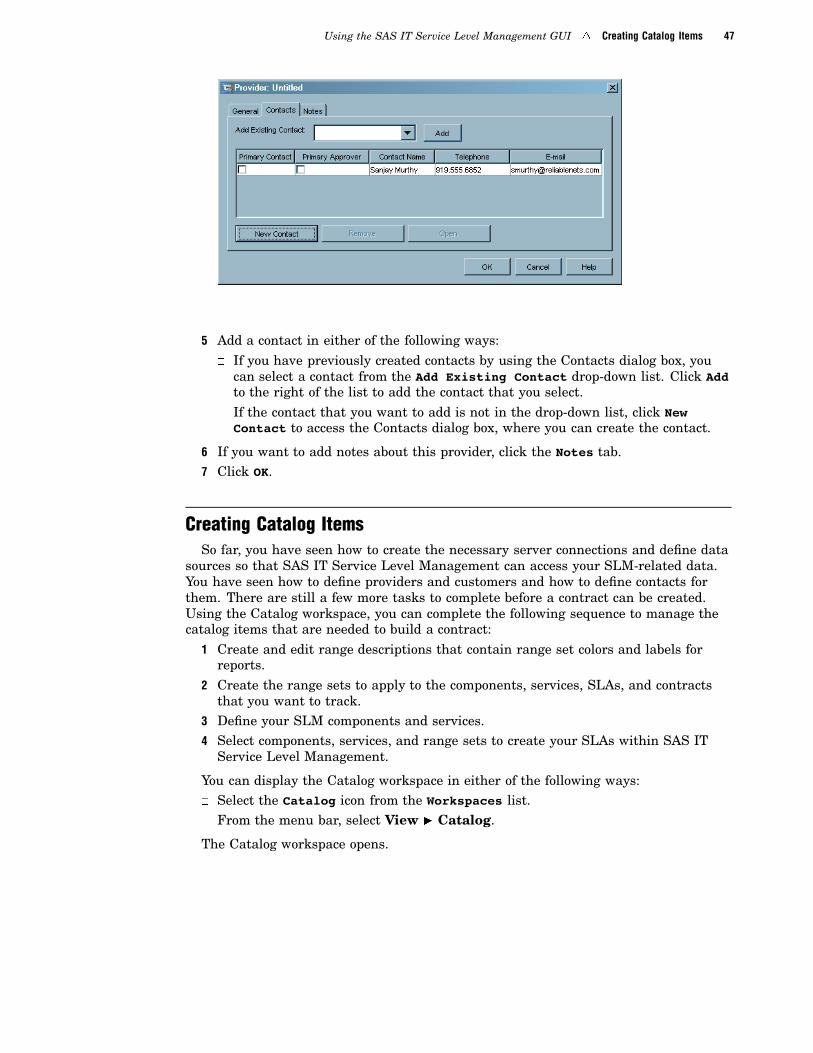
Using the SAS IT Service Level Management GUI � Creating Catalog Items 47
5 Add a contact in either of the following ways:� If you have previously created contacts by using the Contacts dialog box, you
can select a contact from the Add Existing Contact drop-down list. Click Addto the right of the list to add the contact that you select.
� If the contact that you want to add is not in the drop-down list, click NewContact to access the Contacts dialog box, where you can create the contact.
6 If you want to add notes about this provider, click the Notes tab.7 Click OK.
Creating Catalog ItemsSo far, you have seen how to create the necessary server connections and define data
sources so that SAS IT Service Level Management can access your SLM-related data.You have seen how to define providers and customers and how to define contacts forthem. There are still a few more tasks to complete before a contract can be created.Using the Catalog workspace, you can complete the following sequence to manage thecatalog items that are needed to build a contract:
1 Create and edit range descriptions that contain range set colors and labels forreports.
2 Create the range sets to apply to the components, services, SLAs, and contractsthat you want to track.
3 Define your SLM components and services.4 Select components, services, and range sets to create your SLAs within SAS IT
Service Level Management.
You can display the Catalog workspace in either of the following ways:� Select the Catalog icon from the Workspaces list.� From the menu bar, select View � Catalog.
The Catalog workspace opens.
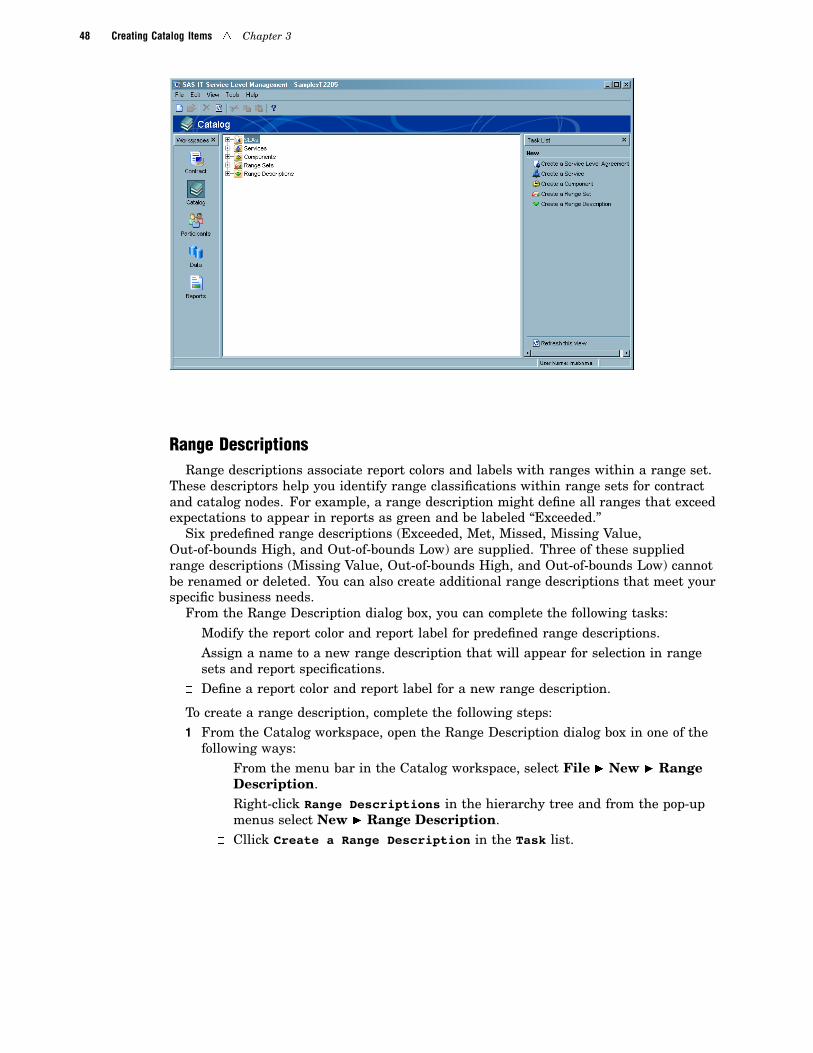
48 Creating Catalog Items � Chapter 3
Range DescriptionsRange descriptions associate report colors and labels with ranges within a range set.
These descriptors help you identify range classifications within range sets for contractand catalog nodes. For example, a range description might define all ranges that exceedexpectations to appear in reports as green and be labeled “Exceeded.”
Six predefined range descriptions (Exceeded, Met, Missed, Missing Value,Out-of-bounds High, and Out-of-bounds Low) are supplied. Three of these suppliedrange descriptions (Missing Value, Out-of-bounds High, and Out-of-bounds Low) cannotbe renamed or deleted. You can also create additional range descriptions that meet yourspecific business needs.
From the Range Description dialog box, you can complete the following tasks:� Modify the report color and report label for predefined range descriptions.� Assign a name to a new range description that will appear for selection in range
sets and report specifications.� Define a report color and report label for a new range description.
To create a range description, complete the following steps:1 From the Catalog workspace, open the Range Description dialog box in one of the
following ways:� From the menu bar in the Catalog workspace, select File � New � Range
Description.� Right-click Range Descriptions in the hierarchy tree and from the pop-up
menus select New � Range Description.� Cllick Create a Range Description in the Task list.
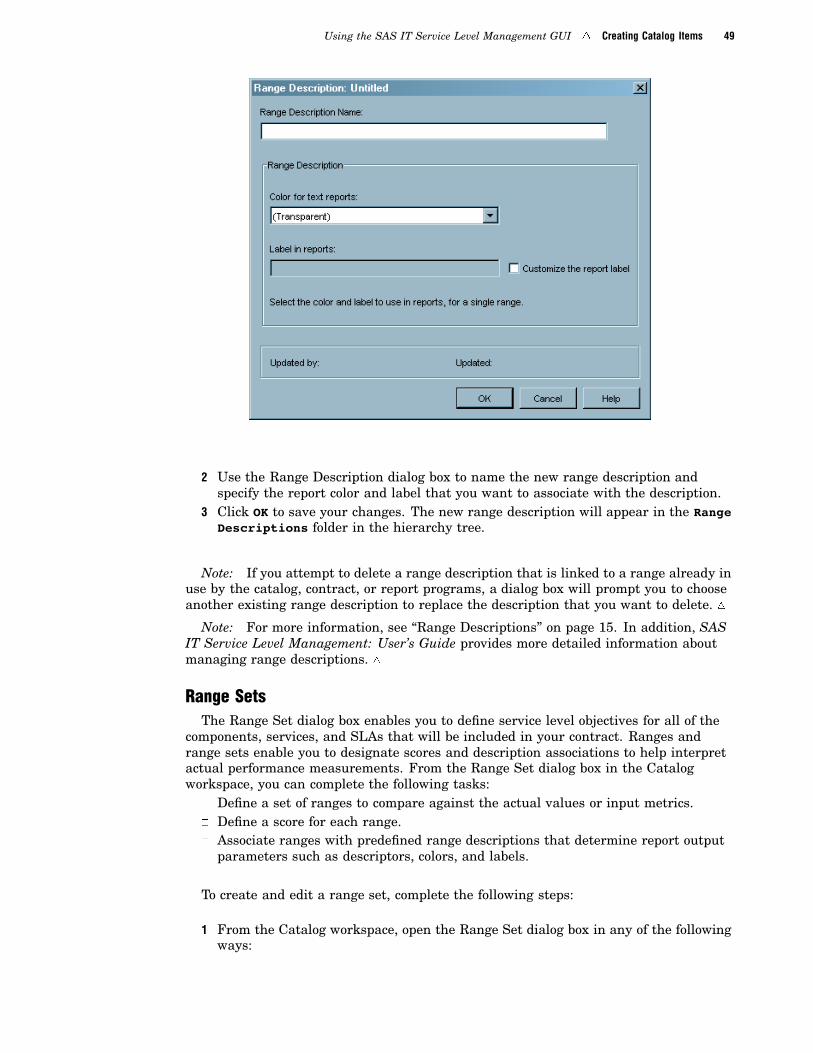
Using the SAS IT Service Level Management GUI � Creating Catalog Items 49
2 Use the Range Description dialog box to name the new range description andspecify the report color and label that you want to associate with the description.
3 Click OK to save your changes. The new range description will appear in the RangeDescriptions folder in the hierarchy tree.
Note: If you attempt to delete a range description that is linked to a range already inuse by the catalog, contract, or report programs, a dialog box will prompt you to chooseanother existing range description to replace the description that you want to delete. �
Note: For more information, see “Range Descriptions” on page 15. In addition, SASIT Service Level Management: User’s Guide provides more detailed information aboutmanaging range descriptions. �
Range SetsThe Range Set dialog box enables you to define service level objectives for all of the
components, services, and SLAs that will be included in your contract. Ranges andrange sets enable you to designate scores and description associations to help interpretactual performance measurements. From the Range Set dialog box in the Catalogworkspace, you can complete the following tasks:
� Define a set of ranges to compare against the actual values or input metrics.� Define a score for each range.� Associate ranges with predefined range descriptions that determine report output
parameters such as descriptors, colors, and labels.
To create and edit a range set, complete the following steps:
1 From the Catalog workspace, open the Range Set dialog box in any of the followingways:
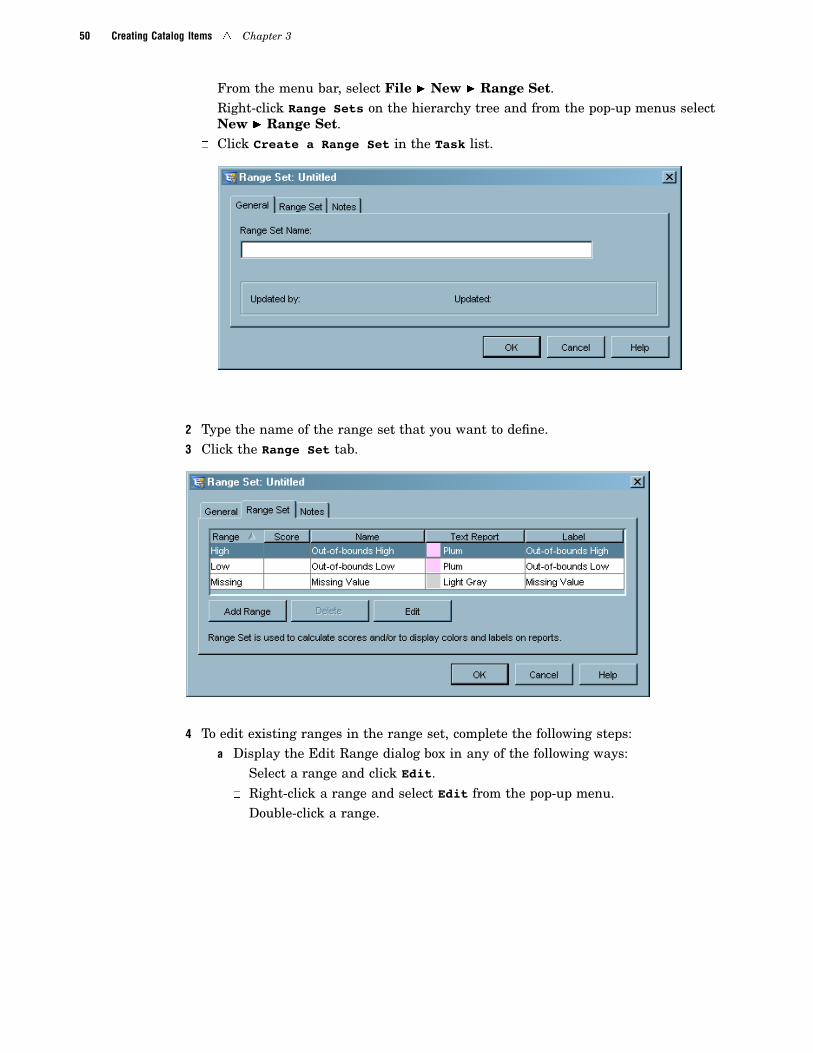
50 Creating Catalog Items � Chapter 3
� From the menu bar, select File � New � Range Set.� Right-click Range Sets on the hierarchy tree and from the pop-up menus select
New � Range Set.� Click Create a Range Set in the Task list.
2 Type the name of the range set that you want to define.3 Click the Range Set tab.
4 To edit existing ranges in the range set, complete the following steps:a Display the Edit Range dialog box in any of the following ways:
� Select a range and click Edit.� Right-click a range and select Edit from the pop-up menu.� Double-click a range.
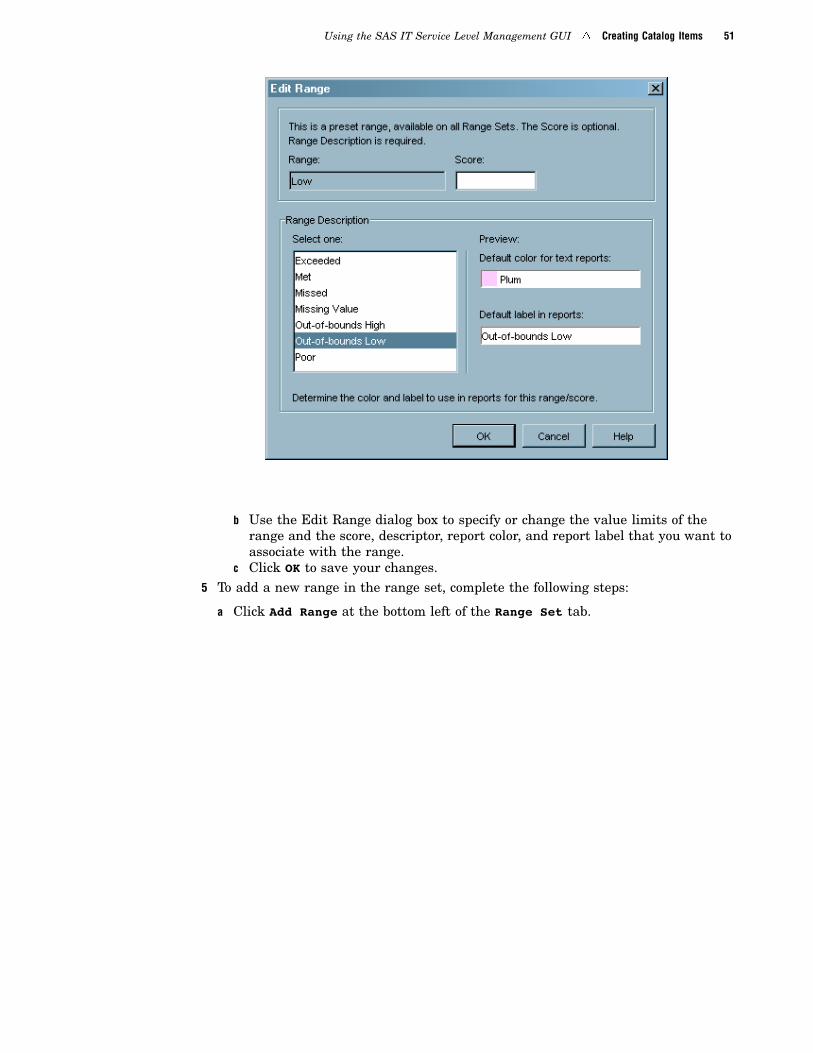
Using the SAS IT Service Level Management GUI � Creating Catalog Items 51
b Use the Edit Range dialog box to specify or change the value limits of therange and the score, descriptor, report color, and report label that you want toassociate with the range.
c Click OK to save your changes.5 To add a new range in the range set, complete the following steps:
a Click Add Range at the bottom left of the Range Set tab.
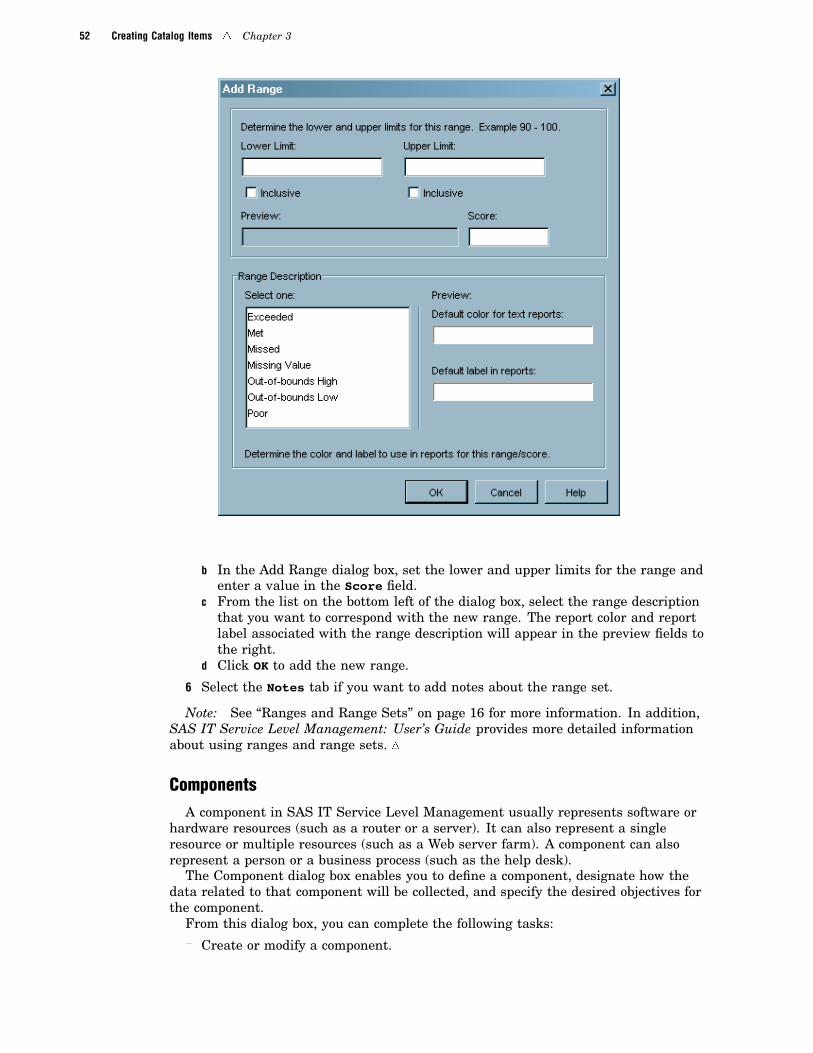
52 Creating Catalog Items � Chapter 3
b In the Add Range dialog box, set the lower and upper limits for the range andenter a value in the Score field.
c From the list on the bottom left of the dialog box, select the range descriptionthat you want to correspond with the new range. The report color and reportlabel associated with the range description will appear in the preview fields tothe right.
d Click OK to add the new range.
6 Select the Notes tab if you want to add notes about the range set.
Note: See “Ranges and Range Sets” on page 16 for more information. In addition,SAS IT Service Level Management: User’s Guide provides more detailed informationabout using ranges and range sets. �
ComponentsA component in SAS IT Service Level Management usually represents software or
hardware resources (such as a router or a server). It can also represent a singleresource or multiple resources (such as a Web server farm). A component can alsorepresent a person or a business process (such as the help desk).
The Component dialog box enables you to define a component, designate how thedata related to that component will be collected, and specify the desired objectives forthe component.
From this dialog box, you can complete the following tasks:
� Create or modify a component.
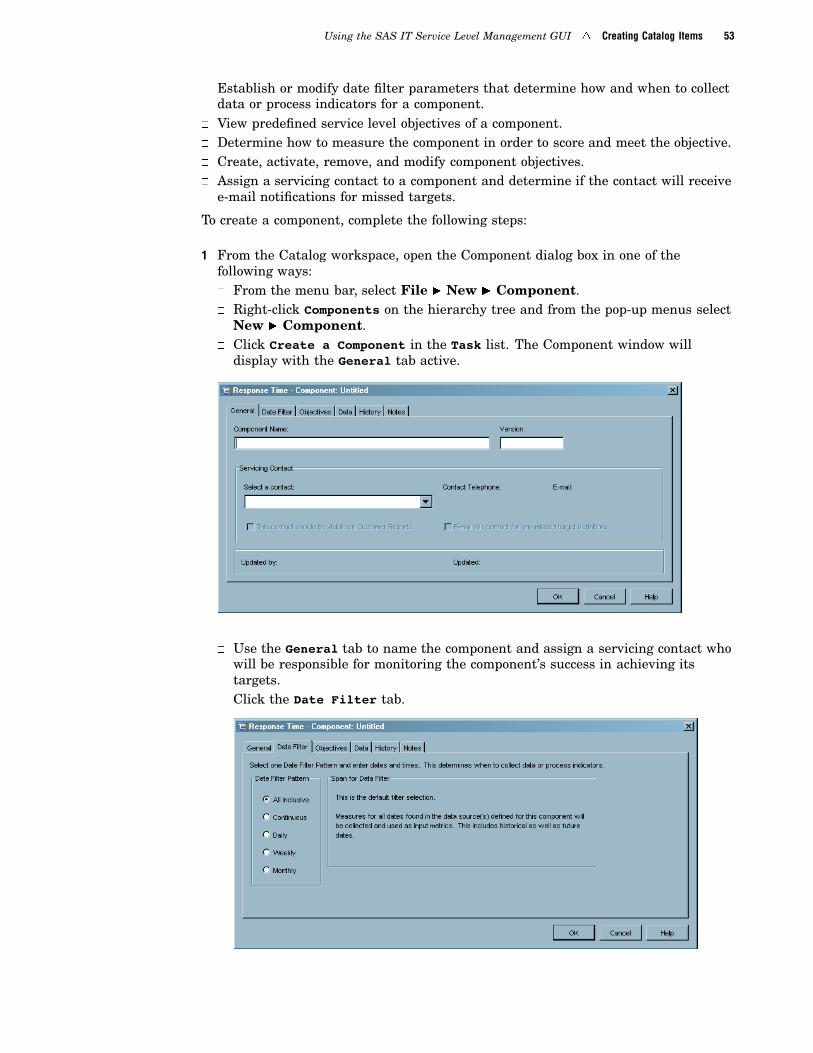
Using the SAS IT Service Level Management GUI � Creating Catalog Items 53
� Establish or modify date filter parameters that determine how and when to collectdata or process indicators for a component.
� View predefined service level objectives of a component.� Determine how to measure the component in order to score and meet the objective.� Create, activate, remove, and modify component objectives.� Assign a servicing contact to a component and determine if the contact will receive
e-mail notifications for missed targets.
To create a component, complete the following steps:
1 From the Catalog workspace, open the Component dialog box in one of thefollowing ways:� From the menu bar, select File � New � Component.� Right-click Components on the hierarchy tree and from the pop-up menus select
New � Component.� Click Create a Component in the Task list. The Component window will
display with the General tab active.
� Use the General tab to name the component and assign a servicing contact whowill be responsible for monitoring the component’s success in achieving itstargets.
� Click the Date Filter tab.
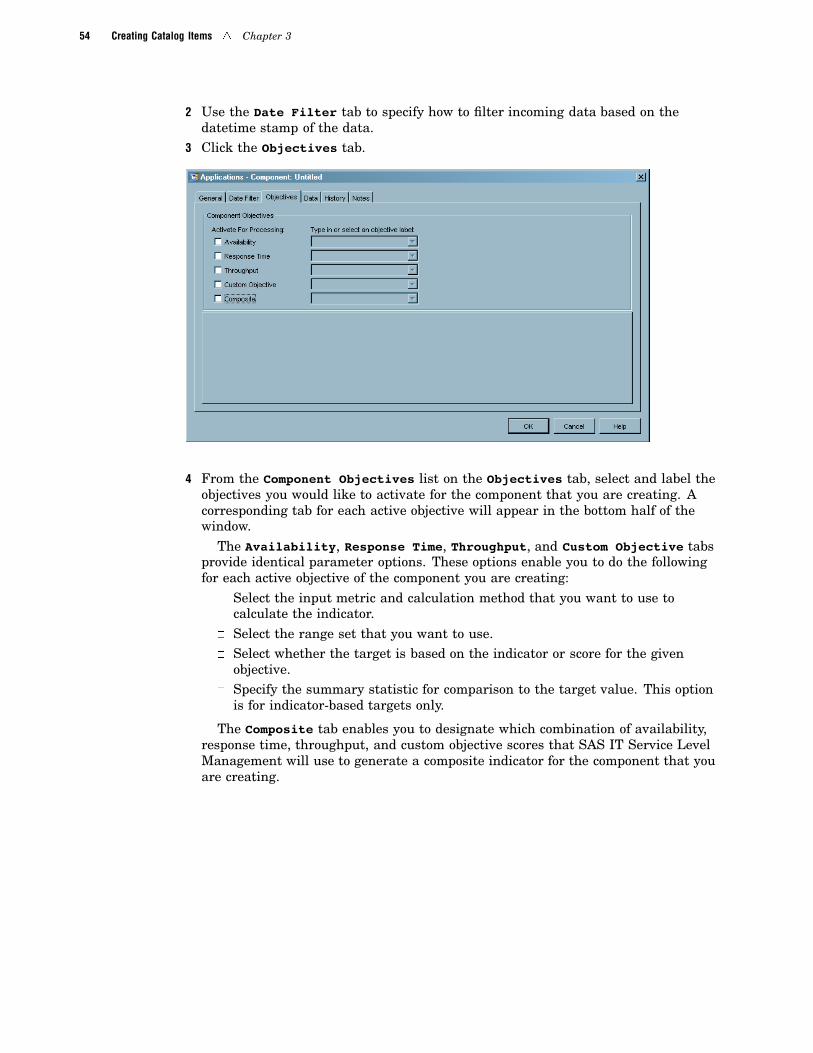
54 Creating Catalog Items � Chapter 3
2 Use the Date Filter tab to specify how to filter incoming data based on thedatetime stamp of the data.
3 Click the Objectives tab.
4 From the Component Objectives list on the Objectives tab, select and label theobjectives you would like to activate for the component that you are creating. Acorresponding tab for each active objective will appear in the bottom half of thewindow.
The Availability, Response Time, Throughput, and Custom Objective tabsprovide identical parameter options. These options enable you to do the followingfor each active objective of the component you are creating:
� Select the input metric and calculation method that you want to use tocalculate the indicator.
� Select the range set that you want to use.� Select whether the target is based on the indicator or score for the given
objective.� Specify the summary statistic for comparison to the target value. This option
is for indicator-based targets only.
The Composite tab enables you to designate which combination of availability,response time, throughput, and custom objective scores that SAS IT Service LevelManagement will use to generate a composite indicator for the component that youare creating.
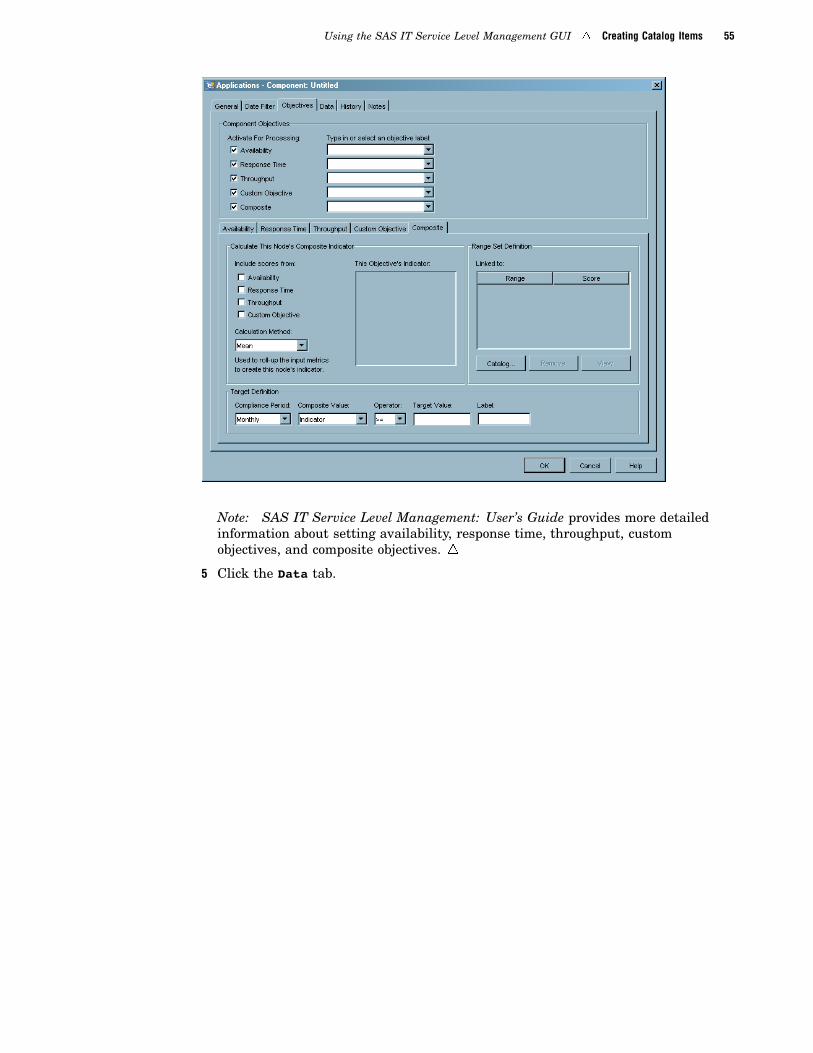
Using the SAS IT Service Level Management GUI � Creating Catalog Items 55
Note: SAS IT Service Level Management: User’s Guide provides more detailedinformation about setting availability, response time, throughput, customobjectives, and composite objectives. �
5 Click the Data tab.
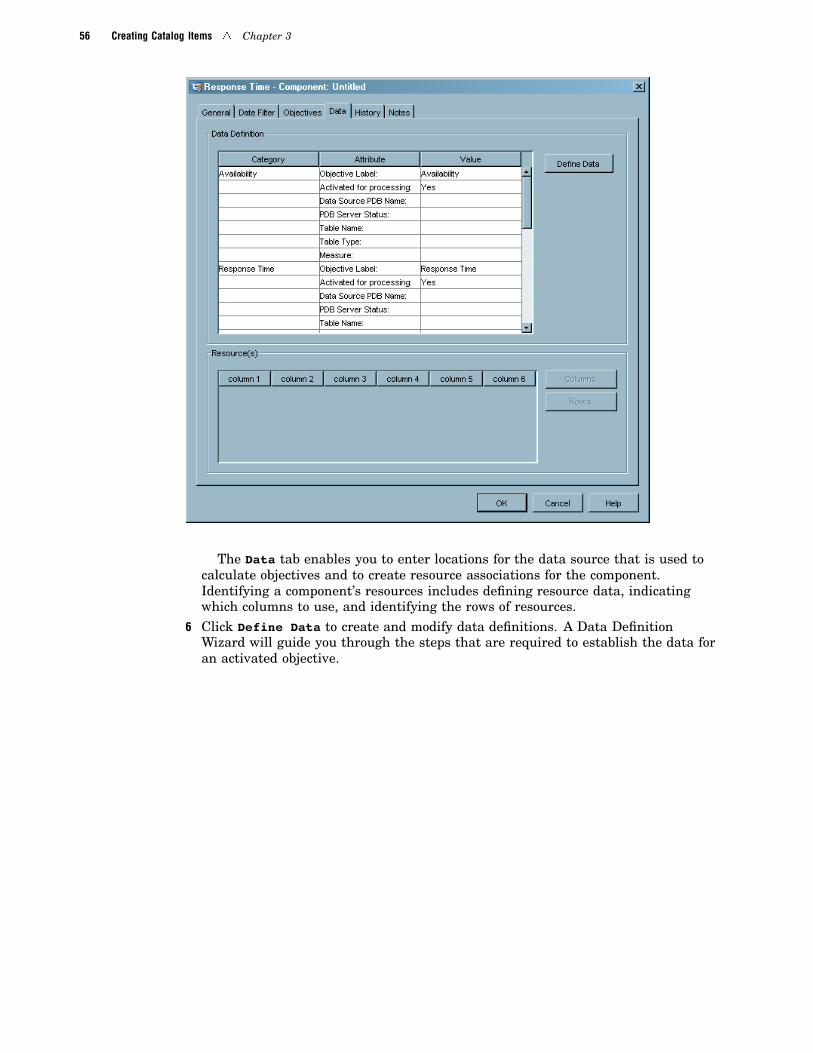
56 Creating Catalog Items � Chapter 3
The Data tab enables you to enter locations for the data source that is used tocalculate objectives and to create resource associations for the component.Identifying a component’s resources includes defining resource data, indicatingwhich columns to use, and identifying the rows of resources.
6 Click Define Data to create and modify data definitions. A Data DefinitionWizard will guide you through the steps that are required to establish the data foran activated objective.
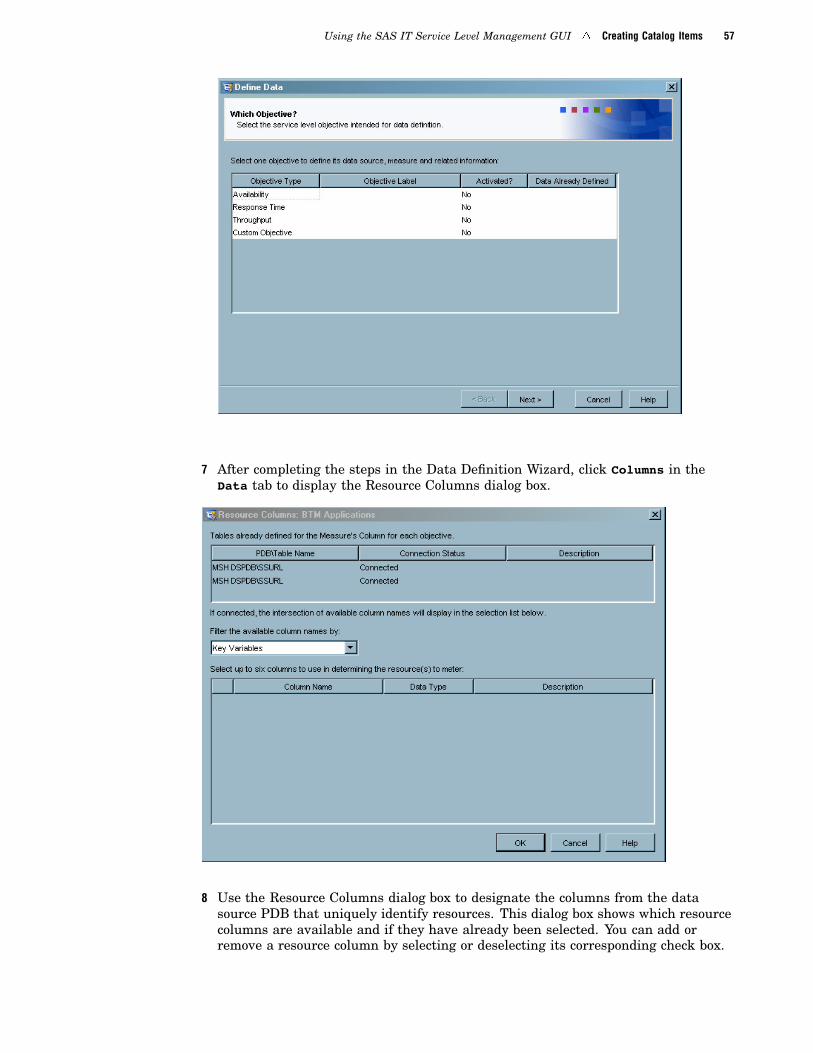
Using the SAS IT Service Level Management GUI � Creating Catalog Items 57
7 After completing the steps in the Data Definition Wizard, click Columns in theData tab to display the Resource Columns dialog box.
8 Use the Resource Columns dialog box to designate the columns from the datasource PDB that uniquely identify resources. This dialog box shows which resourcecolumns are available and if they have already been selected. You can add orremove a resource column by selecting or deselecting its corresponding check box.
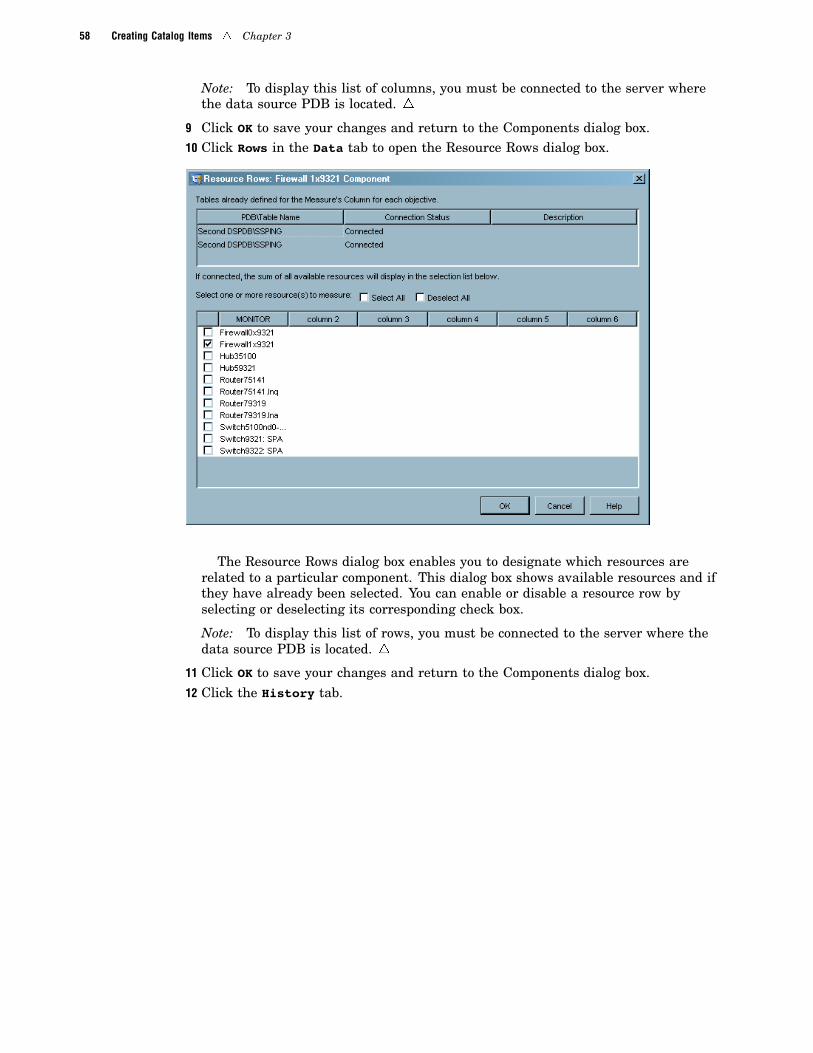
58 Creating Catalog Items � Chapter 3
Note: To display this list of columns, you must be connected to the server wherethe data source PDB is located. �
9 Click OK to save your changes and return to the Components dialog box.10 Click Rows in the Data tab to open the Resource Rows dialog box.
The Resource Rows dialog box enables you to designate which resources arerelated to a particular component. This dialog box shows available resources and ifthey have already been selected. You can enable or disable a resource row byselecting or deselecting its corresponding check box.
Note: To display this list of rows, you must be connected to the server where thedata source PDB is located. �
11 Click OK to save your changes and return to the Components dialog box.12 Click the History tab.

Using the SAS IT Service Level Management GUI � Creating Catalog Items 59
The History tab displays a record of all actions that are performed, the username of the person who performed the actions, and the date and time of eachaction. This is a display-only dialog box.
13 Click the Notes tab if you want to add notes about the component that you arecreating.
14 Click OK to add the new component.
Note: See “Component Nodes and Resources” on page 14 for more information aboutcomponents. SAS IT Service Level Management: User’s Guide provides more detailedinformation about creating components and services. �
ServicesA service in SAS IT Service Level Management represents one or more IT systems
that enable a business process to function. Services are defined in the Catalogworkspace and are associated with one or more components or child services. Servicelevel data for these components and services is compiled to produce indicators for theservice. A service can also contain other services.
The Service dialog box enables you to define a service and to determine the desiredobjectives for use in a contract.
From this dialog box, you can complete the following tasks:� Create or modify a service.� View predefined service level objectives.� Establish associations between service level objectives and components or services.� Determine how to calculate the indicator for objectives.� Determine how to calculate the score for objectives.
To create a service, complete the following steps:
1 From the Catalog workspace, open the Service dialog box in any of the followingways:� From the menu bar, select File � New � Service.� Right-click Services in the hierarchy tree and from the pop-up menu select
New � Service.� Click Create a Service in the Task list.

60 Creating Catalog Items � Chapter 3
The tabs in the Service dialog box are identical to the tabs in the Componentdialog box, with one exception. Where the Component dialog box displays aData tab, the Service dialog box displays a Hierarchy tab.
2 Click the Hierarchy tab to display the hierarchy for this service.
The Hierarchy tab displays a summary of parameters for the selected serviceand its child nodes. The service hierarchy shows what appears (or will appear) inthe catalog tree, along with the specific attributes for each node.
Note: See “Service Nodes” on page 13 for more information about services. SAS ITService Level Management: User’s Guide provides more detailed information aboutcreating services. �
SLAsA service level agreement (SLA) is a part of a contract between a provider of services
and the recipient of those services, or the customer. SLAs are defined in the Catalogworkspace. SLAs, as defined within SAS IT Service Level Management, are associatedwith one or more services or components. An SLA can contain associations with
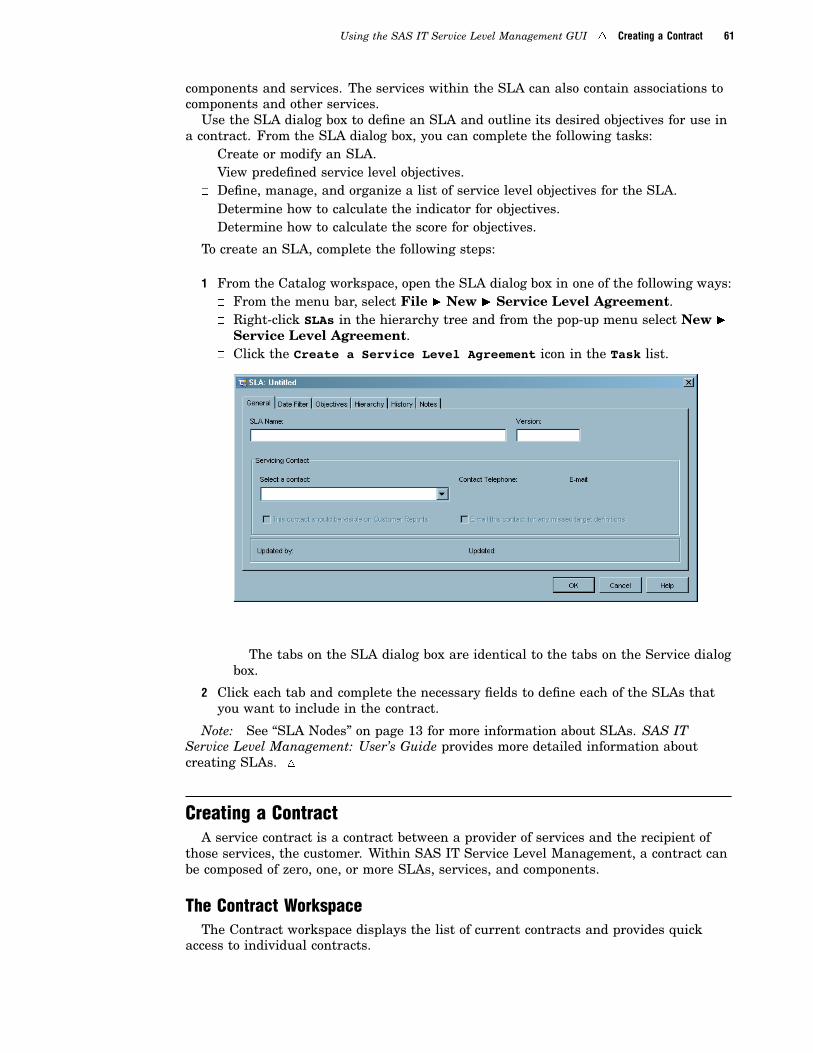
Using the SAS IT Service Level Management GUI � Creating a Contract 61
components and services. The services within the SLA can also contain associations tocomponents and other services.
Use the SLA dialog box to define an SLA and outline its desired objectives for use ina contract. From the SLA dialog box, you can complete the following tasks:
� Create or modify an SLA.� View predefined service level objectives.� Define, manage, and organize a list of service level objectives for the SLA.� Determine how to calculate the indicator for objectives.� Determine how to calculate the score for objectives.
To create an SLA, complete the following steps:
1 From the Catalog workspace, open the SLA dialog box in one of the following ways:� From the menu bar, select File � New � Service Level Agreement.� Right-click SLAs in the hierarchy tree and from the pop-up menu select New �
Service Level Agreement.� Click the Create a Service Level Agreement icon in the Task list.
The tabs on the SLA dialog box are identical to the tabs on the Service dialogbox.
2 Click each tab and complete the necessary fields to define each of the SLAs thatyou want to include in the contract.
Note: See “SLA Nodes” on page 13 for more information about SLAs. SAS ITService Level Management: User’s Guide provides more detailed information aboutcreating SLAs. �
Creating a ContractA service contract is a contract between a provider of services and the recipient of
those services, the customer. Within SAS IT Service Level Management, a contract canbe composed of zero, one, or more SLAs, services, and components.
The Contract WorkspaceThe Contract workspace displays the list of current contracts and provides quick
access to individual contracts.
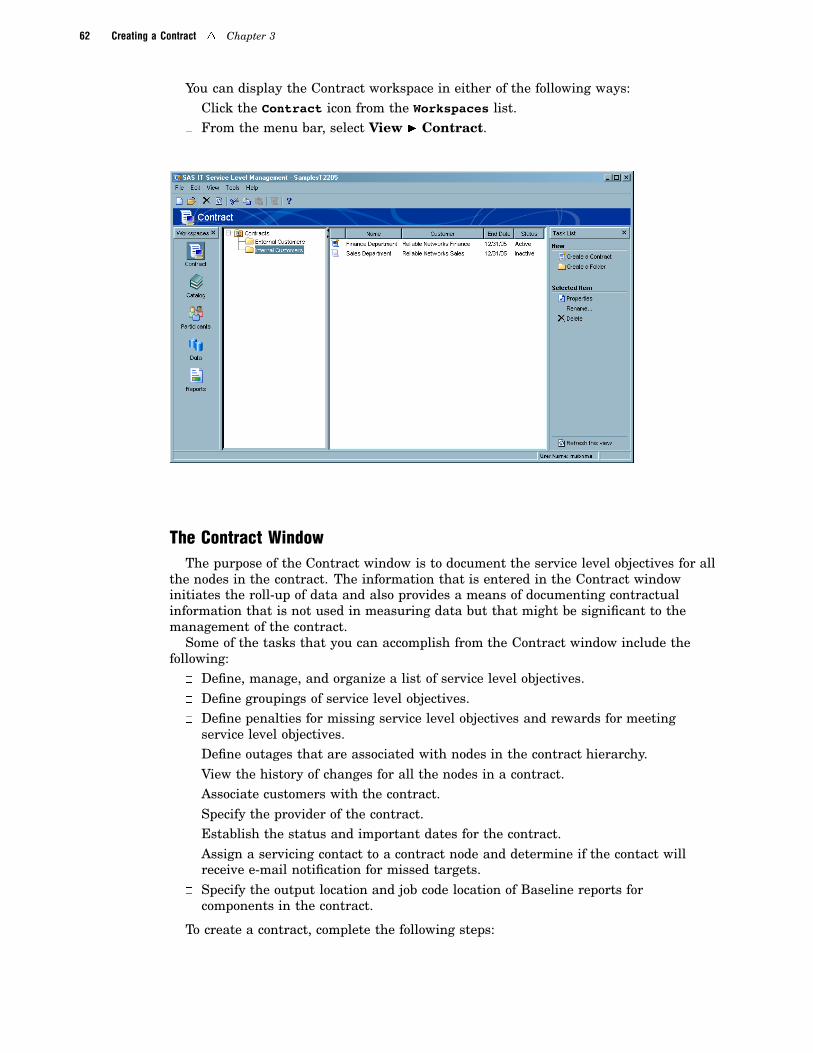
62 Creating a Contract � Chapter 3
You can display the Contract workspace in either of the following ways:� Click the Contract icon from the Workspaces list.� From the menu bar, select View � Contract.
The Contract WindowThe purpose of the Contract window is to document the service level objectives for all
the nodes in the contract. The information that is entered in the Contract windowinitiates the roll-up of data and also provides a means of documenting contractualinformation that is not used in measuring data but that might be significant to themanagement of the contract.
Some of the tasks that you can accomplish from the Contract window include thefollowing:
� Define, manage, and organize a list of service level objectives.� Define groupings of service level objectives.� Define penalties for missing service level objectives and rewards for meeting
service level objectives.� Define outages that are associated with nodes in the contract hierarchy.� View the history of changes for all the nodes in a contract.� Associate customers with the contract.� Specify the provider of the contract.� Establish the status and important dates for the contract.� Assign a servicing contact to a contract node and determine if the contact will
receive e-mail notification for missed targets.� Specify the output location and job code location of Baseline reports for
components in the contract.
To create a contract, complete the following steps:
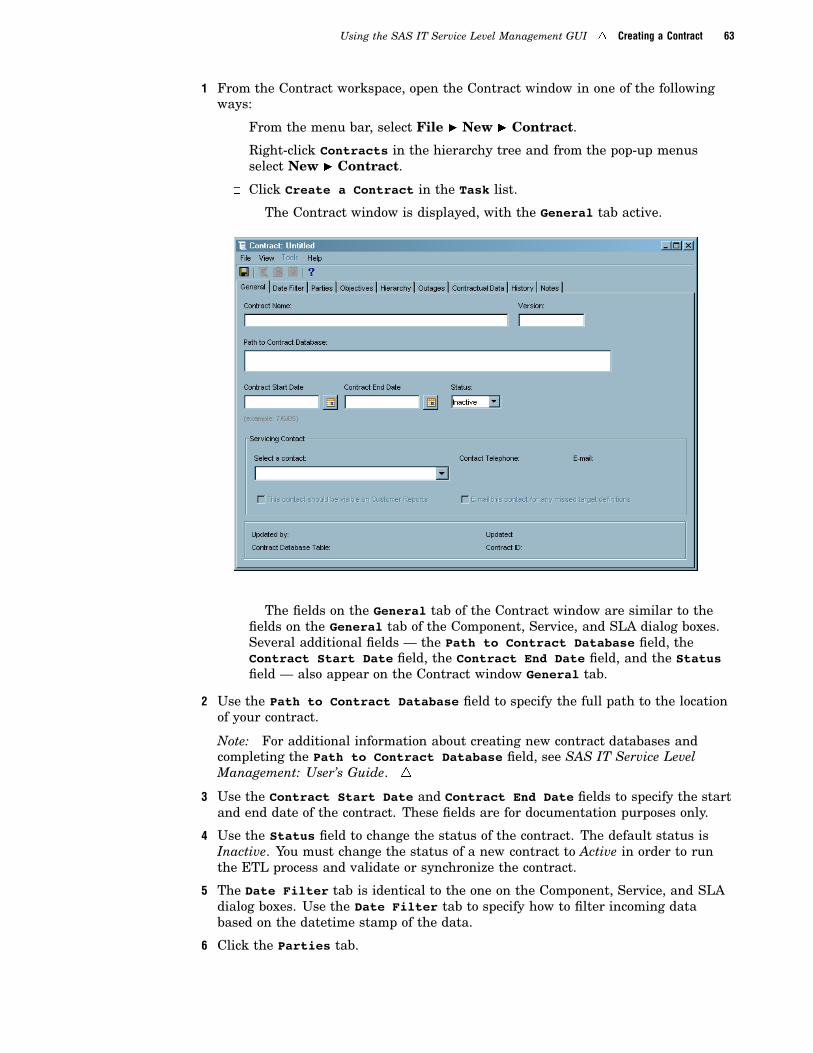
Using the SAS IT Service Level Management GUI � Creating a Contract 63
1 From the Contract workspace, open the Contract window in one of the followingways:
� From the menu bar, select File � New � Contract.
� Right-click Contracts in the hierarchy tree and from the pop-up menusselect New � Contract.
� Click Create a Contract in the Task list.
The Contract window is displayed, with the General tab active.
The fields on the General tab of the Contract window are similar to thefields on the General tab of the Component, Service, and SLA dialog boxes.Several additional fields — the Path to Contract Database field, theContract Start Date field, the Contract End Date field, and the Statusfield — also appear on the Contract window General tab.
2 Use the Path to Contract Database field to specify the full path to the locationof your contract.
Note: For additional information about creating new contract databases andcompleting the Path to Contract Database field, see SAS IT Service LevelManagement: User’s Guide. �
3 Use the Contract Start Date and Contract End Date fields to specify the startand end date of the contract. These fields are for documentation purposes only.
4 Use the Status field to change the status of the contract. The default status isInactive. You must change the status of a new contract to Active in order to runthe ETL process and validate or synchronize the contract.
5 The Date Filter tab is identical to the one on the Component, Service, and SLAdialog boxes. Use the Date Filter tab to specify how to filter incoming databased on the datetime stamp of the data.
6 Click the Parties tab.
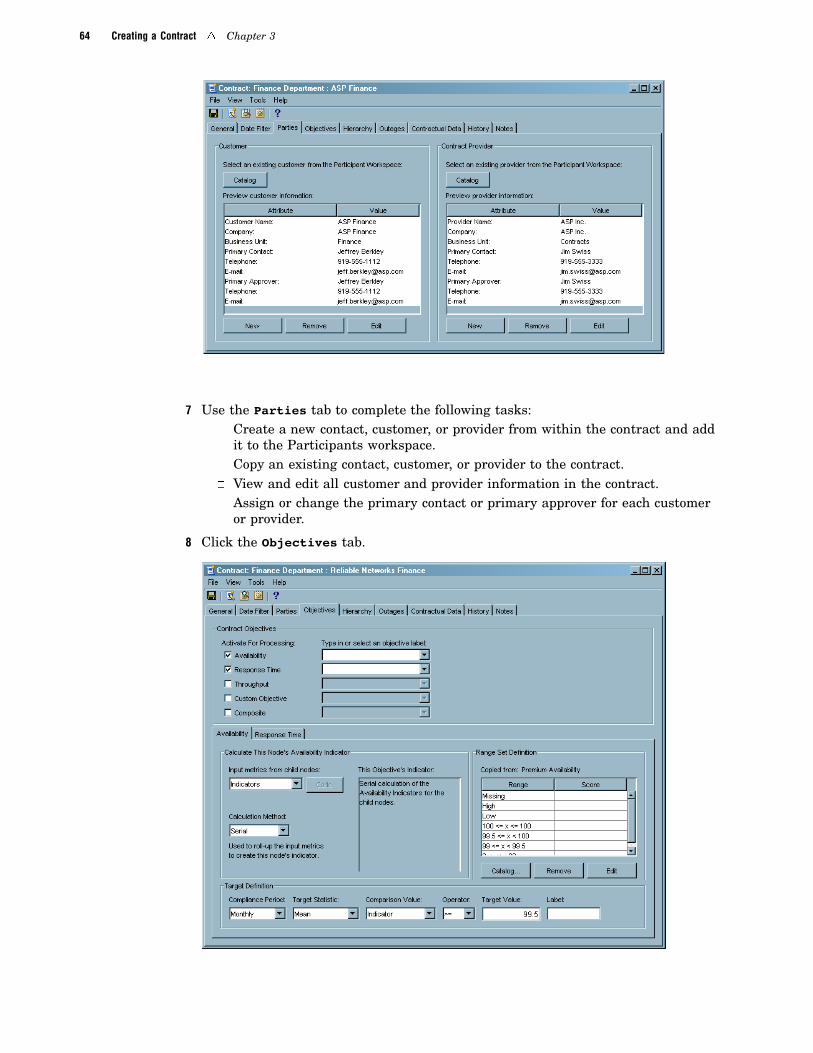
64 Creating a Contract � Chapter 3
7 Use the Parties tab to complete the following tasks:� Create a new contact, customer, or provider from within the contract and add
it to the Participants workspace.� Copy an existing contact, customer, or provider to the contract.� View and edit all customer and provider information in the contract.� Assign or change the primary contact or primary approver for each customer
or provider.
8 Click the Objectives tab.
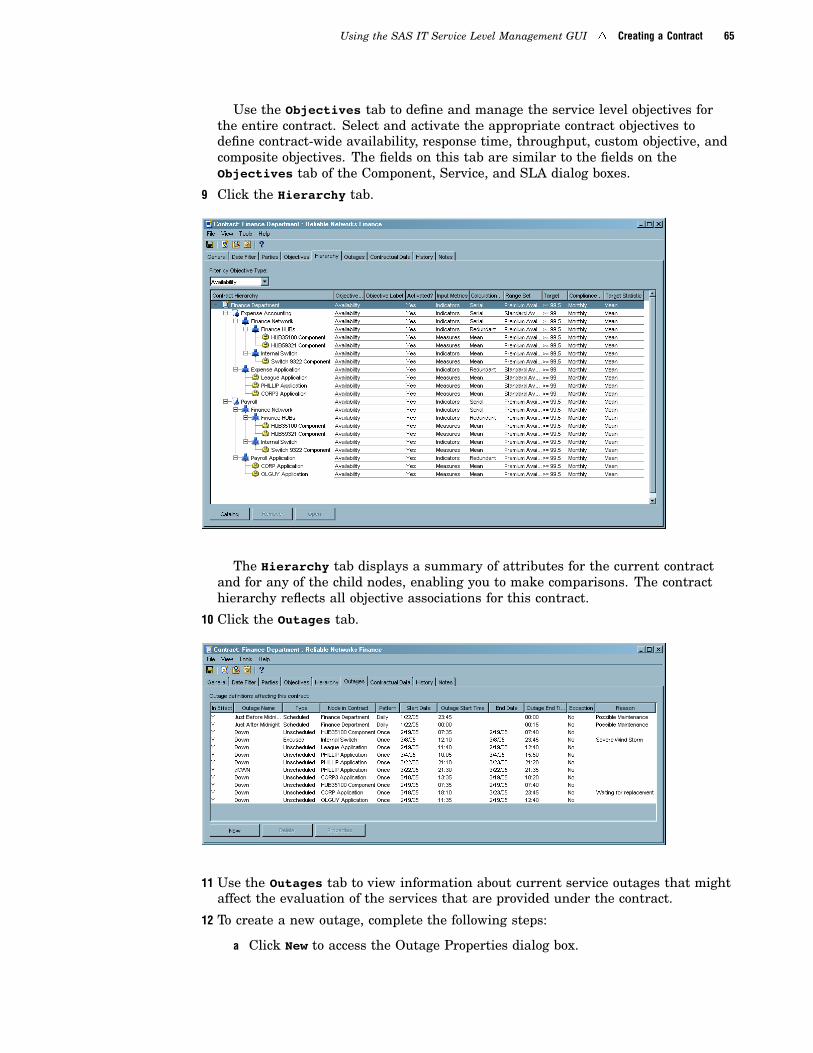
Using the SAS IT Service Level Management GUI � Creating a Contract 65
Use the Objectives tab to define and manage the service level objectives forthe entire contract. Select and activate the appropriate contract objectives todefine contract-wide availability, response time, throughput, custom objective, andcomposite objectives. The fields on this tab are similar to the fields on theObjectives tab of the Component, Service, and SLA dialog boxes.
9 Click the Hierarchy tab.
The Hierarchy tab displays a summary of attributes for the current contractand for any of the child nodes, enabling you to make comparisons. The contracthierarchy reflects all objective associations for this contract.
10 Click the Outages tab.
11 Use the Outages tab to view information about current service outages that mightaffect the evaluation of the services that are provided under the contract.
12 To create a new outage, complete the following steps:
a Click New to access the Outage Properties dialog box.
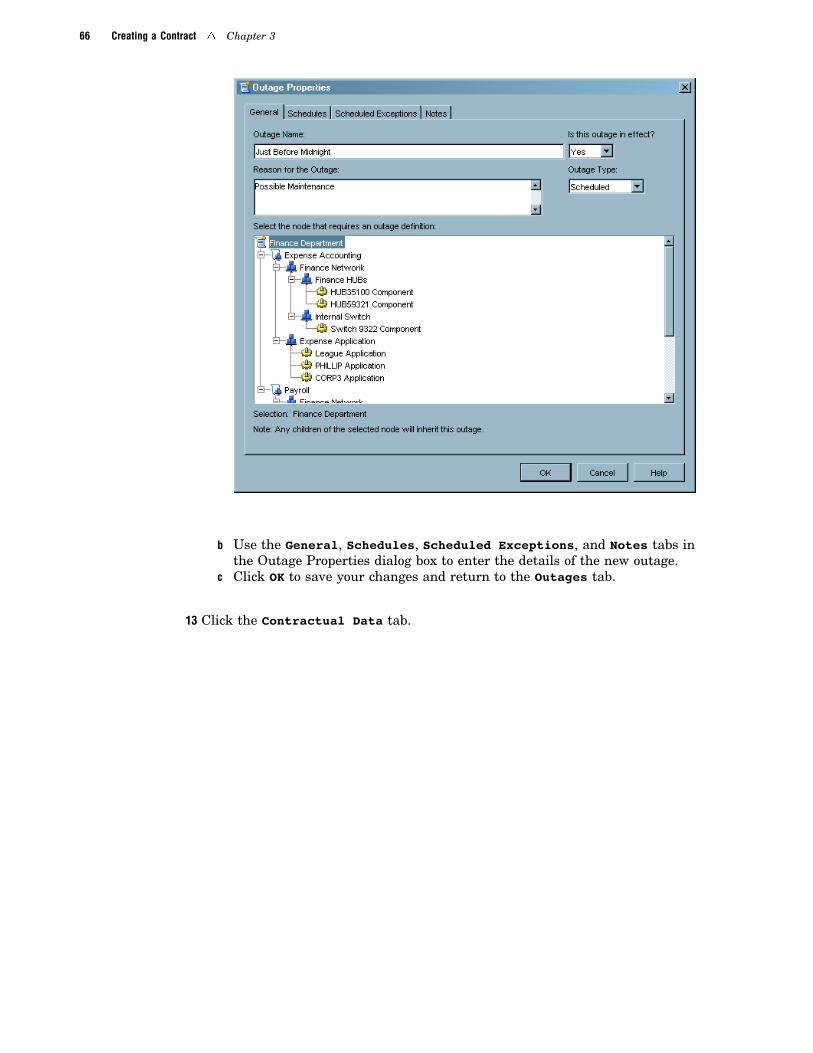
66 Creating a Contract � Chapter 3
b Use the General, Schedules, Scheduled Exceptions, and Notes tabs inthe Outage Properties dialog box to enter the details of the new outage.
c Click OK to save your changes and return to the Outages tab.
13 Click the Contractual Data tab.
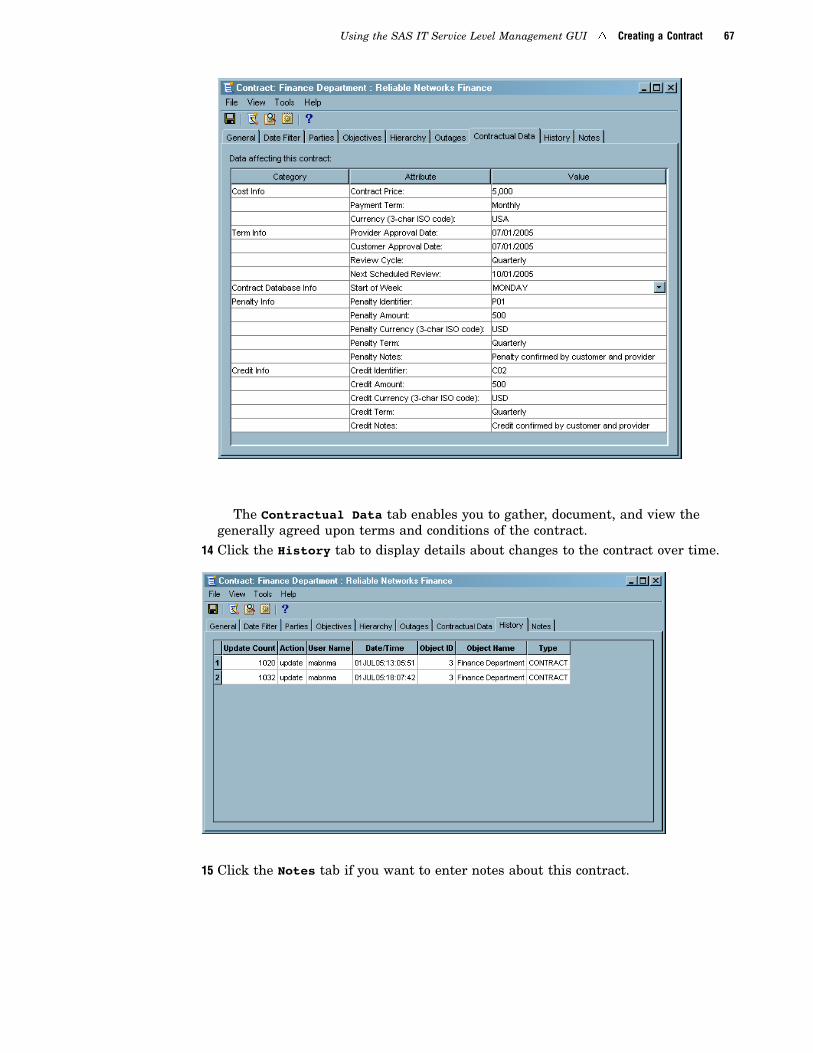
Using the SAS IT Service Level Management GUI � Creating a Contract 67
The Contractual Data tab enables you to gather, document, and view thegenerally agreed upon terms and conditions of the contract.
14 Click the History tab to display details about changes to the contract over time.
15 Click the Notes tab if you want to enter notes about this contract.

68 Running ETL � Chapter 3
Running ETLAfter you create a contract and define service level objectives for all the nodes, you
are ready to begin processing the SLM data for your contract.To begin processing, complete the following steps:1 From the Contract window menu bar, select Tools � Initiate ETL.
2 Click Yes to continue processing.
Note: Running ETL from the IT Service Level Management GUI might take a longtime. Running ETL in a batch environment is recommended. SAS IT Service LevelManagement: User’s Guide provides more information about running ETL in a batchenvironment. �
Closing SAS IT Service Level ManagementFrom any of the workspace windows, you can close SAS IT Service Level
Management in any of the following ways:
� From the menu bar, you can select File � Exit. Then, click Yes to exit.� Click x in the top-right corner of the main window. Then, click Yes to exit.
69
C H A P T E R
4Reporting on Your SLM Data
Overview of Reporting 69Baseline Reports 70
Generating Baseline Reports 70
Viewing Baseline Reports 71
Daily Data Report 73
Weekly Data Report 74Monthly Data Report 76
Service Level Reports 77
Reports for Contract Providers and Customers 78
Reports Workspace 78
Generating Service Level Reports 79
Report Global Settings 79Report Specifications 80
Generate Service Level Reports 81
Viewing Service Level Reports 82
Contract List Report 83
Contract Hierarchy Report 85Daily, Weekly, Monthly, and Yearly Reports 86
Resource Analysis Report 87
5–Minute Interval Table Report 88
Contract Details Report 89
Customer Report 90Provider Report 91
Range Set Details Report 92
Outages Report 93
Outage Details Report 94
Compliance List Report 95
Compliance Details Report 96Servicing Contacts Report 97
SAS Enterprise Guide Reports 97
Overview of Reporting
Reporting is an important part of the service level management concept. IT providersneed frequent reports to help them identify problem areas quickly and easily so thatthey can resolve issues early. Customers need regular reports that demonstrate thevalue that is received for their investment in IT services. And both providers andcustomers need reports that illustrate clearly that the service level objectives that werespecified in the contract are feasible and being met.

70 Baseline Reports � Chapter 4
SAS IT Service Level Management provides three high-level categories of reports tomeet the various needs of contract providers and customers and to facilitate reportmanagement.
Baseline reports provide guidance for establishing reasonable service level targetsbased on resource data. These reports are helpful for contractproviders who are setting up a contract.
Service Levelreports
compare performance statistics with objective targets tocommunicate how well service level objectives are being met.
SAS EnterpriseGuide reports
provide various ways to represent SAS IT Service LevelManagement data in graphical or tabular formats. SAS EnterpriseGuide enables you to create interactive or ad hoc reports.
This chapter provides instructions for managing these reports and provides descriptionsand illustrations of the reporting capabilities of SAS IT Service Level Management.
Baseline ReportsBaseline reports are graphs that display data that exists in a contract database for a
specified contract within the current environment. The graphs in the baseline galleryare prepared from the summary tables in the contract database. You can use thesebaseline views of contract components to determine reasonable targets for the objectivesthat you specify for the components.
Baseline reports are divided into three main groups based on scope of the data: daily,weekly, and monthly data reports. Each of these groups is further divided based on thecalculation methods performed on all of the data: mean, minimum, maximum, and sum.
Note: More detailed information about Baseline reports and how to access them isavailable in SAS IT Service Level Management: User’s Guide. �
Generating Baseline ReportsA SAS job code file must be run in batch mode to schedule the generation of Baseline
reports. You can use the GUI to create this job code file, designate the location of thefile, and designate the location of the report output.
To create the baseline gallery job code and designate the appropriate file and outputlocations, complete the following steps:
1 In the Contract workspace, open the contract for which you want to create thebaseline gallery job code.
2 From the menu bar in the Contract window, select Tools � Create BaselineGallery Job Code.
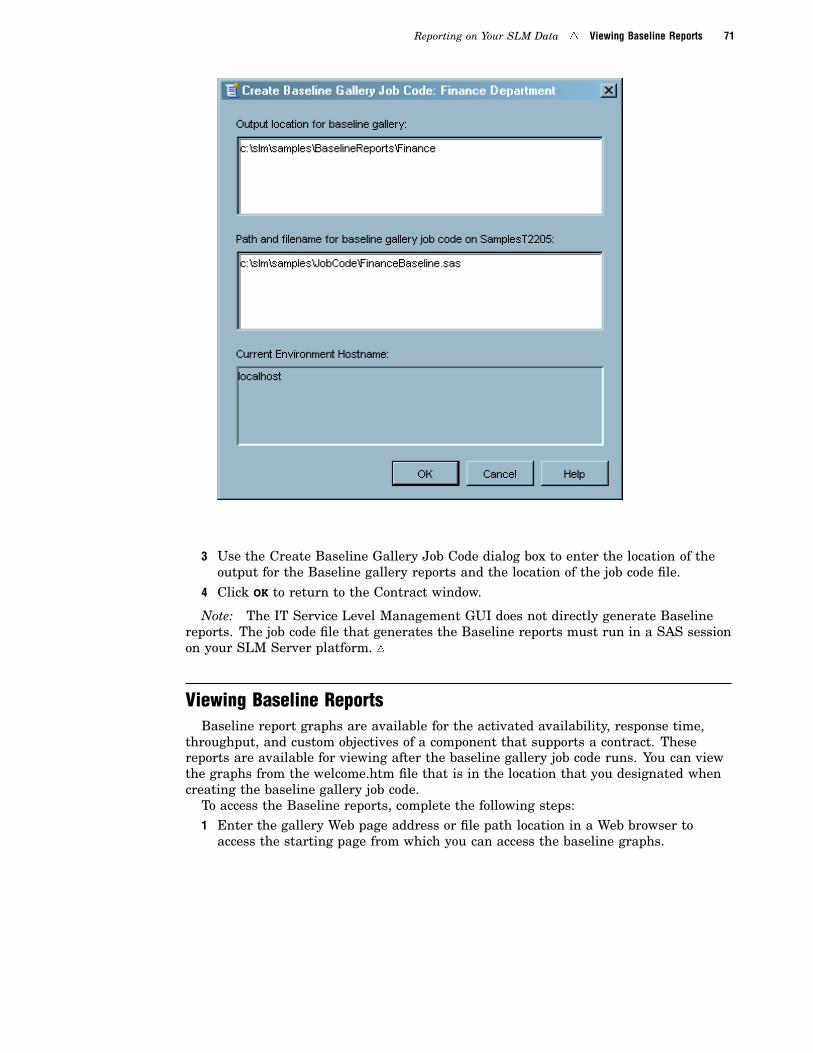
Reporting on Your SLM Data � Viewing Baseline Reports 71
3 Use the Create Baseline Gallery Job Code dialog box to enter the location of theoutput for the Baseline gallery reports and the location of the job code file.
4 Click OK to return to the Contract window.
Note: The IT Service Level Management GUI does not directly generate Baselinereports. The job code file that generates the Baseline reports must run in a SAS sessionon your SLM Server platform. �
Viewing Baseline ReportsBaseline report graphs are available for the activated availability, response time,
throughput, and custom objectives of a component that supports a contract. Thesereports are available for viewing after the baseline gallery job code runs. You can viewthe graphs from the welcome.htm file that is in the location that you designated whencreating the baseline gallery job code.
To access the Baseline reports, complete the following steps:1 Enter the gallery Web page address or file path location in a Web browser to
access the starting page from which you can access the baseline graphs.

72 Viewing Baseline Reports � Chapter 4
2 Click Baseline Reports to access the gallery of Baseline reports.
3 Use the navigation pane on the left side of the window to select a group of reportsbased on scope of the data (daily, weekly, monthly) and statistic (mean, min, max,sum).
4 Use the Select a value for Node or Select a value for Table menus (orboth) to refine the group of thumbnail graphs by a specific node or table.
5 Click a thumbnail graph to enlarge the image.6 After viewing the report, click Back at the top right of the page to return to the
report thumbnails.
Note: The Back option in your Web browser will return to the main page, notthe last report group that you selected. �
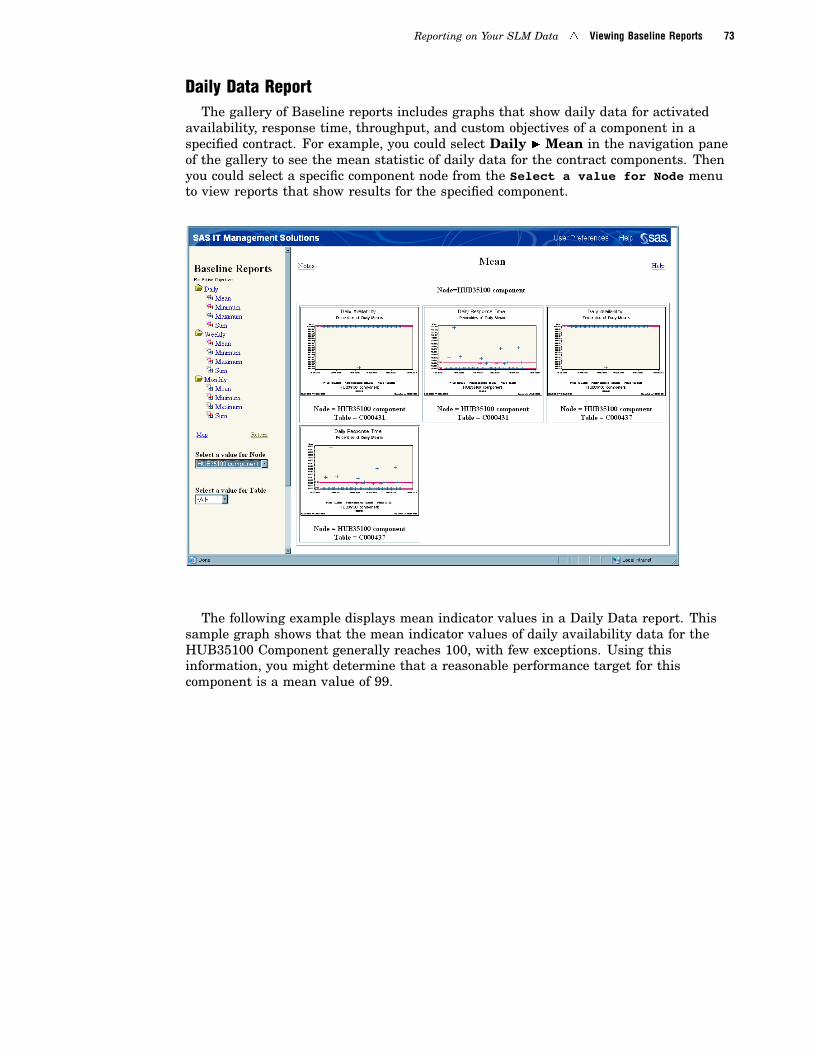
Reporting on Your SLM Data � Viewing Baseline Reports 73
Daily Data ReportThe gallery of Baseline reports includes graphs that show daily data for activated
availability, response time, throughput, and custom objectives of a component in aspecified contract. For example, you could select Daily � Mean in the navigation paneof the gallery to see the mean statistic of daily data for the contract components. Thenyou could select a specific component node from the Select a value for Node menuto view reports that show results for the specified component.
The following example displays mean indicator values in a Daily Data report. Thissample graph shows that the mean indicator values of daily availability data for theHUB35100 Component generally reaches 100, with few exceptions. Using thisinformation, you might determine that a reasonable performance target for thiscomponent is a mean value of 99.
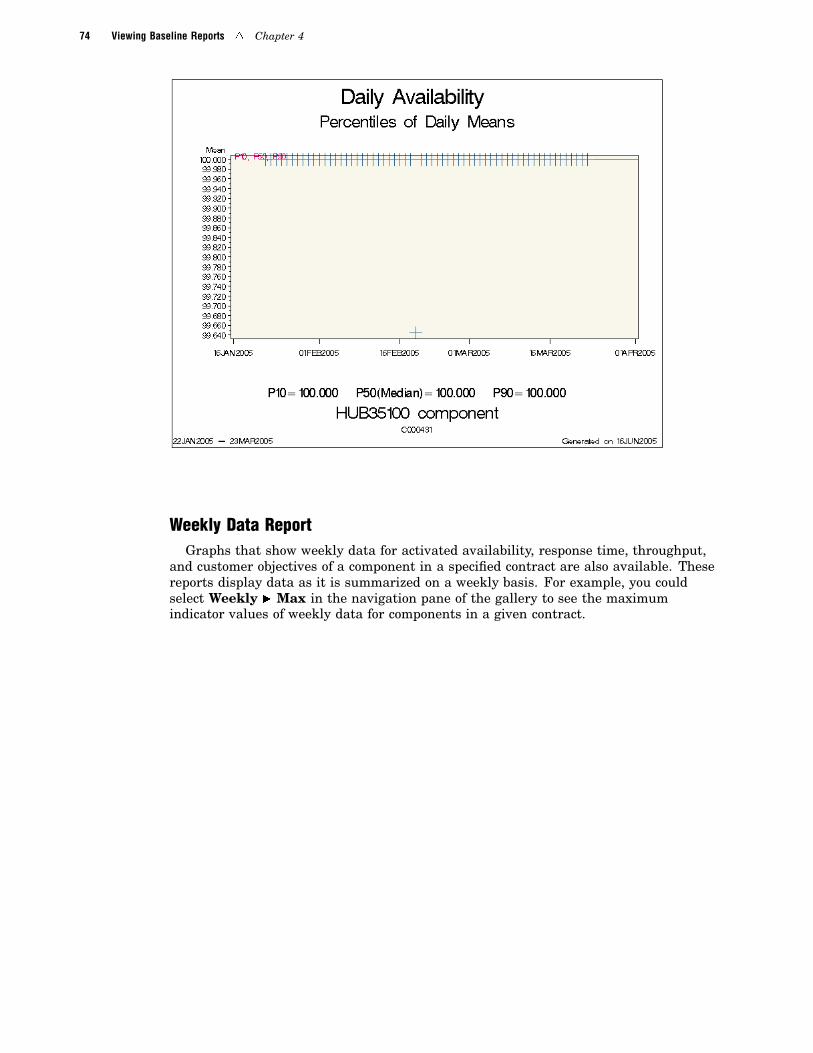
74 Viewing Baseline Reports � Chapter 4
Weekly Data ReportGraphs that show weekly data for activated availability, response time, throughput,
and customer objectives of a component in a specified contract are also available. Thesereports display data as it is summarized on a weekly basis. For example, you couldselect Weekly � Max in the navigation pane of the gallery to see the maximumindicator values of weekly data for components in a given contract.
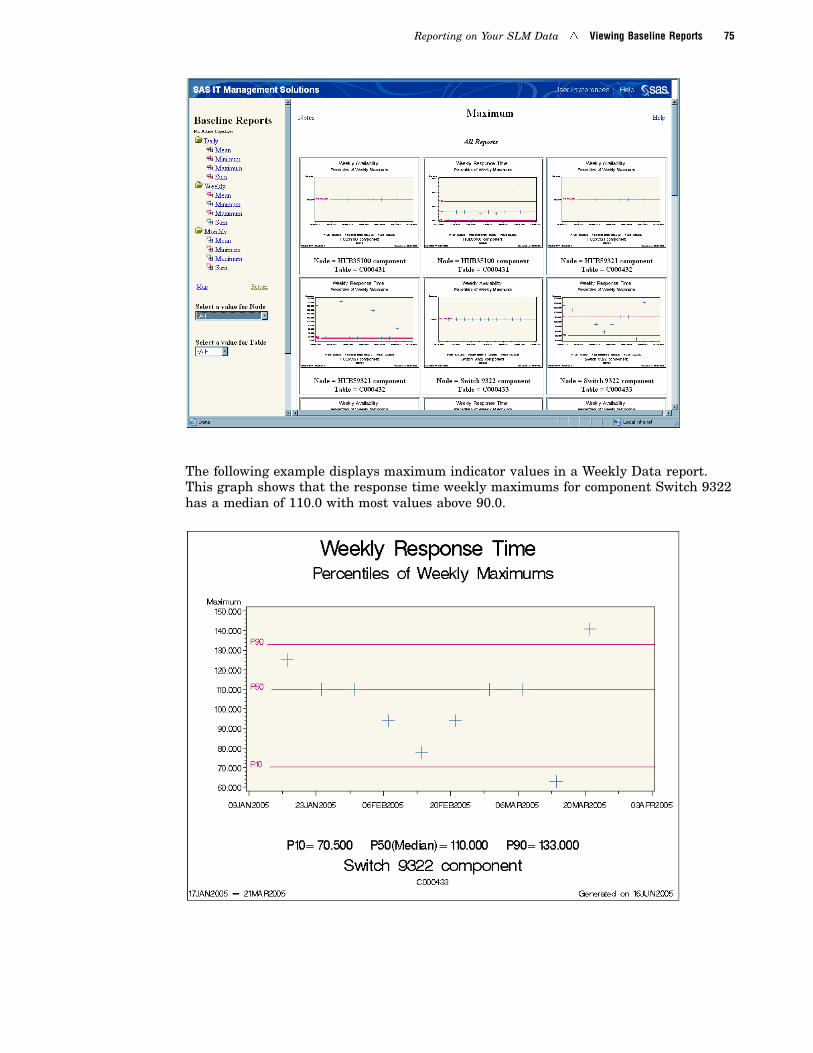
Reporting on Your SLM Data � Viewing Baseline Reports 75
The following example displays maximum indicator values in a Weekly Data report.This graph shows that the response time weekly maximums for component Switch 9322has a median of 110.0 with most values above 90.0.
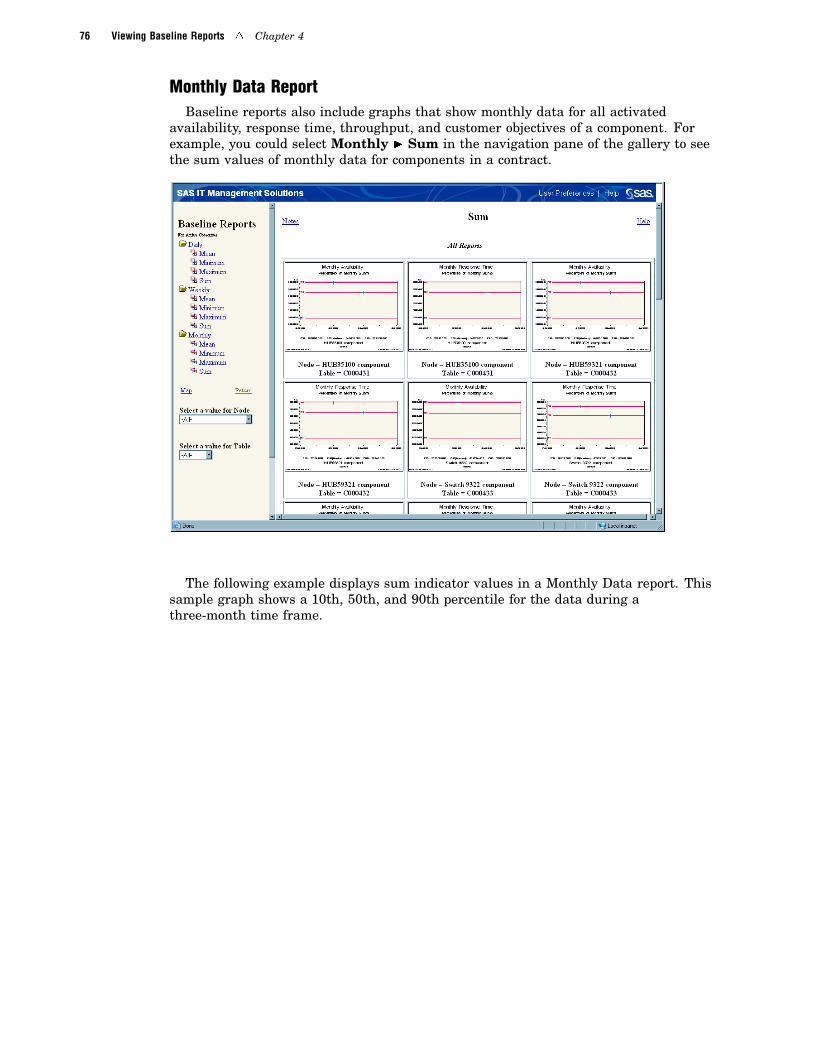
76 Viewing Baseline Reports � Chapter 4
Monthly Data ReportBaseline reports also include graphs that show monthly data for all activated
availability, response time, throughput, and customer objectives of a component. Forexample, you could select Monthly � Sum in the navigation pane of the gallery to seethe sum values of monthly data for components in a contract.
The following example displays sum indicator values in a Monthly Data report. Thissample graph shows a 10th, 50th, and 90th percentile for the data during athree-month time frame.
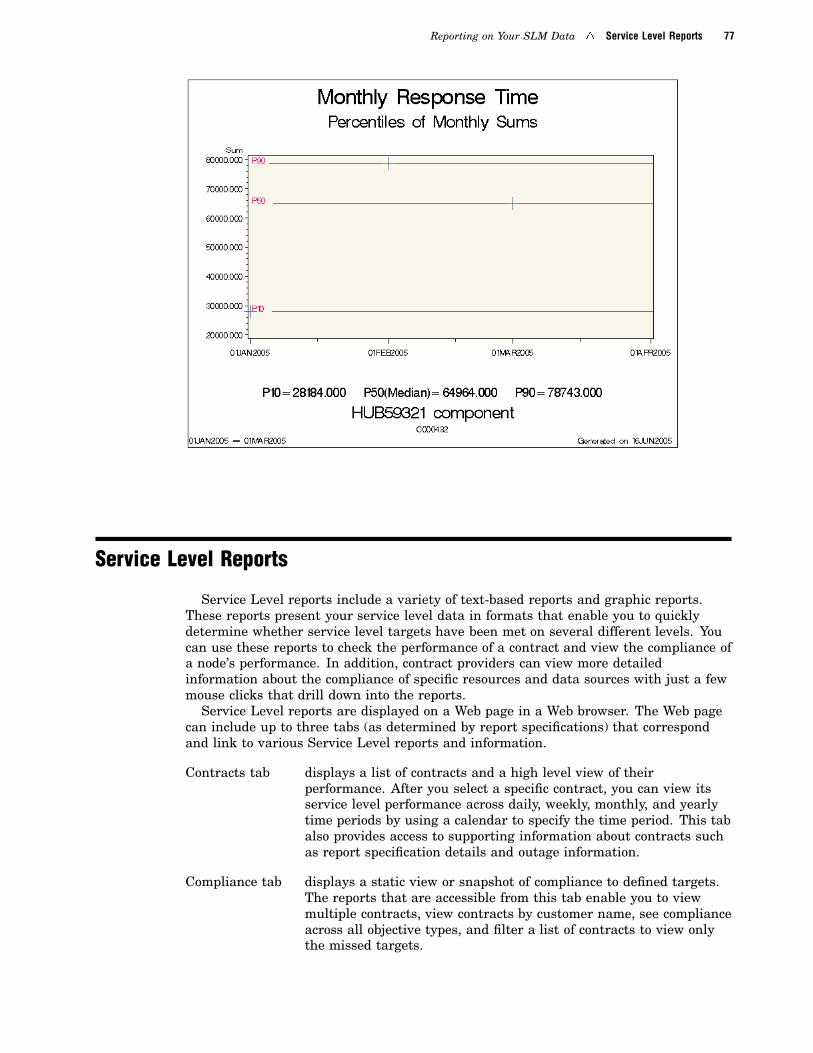
Reporting on Your SLM Data � Service Level Reports 77
Service Level Reports
Service Level reports include a variety of text-based reports and graphic reports.These reports present your service level data in formats that enable you to quicklydetermine whether service level targets have been met on several different levels. Youcan use these reports to check the performance of a contract and view the compliance ofa node’s performance. In addition, contract providers can view more detailedinformation about the compliance of specific resources and data sources with just a fewmouse clicks that drill down into the reports.
Service Level reports are displayed on a Web page in a Web browser. The Web pagecan include up to three tabs (as determined by report specifications) that correspondand link to various Service Level reports and information.
Contracts tab displays a list of contracts and a high level view of theirperformance. After you select a specific contract, you can view itsservice level performance across daily, weekly, monthly, and yearlytime periods by using a calendar to specify the time period. This tabalso provides access to supporting information about contracts suchas report specification details and outage information.
Compliance tab displays a static view or snapshot of compliance to defined targets.The reports that are accessible from this tab enable you to viewmultiple contracts, view contracts by customer name, see complianceacross all objective types, and filter a list of contracts to view onlythe missed targets.
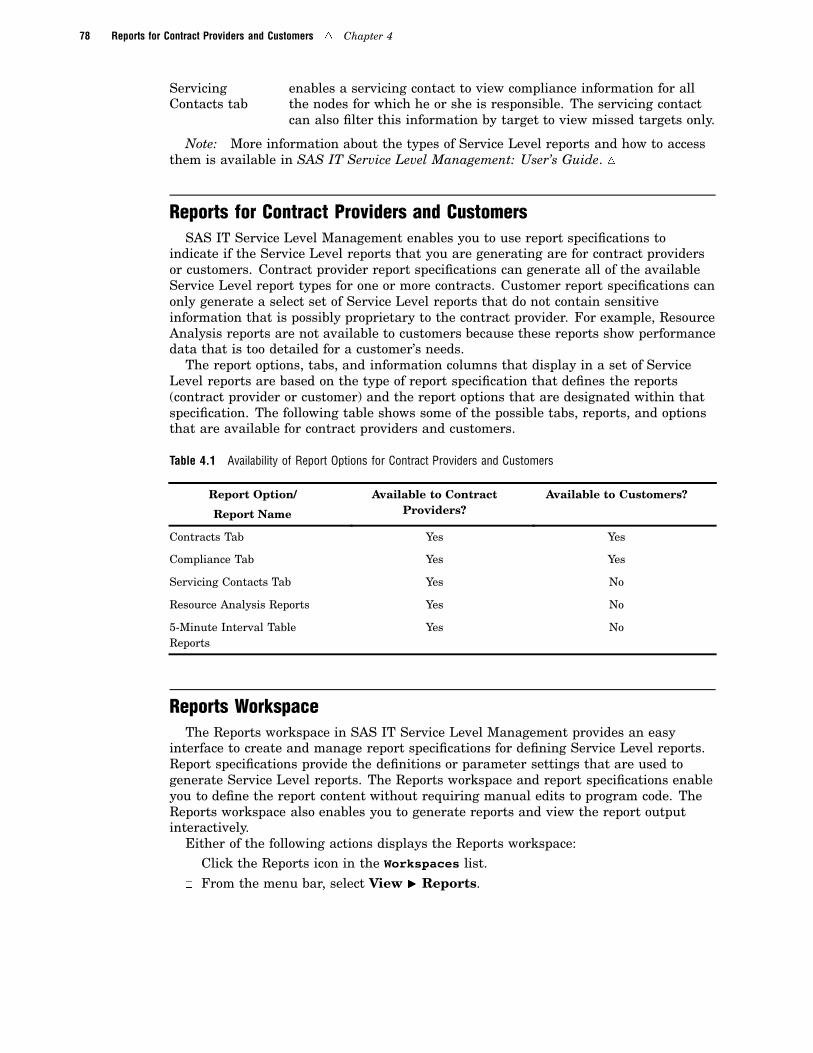
78 Reports for Contract Providers and Customers � Chapter 4
ServicingContacts tab
enables a servicing contact to view compliance information for allthe nodes for which he or she is responsible. The servicing contactcan also filter this information by target to view missed targets only.
Note: More information about the types of Service Level reports and how to accessthem is available in SAS IT Service Level Management: User’s Guide. �
Reports for Contract Providers and CustomersSAS IT Service Level Management enables you to use report specifications to
indicate if the Service Level reports that you are generating are for contract providersor customers. Contract provider report specifications can generate all of the availableService Level report types for one or more contracts. Customer report specifications canonly generate a select set of Service Level reports that do not contain sensitiveinformation that is possibly proprietary to the contract provider. For example, ResourceAnalysis reports are not available to customers because these reports show performancedata that is too detailed for a customer’s needs.
The report options, tabs, and information columns that display in a set of ServiceLevel reports are based on the type of report specification that defines the reports(contract provider or customer) and the report options that are designated within thatspecification. The following table shows some of the possible tabs, reports, and optionsthat are available for contract providers and customers.
Table 4.1 Availability of Report Options for Contract Providers and Customers
Report Option/
Report Name
Available to ContractProviders?
Available to Customers?
Contracts Tab Yes Yes
Compliance Tab Yes Yes
Servicing Contacts Tab Yes No
Resource Analysis Reports Yes No
5-Minute Interval TableReports
Yes No
Reports WorkspaceThe Reports workspace in SAS IT Service Level Management provides an easy
interface to create and manage report specifications for defining Service Level reports.Report specifications provide the definitions or parameter settings that are used togenerate Service Level reports. The Reports workspace and report specifications enableyou to define the report content without requiring manual edits to program code. TheReports workspace also enables you to generate reports and view the report outputinteractively.
Either of the following actions displays the Reports workspace:� Click the Reports icon in the Workspaces list.� From the menu bar, select View � Reports.
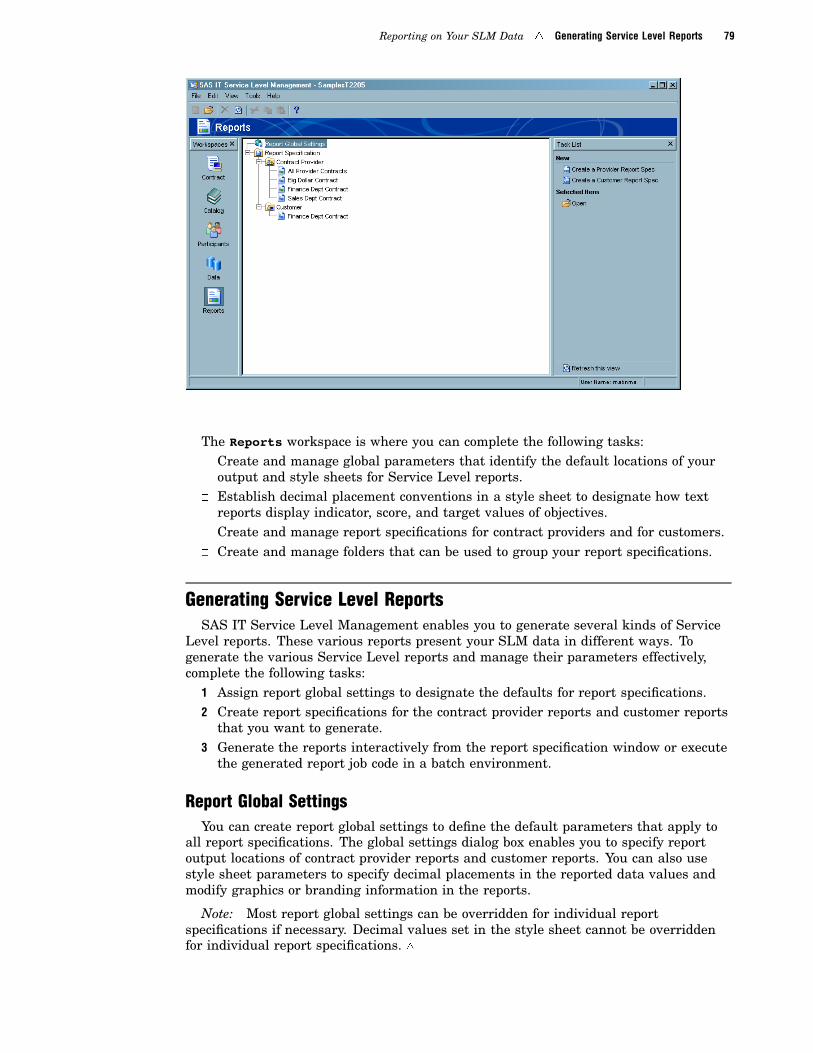
Reporting on Your SLM Data � Generating Service Level Reports 79
The Reports workspace is where you can complete the following tasks:� Create and manage global parameters that identify the default locations of your
output and style sheets for Service Level reports.� Establish decimal placement conventions in a style sheet to designate how text
reports display indicator, score, and target values of objectives.� Create and manage report specifications for contract providers and for customers.� Create and manage folders that can be used to group your report specifications.
Generating Service Level ReportsSAS IT Service Level Management enables you to generate several kinds of Service
Level reports. These various reports present your SLM data in different ways. Togenerate the various Service Level reports and manage their parameters effectively,complete the following tasks:
1 Assign report global settings to designate the defaults for report specifications.2 Create report specifications for the contract provider reports and customer reports
that you want to generate.3 Generate the reports interactively from the report specification window or execute
the generated report job code in a batch environment.
Report Global SettingsYou can create report global settings to define the default parameters that apply to
all report specifications. The global settings dialog box enables you to specify reportoutput locations of contract provider reports and customer reports. You can also usestyle sheet parameters to specify decimal placements in the reported data values andmodify graphics or branding information in the reports.
Note: Most report global settings can be overridden for individual reportspecifications if necessary. Decimal values set in the style sheet cannot be overriddenfor individual report specifications. �

80 Generating Service Level Reports � Chapter 4
Either of the following actions displays the Report Global Settings dialog box:� Double-click Report Global Settings in the hierarchy tree.� Right-click Report Global Settings in the hierarchy tree and from the pop-up
menu click Open.
From the Report Global Settings dialog box, you can complete the following tasks:� Define report output locations for contract provider reports and customer reports.� Designate a customized style sheet for reports.� Define the decimal placement for indicator, score, and target values for objectives
in the Service Level reports.
Report SpecificationsYou must create report specifications for the Service Level reports that you would
like to generate. Report specifications are report definition files that contain the manyparameter options that you set for generating Service Level reports. There are twotypes of Service Level reports (contract provider and customer) based on who will readand use them. Both types of reports contain a specialized set of reporting options.Contract provider report specifications and customer report specifications define thenecessary parameters for the designated report type.
The Reports workspace provides the capability to create, modify, and save reportspecifications so that you can maintain specific report configurations withoutre-entering settings each time that you’d like to generate a routine report. Once youcreate a provider or customer report specification, it is automatically organized into theContract Provider Folder or the Customer Folder for easy management. You canalso create additional sub-folders to manage the report specifications further.
SAS IT Service Level Management provides a Reports Specification Wizard thathelps you set the initial report parameters for each report. The Wizard providesstep-by-step instructions for naming the report specification and assigning the
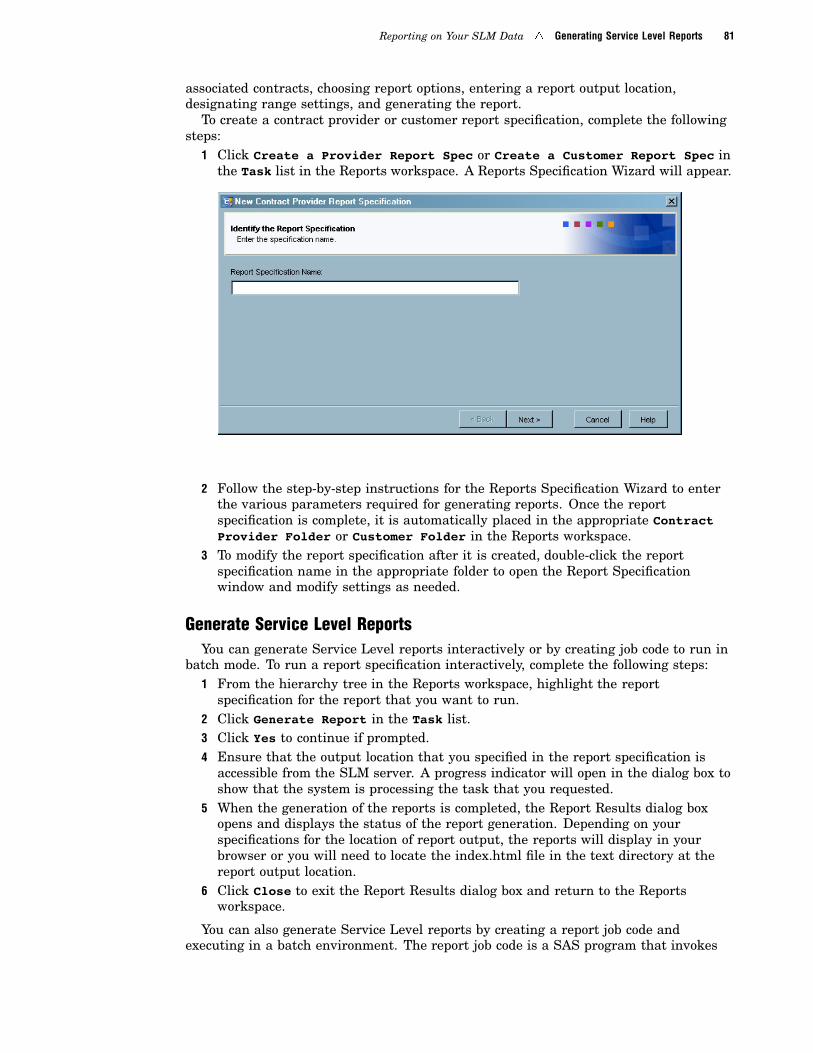
Reporting on Your SLM Data � Generating Service Level Reports 81
associated contracts, choosing report options, entering a report output location,designating range settings, and generating the report.
To create a contract provider or customer report specification, complete the followingsteps:
1 Click Create a Provider Report Spec or Create a Customer Report Spec inthe Task list in the Reports workspace. A Reports Specification Wizard will appear.
2 Follow the step-by-step instructions for the Reports Specification Wizard to enterthe various parameters required for generating reports. Once the reportspecification is complete, it is automatically placed in the appropriate ContractProvider Folder or Customer Folder in the Reports workspace.
3 To modify the report specification after it is created, double-click the reportspecification name in the appropriate folder to open the Report Specificationwindow and modify settings as needed.
Generate Service Level ReportsYou can generate Service Level reports interactively or by creating job code to run in
batch mode. To run a report specification interactively, complete the following steps:1 From the hierarchy tree in the Reports workspace, highlight the report
specification for the report that you want to run.2 Click Generate Report in the Task list.3 Click Yes to continue if prompted.4 Ensure that the output location that you specified in the report specification is
accessible from the SLM server. A progress indicator will open in the dialog box toshow that the system is processing the task that you requested.
5 When the generation of the reports is completed, the Report Results dialog boxopens and displays the status of the report generation. Depending on yourspecifications for the location of report output, the reports will display in yourbrowser or you will need to locate the index.html file in the text directory at thereport output location.
6 Click Close to exit the Report Results dialog box and return to the Reportsworkspace.
You can also generate Service Level reports by creating a report job code andexecuting in a batch environment. The report job code is a SAS program that invokes

82 Viewing Service Level Reports � Chapter 4
the software that generates the reports. More detailed information about report jobcodes is available in SAS IT Service Level Management: User’s Guide.
Viewing Service Level ReportsAfter creating a report specification and running the Service Level reports, you can
access and view the reports in a Web browser. These HTML reports are accessible fromthe URL that is designated in the corresponding report specification. The designatedURL might be a file path on an internal network or it might reference links on managedWeb servers so that the final report output can be distributed to a wide audience.
Each Service Level report provides tabs and links that help you view service leveldata in various report formats. These report formats are grouped and accessed fromthree possible tabs (Contracts, Compliance, and Servicing Contacts). You can usethese tabs and links to drill down into text-based and graphic reports that offer severalmethods of displaying additional details or switching to a different type of report orobjective. The availability of these tabs varies based on whether the reports are forcontract providers or customers. In addition, the Compliance tab and ServicingContacts tab must be enabled in the report specification in order to be available in thecorresponding reports.
To view the Service Level reports, enter the URL in your Web browser or locate theindex.html file that is in the text directory of the report output location. You designatethe Web address and report output location when creating the report specification.
The reports that are presented below are a sampling of the Service Level reports thatare available in SAS IT Service Level Management.
Reporting on Your SLM Data � Viewing Service Level Reports 83
Contract List ReportThe Contract List report is available from the Contracts tab. This report provides
an overview of service levels for all contracts selected in the report specification. Fromthis report, you can see an overview of how each selected contract performs at varioussummary levels such as daily, weekly, monthly, and yearly. You can also drill down intoeach summary level to explore more detailed reports about each contract. For example,if a data cell in the Contract List report is shaded in a color that indicates poorperformance, you can drill down for more details about that data for each time period.The Contract List report also enables contract providers to sort data by customer nameto help organize and sort the report information.
This report enables you to identify the overall health of the contract, discoverproblem areas by drilling down to more detailed reports, view the notes about acontract, and view the performance of a contract on a daily, weekly, monthly,year-by-week, or year-by-month basis
The following is an example of a Contract List report:
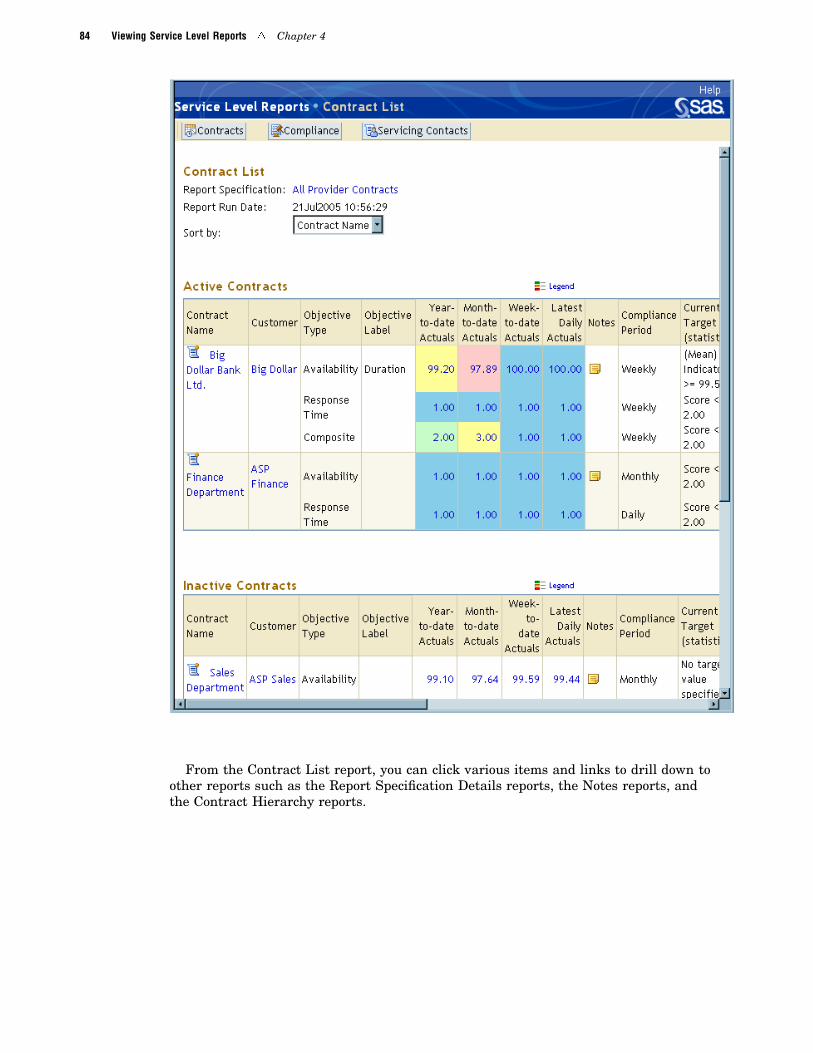
84 Viewing Service Level Reports � Chapter 4
From the Contract List report, you can click various items and links to drill down toother reports such as the Report Specification Details reports, the Notes reports, andthe Contract Hierarchy reports.
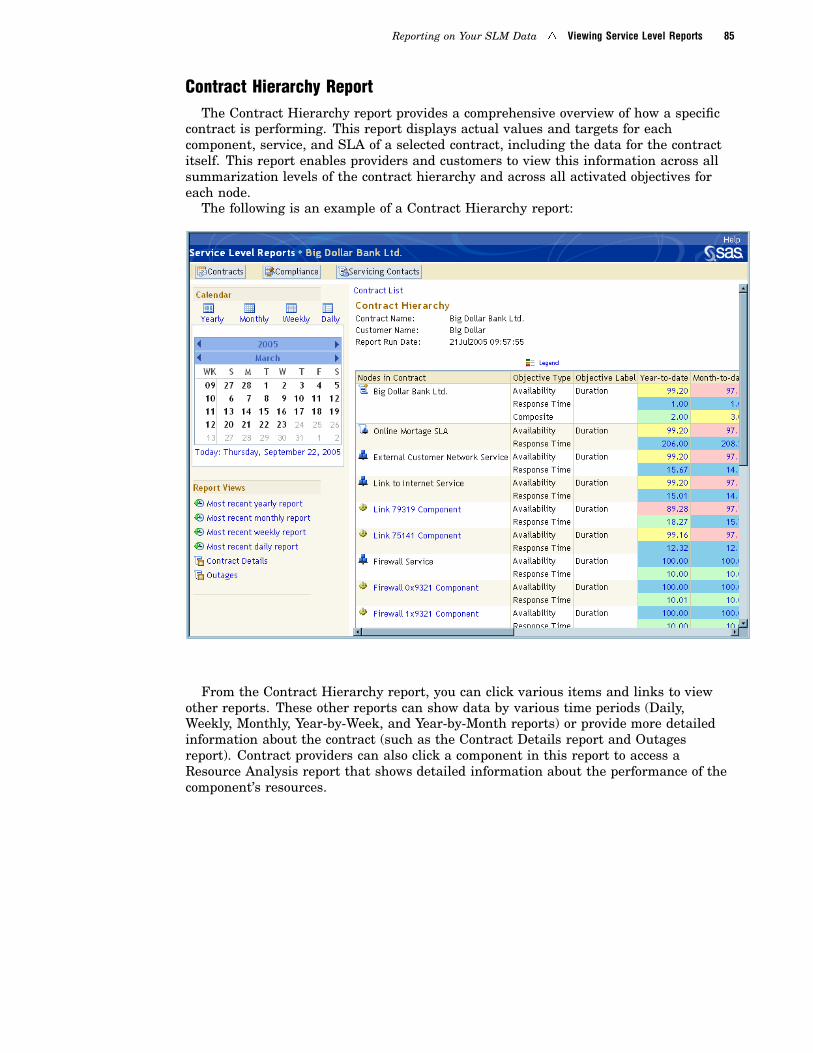
Reporting on Your SLM Data � Viewing Service Level Reports 85
Contract Hierarchy ReportThe Contract Hierarchy report provides a comprehensive overview of how a specific
contract is performing. This report displays actual values and targets for eachcomponent, service, and SLA of a selected contract, including the data for the contractitself. This report enables providers and customers to view this information across allsummarization levels of the contract hierarchy and across all activated objectives foreach node.
The following is an example of a Contract Hierarchy report:
From the Contract Hierarchy report, you can click various items and links to viewother reports. These other reports can show data by various time periods (Daily,Weekly, Monthly, Year-by-Week, and Year-by-Month reports) or provide more detailedinformation about the contract (such as the Contract Details report and Outagesreport). Contract providers can also click a component in this report to access aResource Analysis report that shows detailed information about the performance of thecomponent’s resources.

86 Viewing Service Level Reports � Chapter 4
Daily, Weekly, Monthly, and Yearly ReportsTime-based reports such as the Daily, Weekly, Monthly, and Yearly reports display
target and actual values, enabling you to view how all of the nodes of a contract areperforming for a specified date. Each of these reports presents similar information,differing only in the increments of time over which data is reported. The Daily reportalso displays a graph view of the hourly results for missed targets or outages.
These time-based reports enable you to identify the objectives that are out ofcompliance and drill down to discover the specific dates and times during which targetswere missed. These reports provide several ways to navigate to different levels ofsummary. You can filter these reports by objective type, use the calendar links to selectspecific summary levels, and use the previous and next arrow icons to navigate to adifferent time period at the same summary level. You can also click a graph icon toview a graphic report of the data for the corresponding node. You can then click thereport graph to enlarge the image.
The following is an example of a Daily report:
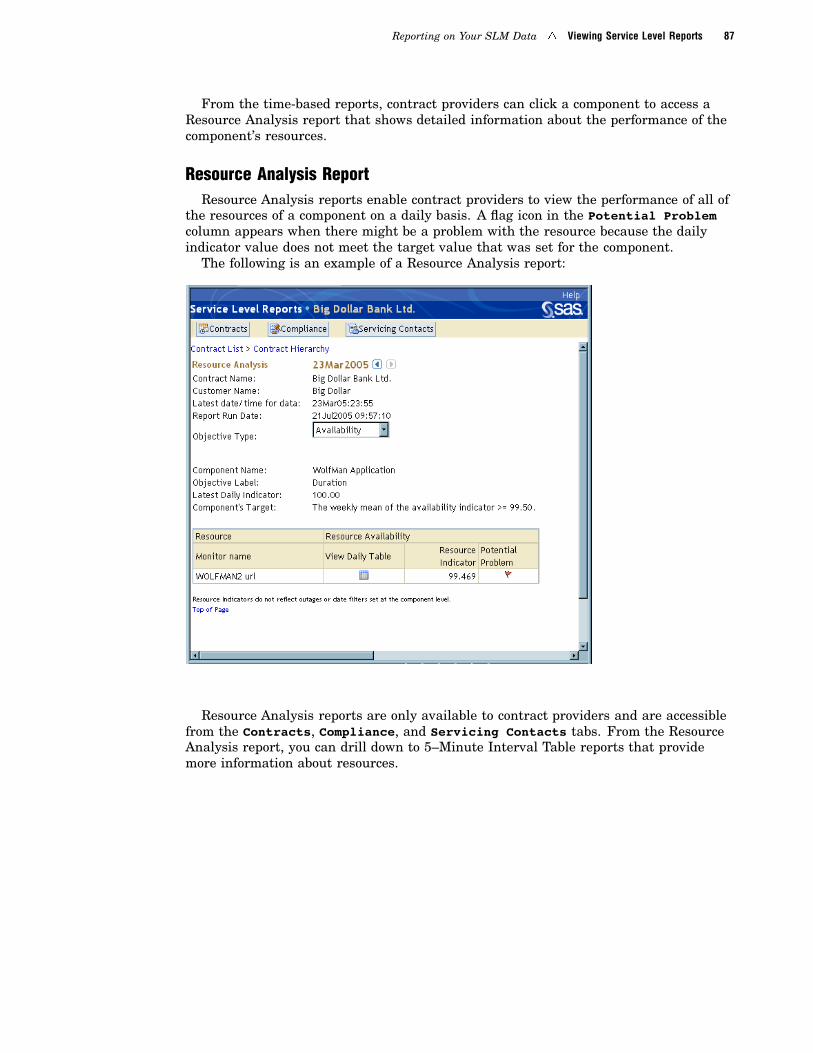
Reporting on Your SLM Data � Viewing Service Level Reports 87
From the time-based reports, contract providers can click a component to access aResource Analysis report that shows detailed information about the performance of thecomponent’s resources.
Resource Analysis ReportResource Analysis reports enable contract providers to view the performance of all of
the resources of a component on a daily basis. A flag icon in the Potential Problemcolumn appears when there might be a problem with the resource because the dailyindicator value does not meet the target value that was set for the component.
The following is an example of a Resource Analysis report:
Resource Analysis reports are only available to contract providers and are accessiblefrom the Contracts, Compliance, and Servicing Contacts tabs. From the ResourceAnalysis report, you can drill down to 5–Minute Interval Table reports that providemore information about resources.
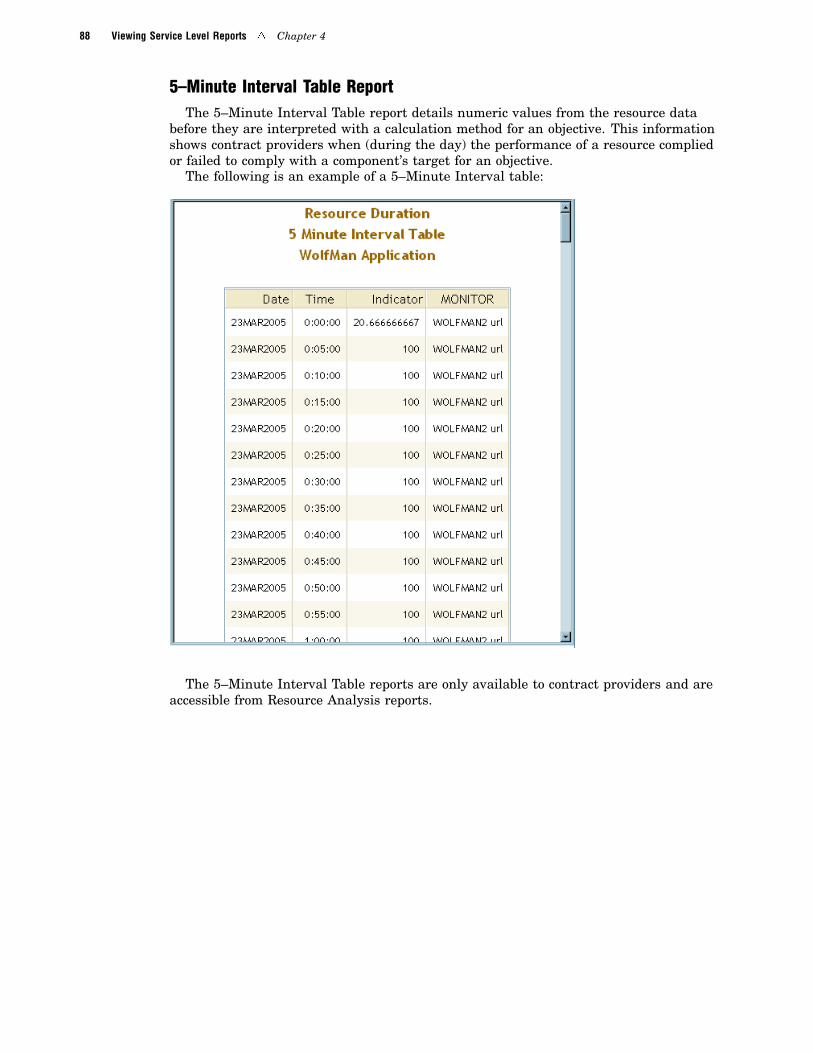
88 Viewing Service Level Reports � Chapter 4
5–Minute Interval Table ReportThe 5–Minute Interval Table report details numeric values from the resource data
before they are interpreted with a calculation method for an objective. This informationshows contract providers when (during the day) the performance of a resource compliedor failed to comply with a component’s target for an objective.
The following is an example of a 5–Minute Interval table:
The 5–Minute Interval Table reports are only available to contract providers and areaccessible from Resource Analysis reports.
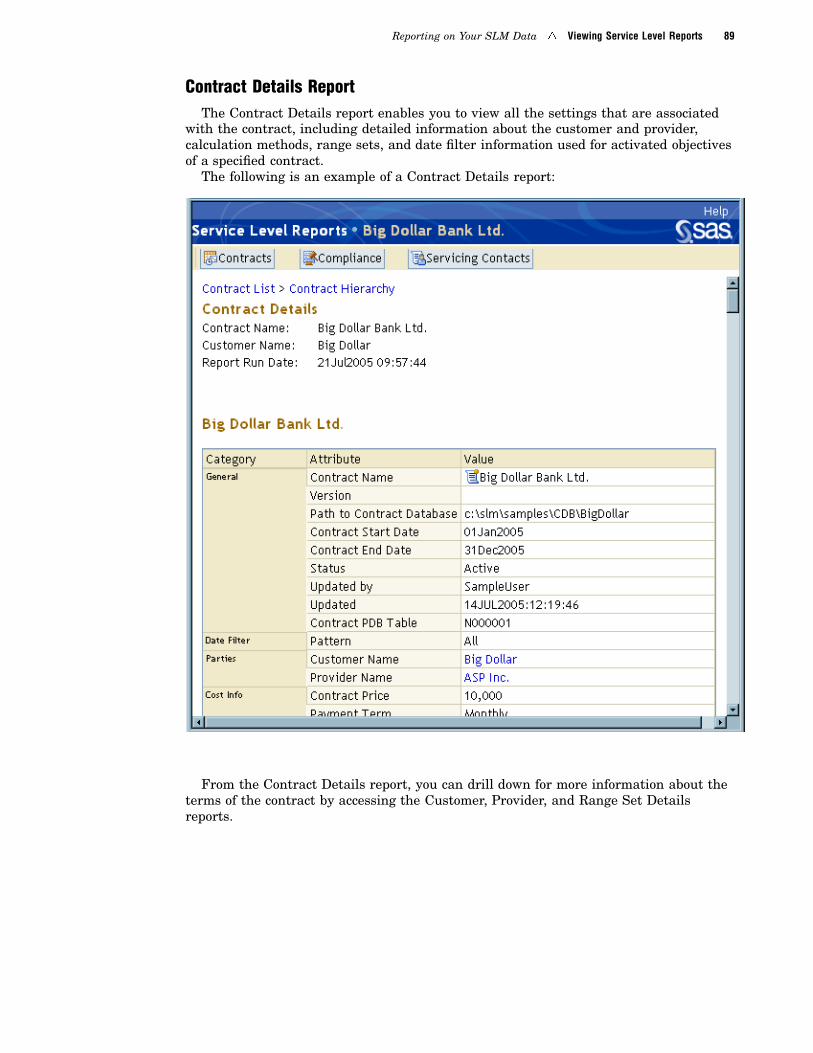
Reporting on Your SLM Data � Viewing Service Level Reports 89
Contract Details ReportThe Contract Details report enables you to view all the settings that are associated
with the contract, including detailed information about the customer and provider,calculation methods, range sets, and date filter information used for activated objectivesof a specified contract.
The following is an example of a Contract Details report:
From the Contract Details report, you can drill down for more information about theterms of the contract by accessing the Customer, Provider, and Range Set Detailsreports.
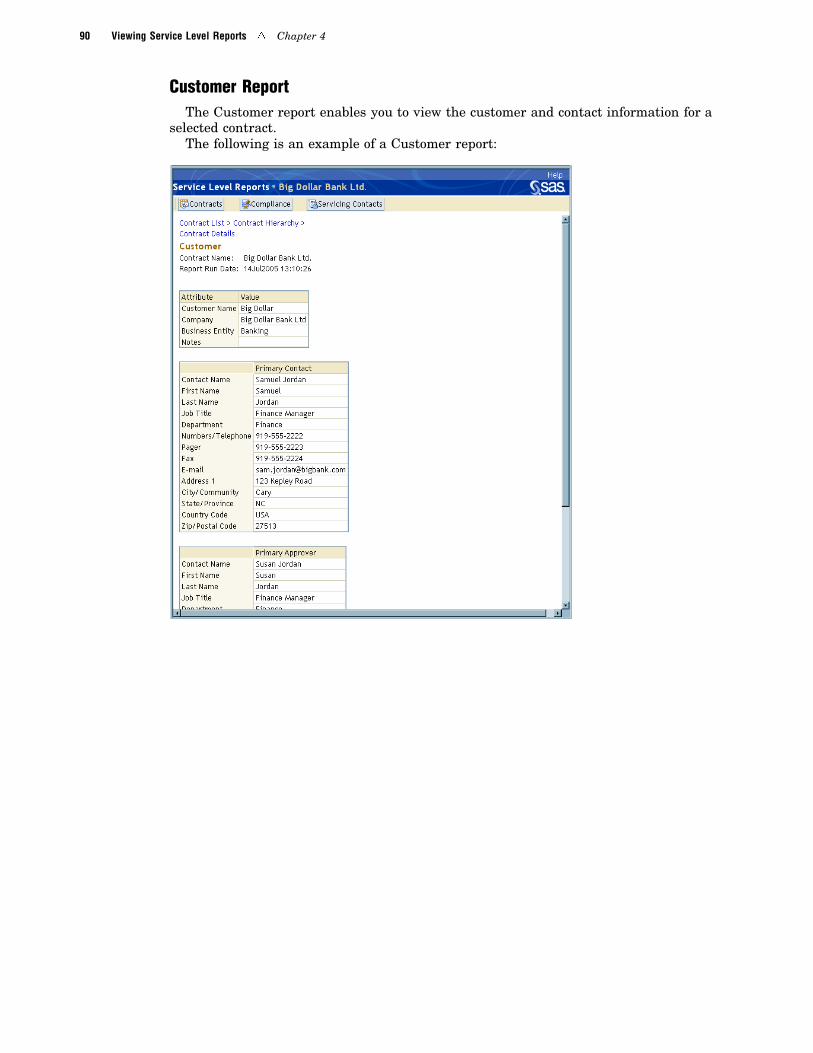
90 Viewing Service Level Reports � Chapter 4
Customer ReportThe Customer report enables you to view the customer and contact information for a
selected contract.The following is an example of a Customer report:
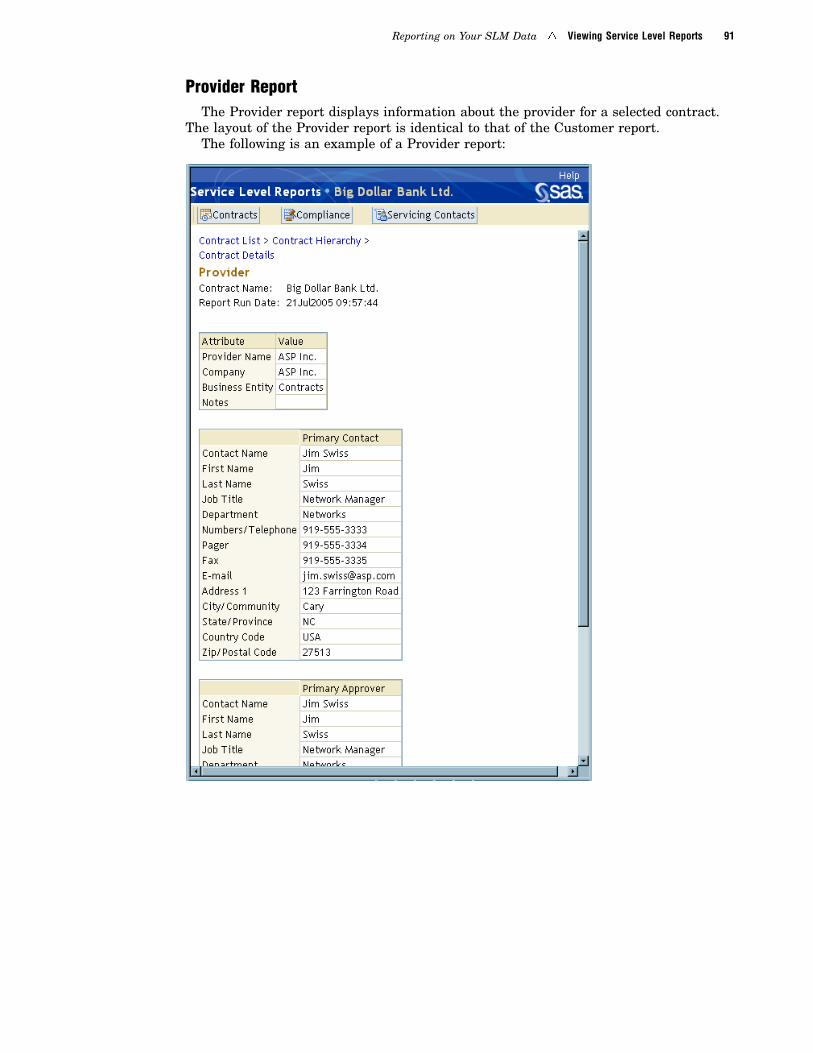
Reporting on Your SLM Data � Viewing Service Level Reports 91
Provider ReportThe Provider report displays information about the provider for a selected contract.
The layout of the Provider report is identical to that of the Customer report.The following is an example of a Provider report:
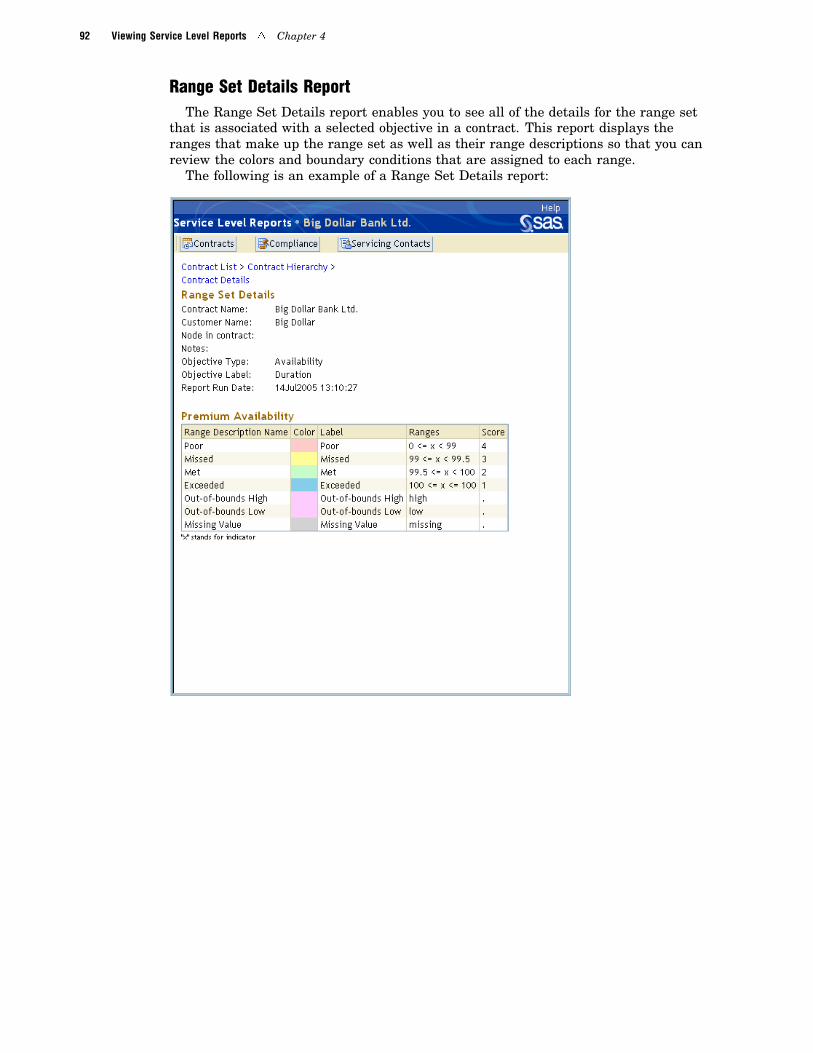
92 Viewing Service Level Reports � Chapter 4
Range Set Details ReportThe Range Set Details report enables you to see all of the details for the range set
that is associated with a selected objective in a contract. This report displays theranges that make up the range set as well as their range descriptions so that you canreview the colors and boundary conditions that are assigned to each range.
The following is an example of a Range Set Details report:
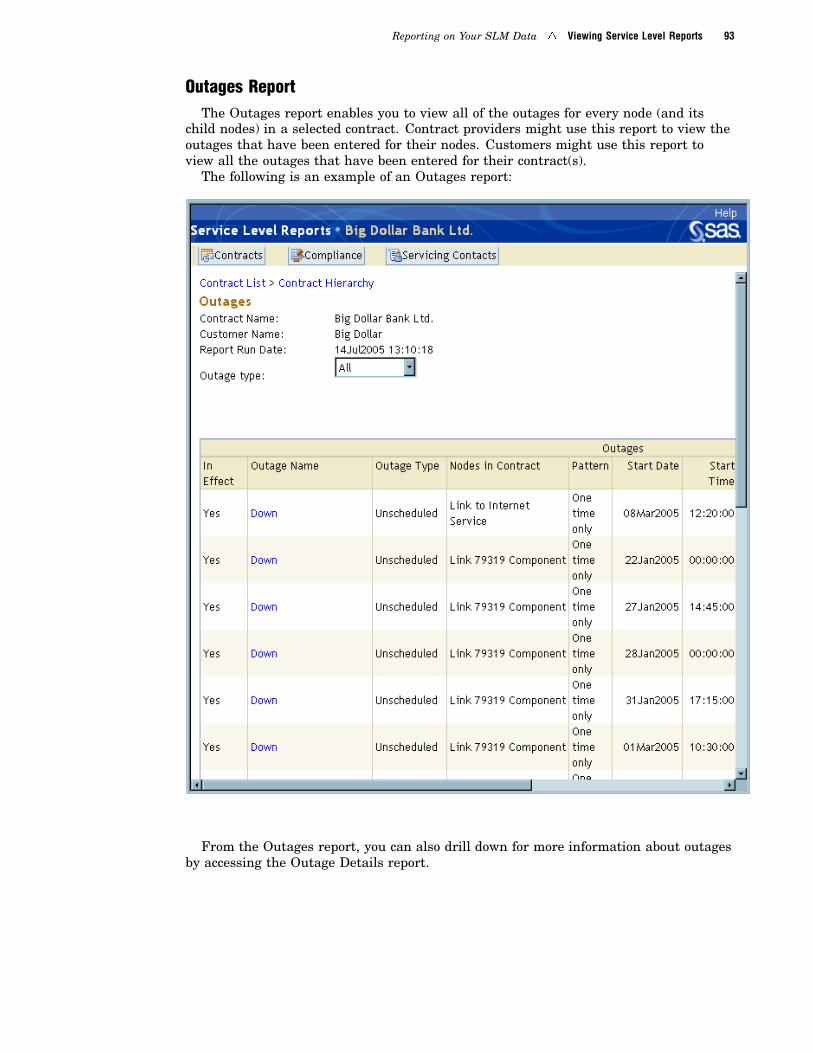
Reporting on Your SLM Data � Viewing Service Level Reports 93
Outages ReportThe Outages report enables you to view all of the outages for every node (and its
child nodes) in a selected contract. Contract providers might use this report to view theoutages that have been entered for their nodes. Customers might use this report toview all the outages that have been entered for their contract(s).
The following is an example of an Outages report:
From the Outages report, you can also drill down for more information about outagesby accessing the Outage Details report.
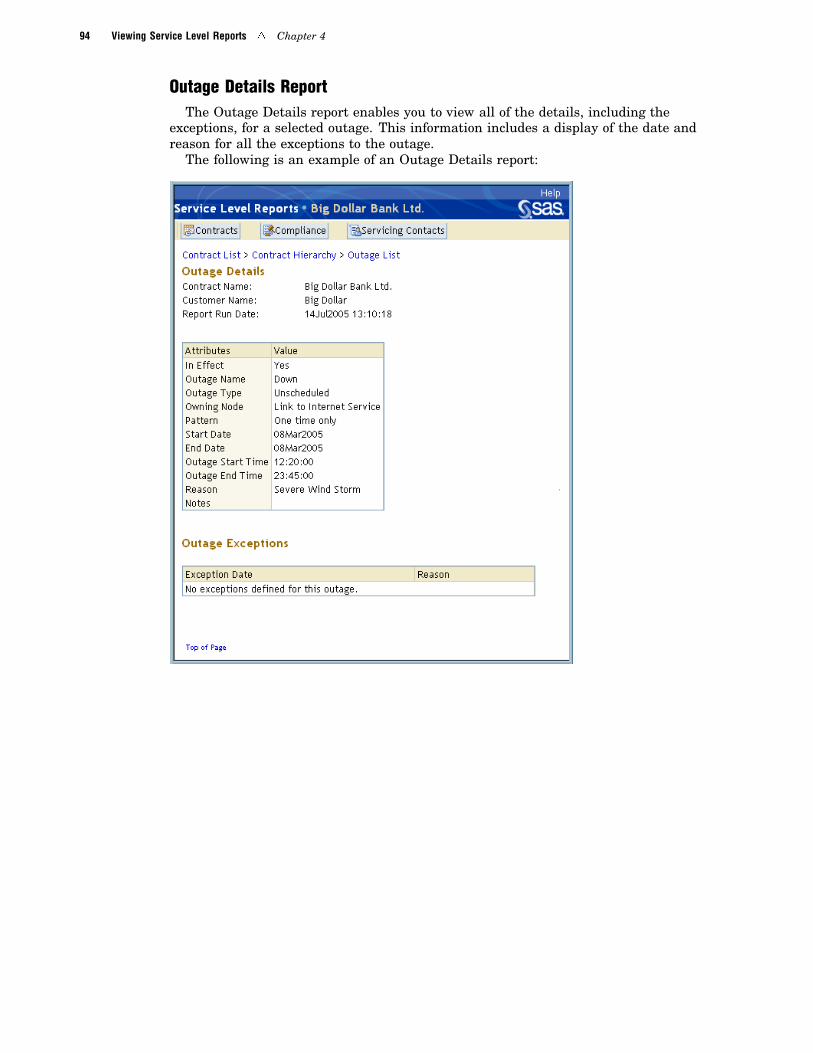
94 Viewing Service Level Reports � Chapter 4
Outage Details ReportThe Outage Details report enables you to view all of the details, including the
exceptions, for a selected outage. This information includes a display of the date andreason for all the exceptions to the outage.
The following is an example of an Outage Details report:
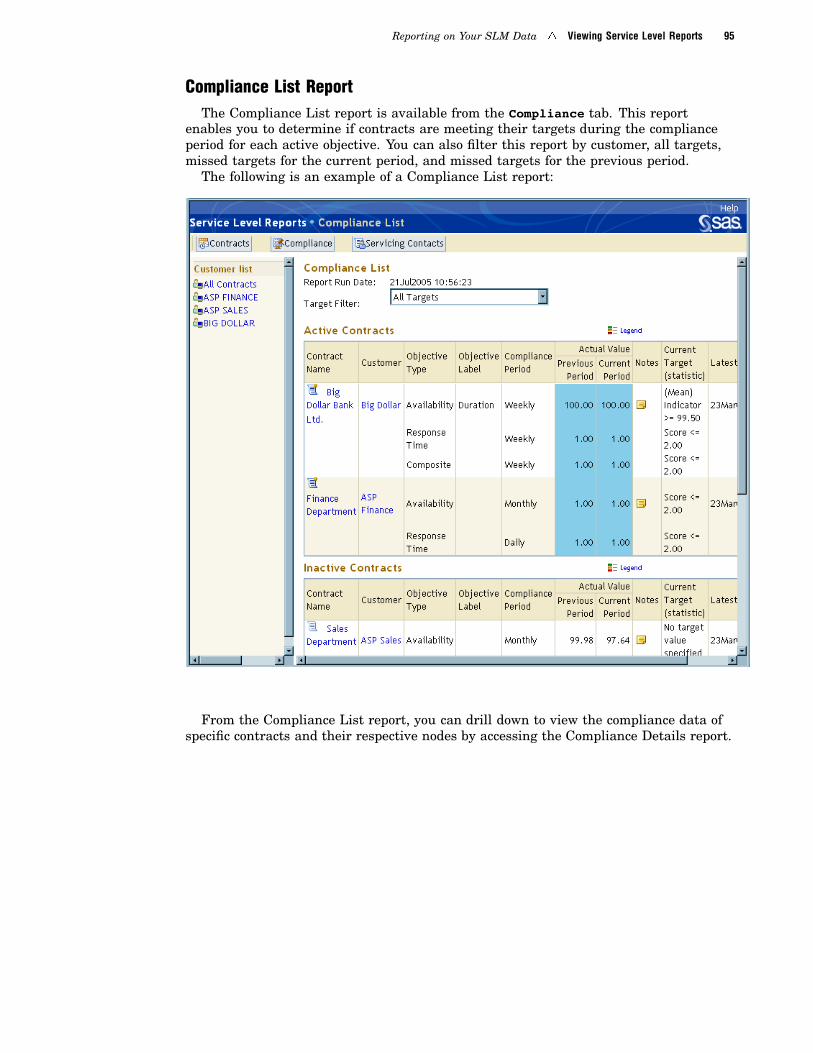
Reporting on Your SLM Data � Viewing Service Level Reports 95
Compliance List ReportThe Compliance List report is available from the Compliance tab. This report
enables you to determine if contracts are meeting their targets during the complianceperiod for each active objective. You can also filter this report by customer, all targets,missed targets for the current period, and missed targets for the previous period.
The following is an example of a Compliance List report:
From the Compliance List report, you can drill down to view the compliance data ofspecific contracts and their respective nodes by accessing the Compliance Details report.
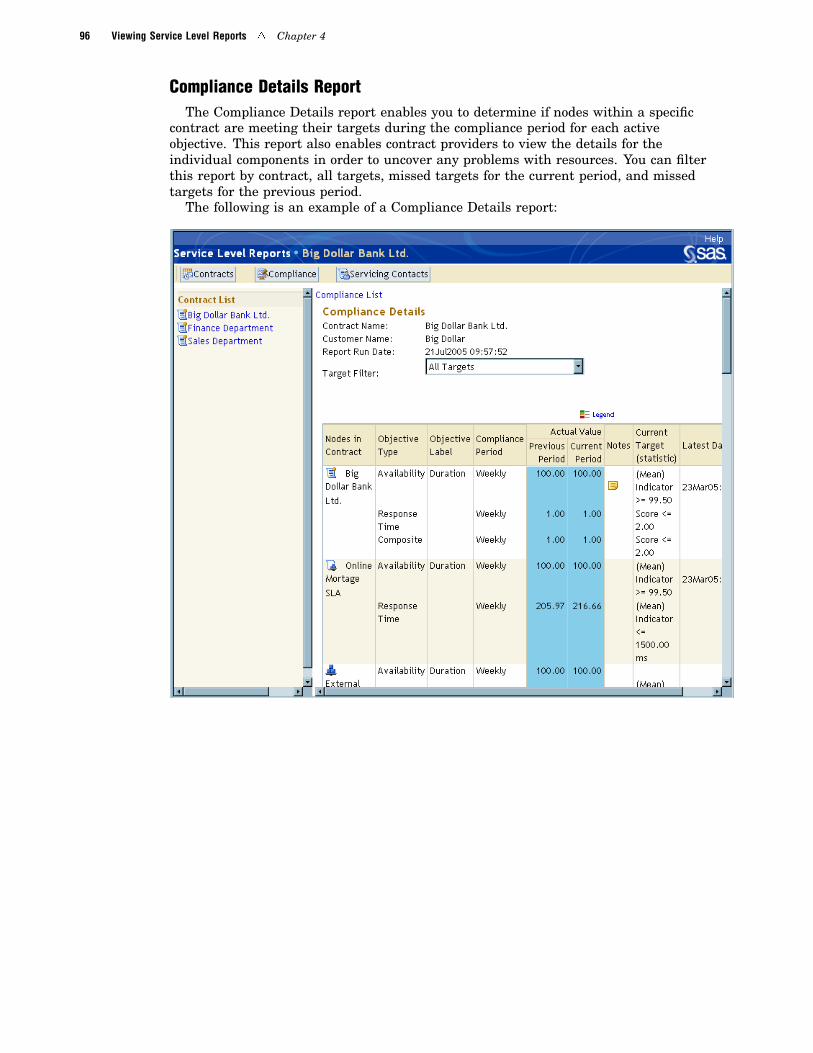
96 Viewing Service Level Reports � Chapter 4
Compliance Details ReportThe Compliance Details report enables you to determine if nodes within a specific
contract are meeting their targets during the compliance period for each activeobjective. This report also enables contract providers to view the details for theindividual components in order to uncover any problems with resources. You can filterthis report by contract, all targets, missed targets for the current period, and missedtargets for the previous period.
The following is an example of a Compliance Details report:

Reporting on Your SLM Data � SAS Enterprise Guide Reports 97
Servicing Contacts ReportThe Servicing Contacts report is available from the Servicing Contacts tab. This
report lists servicing contacts and the compliance data of the contracts for which theservicing contacts have responsibility. The data in this report provides a snapshot ofthe current and previous compliance period, enabling you to view the complianceinformation for contracts that are serviced by a selected contact person or businessentity. You can also filter this report by contact, all targets, missed targets for thecurrent period, and missed targets for the previous period.
The following is an example of a Servicing Contacts report:
SAS Enterprise Guide Reports
SAS Enterprise Guide is a point-and-click Windows application that is packaged withSAS IT Service Level Management. SAS Enterprise Guide provides the followingfeatures:
� an intuitive, visual, customizable interface
� transparent access to data
� ready-to-use tasks for analysis and reporting
� a code editing facility
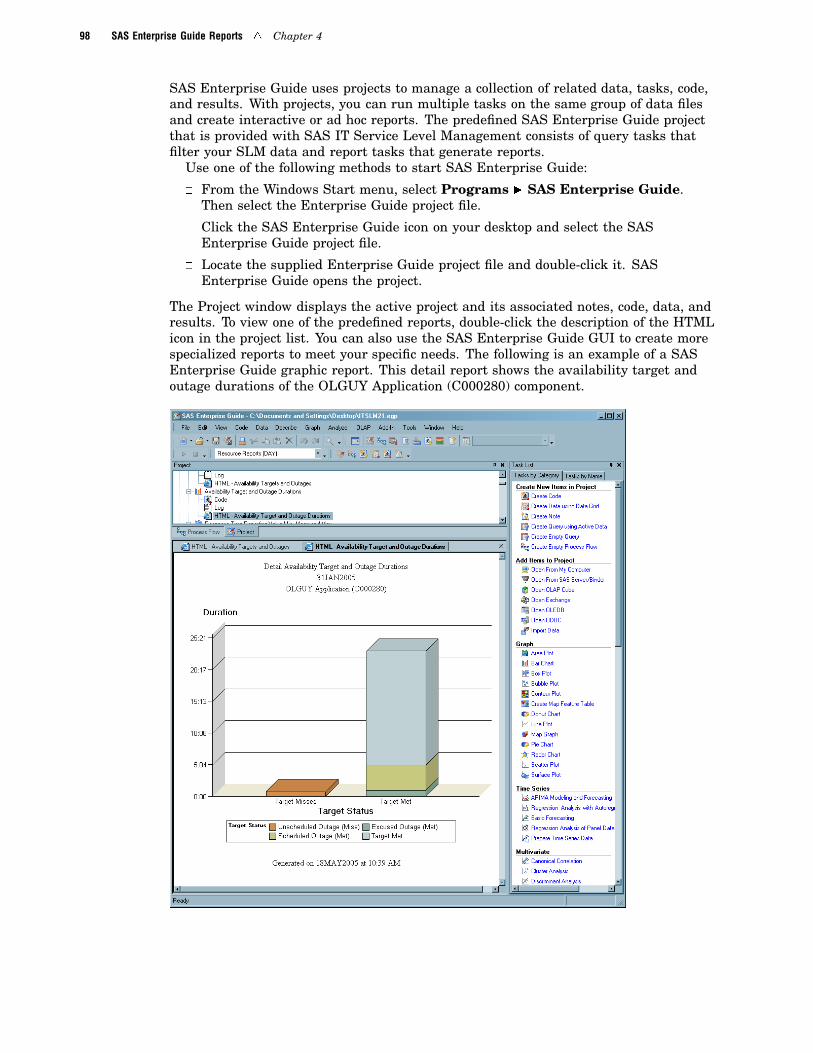
98 SAS Enterprise Guide Reports � Chapter 4
SAS Enterprise Guide uses projects to manage a collection of related data, tasks, code,and results. With projects, you can run multiple tasks on the same group of data filesand create interactive or ad hoc reports. The predefined SAS Enterprise Guide projectthat is provided with SAS IT Service Level Management consists of query tasks thatfilter your SLM data and report tasks that generate reports.
Use one of the following methods to start SAS Enterprise Guide:
� From the Windows Start menu, select Programs � SAS Enterprise Guide.Then select the Enterprise Guide project file.
� Click the SAS Enterprise Guide icon on your desktop and select the SASEnterprise Guide project file.
� Locate the supplied Enterprise Guide project file and double-click it. SASEnterprise Guide opens the project.
The Project window displays the active project and its associated notes, code, data, andresults. To view one of the predefined reports, double-click the description of the HTMLicon in the project list. You can also use the SAS Enterprise Guide GUI to create morespecialized reports to meet your specific needs. The following is an example of a SASEnterprise Guide graphic report. This detail report shows the availability target andoutage durations of the OLGUY Application (C000280) component.
Reporting on Your SLM Data � SAS Enterprise Guide Reports 99
Note: Additional information about using the reporting capabilities of SAS ITService Level Management is provided in SAS IT Service Level Management: User’sGuide. �

100
101
A P P E N D I X
1Recommended Reading
Recommended Reading 101
Recommended Reading
Here is the recommended reading list for this title:� Getting Started with Enterprise Guide� Getting Started with SAS IT Resource Management
� SAS IT Resource Management: User’s Guide� SAS IT Resource Management: Macro Reference� SAS IT Resource Management: Administration and Batch Reporting Course Notes
� SAS IT Resource Management: Interactive Reporting Course Notes� SAS IT Service Level Management: User’s Guide
For a complete list of SAS publications, see the current SAS Publishing Catalog. Toorder the most current publications or to receive a free copy of the catalog, contact aSAS representative at the following address:
SAS Publishing SalesSAS Campus DriveCary, NC 27513Telephone: (800) 727-3228*Fax: (919) 677-8166E-mail: [email protected] address: support.sas.com/pubs* For other SAS Institute business, call (919) 677-8000.
Customers outside the United States should contact their local SAS office.

102
103
Glossary
availabilitythe percentage of time that a system is available to respond to the requests of itsusers.
cataloga group of SLAs, services, components, range sets, and range descriptions that areused to create a contract. These items are stored in five supplied folders (SLAs,Services, Components, Range Sets, and Range Descriptions) that are accessed fromthe Catalog workspace.
componentsoftware, hardware, or any other entity that makes the delivery of an IT servicepossible. A component is also the lowest-level node in the contract hierarchy. Seealso resource, resource list.
composite objectivean objective that combines two or more of the other objective values to determine howwell a particular node is performing. The indicator is calculated from the combinedscores for availability, response time, throughput, and/or custom objective of the node.
contacta person who is designated as having responsibility for some aspect of a contract, anSLA, a service, or a component. See also participant.
contracta collection of data that represents the business relationship between an IT serviceprovider and a customer. The contract contains one or more SLAs, which presentspecific, detailed information about the services that are to be provided. A contract isalso the highest-level node in the contract hierarchy.
contract databasea container that stores time series data that has been through the SAS IT ServiceLevel Management ETL process. This data is used to evaluate whether the objectivesin a contract have been met. See also ETL (extract, transform, load) process.
custom objectivean objective that measures data that doesn’t typically fit within the scope ofavailability, response time, or throughput, such as customer satisfaction or meantime between failures. SAS IT Service Level Management accommodates only onecustom objective per node.
104 Glossary
data source PDB (performance database)a data warehouse that stores time series data that is provided by SAS IT ResourceManagement. This data is used as input to the SAS IT Service Level ManagementETL process. See also ETL (extract, transform, and load) process.
environmentthe server, the environment database, and a set of objects and processes thatfacilitate the server operations of SAS IT Service Level Management. For the SAS ITService Level Management client, the property-value pairs for an environmentdescribe how to connect to the server and access the database. For example, theproperty- value pairs specify information such as the host name, the port, andconnection methods. See also environment database.
environment databasea database that contains objects that are defined in, and used by, SAS IT ServiceLevel Management. The objects include contracts, service level agreements, services,components, customers, and providers. Some of these objects have pointers to otherdatabases. For example, a contract object has a pointer to a contract database, and acomponent object has pointers to as many as three data source PDBs. See alsoenvironment.
ETL (extract, transform, load) processthe process of extracting IT performance data from a data source, transforming thedata, and loading it into a contract database.
excused outagea time period, such as during a power outage, when a node (and its child nodes) inthe contract hierarchy was unavailable without fault from the service provider. Anexcused outage reduces the amount of time that a service provider is accountable forproviding service. Corresponding service level indicators during this time period aredisplayed as missing and are ignored. See also scheduled outage, unscheduled outage.
hierarchyan arrangement of nodes into levels that are based on parent-child relationships.Members of a hierarchy are arranged from more general to more specific. Forexample, in SAS IT Service Level Management, a simple contract hierarchy mightconsist of nodes that represent the contract at the highest level, the SLAs as childnodes of the contract, the services and components covered by each SLA as childnodes of the SLAs, and the components and contributory services that comprise eachservice as child nodes of those services.
indicatora representation of the performance of an objective that is being measured, expressedas a numeric value.
metricany standard of measurement that is used as a basis for evaluation or comparison.For example, bytes per second throughput is a common service level or performancemetric.
nodea collection of data that describes one of the software objects that form the structureof an IT service contract. A graphic representation of one of these objects is alsoreferred to as a node. The four types of measurable nodes in the contract hierarchyinclude components, services, service level agreements, and the contract itself.
objectiveany of several aspects of service that are measured in order to arrive at one or morevalues for one or more indicators. Each node can have the following types of
Glossary 105
objectives, which are based on the data from the node’s child nodes or peer objectives:availability, response time, throughput, custom objective, and composite.
outagea time period during which a node in the contract hierarchy is not available.
outage exceptiona deviation in an outage pattern. For example, if an outage is defined to recur everyFriday, an outage exception is set for the last Friday in the month if no outage isexpected to occur on that day. See outage.
participanta provider, customer, or other contact who is specified as being involved in a contract.Participants are defined in the Participants workspace.
rangea defined interval with distinct lower and upper boundaries that serve to collect ordistinguish data values. Ranges are combined to form range sets. See also range set.
range descriptiona descriptor that assigns a report color and label to a range classification within arange set. For example, a range description might define all ranges that exceedexpectations to appear in reports as green and be labeled "Exceeded." There are sixsupplied range descriptions (Exceeded, Met, Missed, Missing Value, Out-of-boundsHigh, and Out-of-bounds Low). Three of the supplied range descriptions (MissingValue, Out-of-bounds High, and Out-of-bounds Low) are fixed and cannot be deleted.
range seta table that contains two or more ranges of probable service level measurements fora node, along with scores, colors, and/or descriptions for each of the ranges. See alsorange, score.
report specificationa report definition file that contains the many configuration options that the contractprovider sets for generating a specific report.
resourcean item of hardware or software or any other entity for which data is collected andwhich, alone or with other resources, makes up a component. See also resource list,component.
resource lista list of all the entities that comprise a component. The resource list also specifieswhich data is extracted from the data source PDB to calculate indicators for acomponent node’s objectives. (By contrast, all other nodes extract data from childnodes.) See also resource, component.
response timethe amount of time to service a request.
scheduled outagea predetermined and accepted time period, such as during a routine maintenanceevent, when a node (and its child nodes) in the contract hierarchy is expected to beunavailable. A scheduled outage reduces the amount of time that a service provideris accountable for providing service. Corresponding service level indicators duringthis time period are displayed as missing and are ignored. See also excused outage,unscheduled outage.
scorea numeric value that is derived by comparing a service level indicator to previouslydefined range sets. Scores are useful for comparing unlike measurements. For
106 Glossary
example, response time for a help desk is measured in minutes, and response timefor a hard drive is measured in milliseconds. If you combine these response times ina calculation of response time for a service, an SLA, or a contract, the result ismeaningless. Using range sets to transform the dissimilar measurements intocompatible scores facilitates such calculations and leads to useful and accurateresults. See also range set.
servicea service that an IT organization provides to customers. IT services can includesupport for computer systems, networks, applications, telephones, fax machines, andWeb pages, as well as other types of software and hardware services. A service isalso a node in the contract hierarchy that organizes other service nodes andcomponent nodes in the hierarchy.
service level agreementSee SLA (service level agreement).
service level contractSee contract.
service level managementSee SLM (service level management).
servicing contacta person or entity who is assigned the responsibility for a given node in the contract.Additionally, the servicing contact might receive e-mail notifications about missedtargets. See contact.
SLA (service level agreement)an agreement between an IT provider and a customer. The SLA specifies theperformance goals for each service that the provider delivers. For example, goals foravailability, response time, throughput, and a custom objective are often included inSLAs. An SLA is also a node in the contract hierarchy that organizes componentnodes, service nodes, and other SLA nodes in the hierarchy.
SLI (service level indicator)See indicator.
SLM (service level management)a concept of IT service delivery that emphasizes the close alignment of IT services tothe needs of customers. Clear definitions of service level objectives, frequentmeasurements of service levels, and meaningful reports help to ensure that ITcustomers experience high levels of service.
SLO (service level objective)See objective.
targeta numeric value that represents the performance goal for a node that is beingmeasured.
throughputthe rate at which requests for work are serviced by a computer system.
unscheduled outagea time period, such as during a server failure, when a node in the contract hierarchyis not available. This type of outage incurs a penalty value of zero for the availabilityobjective of the affected nodes during the outage time period. See also excusedoutage, scheduled outage.

Index 107
Index
Numbers5-Minute Interval Table report 88
Aadjusting data 19availability 5, 14
BBaseline reports 9, 70
Daily Data report 73generating 70Monthly Data report 76viewing 71Weekly Data report 74
business needs 3, 5
Ccatalog items
components 52creating 47range descriptions 48range sets 49service level agreements (SLAs) 60services 59
Catalog workspace 36client/server architecture 7Compliance Details report 96Compliance List report 95Compliance tab 77component nodes 12, 14components 52composite objectives 5, 14contacts 43
Servicing Contacts report 97Servicing Contacts tab 78
contract database 8Contract Details report 89contract hierarchy 8, 12Contract Hierarchy report 85Contract List report 83contract nodes 12, 13Contract Provider reports 78contract providers 3, 46
Contract window 62Contract workspace 36, 61contracts 5
adding participants 42business needs 5catalog items 47constructing 38creating 61data collection tools 6data sources 39data storage location 6format 6measurable service goals 5measurement techniques 5measurement type 6problems with 6reporting periods and methods 5representations of 8server connections 39
Contracts tab 77custom objectives 5, 14Customer reports 78, 90customers 3, 44
DDaily Data report 73Daily report 86data adjustments 19data collection tools 6data extraction 20data format 6data sources 39, 42data storage location 6Data workspace 38disparate data 8
EEnterprise Guide reporting 9, 97environment 30
editing 31properties for 32
environment database 7environmental data 30ETL
running 68
ETL process 7, 20data extraction 20downward flow of instructions 20service level calculations 20, 23summary of 26upward flow of instructions 23
extract, transform, and load processSee ETL process
extracting data 20
FFive-Minute Interval Table report 88format of data 6
Gglobal settings 79goals
measurable service goals 5SLM goals 3
GUI 10constructing contracts 38navigation 33starting 30workspaces 35
Hhierarchy tree pop-up menus 35
Iindicators 14
categorizing 16ranges of values 16
IT services 2continuous improvement of 3value of 3
Llogging on 31
108 Index
Mmeasurable service goals 5measurement techniques 5
measurement type 6menu bar 34
menus 35Monthly Data report 76
Monthly report 86
Nnavigation 33
nodes 8component nodes 12, 14
contract nodes 12, 13service level objectives for 14
service nodes 12, 13SLA nodes 12, 13
Oobjectives
composite 5, 14custom 5, 14
service level 14Outage Details report 94
outagesdata adjustments for 19
Outages report 93
Pparticipants
adding 42
contacts 43customers 44providers 46
Participants workspace 37pop-up menus 35
Provider report 91providers 3, 46
Contract Provider reports 78
Rrange descriptions 15, 48Range Set Details report 92
range sets 16, 49ranges 16
report global settings 79report job code 81report specifications 80reporting 9, 69
Baseline reports 9, 70Enterprise Guide reporting 9, 97methods 5Service Level reports 9, 77
reporting periods 5Reports workspace 38, 78Resource Analysis report 87resource lists 14response time 5, 14
SSAS Enterprise Guide reports 9, 97SAS IT Charge Management 10SAS IT Management Solutions 10SAS IT Resource Management 10SAS IT Service Level Management 1, 7
closing 68scores 14, 17server connections 39, 40service goals 5service level agreements (SLAs) 5, 60service level calculations 11
downward flow of ETL instructions 20upward flow of ETL instructions 23
service level management (SLM) 2business needs and 3contract problems 6contracts 5goals of 3implementing 4need for 2ongoing activities 4
service level objectives 14indicators 14range descriptions 15ranges and range sets 16scores 17targets 18
Service Level reports 9, 775-Minute Interval Table report 88Compliance Details report 96Compliance List report 95Compliance tab 77Contract Details report 89Contract Hierarchy report 85Contract List report 83Contract Provider reports 78Contracts tab 77
Customer reports 78, 90Daily report 86generating 79generating interactively 81generating with code 81Monthly report 86Outage Details report 94Outages report 93Provider report 91Range Set Details report 92report global settings 79report specifications 80Reports workspace 78Resource Analysis report 87Servicing Contact report 97Servicing Contacts tab 78viewing 82Weekly report 86Yearly report 86
service nodes 12, 13services 59Servicing Contact report 97Servicing Contacts tab 78SLA nodes 12, 13SLAs (service level agreements) 5, 60SLM
See service level management (SLM)
Ttabs 35targets 18Task list 35throughput 5, 14toolbar 34
WWeekly Data report 74Weekly report 86workspaces 35
Catalog 36Contract 36, 61Data 38Participants 37Reports 38, 78
Workspaces list 35
YYearly report 86
Your Turn
If you have comments or suggestions about Getting Started with SAS IT Service LevelManagement 2, please send them to us on a photocopy of this page, or send uselectronic mail.
For comments about this book, please return the photocopy to
SAS PublishingSAS Campus DriveCary, NC 27513E-mail: [email protected]
For suggestions about the software, please return the photocopy to
SAS Institute Inc.Technical Support DivisionSAS Campus DriveCary, NC 27513E-mail: [email protected]

s
SAS Publishing gives you the tools to flourish in any environment with SAS®!
Whether you are new to the workforce or an experienced professional, you need a way to distinguish yourself in this rapidly changing and competitive job market. SAS Publishing provides you with a wide range of resources, from software to online training to publications to set yourself apart.
Build Your SAS Skills with SAS Learning EditionSAS Learning Edition is your personal learning version of the world’s leading business intelligence and analytic software. It provides a unique opportunity to gain hands-on experience and learn how SAS gives you the power to perform.
s u p p o r t . s a s . c o m / L E
Personalize Your Training with SAS Self-Paced e-LearningYou are in complete control of your learning environment with SAS Self-Paced e-Learning! Gain immediate 24/7 access to SAS training directly from your desktop, using only a standard Web browser. If you do not have SAS installed, you can use SAS Learning Edition for all Base SAS e-learning.
s u p p o r t . s a s . c o m / s e l f p a c e d
Expand Your Knowledge with Books from SAS PublishingSAS Press offers user-friendly books for all skill levels, covering such topics as univariate and multivariate statistics, linear models, mixed models, fixed effects regression and more. View our complete catalog and get free access to the latest reference documentation by visiting us online.
s u p p o r t . s a s . c o m / p u b s
SAS and all other SAS Institute Inc. product or service names are registered trademarks or trademarks of SAS Institute Inc. in the USA and other countries. ® indicates USA registration. Other brand and product names are trademarks of their respective companies. © 2005 SAS Institute Inc. All rights reserved. 345193US.0805