getting started in atpdesigner · neplan . it is recommended to study the atpdesigner help file and...
TRANSCRIPT

Power Engineering Saar
Institute of Electrical Power Engineering
Getting Started in ATPDesigner
Graphical User Interface to the ATP – the
Alternative Transients Program

Getting Started in ATPDesigner – www.atpdesigner.de 21.07.2014
Page 2 of 46 Pages
Content 1 Getting Started in Simulating Electrical Power Networks ............................................ 4
1.1 ATPDesigner – Vision of a Graphical User Interface ............................................... 5
1.2 ATPDesigner – Developped for Existing and Future Windows OS ......................... 6
1.3 ATPDesigner and ATP - A Powerful Team for Power Engineering ......................... 6
1.4 Files and File Extensions ............................................................................................... 8
1.5 Error Statistics of the .LST-File ....................................................................................... 9
2 ATPDesigner – Multiple Views for Power Networks and Diagrams ........................... 12
2.1 Main Menu ................................................................................................................. 12
2.2 Toolbar for Diagrams ................................................................................................. 14
2.3 Toolbar for Network Elements .................................................................................. 14
3 Design of the Electrical Power Network ...................................................................... 15
3.1 Creating a New Power Network ........................................................................ 15
3.1.1 Nodes, Node Names and Snap-Points ............................................................ 15
3.1.2 Delete all Network Elements of a Power Network ......................................... 16
3.1.3 Adding, Deleting, Moving, Rotating, … Network Elements .......................... 16
3.1.4 Select One or More Network Element ............................................................. 17
3.1.5 Rotating a Network Element ............................................................................. 17
3.2 How to Delete the Elements of the Default Power Network ? ...................... 18
3.3 List of Network Elements ........................................................................................... 19
3.4 Changing the Settings of Network Elements ......................................................... 20
3.4.1 OK ......................................................................................................................... 20
3.4.2 Cancel .................................................................................................................. 20
3.4.3 Default .................................................................................................................. 20
3.4.4 Help ....................................................................................................................... 21
3.5 .NET-File – Container of the Power Network .......................................................... 21
3.6 Integrated File Browser ........................................................................................ 22
3.7 Program Settings ................................................................................................ 23
4 Using ATP to Calculate Voltages, Currents, Energy, … ............................................. 24
4.1 Starting to Simulate Power Networks ................................................................ 24
4.2 Processing .PL4- or COMTRADE-File to Create Diagrams .................................... 25
4.3 Open a .PL4-File to Create a Diagram ................................................................... 26
4.3.1 How to Select a Signal to be Displayed in a Diagram ? ............................... 27
4.3.2 How to Deselect a Signal ? ............................................................................... 27
4.3.3 Most easy way to create a Diagram using Toolbar Buttons ......................... 27
4.4 Creating a Probe based Diagram .......................................................................... 30
4.5 Signal Analysis Methods ............................................................................................ 31

Getting Started in ATPDesigner – www.atpdesigner.de 21.07.2014
Page 3 of 46 Pages
4.5.1 Diagram Settings .......................................................................................... 31
4.5.2 DFT (f) - Amount and Phase of the Fundamental Frequency ............... 32
4.5.3 Harmonics – Presenting the Harmonic Frequencies in Addition ........... 33
4.5.4 Spectrum – Frequency Spectrum Presented as a Bar Diagram ........... 34
5 Library of Network Elements .......................................................................................... 36
6 ATPDesigner - Web Services .......................................................................................... 37
7 Short Circuit Analysis Results ................................................................................... 38
7.1 Why Stationary Network Analysis Doesn’t Contain Transient Phenomena ? .... 38
7.2 Results of the Stationary Network Analysis ............................................................. 38
7.3 How to Start the Short Circuit Analysis ? ................................................................. 40
7.4 Moving the Short Circuit Results Tooltips to Other Positions ................................. 40
7.5 Saving the Current Position and Size of the Short Circuit Results Tooltips .......... 42
7.6 Restoring the Position and Size of the Short Circuit Results Tooltips .................... 42
7.7 Update – Recalculating the Short Circuit Results .................................................. 43
7.8 Resizing the Dialog Short Circuit Results ................................................................. 43
7.9 Content of the Short Circuit Results Tooltips .......................................................... 44
7.10 Probes – Definition Protection Elements and Nominal Voltages ...................... 45

Getting Started in ATPDesigner – www.atpdesigner.de 21.07.2014
Page 4 of 46 Pages
1 Getting Started in Simulating Electrical Power Networks
ATPDesigner is a Control Center for the Interactive Design and the Simulation of
Electrical Power Networks. ATPDesigner is not a network simulation program, but can
be used as a graphical pre-processor to the ATP (Alternative Transients Program)
version of the Electromagnetic Transients Program (EMTP). ATPDesigner is approved to
operate on Windows XP, Windows 2000, Windows NT, Windows 7 (32 and 64Bit),
Windows 8 (64Bit) and Windows 8.1 (64 Bit). The operation under Windows 9x can be
not guaranteed. In addition ATPDesigner provides also the user analyzing short-circuits,
faults, disturbances, etc. in electrical power networks.
ATPDesigner provides the user
to design electrical power networks,
to create a graphical view of the power network (“single-phase diagram”),
to manage the settings of the equipment of the power network,
to create diagrams of voltages and currents,
to analyze voltages and currents using signal analysis methods,
to calculate the frequency spectrum of voltages and currents,
to read, write and process COMTRADE files,
to test protection relays,
to simulate the real-time behavior of protection relays,
to create libraries of network elements and
to do a lot of things more in the field of power engineering.
ATPDesigner also provides data interfaces to other simulation tools e.g. Simplorer or
NEPLAN.
It is recommended to study the ATPDesigner Help File and the number of test cases
which are part of the ATPDesigner setup.

Getting Started in ATPDesigner – www.atpdesigner.de 21.07.2014
Page 5 of 46 Pages
1.1 ATPDesigner – Vision of a Graphical User Interface
Without any doubt the ATP is one of the best or maybe the best CAE (Computer Aided
Engineering) tool in the world to study the transient phenomena of electrical power
networks. But also without any doubt the ATP is difficult to use.
Figure 1: ATPDesigner – Graphical User Interface to the ATP
ATP users need a lot of experience to work with ATP. Therefore some years ago the
vision was born to design and develop a graphical user interface to the ATP for
Windows operating systems, which shall make it possible to use the ATP with a minimum
of ATP specific knowledge. Figure 1 shows the graphical user interface of ATPDesigner.
It shall be also possible for the students of electrical engineering to use the capabilities
of the ATP for their exercises and projects after some day’s initial training. It shall be
especially of interest for students of electrical power engineering
Various network elements e.g. overhead lines or transformers are prepared as
templates and can be used very easy to design 3-phase and 1-phase power networks.
All network elements are defined from the electrical engineering point of view. The
knowledge of the geometrical and physical data of the network elements are
sufficient to specify the required settings. Internal, only ATP related settings are
predefined and invisible for the ATPDesigner user. Neither detailed knowledge in
modelling power network elements nor detailed knowledge about the ATP and the
ATP rules are required, if ATPDesigner will be used as the graphical user interface.
Nevertheless for special purposes it may be of interest to study also the relevant
documentation of the ATP Rule Book. The help file of ATPDesigner contains also some

Getting Started in ATPDesigner – www.atpdesigner.de 21.07.2014
Page 6 of 46 Pages
extracts of the ATP Rule Book to improve the understanding of the settings, which are
required to specify high-sophisticated models of electrical equipment of power
networks.
ATPDesigner doesn’t provide 100% of the capabilities of the ATP. Therefore for special
purposes it is also possible to include a “hand-maded” ATP data case into the
ATPDesigner created power network, which will be stored in the .ATP-file. ”Hand-
maded” means, that the user has written this ATP data case outside ATPDesigner e.g.
using a text editor but according the rules specified in the ATP Rule Book. The network
element External .ATP-File has been foreseen to include very easily any “hand-
maded” ATP data case in any ATPDesigner power network.
1.2 ATPDesigner – Developped for Existing and Future Windows OS
Following the intuitive design of Windows based software tools to minimize the initial
training of the users, ATPDesigner was and will be further developed using C++, classes,
threads, background tasks. The use of a high sophisticated development tool
guarantees an extremely high stability of the ATPDesigner application software and
the continuous evolution of ATPDesigner in the future.
ATPDesigner has been and will be further developed using the development tool
Microsoft Visual Studio. Therefore ATPDesigner can participate in all future evolutions
of the Windows based software world. It can be also expected, that ATPDesigner will
operate not only on the existing Windows operating systems but also on all Windows
operating systems coming in the future.
1.3 ATPDesigner and ATP - A Powerful Team for Power Engineering
ATPDesigner is not a network simulation system, but “only” a graphical user interface
with a lot of features to provide the user to simulate and analyze the stationary and
transient behavior of electrical power networks.
The simulation of electrical power networks requires the ATP in addition to ATPDesigner.
The ATP (Alternative Transients Program) version of the ATP-EMTP is the world-wide
mostly used universal program for digital simulation of electromagnetic transients in
power systems has extensive modelling capabilities. The network simulation system ATP
is designed and will be further developed to simulate single- and multi-phase electrical
power networks. ATP is very well prepared to calculate voltages and currents of 3-
phase electrical power networks. It can be used to simulate high-frequency transient
phenomena as well as stationary short circuits. In addition ATP supports a lot of network
elements, linear and nonlinear impedances and mathematical methods to design a
model of the electrical power network.
Figure 2 shows the interaction between ATPDesigner and the ATP and ATPDesigner
and the rest of the software world. ATPDesigner exchanges all relevant data to the
ATP and to other software tools using text files and binary files. The different file types
can be easily identified, because the file name of each of these file types consists of
a specific File Extension.

Getting Started in ATPDesigner – www.atpdesigner.de 21.07.2014
Page 7 of 46 Pages
Figure 2: Interaction between ATPDesigner and ATP

Getting Started in ATPDesigner – www.atpdesigner.de 21.07.2014
Page 8 of 46 Pages
1.4 Files and File Extensions
.INI
The .INI-file contains the Program Settings which are stored independent of the data
of the electrical power network. The .INI-file will be automatically saved to the hard
disk during the shutdown of ATPDesigner and automatically read during the startup.
Please Note:
The re-creation of the .INI-file has no influence of the data of the power network
which are saved in the corresponding .NET-file.
The COMTRADE based Equations are stored in the .INI-file and will be lost if the
.INI-file was deleted.
The Program Settings dialog can be opened via the main menu Tools, sub menu
Program Settings.
.NET
The .NET-file contains all data of the electrical power network: electrical, mechanical
and graphical data e.g. size and coordinates of all network elements. Bitmaps are also
saved in the .NET-files. All other files described below can be generated based on the
information of the .NET-file. Therefore it is only necessary to save the .NET-file.
Read also .NET-File – Container of the Power Network
.ATP
The .ATP-file is the ATP input file and contains the control commands for the ATP. The
.ATP-file will be created by ATPDesigner based on the information and data stored in
the .NET-file.
.LST
The .LST-file will be generated by ATP and contains a copy of the control commands
and additional comments, error messages, etc. In case of any error the .LST-file must
be checked for a deeper error analysis. Please read the ATP Rule Book for more
information. ATPDesigner reads the .LST-file after the simulation process has been
finalized and analyses the warnings and error messages contained in the .LST-file. The
result of this analysis will be presented to the user. In addition ATPDesigner displays all
error messages created from the ATP during the simulation process in message boxes
using the original error message of the ATP.

Getting Started in ATPDesigner – www.atpdesigner.de 21.07.2014
Page 9 of 46 Pages
Figure 3: Error Message of the ATP displayed in a Message Box
.PL4
The .PL4-file contains all data which have been calculated during the simulation
process: voltages, currents, energy, etc. These data are saved as sampled values. The
.PL4-file will be used to create diagrams.
1.5 Error Statistics of the .LST-File
ATPDesigner checks the .LST-file for error messages, if the network simulation has been
finalized. Now ATPDesigner presents first an error statistics before each error message
will be displayed. The user can now decide to continue or to cancel. The figure below
shows the corresponding message.
Figure 4: Error Statistics of the .LST-File
Total number of errors
o Sum of all errors and warnings identified in the .LST-file
System Errors
o Sum of all “You lose fella” errors
o Critical error which must be corrected
Floating Subnetworks

Getting Started in ATPDesigner – www.atpdesigner.de 21.07.2014
Page 10 of 46 Pages
Not Connected Branches
Tacs Names Not Unique
Duplicate Tacs Names
o Two network elements are using the same node name of the power
network in their 90- or 91-TACS interface.
o Critical error which must be corrected
Figure 5: Error Message of Duplicate TACS Names
ATPDesigner also displays additional information:
Figure 6: Additonal Information to the Error Statistics
x isolated network element(s) found
Isolated network elements are not connected with any other network element of the
power network.
x self connected network element(s) found
These network elements are connected to themselves e.g. Lines
x failed node name(s) found
The node names are not according the internal rules
x not connected node(s) of network element(s) found
Nodes of network elements are not connected but should be connected.
x invalid busbar nodes found

Getting Started in ATPDesigner – www.atpdesigner.de 21.07.2014
Page 11 of 46 Pages
Nodes of one or more busbars are not according the internal rules
x disabled network element(s) found
Network elements can be enabled or disabled for the network simulation processed
by the ATP. If a network element has been disabled, it will be drawn as part of the
network using the Colour for Disabled Network Elements, but it will be ignored for the
network simulation processed by the ATP.

Getting Started in ATPDesigner – www.atpdesigner.de 21.07.2014
Page 12 of 46 Pages
2 ATPDesigner – Multiple Views for Power Networks and Diagrams
Figure 7 shows the graphical user interface of ATPDesigner.
2.1 Main Menu
File
Edit
Power Network
ATP
Test
Network Design
Diagrams
Tools
View
Window
Help
Figure 7: ATPDesigner – Multiple Views for Power Networks and Diagrams
A lot of features, which are available in the main menu and the sub menus can be
also enabled using the Toolbars or the Right Mouse Button Menu. Some of the toolbar
buttons are explained below.
File + New : Create a new power network (.NET-file), CTRL + N File + Open : Open an existing power network (.NET-file), CTRL + O File Browser : Open the integrated File Browser
Main Menu
Toolbar
Multiple Views
Power Network
Integrated Diagram Viewer
Toolbar and Status Bar

Getting Started in ATPDesigner – www.atpdesigner.de 21.07.2014
Page 13 of 46 Pages
Start the network simulation, CTRL + R
General settings e.g. sampling rate dt, simulation time T, etc.
Flip horizontal
Rotate 90° to the right, R
Rotate 90° to the left, L Delete a network element Copy & Paste, CTRL + C & CTRL + V
Please note, before using these operations, the network element, which should be manipulated, must be first selected (Select One or More Network Element)
Disable or enable a network element F5 If the network element has been disabled, ATPDesigner doesn’t consider this network element during the network simulation process.
FIND, CTRL + F
Open the dialog to present all network elements used in the top most power network, presenting all settings
o The data can be copied into any other apllication e.g. WORD via the clipboard.
o The data can be also written into a text file to the hard disk.
Figure 8: FIND – Presenting all Network Elements and their Settings
Getting Started in ATPDesigner – www.atpdesigner.de 21.07.2014
Page 14 of 46 Pages
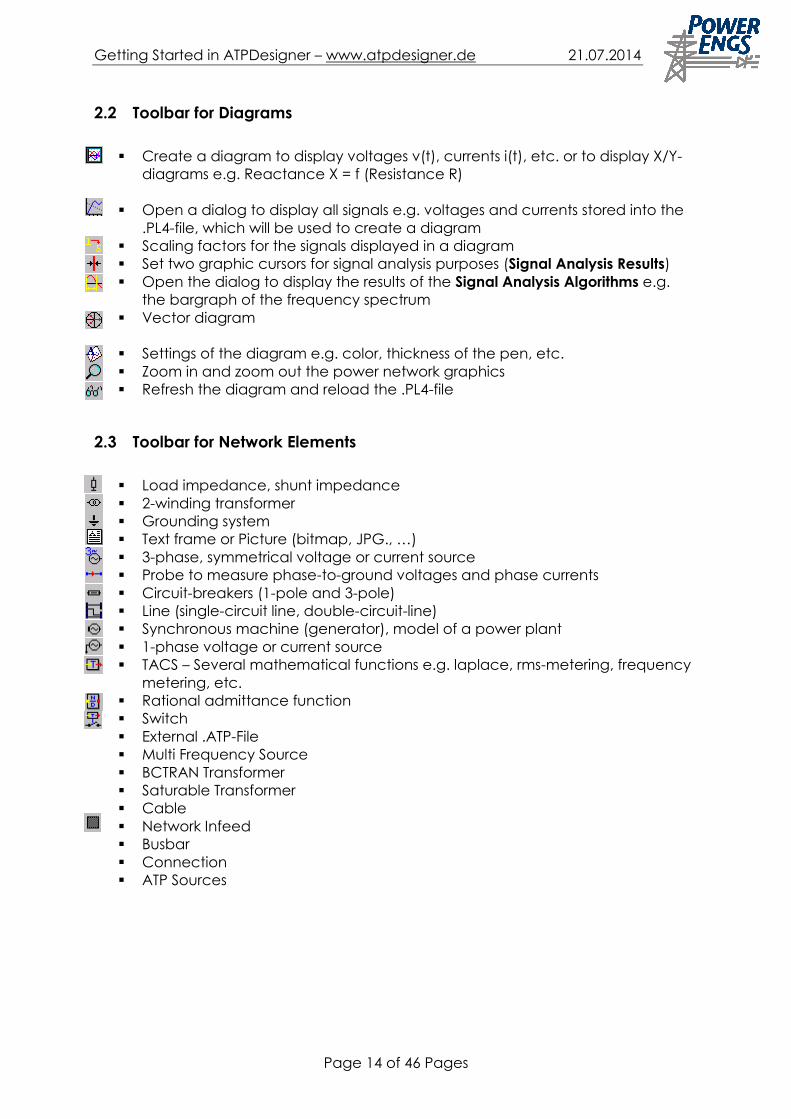
2.2 Toolbar for Diagrams
Create a diagram to display voltages v(t), currents i(t), etc. or to display X/Y-
diagrams e.g. Reactance X = f (Resistance R)
Open a dialog to display all signals e.g. voltages and currents stored into the
.PL4-file, which will be used to create a diagram
Scaling factors for the signals displayed in a diagram
Set two graphic cursors for signal analysis purposes (Signal Analysis Results)
Open the dialog to display the results of the Signal Analysis Algorithms e.g.
the bargraph of the frequency spectrum
Vector diagram
Settings of the diagram e.g. color, thickness of the pen, etc.
Zoom in and zoom out the power network graphics
Refresh the diagram and reload the .PL4-file
2.3 Toolbar for Network Elements
Load impedance, shunt impedance
2-winding transformer
Grounding system
Text frame or Picture (bitmap, JPG., …)
3-phase, symmetrical voltage or current source
Probe to measure phase-to-ground voltages and phase currents
Circuit-breakers (1-pole and 3-pole)
Line (single-circuit line, double-circuit-line)
Synchronous machine (generator), model of a power plant
1-phase voltage or current source
TACS – Several mathematical functions e.g. laplace, rms-metering, frequency
metering, etc.
Rational admittance function
Switch
External .ATP-File
Multi Frequency Source
BCTRAN Transformer
Saturable Transformer
Cable
Network Infeed
Busbar
Connection
ATP Sources

Getting Started in ATPDesigner – www.atpdesigner.de 21.07.2014
Page 15 of 46 Pages
3 Design of the Electrical Power Network
3.1 Creating a New Power Network
The user should first create a new power network using the New button of the Main
Toolbar or using the corresponding menu item New in the main menu File. ATPDesigner
creates the default network shown in the figure below. The default power network
always consists of several Network Elements:
Network Infeed Network 1
Single-Circuit Line Line 1
Circuit Breaker Cb1 with Measuring Location M1
Circuit Breaker Cb2
2 Busbars
Figure 9: Default Power Network
3.1.1 Nodes, Node Names and Snap-Points
The shape of each network element consists of 1, 2 or more snap-points, which are
drawn as small squares. Only Snap-points can be used to connect two network
elements. Please note, that a snap-point can only connect one other snap-point. But
the snap-points will be not only used to define the “graphical” connection of two
different network elements, but also to define the “electrical” connection. On this
point of view a snap-point will be also used as a node of the electrical power network.
1.1.1.1.6 Network Infeed
1.1.1.1.5 Circuit Breaker with Measuring Loacation
1.1.1.1.4 Line
1.1.1.1.3 Circuit-Breaker
1.1.1.1.2 Busbar with 5 Snap-Points
1.1.1.1.1 Toolbars

Getting Started in ATPDesigner – www.atpdesigner.de 21.07.2014
Page 16 of 46 Pages
ATPDesigner creates automatically a node name (read the chapter Node Names in
the Electrical Network of the help file) for each 1-phas or 3-phase node of the power
network. These node names will be used to define the “electrical” connection
between the nodes of different network elements. ATPDesigner writes these node
names into the .ATP-file to process the network simulation. The node names consists of
maximum 6 characters according the ATP Rule Book. The first character indicates the
phase of the 3-phase system: R = phase A, S = phase B, T = phase C. The next 5
characters specifies the unique name of the node: a unique number in the range of 1
up to 9999.
Node name of the electrical network: {RST}12345
It can be now stated that ATPDesigner provides electrical power networks with up to
9999 electrical 3-phase nodes. Nevertheless this should be enough for “normal”
networks.
It is forseen that the user can define so called fixed node names, which must be
defined by the user. These fixed node names are used to replace the ATPDesigner
created node names, if the .ATP-file will be written.
3.1.2 Delete all Network Elements of a Power Network
It is possible to delete all network elements, which are part of an electrical power
network in one step:
Toolbar button
Main menu Edit, menu item Erase All
3.1.3 Adding, Deleting, Moving, Rotating, … Network Elements
The user can now add, change, move, rotate, delete, copy & paste, etc. network
elements e.g. Network Infeeds, Lines, Circuit-Breakers or auxiliary elements e.g.
Text Frames or Pictures. Several network elements e.g. lines, Transformers, etc. are
available to design electrical power networks. The network elements can be added
via the main menu Network Design or the corresponding buttons in the Network Design
Toolbar or the Right Mouse Button Menu.
New network elements can be added by the Drag & Drop technology usual for
windows programs:
First click on the corresponding Toolbar Button.
Select the Drawing Direction.
Move the frame of the new network element to the target location in the
graphics view e.g. a node of an existing network element.
If necessary connect one node of the new network element to a node of
another network element.
Open the settings dialog via a left-mouse-button-double-click on the graphical
symbol of the network element (will be done automatically).
Change settings in the network element specific settings dialog.

Getting Started in ATPDesigner – www.atpdesigner.de 21.07.2014
Page 17 of 46 Pages
Figure 10: Dialog to Select the Drawing Direction of a New Network Element
Figure 10 shows the dialog to select the drawing direction of a new network element.
If selected ATPDesigner draws a dotted frame, which can be moved to any location
in the graphics view using the mouse. As long as the frame will be moved, a red cross
will be displayed at the current mouse to identify not connected snap-points of other
network elements. The shape of the “red cross” will increase, if a not connected snap-
point has been detected.
3.1.4 Select One or More Network Element
Network Elements must be first selected, before the user can manipulate the shape of
the network element: Move, Delete, Rotate, Copy & Paste, …
3.1.4.1 Selecting One Network Element
Move the mouse cursor to the network element
Press left mouse button
The selected network element will be displayed in light gray.
3.1.4.2 Selecting Two and More Network Elements
Move the mouse cursor close to the first network element, but not over the
network element.
Press the "Shift" – key.
Press the left mouse button as long as necessary to select an other network
element and move the mouse cursor to select all network elements of interest.
As long as the left mouse button will be pressed, a dotted frame will be drawn.
All network elements will be selected, which are located inside the frame.
The selected network elements will be displayed in light gray color.
3.1.5 Rotating a Network Element
First the user must select the network element to be rotated.
Flip horizontal
Rotate 90° to the right, R
Rotate 90° to the left, L

Getting Started in ATPDesigner – www.atpdesigner.de 21.07.2014
Page 18 of 46 Pages
3.2 How to Delete the Elements of the Default Power Network ?
ATPDesigner provides two functions to delete network elements:
Delete One Network Element
Select the network element by a Left Mouse Button Click
Move the mouse cursor “over” the selected network element
Open the Right Mouse Button Menu
Click on the menu item Delete
Delete All Network Elements
Open the main menu Edit, click on the menu item Erase All
Or
Use the toolbar button

Getting Started in ATPDesigner – www.atpdesigner.de 21.07.2014
Page 19 of 46 Pages
3.3 List of Network Elements
ATPDesigner supports a lot of different network elements to design and simulate
electrical power networks. Some of these network elements correspond directly with
ATP models, but some of these network elements are self-developed based on
fundamental ATP models.
Network Infeeds
Busbars
Single-Circuit Lines
Double-Circuit Lines
3-Pole-Circuit Breakers
1-Pole-Circuit Breakers
Switch
1-Phase and 3-Phase - Load Impedances
Shunt Impedance
Transformers
BCTRAN Transformer
XFORMER Transformer
SATURABLE Transformer Component
Cable (CABLE PARAMETERS)
Autotransformers
Generators
Connections
Serial and Parallel Impedances
Textframes
Pictures
Grounding Systems
Static Power Network Sources
3-Phase Symmetrical Source
Empirical Function
External .ATP-FileSplitter
Probe
Fault Type and Fault Locations (Up to 3 Fault Locations with 3 Fault Types)
Measuring Locations
Current and Voltage Transformers
Capacitive Voltage Transformers
Current Transformer Saturation
TACS Data Card
TACS STAND ALONE
Nonlinear Element e.g. L(i)
Multi Frequency Source
Harmonic Frequency Source
MOV - Metal Oxyd Varistor (ZNO Fitter)
Admittance Function Y(s) ot Y(z)

Getting Started in ATPDesigner – www.atpdesigner.de 21.07.2014
Page 20 of 46 Pages
3.4 Changing the Settings of Network Elements
The settings of each network element can be displayed and changed using the
network element specific Settings Dialog.
1. First the network element must be selected with a Left Mouse Button Click on
the graphical symbol of the network element. The selected network element
will be now drawn in light gray.
2. The settings dialog, which is specifically designed for the different network
elements, can be now opened with a Left Mouse Button Double Click. All these
dialogs are explained in the corresponding chapters of the help file. Please
read also the How to ... section in the help file.
Figure 11 shows the settings dialog of a Network Infeed for example.
Figure 11: Settings Dialog of a Network Infeed
Some buttons are common for all settings dialogs.
3.4.1 OK
Close dialog and save changed data
3.4.2 Cancel
Close dialog without saving changed data
3.4.3 Default
Load the default settings

Getting Started in ATPDesigner – www.atpdesigner.de 21.07.2014
Page 21 of 46 Pages
3.4.4 Help
Open the corresponding chapter of the help file to read detailed information about
the network element and how to use. Links to related chapters of the help file are also
available.
3.5 .NET-File – Container of the Power Network
The .NET-file contains all data which are relevant for the electrical power network:
Data to describe the graphical representation of all network elements used in
the power network.
Electrical and mechanical data to define the physical behavior of all network
elements used in the power network.
Data of the embedded Pictures e.g. bitmaps or JPG.-files.
Data of the tooltips to display the Short Circuit Analysis Results.
The name of the .NET-file is displayed in the header of the corresponding client window
e.g. C:\ATPDesigner\Data\Network_1.net shown in Figure 9.
Backup the .NET-File
It is absolutely sufficient to save only the .NET-file. All other files will be only temporarily
created and can be recreated using ATPDesigner and the.NET-file.
The data stored in the .NET-file will be secured using a checksum algorithm. The user
should not change any data in the .NET-file by hand e.g. using a text editor, because
the .NET-file may be corrupted after such modifications. ATPDesigner doesn't accept
.NET-files with a corrupted checksum. In this case ATPDesigner presents the error
message shown below and reloads a power network with default values. All
information contained in the corrupted .NET-file are now lost.
Figure 12: Error Message for Corrupted the .NET-Files (Checksum Error)

Getting Started in ATPDesigner – www.atpdesigner.de 21.07.2014
Page 22 of 46 Pages
3.6 Integrated File Browser
ATPDesigner provides the user managing the different file types with an integrated File
Browser. Nevertheless the standardized and well known features of Windows based
software tools e.g. New,
Figure 13: Intergated File Browser
Open, Save, Save As .., Print, etc. are also available either in the main menu File, using
the buttons of the Main Toolbar or the standardised hotkeys.
Files can be selected and opened using the Explorer or the file list at the right-side of
the dialog.
Select a folder, which should be scanned for .NET-, .TXT-, COMTRADE- and .PL4-
files.
Double-click on the name of the file using the left mouse button.
ATPDesigner automatically creates a new view depending on the extension of the
double-clicked file:
A diagram view for .PL4-files and COMTRADE-files.
A power network view for .NET-files.
1.1.1.1.8 Folder of the File List
1.1.1.1.9 File List
1.1.1.1.11 Clean the Folder
1.1.1.1.10 Select an other the Folder
1.1.1.1.7 Explorer

Getting Started in ATPDesigner – www.atpdesigner.de 21.07.2014
Page 23 of 46 Pages
3.7 Program Settings
Several settings, which are ATPDesigner specific and independent of the data of the
electrical power network, will be saved in the .INI-file and not in the .NET-file. The .INI-
file will be read automatically during startup. ATPDesigner creates a new .INI-file, if the
.INI-file could not be read. The .INI-file will be saved if ATPDesigner will be closed. The
content of the .INI-file is explained in detail in the corresponding chapter of the help
file. Figure 14 shows the settings dialog.
Figure 14: Program Settings Dialog
It is very important to define the right file name of the ATP Exectuable File e.g.
TPBIG.EXE.
Read more details in the chapter Program Settings of the help file.
Read more details in the chapter Content of the .INI-File of the help file.
1.1.1.1.13 Name of the ATP executable file
1.1.1.1.12 If enable, the last top most power network (.NET-file) will be automatically loaded during startup
1.1.1.1.15 Folders
1.1.1.1.14 Undo Steps

Getting Started in ATPDesigner – www.atpdesigner.de 21.07.2014
Page 24 of 46 Pages
4 Using ATP to Calculate Voltages, Currents, Energy, …
4.1 Starting to Simulate Power Networks
The network simulation can be easily started only pressing the button or CTRL + R.
ATPDesigner writes the ATP based models of the network elements into the .ATP-File
and starts ATP in a background task. Now ATP calculates voltages and currents and
save these results into two output files.
The .LST-File contains
a copy of all commands of the .ATP-file,
additional comments and error messages written during the runtime of ATP
(American EMTP User Group, References) and
Optionally the results of the so called Steady State Analysis of the electrical
power network.
The .PL4-File contains the calculated voltages and currents as sampled values e.g. to
create diagrams.
ATPDesigner reads the sampled values out of the .PL4-file and process these data:
to create diagrams to display the time dependent behavior of the signals,
to analyzes the voltages and currents using integrated Signal Analysis
Algorithms and
to calculate and display the Frequency Spectrum of voltages and currents.
Please note, that COMTRADE files can be also used to create diagrams and to analyze
voltages and currents.

Getting Started in ATPDesigner – www.atpdesigner.de 21.07.2014
Page 25 of 46 Pages
4.2 Processing .PL4- or COMTRADE-File to Create Diagrams
.PL4-files or COMTRADE-files can be displayed using an external diagram viewer e.g.
PlotXY, which is part of the ATP installation setup or using the integrated Diagram
Viewer of ATPDesigner. The external diagram viewer can be started via the button
or in parallel to ATPDesigner as a parallel task. The .PL4-file can be also automatically
converted to the COMTRADE standard IEC 60255-24 and presented using any external
COMTRADE viewer. The integrated diagram viewer will be automatically started, if a
.PL4-file or a COMTRADE-file had been loaded e.g. via a double-click on the file name
in the File Browser .
Figure 15: File Browser in ATPDesigner
Please note, that the external .PL4-viewer can be defined in the Program Settings
Dialog, setting Diagram Viewer.

Getting Started in ATPDesigner – www.atpdesigner.de 21.07.2014
Page 26 of 46 Pages
4.3 Open a .PL4-File to Create a Diagram
The .PL4-file can be also opened via the Right Mouse Button Menu, which will be
displayed, if the right button of the mouse has been clicked and the mouse cursor is
not located “over” the shape of a network element.
Figure 16: Right Mouse Button Menu
Figure 17: Dialog to Select the Signals to Be Displayed in a Diagram

Getting Started in ATPDesigner – www.atpdesigner.de 21.07.2014
Page 27 of 46 Pages
If the power network is displayed in the topmost view of ATPDesigner, click the right
mouse button and select the menu item Open Diagram (.PL4-File) ... The .PL4-file which
corresponds to the topmost power network will be loaded and first the Dialog to Select
the Signals to be Displayed in a Diagram will be presented. After selecting voltages
and/or currents the diagram will be automatically created in a new view.
A faster way to create the diagram which corresponds to the topmost power network:
Select the power network view which is of interest
If required restart the network simulation process
Click on the toolbar button
Figure 18: Toolbar for Diagrams
ATPDesigner “knows” the name of the .NET-file of the topmost power network and
therefore “knows” also the name of the corresponding .PL4-file, which must be used
to create the diagram.
Figure 17 shows the dialog which displays all available signals calculated by the ATP
during the simulation process and stored into the .PL4-file. The list box at the left side of
the dialog displays all available signals, the list box at the right side all selected signals
to be displayed in the diagram. Please note, that the maximum number of signals to
be displayed is limited.
4.3.1 How to Select a Signal to be Displayed in a Diagram ?
Click on the name of the signal of the left-side ist box with a Left Mouse Button
Click
Click on the Button
4.3.2 How to Deselect a Signal ?
Click on the name of the signal of the right-side ist box with a Left Mouse Button
Click
Click on the Button
4.3.3 Most easy way to create a Diagram using Toolbar Buttons
Diagrams can be also easily created only using the toolbar buttons of the Diagram
Toolbar.

Getting Started in ATPDesigner – www.atpdesigner.de 21.07.2014
Page 28 of 46 Pages
Step 1:
Press the button in the Toolbar for Diagrams to open the .PL4-file, which corresponds
to the topmost .NET-file.
Please note, that the view of the power network must be enabled as topmost view to
enable this toolbar button. To enable the view of the power network, please move the
mouse cursor in the view which displays the power network of interest and click on the
view using the left mouse button.
Step 2:
The dialog shown in Figure 17 will be now displayed. Select the node names of the
signals which shall be displayed in the diagram.
Please note that signals displayed in the list boxes can be selected as usual for
Windows based software tools (Shift Left + Cursor or Strg + Cursor).
Step 3:
After the Ok button has been clicked, the diagram will be drawn.
TACS - … Output signal of the TACS section of the ATP
MODELS - … Output signal of the MODELS section of the ATP
c: … Output signal is a current
v: … Output signal is a voltage
MACHx … Output signal of a machine (e.g. S.M. 59 model)
Getting Started in ATPDesigner – www.atpdesigner.de 21.07.2014
Page 29 of 46 Pages
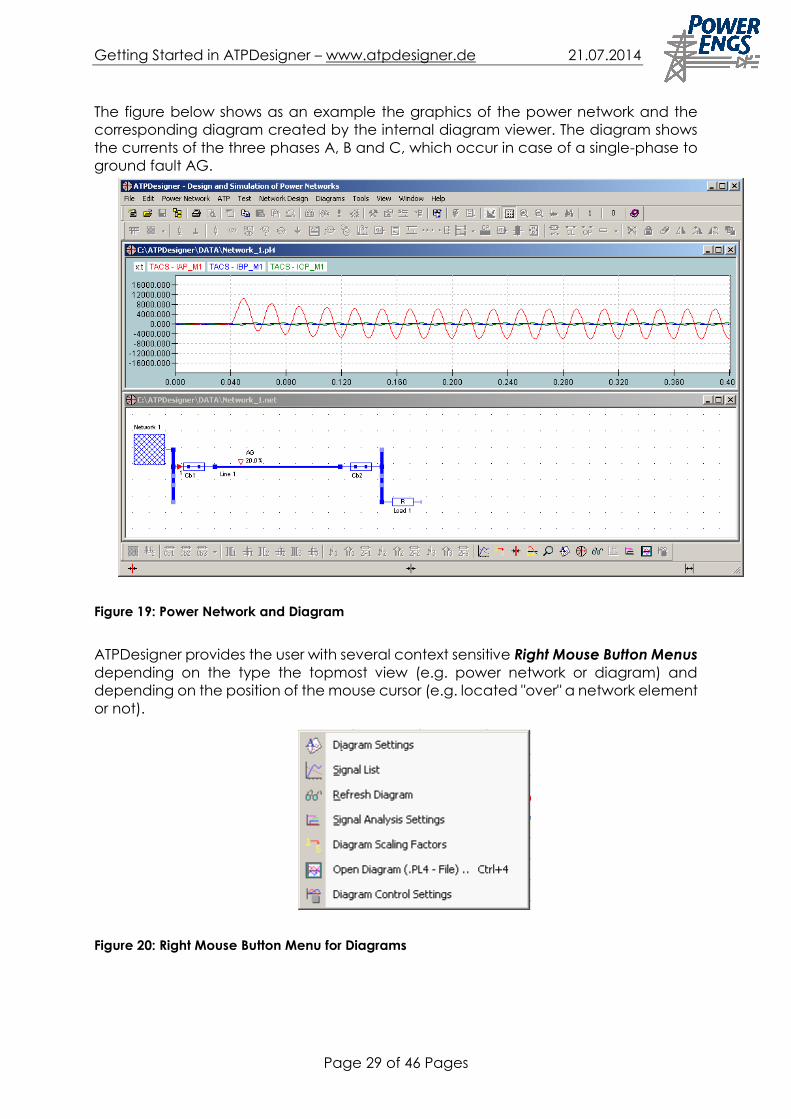
The figure below shows as an example the graphics of the power network and the
corresponding diagram created by the internal diagram viewer. The diagram shows
the currents of the three phases A, B and C, which occur in case of a single-phase to
ground fault AG.
Figure 19: Power Network and Diagram
ATPDesigner provides the user with several context sensitive Right Mouse Button Menus
depending on the type the topmost view (e.g. power network or diagram) and
depending on the position of the mouse cursor (e.g. located "over" a network element
or not).
Figure 20: Right Mouse Button Menu for Diagrams

Getting Started in ATPDesigner – www.atpdesigner.de 21.07.2014
Page 30 of 46 Pages
4.4 Creating a Probe based Diagram
Probes can be used to measure voltages and currents in the power network at several
nodes. If the user is only interested to analyse voltages and/or currents measured by
one specific Probe, the corresponding diagram can be easily created:
Select the Probe, whose voltages and/or currents are of interest by a left mouse
button click
How to select a network element ?
A network element can be selected with a left mouse button click. If the
network element has been selected, it will be drawn in light grey color.
Move the cursor “over” the Probe
Click on the right mouse button
Select the menu item Probe
Select one of the menu items in the sub menu
After that the user can select one or more of the displayed voltages and currents. The
diagram will be automatically displayed.
Figure 21: Creating a Probe based Diagram using the Right Mouse Button Menu

Getting Started in ATPDesigner – www.atpdesigner.de 21.07.2014
Page 31 of 46 Pages
4.5 Signal Analysis Methods
ATPDesigner provides also the analysis of voltages and currents which are stored as
sampled values in the .PL4-file or COMTRADE-file. The signal analysis methods are
based on the Discrete Fourier Transformation, which is used to calculate the frequency
spectrum of voltages and currents. The figures below show some examples.
4.5.1 Diagram Settings
The settings of the signal analysis can be changed in the settings dialog Diagram
Settings.
Figure 22: Diagram Settings

Getting Started in ATPDesigner – www.atpdesigner.de 21.07.2014
Page 32 of 46 Pages
4.5.2 DFT (f) - Amount and Phase of the Fundamental Frequency
The amount and phase angle of the fundamental frequency of all voltages and
currents, which are displayed in the diagram, will be shown in a spread sheet (Figure
23).
Figure 23: Dialog to Display Amount and Phase Shift of the Fundamental Frequency
4.5.2.1 Node Name
Name of the signal to be displayed
4.5.2.2 Amount
Amount of the signal in V, A, etc.
4.5.2.3 Phase Angle [°]
Phase angle of the signal in degree
4.5.2.4 Phase Diff. [°]
Phase shift of the signal related to the signal displayed in the first line of the spread
sheet (= No. 1)
Phase Diff. of Node N = Phase Angle of Signal No. N - Phase Angle of Signal No.
1
4.5.2.5 Real
Real part of the vector calculated using DFT
4.5.2.6 Imag
Imaginary part of the vector calculated using DFT
4.5.2.7 Copy
Copy the analysis results into the clipboard

Getting Started in ATPDesigner – www.atpdesigner.de 21.07.2014
Page 33 of 46 Pages
The different cell data will be separated using the Cell Separation Character or a
tabulator. Both alternatives can be selected as explained below.
On Top
If enabled, the window is the Top Most Window on the desktop
RMS
If enabled, all values will be calculated and displayed as R.M.S. values. If disabled, all
values will be calculated and displayed as PEAK values.
* Sqrt (3)
The calculated values will be multiplied by factor sqrt (3). This option can be used to
calculate the corresponding nominal voltage, if phase-to-ground voltages has been
measured.
Tab
Tabulator + Blank will be selected as cell separation
Character
The character displayed into the edit field below will be used as cell separation
4.5.3 Harmonics – Presenting the Harmonic Frequencies in Addition
The frequency spectrum can be calculated only for one signal, which must be first
selected:
Click on the line of the spread sheet, which contains the signal of interest.
Figure 24: Selecting One of the Signals to Calculate the Frequency Spectrum
Getting Started in ATPDesigner – www.atpdesigner.de 21.07.2014
Page 34 of 46 Pages
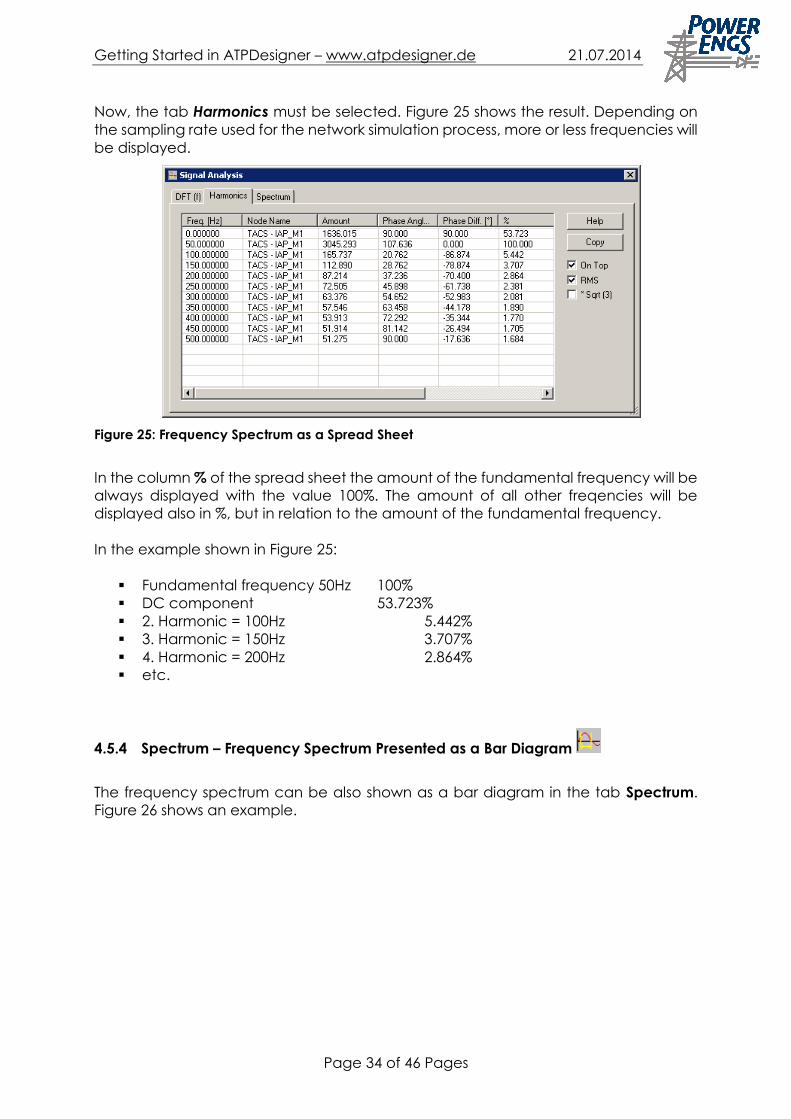
Now, the tab Harmonics must be selected. Figure 25 shows the result. Depending on
the sampling rate used for the network simulation process, more or less frequencies will
be displayed.
Figure 25: Frequency Spectrum as a Spread Sheet
In the column % of the spread sheet the amount of the fundamental frequency will be
always displayed with the value 100%. The amount of all other freqencies will be
displayed also in %, but in relation to the amount of the fundamental frequency.
In the example shown in Figure 25:
Fundamental frequency 50Hz 100%
DC component 53.723%
2. Harmonic = 100Hz 5.442%
3. Harmonic = 150Hz 3.707%
4. Harmonic = 200Hz 2.864%
etc.
4.5.4 Spectrum – Frequency Spectrum Presented as a Bar Diagram
The frequency spectrum can be also shown as a bar diagram in the tab Spectrum.
Figure 26 shows an example.

Getting Started in ATPDesigner – www.atpdesigner.de 21.07.2014
Page 35 of 46 Pages
Figure 26: Frequency Spectrum drawn as a Bar Diagram
The maximum frequency of the frequency spectrum depends on the sampling
frequency used during the simulation process. ATPDesigner automatically presents the
minimum and maximum frequency in the both combo boxes at the right-side of the
dialog. Both settings can be changed by the user. ATPDesigner will redraw
automatically the frequency spectrum.

Getting Started in ATPDesigner – www.atpdesigner.de 21.07.2014
Page 36 of 46 Pages
5 Library of Network Elements
ATPDesigner provides the user to manage his specific network elements using a Library
of Network Elements. The user can transfer network elements to and from the library
via the clipboard. Therefore the user must only use the Copy & Paste functions to work
with a library. This can be done using the well-known menu items, right mouse button
menus, hot keys, toolbar buttons, etc.
The libraries can be easily saved to and loaded from e.g. a hard disk. The data are
secured with a checksum. Therefore the library may be corrupted modifying the data
by hand. A corrupted library cannot be further used and not repaired.
ATPDesigner uses a tree control to present the content of the library. The first tree level
presents the name of the network element class e.g. Load Impedance, Network
Infeed, etc. The network elements are presented in the second tree level using the
user specific name of the network element.
Figure 27: Library of Network Elements Displayed in a Tree
Copy a network element from the library to the power network graphics: Drag & Drop
1. Select the network element in the tree control of the library by a LEFT MOUSE
BUTTON CLICK.
2. Move the mouse cursor "over" the name of the network element to be moved.
3. Press the LEFT MOUSE BUTTON down.

Getting Started in ATPDesigner – www.atpdesigner.de 21.07.2014
Page 37 of 46 Pages
4. Keep the LEFT MOUSE BUTTON DOWN and "move" the network element to any
position in the power network graphics.
5. Release the left mouse button.
Copy a network element from the power network to the library: CTRL+C & CTRL+V
1. Select the network element in the power network graphics by a LEFT MOUSE
BUTTON CLICK.
2. Press CTRL+C to copy the network element into the clipboard.
3. Enable the dialog of the library by a LEFT MOUSE BUTTON CLICK on the dialog
of the library.
4. Press CTRL+V to insert the network element into the tree control of the library.
Read more in the chapter Library of Network Elements of the help file.
6 ATPDesigner - Web Services
ATPDesigner Home Page: www.atpdesigner.de
Download ATPDesigner Evaluation Release
Download Beta Releases for Trial
Download several PDF's e.g. Applications, etc.
Download interesting .NET – Files
Download Version History
Information about the compatibility to the ATP executable files
Information about pricing and pucrchasing
ATPDesigner E-Mail Support: [email protected]
ATPDesigner provides directly the use of the web services:
Main menu Help
Menu item Web Services
Figure 28: Menu Item to Open the Web Service Dialog

Getting Started in ATPDesigner – www.atpdesigner.de 21.07.2014
Page 38 of 46 Pages
7 Short Circuit Analysis Results
The network simulation program ATP is also able to process a stationary analysis of the
power network, which doesn’t consider any transient phenomena during the
simulation process. Transient phenomena will only occur, if at least one network
element changes its state during the simulation process e.g. a circuit-breaker will open
or close or a network disturbance will occur. The use of non-linear network elements
e.g. a transformer with a magnetization characteristic will not produce transient
phenomena during a stationary network analysis. The results of the stationary network
analysis are called ATP Steady State Analysis in the ATP Rule Book.
7.1 Why Stationary Network Analysis Doesn’t Contain Transient Phenomena ?
For a stationary network analysis it will be assumed, that all voltage and current sources
are represented by sinusoidal waveforms only described by the amount e.g. in V or A
and the phase shift e.g. in degrees. Amount and phase shift are fixed during the
stationary network analysis. In addition the state of the power network and all other
network elements will be also not changed.
Network elements with a non-linear characteristic e.g. transformer, current-
transformer (ct), etc. will be also simulated as a linear network element using R, L and
C. Circuit-breakers must keep open or closed, but will not change their state. It is
possible to take into account network disturbances e.g. the Faults of Line 1..3 during a
stationary network analysis. In this case it will be assumed, that the network disturbance
is still existing and remains existing during the network calculation.
ATPDesigner provides the user by all features, which are required to process a
stationary network analysis:
The open/close state of the circuit breaker will be taken into account. The
open/close states of the circuit-breakers, which are relevant for the stationary
network analysis, are always displayed in the power network graphics.
All network disturbances especially the Faults of Line 1..3 (Faults and Fault Types)
will be taken into account.
The stationary network analysis is particularly of interest to calculate the short-circuit
currents and voltages after a short-circuit has been occurred in the power network.
Therefore the stationary network analysis (= ATP’s Steady State Analysis) will be called
Short Circuit Analysis in ATPDesigner.
7.2 Results of the Stationary Network Analysis
During the Steady State Analysis (ATP’s name of the stationary network analysis) ATP
also calculates the time dependent signals of voltages and currents and saves these
signals into the corresponding .PL4-file. Nevertheless these signals are in general not
really of interest, because they will display only stationary, sinusoidal waveforms
without any transient phenomena.
The results of the ATP Steady State Analysis will be automatically saved by ATP in a
section of the .LST-file. ATPDesigner reads automatically the .LST-file after the simulation

Getting Started in ATPDesigner – www.atpdesigner.de 21.07.2014
Page 39 of 46 Pages
process has been successfully finalized, identifies the results of ATP’s Steady State
Analysis and displays these results in a spread sheet of the dialog Short Circuit Results.
Figure 29 shows this dialog.
ATPDesigner tries to identify voltages and currents, which are assigned to any of the
network elements of the power network. If ATPDesigner is not able to identify clearly
these voltages or currents, no signal will be displayed in the corresponding lines of the
spread sheet.

Getting Started in ATPDesigner – www.atpdesigner.de 21.07.2014
Page 40 of 46 Pages
Figure 29: Dialog to Display the Short Circuit Analysis Results
The results of the Short Circuit Analysis can be also displayed in the power network
graphics pressing the F4 button.
Figure 30: Displaying the Short Circuit Analysis Results in Tooltips
7.3 How to Start the Short Circuit Analysis ?
The Short Circuit Analysis can be started by several methods:
CTRL + E
Pressing the button of the Main Toolbar
Using the menu item Short Circuit Results in the main menu ATP
Using the menu item Short Circuit Results in the Right Mouse Button Menu
(if the mouse cursor is not “over” a shape of a network element)
ATPDesigner automatically opens the dialog containing the results as shown in Figure
29.
7.4 Moving the Short Circuit Results Tooltips to Other Positions
ATPDesigner displays the results of the Short Circuit Analysis using Yellow Tooltips. If
required the tooltips can be moved to any other position in the view. A “graphical”
overlapping of the tooltips can be avoided.
Move the mouse cursor “over” the yellow tooltip
Press the Left Mouse Button and hold it down
Move the mouse cursor to another position (a frame will be drawn during this
operation)
Release the mouse button (the new position of the tooltip will be saved now)

Getting Started in ATPDesigner – www.atpdesigner.de 21.07.2014
Page 41 of 46 Pages
Figure 31: Yellow Tooltips – Displaying the Short Circuit Analysis Results

Getting Started in ATPDesigner – www.atpdesigner.de 21.07.2014
Page 42 of 46 Pages
7.5 Saving the Current Position and Size of the Short Circuit Results Tooltips
The current position of the tooltips will be saved into the .NET-file,
if the tooltips are displayed in the network graphics and
the Save or Save As .. function has been used.
7.6 Restoring the Position and Size of the Short Circuit Results Tooltips
ATPDesigner automatically enables the Short Circuit Analysis function after a .NET-file
has been successfully loaded, if the data of Short Circuit Results Tooltips are identified
in this .NET-file. Figure 32 shows an example. The tooltips doesn’t show any result,
because the Short Circuit Analysis wasn’t yet processed.
Please note, that only the position and size of the tooltips are saved in the .NET-file, not
the results of the Short Circuit Analysis.
Figure 32: Short Circuit Results Tooltips After Loading the .NET-File

Getting Started in ATPDesigner – www.atpdesigner.de 21.07.2014
Page 43 of 46 Pages
To display the Short Circuit Results, the Short Circuit Analysis must be processed e.g.
pressing CTRL + E or the toolbar button .
Figure 33: Short Circuit Results Tooltips after pressing CTRL + E
7.7 Update – Recalculating the Short Circuit Results
If the power network has been modified, the Short Circuit Analysis must be restarted
to Update the results.
Press the button Update of the dialog Short Circuit Results displayed in Figure 29.
7.8 Resizing the Dialog Short Circuit Results
The dialog Short Circuit Results can be easily resized using the grip in the bottom left
corner. If it is sufficient for the user to use only the Short Circuit Results Tooltips, the dialog
Short Circuit Results can be resized to the smallest size.
Figure 34: Resizing the Dialog Short Circuit Results

Getting Started in ATPDesigner – www.atpdesigner.de 21.07.2014
Page 44 of 46 Pages
Please note, that the position and the size of this dialog will be stored into the registry
during the shutdown of ATPDesigner if visible. The dialog will appear using at the same
position and with the same size, if the dialog Short Circuit Results will be reopened.
7.9 Content of the Short Circuit Results Tooltips
Figure 35 shows the zoomed content of a Short Circuit Results Tooltip.
Figure 35: Content of the Short Circuit Results Tooltip
Phase-to-ground voltage VAG in Vrms, absolute phase shift in degree, p.u.-
value in % of the nominal value
Phase-to-ground voltage VBG in Vrms, absolute phase shift in degree, p.u.-
value in % of the nominal value
Phase-to-ground voltage VCG in Vrms, absolute phase shift in degree, p.u.-
value in % of the nominal value
Phase current IA in Arms, absolute phase shift in degree, [relative phase shift in
relation to the corresponding phase-to-ground voltage in degree], p.u.-value
in % of the nominal value
Phase current IB in Arms, absolute phase shift in degree, [relative phase shift in
relation to the corresponding phase-to-ground voltage in degree], p.u.-value
in % of the nominal value
Phase current IC in Arms, absolute phase shift in degree, [relative phase shift in
relation to the corresponding phase-to-ground voltage in degree], p.u.-value
in % of the nominal value
Relative phase shift PHIrel = (Absolute phase shift of the phase current) - (Absolute
phase shift of the phase-to-ground voltage)

Getting Started in ATPDesigner – www.atpdesigner.de 21.07.2014
Page 45 of 46 Pages
Apparent power S in MVA
Active power P in MW, reactive power Q in Mvar
The power factors will be calculated considering unbalanced loads:
S = | VA | * | IA | + | VB | * | IB | + | VC | * | IC |
P = | VA | * | IA | * cos (PHIrel) + | VB | * | IB | * cos (PHIrel) + | VC | * | IC | *
cos (PHIrel)
Q = | VA | * | IA | * sin (-1 x PHIrel) + | VB | * | IB | * sin (-1 x PHIrel) + | VC | * |
IC | * sin (-1 x PHIrel)
7.10 Probes – Definition Protection Elements and Nominal Voltages
Voltages and Currents can be measured independent of the Measuring Locations of
Circuit-Breakers Cb1..5 using a Probe. The user can change several settings of the
network element Probe via a network element specific dialog displayed below. The
Probe can be used as a 3-phase probe to measure voltages and/or currents in all 3
phases in parallel or as a phase-selective probe.
Figure 36: Settings Dialog of a Probe
The Nominal Values of voltages, currents, etc. can be defined by the user. These
nominals values will be used to calculate the p.u. - value of the voltages, currents, etc.
measured at the measuring location of the probe. The p.u.-values will be displayed in

Getting Started in ATPDesigner – www.atpdesigner.de 21.07.2014
Page 46 of 46 Pages
the Short Circuit Analysis Results Tooltips.
Vn
Nominal voltage at the measuring location
In
Nominal current at the measuring location
Please note, that the p.u.-values will be only displayed for Probes, NOT for the
Measuring Locations of the Circuit Breakers Cb1..5.
Probes can be also used to compare the phase-to-ground voltages and the phase
currents with several thresholds. In addition time delays can be also used. In sum
probes can be used to "simulate" simple Protection Elements.
I>
Threshold of the phase overcurrent
TI>
Time delay of the phase overcurrent
V>
Threshold of the phase overvoltage
V<
Threshold of the phase undervoltage