getting more bang for your public investment buck - richard hugues, imf
TRANSCRIPT


Getting More Bank for Your Public Investment Buck: Outline of the Presentation
I. Public Investment and Infrastructure Quality
II. Estimating Public Investment Efficiency
III. Assessing Public Investment Management
IV. Explaining Public Investment Performance
V. Conclusions, Recommendations, and Next Steps
2
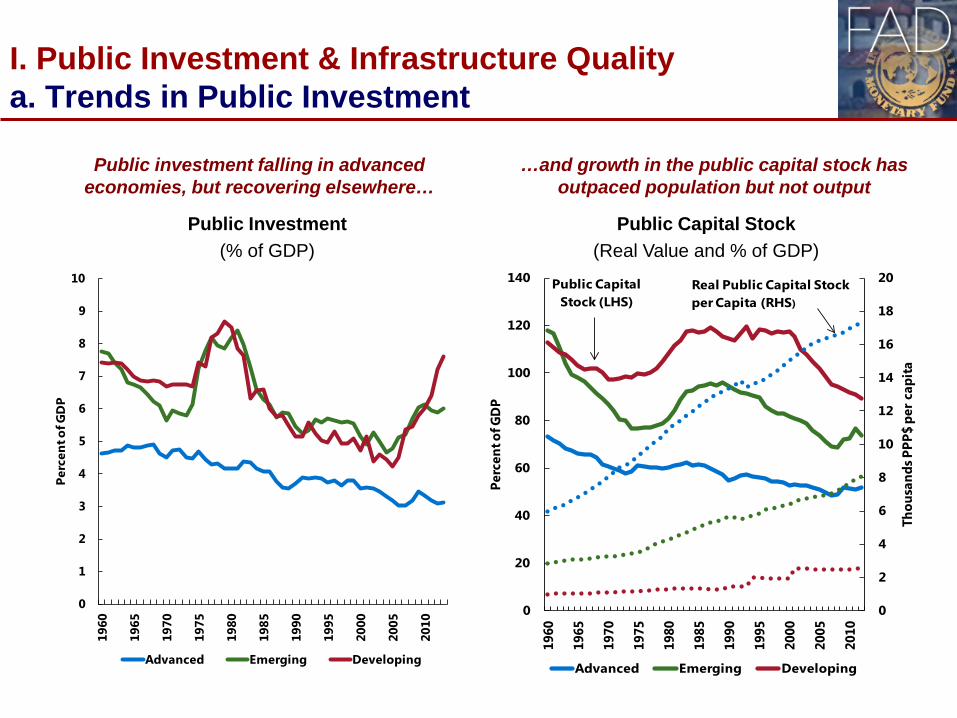
I. Public Investment & Infrastructure Quality a. Trends in Public Investment
Public investment falling in advanced economies, but recovering elsewhere…
…and growth in the public capital stock has outpaced population but not output
3
0
1
2
3
4
5
6
7
8
9
10
1960
1965
1970
1975
1980
1985
1990
1995
2000
2005
2010
Perc
ent o
f GD
P
Advanced Emerging Developing
Public Investment (% of GDP)
0
2
4
6
8
10
12
14
16
18
20
0
20
40
60
80
100
120
140
1960
1965
1970
1975
1980
1985
1990
1995
2000
2005
2010
Thou
sand
s PPP
$ pe
r cap
ita
Perc
ent o
f GD
P
Advanced Emerging Developing
Real Public Capital Stock per Capita (RHS)
Public Capital Stock (LHS)
Public Capital Stock (Real Value and % of GDP)
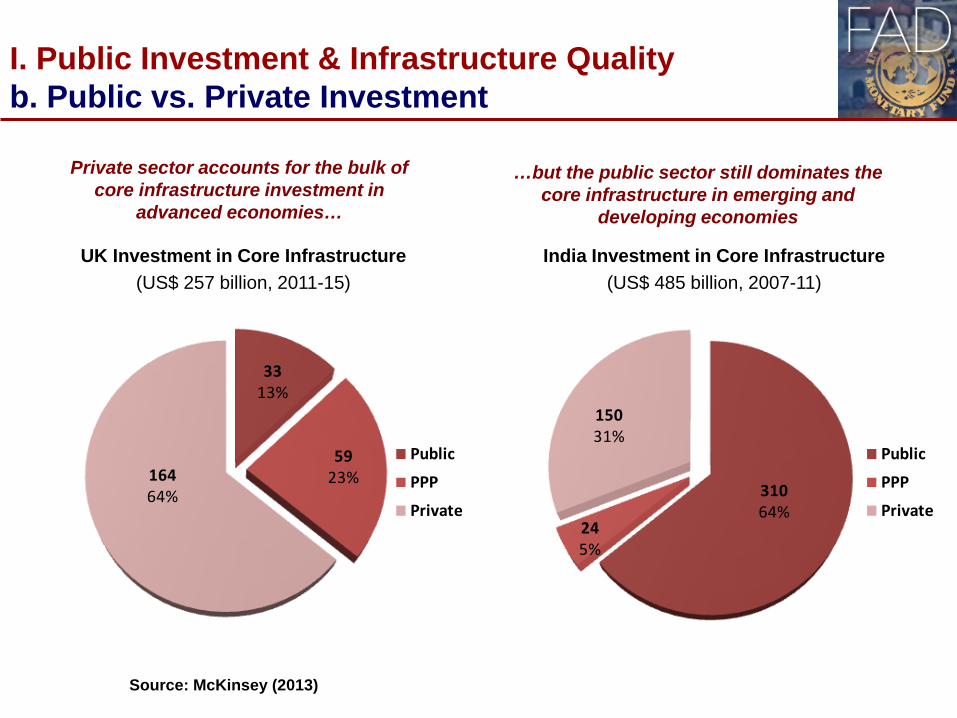
I. Public Investment & Infrastructure Quality b. Public vs. Private Investment
Private sector accounts for the bulk of core infrastructure investment in
advanced economies…
…but the public sector still dominates the core infrastructure in emerging and
developing economies
4
UK Investment in Core Infrastructure (US$ 257 billion, 2011-15)
3313%
5923%164
64%
Public
PPP
Private31064%
245%
15031%
Public
PPP
Private
India Investment in Core Infrastructure (US$ 485 billion, 2007-11)
Source: McKinsey (2013)

I. Public Investment & Infrastructure Quality c. Trends in Infrastructure Quality
Survey measures suggest some convergence in infrastructure quality
between rich & poor countries….
…but physical measures highlight the large and persistent disparities in infrastructure
access & quality between rich and poor
5
0
1
2
3
4
5
6
2006
2007
2008
2009
2010
2011
2012
2013
2014
AdvancedEmergingDeveloping
Perceptions of Infrastructure Quality (2006-14)
Measures of Infrastructure Access (Latest year)
0102030405060708090100
02468
1012141618
Road
s per
capi
ta
Publ
ic e
duca
tion
infr
astr
uctu
re
Publ
ic h
ealth
in
fras
truc
ture
Elec
tric
ity p
er
capi
ta
Acce
ss to
wat
er
(RHS
)
AdvancedEmergingDeveloping

II. Estimating Public Investment Efficiency a. Public Investment Efficiency Index
6
Sizeable public investment efficiency gaps both across and with different income groups
0
20
40
60
80
100
120
140
0 5,000 10,000 15,000 20,000 25,000 30,000 35,000
Phys
ical
infr
astr
uctu
re sc
ore
(100
=AE a
vera
ge)
Public capital stock per capita, PPP US$
Advanced Emerging Developing Frontier line
Public Capital Stock vs. Infrastructure Quality

0.0
0.2
0.4
0.6
0.8
1.0
Advanced Emerging Low-Income All Countries
Effic
ienc
y sc
ores
Average efficiency gap
of 40%
II. Estimating Public Investment Efficiency b. Public Investment Efficiency Gap
7
Variation in Public Investment Efficiency
Average country is 40% below efficiency frontier with largest efficiency gaps among low income countries
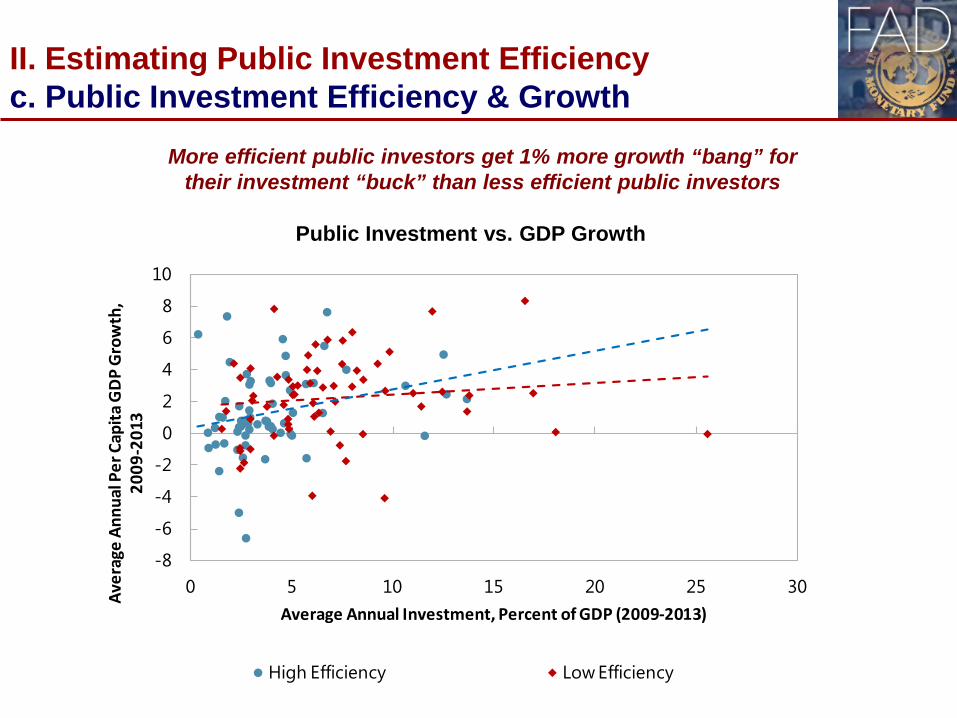
II. Estimating Public Investment Efficiency c. Public Investment Efficiency & Growth
8
-8
-6
-4
-2
0
2
4
6
8
10
0 5 10 15 20 25 30Aver
age
Annu
al P
er C
apita
GD
P G
row
th,
2009
-201
3
Average Annual Investment, Percent of GDP (2009-2013)
High Efficiency Low Efficiency
Public Investment vs. GDP Growth
More efficient public investors get 1% more growth “bang” for their investment “buck” than less efficient public investors

III. Evaluating Public Investment Management a. Public Investment Management Assessment (PIMA)
The PIMA Framework
9
Planning1. Fiscal rules2. National & Sectoral Plans3. Central-Local Coordination4. Management of PPPs5. Regulation of Infra. Corps.
Allocating6. Multi-year budgeting7. Budget Comprehensiveness8. Budget Unity9. Project Appraisal10. Project Selection
Implementing11. Protection of Investment12. Availability of Funding13. Transparency of Execution14. Project Management15. Monitoring of Assets

III. Evaluating Public Investment Management b. PIM Strengths and Weaknesses
10
PIMA Score by Institution
1. Fiscal rules2. Natl/Sectoral Planning
3. Central-Local Coord.
4. PPP
5. Infrastructure Company Regulation
6. Multi-year Budgeting
7. Budget Comprehensiveness8. Budget Unity9. Project Appraisal
10. Project Selection
11. Investment Protection
12. Funding Availability
13. Budget Execution Transparency
14. Mgmt. of Project Implementation
15. Monitoring of Public Assets
Advanced
Emerging
Developing 1 - 5: Planning
6 - 10: Allocating
1 - 5: Planning
6 - 10: Allocation

IV. Explaining Public Investment Performance a. Public Investment Efficiency & Productivity
Stronger PIM institutions associated with more efficient investment…
…and (more weakly) associated with more productive investment
11
PIMA Score vs. PI Efficiency PIMA Score vs. PICOR
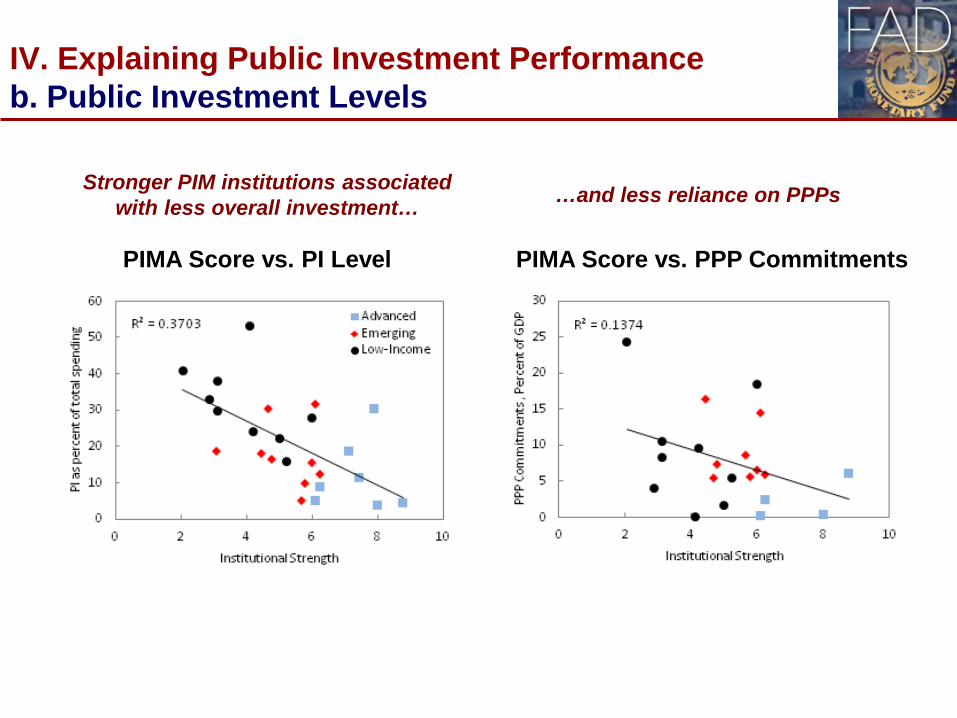
IV. Explaining Public Investment Performance b. Public Investment Levels
Stronger PIM institutions associated with less overall investment… …and less reliance on PPPs
12
PIMA Score vs. PI Level PIMA Score vs. PPP Commitments

IV. Explaining Public Investment Performance c. Public Investment Stability
Stronger PIM institutions associated with more stable levels of investment…
…and more stability in the allocation of investment between sectors
13
PIMA Score vs. Overall PI Volatility
0
5
10
15
20
25
30
35
40
45
0 2 4 6 8 10
Vola
tility
Institutional Strength
Correlation Coef: -0.59
0
1
2
3
4
5
6
7
0 2 4 6 8 10
Chur
n
Institutional Strength
Correlation Coef: -0.57
PIMA Score vs. PI “Churn”
Advanced Emerging
Low Income

IV. Explaining Public Investment Performance c. Public Investment Execution
Stronger PIM institutions associated with more credible capital budgets…
…and lower perceptions of government corruption.
14
0
10
20
30
40
50
60
70
80
90
0 2 4 6 8 10
Impl
emen
tatio
n
Institutional Strength
Correlation Coef: -0.53
0
1
2
3
4
5
6
0 2 4 6 8 10
ICRG
Inte
grity
Sco
re
Institutional Strength
Correlation Coef: 0.60
PIMA Score vs. PI Over/Under Execution PIMA Score vs. Government Integrity
Advanced Emerging
Low Income

V. Conclusions, Recommendations, and Next Steps: a. Preliminary Conclusions
1. Scope to improve public investment efficiency by 40 percent on average across 25 sample countries
2. Higher efficiency countries get 1 percent of GDP more growth “bang” for their investment than lower efficiency countries
3. Strengthening public investment management (PIM) practices can reduce the “efficiency gap” by almost half
4. Stronger PIM practices improve efficiency by ensuring: – More sustainable levels of investment and PPPs – More stable profile and allocation of investment spending – Less overspending during project execution – Lower levels of rent-seeking
5. Stronger PIM practices positively (but weakly) associated with more economically productive public infrastructure (PICOR) 15
V. Conclusions, Recommendations, and Next Steps: b. Tentative Recommendations
1. Advanced economies need to introduce more investment-friendly fiscal frameworks, strengthen central-local coordination, and adopt more binding MTBFs
2. Emerging economies should unify current and capital budgets and adopt more rigorous and transparent mechanisms for investment project appraisal, selection, and management
3. Developing countries should focus on strengthening investment project execution and management of risks associated with rapid growth in PPPs
4. All countries would benefit from integrating strategic investment planning and budgeting
16

V. Conclusions, Recommendations, and Next Steps: c. Next Steps in Conjunction with Other IFIs
17
Date Milestone
May 2015 Publication of IMF Policy Paper Making Public Investment More Efficient
Summer 2015 Release of cross-country data set on capital stocks public investment quality (PIQ-X) and efficiency (PIE-X)
Autumn 2015 Piloting of Public Investment Management Assessment (PIMA) diagnostic
Winter 2015 Launch of IMF PPP Fiscal Risk Analysis and Management (P-FRAM) tool
Spring 2016 Finalization of PIMA in light of lessons from pilots
Ongoing Greater emphasis in IMF technical assistance on strengthening public investment management