get smart think small - pce.parliament.nz
TRANSCRIPT

Get smart,think smallLocal energy systemsfor New ZealandREDESIGN
I've been designed to be easy to
read in electronic form as well. See
www.pce.govt.nz.
REDUCE
We always aim to reduce our own
resource use. I’m made of 100%
recycled paper.
REUSE
Don’t need to keep a copy? Feel free
to share me around or return me to
the PCE and they’ll pass me on to
someone else.
RECYCLE
I’m also 100% recyclable.
Parliamentary Commissioner for the EnvironmentTe Kaitiaki Taiao a Te Whare PäremataPO Box 10-241, WellingtonAotearoa New Zealandwww.pce.govt.nz

About the Parliamentary Commissioner for the Environment
Te Kaitiaki Taiao a Te Whare Päremata
Independent scrutiny, advocacy and advice for a better environment
The Parliamentary Commissioner for the Environment (PCE) is an independent officer
of Parliament with wide-ranging powers to investigate environmental concerns. The
office was set up under the Environment Act 1986, and the Commissioner is appointed
for a five-year term. In 2002, Commissioner Dr Morgan Williams was appointed to a
second five-year term. The primary objective of the office is to contribute to maintaining
and improving the quality of the environment in New Zealand.
The PCE has five key roles:
• Environmental systems guardian – checking on the ability of management regimesto ensure that the quality of the environment is maintained or improved
• Environmental watchdog – responding to the general public’s enquiries andconcerns, and encouraging preventative measures and remedial actions to protectthe environment.
• Information provider, facilitator and catalyst - providing information about theenvironment to a wide range of groups and individuals
• Environmental management auditor – evaluating the performance of publicagencies to ensure they are meeting their environmental responsibilities
• Advisor to Parliamentary Select Committees – responding to requests from SelectCommittees to provide assistance and advice.

Parliamentary Commissioner for the EnvironmentTe Kaitiaki Taiao a Te Whare ParemataPO Box 10-241, WellingtonAotearoa New Zealandwww.pce.govt.nz
Get smart, think small Local energy systems for New Zealand
¯

G E T S M A R T, T H I N K S M A L L2
This report and other publications by the Parliamentary Commissioner for the Environment (PCE) are available on the PCE’s website: www.pce.govt.nz.
Investigation teamDoug CloverReece MartinNick Potter
With assistance fromSarah McLaren Martin Barry
Internal reviewersHelen BeaumontIain McAuley
External reviewersGerry CoatesAlister GardinerMike O’Connell
AcknowledgementsThe Parliamentary Commissioner for the Environment and his investigation team would like to thank all those who assisted with the research and preparation of this report.
EditingWrite Group Limited, PO Box 9840, Wellington
Proof readingKathryn Botherway
Design and layoutChristine Prebble, Mosaic Consultants Ltd
PhotographsMichael Lawley, Ecoinnovation (top of page 33)National Institute of Water and Atmospheric Research (Maori research unit –Te Kuwaha) (bottom of page 33)Reece Martin (page 43)
Cover illustrationSimon Shaw, Watermark Ltd, www.watermarkltd.com
Internal illustrationsTrevor Plaisted, Design and Illustration Services (pages 10-11, 17, 18 and 35)
Bibliographic referenceParliamentary Commissioner for the Environment. 2006. Get smart, think small: Local energy systems for New Zealand. Wellington: Parliamentary Commissioner for the Environment.This document may be copied provided that the source is acknowledged.ISBN: Print version 1-877274-61-5 Electronic version 1-877274-41-0

P C E 3
Contents
Preface 5
Executive summary 7
1 Introduction 9
1.1 What are local energy systems? 9
1.2 Why should we consider local energy systems for New Zealand? 12
1.3 Why has the PCE prepared this report? 13
1.4 What is the scope of this report? 14
2 The nature of local energy systems 16
2.1 The evolution of New Zealand’s energy system 16
2.2 An alternative future for New Zealand’s energy system 18
2.3 The pieces of the jigsaw 19
2.4 Putting the pieces together 31
3 The impacts of local energy systems 34
3.1 The benefi ts of local energy systems 34
3.2 The challenges of local energy systems 44
4 Local energy potential in New Zealand 46
4.1 The EHMS study of the potential for local energy technologies in NZ 46
4.2 Similar studies in other countries 55
4.3 Summary 56
5 Barriers to the adoption of local energy systems in New Zealand 57
5.1 Awareness and understanding of local energy systems 57
5.2 The costs and value of local energy systems 61
5.3 Technical challenges 65
5.4 Capacity for design, installation, and maintenance of local energy systems 69
5.5 Developing knowledge about local energy technologies 72
5.6 Summary 74
6 The institutional and regulatory framework 76
6.1 Institutional framework 76
6.2 Regulations and standards 81
6.3 Summary 90
7 Making the shift to local energy 91
7.1 The potential for local energy in New Zealand 91
7.2 The time is right 91
7.3 The way forward 92
Glossary 98
Acronyms 102

G E T S M A R T, T H I N K S M A L L4
Endnotes 103
References 107
Further reading 111
Appendix A: Summary of tables from EHMS study 112
Appendix B: Some key researchers and their projects 114
Appendix C: Net metering, net billing, and standard offer contracts 115
Appendix D: Germany’s combined incentive scheme 116
Appendix E: Funding for local energy research in New Zealand 117

P C E 5
Preface
Energy is at the heart of our daily lives. It heats the water for our morning cuppa and
shower, and on dark mornings lights the way to our mailbox and morning paper.
Hot tea and a warm shower are just two services we derive from energy that usually
comes from a distant source, such as a South Island hydro dam or a Taranaki gas fi eld.
In our families or local businesses we have little or no control over these sources of
energy nor the price of using them. We rely overwhelmingly on the bigger system and
those who manage it. Usually this presents no problem but on occasion the system
fails with far-reaching results – something downtown Wellington restaurateurs and
hoteliers became acutely aware of early in September 2006 when water infi ltrated
their gas supply pipes leaving many with no gas for hot water or cooking.
From production and use of energy come many of the greenhouse gas emissions that
are causing climate change. Human-induced climate change will dominate our future.
To reduce the emissions we need to wring more value out of every unit of energy we
produce. Climate change will also require us to build more resilient energy systems to
withstand increasingly frequent extreme weather.
These concerns, in part, prompted this study. So did the opportunities now arising
from the development of new energy technologies. These technologies will allow
people to take more control of how they choose to provide their non-transport
energy needs.
We refer to these as ‘local energy’ technologies and they offer a degree of control
that’s never before been achieved over how we source and manage our energy
requirements. These technologies also present another means of improving the
security of our electricity system.
As householders, consumers, and business operators, we can play a central role in
expanding the development of local energy systems in New Zealand. In the future,
decisions about how we use energy will be as important to us as where we live, the
size of our houses, our children’s schools, and where we go on holiday.
Studies indicate that promotion of energy effi ciency is not, on its own, an adequate
catalyst for change in the way we relate to energy, and it remains an invisible magic
in our homes. Getting us to ‘see’ it and understand its value appears to require new
stimuli. British research indicates that when some or all of the energy used in homes
or businesses is sourced locally through technologies such as solar panels and other
forms of microgeneration, and there are also technologies present such as smart
meters that provide people with real time information, people do switch on and use
energy more thoughtfully.1 As the research concluded:

G E T S M A R T, T H I N K S M A L L6
Making energy generation and management part and parcel of people’s homes and schools may hold the key to empowering and engaging energy consumers for the fi rst time.2
It is up to us to grasp these opportunities to help transform our energy system, but
what will be the catalysts? While this study indicates that signifi cant potential exists
for these technologies in New Zealand over the next 30 years, it also identifi es
many barriers.
Our culture of relying on large-unit, supply-side energy solutions is deeply ingrained.
This is not to criticise how we have done things in the past – that approach refl ected
world best practice and has served us well. However, my plea is that we collectively
accept we are rapidly moving into a very different world with new options, and our
ideas of how to ensure energy security must change.
The catalysts must come from more than just promoting energy awareness through
education programmes. As I discussed in my recent wind power report,3 being able
to invest in our rich endowment of renewable energy sources, particularly at the local
level, will be part of re-evaluating how we think about energy and the way we use it.
As in other areas of New Zealand’s energy sector, innovative leadership is needed.
With appropriate Government support and investment, energy businesses need to
promote and develop the new technologies.
Some SOEs, the Electricity Commission, and EECA have initiated programmes that
are considering how these technologies will fi t into the electricity system and what
opportunities they might present. But these initiatives will struggle without an
institutional and policy framework that recognises these new technologies do more
than just provide energy services – they can also bring improved health, regional job
creation, new opportunities for innovation, and reduced energy security risks.
Expanding our portfolio of energy solutions to include local energy requires catalysts
for change, investment and, above all, leadership. Given New Zealand’s energy
challenges, it is not a time to be incremental and timid. While acknowledging
current efforts, the recommendations in this report refl ect this. I’m confi dent that,
if implemented, they will lead to greater opportunities for many people and the
unleashing of considerable energy.
Dr J. Morgan Williams
Parliamentary Commissioner for the Environment
P C E 7
Executive summary
New Zealand’s electricity generating system is under pressure as electricity
consumption rises each year. The response to this increased demand has been to
build more large electricity generating plants. However, there is an alternative. Local
energy systems can provide energy services without reliance on remote large-scale
electricity generation.
Local energy systems have the potential to displace 16,000 GWh per year of
electricity from large power stations in 30 years time, or much sooner if there is
government support. This amount is more than the electricity consumed by the entire
residential sector in 2005 (12,732 GWh) and about equal to industrial sector use
(16,160 GWh) in the same year.
Local energy systems comprise several elements. At the core are technologies that
produce electricity or heat, on a small scale, close to where it is used. Generating
electricity on this scale is often referred to as microgeneration.
Other elements support this core element, including:
• technologies that control and manage the electricity or heat produced (control
systems, meters, inverters, batteries)
• heat-capture technologies that make use of ambient heat for space
or water heating
• measures that improve the thermal performance of the buildings where the
locally-produced energy is used
• measures and technologies that manage the demand for energy services and
maximise energy effi ciency
• the attitudes and behaviours of people interacting with local energy systems.
The potential advantages of local energy systems include:
• making use of energy sources, particularly renewable sources, that are not suitable
for large electricity generating plants
• reducing the use of non-renewable energy sources, and their related emissions of
greenhouse gases
• increasing the overall effi ciency and resilience of energy systems by spreading
energy generation throughout the network
• improving energy security by making end-users more self-reliant
• promoting economic competition by introducing new technologies into
the marketplace

G E T S M A R T, T H I N K S M A L L8
• encouraging regional development by creating jobs in New Zealand for designers,
manufacturers, and tradespeople
• raising individuals’ awareness of energy use, leading to behavioural changes
• improving health and reducing ‘fuel poverty’ by delivering warmer homes at lower
running costs.
Widespread adoption of local energy systems is held back by a number of factors,
including:
• a lack of public awareness and understanding
• the market’s failure to fully value all the benefi ts of local energy, making it
comparatively expensive
• specifi c research gaps
• a lack of capacity in the local energy sector
• an absence of demonstration projects tailored to the New Zealand situation
• various institutional and regulatory barriers.
Overall, the evidence points to a compelling argument in favour of government
intervention to kick-start local energy systems in New Zealand. This report sets
out that argument, provides a quantitative analysis of the potential for local
energy in New Zealand, examines the current barriers to its uptake, and provides
recommendations for overcoming these barriers and moving into a local
energy future.

C H A P T E R 1Introduction
The nationwide and local electricity grids, metering systems and regulatory arrangements that were created for a world of large-scale centralised power stations will need restructuring over the next 20 years to support the emergence of far more renewables and small-scale distributed electricity generation.4
Most New Zealanders enjoy quick and easy access to a reliable supply of energy.
Electricity, in particular, is readily available at the fl ick of a switch. Most of this
electricity is generated in large power plants and distributed through an elaborate
transmission infrastructure to where it is needed.
However, there are other ways of thinking about how we generate and distribute
electricity, and indeed how we use it in our homes, farms, offi ces, schools, and
communities. Today we have an opportunity to reshape New Zealand’s energy future
by taking advantage of new technologies and techniques for managing our energy
services5 at a local level (see Figure 1.1). This report explores that opportunity.
1.1 What are local energy systems?
The term ‘local energy systems’ describes methods for providing energy services
without depending on remote large-scale electricity generation. The idea of local
energy is not new: fi re, wind and water power have provided heat, pumped water,
and ground grain on a local scale for thousands of years. However, nowadays local
production of useful forms of energy, particularly electricity, can be accomplished
more effi ciently, with less effort, at lower cost, and with a greater degree of control
than ever before.
Today, local energy is about:
• using energy resources that are not easily available for use by large electricity
generating plants
• avoiding and reducing greenhouse gas emissions
• generating and using energy effi ciently
• avoiding the environmental harm caused by large electricity generating plants.
Local energy systems can use technologies that are common today, such as wood
burners and diesel generators, as well as new and emerging technologies such as
micro wind turbines, micro hydro turbines, solar photovoltaics, Stirling engines, and
fuel cells.
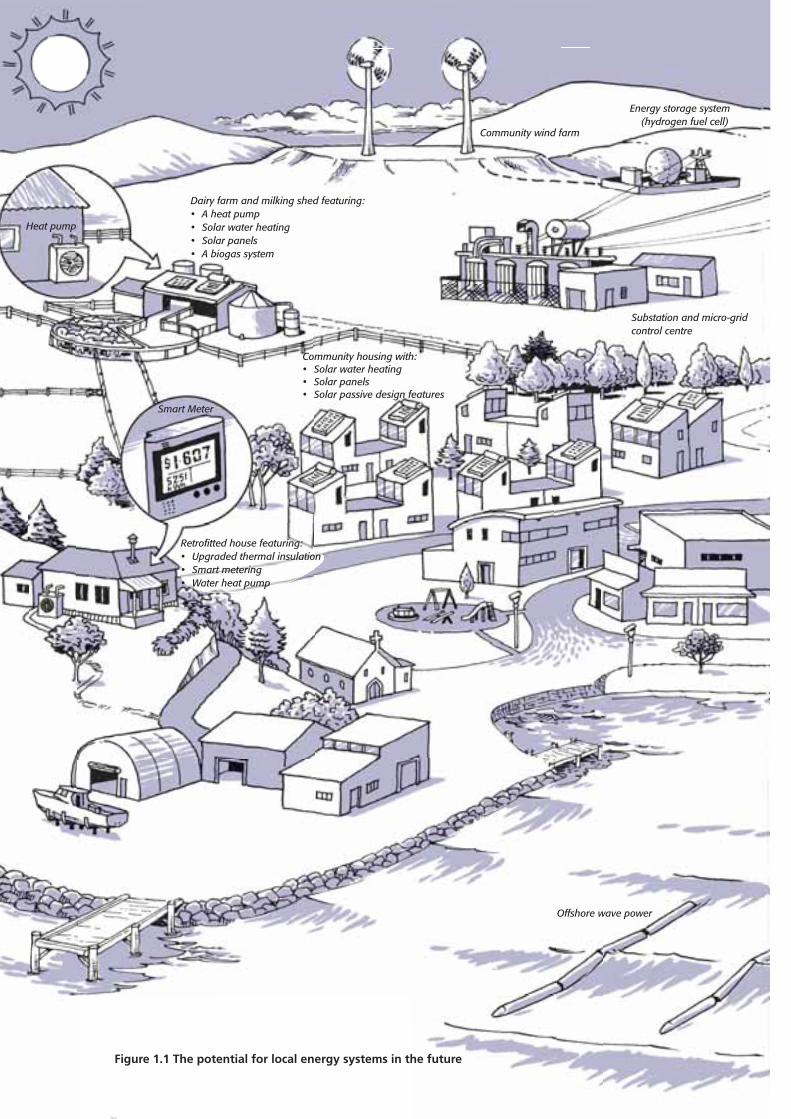
Dairy farm and milking shed featuring:• A heat pump• Solar water heating• Solar panels• A biogas system
Community housing with:• Solar water heating• Solar panels• Solar passive design features
Community wind farm
Energy storage system (hydrogen fuel cell)
Substation and micro-grid control centre
Smart Meter
Heat pump
Offshore wave power
Retrofi tted house featuring:• Upgraded thermal insulation• Smart metering• Water heat pump
Figure 1.1 The potential for local energy systems in the future
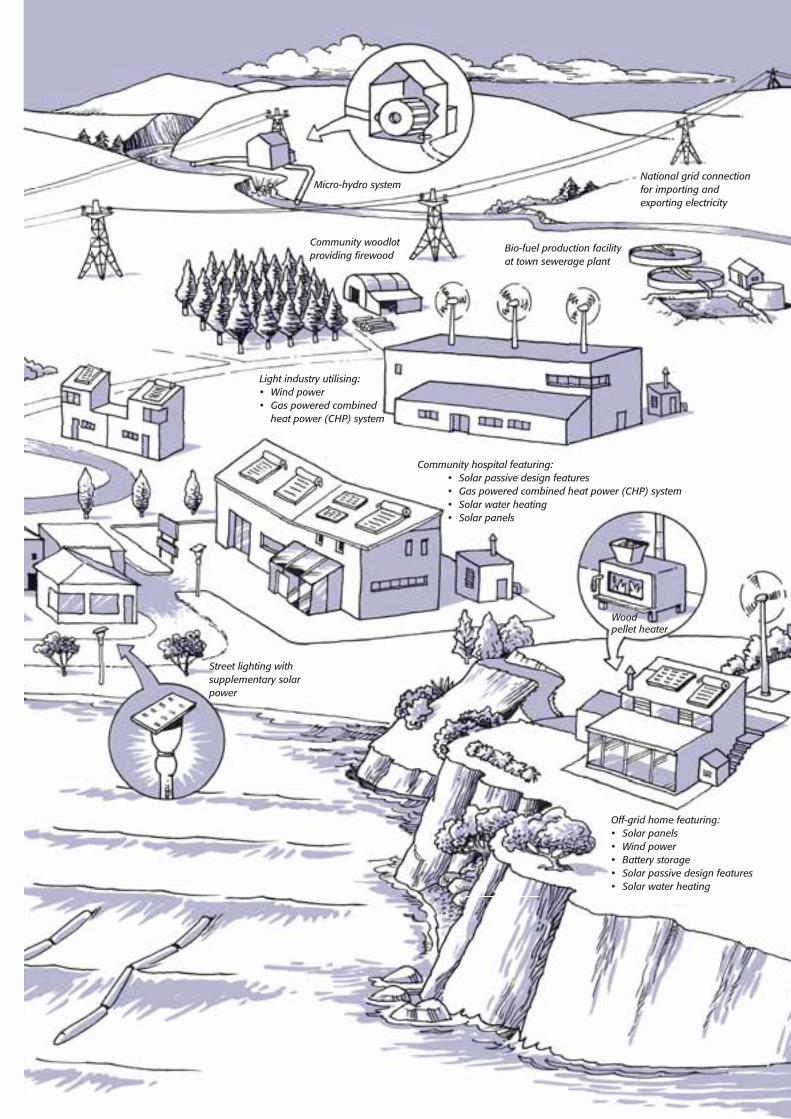
Off-grid home featuring:• Solar panels• Wind power• Battery storage • Solar passive design features• Solar water heating
Community hospital featuring:• Solar passive design features• Gas powered combined heat power (CHP) system• Solar water heating• Solar panels
Light industry utilising:• Wind power• Gas powered combined
heat power (CHP) system
Bio-fuel production facility at town sewerage plant
Community woodlot providing fi rewood
Micro-hydro systemNational grid connection for importing and exporting electricity
Street lighting with supplementary solar power
Woodpellet heater

G E T S M A R T, T H I N K S M A L L12
A local energy system comprises several elements. At the core of such a system is
the small-scale production of electricity, heat, or a combination of electricity and
heat, close to where people will use it. The small-scale production of energy is called
microgeneration.6
Closely associated with microgeneration is a group of technologies that control and
manage the fl ow of energy, particularly electricity. These enabling technologies include
smart control systems, energy storage technologies and, in the future when individual
systems are linked, micro grids and smart grids.
Local energy systems also use technologies and techniques that support
microgeneration either by delivering supplementary energy services, or by making
maximum use of each unit of energy produced. These supportive technologies include
those that capture ambient heat, such as solar hot water heaters and heat pumps,
and measures that improve the thermal and lighting performance of buildings, such as
passive solar design of buildings, roof insulation, and double-glazing.
Measures that provide the maximum value or service for each unit of energy produced
form the last technical element of local energy systems. These measures improve end-
use energy effi ciency and enable demand to be managed prudently.
Finally, local energy systems are not just about technologies: they have an important
human dimension. To be successful the users of these systems have to be actively
involved in their design and operation.
In this report, we use the term ‘local energy systems’ to convey the idea that while
microgeneration technologies are crucial in providing energy services to homes and
communities, they are only part of the ‘jigsaw’, and should not be considered in
isolation. This jigsaw concept is discussed further in Sections 2.3 and 2.4.
1.2 Why should we consider local energy systems for New Zealand?
The amount of electricity used in New Zealand has almost doubled over the last 25
years, and during the last decade it has increased by over 20 percent (1.8 percent
per year).7 The Government predicts that electricity use will keep growing by about
1.2 percent each year.8 Large electricity generating plants using hydro, gas, coal
or geothermal energy sources have provided most of this electricity.9 In the future,
however, new ways to satisfy the growing demand for electricity will need to
be found.
Today’s debate revolves around whether the way to meet this future demand is by
building more large generating plants, or whether local energy systems can provide a
feasible alternative solution.
Building large electricity generating plants in New Zealand is becoming more
challenging.

P C E 13
• The best large hydro sites have already been developed, and most of the
remaining big rivers have signifi cant conservation values.10
• The known large gas fi elds (Maui, Pohokura, Kapuni, and Kupe) will run down
over the next 25 years.11
• Large reserves of coal remain, but burning coal produces greenhouse gases and
confl icts with New Zealand’s Kyoto Protocol commitments to reduce emissions of
these gases.
• Large geothermal plants and wind farms could contribute signifi cantly to future
electricity generation.12 However, growing public opposition to the development
of new large projects adds to their cost.
In contrast, local energy systems have the potential to displace a signifi cant proportion
of the future electricity demand that would otherwise require investment in new
large plants.
This report argues that local energy systems can advance and strengthen New
Zealand’s energy system by complementing the current centralised energy system and
making better use of the wealth of renewable resources available here.
New Zealand stakeholders and research institutions are researching ways of improving
our knowledge and use of local energy technologies. However, there has been no
serious attempt so far to provide a comprehensive programme to identify appropriate
technologies and assess their potential use in New Zealand.
1.3 Why has the PCE prepared this report?
The Parliamentary Commissioner for the Environment (PCE) has ongoing work in the
electricity, energy, and environment spheres. Each year we independently assess the
environmental performance of New Zealand’s electricity sector.13 We have identifi ed
four main objectives for the sector as part of this assessment process:
• managing growth in electricity demand
• promoting renewable energy
• promoting the electricity system’s security and effi ciency
• minimising environmental impacts.14
The PCE considers that local energy systems can contribute signifi cantly to achieving
these objectives. This belief is also consistent with:
• the objectives in the Electricity Act 1992
• the Government’s stated policy of promoting demand-side management and
energy effi ciency

G E T S M A R T, T H I N K S M A L L14
• removing the barriers to investment in new generation technologies especially
those that are based on renewable sources of energy and distributed generation
technologies15
• New Zealand moving towards meeting its Kyoto Protocol obligations to reduce
greenhouse gas emissions.
Proposals to upgrade the national electricity grid, which is the heart of New Zealand’s
centralised electricity system, have also caused some concern. Investing in local energy
systems may be a way to delay or avoid some of these grid upgrades. However, this
report does not specifi cally examine alternatives to current grid upgrade plans.16
Finally, recent advances in microgeneration and energy management technologies
(including metering and monitoring systems) mean it is timely to examine the
potential for local energy systems in New Zealand.
1.4 What is the scope of this report?
This report is intended for policymakers, businesses, and entrepreneurs in the energy
sector. It explores the potential for local energy systems in New Zealand, and gives
guidance on how to encourage their development.
It is important to note that the scope of the report is not limited to microgeneration
of electricity – an assumption often made when people are discussing how to produce
energy. As well as electricity-generating technologies, local energy systems include
heat-generation technologies, heat capture through building design, use of energy
sources directly (such as using solar energy to heat water), energy effi ciency measures,
and other techniques for providing energy services to homes and communities.
Local energy systems can be developed on any scale – from homes and small
businesses to large offi ces and community facilities such as schools and hospitals.
They can even be used in large industrial facilities, although they are unlikely to make
a major contribution to the demands of energy-intensive industries.
This report focuses on small-scale local energy that could be used by:
• individual households and neighbourhood networks
• farms
• small rural communities
• small- to medium-sized enterprises (SMEs) and community facilities.
Its main focus is on systems where the microgeneration output is typically up to
100 kW. However, this fi gure is arbitrary, and larger systems are conceivable for many
of these applications, such as larger farms and enterprises.
P C E 15
We do not advocate any particular technologies or mix of technologies, as different
technologies will be more or less suitable at specifi c sites for specifi c needs. We
examine a range of well-established and emerging technologies that are (or could be)
used in New Zealand.
1.4.1 What the report does not cover
We have excluded the energy demand of the transport sector from the scope of
this report. This is because this report has come out of the Electricity, Energy, and
the Environment (EEE) work programme of the Commissioner, which focuses on
electricity and closely related energy sectors (e.g. the natural gas and coal sectors).17
Furthermore, the transport sector is, so far, largely distinct from the stationary energy
sector; although this is set to change with the increased use of biofuels, fuel cells,
plug-in hybrids and other forms of transport using reticulated electricity.
1.4.2 The structure of the report
This introductory chapter has provided an overview of local energy systems, and why
it is timely to consider their adoption in New Zealand.
Chapter 2 provides more detail about local energy systems and their associated
technologies.
Chapter 3 outlines the benefi ts of local energy systems compared with using
electricity from large generating plants.
Chapter 4 analyses the potential for uptake of these systems in New Zealand,
Chapter 5 discusses the barriers, and Chapter 6 looks at the institutional and
regulatory framework.
Chapter 7 looks ahead with recommendations for action.

C H A P T E R 2The nature of local energy systems
This chapter provides a brief history of the New Zealand energy system, and looks at
how local energy can form part of its future (Sections 2.1 and 2.2). It then describes
the parts of the local energy jigsaw (Section 2.3), and how these parts fi t together as
integrated energy service delivery systems (Section 2.4). Two case studies demonstrate
how local energy is being used now in New Zealand.
2.1 The evolution of New Zealand’s energy system
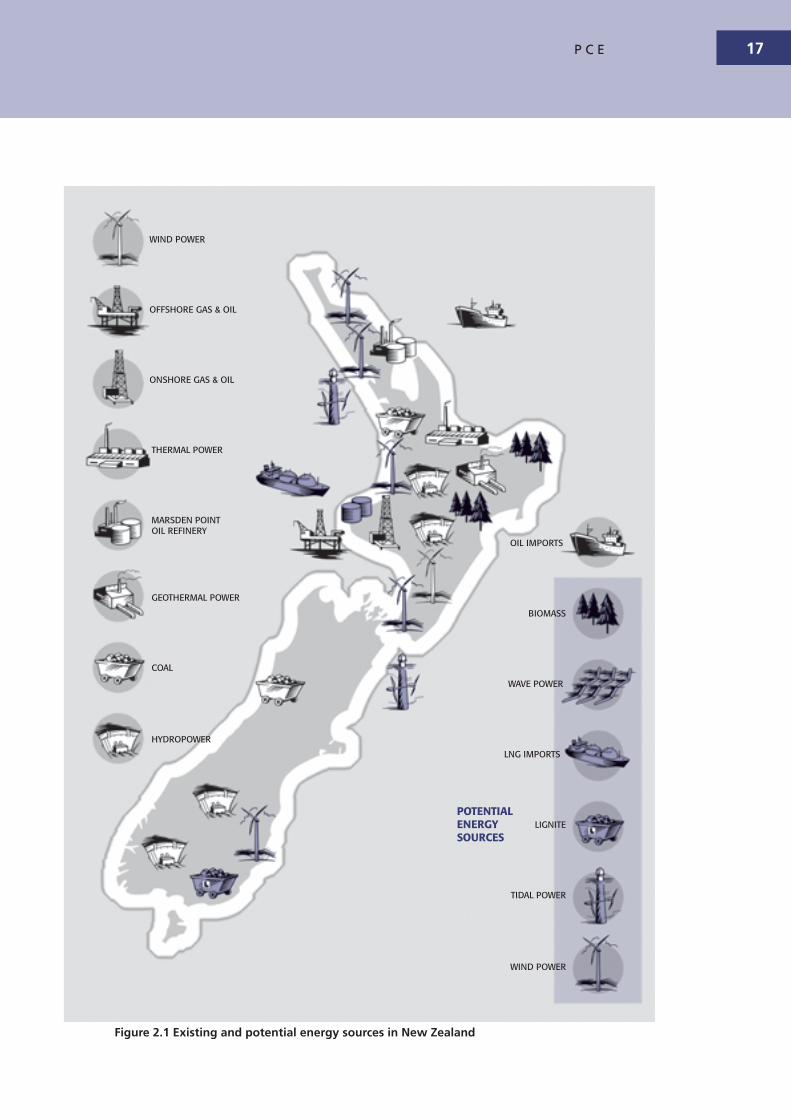
New Zealand is a country that is richly endowed with energy resources (see Figure
2.1). Before European settlement, Maori used wood and other similar forms of
biomass and geothermal energy for their cooking and heating needs.
By the early 20th century, New Zealand’s energy system was still mostly based on
locally available resources. People burned wood and coal for heat and electric power,
and built small hydro schemes in local waterways to generate electricity. Local
authorities and private companies initiated small-scale energy generation projects
to meet local needs, and many towns had their own coal gas (gasifi cation of coal)
production plants.
From the 1920s onwards, a more centralised energy system took shape. The
Government made major investments in large-scale electricity infrastructure as New
Zealand followed the lead of other industrial countries. Increasingly, electricity was
generated by large power plants located near concentrated energy sources such as
fast-fl owing rivers, geothermal hot spots and accessible coal resources.
The main hydro power plants were developed on the Waitaki and Clutha rivers
in the South Island and on the Waikato river system in the North Island between
the 1930s and the 1980s. The Manapouri hydro power plant in Fiordland was
constructed in the late 1960s. The fi rst coal-fi red power plant was built at Meremere
in 1958 and decommissioned in 1990. The coal and gas fi red Huntly power plant
was commissioned in 1983 and, at 1000 MW, remains the largest power plant in
New Zealand today. Wairakei, commissioned in 1958, was one of the world’s fi rst
geothermal power plants.
The late 1990s introduced a period of development based on using high effi ciency
gas-fi red combined cycle power plants for electricity generation (e.g. Southdown
in 1997, Taranaki Combined Cycle plant in 1998, and Otahuhu B in 2000). More
recently, power development has focused on wind power: the small Hau Nui wind
farm in 1996, Tararua I in 2000, and Te Apiti in 2004 (see PCE, 2006b). New wind
power projects to generate over 1000 MW are under consideration.
P C E 17
Figure 2.1 Existing and potential energy sources in New Zealand
WIND POWER
OFFSHORE GAS & OIL
ONSHORE GAS & OIL
THERMAL POWER
MARSDEN POINT OIL REFINERY
GEOTHERMAL POWER
COAL
HYDROPOWER
OIL IMPORTS
POTENTIALENERGYSOURCES
BIOMASS
WAVE POWER
LNG IMPORTS
LIGNITE
WIND POWER
TIDAL POWER

G E T S M A R T, T H I N K S M A L L18
Towards the end of the 20th century, gas from the large Maui fi eld started to play
an infl uential role in New Zealand’s energy system. In the North Island, some of this
gas was transmitted at high pressure and distributed at low and medium pressure
to homes and businesses for direct use (for cooking, and space and water heating).
However, most of the gas (excluding that used in the petrochemicals industry) was
used in large North Island power plants to generate electricity. The South Island did
not have access to the natural gas source or distribution system but relied on Liquid
Petroleum Gas (LPG) that was shipped to ports in Canterbury and Otago.
The result of all these developments is that today New Zealand has a centralised
transmission and distribution system, where most electricity and gas is generated
or sourced far from where people live and use energy. It is based on large power
plants that are connected to an extensive network of long-distance transmission lines
feeding local power networks and lines. The electricity network allows the system
operator to dispatch generation as required, optimise the fl ows of electricity, and
ensure that there is capacity ready to support the system as required. However, the
power fl ows only in one direction: from a central power station, through transmission
lines to local distribution networks, and on to electricity users (see Figure 2.2).
Figure 2.2 Diagram of New Zealand’s electricity system
2.2 An alternative future for New Zealand’s energy system
Looking to the future, the major trend for New Zealand this century could be
decentralisation – that is, the generation, management, and storage of electricity
and/or heat close to where it is used. This does not mean going back, nor does it
necessarily mean a proliferation of segregated stand-alone systems. It means making
the most of what New Zealand already has, and adding newer, more sustainable
systems and technologies suited to individual and community needs. Local energy
systems could help deliver this alternative future.
HYDRO ELECTRIC POWER STATION
THERMAL POWER STATION
WIND FARM
NATIONAL GRID
LOCALNETWORKS
CITIES

P C E 19
2.3 The pieces of the jigsaw
Microgeneration technologies are at the heart of local energy systems. However, they
have limited potential when used in isolation. Adopting microgeneration technologies
should be supported by various other technologies and measures. These include:
• enabling technologies that provide control and monitoring, and storage services
• heat-capture technologies that use ambient heat
• building design and performance measures that can signifi cantly improve energy-
effi ciency for heating, cooling, and lighting
• effi cient management of energy services, as the management of peak loads is
critical, particularly for off-grid systems
• changes in people’s attitudes and behaviour that result in more effective use of
energy (this helps local energy systems perform up to their full potential)
• whether to have an off-grid or on-grid system
• whether systems will be able to link to form micro grids (small local networks) that
permit micro generators to share smart control and energy storage equipment,
and thereby have increased security of supply.
It is therefore appropriate to think of a local energy system as a jigsaw: when all
the different pieces are fi tted together correctly, they create a single integrated and
effective system that can deliver appropriately scaled energy services to households,
SMEs, and small communities. The pieces are described in Sections 2.3.1 to 2.3.8
below, and Section 2.4 shows how they fi t together.
2.3.1 Microgeneration technologies
The technology exists to enable a radical overhaul of the way in which energy is generated, distributed and consumed – an overhaul whose impact on the energy industry could match the internet’s impact on communications.18
The microgeneration technologies that form the core of local energy systems can be
categorised according to whether they generate heat, electricity, or both heat and
electricity (combined heat and power). Examples of these technologies are listed in
Table 2.1, and the accompanying box also highlights how some of these are
being used.

G E T S M A R T, T H I N K S M A L L20
Table 2.1 Examples of existing and emerging microgeneration technologies
Technology Energy form Comments
Heat generation
Wood pellet burner or industrial combustor units
Biomass New systems are highly effi cient burners of biomass to produce heat. Can be used in a domestic situation for water and/or space heating, or small-scale industrial processes
Gas and coal burners; gas water heaters and cookers
Fossil fuels There are various direct space and water heating applications. Gas is often used for cooking.
Electricity generation
Reciprocating engine, diesel or biofuel generator
Fossil fuels Generators can provide electricity in emergencies or when other sources of renewable energy are unavailable. There are many applications and sizes, but they are normally used as a standby power option.
Solar photovoltaics (PV)
Solar PV can be installed to capture the energy of sunlight and produce electricity through a photochemical reaction.
Micro hydro Water These systems utilise nearby water sources to drive a micro turbine to produce electricity; they can provide continuous power depending on water availability.
Micro wind turbine
Wind Micro wind turbines can be either roof or wall-mounted, or erected on a wind mast. Various sizes of turbine (and output) are available.
Wave power Waves Two types of wave power technologies are currently being developed: offshore (e.g. the Pelamis) and land-based (e.g. the Limpet).
Combined heat and power generation
Fuel cells Hydrogen Use hydrogen (produced on-site or imported) to produce both heat and electricity. Currently an emerging technology at the prototype phase.
Stirling engine
Micro gas turbines
Natural gas (and other fossil fuels)
Designed to replace a central heating boiler (or water boiler) and supplement electricity supply.

P C E 21
A local energy system in action: the Lawley family
Local energy is an integral part of the lives of the Lawley family in Taranaki. Their rural home near New Plymouth is energy self-suffi cient, and their local energy system provides suffi cient energy for their two businesses, Eco-Inn Backpacker Lodge and Ecoinnovation.
Ecoinnovation specialises in local energy systems and sells and manufactures various microgeneration components for small-scale renewable energy systems. Ecoinnovation can convert Fisher and Paykel ‘smart drive’ washing-machine components into generators for small-scale wind and hydropower turbines.
The Lawleys have used a variety of microgeneration technologies on their property, including:
• four sets of solar photovoltaic (PV) panels (totalling 1.2 kW), and solar water heating (including solar water under-fl oor heating)
• three micro wind turbines
• a mini hydropower system and a water ram for water pumping
• a woodstove for space and water heating.
In addition, they have batteries to store electricity generated from the solar, wind and hydropower microgeneration technologies, and an inverter to convert the battery power to useful electricity. They have also made good use of building insulation, and have a shower with a heat recovery unit and a guest spa pool heated by solar water heating.
Further information on Ecoinnovation and the Eco-Inn is available on the internet at www.ecoinnovation.co.nz and www.ecoinn.co.nz.
2.3.2 Smart control and information technologies
Technologies that provide information on, and the means to control, energy
production and use are essential elements for local energy systems. These
technologies have the capability to display and store information, communicate that
information to the local energy system manager or owner (either on site or remotely),
and even allow for the remote control of the system.
Smart (or advanced) electricity meters are the key piece of information technology
for on-grid local energy systems. Smart meters have a range of features beyond
just measuring the amount of electricity used by the consumer. They can measure
electricity fl ows (imports and exports) and provide both consumers and lines
companies with real-time information in a range of formats. For example, electricity
use can be shown in kilowatt hours (kWh) or cost fi gures ($). Smart meters also
incorporate data storage (for later analysis) and communication systems with the
potential for remote control.

G E T S M A R T, T H I N K S M A L L22
Table 2.2 Examples of energy storage technologies
Class of technology Examples Comments
Chemical energy storage
Lead acid batteries
Nickel cadmium batteries
Nickel metal hydride batteries
Lithium ion (Li ion) batteries
Lithium polymer batteries (Li Poly or LiPo)
Sodium sulphur batteries (NAS)
One of the oldest and most developed battery technologies. It is a low cost and popular storage choice. Its application for energy storage, however, has been very limited due to its short cycle life.
Lithium ion and lithium polymer batteries have begun to take over from nickel-based batteries in the market. However, a number of technological challenges must be overcome before these will be suitable for application at the local energy scale.
NAS batteries will probably be developed for larger scale applications. There are also safety issues as the sodium is corrosive.
Flow batteries A form of battery in which electrolyte is stored outside the battery and then fl ows through a power cell/reactor where the chemical energy is converted to electricity.
The great advantage of this system is that electricity production is limited only by the capacity of the electrolyte storage reservoirs.
Hydrogen fuel cells Surplus electricity can be used to electrolyse hydrogen from water. This hydrogen is then stored and later used in a fuel cell to produce electricity.
Biogas (i.e. methane) from anaerobic digestion
Anaerobic digestion is a low temperature biological process to produce biogas (mainly methane) from non-woody, wet organic material (often animal and human waste). This gas can be stored for later use.
Mechanical energy storage
Compressed air, fl ywheels
Compressed air and power fl ywheels are most suitable for energy storage systems at a larger scale than those included within the scope of this study.
Pumped hydro storage
Pumped storage involves pumping water up hill into a reservoir using surplus electricity. This water can then be used later to generate hydro-electricity when there is high demand.
Energy stored in an electric fi eld
Ultra or super capacitors
Ultra-capacitors are suitable short time, high value energy boost systems.
However, they might be suitable for buffering small amounts of fl uctuating energy, for example from an individual wind turbine.
Source: Adapted from East Harbour Management Services (EHMS), 2006.
P C E 23
The United Kingdom’s microgeneration strategy has highlighted the importance of
smart meter technologies in microgeneration systems:
It is important that as work continues to develop on the costs and benefi ts of smart meters the assessment includes the interaction of smart meters with microgeneration technologies.19
Smart meters are considered an essential element in an effi cient electricity system.20
They enable microgeneration technologies to integrate into existing networks, and
with appropriate tariffs can make these projects more economically viable.
In summary, smart meters help create competition in the electricity market, bring
about energy effi ciency, and increase the uptake of microgeneration technologies.
2.3.3 Energy storage
Many local energy sources are intermittent – that is, they are not available for energy
generation at all times. For example, electricity generated from micro wind turbines
and solar photovoltaic panels is available only when the wind is blowing and the sun
is shining. To preserve continuity of supply, the local energy system must either be able
to connect to the national grid when local generation is not available, or incorporate
some form of energy storage.
There is considerable ongoing research into improving and developing energy storage
technologies, and reducing the costs. Table 2.2 summarises these technologies.
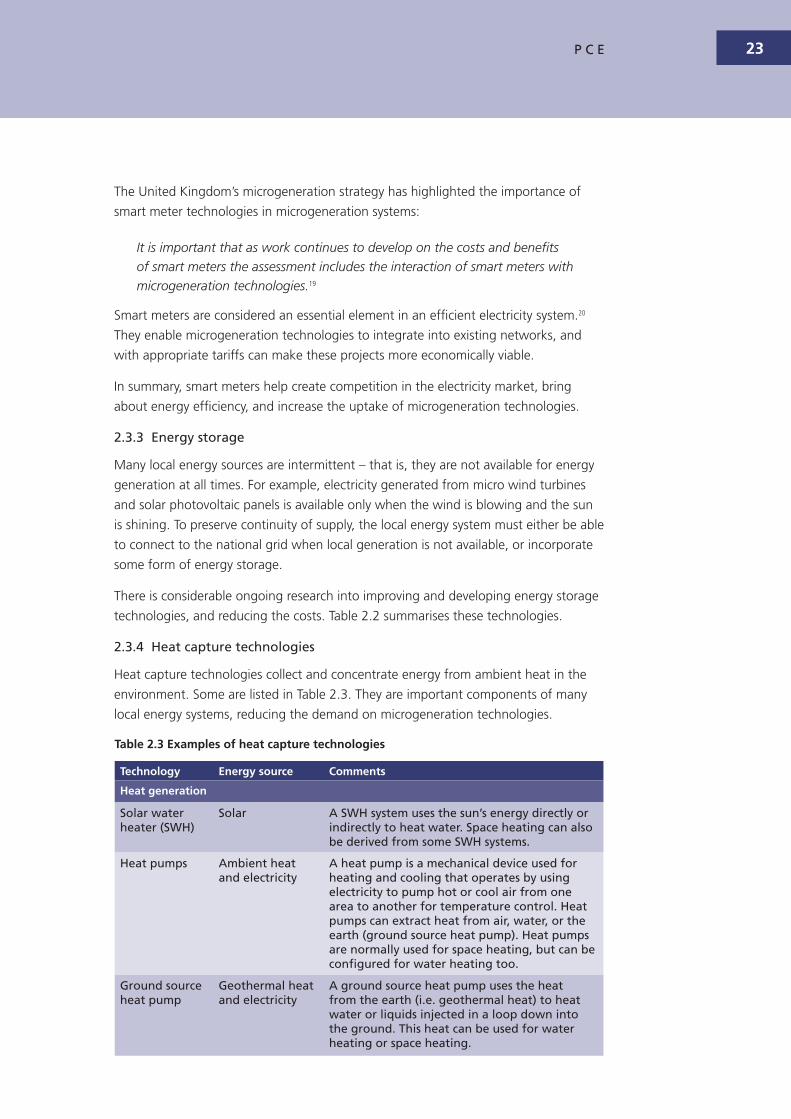
2.3.4 Heat capture technologies
Heat capture technologies collect and concentrate energy from ambient heat in the
environment. Some are listed in Table 2.3. They are important components of many
local energy systems, reducing the demand on microgeneration technologies.
Table 2.3 Examples of heat capture technologies
Technology Energy source Comments
Heat generation
Solar water heater (SWH)
Solar A SWH system uses the sun’s energy directly or indirectly to heat water. Space heating can also be derived from some SWH systems.
Heat pumps Ambient heat and electricity
A heat pump is a mechanical device used for heating and cooling that operates by using electricity to pump hot or cool air from one area to another for temperature control. Heat pumps can extract heat from air, water, or the earth (ground source heat pump). Heat pumps are normally used for space heating, but can be confi gured for water heating too.
Ground source heat pump
Geothermal heat and electricity
A ground source heat pump uses the heat from the earth (i.e. geothermal heat) to heat water or liquids injected in a loop down into the ground. This heat can be used for water heating or space heating.

G E T S M A R T, T H I N K S M A L L24
2.3.5 Building design and performance measures
Buildings can be considered as constructions that capture heat to provide a
comfortable environment in which to live and work. The building envelope (i.e. the
building fl oor, walls, and roof) regulates the transfer of energy, in the form of heat
and light, between external and internal environments. In effect, building envelopes
can be considered an integral part of local energy systems, because they help provide
the energy services of light, space heating, and space cooling.21
However, the building envelope on its own often cannot maintain the desired level of
comfort, and needs supplementary sources of energy.
The ability of a building envelope to regulate light and provide space heating and
cooling depends on factors such as:
• for light: orientation toward the sun, area and location of glass, degree and type
of shading
• for space heating: the use of thermal mass to retain captured heat (i.e. walls and
fl ooring that absorb and release solar heat), and the use of increased levels of
insulation to slow heat loss
• for space cooling: shading to prevent overheating, and natural ventilation to allow
heat to escape.
Variability in these factors will affect the performance of the building envelope and
the requirements from other elements of the local energy system.
The measures available to maximise a building envelope’s ability to provide light,
heating, and cooling depend on whether it is a new building or a retrofi t of an
existing one. In general, retrofi ts focus on improving a building’s insulation. Other
options, such as improving solar collection or adding thermal mass, are usually ruled
out by technical diffi culties and cost. However, a wider range of measures can be
considered when designing a new building.
Some specifi c measures that can improve the building envelope’s role are listed in
Table 2.4.22
2.3.6 End-use effi ciency and energy management
Energy effi ciency measures are any measures that increase the net benefi ts per unit of
energy.23 End-use effi ciency measures are those applied at the point where the energy
(e.g. electricity, gas, or wood) is converted into the desired energy service (e.g. heat or
cooling, light, or motive power).
Examples of such end-use measures include:
• energy-effi cient refrigerators
• compact fl uorescent lights

P C E 25
Table 2.4 Measures for improved building performance
Type of measure Examples Comments
Insulation Building insulation
Double glazed windows
Various natural and synthetic insulating materials can be used in ceilings and other cavities (i.e. walls and fl oors) to prevent heat loss.
Double glazed windows – installed on new buildings or retrofi tted on old buildings – reduce heat loss compared with single-glazed windows.
Capture of ambient solar heat and light
Passive solar design features (i.e. building orientation, appropriate design, and building materials)
Most cost-effective when incorporated into the initial design of a building (as opposed to a retrofi t).
• correctly sized and maintained electric motors
• liquid crystal display televisions
• low fl ow shower heads.
Energy management measures are those that manage the use of the system to
minimise wastage and reduce peak loads. Such measures can be as simple as
changing the time when energy services are required (for example, doing the
dishwashing late at night). Another simple example of demand management is using
automated lighting, which helps avoid unnecessary use of electric lights. The most
common example in New Zealand is ‘ripple control’ that allows a lines company to
switch off hot water heaters at times of peak demand. In return for accepting this
limitation, the customer pays a lower tariff. More sophisticated energy management
measures include automated monitoring and control of equipment use to optimise
power consumption.
Although they are not discussed in detail in this report, energy management
measures can, when incorporated into the design of local energy systems, make those
systems smaller and cheaper. Such measures are therefore key pieces of the local
energy ‘jigsaw’.
2.3.7 People’s attitudes and behaviour
By their nature, local energy systems require people to be more involved in their
planning, design and operation. This is because local energy systems must be tailored
to the needs and circumstances of the end-users. Also, the end-user has to be more
involved in the operation of the system, even with modern control technologies.
G E T S M A R T, T H I N K S M A L L26
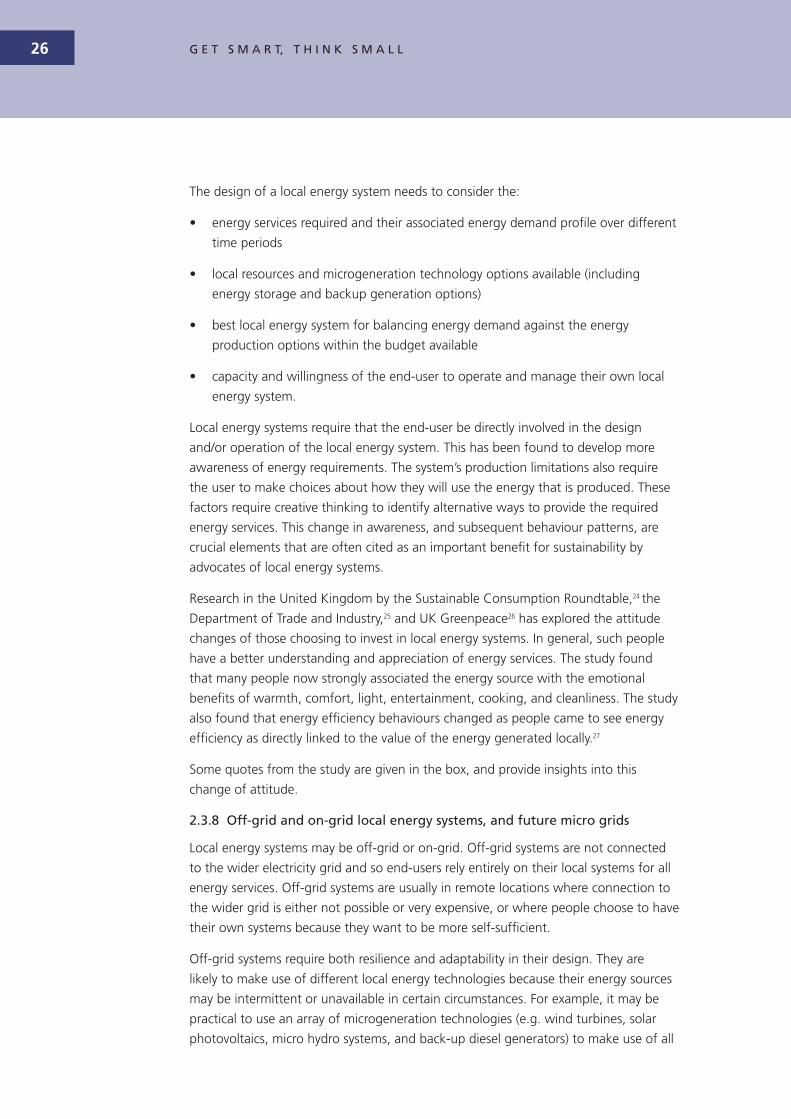
The design of a local energy system needs to consider the:
• energy services required and their associated energy demand profi le over different
time periods
• local resources and microgeneration technology options available (including
energy storage and backup generation options)
• best local energy system for balancing energy demand against the energy
production options within the budget available
• capacity and willingness of the end-user to operate and manage their own local
energy system.
Local energy systems require that the end-user be directly involved in the design
and/or operation of the local energy system. This has been found to develop more
awareness of energy requirements. The system’s production limitations also require
the user to make choices about how they will use the energy that is produced. These
factors require creative thinking to identify alternative ways to provide the required
energy services. This change in awareness, and subsequent behaviour patterns, are
crucial elements that are often cited as an important benefi t for sustainability by
advocates of local energy systems.
Research in the United Kingdom by the Sustainable Consumption Roundtable,24 the
Department of Trade and Industry,25 and UK Greenpeace26 has explored the attitude
changes of those choosing to invest in local energy systems. In general, such people
have a better understanding and appreciation of energy services. The study found
that many people now strongly associated the energy source with the emotional
benefi ts of warmth, comfort, light, entertainment, cooking, and cleanliness. The study
also found that energy effi ciency behaviours changed as people came to see energy
effi ciency as directly linked to the value of the energy generated locally.27
Some quotes from the study are given in the box, and provide insights into this
change of attitude.
2.3.8 Off-grid and on-grid local energy systems, and future micro grids
Local energy systems may be off-grid or on-grid. Off-grid systems are not connected
to the wider electricity grid and so end-users rely entirely on their local systems for all
energy services. Off-grid systems are usually in remote locations where connection to
the wider grid is either not possible or very expensive, or where people choose to have
their own systems because they want to be more self-suffi cient.
Off-grid systems require both resilience and adaptability in their design. They are
likely to make use of different local energy technologies because their energy sources
may be intermittent or unavailable in certain circumstances. For example, it may be
practical to use an array of microgeneration technologies (e.g. wind turbines, solar
photovoltaics, micro hydro systems, and back-up diesel generators) to make use of all

P C E 27
Changes of attitude associated with uptake of local energy systems
When the wind is blowing right up then I turn the electric heaters on – rather than use the gas from the gas bottles. Male, N. Lancashire, with off-grid wind.
As we had spent our own money we really began to take an interest and stopped leaving the TV on standby for example, and we are really careful not to leave the loft lights on any more. Male, Cheltenham, with solar PV and combined heat and power.
It has made me far more aware, when I look at the light bulbs I think that it’s me, I am the one generating my own electricity...it’s made me really aware of the weather…more connected as to what is happening at ground level. Male, N. Lancashire, with off-grid wind.
The advantage with it is that it makes you think about your energy use more. You value it more… You realise it’s easier to save it than make it. That is especially true of the hot water panel, but also with the electricity too. Male, Edinburgh, PV and SWH.
When that red light is on we know we are exporting to the grid – so it’s time to put the washing machine on or it’s OK to boil the kettle. When that light is not on we make sure that everything is off – nothing is on standby ’cos we know that it’s probably really costing us. Older couple, South West Lancashire, wind.
Source: Dobbyn & Thomas, 2005
available energy sources. So when one energy source is unavailable (say, solar energy
at night), other sources can be used as substitutes (such as wind or hydro power).
It is more important in off-grid systems to be able to store excess generated energy,
and/or to have back-up generators running on fossil fuels or biofuels (and potentially
hydrogen fuel cells in the longer term). Off-grid systems require more storage capacity
and much higher peak output than on-grid systems, so they are generally much more
expensive. Technologies for storing excess energy were discussed in Section 2.3.3.
In 2013 the Electricity Act 1992 will remove the requirement for lines companies to
maintain electricity supply to all areas. The potential cost of maintaining rural lines
after this time means that off-grid systems are likely to have an increased role in New
Zealand after 2013. Indeed, this has been a key driver in establishing the local energy
system project at Totara Valley, described in the box.
On-grid local energy systems are connected to the wider grid. These systems provide
the benefi ts of both centralised and decentralised systems: using local energy when
feasible, and electricity from the wider grid at other times.
This pattern fi ts well with the intermittency of some energy sources such as the
sun and wind. On-grid systems allow the wider grid to be used as a virtual storage
technology, providing ‘backup’ capacity and removing the need for on-site energy
storage. For example, an electric heater can provide backup for a wood fi re. In
addition, when the local energy system is generating beyond demand, the surplus can
be transferred elsewhere through the wider grid (and stored if appropriate).

G E T S M A R T, T H I N K S M A L L28
Local energy potential in rural areas of New Zealand
Research is being conducted on the potential of various microgeneration technologies in the rural farming community of Totara Valley, near Woodville in the Tararua District. The project began in 1999 and combines expertise from Massey University and Industrial Research Limited. It aims to develop a local energy system by testing a range of microgeneration and heat capture technologies in a real-life setting, and examining how the local energy system integrates with local lines networks.
A key driver for the Totara Valley project has been recognition of the potential need for integrated local energy systems after 2013. From that date, under the Electricity Act 1992, lines companies will no longer be required to deliver electricity to uneconomic, remote sites. If this policy is maintained, then many rural communities – like Totara Valley – will be forced to seriously reconsider their energy circumstances, and focus on options such as off-grid local energy systems.
Totara Valley is a typical rural New Zealand hill country community. Sheep and beef farming are prominent and the community involved in the study consists of three farms with six households and associated farm buildings.
Initial research focused on determining electricity use and demand. A resource assessment then determined the renewable energy resources available in the Totara Valley area. This included:
• assessment of sunshine levels, wind speeds, and stream water fl ow
• electricity demand profi les for the six households and associated farm buildings (e.g. woolshed energy use), showing seasonal and daily variations
• power quality data for the microgeneration technologies, including voltage fl uctuations and outages.
Based on the initial assessments, the following microgeneration and heat capture technologies were installed, and are being monitored:
• solar power systems on three houses
• a solar hot water system
• a hot water heat pump system
• a biodiesel generator
• a wind turbine
• a 1.2 kW alkaline fuel cell (battery)
• a micro hydro system.
Meters monitor energy use and production across the community.
Research is looking at the best ways of integrating the local energy technologies into the local lines network (i.e. determining network issues such as voltage fl uctuations and outages). This aspect of the project has been supported by a number of lines companies who share a common interest in the fi ndings.
For further information on this project, see the following websites:
• www.irl.cri.nz/industry-sectors/sector-energy/Energy-at-the-cross-roads.aspx
• www.irl.cri.nz/industry-sectors/sector-energy/farmers-tap-into-integrated-distributed-energy-systems.aspx
• www.frst.govt.nz/database/CD04/html/reports/pdfs/c08x0203.pdf

P C E 29
Using the storage capacity of the wider grid imposes extra costs on the network
operator. However, these additional grid storage costs can be much lower than the
storage costs of off-grid local energy systems.
Some of the differences between off-grid and on-grid systems are summarised in
Table 2.5.
Table 2.5 Differences between off-grid and on-grid local energy systems
Off-grid local energy systems On-grid local energy systems
More likely in remote and rural locations (where connection to the wider grid is impractical or prohibitively costly).
An option wherever grid connection is available – in both rural and urban areas.
Storage of surplus energy, or a diversity of energy sources, is essential to allow for the intermittency of renewable energy sources. Backup on-site generation (e.g. a diesel generator) is also likely to be required.
Users have the option of feeding any surplus electricity back into the wider grid. Users are often able to receive fi nancial reward for exported electricity.
System feedback information is crucial to help end-users decide about tradeoffs between energy supply and demand.
System feedback information is important to help the end-user with their system’s interaction with the electricity grid. For example, individuals may choose not to use certain electrical appliances if they can instead feed some of their electricity back into the grid and thereby earn money.
Metering is important to allow the end-users to monitor and optimise their own energy systems (i.e. energy production and storage).
Metering and control is required for payment and for controlling the infl ows and outfl ows of electricity.
Micro grids
A micro grid is an aggregation of connected local energy systems that can be regarded
as a single entity, either locally (an off-grid system) or within a larger network (an on-
grid system). Micro grids do not exist in New Zealand but with the emergence of local
energy systems they have the potential to complement the existing electricity network.
This is illustrated in Figure 2.3. The shaded area shows how electricity fl ows from
the micro grid to the houses and also from the houses into the local micro grid.
The enlarged box in Figure 2.3 shows a possible future local energy system using
photovoltaic cells, hydrogen production and storage, and a fuel cell operating
within a micro grid. At its core is the smart control and information technology that
permits it to function as a semi-autonomous power system both importing and
exporting electricity.28
When a micro grid is connected to a wider grid (i.e. it is on-grid), it can be operated as a
single aggregated load, or as a single aggregated supplier of electricity when generation
exceeds demand within the micro grid. Alternatively, the excess electricity can be stored
within the micro grid.
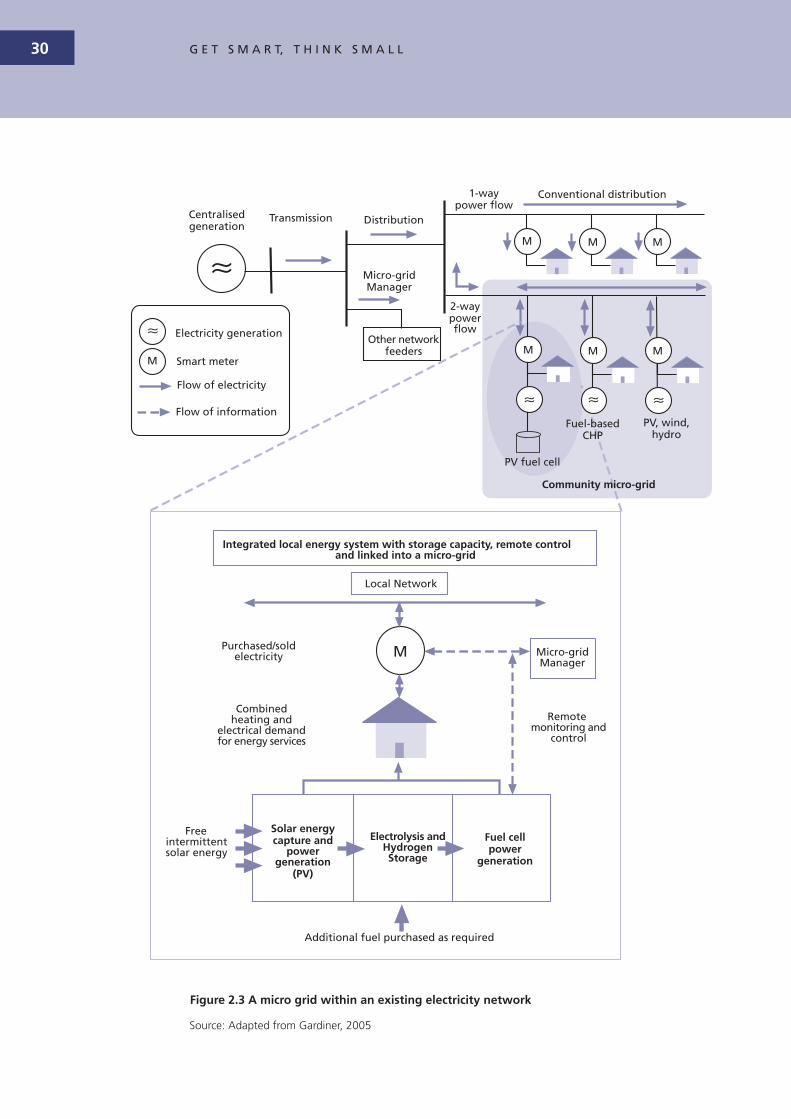
G E T S M A R T, T H I N K S M A L L30
Figure 2.3 A micro grid within an existing electricity network
Source: Adapted from Gardiner, 2005
Integrated local energy system with storage capacity, remote controland linked into a micro-grid
Local Network
Purchased/soldelectricity Micro-grid
Manager
Combinedheating and
electrical demandfor energy services
Remotemonitoring and
control
Freeintermittentsolar energy
Solar energycapture and
powergeneration
(PV)
Electrolysis andHydrogenStorage
Fuel cellpower
generation
Additional fuel purchased as required
Electricity generation
Flow of electricity
Smart meter
Flow of information
Conventional distribution1-waypower flow
2-waypowerflow
DistributionTransmissionCentralisedgeneration
Micro-gridManager
Other networkfeeders
PV fuel cell
PV, wind,hydro
Fuel-basedCHP
Community micro-grid
M
M
M M M
M M M
P C E 31
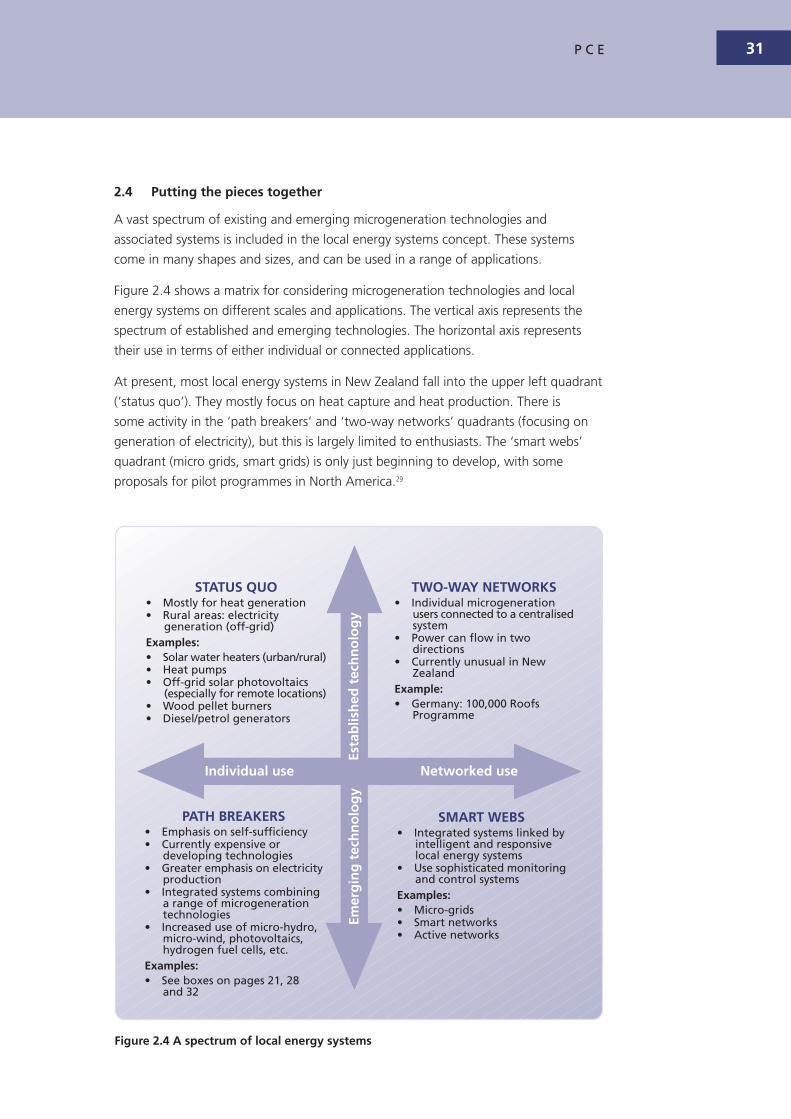
2.4 Putting the pieces together
A vast spectrum of existing and emerging microgeneration technologies and
associated systems is included in the local energy systems concept. These systems
come in many shapes and sizes, and can be used in a range of applications.
Figure 2.4 shows a matrix for considering microgeneration technologies and local
energy systems on different scales and applications. The vertical axis represents the
spectrum of established and emerging technologies. The horizontal axis represents
their use in terms of either individual or connected applications.
At present, most local energy systems in New Zealand fall into the upper left quadrant
(‘status quo’). They mostly focus on heat capture and heat production. There is
some activity in the ‘path breakers’ and ‘two-way networks’ quadrants (focusing on
generation of electricity), but this is largely limited to enthusiasts. The ‘smart webs’
quadrant (micro grids, smart grids) is only just beginning to develop, with some
proposals for pilot programmes in North America.29
Figure 2.4 A spectrum of local energy systems
Esta
blis
hed
tec
hn
olo
gy
Networked useIndividual use
Emer
gin
g t
ech
no
log
y
STATUS QUO• Mostly for heat generation• Rural areas: electricity
generation (off-grid)Examples:• Solar water heaters (urban/rural)• Heat pumps• Off-grid solar photovoltaics
(especially for remote locations)• Wood pellet burners• Diesel/petrol generators
TWO-WAY NETWORKS• Individual microgeneration
users connected to a centralisedsystem
• Power can flow in twodirections
• Currently unusual in NewZealand
Example:• Germany: 100,000 Roofs
Programme
PATH BREAKERS• Emphasis on self-sufficiency• Currently expensive or
developing technologies• Greater emphasis on electricity
production• Integrated systems combining
a range of microgenerationtechnologies
• Increased use of micro-hydro,micro-wind, photovoltaics,hydrogen fuel cells, etc.
Examples:• See boxes on pages 21, 28
and 32
SMART WEBS• Integrated systems linked by
intelligent and responsivelocal energy systems
• Use sophisticated monitoringand control systems
Examples:• Micro-grids• Smart networks• Active networks
G E T S M A R T, T H I N K S M A L L32
In practice, the design of local energy systems requires attention to three factors. The
fi rst is what resources are available locally and whether their use is viable.
The second is the intermittency of some forms of renewable energy (e.g. solar and
wind energy). Energy storage technologies and alternative backup options may be
important; for example, in a remote location.
Thirdly, the required level of reliability of the energy supply needs to be decided. Some
end-users may accept a lower level of reliability as a trade-off for reducing the cost
of the system by having less generation or storage capacity. Some people may be
willing to stop using certain appliances – such as TVs, stereos, or computers – when
energy supply is low. On the other hand, in some circumstances the need for reliability
will require backup generation at almost any cost to ensure that energy is always
available. For example, crucial hospital equipment would defi nitely require a reliable
energy supply.
It is obvious that the design of appropriate local energy systems is a skilled task that
requires relatively high levels of technical knowledge and understanding of end-user
needs. NIWA’s Maori research unit has recently been through this process with two
Maori communities, and their experiences are described in the box.30 Developing
a greater capacity within the economy to provide the necessary specialist skills is
discussed in Section 5.4.
Local energy systems in rural Maori communities
NIWA’s Maori research unit, Te Kuwaha, is conducting local energy system research in two rural Maori communities in Northland (Waipoua) and near Lake Taupo (Waihi). The research aims to provide tailored energy solutions for these two distinctive communities.
The Te Roroa (Waipoua) and Ngati Turumakina (Waihi) communities each have 15 to 20 homes and a marae complex (with associated buildings). These form a cultural base for both residents and members of wider whanau and hapu. Like other rural communities, they face problems with energy infrastructure and its impact on community development. Both communities want to maximise their energy-independence.
NIWA’s research has involved four distinct steps:
1 Auditing energy effi ciency
2 Assessing energy use and needs
3 Assessing energy resources
4 Deploying energy effi ciency and/or microgeneration technologies and running an education programme.
For Step 1, Te Kuwaha canvassed community perspectives on energy use and energy-related concerns, and identifi ed opportunities for energy effi ciency in homes and buildings. A survey also provided an understanding of normal energy use and the priority ‘energy services’ of each community (Step 2). These two initial steps were crucial. Accommodating the human aspects of energy use and needs are vital for the successful integration of local energy systems in communities and households.

P C E 33
Assessment of energy resources (Step 3) identifi ed and evaluated the options available to each community (such as solar, wind, hydro, and wave energy potential). This information provides the basis for Step 4: deciding on the most suitable local energy system and deploying it.
The Te Roroa community (Waipoua) is not connected to the national electricity grid, and relied heavily on wood and fossil fuels for providing their energy services. They focused on fi nding energy solutions for refrigeration, clothes washing, lighting, appliance use, and summer hot water. As a result, a small hydroelectricity system, solar power systems, a micro wind turbine, and a domestic solar hot water unit were installed.
The Ngati Turumakina community (Waihi) is on the electricity grid and wanted to reduce ineffi cient energy use, and gain more effective and effi cient water heating and refrigeration through the research programme. A small grid-connected solar power system and solar water heating units were installed, and the potential for a micro hydro electricity system is being assessed.
The research has identifi ed that local energy systems and solutions are site-dependent. Preliminary energy auditing, energy use and needs assessment, energy resources assessment, and socio-economic factors are key elements in the design of any local energy system.
The research has shown that active community involvement (learning by doing) through helping communities to understand and control their energy options is important. The project has highlighted that the ‘human’ and ‘technological’
elements of local energy systems are co-dependent.
Further details on this NIWA work are available on its website:
www.niwascience.co.nz/pubs/wa/13-4/maori
Underfl oor insulation installation in the Waihi community
Solar panels at Tapeka Marae, Waihi

C H A P T E R 3The impacts of local energy systems
This chapter discusses the benefi ts, both private and public, of local energy systems
(Section 3.1). It also summarises some of the key challenges that could arise from the
widespread adoption of local energy systems (Section 3.2).
3.1 The benefi ts of local energy systems
Local energy systems can potentially provide benefi ts other than those of providing
energy services to the user. Many of these benefi ts often cannot be easily valued in
monetary terms. They may also not be received by the user but are transferred free to
the wider community. These types of benefi ts are called positive externalities, and are
summarised in four groups:
• national energy system benefi ts (Section 3.1.1)
• environmental benefi ts (Section 3.1.2)
• economic benefi ts (Section 3.1.3)
• social and cultural benefi ts (Section 3.1.4).
3.1.1 National energy system benefi ts
Increased effi ciency
Local energy systems could make New Zealand’s energy system more effi cient.
Producing useful energy at or near the point of use reduces the losses associated with
some centralised energy systems. This reduction is particularly notable if the energy is
produced at peak load times when losses are highest.
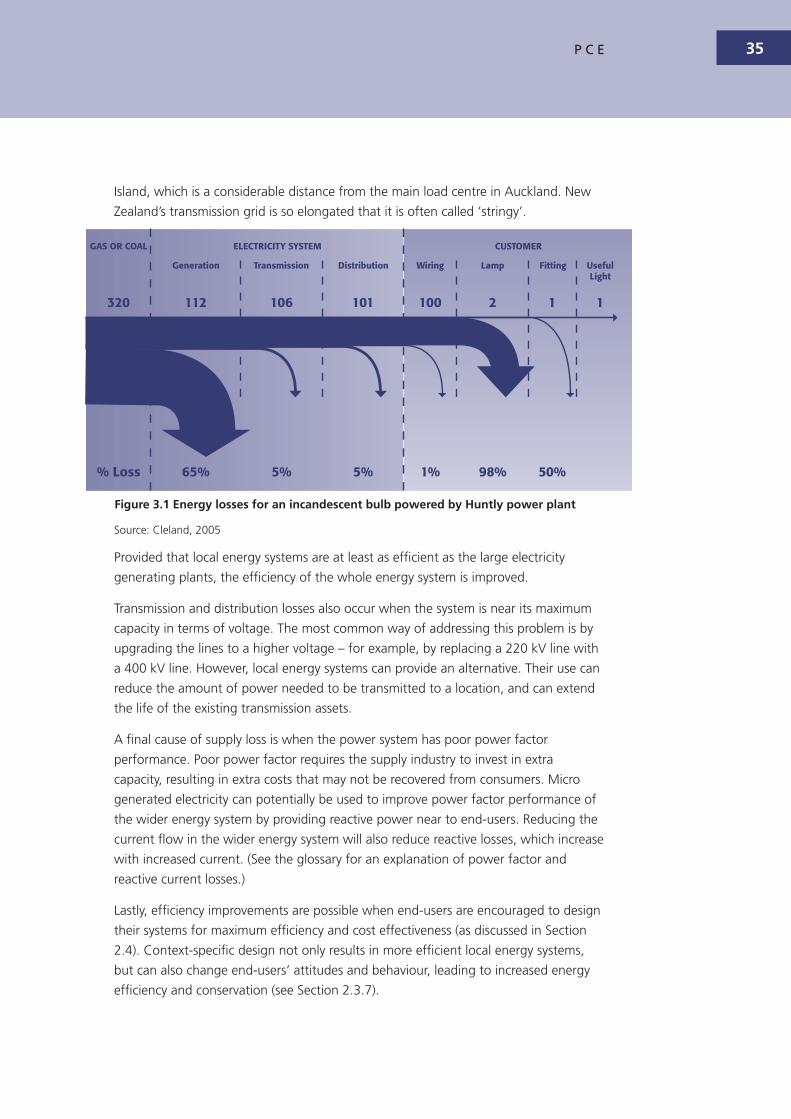
Whenever energy sources are converted into energy and transported, some of this
energy is lost in the form of waste heat. Figure 3.1 shows how much energy is
wasted in the process of providing light, using gas or coal as an energy source. In this
example, gas or coal generates electricity at the Huntly power plant. The electricity is
transported through the high voltage transmission grid and the lower voltage local
distribution network, and then used in an incandescent light bulb.
The diagram shows that most of the energy loss occurs during electricity generation
at the power station, and when the energy is converted into light. The diagram
also shows there is an approximate 11 percent loss of energy (as heat) during the
transmission and distribution of the electricity through the network.
High losses occur when electricity has to travel long distances between generation
sites and main load centres. In New Zealand the main generation sites are in the South
P C E 35
Island, which is a considerable distance from the main load centre in Auckland. New
Zealand’s transmission grid is so elongated that it is often called ‘stringy’.
Figure 3.1 Energy losses for an incandescent bulb powered by Huntly power plant
Source: Cleland, 2005
Provided that local energy systems are at least as effi cient as the large electricity
generating plants, the effi ciency of the whole energy system is improved.
Transmission and distribution losses also occur when the system is near its maximum
capacity in terms of voltage. The most common way of addressing this problem is by
upgrading the lines to a higher voltage – for example, by replacing a 220 kV line with
a 400 kV line. However, local energy systems can provide an alternative. Their use can
reduce the amount of power needed to be transmitted to a location, and can extend
the life of the existing transmission assets.
A fi nal cause of supply loss is when the power system has poor power factor
performance. Poor power factor requires the supply industry to invest in extra
capacity, resulting in extra costs that may not be recovered from consumers. Micro
generated electricity can potentially be used to improve power factor performance of
the wider energy system by providing reactive power near to end-users. Reducing the
current fl ow in the wider energy system will also reduce reactive losses, which increase
with increased current. (See the glossary for an explanation of power factor and
reactive current losses.)
Lastly, effi ciency improvements are possible when end-users are encouraged to design
their systems for maximum effi ciency and cost effectiveness (as discussed in Section
2.4). Context-specifi c design not only results in more effi cient local energy systems,
but can also change end-users’ attitudes and behaviour, leading to increased energy
effi ciency and conservation (see Section 2.3.7).
GAS OR COAL ELECTRICITY SYSTEM CUSTOMER
Generation Transmission Distribution Wiring Lamp Fitting UsefulLight
320 112 106 101 100 2 1 1
% Loss 65% 5% 5% 1% 98% 50%

G E T S M A R T, T H I N K S M A L L36
Improved grid resilience
Improved grid resilience is one of the most commonly stated benefi ts of on-grid
local energy systems. Grid resilience is the ability of a network to withstand sudden
disturbances, like a supply outage or grid constraint. The box describes two well-
known international incidents that had signifi cant impacts.
There have also been recent network outages in New Zealand. The fi rst left Auckland
without power for up to eight hours as a result of poor grid maintenance.31 The
second, caused by heavy snowfall, affected large areas of the South Island and lasted
several weeks for some.32
Local energy contributes to greater grid resilience in two ways. First, simultaneous
failure is far less likely with a large number of microgeneration units than with a
smaller number of large generating plants.33 Secondly, microgeneration capacity can
strengthen distribution networks by reducing peak demand when these networks are
under most stress and prone to fail.
Cascade failure – the risk of centralised grids
The fragility of centralised transmission grids became apparent in 2003 when there were major ‘cascade failures’ in North America and Italy. (See the glossary for a defi nition of cascade failure.)
In August 2003, 50 million Americans and Canadians were plunged into darkness. The outage lasted up to 24 hours in some areas with an estimated cost to users of US $4–10 billion in the United States and C$2.3 billion in Ontario.34 The blackout was initially attributed to the failure of one line (due to a fallen tree) at a time when the grid was operating at maximum capacity. The system operators failed to recognise the problem and shut off some of the demand. At this point the system began to undergo cascade failure as more and more lines failed under the load. The blackout affected water supplies, the cellular network, fi nancial markets, and transportation systems.
The Italian failure occurred in September of the same year and lasted nine hours. Blackouts affected all of Italy. The failure was due to storm damage to one 400 kV line from Switzerland which then resulted in two more 400 kV line outages. At this point the operator lost control and the system went into cascade failure. The blackout occurred at 3 a.m. but still trapped several hundred people in underground trains. Trains throughout Italy were cancelled, leaving around 30,000 people stranded.
Increased energy security
Energy security refers to how well people can access energy services when and where
they need them. Energy security may be negatively affected by events such as a rise
in the price of fuels (like coal or gas), natural disasters (such as fl oods and hurricanes),
human error, failure of the national grid, geopolitical or industrial disruptions (e.g.
oil shocks, industrial disputes), and depletion or shortage of resources (e.g. peak oil).
These events have the potential to affect both large electricity generating plants and
local energy systems. However, local energy systems offer increased security for
several reasons:

P C E 37
• They are often based on renewable energy sources like the wind and sun, which
provide a vast, intermittent supply of energy
• If based on renewable and ambient energy sources, these systems have zero
(or minimal) fuel costs, reducing vulnerability to fl uctuations in the price and
availability of fuels like gas, coal, diesel or oil
• Failures in centralised electricity generation plants and transmission/distribution
networks have limited effect because energy can be generated on-site (and, in the
case of off-grid systems, have no effect)
• They often involve the use of more than one resource or conversion system and
therefore provide the end-user with the option of switching between them during
times of shortage or disruption.
3.1.2 Environmental benefi ts
Reduced use of non-renewable energy resources
Energy systems based on fi nite non-renewable resources (e.g. fossil fuels such as gas
and coal) are by defi nition unsustainable. Local energy systems, however, can make
use of renewable energy sources that are not available to large electricity generating
plants. Such sources could include smaller streams and less windy or less sunny
locations, which are unsuitable for large-scale electricity generation. Use of these
energy sources, alone or in combination, offsets the need to use fossil fuels in New
Zealand and provides the added benefi t of reducing greenhouse gas emissions (as
described below).
Increased energy effi ciency
Compared with large power stations, local energy systems can provide more effi cient
energy services because:
• they are often more effi cient, especially when using fossil fuels, in converting the
energy into a useful form (i.e. they can deliver more useful energy for each unit of
energy input)
• there is a greater focus on end-use energy effi ciency.
Figure 3.1 shows that a lot of energy is lost in the process of generating electricity
from fossil fuels. In general, it is more effi cient to use energy sources directly than
convert them into electricity.
For example, it is more effi cient to use coal or gas directly for space heating than to
generate electricity in a large power plant, transport that electricity, and then use it
in an electric heater. Alternatively, if conversion to electricity is necessary, it is more
effi cient to do so in a way that delivers as many useful services as possible through
the process.
G E T S M A R T, T H I N K S M A L L38
Local energy systems can do this by using combined heat and power (CHP)
technologies. For example, the WhisperTech CHP plant uses natural gas in a Stirling
cycle engine to produce heat for water and space heating, and at the same time
generates electricity.
Local energy systems can improve energy effi ciency by reducing demand. An essential
part of designing appropriate local energy systems is assessing energy demand (as
discussed in Section 2.4). Improvements in building design, use of energy effi cient
equipment and appropriate management, and changes in people’s attitudes and
behaviour (as discussed in Sections 2.3.5 to 2.3.7) can all increase energy effi ciency.
Reduced greenhouse gas emissions
Large electricity generating plants using coal and gas as fuel contribute around
26 percent of New Zealand’s total electricity supply and 10 percent of its total
greenhouse gas emissions.35 By displacing electricity generated from these sources,
local energy systems can reduce the net emissions of greenhouse gases. This is
possible because local energy systems can provide energy services in a highly effi cient
manner (as outlined above) and utilise local renewable energy sources, which have no
or negligible greenhouse gas emissions.
Improved environmental outcomes
Local energy systems, because of their small scale, locally sourced, renewable energy
and high system effi ciencies, reduce or eliminate many of the environmental impacts
normally associated with energy projects. The microgeneration technologies used in
local energy systems do have some environmental impacts, and examples are given
in Table 3.1. In general, though, these can be regarded as relatively minor compared
with the impacts of building and operating new large electricity generating plants.
3.1.3 Economic benefi ts
Increased competition in the market
Local energy systems provide an alternative for consumers to the traditional sources
of energy services (e.g. electricity from the national grid, or reticulated gas). The
existence of these alternatives has the potential to transform the energy market.
Improved investment in the electricity system
Investment in new electricity infrastructure tends to occur in large chunks that take a
long time to reach fruition. The longer the time between the initial project proposal
and project completion, the more opportunity for unforeseen delays.
To maximise the fi nancial return on the investment, the investor will encourage uptake
of excess supply as quickly as possible. Demand increases quickly until the system
once again approaches its physical capacity and becomes constrained. Economists
know this type of investment as a ‘lumpy investment’ problem.

P C E 39
Table 3.1 Examples of potential environmental impacts associated with microgeneration technologies
Technology Energy source Potential environmental impacts
Heat generation
Wood pellet burner or industrial combustor units
Biomass Localised air pollution
Passive solar design Solar N/A
Solar water heater (SWH) Solar Visual impacts
Ground source heat pump Geothermal N/A
Heat pumps Electricity Noise plus any existing adverse environmental impacts arising from the electricity generation and transmission system
Gas and coal burners Fossil fuels Greenhouse gas emissions and localised air pollution
Electricity generation
Reciprocating engine Fossil fuels Greenhouse gas emissions, noise, localised air pollution
Petrol, diesel or biofuel generator
Fossil fuels Greenhouse gas emissions, noise, localised air pollution
Micro gas turbine Fossil fuels Greenhouse gas emissions, noise, localised air pollution
Solar photovoltaics (PV) Solar Visual impacts
Micro hydro Water Dependent on type of system, but could have an impact on stream ecology, and downstream water use
Micro wind turbine Wind Noise and visual impacts, particularly in urban environments
Wave power technologies Wave Visual, and coastal ecological impacts (if an onshore system)
Fuel cells Hydrogen Greenhouse gas emissions if sourced from fossil fuels
Stirling engine micro-turbines
Natural gas (and other fossil fuels)
Greenhouse gas emissions, localised air pollution
Local energy systems avoid lumpy investment, as they are small-scale, modular,
and relatively quick to commission. Generation capacity can be added on a just-in-
time basis closely following growth in demand. This helps eliminate the periods of
signifi cant over-capacity associated with large-scale developments.36
Combined heat and power generation

G E T S M A R T, T H I N K S M A L L40
Effi cient use of existing capacity
Introducing local energy systems into the energy market can delay, and in some cases
remove, the need for contentious and expensive upgrades to centralised energy
systems (e.g. transmission and network upgrades). Local energy systems can help
reduce the size of peak loads, so grid and generation capacity does not have to
accommodate them. As a result, existing systems can be more fully utilised.
Orion New Zealand Ltd is using this approach to delay investment in new capacity in
its distribution network. Orion has negotiated with businesses that have the ability to
generate electricity to use (where possible) their generating capacity to manage peak
loads, and thereby reduce the demand on the network at these times.
A model developed by the World Alliance for Decentralized Energy (WADE) compared
the long-term cost-competitiveness of a centralised power system with more
decentralised systems using microgeneration technologies.37 It concluded that
the long-term retail price of electricity would be signifi cantly cheaper from a
decentralised system, mainly because of the reduced need for transmission and
distribution investment.
Local economic development
Increasing use of local energy systems in New Zealand could create a market for
installation and ongoing maintenance support activities, which could lead to the
creation of local industries. It could also lead to the upskilling of electricians,
plumbers, engineers, and others involved in the installation and maintenance of
local energy systems.
This has been demonstrated in Germany where a focus on renewable energy and
microgeneration has led to a signifi cant domestic market. Positive spin-offs have
included a growth in related research and development, production and export
of associated local energy products, and the creation of careers and employment
opportunities in the industry.38
Some local energy system equipment could be designed and constructed in New
Zealand. Solar hot water heating, micro hydro, and micro combined heat and
power systems are already being manufactured here. New Zealand also has a strong
electronics industry, and power electronics are a key element in microgeneration.
In contrast, equipment for large, centralised energy systems is almost exclusively
imported, and multi-national companies often provide the maintenance support.
Increased demand in New Zealand for local energy systems has the potential to
create positive economic spin-offs similar to those realised in other countries, such
as Germany.
P C E 41
3.1.4 Social and cultural benefi ts
More socially acceptable development
The development and operation of a large electricity generating plant has very
signifi cant impacts on local communities.39 Proposals for new developments are often
met with public resistance, leading to increased costs and uncertainties in the project’s
planning phases. This is particularly the case when the project’s negative impacts are
experienced at the local or regional level, and most of the benefi ts (i.e. use of the
generated electricity) go to people geographically remote from the plant’s location.
In contrast, the people who will experience any negative impacts from local energy
systems are mainly the same people who will benefi t from the systems.
Empowered users
The language of “energy effi ciency in the home” is currently going over the heads of householders who do not make the links between their TVs, dishwashers and thermostats and their active concern about global climate change. Making energy generation part and parcel of people’s homes and schools may hold the key to empowering and engaging energy consumers for the fi rst time.40
The real value of a local energy system does not lie just in its energy generation role.
It can also act as a catalyst for change. Research for the United Kingdom’s Sustainable
Consumption Roundtable shows that local energy can be a very effective ‘hook’ to
engage people in energy and climate change issues and to infl uence behaviour.41
Some of the fi ndings have already been discussed in Section 2.3.7 and the research
concludes that:
A whole host of attitudinal and behavioural shifts do seem to be fostered (though not automatically created) by the presence of on-site micro-generation… Thus the fi ndings from this research indicate that the qualitative impacts of micro-generation technology can be substantial, presenting a living, breathing and emotionally engaging face to energy consumption issues. In short, micro-generation can help bring the invisible to life.42
Those who choose local energy systems have more control over their energy use
and can reduce their dependence on the wider energy sector. Jeremy Rifkin (2002),
referring to his vision of a distributed energy system based on the hydrogen fuel cell
as the storage and control mechanism, calls this trend the “democratised energy
web”. It has the potential to empower users and increase their self-reliance, and
reinforces a ‘can do’ mentality.43

G E T S M A R T, T H I N K S M A L L42
Engaging communities on energy issues
At a community level, local energy technologies, such as micro wind turbines on
the tops of school buildings, can provide a tangible educational tool for developing
understanding of energy and climate change issues. They can form part of
education for sustainability programmes in schools, and thereby act as a model
for a local community.
Opportunities exist for engaging communities throughout New Zealand by locating
local energy technologies on public buildings like libraries, council offi ces, and
hospitals (see box on Waitakere Hospital). Local energy could be an option for marae
and associated buildings around New Zealand (see box in Section 2.4).
Hoffman & High-Pippert (2005) looked at how the development of community energy
initiatives affected community decision-making and involvement. They concluded that:
In this respect, community energy might well perform the sort of civic function described by Skocpol (2003), that is, a vehicle that provides a means for political activity on the part of the broad mass of citizens who join not just for social interaction but also to be actively involved in the making of public policy.
Improved health and safety
A third of New Zealand homes are kept at temperatures below those recommended
by health authorities and the World Health Organisation (between 18oC and 21oC);
in Auckland the mean household temperature is 16.5oC.44 Well-designed local energy
systems incorporate measures that produce heat more effi ciently (e.g. with heat
pumps) and improve the thermal performance of buildings. The Wellington School of
Medicine and Health Studies has showed that installing insulation improved thermal
performance and adult and child health and well-being.45 Additional information on
the linkages between energy use and health and well-being is included in the PCE
report Healthy, wealthy, and wise (PCE, 2006c).
Passive solar design can also improve health and well-being. Passive solar design
means designing buildings to make maximum use of the sun’s energy for heating,
cooling and lighting purposes. Various design options have already been outlined in
Section 2.3.5. The recently constructed Waitakere Hospital is an example that has
both energy effi ciency and health benefi ts (see box).
Off-grid local energy systems can improve safety in areas previously without an
electricity supply. When cheap, reliable electric lighting replaces lanterns and candles,
it reduces the risk of fi res. Electric lighting of dark passageways and steps reduces the
risk of injury.

P C E 43
Waitakere Hospital: Smart design and energy effi ciency
The recently developed Waitakere Hospital is the product of a design team committed to building a sustainable hospital, with energy effi ciency as a core aim. The hospital incorporates a number of simple and innovative features:
• Passive solar design: The building is positioned to maximise exposure to the sun’s freely available light and heat. The hospital also uses natural ventilation and upgraded insulation to maximise indoor comfort, and uses air-conditioning only in certain areas of the hospital (such as operating rooms). These measures help prevent excessive temperature variations and minimise the energy used for space heating or cooling in the hospital.
• Energy effi cient lighting: The hospital makes full use of natural light, has window glazing and shading, and energy-effi cient lighting systems that comprise:
- tailoring lighting levels
- localised switching and using low loss ballasts46
- fi tting high-frequency dimmable ballasts to selected areas (such as corridors and courtyards) to allow daylight to complement artifi cial lighting
- installing occupancy sensors in some areas.
• Energy effi cient water and air systems and management: The hospital has high effi ciency motors and low-pressure loss water and air handling systems. A computerised building-management system also helps control core water and air systems in the hospital to maximise energy effi ciency.
• Solar water heating services the Cultural Health Area of the hospital.
The hospital has other innovative sustainable and eco-friendly features including waste minimisation and water management initiatives.
Lessons learned during the hospital’s design, construction, and operation provide insight into the value of ‘smart design’ for energy effi ciency. The redevelopment can provide inspiration for future design and building projects.
For further information on this project, check these websites:
• www.waitakere.govt.nz/abtcit/ec/ecoinit/hospital.asp
• www.mfe.govt.nz/publications/sus-dev/value-case-sustainable-building-feb06/html/page6d.html
Waitakere Hospital

G E T S M A R T, T H I N K S M A L L44
Addressing fuel poverty
We often encounter homes being poorly heated by electric resistance heaters and LPG gas costing 17-21 cents per kWh to heat by these means. By installing a heat pump, heat is provided at the equivalent of about 6c/kWh, with a far more effi cient use of energy through both the heat pump and the insulation. The ability to increase heating to provide healthy indoor temperatures is also vastly improved.47
Fuel poverty is defi ned as being unable to afford suffi cient fuel for one’s domestic
needs, particularly for heating.48 The UK Government identifi es households vulnerable
to fuel poverty as those that spend more than 10 percent of their income keeping the
house at a reasonable temperature.49
The usual means of addressing fuel poverty is to provide ongoing fi nancial assistance
through the welfare system. This has a number of disadvantages. For the householder,
these include having to live with the uncertainty of whether this assistance will
continue. For the government funders, they include fi nancial exposure to fl uctuations
in energy prices, and the numbers of households qualifying for assistance.
Although local energy systems often have higher establishment costs, their higher
levels of system effi ciency (and use of free resources in some circumstances) mean
their running costs are signifi cantly lower. In the case of systems that improve the
thermal performance of buildings (making them easier to heat), the running costs
are zero. Such systems can reduce the uncertainties for both householders and
governments associated with providing ongoing top-up assistance.
Groups such as Grey Power point to fuel poverty as an issue for elderly people who
often limit their home heating to save money.50 Local energy systems can help address
this fuel poverty problem.51
3.2 The challenges of local energy systems
As well as their benefi ts, local energy systems do present challenges for, and impose
costs on, some stakeholders in the energy sector under certain circumstances. Some
challenges and their associated costs are listed here:
• Signifi cant uptake of local energy systems could reduce the amount of
electricity purchased from the grid. Electricity generators and operators of
networks could have surplus capacity and be less profi table. These assets would
become ‘stranded’.
• Local energy systems that rely on intermittent sources of energy may not always
deliver energy at times of peak load. If there is no mechanism for controlling the
effects of the intermittency, the network will have to make up the shortfall. In
effect, the network operator will not be able to rely on the local energy systems to
share the peak load.

P C E 45
• While individual local energy systems have negligible environmental effects,
large numbers concentrated in specifi c areas could result in signifi cant
cumulative impacts.
• Local energy systems are as dangerous as any other electrical installation,
particularly when the equipment needs repair or minor adjustment. There is a
danger that unqualifi ed end-users may attempt do-it-yourself solutions.

C H A P T E R 4Local energy potential in New Zealand
During preparation of this report it became apparent there was little analysis of the
possible role of local energy systems in New Zealand’s energy sector. To fi ll this gap the
PCE commissioned East Harbour Management Services Limited (EHMS) to assess the
potential for adoption of these systems in New Zealand.52
The study defi nes the resources and technologies that will probably comprise local
energy systems, estimates their potential uptake, and calculates the energy that they
can produce and displace.
To provide some results within the available timeframe and budget, we used a set
of simplifying assumptions. As a consequence, the study cannot be considered
defi nitive. However, we hope this preliminary study will encourage others to
undertake further work.
The study and its results are summarised in Section 4.1. Section 4.2 outlines similar
studies from other countries, and Section 4.3 discusses the implications of the EHMS
study for adoption of local energy systems in New Zealand. The full EHMS report can
be downloaded from the PCE’s website.53
Please note that the EHMS study summarised in this chapter uses the term
‘microgeneration’ rather than ‘local energy systems’ to refer to microgeneration, heat
capture, improved building performance, and energy effi ciency measures. For the sake
of consistency the term ‘local energy systems’ will be used in this chapter as in the
other chapters.
4.1 The EHMS study of the potential for local energy technologies in New Zealand
This section provides an overview of the EHMS study and its results. It outlines the
objectives and focus of the study (Section 4.1.1) and the key assumptions (Section
4.1.2), and discusses four key fi ndings (Sections 4.1.3 to 4.1.6).
4.1.1 Introduction to the study
The study aimed to assess the potential in New Zealand of the technologies that can
be used in local energy systems, and more specifi cally to:
• identify which technologies could currently be used
• calculate realistic and defendable estimates of the potential for adoption of these
technologies in the short (0–5 years), medium (0–10 years) and long term (up to
30 years).
P C E 47
The focus was on local energy systems and providing energy services for households,
small communities, farms and other rural businesses, and small- to medium-sized
enterprises (SMEs). The study considered a range of microgeneration and heat capture
technologies that could generate up to the equivalent of one megawatt (MW) of heat
and/or approximately 300 to 500 kilowatts (kW) of electricity.
It also considered smart control and information technologies for buildings, energy
storage technologies, and measures to modify building performance. In this section,
the term ‘technology’ includes measures to modify building performance, as well as
the more obvious technologies.
The analysis included:
• Microgenerating technologies including combined heat and power (CHP) systems,
photovoltaic solar panels, micro wind turbines, micro hydro systems, wood
burners, pellet burners, Stirling engines, and fossil fuel generators.
• Heat capture technologies: direct generation of heat or cooling from energy
sources. This category includes solar water heaters and heat pumps.
• Building performance measures: these include passive solar design, ceiling and hot
water cylinder insulation, and double-glazing.
• Pumping: technologies that deliver energy used directly for pumping fl uids
(essentially, motive power that is not transport-related). Specifi c non-pumping
mechanical applications (e.g. wind- or water-powered fl our mills) are not included
as these are considered ‘boutique’ applications.
• Energy management and equipment effi ciency: technologies or concepts that
mostly focus on reducing primary energy use. This category includes low energy-
use light bulbs and lighting systems, automated controls on equipment, and
energy-effi cient appliances.
4.1.2 Key assumptions of the study
The EHMS study had to make a number of assumptions to calculate the potential of
microgeneration technologies. The most important ones are outlined here.
The study accounted for potential economies of scale (from increased uptake) and
technology developments such as ongoing technological improvements or changes.
Micro heat generation technologies such as wood burners are currently more
common than micro electricity generation technologies, and the study has probably
more accurately estimated the adoption of these technologies.
The study assumed that all current energy-related government policies and strategies
are implemented and the expected outcomes are achieved. Specifi c government
strategies and policies include:
G E T S M A R T, T H I N K S M A L L48
• the National Energy Effi ciency and Conservation Strategy (and associated
objectives)
• the Home Energy Rating Scheme (HERS) to be adopted in some form by 2010.
The study did not account for any new government policies to promote local energy.
The study calculations assume that the price of energy in real terms will stay the same
over the 30-year period. In reality, prices are very likely to increase over this period,
and this will impact on the adoption of local energy technologies, particularly those
that generate electricity. Estimating the future price path of electricity was beyond the
scope of the study, but the Commissioner believes that such an analysis should
be done.
The EHMS study did not take into account any of the benefi ts arising from local
energy systems identifi ed in Chapter 3.
4.1.3 Results: Cost of different local energy technologies in New Zealand
A key factor in estimating the adoption of local energy technologies is the current
and projected price of energy. To indicate the relative cost of energy from different
technologies, the average cost of energy from each technology was calculated. The
calculation was based on present-day costs and included analysis of:
• initial capital costs
• running costs (e.g. maintenance and/or fuel costs)
• technology effi ciencies
• expected system lifetime (based in part on warranty details).
However, it should be noted that the analysis did not attempt to take into account
the value of any non-market benefi ts of local energy technologies (as identifi ed in
Chapter 3).
The calculated cost of energy supplied (or saved) by each of the different technologies
is shown in Figure 4.1. This fi gure also shows the average urban and rural retail prices
of electricity as two horizontal lines. It is clear that some technologies are economical
at present when compared with these electricity prices.
Note the following points in relation to Figure 4.1.
• The ‘Water heating effi ciency’ column refers to net costs of insulating suitable
hot water cylinders (i.e. the cost of supplying and fi tting the insulation, minus the
cost of energy saved over the lifetime of the insulated cylinder, compared with an
uninsulated one).
• There are two columns for both ‘Passive solar design’ and ‘Window double
glazing’. The columns differentiate between the net costs of the technologies
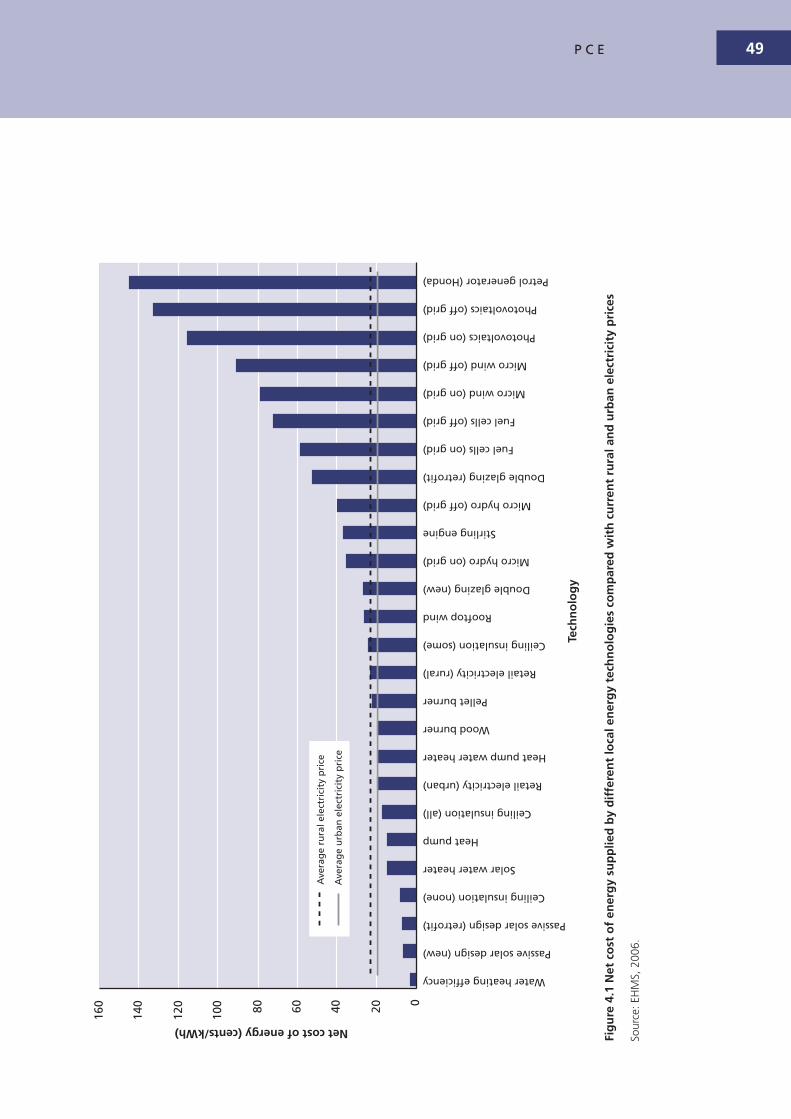
P C E 49
Fig
ure
4.1
Net
co
st o
f en
erg
y su
pp
lied
by
dif
fere
nt
loca
l en
erg
y te
chn
olo
gie
s co
mp
ared
wit
h c
urr
ent
rura
l an
d u
rban
ele
ctri
city
pri
ces
Sour
ce: E
HM
S, 2
006.
0
20406080
100
120
140
160
Water heating efficiency
Passive solar design (new)
Passive solar design (retrofit)
Ceiling insulation (none)
Solar water heater
Heat pump
Ceiling insulation (all)
Retail electricity (urban)
Heat pump water heater
Wood burner
Pellet burner
Retail electricity (rural)
Ceiling insulation (some)
Rooftop wind
Double glazing (new)
Micro hydro (on grid)
Stirling engine
Micro hydro (off grid)
Double glazing (retrofit)
Fuel cells (on grid)
Fuel cells (off grid)
Micro wind (on grid)
Micro wind (off grid)
Photovoltaics (on grid)
Photovoltaics (off grid)
Petrol generator (Honda)
Ave
rag
e ru
ral e
lect
rici
ty p
rice
Ave
rag
e u
rban
ele
ctri
city
pri
ce
Tech
no
log
y
Net cost of energy (cents/kWh)

G E T S M A R T, T H I N K S M A L L50
according to whether they are part of a new building or retrofi tted later. Figure
4.1 shows that both measures cost more if they are retrofi tted.
• There are three different columns for ‘Ceiling insulation’ – ‘none’, ‘some’, and
‘all’. Two of these columns give the net cost of energy in buildings with no
insulation (none), and buildings with insulation at a level below the requirements
of the building regulations (some). The third column (all) gives the average net
cost of ceiling insulation for all houses where improvements can be made.
Figure 4.1 shows that the most cost-effective technologies are those that modify
energy demand (i.e. use energy more effi ciently or effectively) and those that generate
heat. The cost of many of the electricity-generating technologies – particularly micro
wind turbines, fuel cells, and PVs – is well above current electricity costs. Obviously
this will have a major infl uence on their uptake.
In the study, future reticulated electricity costs were projected to increase in line
with current trends in the analysis. However, there may in fact be signifi cantly higher
real price increases in the future. In addition the report does not consider that
technologies may become more effective or effi cient, or less costly, in the future. So it
is possible that local energy technologies, which are currently relatively expensive, may
become more affordable.
4.1.4 Results: Projected energy generated and saved by different local energy technologies
Based on the assumptions outlined in Section 4.1.2, this section describes the
potential adoption of the various local energy technologies, and the total amount of
energy produced or saved by each technology (GWh/year). Some technologies have
been left out of this discussion because of their low expected uptake. Stirling and
Honda generators are also left out.
Figure 4.2 shows the projected energy generated and saved by the different
technologies in the residential sector (homes and small communities) over three
time periods:
• short term (0–5 years)
• medium term (0–10 years)
• long term (0–30 years).
Figure 4.2 shows that the most signifi cant technologies in the residential sector are
likely to be:
• solar water heating
• heat pumps for space heating
• passive solar design incorporated in new buildings

P C E 51
Fig
ure
4.2
Pro
ject
ed e
ner
gy
gen
erat
ed a
nd
sav
ed b
y lo
cal e
ner
gy
tech
no
log
ies
for
the
resi
den
tial
sec
tor
Sour
ce: E
HM
S, 2
006.
0
200
400
600
800
1,00
0
1,20
0
1,40
0
1,60
0
1,80
0
2,00
0
Solar water heaters
Heat pump
Passive solar design (new)
Double glazing (new)
Heat pump water heaters
Pellet burner
Wood burner
Passive solar design (retrofit)
Ceiling insulation
Water heating efficiency
Double glazing (retrofit)
Wind
Photovoltaics
Wind rooftop
Combined heat and power
Micro hydro
Tech
no
log
y
Projected energy generated and saved (GWh/year)
Sho
rt t
erm
(0-5
yea
rs)
Med
ium
ter
m (0
-10
year
s)Lo
ng
ter
m (0
-30
year
s)

G E T S M A R T, T H I N K S M A L L52
Fig
ure
4.3
Po
ten
tial
ad
op
tio
n o
f lo
cal e
ner
gy
tech
no
log
ies
for
the
SME
sect
or
Sour
ce: E
HM
S, 2
006.
0
1,00
0
2,00
0
3,00
0
4,00
0
5,00
0
6,00
0Energy management
Heat pump
Solar water heaters
Photovoltaics
Wind
Combined heat and power
Wind rooftop
Heat pump water heaters
Micro hydro
Industrial combustors
Pellet burner
Tech
no
log
y
Projected energy generated and saved (GWh/year)
Sho
rt t
erm
(0-5
yea
rs)
Med
ium
ter
m (0
-10
year
s)Lo
ng
ter
m (0
-30
year
s)
P C E 53
• double glazing on new buildings
• heat pumps for water heating.
These technologies are relatively well known, ‘low-tech’ examples of local energy
technologies. Many houses already have them.
Figure 4.3 shows the same data for small- to medium-sized enterprises (SMEs).
It shows that the most signifi cant technologies for the SME sector are likely to be:
• energy management and equipment effi ciency
• heat pumps for space heating
• solar water heating.
Again, these examples are relatively well-known ‘low-tech’ examples of local energy
technologies. They are already being used, or are emerging, in many SMEs and in
the community sector (for example, see the case study on Waitakere Hospital in
Section 3.1.4).
Figures 4.2 and 4.3 show that technologies for improving heat provision (either by
replacing electricity or by using heat more effi ciently and effectively) will be adopted
more readily than electricity-generating technologies. Figure 4.3 also shows that
signifi cant gains are possible by improving energy management and control systems,
and using energy-effi cient equipment in the SME sector.
The fi ndings for heat pumps and solar water heating are consistent with recent
studies in Europe. They show that space and water heating are drivers in the uptake
of microgeneration in Europe.55
4.1.5 Results: Total projected energy generated and saved by different user sectors
Table 4.1 summarises the total potential energy generated and saved by the different
groups of local energy technologies in the residential and SME sectors. Separate tables
identifying the specifi c technologies for each sector are included in Appendix A.
In 30 years’ time, a total of 16,356 GWh/year of energy (electricity and heat) could be
generated or saved by adopting local energy technologies. This amount is made up of:
• 580 GWh/year micro electricity generation
• 8,021 GWh/year micro heat generation
• 7,755 GWh/year of electricity consumption avoided by energy effi ciency measures
(Table 4.1).
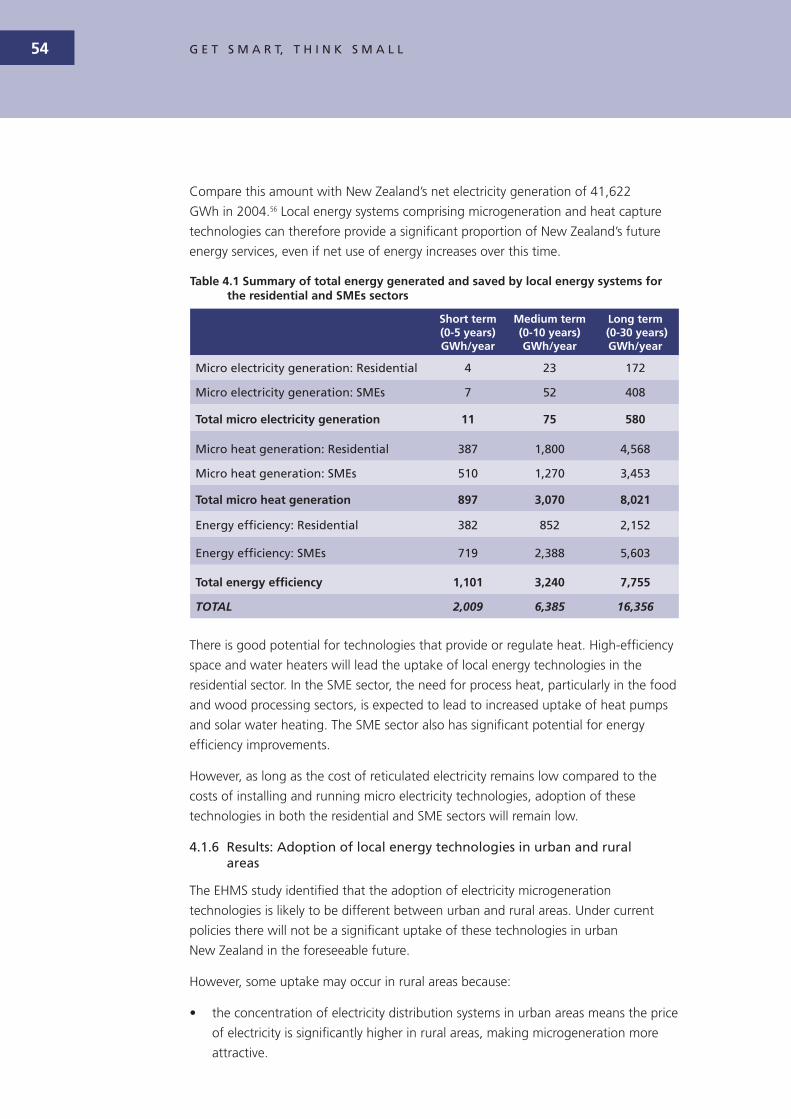
G E T S M A R T, T H I N K S M A L L54
Compare this amount with New Zealand’s net electricity generation of 41,622
GWh in 2004.56 Local energy systems comprising microgeneration and heat capture
technologies can therefore provide a signifi cant proportion of New Zealand’s future
energy services, even if net use of energy increases over this time.
Table 4.1 Summary of total energy generated and saved by local energy systems for the residential and SMEs sectors
Short term (0-5 years)GWh/year
Medium term (0-10 years)GWh/year
Long term (0-30 years)GWh/year
Micro electricity generation: Residential 4 23 172
Micro electricity generation: SMEs 7 52 408
Total micro electricity generation 11 75 580
Micro heat generation: Residential 387 1,800 4,568
Micro heat generation: SMEs 510 1,270 3,453
Total micro heat generation 897 3,070 8,021
Energy effi ciency: Residential 382 852 2,152
Energy effi ciency: SMEs 719 2,388 5,603
Total energy effi ciency 1,101 3,240 7,755
TOTAL 2,009 6,385 16,356
There is good potential for technologies that provide or regulate heat. High-effi ciency
space and water heaters will lead the uptake of local energy technologies in the
residential sector. In the SME sector, the need for process heat, particularly in the food
and wood processing sectors, is expected to lead to increased uptake of heat pumps
and solar water heating. The SME sector also has signifi cant potential for energy
effi ciency improvements.
However, as long as the cost of reticulated electricity remains low compared to the
costs of installing and running micro electricity technologies, adoption of these
technologies in both the residential and SME sectors will remain low.
4.1.6 Results: Adoption of local energy technologies in urban and rural areas
The EHMS study identifi ed that the adoption of electricity microgeneration
technologies is likely to be different between urban and rural areas. Under current
policies there will not be a signifi cant uptake of these technologies in urban
New Zealand in the foreseeable future.
However, some uptake may occur in rural areas because:
• the concentration of electricity distribution systems in urban areas means the price
of electricity is signifi cantly higher in rural areas, making microgeneration more
attractive.
P C E 55
• any (negative) environmental impacts of local energy systems are less signifi cant
in rural areas because the population is less dense and fewer pre-existing
environmental impacts arise from other activities (e.g. transport, home heating,
industry, etc).
Another signifi cant factor that will affect rural uptake is the 2013 removal of the
requirement for lines companies to maintain electricity supply to all areas. See
Section 2.3.8.
4.2 Similar studies in other countries
International examples of initiatives on local energy (also described as microgeneration
or distributed generation) are available in many countries, particularly in Europe.
For example, the German Government has promoted microgeneration as part of a
broader renewable energy programme. The German work is summarised in the PCE’s
publication Future currents.57 The German initiatives are also discussed in Section 5.2.3
of the present report.
The United Kingdom’s Department of Trade and Industry (DTI) has been studying
the potential of microgeneration in the UK, and recently released a report entitled
Potential for microgeneration: Study and analysis.58 The report examined this potential
under a range of different scenarios. Various government interventions were
considered, including:
• use of Energy Export Equivalence (EEE), where excess electricity is sold to the grid
at the same price as electricity bought from the grid
• a subsidy of 25 percent for purchase of microgeneration equipment to reduce
capitals costs
• Renewable Obligation Certifi cates (ROCs) which could allow microgenerators to
enter agreements for selling their renewable energy to electricity suppliers
• regulations promoting microgeneration use in all new buildings.
The report found that microgeneration could provide 30 to 40 percent of the UK’s
electricity needs, and help to reduce household carbon emissions by 15 percent a year.
However, without government interventions there would be no signifi cant uptake of
microgeneration technologies until between 2030 and 2050. Even then, EEE (selling
excess energy at the same price as bought energy) was still crucial for technologies
such as micro wind turbines and solar photovoltaics.
The report also highlighted that microgeneration could deliver signifi cant energy
effi ciency and carbon dioxide benefi ts (from, for example, increased use of
renewables, and use of waste heat from electricity generation or renewable heating
fuels). Microgeneration could also avoid losses in the electricity transmission and
distribution system.

G E T S M A R T, T H I N K S M A L L56
The report noted that microgeneration would need signifi cant uptake to have an
impact on the UK’s electricity system. That would require a new approach to energy
planning and policy, and a greater understanding of the likely interaction between
microgeneration technologies and potential end-users (the general public).
In March 2006 the UK Government followed up this study with a microgeneration
strategy, Our energy challenge: Power from the people.59 The objective is to create the
conditions for microgeneration to be a viable supplementary energy generation option
for householders, communities, and small businesses.
4.3 Summary
The EHMS study is the fi rst comprehensive attempt to quantify the potential for local
energy systems in New Zealand. This work is an important element in the discussion
about the role of these systems in New Zealand’s energy future, even allowing for the
inherent limitations of its assumptions.
The study has indicated that, under current policy and price settings, local energy
technologies are most likely to be taken up for water and space heating, and
for energy effi ciency and management. In contrast, micro electricity generating
technologies will have signifi cantly lower rates of uptake – primarily because of their
high cost.
The EHMS study did not assess the impact of different types of government
intervention. In effect, it assumed that the present institutional environment remains
largely constant over the next 30 years. Under such conditions, certain barriers will
prevent New Zealand from realising the full potential of local energy systems. These
barriers are the subjects of the next two chapters.
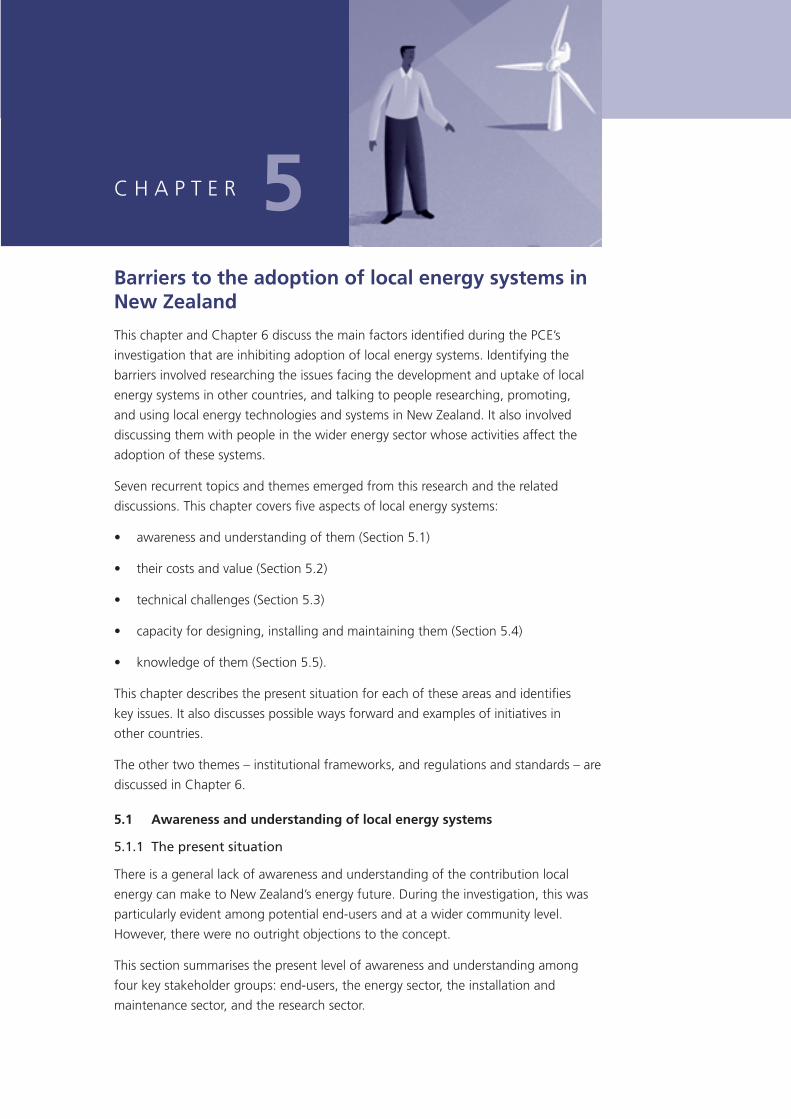
C H A P T E R 5Barriers to the adoption of local energy systems in New Zealand
This chapter and Chapter 6 discuss the main factors identifi ed during the PCE’s
investigation that are inhibiting adoption of local energy systems. Identifying the
barriers involved researching the issues facing the development and uptake of local
energy systems in other countries, and talking to people researching, promoting,
and using local energy technologies and systems in New Zealand. It also involved
discussing them with people in the wider energy sector whose activities affect the
adoption of these systems.
Seven recurrent topics and themes emerged from this research and the related
discussions. This chapter covers fi ve aspects of local energy systems:
• awareness and understanding of them (Section 5.1)
• their costs and value (Section 5.2)
• technical challenges (Section 5.3)
• capacity for designing, installing and maintaining them (Section 5.4)
• knowledge of them (Section 5.5).
This chapter describes the present situation for each of these areas and identifi es
key issues. It also discusses possible ways forward and examples of initiatives in
other countries.
The other two themes – institutional frameworks, and regulations and standards – are
discussed in Chapter 6.
5.1 Awareness and understanding of local energy systems
5.1.1 The present situation
There is a general lack of awareness and understanding of the contribution local
energy can make to New Zealand’s energy future. During the investigation, this was
particularly evident among potential end-users and at a wider community level.
However, there were no outright objections to the concept.
This section summarises the present level of awareness and understanding among
four key stakeholder groups: end-users, the energy sector, the installation and
maintenance sector, and the research sector.
G E T S M A R T, T H I N K S M A L L58
Awareness and understanding among potential end-users
The general public are aware of some of the technologies that make up local energy
systems. However, they rarely understand that:
• local energy solutions are about more than just generating electricity
• homes and workplaces need a lot of energy, and local energy systems have the
potential to contribute to that
• microgeneration technologies are relatively expensive when compared to
reticulated electricity
• local energy technologies need an integrated system.
People often expressed surprise that wood burners, solar water heaters, and the
passive thermal capacity of houses can be integral to the success of a microgeneration
system. Generally, they thought microgeneration was about producing electricity. They
often overlooked heat production and the ‘demand side’ aspects of local energy (such
as energy effi ciency, good systems design, and maximising use of available energy).
Our research also suggests that many potential end-users do not understand how
much energy is used in a modern home or workplace, the effect of meeting peak
loads on the cost of local energy systems, and the amount of energy that these
systems can realistically deliver.
Few people realise that solar photovoltaics, the most widely known of the
microgeneration technologies, is one of the most expensive. They have limited
awareness of the cost competitiveness of other forms of local energy such as solar
water heating and using insulation to improve heat provision.
Finally, our research found few people understand that local energy technologies
require an integrated system of energy sources, control systems, demand
management, and storage capability (or access to the wider grid). There is little
awareness of the benefi ts of using several microgeneration technologies, rather than
relying on just one local energy source.
Generally, the only people who have any awareness or understanding of local
energy systems are researchers, people promoting specifi c technologies, and some
interested individuals.
Awareness and understanding within the energy sector
As might be expected, there is a higher level of awareness of local energy systems in
the energy sector.
In the electricity industry, the lines companies60 seem most aware of the opportunities
and risks of microgeneration of electricity, although they tend to focus on larger scale
distributed generation (DG). DG plants are often situated close to end-users who

P C E 59
require larger amounts of energy (such as hospitals or large industrial plants). Also, DG
is primarily focused on the generation of electricity. The production and utilisation of
heat is of secondary importance.
Our research suggests that lines companies are interested in DG because they can use
it to strengthen their networks without investing in new line capacity. Orion is one
example of a lines company that uses DG, in the form of diesel generator sets,
to compensate for line constraints at times of peak load within their network
in Canterbury.
Distributed generation also provides a way for lines companies to diversify out of
the highly regulated core business of distribution networks where there are limited
options to seek new profi t opportunities. Unison’s and Eastland Energy’s wind farm
proposals are examples of this type of diversifi cation.
Some forward-looking lines companies are beginning to plan for the possibility
of their customers adopting microgeneration. For example, Orion has developed
standardised application forms for customers interested in grid-connected micro
electricity generation. MainPower (another Canterbury lines company) is assessing the
potential of various microgeneration technologies (solar photovoltaics, micro wind,
and micro hydro).61
Orion and MainPower see local energy systems and larger scale distributed generation
as potentially complementary to their core business. However, they also think that
the existing regulatory framework actively discourages lines companies from making
this a reality. The Ministry of Economic Development recently released a discussion
document, Facilitating investment in generation by lines companies, which explores
this issue.62
The attitudes of the combined generator-retail companies (the ‘gentailers’) are more
diffi cult to determine. Gentailers are most involved when a household or business
with microgeneration capability wishes to sell their surplus electricity back into the
network. How easily this transaction can be undertaken is an indicator of how well a
gentailer is engaging with the concept of microgeneration.
For example, Contact Energy offers contracts to electricity microgenerators on its
network. It also has an agreement with the NZ Photovoltaic Association (NZPVA) to
buy surplus electricity from NZPVA members at the full retail price (i.e. the price the
customer pays for their normal electricity).63
TrustPower has had a microgeneration policy in place since July 2003. It gives
customers metering and pays them $50/MWh + GST for all exported electricity. Other
gentailers, such as Meridian Energy, are considering how they can integrate customer
microgeneration into their business.
A small proportion of gentailers doubt the viability and usefulness of microgeneration.
One suggested that lobbying for microgeneration comes from a minority group of

G E T S M A R T, T H I N K S M A L L60
hobbyists and zealots looking for subsidies. They suggested that microgeneration
has very few institutional and market barriers in New Zealand, and that the only
real barriers are related to cost. This was based on the observation that, despite
allowing trading of surplus electricity at favourable prices, they had seen little uptake
of microgeneration among end-users. These views do not refl ect those of the entire
electricity industry, but this mindset of some in the sector is a potential barrier.
In summary, most of the electricity industry is aware of local energy systems, and
specifi cally microgeneration of electricity. However, some see these technologies as a
marginal part of the energy sector for the foreseeable future.64
Awareness and understanding in the installation and maintenance sector
The installation and maintenance of local energy equipment requires various
tradespeople. Our investigation found that some promoters and retailers of
microgeneration and heat capture technologies often had trouble installing local
energy equipment because many tradespeople did not have the necessary skills, and
those that do are often busy on other work.
However, this situation has improved in the last few years, particularly for the more
common technologies (such as heat pumps and solar water heating). Industry
advocates have played an important role in raising awareness and understanding
among tradespeople. This issue is related to building capacity for design, installation,
and maintenance of local energy systems (see Section 5.4).
The installation and maintenance of local energy equipment is also linked to local
government planning and authorisation processes. Staff at territorial authorities
were sometimes unaware or uncertain of planning and authorisation requirements
(particularly those related to the Resource Management Act 1991 and the Building
Act 2004). Regulations and standards are discussed in Section 6.2.
Awareness and understanding in the research sector
Many initiatives at university and Crown Research Institute (CRI) level include research
on local energy systems. Although much of this research is not focused specifi cally on
microgeneration or other local energy technologies, it is still useful for local energy
systems. Some of the key stakeholders and their local-energy related projects are listed
in Appendix B.
Issue 1: Limited awareness and understanding of microgeneration and local energy systems
Those in the energy sector are aware of local energy systems, especially those technologies that generate electricity, and the research sector has projects focusing on many aspects of local energy. However, there is a lack of awareness and understanding of local energy systems at the community level and, in particular, by the potential end-users. This lack of awareness and understanding signifi cantly affects the uptake of local energy systems.

P C E 61
5.1.2 The way forward
At present there is no specifi c government effort to promote local energy systems
in New Zealand. The Energy Effi ciency and Conservation Authority (EECA) does
support some forms of local energy, such as solar hot water heaters and domestic
heating effi ciency, as part of other programmes. However, EECA does not have a
specifi c programme that promotes, or raises awareness of, the concept of local
energy systems.
The Centre for Advanced Engineering is the main non-government organisation that
promotes awareness of small-scale energy production. Its focus is on microgeneration
and distributed generation. The Centre publishes Energy21 News: The news journal
for distributed energy resources.65
An integrated education and awareness programme led by government and industry
would help potential users. The programme could raise awareness and understanding
of local energy systems and the various technologies, highlight their costs and
benefi ts, and outline the role they could play in New Zealand’s energy future.
5.1.3 Initiatives in other countries
The United Kingdom’s Department of Trade and Industry (DTI) has taken some
steps to raise awareness of the concept of microgeneration. Recently it developed a
microgeneration strategy entitled Our energy challenge – Power from the people.
Another DTI project, the Clear Skies Programme, supported the adoption of 6,976
local energy technologies in England, Wales, and Northern Ireland from 2003 to 2006,
with funding of almost £5 million. The programme aims to increase the uptake of
microgeneration equipment by households and community organisations. At present
around 184 schools in England, Wales, and Northern Ireland operate small-scale
renewable technology installations to provide their energy services.66
5.2 The costs and value of local energy systems
5.2.1 The present situation
In order for renewable policies to be fully effective, they need to send the right signals to the market. Market stability facilitates investment confi dence, which encourages entry.67
The East Harbour Management Services (EHMS) study summarised in Chapter 4
clearly demonstrates that the cost of buying, installing, and maintaining local energy
technologies, combined with the relatively low cost of reticulated electricity, make
many local energy options uneconomical. In particular, technologies such as solar
photovoltaics, micro wind turbines, and micro hydro systems are too expensive in
most situations.

G E T S M A R T, T H I N K S M A L L62
However, the EHMS study does not account for all the benefi ts provided by local
energy systems (described in Chapter 3). As a result, their true value is not effectively
represented in the marketplace.
It is often diffi cult for governments to justify intervening in any marketplace. However,
in local energy’s case there is a strong argument for intervention because energy
prices currently do not capture many of the costs imposed on the environment and
society. Pricing also neglects many of the benefi ts provided by alternative energy
systems, including local energy systems. International experience has shown that
pricing these costs and benefi ts accurately requires government intervention.
Issue 2: Properly valuing the benefi ts and costs of local energy technologies
The cost of some local energy technologies, particularly some electricity generating technologies (e.g. wind and solar photovoltaics), puts people off adopting them. However, these costs and related energy pricing systems do not refl ect the true value of local energy systems (i.e. the inherent public benefi ts such as reduced greenhouse gas emissions, increased energy security, and more effi cient use of existing capacity).
5.2.2 The way forward
Economic instruments can reduce the typically high costs of some local energy
technologies. The range of options includes:
• tax relief on the cost of equipment
• capital grants to subsidise the relatively high initial purchase costs
• rebates to partially refund purchase and installation costs
• combined incentive schemes that use several economic instruments to achieve the
desired outcome.
Other economic instruments can remove some of the market barriers, particularly by
helping end-users sell their surplus energy (see Section 6.2). The three most common
approaches are:
• net metering and net billing
• standard offer contracts (feed-in tariffs) that offer customers a predetermined
fi xed price for electricity that they export back to the grid
• mandatory requirements for energy retailers to provide a set quantity or
percentage of their electricity from renewable energy sources. This aims to
stimulate market growth by creating a mandatory demand for renewably
generated electricity.
More details on net metering, net billing, and standard offer contracts are given in
Appendix C.

P C E 63
5.2.3 Initiatives in other countries
Other countries have introduced economic policies that make local energy systems
more cost-competitive with traditional sources of energy services. Some examples are
given below.
Tax relief
In the United Kingdom, VAT (the UK equivalent of GST) has been lowered as an
incentive for people to buy micro wind turbines, solar thermal technologies, solar PV
panels, ground source heat pumps, and air-sourced heat pumps.68 The reduced VAT
rate is 5 percent, whilst the standard rate is 17.5 percent. This means a solar panel
normally costing £11,750 can be bought for £10,500, saving £1,250.
Capital grants
The British Department of Trade and Industry and the Energy Saving Trust undertook
the Solar PV Grant Programme from 2002 to 2006 with a budget of £26 million. The
size of the grants varied with the type of building and size of solar panels, but could
be up to 50 percent of the total cost of installation.
Japan implemented the Ten Thousand Roofs programme in 1994, where the
Government paid one-third of the installation cost of solar PVs on household roofs,
funded through an electricity surcharge. Local utilities were also obliged to purchase
excess power generated by these solar PV systems at the retail price of electricity. The
scheme ran until September 1997 when it was replaced by other schemes for PV and
other renewable sources of energy.
These schemes have boosted domestic demand so much that Japan has become
a world leader in solar capacity and PV cell manufacturing. In 2003, Japanese PV
companies manufactured just over 50 percent (588 MW) of the global supply of PV
modules, of which 45 percent was sold to the local market.69
Rebates
The Australian Government implemented the Photovoltaic Rebate Programme in
January 2000.70 The A$50 million programme offers cash rebates to homeowners
who install solar PV systems. The programme is also available to community buildings,
schools, display homes, and housing developments.71
The cash rebate was originally set at A$4 per peak watt installed and capped at
A$4,000. In January 2006 this was reduced to A$3.50 per peak watt for residential
installations. The solar PV systems have to be at least 450-watt peak output. As an
example, if a 1 kW solar panel retails for around A$10,000, a cash rebate of A$4,000
is provided (i.e. 1,000 times A$4), reducing the retail price to A$6,000. Many retailers
involved in the scheme charge customers the discounted rate for the PV system and

G E T S M A R T, T H I N K S M A L L64
get the reimbursement from the Government themselves, as this saves extra hassle for
the customer. The programme is expected to run until June 2007.
Combined incentive schemes
The most comprehensive incentive scheme known for local energy systems is
Germany's 100,000 Roofs Programme.72 Launched on 1 January 1999, it provided
interest-free loans (and low-interest loans) for solar PV units of 1 kW or less. The
loans covered the entire retail cost of the units, and were made available through
the customer’s own bank. The 10-year loan had to be paid back in eight annual
instalments, with no repayment required in the fi rst 2 years.
The programme was so successful that it ended in 2003 – 18 months earlier than
planned – when the target of 100,000 installations was met. Around 10 percent of
instalments were commercial, and the rest were households and community groups.
In April 2000, the scheme was integrated within their Renewable Energy Law. (More
details of this scheme are given in Appendix D.)
Germany now has the second largest solar PV capacity in the world after Japan, with
around 150,000 solar PV installations. This market expansion has boosted the local
manufacturing industry: in 1999, all PV units installed in Germany were imported but
by 2004 more than half were locally made. The price of solar PV units fell 20 percent
during this time, as economies of scale were reached in production of solar units and
mounting systems.
Standard offer contracts
By 2005, at least 32 countries and fi ve states or provinces had introduced standard
offer contracts, including 16 European nations as well as Brazil, Sri Lanka, Thailand,
China, and India.73
Mandatory requirement schemes
By 2005, mandatory requirement schemes had been set up in 11 countries including
Australia, Japan, the USA, and various European countries.74 These schemes come in
a variety of forms with different names, such as mandatory quota systems, renewable
portfolio standards, and renewable obligations.
Most schemes have focused on developing large-scale renewable generation,
although there are some exceptions. For example, introduction of the Renewable
Portfolio Standard (RPS) in New Mexico required utilities to purchase 10 percent of
their electricity from renewable sources. The power companies could choose either
to build their own renewable generators, or to incentivise their customers to build
their own.
P C E 65
Power New Mexico (PNM) chose the latter option, and implemented its Solar PV
Program. When customers connect to PNM, with an installed solar PV panel of 10
kW or smaller, they receive a payment or credit of 13 cents for every kWh the panel
produces, regardless of their consumption. In addition, a net-metering arrangement
is offered, where customers can sell surplus electricity back to the grid for the same
price that they buy it.
5.3 Technical challenges
5.3.1 The present situation
Local energy systems include established technologies (e.g. solar hot water heating,
building insulation, high effi ciency wood burners) and emerging technologies,
mostly electrical, that require further development (such as fuel cells, some types
of micro hydro, wave, and tidal power systems, and some bioenergy systems). For
the established technologies, research is continuing on reducing costs, increasing
reliability, and widening their applicability. Much of this research is happening
overseas and, for many of the technologies, New Zealand will be in a receiver role,
a ‘technology taker’, rather than an instigator or developer. However, where New
Zealand has special expertise it should play an important role in the development of
specifi c technologies (see Section 5.3.2).
During this investigation it became apparent that the real technical challenges for
New Zealand could best be described as contextual (i.e. how certain technologies
should be applied in each context rather than what specifi c types of microgeneration
and related technologies need to be developed). In particular, the following areas
require more attention.
Site-specifi c design of local energy systems
As discussed in Section 2.4, designing a local energy system requires attention to a
number of site-specifi c factors, including:
• the energy services required
• the local energy resources available
• energy storage options
• the reliability of the systems
• the budget available
• the role of the end-user.
The implications of local energy systems for the centralised electricity network
As on-grid local energy systems become more common, they will begin to affect the
operation and integrity of wider distribution networks. These networks will need to
adjust to accommodate multiple fl ows of electricity as more people invest in local

G E T S M A R T, T H I N K S M A L L66
energy systems. The additional fl ows will affect voltage, frequency, and the incidence
of system faults.
The network companies are also concerned about the impact of local energy systems
on their business and profi tability. Electricity generated (or saved) through the use
of local energy systems could reduce the demand for electricity to be transported
through some parts of the electricity network.
Smart metering
The lack of smart metering systems in New Zealand’s electricity system is not just
a major technical barrier to the adoption of on-grid local energy systems, but also
a major source of ineffi ciency in the electricity market. Indeed, the Parliamentary
Commissioner for the Environment’s recent assessment of the environmental
performance of the electricity sector also supports developing policies that require
smart meters for effi ciency.75
Storage technologies
At present, many energy storage systems are expensive, have short functional
lifetimes, are only suitable for specifi c applications, and are often high-maintenance.
The lack of cheap, reliable, versatile, and low-maintenance energy storage systems
is a major constraint to promoting off-grid systems in particular. Renewable off-grid
systems based on wind and sunlight must incorporate a storage system (or alternative
back-up generators using fossil fuels) because of the intermittent nature of these
energy sources.76
For on-grid systems that include a storage component, lines companies and/or energy
retailers could import microgenerated electricity into their networks at times of high
demand. This arrangement would allow end-users to receive a premium price for
the surplus energy that they export to the wider grid. Therefore, as local energy
technologies based on intermittent renewable sources of energy become more
common, the need to develop better storage systems for use in both off-grid and on-
grid systems will increase.
Issue 3: Overcoming the technical challenges associated with design, installation, and operation of local energy systems
A range of enabling technologies and methods is required to integrate microgeneration technologies effectively into local energy systems. These include methods for designing site-specifi c local energy systems, modelling the interactions between on-grid systems and the wider electricity network, smart metering systems, and improved storage technologies.

P C E 67
5.3.2 The way forward
Site-specifi c design of microgeneration systems
Designing a local energy system that takes account of all relevant site-specifi c factors
is a complicated process. Ongoing research at Massey University and Industrial
Research Limited (IRL) is examining how to undertake in-depth assessments of the
physical resources and end-user requirements prior to designing local energy systems.
A Massey PhD student has recently developed a comprehensive decision-support
system that combines local energy system performance and economic predictive tools
with social and environmental parameters. The objective is to enable end-users to
select their energy choices using a triple bottom line approach.77 The work suggests
that this important aspect of local energy systems requires further research in
New Zealand.
Implications of local energy systems for the centralised electricity network
As on-grid local energy systems become more common, lines companies (and possibly
even Transpower) will need to change the way they plan their investment, and learn
new techniques for operating the grid in a secure manner. IRL has undertaken work in
this area, but there is a need to further develop these models to help lines companies
and policymakers understand the short and long term implications for distribution
networks of increasing amounts of on-grid microgenerated electricity. These models
will enable lines companies to incorporate the growth of microgeneration into their
network planning.
Smart meters
Smart meters have been described in Section 2.3.2. An essential element of an
effi cient electricity system, they enable consumers to analyse their electricity use
meaningfully. Research has shown that this information infl uences consumers’
behaviour, causing them to use energy more wisely and to consider alternatives
such as energy effi ciency improvements or a local energy system (if they don’t have
one already).78
In August 2006 Arcinnovations, a subsidiary of Meridian Energy, announced the start
of an Advanced Meter Management Programme. This is a 2-year programme to
introduce smart meters to over 100,000 Christchurch homes. Initially the focus is on
the commercial benefi ts of reducing costs through remote accurate meter-reading.
Other benefi ts have been promised to customers, including:
• eliminating the need for meter readers to have regular access to consumers’
properties
• greater accuracy in billing detail
• comparative information to guide customer decisions about electricity use
G E T S M A R T, T H I N K S M A L L68
• more detailed time-of-day pricing and incentives to increase energy effi ciency and
reduce energy bills
• energy management tools, potentially including remote control of household
appliances or workplace equipment
• diverse payment options, potentially including consumer-selected bill dates
• new service models with options allowing consumers to directly tailor and manage
their energy requirements.79
Smart meters could potentially allow energy retailers or lines companies, with the
micro generator’s agreement, to exercise some degree of control over the local
energy system, possibly using a predetermined price as the trigger. This would
provide a mechanism for ensuring that network stability is enhanced by local energy
systems (see Section 3.1.1), and that any surplus energy generated from intermittent
renewable sources is not wasted.
Storage technologies
The most widely used form of energy storage is the lead acid battery. However,
these batteries are relatively costly and need careful management because of their
concentrated acid content. There are now other types of batteries, such as the lithium
ion battery, which cost more but are cheaper to operate. All electrochemical batteries
have limited lifetimes (because of the limited number of times that they can be fully
discharged).
Storage technologies that are available or in development, other than batteries,
include super capacitors, fuel cells, fl y wheels, compressed air storage, and pumped
hydro storage. There is signifi cant effort going into the development of these energy
storage systems but the focus is mostly on the larger scale rather than the local energy
scale. There is a need to develop energy storage systems that are compatible with
local energy systems.
5.3.3 Initiatives in other countries
Other countries are looking at how to address some of the technical challenges of
local energy systems.
Implications of local energy systems for the centralised electricity network
Analysis for the UK’s DTI found that the initial impact of local energy systems on
networks would be minimal, although heavy concentration in small areas could
possibly lead to issues. The study found that an unacceptable level of voltage variation
occurred within the network when 50 percent of the houses had microgeneration
capacity (i.e. 50 percent of houses had a 1.1 kW generator, or 550W per house).
The analysis also found that reverse power fl ow, which occurs when more electricity is
generated than consumed and power is spilled back into the network, would probably

P C E 69
become a problem when local energy penetration is around 1.4 kW per house.
Most distribution system transformers are only designed to take power in
one direction (towards the building). The study concluded that these issues could
easily be resolved, and questioned whether they were economic matters rather than
technical limitations.80
The Australian Government is now attempting to understand the impact of local
energy systems through the Solar Cities project. It will create an urban-scale model
combining solar PV, energy effi ciency, load management, smart meters, and cost-
refl ective pricing. At least four major cities will be involved, each competing on
a tendering basis for the funding. Installations will be completed in each city by
around 2008–2009. The project will monitor the effect of this large-scale ‘real world’
application of smart meters and cost-refl ective pricing on energy consumption
patterns, attitudinal and behavioural changes, the need for network upgrading, and
greenhouse gas emission levels.81
BC Hydro, the utility that serves all British Columbia in Canada, is concerned about
the sheer complexity of managing networks of smart devices including distributed
generators (although these generators are at a larger scale than the focus of this
report). BC Hydro’s Powertech Labs are developing software to model power grid
stability, including the impacts of large numbers of distributed generators.82
Storage technologies
This is an area where work is being done in New Zealand. For example, IRL is assessing
the use of fuel cells in local energy systems, and Auckland University is looking at the
use of ultra capacitors in smaller scale applications.
In Canada, BC Hydro is exploring practical issues around integrating fuel cells into
its own grid operations. Working with the Canadian National Research Council’s
Institute for Fuel Cell Innovation and British Columbia-based Ballard Energy Systems,
it is testing how 1 kW Ballard fuel cells perform as replacements for batteries on the
BC Hydro grid. The utility has 600 sites where batteries provide emergency power,
including substations and telecommunications sites used in BC Hydro’s own control
system. Field tests started in 2004.83
5.4 Capacity for design, installation, and maintenance of local energy systems
5.4.1 The present situation
A major barrier to local energy systems in New Zealand is the shortage of people who
can provide expert advice on design, installation, and maintenance. Development of
New Zealand’s capability in this fi eld will require appropriately trained and qualifi ed:
• engineers specialising in local energy technologies and systems (to adapt or
develop technologies for New Zealand conditions)
G E T S M A R T, T H I N K S M A L L70
• architects with knowledge of passive solar design and energy effi ciency
in buildings
• developers and property managers (who understand the benefi ts and costs of
local energy systems and how to incorporate them into the specifi cations for new
and existing buildings)
• builders (for installation of local energy systems)
• plumbers (for installation and repair of technologies such as solar water heaters)
• electricians (for installation and repair of local energy systems)
• accreditors (for checking that local energy systems and installations meet and
continue to meet legislative requirements)
• inspectors (for certifying installed local energy systems).
Over time this will lead to a local energy services industry. Training will also be needed
for people in the real estate, valuation, and mortgage sectors to assess ‘added value’
of infrastructure with local energy capability.
During the PCE’s investigation, it became clear that only some design, civil
engineering, and building fi rms will promote the benefi ts of highly energy effi cient
buildings to their clients, even though most have been trained in applying energy
effi ciency concepts. The demand is currently for larger houses with lots of features,
and energy performance is a minor consideration, if considered at all.
Until clients demand the ‘eco’ house rather than the ‘ego’ house, designers and
builders will not implement energy performance measures or develop the relevant
skills. This lack of awareness and understanding among potential end-users was
discussed in Section 5.1.1.
The Solar Industries Association (SIA) is concerned that the shortage of qualifi ed
plumbers and electricians is already inhibiting the uptake of solar hot water heaters.
In this situation, there is always a danger that ‘cowboys’ will undermine what is
otherwise a valid energy option by poor installation or by recommending systems that
are not appropriate. Certifi cation, quality assurance programmes, and greater brand
awareness are required to minimise this problem.
Another problem for someone wishing to install a local energy system is that
installation and servicing may require several tradespeople. For example, installing
solar hot water heaters requires a plumber and often an electrician. This adds another
layer of complexity and planning which may deter some people.
Experience with solar water heater installations indicates that in some regions it is
hard to get tradespeople to do the work because of competition for their services.
Clients must compete with others wanting these same tradespeople to undertake
other more traditional tasks.

P C E 71
Issue 4: A lack of capacity in the local energy sector
Inadequate training, qualifi cation and accreditation schemes associated with the emerging local energy industry could act as a deterrent to the adoption of local energy systems. Potential end-users require reliable and accessible information about them. In addition, the installation and maintenance industry requires robust product information, installation and maintenance training, and accreditation to support them in using and promoting local energy systems to potential end-users.
5.4.2 The way forward
Professional training for engineers and architects should cover the potential of
local energy systems and the availability of various technologies and approaches.
Experience in the United Kingdom has shown that post-graduate training is a
useful approach.
Integrated and comprehensive training and certifi cation schemes are required for
local councils offi cers, employees of lines companies, trade certifi ers, electricians,
and plumbers so that they are qualifi ed to approve or install local energy systems. An
example of one initiative is a short course run by the Waikato Institute of Technology.
The course, leading to a qualifi cation, is for plumbers who wish to develop skills to
install and maintain solar water heaters.
Qualifi cations for local energy technologies would address the problem of it taking
multiple tradespeople to install microgeneration technologies. Appropriately qualifi ed
tradespeople could install and repair particular types of technologies (e.g. solar hot
water heaters, photovoltaics, micro wind turbines) even though this work may
require the skills of more than one of the traditional trades (e.g. the electrical and
plumbing trades).
5.4.3 Initiatives in other countries
The shortage of qualifi ed professionals and tradespeople is not unique to New
Zealand. For example, the UK Microgeneration Strategy identifi es a possible shortage
of qualifi ed people in some traditional occupations (such as plumbers and electricians)
if the demand for local energy technologies increases. The strategy proposes that:
DTI will explore with the Sector Skills Councils what more can be done to ensure that the skills base develops to support the levels of demand that will hopefully be created for microgeneration technologies. The other signifi cant issue for industry development is the education of the related industries mentioned above.84
Other countries have – or are starting to – put in place both government and privately
funded programmes to fi ll these gaps. The Energy Institute in the United Kingdom,
for example, holds one-day courses throughout the year specifi cally to update the
G E T S M A R T, T H I N K S M A L L72
knowledge of energy professionals on all aspects of local energy systems and energy
management.85
The USA’s Zero Net Energy Buildings Outreach and Action Plan offers an example of
coordination among different professionals and tradespeople. Initiated in 2000 by
the US Department of Energy, the plan involves creating a number of homebuilder
teams. These teams bring together construction companies, architects, engineers, and
builders, with the aim of designing, building and showcasing ‘zero-energy houses’.86
The plan aims to build over 100,000 affordable zero-energy houses by 2020.87
5.5 Developing knowledge about local energy technologies
The investigation for this report identifi ed a variety of research needs across the
disciplines of engineering, economics, systems modelling, and social science. However,
the subject most often discussed was the development of promising technologies and
combinations of technologies relevant to the New Zealand situation.
5.5.1 The present situation
Developing knowledge about energy technologies involves three stages.
1 Research: from the initial research into the concept, through to the experimental
or bench-top stage to show that the technology works in practice
2 Development: developing the concept from the bench-top to the pilot stage
3 Pilot: discovering whether the technology works as expected under realistic
conditions.
A subsequent stage, not usually considered part of the research and development
process, is also essential to successful uptake. This is the early commercial stage
where the technology is brought to the attention of target audiences, often through
demonstration projects run in cooperation with selected potential end-users.
During this investigation, stakeholders expressed concern about the diffi culty of
obtaining funding for this stage; in particular, for demonstrating technologies and for
other pre-commercial projects. Without such activities it is diffi cult to attract interest
and investment into the sector.
Anecdote suggests that there is a shortage of venture capital for local energy in
New Zealand. The lack of any signifi cant existing industry in this area further restricts
investment potential. In summary, a classic ‘catch-22’ situation exists, as it does in the
UK, where microgeneration is curtailed by investment wariness.88
Some stakeholders also raised concerns about the diffi culty of obtaining funding for
research and development of local energy technologies in general. (See Appendix
E for more about current funding of energy research.) However, the Minister for
Research, Science and Technology announced in a 2006 Budget speech that $11.7
million in new funding would be invested over four years on energy research:

P C E 73
This new energy research funding will assist New Zealand to move toward a more sustainable energy future so we can more effectively respond to pressures on energy supplies and security. In particular, the research will be aimed at assisting New Zealand to:
• more fully understand our indigenous energy resources and opportunities, in particular using renewable energy resources;
• develop new energy technologies, and be better placed to adapt and adopt new overseas technologies, for use in New Zealand;
• understand and implement opportunities to use energy more effi ciently in homes and businesses.
These initiatives sit alongside other ongoing streams of work, including the National Energy Strategy.89
Although not specifi cally mentioned, development of local energy technologies
would be consistent with these objectives. If funding is to be directed to them, it is
important that the National Energy Strategy clearly identifi es local energy systems as
an important work stream.
Finally, those involved in research into local energy felt that a more coordinated
research strategy would assist in strengthening the overall effect of individual research
efforts. This will help to avoid potential overlaps in research, and focus it towards
areas of most benefi t.
Issue 5: Need for a coordinated local energy research programme and funding for demonstration projects
The concept of local energy systems is not yet fully recognised in New Zealand science, technology, and research policy development. Without a coordinated programme there could be overlaps and gaps in research, reducing the potential benefi ts. There is also a shortage of funding for demonstration projects that show the feasibility of local energy systems to potential end-users.
5.5.2 The way forward
This investigation has identifi ed some important areas where research is needed, such
as the economics of local energy systems (including evaluation of the public benefi ts),
their impact on electricity networks, and how people interact with them.
However, the most signifi cant research need is for a research programme specifi cally
focused on local energy systems. This should identify, as a minimum:
• demonstration projects that can show the feasibility of local energy systems to
target audiences

G E T S M A R T, T H I N K S M A L L74
• gaps in information where research is required
• areas of future local energy research potential
• the important components of overseas research applicable to New Zealand
• opportunities for collaboration among research stakeholders nationally and
abroad.
This programme should be part of a wider strategy for local energy systems (see
Chapter 7).
5.5.3 Initiatives in other countries
The UK’s microgeneration strategy states that the:
DTI will produce a map of available funding, building on the Research Atlas being developed by the UK Energy Research Centre, together with guidance on how to apply. This will then inform further assessment as to whether R&D funding is being appropriately targeted.90
A 2006 UK Government Budget speech also announced:
…a new fund, initially £50 million, for microgeneration technologies which make it possible for homes and businesses to generate their own renewable energy. The purpose of this £50 million fund is to show how we can make these technologies from wind turbines to solar heating, affordable to schools, housing associations, businesses including local authority tenants – initially 25,000 buildings…91
The Canadian Government has a Technology and Innovation Initiative with a
Decentralized Energy Production (DEP) component with funding of C$20 million over
fi ve years. The DEP team’s strategic plan included defi ning boundaries with other
government-funded research and development programmes, and integration with
other technology and innovation areas.92
5.6 Summary
This chapter has identifi ed fi ve factors that are inhibiting the adoption of local energy
systems in New Zealand, from which fi ve key issues can be distilled:
Issue 1: Limited awareness and understanding of local energy systems.
Issue 2: Valuing local energy technologies properly.
Issue 3: Overcoming the technical challenges associated with design, installation, and
operation of local energy systems.
Issue 4: A lack of capacity in the local energy sector.

P C E 75
Issue 5: Need for a coordinated local energy research programme and funding for
demonstration projects.
We have suggested possible ways forward for each of these issues, and given
examples of initiatives in other countries. However, none of these measures will
succeed unless the institutional and regulatory barriers to microgeneration are
removed. This is the subject of the next chapter.

C H A P T E R 6The institutional and regulatory framework
6.1 Institutional framework
The existing institutional framework that oversees and provides energy services in New
Zealand is complex, refl ecting 20 years of ongoing reform. Table 6.1 summarises the
key players and their roles in relation to local energy systems.
Table 6.1 The key local energy stakeholders and their roles
Institution Role in relation to local energy systems
Government agencies
Ministry of Economic Development (MED)
MED develops and oversees energy related policies and legislation including:
• energy strategies
• energy-related legislation and regulations
• government policy statements on energy
• regulation of safety in the electricity and gas industry.
Current work: MED is developing a New Zealand Energy Strategy; it could include local energy policies.
MED is also developing distributed generation regulations (including the microgeneration of electricity).
Energy Effi ciency and Conservation Authority (EECA)
EECA is responsible for promoting energy effi ciency and renewable energy. It is also responsible for developing the Government’s National Energy Effi ciency and Conservation Strategy (NEECS).
Current work: Some local energy technologies are included in the renewable and energy effi ciency programmes (e.g. solar hot water heating promotion).
EECA is currently reviewing the NEECS, which could be amended to include local energy objectives.
Ministry for the Environment (MfE)
MfE is responsible for the climate change programme.
Current work: MfE is currently reviewing the Government’s climate change policy, including any economic instrument that places a price on carbon. Such an instrument would support the uptake of local energy.

P C E 77
Department of Building and Housing (DBH)
DBH develops and oversees the Building Code and Building Act 2004. From 2007 the Building Practitioners Board will licence professional builders.
Current work: DBH is currently reviewing the energy effi ciency provisions of the Building Code. This review will infl uence building requirements and aspects of local energy systems.
Ministry of Research, Science and Technology (MRST)
MRST develops the Government’s research and innovation funding policy. It also has a key role in managing the Government’s programmes of research, science and technology across all sectors, including energy.
Foundation for Research, Science and Technology (FRST)
FRST develops operational funding policy and allocates the Government’s research funding.
Current work: FRST is currently reviewing its energy funding criteria.
Commerce Commission (CC)
The CC ensures the commercial compliance of electricity lines companies, Transpower, and natural gas distributors with the provisions in the Commerce Act 1986 (electricity lines companies and Transpower have specifi c provisions in Part 4A of the Act).
Regional Councils Regional Councils set rules and regulate the taking and discharge of water; this may have an impact on some micro hydro schemes.
Territorial Authorities (TAs)
TAs set rules that regulate the use of land, noise effects, and access to sunlight.
The TAs’ building inspectors also ensure that alterations to buildings comply with the rules in plans and the Building Act and Code.
Electricity sector
Electricity Commission Regulates the electricity market. Does not set prices but sets the rules by which the market operates.
The Commission must achieve a number of objectives including seeking to achieve specifi c outcomes:
“The electricity sector contributes to achieving the Government’s climate change objectives by minimising hydro spill, effi ciently managing transmission and distribution losses and constraints, promoting demand-side management and energy effi ciency, and removing barriers to investment in new generation technologies, renewables, and distributed generation.”93
Gentailers Generate electricity and, either directly or through their own retail arms, sell it to end-users; they may also own electricity meters.
Lines companies Build and maintain the local distribution networks; they may also own electricity meters.

G E T S M A R T, T H I N K S M A L L78
Transpower Builds and operates the national grid and maintains grid security.
Meter companies The major metering company NGC wants to introduce smart electricity meters into the market. The company was separate from the other players in the electricity market but is now owned by Vector, a lines company.
M-co (The Marketplace Company)
Operates the wholesale electricity and electricity contracts market.
Providers of non-electrical energy resources
Gas production companies
Unlike the electricity generating companies, they do not have much presence in the retailing industry. An exception is Todd Energy, which also has an interest in a number of electricity generating and retailing enterprises.
Gas supply companies These are the equivalent of electricity retailers and, in many cases, are part of a major electricity company. They on-sell natural or, in some cases, landfi ll gas to consumers.
Gas lines companies Similar to electricity lines companies, and operate under a similar regulatory environment.
Vector Formerly NGC, operates the main gas network.
Coal and wood providers
This sector comprises one large company, Solid Energy (which provides coal and wood pellets), and many small businesses.
Microgeneration providers
Individual microgeneration companies
Individual and small companies that sell, install, and repair microgeneration technologies. They are often also importers, and in some cases developers and manufacturers of these technologies.
Many of these providers have formed associations to raise their profi le. These associations often work with EECA to undertake promotional activities.
This group also includes architects and builders who specialise in the provision of passive solar buildings, and energy-effi cient building methods.
The key stakeholders that can hinder or support initiatives for local energy systems
are the Government and its agencies, electricity retailers, Transpower, and the lines
companies. Their roles are outlined below.
The Government and its agencies
The energy sector is institutionally and physically set up to provide energy (primarily
electricity and gas) in large quantities from remote locations to dispersed end-users
(as described in Chapter 2). Government institutions are designed to ensure that this
happens as effi ciently, cheaply, and reliably as possible.

P C E 79
Small-scale energy generation for local use does not fi t this institutional model.
Therefore there is a danger that the current institutional framework in New Zealand
could hinder the adoption of local energy systems.
The Ministry of Economic Development and the Electricity Commission are
undertaking some work in this area, but their primary focus is on the barriers facing
larger-scale distributed generation projects. Local energy is seen as a subset. There has
been little Government research to identify the scale of the opportunities arising from
local energy systems.
Local energy features in some Government programmes but has no specifi c strategy
or programme of its own. Government promotion of local energy is part of distributed
generation and energy effi ciency programmes. One example is EECA’s solar water
heating initiative, which is part of the Government’s energy effi ciency programme. In
addition, an important part of EECA’s current effort to promote renewable energy is
through making submissions in support of large-scale projects such as wind farms.
Electricity retailers
The electricity retailers have a role to play in buying surplus electricity from on-grid
electricity microgeneration. Table 6.2 summarises the policies of some electricity
retailers for buying microgenerated electricity.
As the technology becomes more prevalent it is likely that more microgenerators will
choose to stay on the grid so that they receive the benefi ts of back-up supply and the
ability to sell any surplus electricity. However, there is little commercial incentive for the
electricity retailers to buy this power, as it directly competes with their own business. If
the retailer does buy this electricity, then there is a strong reason to pay only the price
it pays its other suppliers (the wholesale price). This price does not refl ect the wider
benefi ts that microgeneration offers, both to the grid (by delaying the need for more
investment) and the other areas described in Chapter 3.
Table 6.2 Summary of the microgeneration purchase policies of some electricity retailers
Retailer Owned by Microgeneration purchase policy
TrustPower Ltd TrustPower Ltd Buys surplus microgeneration electricity at $50/MWh + GST.
Empower Ltd Contact Energy Buys surplus PV electricity at the retail price from New Zealand Photovoltaics Association (NZPVA) members only. Other purchase agreements are case dependent.
Meridian Energy Ltd Meridian Energy Ltd Meridian offers net metering to customers with small microgeneration capacity. This does not include the lines component of any tariff.
G E T S M A R T, T H I N K S M A L L80
Transpower and the lines companies
Although Transpower has no apparent concerns about local energy at this time, it
does have an ongoing policy of questioning any initiatives that could result in its
assets becoming stranded (redundant). Suffi cient adoption of local energy systems
in high-demand areas (e.g. Auckland and Christchurch) could lead to parts of its grid
being under-utilised. This could pose a risk to Transpower’s business, as its revenue is
proportional to the amount of electricity carried by their power lines. However, the
adoption of local energy systems would have to be signifi cant for this scenario to
become a reality.
The only major players in the electricity market that currently have an incentive to
promote local energy are the lines companies. There are several reasons for this
difference:
• Local energy can be used to delay new investment in lines, and this has economic
value for a lines company
• The core business of the lines companies is strictly regulated, and local energy
provides an opportunity to develop new markets
• Most lines companies still operate within their original power board areas. These
companies often retain a close relationship with the local community, and may see
local energy as another opportunity to work with these communities.
However, the lines companies made it clear in discussions that they fi nd the current
regulatory framework overly restrictive resulting in less effi cient outcomes. This is
discussed further in Section 6.2.1.
Issue 6: The complex institutional framework of the energy sector is a potential barrier for local energy systems.
The energy sector, particularly the electricity industry, has a complex management and institutional framework based on the centralised model of energy provision. This could be a barrier to development of the local energy marketplace.
6.1.1 The way forward
An integrated strategy on local energy could help resolve some of the issues outlined
above. The strategy could provide a comprehensive overview of the local energy
sector, and highlight issues and priorities for further work.
As an example, a local energy strategy (based on stakeholder consultation) could
identify the key institutional barriers to it, and devise tailored solutions. Such a
strategy could identify legislation and policies that require amending (or development)
to facilitate the adoption of local energy. Some possible directions are outlined in
Section 6.2.

P C E 81
6.1.2 Initiatives in other countries
In March 2006 the UK Government launched its Microgeneration Strategy, Our energy
challenge – Power from the people.94 The strategy has the following objective:
…to create conditions under which microgeneration becomes a realistic alternative and supplementary energy generation source for the householder, for the community and for small business.95
It points out that a range of constraints is currently affecting the wide-scale
deployment of microgeneration, including fi nancial, information, technical, and
regulatory constraints. The strategy recognises that a range of actions is required
to achieve its stated objective, particularly by the Government and other key
stakeholders. This approach provides a model for other nations interested in
supporting local energy.
Stakeholder feedback following the strategy’s release was largely supportive, with
praise for the measures suggested as a good fi rst step for overcoming the barriers,
and support for the suggested policy framework.96
6.2 Regulations and standards
6.2.1 The present situation
This section describes some of the key regulatory barriers to the adoption of local
energy systems:
• the Electricity Industry Reform Act 1998
• standardised approvals
• rights of access to renewable energy sources
• the Building Act 2004 and the Building Code
• technical standards.
Electricity Industry Reform Act 1998 (EIRA)
The Electricity Industry Reform Act 1998 (EIRA) divided the electricity sector into two
parts: the owners of the lines and infrastructure, and the sellers and/or generators
of electricity. The Act imposed strict controls and regulations on cross-ownership,
and provided for full corporate separation through mirror trusts and arms-length
management. This was in response to concern that local electricity companies, being
both vertically integrated and natural monopolies, could be involved in practices that
were anti-competitive, preventing the electricity market operating effectively.
The EIRA was amended in 2001 and 2004. The 2001 amendment eased the
prohibition on lines companies owning generation. The justifi cation was that lines
companies should be able, where it made economic sense, to invest in distributed

G E T S M A R T, T H I N K S M A L L82
generation rather than upgrading lines networks. The amendment allowed lines
companies to own distributed generation up to the greater of 5 MW or 2 percent of
their maximum demand, and to sell the power from such generation.
The 2001 amendment also allowed lines companies to generate electricity from
renewable energy sources to an unlimited level. If capacity exceeded 5 MW or 2
percent of their peak load then full corporate separation and arms-length rules
would apply.
The 2004 amendment raised the limit on lines companies’ ownership of non-
renewable generation to 50 MW or 20 percent of peak load, and an unlimited
amount of reserve generation contracted to the Electricity Commission. However, the
provisions relating to full corporate separation and arms-length rules still applied for
any generation capacity above 5 MW or 2 percent of peak demand.
Many lines companies consider that the current regulatory environment is still
overly restrictive. An example of the tension was highlighted by the Commerce
Commission’s recent decision to decline Eastland Networks’ application for exemption
from the arms-length rules and the restriction on selling electricity directly to its line
customers. The decision to decline was based on concerns about the opportunities
the exemption would create for lines companies to use their line monopoly to favour
their own electricity generation activities at the expense of other competing electricity
generators and retailers.97
Recognising this concern among lines companies, the Ministry of Economic
Development (MED) in April 2006 issued a discussion paper titled Investment in
electricity generation by lines companies.98 The paper considers areas where there
may be unnecessary barriers to lines companies’ investment in large- and small-scale
generation. It acknowledges that lines companies are technically able to generate
unlimited amounts of energy for new renewable energy projects, and limited amounts
for non-renewable energy projects. However, the paper suggests that legal constraints
create fi nancial barriers to the viability of such projects.
In particular, the paper identifi es the following constraints:
• Lines companies are prohibited from hedging the fi nancial risks of selling energy.
They must sell either at spot prices or to other parties who are able to manage the
variations in power production and market prices. This usually means a competing
energy generator/retailer or one of the few large energy users that are active in
the electricity market.
• The compliance costs associated with operating holdings with full corporate
separation and compliance with arms-length rules (required for any generation by
lines companies above 5 MW or 2 percent of peak demand) may be too high to
justify for smaller projects.

P C E 83
It appears from the paper’s conclusions that further legislative changes to facilitate
lines companies’ investment in generation are likely to occur.
Streamlined approvals for installing and operating local energy systems
An individual or business wishing to install some form of local energy technology
will in most instances require regulatory approvals or contractual agreements with
one or more agencies. Depending on the type of local energy system, the applicant
may need approvals from regional and territorial authorities, lines companies and
electricity retailers, and/or licensed workers. Getting these approvals is often felt
to be unnecessarily complicated and expensive, and discourages uptake of local
energy technologies.
Regional council and territorial authority approvals
Regional councils and territorial authorities are consent authorities under the Resource
Management Act 1991 (RMA). Technologies that use water – such as micro hydro
systems – may require resource consent from a regional council to use, dam, or divert
the water. Also, resource consent may be required from a territorial authority if the
local energy system:
• produces excessive noise
• impacts on visual amenity
• involves land use such as the construction of an unauthorised structure.
An example could be the proposed installation of a micro-wind turbine in an
urban environment.
The RMA allows councils to include provisions in their regional or district plans that
make certain activities permitted (with or without conditions). Permitted activities
do not require resource consent. Usually the effects of such activities are known and
considered minor.
However, most local energy technologies are relatively uncommon in New Zealand,
and council offi cials have limited experience with them. Offi cials often err on the side
of caution and require additional conditions to reduce risk (and adverse impacts).
Proponents of local energy technologies consider that some resource consent
conditions are unnecessary and can add signifi cant costs to some systems.
Regional and territorial authorities also use their powers and functions under the
Building Act 2004 to ensure that local energy systems comply with the Building Code.
Any system that impinges on the structural integrity of a building may require such
an approval. Solar hot water heaters, heat pumps, roof-based wind turbines and
photovoltaics are technologies that fall into this category. Regional councils are also
responsible under the Building Act 2004 for matters pertaining to dams.

G E T S M A R T, T H I N K S M A L L84
Building inspectors are required to determine the adequacy of building work.
However, industry participants have advised that, as in setting environmental
performance standards for local energy technologies, unfamiliarity with these
technologies often means councils and inspectors err on the side of caution. So there
is considerable variability in the way the Building Code is applied, sometimes even
within the same council. This issue raises questions about the need for extra staff
training in this area (see Section 5.4).
Alternative options for approving local energy systems include:
• councils undertaking the verifi cation, as they do with buildings and
building alterations
• an independent third party verifying installation
• the owner bearing the risk (with or without insurance).
Some other questions are relevant in setting up an approvals mechanism for the
installation of local energy systems:
• Who pays the costs associated with approval of an installation – the public or
the applicant? At present each council makes this decision through their cost
recovery policies.
• Who carries liability if anything goes wrong? This could be a signifi cant issue
restricting local energy uptake, particularly as bad installation and liability issues
could deter customers from entering the local energy market.
Lines companies and electricity retailer approvals
Any local energy system that is intended to export electricity into the local network
will require approval from the local lines company under the Electricity Act 1992 and
Electricity Regulations 1997. The applicant will need to comply with the local lines
company’s network connection requirements for on-grid systems, which cover safety
provisions. In addition, the lines company may also require some form of payment for
lines connection.
The applicant will also need to fi nd a buyer for the electricity. In most cases this will
involve a contract to sell and purchase, between a local energy system end-user and
a dedicated supplier or electricity retailer.99 Examples of these types of arrangement
are Windfl ow Technology’s supply agreement with the Christchurch City Council, and
Energy3’s agreement to sell electricity to Meridian Energy (an electricity retailer).100
The Energy Effi ciency and Conservation Authority (EECA) has identifi ed two barriers to
the development of very small (up to 5 kW) renewable generation, namely:

P C E 85
…the lack of standard connection agreements for connecting such generators to lines networks and the lack of standard agreements for electricity retailers to purchase surplus electricity. Its work [EECA] is to determine model agreements to overcome these barriers.101
Some line companies, for example Orion, offer standard connection contracts for
microgenerators. Contact Energy also offers a standard purchase contract for small
amounts of electricity. However, these arrangements are not common across the
industry and conditions vary.
Two initiatives under way, one by the Ministry of Economic Development (MED) and
the other by the Electricity Commission (EC), attempt to address the uncertainties
surrounding connection to the network and sale/purchase of small amounts of
surplus electricity.
MED has recently developed draft distributed generation regulations and released
these for consultation in September 2006. Submissions were due by 10 October 2006.
The regulations follow on from a 2003 discussion document that proposed how to
set the price chargeable by lines companies to microgenerators for connecting to
the network. The document defi ned two categories of generation: less than 10 kW
generation capacity and 10,000 kWh generated per year, and over 10 kW ‘connected
behind load’ (i.e. primarily for use on the site where generation occurs). Both
categories are applicable to the types of local energy considered in this report.102
The recently released Draft Electricity Governance (Connection of Distributed
Generation) Regulations 2006 now only distinguishes between two categories: less
than or equal to 10kW, and above 10kW generation capacity. The ‘behind load’
concept is no longer included.
For less than 10kW generation there is no cost of connecting to the local lines
network because:
…there is an expectation of suffi cient network capacity, and the distributor is therefore expected to approve connection at no cost (other than for additional metering and for processing the application) provided that there is suffi cient connection capacity at the existing point of connection and the distributed generation meets relevant connection standards.103
The Ministry considers there will be no impact from the uptake of these small
microgeneration systems on line capacity in the medium term and therefore no need
for lines companies to recover capital and operating costs though fi xed charges. The
Ministry will, however, continue to monitor the situation.
For more than 10kW generation the regulations propose that distributors may charge
generators an amount that recovers reasonable capital and operating costs, but only
those necessary for the connection of the distributed generation.

G E T S M A R T, T H I N K S M A L L86
The costs that can be considered are for:
• connection from the power plant to the network
• up-rating of lines, transformers, and switchgear
• changes to fault protection and voltage control systems.
However, pricing provisions also include the expectation that generators will be
recognised for the benefi ts they provide to the network by avoiding the need for a
line to be upgraded.
The Electricity Commission (EC) is developing model retail contracts to standardise
some of the conditions applying to the sale and purchase of electricity. The suite
of model contracts being developed includes provisions for buying small surpluses
of electricity generation from distributed generation. The provisions relating to the
purchase of electricity from small-scale distributed generation (i.e. local energy
systems) are included as Schedule 1 to the Model Domestic Contract For Delivered
Electricity (Interposed).104
The schedule, however, is optional for retailers, and applies only to those
microgenerators with equipment that generates less than 40,000 kWh per year. The
schedule also requires the installation of an approved export meter (net metering is
not permitted), and each retail company sets their own price for the purchase of
any electricity.
At present it is uncertain whether electricity retailers will use this schedule of the
model contract and what price plans the model contracts might contain. It appears
the retailers are awaiting the outcome of the Electricity Commission’s work on
producing a common industry model before releasing or developing further policy.
Approvals under the Electricity Act 1992 and the Electricity Regulations 1997
Any microgeneration technology that produces voltages above 50v AC or 120v
DC will require certifi cation by a licensed worker (electrician) under the Electricity
Act 1992 and the Electricity Regulations 1997. The certifi cation confi rms that the
electricity generating equipment is safe to connect to the electricity lines network.
One advantage of smaller microgeneration systems is that they can operate below
these voltages and avoid this requirement. However, their usefulness is limited to off-
grid systems that do not require the operation of standard electrical appliances.
Rights of access to renewable energy sources
As local energy systems using renewable sources of energy become more prevalent
it is likely that there will be confl icts over rights of access to energy sources. For
example, confl icts could arise when:
• a farmer has a micro hydro scheme and another farmer upstream wants to take
water for irrigation

P C E 87
• a house in Auckland has photovoltaic cells on the roof, and the next-door
neighbour constructs a building that blocks the sun for part of the day
• a house in Wellington has a micro wind turbine on the roof, and the next-door
neighbour plants trees that eventually grow and disturb the wind fl ow.
Local and central government will have to consider how such confl icts are managed
if local energy is taken up more widely. Specifi c rules may need to be developed,
and consideration given to permitted activity rules under local government planning
frameworks, particularly those pertaining to the RMA.
Building Act 2004 and the Building Code
The purpose of the Building Act is to regulate building work to ensure that buildings
meet set standards of safety, contribute to health and well being, and “are designed,
constructed, and able to be used in ways that promote sustainable development”.105
The Building Code is a set of regulations made under the Building Act that prescribe
both the functional requirements for buildings, and the performance criteria that
buildings must meet in their intended use.106 The Department of Building and
Housing administers the code. The Act requires that the code be reviewed by 30
November 2007, and the Department of Building and Housing is currently consulting
stakeholders as part of this review.
Regional and territorial authorities are building consent authorities under the Act.
They administer the requirements of both the Building Act and the Building Code.
When building consent authorities are performing functions under the Act they must
(among other things) take into account “the need to facilitate the effi cient use of
energy and energy conservation and the use of renewable sources of energy
in buildings”.107
To help builders comply with the code, a number of ‘acceptable solutions’ are
provided. The code does not currently contain any acceptable solutions for local
energy technologies, although it considers solar hot water heating as an acceptable
solution to the H1 energy effi ciency requirements in the Building Code.
For those local energy systems that will fall within the scope of the Building Code,
such as roof-mounted wind turbines and photovoltaic arrays, clear guidance would
be useful. This would mean specifi c provisions and possibly even some ‘acceptable
solutions’ for these technologies.
The code also sets the minimum standards for energy effi ciency of buildings, through
the H1 compliance document. The review of the code will:

G E T S M A R T, T H I N K S M A L L88
…examine how it could be more user-friendly, and ensure that performance standards for buildings are clear and meet community expectations. These changes will take into account the Act’s requirements for sustainable development and for buildings that help people stay healthy and comfortable.108
In October 2006, as part of the review of the Building Code, the Building Issues
Minister announced a new package of work aimed at improving the energy effi ciency
of New Zealand homes and commercial buildings through insulation, solar, lighting
and other technologies. A public discussion document was released in November with
public comment sought by April 2007.109
Although the discussion document is focused on improving energy effi ciency in
buildings, there is some overlap with many of the issues discussed in this report. It
would be timely if, as part of the review of the Building Code, some thought were
given to the impact of emerging local energy technologies on the code.
Technical standards
Technical standards ensure that microgeneration components of local energy systems
are safe, do not adversely affect the security of the electricity system (if they are
on-grid), and perform as promised. Some lines companies have already developed
standards for those microgeneration technologies that will be connecting to their
networks. An example of such a standard is Orion’s Requirements for embedded
generation.110
In addition, there are Australian and New Zealand technical standards that cover
performance testing and installation of solar hot water heaters, photovoltaics, and
heat pumps.
However, many of the technologies identifi ed in this report have not been tested in
New Zealand. In these cases, the purchaser and any approving authority will have to
rely on the source country’s standards for technical information, where they exist. It is
possible that such standards may not be recognised, or may be inappropriate for the
New Zealand situation.
Issue 7: New Zealand’s regulatory framework does not support local energy
New Zealand’s current regulatory framework provides some barriers to the adoption of local energy. The range of legislative requirements for the local energy sector could confuse and discourage interested parties and end-users from investing in local energy.

P C E 89
6.2.2 The way forward
Many areas within the regulatory framework require development to facilitate
local energy.
The Ministry of Economic Development is currently consulting on the regulatory
barriers that prevent lines companies becoming involved in local energy activities. In
addition, the Electricity Commission is conducting work on developing model retail
contracts for local energy. This work is an important prerequisite to the widespread
adoption of on-grid local energy. However, further work is required by local
government and the installation industry to devise a framework of authorisation and
certifi cation to ensure quality control and resolve liability issues.
All this policy and regulation development will be driven largely by the demand for
local energy and the sector’s reaction to problems that arise. However, rather than
relying on this reactive development approach, some form of proactive strategy
– based on discussion among all key stakeholders – could help develop more robust
planning and approval procedures, and regulation for the local energy sector. Any
strategy needs to link to the issues identifi ed in Chapter 5, and those explored further
in Chapter 7.
6.2.3 Initiatives in other countries
There are a number of examples in the UK of regulatory initiatives to overcome the
types of barriers identifi ed in this section.
Planning Policy Statement 22: Renewable Energy was published in 2004, and
established that local authorities could set targets for on-site renewable energy in
residential, commercial or industrial projects.111 The London Borough of Merton
provides an example of this type of initiative in practice (see box).
The UK Offi ce of the Deputy Prime Minister (ODPM) has recently announced a review
of permitted development rights enjoyed by householders. The intention is to make it
easier to install microgeneration equipment such as micro wind and heat pumps in UK
homes. A permitted development right allows owners to make certain types of minor
alterations to their homes without the need to apply for planning permission.112
Regarding building regulations specifi cally, the ODPM in the UK announced in March
2006 that it would strengthen the Code for Sustainable Homes alongside tougher
building regulations to address climate change. This code sets higher standards for
new homes to be rated against, in order to increase environmental sustainability and
give homeowners better information about the running costs of their homes.
The code’s minimum standards will be raised above the requirements of mandatory
building regulations, and each level of the code will set minimum requirements
for energy and water effi ciency. Code points are part of the scoring system and a
minimum number of points are needed for code compliance. New homes that use

G E T S M A R T, T H I N K S M A L L90
micro renewable technology such as wind turbines and solar panels will gain extra
code points to further promote on-site energy generation.
The proposals for strengthening the Code have been criticised by some environmental
organisations for not having tougher standards, not including commercial buildings or
refurbishment of existing buildings, and not being mandatory.113
In Spain, the Technical Building Code was established in March 2006.114 This code
requires all new buildings and renovations, regardless of their use, to provide 30 to 70
percent of their expected hot water demand by solar energy. This obligation depends
on different parameters, including expected volume of water demand, geographical
position of the building, and surrounding shade. In addition, large buildings of over
4,000 m2 fl oor space will be required to install solar PV systems.115
The Merton rule
In October 2003, the London Borough of Merton became the fi rst local authority in the UK to introduce a policy that required new non-residential buildings to generate at least 10 percent of their energy needs from on-site renewable sources. The ruling applies to all non-residential developments larger than 1,000 m2.
The fi rst development under the policy was a 4,500 m2 industrial building, on which 10 small wind turbines and 9 kW of photovoltaics were installed. Five further developments have been built or are under construction.
The policy has been dubbed ‘the Merton rule’ and now almost a quarter of all local authorities in the UK are either implementing or formulating similar policies.
In order to help industry learn more about these requirements, the Merton rule was showcased in seminars at the Interbuild Exhibition in Birmingham in April 2006. The seminars provided an opportunity for designers, architects, surveyors, and builders to share experiences and best practice in working under the Merton rule.116
6.3 Summary
In addition to the fi ve issues identifi ed in Chapter 5, this chapter has identifi ed
two further issues that are holding back the adoption of local energy systems in
New Zealand.
Issue 6: The complex institutional framework of the energy sector is a
potential barrier.
Issue 7: New Zealand’s regulatory framework does not support local energy.
Possible ways forward that address these issues have been suggested, and examples
of initiatives in other countries given. Development of a local energy strategy for New
Zealand is particularly crucial. This is discussed in more detail in the next chapter.

C H A P T E R 7Making the shift to local energy
7.1 The potential for local energy in New Zealand
Local energy systems are in a similar position today as telecommunication and
computing technologies were 30 years ago. When the fi rst personal computers
and basic internet protocols were developed during the 1970s, most people didn’t
understand these new technologies or foresee their potential. It wasn’t until user-
friendly software and lower prices made them more accessible that they began to
be widely adopted. The internet and personal computing are now an integral part of
most modern societies.
The same potential exists, and could be realised, with local energy systems.
The EHMS study of the uptake of local energy in Chapter 4 found that most growth
would occur between 2016 and 2036, when the cost of many of the technologies is
expected to decline signifi cantly. By the end of this period the equivalent of 16,000
GWh electricity a year could either be generated on-site, or avoided, by the adoption
of local energy technologies. This amount can be compared with New Zealand’s net
electricity generation of 41,600 GWh in 2004.
In other words, even without additional government intervention, 39 percent of New
Zealand’s current electricity use could be displaced by local energy systems in 30 years’
time. Considerably more is possible with government leadership and support.
7.2 The time is right
New Zealand is particularly well suited to local energy systems because of its abundant
renewable energy sources (i.e. sun, wind, and water). Although wind and hydro
energy sources can be (and are already being) used in large electricity generating
plants, such plants have signifi cant drawbacks compared with using these energy
sources in local energy systems (as discussed in Chapter 3). In the case of hydro
power, many of the sites suitable for large-scale development have already been used.
Most of the remaining sites are in areas with signifi cant environmental or other values,
where public acceptance of large-scale development plans would be diffi cult to gain.
Local energy systems that can displace electricity generated from large, centralised
plants, especially those that use fossil fuels, have the potential to deliver many public
benefi ts. These have been discussed in Chapter 3 under four headings: national
energy system benefi ts, environmental benefi ts, economic benefi ts, and social and
cultural benefi ts (see Section 3.1).
G E T S M A R T, T H I N K S M A L L92
Now is an appropriate time for New Zealanders to seriously consider how to realise
these benefi ts, and how to introduce local energy systems into the marketplace.
Overseas experience clearly indicates that, with government’s support, local energy
systems could become an integral part of New Zealand’s future energy sector.
7.3 The way forward
The potential benefi ts of local energy will not be realised on any signifi cant scale
unless there is government leadership. In addition, this report has identifi ed seven
issues affecting the adoption of local energy systems (see Chapters 5 and 6).
Further work is needed to address these issues. Recommended actions are
summarised in the following sections.
7.3.1 Increasing awareness and understanding of local energy systems (Issue 1)
Awareness of local energy is growing, but among the general public there remains a
lack of understanding about:
• what local energy comprises – that it’s not just about generating electricity, and
that successful systems need an integrated range of energy sources, control
technologies, energy storage technologies (or access to the wider grid), and
demand management systems
• the potential contribution of local energy systems to energy services in homes
and workplaces
• the relative costs of local energy technologies, particularly those that
generate electricity.
The focus of the electricity industry is primarily on larger-scale distributed generation
rather than local energy. However, some lines companies, such as Orion and
MainPower, are aware that local energy systems, particularly those that allow for the
microgeneration of electricity, present both opportunities and risks to their businesses.
The attitudes of the ‘gentailers’ are more diffi cult to determine, but at this stage they
seem to have more of a ‘wait and see’ attitude.
The Government can take a lead in building local energy awareness and knowledge
by endorsing its future role, and developing programmes to address the barriers
identifi ed in this report. The current work on developing a National Energy Strategy
provides an opportunity to bring local energy into the mainstream of energy policy.
The Government can also take a lead in its own activities by looking for local
energy opportunities within government. The Govt3 programme is an ideal means
of implementing local energy initiatives into mainstream government activities.117
The programme works with agencies to implement the Government’s sustainability
policies (including the National Energy Effi ciency and Conservation Strategy, the
Climate Change Programme, and the New Zealand Waste Strategy).

P C E 93
Recommendation 1
a) That the Minister of Energy, as part of the New Zealand Energy Strategy, develops a
specifi c local energy work programme for New Zealand that:
• endorses the concept of local energy
• identifi es the contribution that local energy systems can make to New Zealand’s
future energy services provision
• sets targets for the short, medium, and long term uptake of local energy
• sets out the roles and responsibilities of government agencies in achieving
the targets
• provides a framework that coordinates the work programmes to implement
Recommendations 2 and 3.
b) That the Minister for the Environment supports local energy initiatives through the
Govt3 programme.
7.3.2 Getting the costs and benefi ts right (Issue 2)
Some local energy technologies identifi ed in this report already make fi nancial sense
(e.g. solar water heating). However, many are still more expensive to install and
operate than using reticulated electricity and gas. Current costs and projections make
it clear that these technologies will not be a signifi cant component of New Zealand’s
energy future in the next few years unless there is government intervention (as
demonstrated in Chapter 4).
Nevertheless, New Zealand has a history of government intervention in the energy
sector for the public good. Our large hydroelectric projects were funded and built by
the Government. The Government underwrote the development of the Maui gas fi eld
through the Maui take-or-pay gas contract. More recently, the Government intervened
in the electricity market through the Whirinaki power plant and the Huntly e3p gas
contract. The net result of these interventions is that New Zealand has had some of
the lowest priced energy in the world.
In the same way, adoption of local energy systems could be supported through a
range of economic instruments as outlined in Section 5.2.2. Such intervention could
be justifi ed by the fact that these systems provide private and public benefi ts that are
not taken into account by the market. For this reason, work is required to assess the
value of the private and public benefi ts of local energy.
Work is also needed to develop economic instruments that value the costs and
benefi ts of local energy, and promote its uptake. Some of the instruments used
in other countries should be investigated including standard offer contracts,
net metering and net billing, rebates, capital grants, tax relief, and mandatory
requirements targeted at small-scale applications.

G E T S M A R T, T H I N K S M A L L94
Recommendation 2
That the Ministers of Finance and Energy:
• undertake work that identifi es the value of the private and public benefi ts (social,
economic, and environmental) arising from local energy systems
• develop economic instruments that recognise the value of these benefi ts and
promote the uptake of local energy, possibly by including:
– net metering and net billing
– standard contract offer/feed-in tariffs
– rebates
– capital grants
– tax relief
– mandatory requirements (similar to the renewable portfolio standard but
targeted at small-scale applications).
7.3.3 Local energy technology research (Issues 3 and 5)
Many local energy technologies have been developed to the point where they are
ready for uptake in the marketplace. However, there remain a number of areas
requiring further knowledge development. Future research should give priority to:
• demonstration projects showing the feasibility of local energy to potential
end-users
• improving the performance and lowering the costs of selected energy generation
and transformation technologies, in particular energy storage systems and local
energy system control technologies
• developing tools to assess the impact of future local energy on existing
electricity networks
• development of assessment methods for designing site-specifi c local energy
systems, which help system providers work with communities and individuals.
Recommendation 3
That the Foundation for Research Science and Technology develops specifi c guidelines
for funding local energy research.
7.3.4 Building capability to design, install and maintain local energy systems (Issue 4)
A challenge common to all countries encouraging the uptake of local energy
technologies is the shortage of suitably qualifi ed people to design, install, and

P C E 95
maintain local energy systems. This investigation has identifi ed a number of essential
professions and trade groups for this work: engineers, architects, developers and
property managers, builders, plumbers, electricians, and accreditors and inspectors
(the offi cials that issue approvals).
A comprehensive training strategy is required to deliver integrated management
training and certifi cation schemes for these people. These schemes should be
developed bearing in mind that local energy requires customised application for
each situation.
Recommendation 4
That the Minister of Tertiary Education and Associate Minister of Tertiary Education
direct the Ministry of Education, NZQA, and the Tertiary Education Commission to
work with tertiary institutions and Industry Training Organisations to develop training
programmes and qualifi cation standards for skills in:
• designing site-specifi c local energy systems (engineers, architects, developers and
property managers)
• installing, maintaining, and servicing local energy systems (tradespeople)
• approving local energy systems (accreditors and inspectors).
7.3.5 A place in the market for local energy (Issue 6)
The energy sector and its associated regulatory agencies have for 80 years been
focusing on large-scale, centralised energy projects. Consequently, the current
institutional framework does not provide the best conditions for encouraging local
energy. Work is needed specifi cally to assess the barriers this institutional framework
creates, and how these can be lifted.
Recommendation 5
That the Ministers of Energy and Commerce identify barriers in the electricity market
that are preventing the uptake of local energy, and develop policies to:
• ensure that there are no market barriers preventing the sale of surplus electricity
produced by local energy systems
• create pricing conditions that refl ect the true value of local energy
• guarantee access to the wider grid for end-users with on-grid local energy
systems, subject to safety and quality standards
• address the effect of line and connection charges on the fi nancial viability of on-
grid local energy systems
• address the barriers facing lines companies wanting to be involved in local energy
(which is different from lines companies being involved in larger-scale distributed
generation)

G E T S M A R T, T H I N K S M A L L96
• develop measures that encourage the uptake of smart/advanced meters that
support local energy systems (i.e. meters that record and display imported and
exported electricity, and the amount of gross generation).
7.3.6 Getting the regulatory framework right (Issue 7)
This investigation has identifi ed a number of regulatory issues that present barriers to
the uptake of local energy (Section 6.2.1). The key ones are:
• the lack of information and precedents for approving local energy systems under
the RMA 1991 and the Building Act 2004
• the need to improve the thermal and light performance of new and existing
buildings (commercial and residential) in the Building Code
• the lack of ‘acceptable solutions’ for local energy technologies in the
Building Code
• the lack of New Zealand-specifi c technical standards for local energy technologies
that ensure quality and performance for consumers (Sections 5.4.1 and 6.2.1).
Guidance documents are needed to help local authorities understand the approval
process for local energy systems in relation to the RMA and planning regulations. The
Ministry for the Environment could lead this initiative, with input from the Electricity
Commission, EECA, and the Department of Building and Housing.
The current Building Code review needs to support the uptake of local energy in
commercial and residential buildings by aiming for the world best practice for thermal
performance and natural light use in residential and commercial buildings. The code
also needs to account for the requirements of local energy systems when buildings are
designed and built (e.g. planning their orientation to the sun for energy effi ciency),
and possibly including some ‘acceptable solutions’ for local energy systems.
Standards New Zealand, with the Electricity Commission, EECA, and Department of
Building and Housing, needs to identify local energy technologies appropriate for New
Zealand, and develop appropriate technical compliance standards.
Recommendation 6
The PCE recommends that:
• the Ministry for the Environment, with the Electricity Commission, EECA, and the
Department of Building and Housing, develop guidance documents to help local
authorities understand the implications of local energy technologies for the RMA
and planning process
• the Minister of Building Issues ensures that the review of the Building Code sets
standards that will achieve world best practice in thermal performance and use of
natural light for residential and commercial buildings

P C E 97
• the Minister of Building Issues ensures that the review of the Building Code takes
account of the structural requirements on commercial and residential buildings for
installation of local energy systems
• Standards New Zealand, with support from the Electricity Commission and
Department of Building and Housing, initiates a programme to identify local
energy technologies currently and potentially applicable in New Zealand, and
develop technical compliance standards for these technologies.

G E T S M A R T, T H I N K S M A L L98
GlossaryActive networks A possible evolution of the current passive
distribution networks. Proposed as a means of technically and economically facilitating distributed generation. The model is based on increased interconnection as opposed to the current mostly linear/radial connections, and requires active management of congestion unlike conventional passive systems.
Biomass energy source Any organic matter that is available on a renewable or recurring basis, including dedicated energy crops and trees, agricultural food and feed crop residues, wood and wood wastes, animal wastes, and other waste materials.
Cascade failure Cascade failure can occur when a system composed of interdependent elements is loaded to or near capacity. The cascade occurs when one of the elements fails and the load shifts to other elements in the system. Those elements, already at capacity, also fail, shifting their load onto other elements. The term is frequently used in reference to large power grids but cascade failure can also occur with other systems such as roads.
Cogeneration The simultaneous generation of electricity and heat.
Combined cycle power plant A power-producing engine or plant that employs more than one thermodynamic cycle. A cogeneration plant is a combined cycle power plant.
Demand-side management Management that infl uences the amount or timing of users’ energy demand in order to use scarce energy resources most effi ciently. This includes reducing the peak demand by spreading the customer load more evenly over the entire daily or weekly period.
Distributed energy resources The microgeneration of electricity or electricity and heat (combined heat and power).
Distributed generation The use of power generation technologies located close to the end-user, but still connected to the grid.
Electrical resistance A measure of the degree to which an object opposes the passage of an electric current.
Energy demand Energy use measured in blocks of power fl ow (usually in half hour periods).
Energy effi ciency Increasing the energy services provided for a given amount of energy input.
(DER)
P C E 99
Energy services Services that people value and that require energy, such as lighting, heating, cooling, mobility, communication, and information technologies.
Energy sources The forces or materials that provide energy when accessed or converted by technologies; for example, solar heat and light, wind, gravity (falling water), geothermal, wind, biomass, and fossil fuels.
Fuel cell An electrochemical energy conversion device that is designed for continuous replenishment of the reactants consumed. They produce electricity from an external supply of fuel (usually hydrogen) and oxygen.
Fuel switching Using a different fuel to provide the same energy services (for example, using wood pellets instead of electricity for heating a home).
Gigawatt hour (GWh) 1,000,0000,0000 watt hours. New Zealand uses around 41,000 GWh of electrical energy per year. See Watt hour.
Grid constraint When the capacity of the transmission or distribution system is insuffi cient to transport enough electricity to meet demand (usually at peak times).
Hydrological cycle The continuous circulation of water between the atmosphere, land, surface water, and groundwater; driven by solar radiation.
Kilowatt (kW) 1,000 watts. See Watt.
Kilowatt hour (kWh) 1,000 watt hours. See Watt hour.
Lines companies The companies that manage the local networks. There are 33 lines companies; many are owned or co-owned by community trusts.
Local network The electricity network excluding the transmission grid operated by Transpower.
Megawatt (MW) 1,000,000 watts. See Watt.
Megawatt hour (MWh) 1,000,000 watt hours. See Watt hour.
Micro grids Small electrical distribution systems that connect many customers to many distributed sources of generation and storage.
Mirror trusts Section 38 of the Electricity Industry Reform Act 1998 allows energy trusts to establish mirror images (mirror trusts) of themselves to conduct the business they had to relinquish as a result of the lines/energy split.

G E T S M A R T, T H I N K S M A L L100
National grid The high voltage power cables that transmit electricity from where it is generated to local lines networks or directly to industrial users; operated by Transpower.
Natural monopoly These occur where the technological advantages of large-scale production preclude effi cient competition among smaller companies. The necessary conditions for a natural monopoly are high fi xed costs of entering which cause long run average costs to decline as output expands. Network companies such as electricity and telecommunications are often cited as classic natural monopolies. However, technological developments can quickly alter this situation.
Peak load/Peak demand The times when demand for electricity is at its maximum, requiring generation to operate at or near its full capacity.
Power factor New Zealand’s electricity system is based on Alternating Current (AC). The current and the voltage change polarity (phase) 50 times a second. Only voltage in phase with current provides useful energy. Poor power factor occurs when inductive loads (the loads caused by the magnetic fi elds in electric motors, solenoids) cause the current and voltage to not change polarity at the same time. Power factor can be corrected through the installation of certain equipment, and the owners of large loads are required to keep their power factor within specifi c limits.
Renewable energy Energy from sources such as the sun, wind, waves, tides, ocean currents, the hydrological cycle, and biomass, that are sustainable and naturally replaced within a short time period.
Reserve generation A generation plant specifi cally built and operated to be used only in times of exceptional peak demand, or in an emergency when other generation is not available.
Reticulated electricity Electricity supplied through the electricity network (transmission and distribution networks).
Smart grids A similar concept to active grids but with a greater emphasis on integrating microgeneration into the system and managing demand (including the control of domestic loads).
Solar photovoltaics A technology that converts solar energy directly into electricity.

P C E 101
Spot price The price set in the wholesale market for electricity in a specifi ed half hour period at a specifi c point where it leaves the transmission grid.
Stirling engine A type of combustion piston engine that incorporates a heat-exchange process that allows for the near-ideal effi ciency in conversion of heat into mechanical movement.
Terawatt hours (TWh) 1,000,000,000,000 watt hours. See Watt hour.
Thermodynamic cycle There are two primary classes of thermodynamic cycles. Power cycles are cycles that convert a heat input into a work output. Refrigeration cycles transfer heat from low to high temperatures using work input.
Transmission The transmission of electricity through high voltage current. Usually used to describe the grid operated by Transpower and not the local distribution networks.
Vertically integrated monopoly A monopoly created through vertical integration. These companies are united through a hierarchy and share a common owner. Each part of the hierarchy produces a different product or service that combine to satisfy a common need. In New Zealand prior to reforms the local electricity power boards could generate, distribute, and sell electricity.
Watt (W) Measure of power equal to one joule per second. See Kilowatt and Megawatt.
Watt hour (Wh) A measure of energy equivalent to one watt of power used for one hour, or 3,600 joules. See Kilowatt hour, Megawatt hour, and Gigawatt hour.
G E T S M A R T, T H I N K S M A L L102
AcronymsCHP Combined heat and power
DBH Department of Building and Housing
DOC Department of Conservation
CRI Crown Research Institute
DG Distributed generation
DTI Department of Trade and Industry (United Kingdom)
e3p Genesis Energy’s planned Energy Effi ciency Enhancement Project at Huntly. It will generate 385MW.
EECA Energy Effi ciency and Conservation Authority
EEE Energy export equivalence
EHMS East Harbour Management Services
FRST Foundation for Research Science and Technology
HERS Home energy rating scheme
IRL Industrial Research Limited (a CRI)
LPG Liquid petroleum gas
MED Ministry of Economic Development
MRST Ministry of Research, Science and Technology
NEECS National Energy Effi ciency and Conservation Strategy
NZPVA New Zealand Photovoltaic Association, now called the Sustainable Electricity Association New Zealand (SEANZ).
PV Photovoltaics
ROC Renewable obligation certifi cate
SIA Solar Industries Association
SMEs Small to medium-sized enterprises
SWH Solar water heater

P C E 103
Endnotes1 Dobbyn and Thomas, 2005.2 ibid., 2005: 3.3 PCE, 2006b. 4 DTI, 2003: 16.5 Energy services are defi ned as the services (e.g. lighting, heating, cooling, and power to drive machinery)
that can be derived from various forms of energy. See www.pce.govt.nz/reports/allreports/1_877274_55_0.pdf [Accessed 6 November, 2006].
6 For a more in depth defi nition of microgeneration see www.dti.gov.uk/fi les/fi le27576.pdf [Accessed 2 November 2006].
7 Ministry for Economic Development (MED), 2006a. 8 MED, 2003.9 MED, 2006a.10 Waterways with signifi cant conservation values (and Water Conservation Orders) are identifi ed on the
Ministry for the Environment website. See www.mfe.govt.nz/issues/water/freshwater/water-conservation/ [Accessed 21 August 2006].
11 MED, 2006a.12 PCE, 2005.13 The PCE’s assessment role for the electricity sector is explained more fully on the PCE website. See www.
pce.govt.nz/reports/allreports/1177_0066.pdf [Accessed 6 November 2006].14 PCE, 2004: 9-11.15 See section 172N of the Electricity Act 1992 and the Government’s Policy Statement for electricity. See
www.med.govt.nz/templates/StandardSummary____395.aspx [Accessed 1 September 2006].16 The PCE has not investigated Transpower’s proposed upgrades to the national grid. For example,
Transpower plans to build a new 400 kV transmission line between the central North Island and Auckland. The Electricity Commission is investigating Transpower’s proposal (see www.electricitycommission.govt.nz/).
17 For more information about the Electricity, Energy and the Environment work of the PCE see www.pce.govt.nz/reports/allreports/1_877274_14_3.shtml and www.pce.govt.nz/reports/allreports/1177_0066_2006.shtml [Accessed 6 November 2006].
18 The Economist, 2004: 17.19 DTI, 2006a: 32.20 Energywatch, 2005.21 Donn & Thomas, 2001.22 Other variables, such as the surrounding landscape and vegetation, may also infl uence the thermal
performance of buildings. For example, a nearby hill or tree may provide shading to a building and infl uence its heating and cooling requirements.
23 Benefi ts and costs in this context include monetary and non-monetary benefi ts and costs, and also benefi ts and costs that affect the direct users of the energy, the broader community, and the environment. For further explanation of the PCE defi nition of energy effi ciency, see www.pce.govt.nz/reports/allreports/0_908804_90_3.pdf [Accessed 6 November 2006].
24 Dobbyn & Thomas, 2005.25 DTI, 2005.26 Greenpeace UK, 2005.27 ibid., 2005: 72.28 Lasseter et al., 2003. 29 For example, the Gridwise Alliance is a joint private and government initiative to develop smart grid
systems. See www.gridwise.org/index.htm [Accessed 29 August 2006]. 30 Penny, 2005.31 For further information on the Auckland outage see www.med.govt.nz/templates/ContentTopicSummary_
___20837.aspx [Accessed 28 August 2006].32 See subs.nzherald.co.nz/location/story.cfm?l_id=145&objectid=10386656 and subs.nzherald.co.nz/topic/
story.cfm?c_id=187&objectid=10388160 [Accessed 28 August 2006].33 Failure can be a result of accidents, climatic events, or a collapse of the transmission and distribution lines.34 U.S.–Canada Power System Outage Task Force, 2004.35 MED, 2006b.

G E T S M A R T, T H I N K S M A L L104
36 Lovins et al., 2002.37 WADE, 2004.38 See www.bmu.de/english/renewable_energy/press_statements_speeches/doc/36601.php [Accessed 26
July 2006] and www.globalchange.umd.edu/?energytrends&page=germany.6 [Accessed 26 July 2006].39 Lovins et al., 2002: 297. 40 Dobbyn & Thomas, 2005: 4.41 ibid., 2005.42 ibid., 2005: 10.43 Rifkin, 2002.44 Rankine, 2005.45 Howden-Chapman et al., 2005. See also www.wnmeds.ac.nz/academic/dph/research/housing/insulation.
html [Accessed 28 August 2006].46 A ballast is a device to stabilise current in a circuit, and is a component of a fl uorescent light.47 McChesney, 2006. See www.scoop.co.nz/stories/PO0607/S00164.htm [Accessed 20 July 2006].48 Oxford English Dictionary (OED) Online, 2006. See www.oed.com/ [Accessed 27 April 2006]. 49 DETR, 1999.50 See www.greypower.co.nz/bulletin.pdf [Accessed 26 July 2006].51 DTI, 2006a.52 EHMS, 2006. 53 See www.pce.govt.nz/reports/pce_reports.shtml54 Prices stated in real terms are adjusted to take out the effects of infl ation.55 DTI, 2006a.56 MED, 2006b. 57 PCE, 2005.58 Energy Saving Trust et al., 2005. 59 DTI, 2006a.60 The lines companies are: Alpine Energy Ltd, Aurora Energy Ltd, Buller Electricity, Centralines Ltd,
Counties Power Ltd, Delta Utility Services Ltd (manages Aurora), Eastland Network Ltd, Electra Ltd, Electricity Ashburton Ltd, Electricity Invercargill Ltd, ElectroNet Ltd (manages Westpower), Horizon Energy Distribution Ltd, MainPower NZ Ltd, Marlborough Lines Ltd, Nelson Electricity (Network Tasman & Marlborough Lines JV), Network Tasman Ltd, Network Waitaki Ltd, Networks South Ltd (manages Alpine Energy and Network Waitaki), Northpower Ltd, Orion New Zealand Ltd, OtagoNet Joint Venture Ltd, Powerco Ltd, PowerNet Ltd (manages Electricity Invercargill, The Power Co, and Otago Power), Scanpower Ltd, The Lines Company Ltd, The Power Company Ltd, Top Energy Ltd, Unison Networks Ltd (manages Centralines), UnitedNetworks Ltd (see Vector), Vector Ltd, Waipa Networks Ltd, WEL Ltd, Westpower Ltd.
61 MainPower have recently built a new offi ce block with solar passive design features, and solar photovoltaic panels. They were also involved in a joint project with the Department of Conservation (DOC) and the Energy Effi ciency and Conservation Authority, to install a micro hydro generator on a remote DOC hut in the South Island. See www.localgeneration.co.nz/home/ [Accessed 23 August 2006].
62 See www.med.govt.nz/templates/ContentTopicSummary____4145.aspx [Accessed 27 April 2006]. 63 See www.photovoltaics.org.nz/news.html [Accessed 27 April 2006].64 Apart from solar water heating reducing the effectiveness of ripple control, there was no apparent
concern about the impact of other forms of microgeneration on gentailers’ business.65 See www.caenz.com/caeindex.html [Accessed 26 April 2006].66 See www.clear-skies.org [Accessed 28 August 2006].67 OECD & IEA, 2004.68 DTI, 2005.69 Jäger-Waldau, 2005.70 AGO, 2006.71 See www.greenhouse.gov.au/renewable/pv/index.html [Accessed 28 August 2006].72 REACT, 2004.73 REN21, 2005.74 ibid., 2005.75 PCE, 2006a.

P C E 105
76 The effects of intermittency can be reduced to some extent by having a diversity of energy sources (e.g. wind and solar, or solar and hydro).
77 Murray, 2005. See also www.caenz.com/DistGen/DGdownloads/Totora_Valley.pdf [Accessed 14 March 2006].
78 Dobbyn and Thomas, 2005.79 See www.arcinnovations.co.nz/why-amm.html [Accessed 7 August 2006].80 DTI, 2005.81 See www.greenhouse.gov.au/solarcities/ [Accessed June 2006].82 Mazza, undated.83 Mazza, undated; Bush, 2004.84 DTI, 2006a: 37.85 See www.energyinst.org.uk/content/fi les/Smale%20scall%20renewables%20and%20microgeneration.
pdf [Accessed 2 May 2006]. 86 A zero net energy house is a building with a net energy consumption of zero over a typical year.87 Charron, 2005.88 DTI, 2006a. 89 See www.beehive.govt.nz/ViewDocument.aspx?DocumentID=25823 [Accessed 20 May 2006].90 DTI, 2006a: 36.91 See www.hm-treasury.gov.uk/budget/budget_06/bud_bud06_speech.cfm [Accessed 2 July 2006].92 Brandon, 2004.93 Section 172N(2) of the Electricity Act 1992.94 DTI, 2006a.95 ibid., 2006a: 3.96 See www.micropower.co.uk/news/newsrelease39.html [Accessed 10 April 2006].97 Commerce Commission, 2006.98 MED, 2006c.99 MED, 2003.100 See www.energy3.co.nz/generation.htm [Accessed 29 August 2006].101 MED, 2003: 8.102 For example, a large farm with a 30 kW to 300 kW micro hydro plant or wind turbines would fi t within
the category over 10 kW ‘connected behind load’.103 MED, 2006d.104 See www.electricitycommission.govt.nz/pdfs/opdev/retail/model/MRC-app-A2-marked.pdf [Accessed 6
November 2006].105 Section 3 Building Act.106 Section 400 Building Act.107 Section 4(2)(m) Building Act.108 See www.dbh.govt.nz/ba-further-changes [Accessed 31 August 2006].109 See www.beehive.govt.nz/ViewDocument.aspx?DocumentID=27293 [Accessed 5 October 2006].110 See www.oriongroup.co.nz/Default.htm?/Page%20path%20here%20(minus%20.asp [Accessed 31
August 2006]. 111 ODPM, 2004.112 See www.communities.gov.uk/index.asp [Accessed 31 August 2006].113 See www.foe.co.uk/resource/press_releases/sustainable_building_code_07032006.html [Accessed 24
October 2006].114 ESTIF, 2006.115 See www.estif.org/index.php?id=46&backPID=2&pS=1&tt_news=71 [Accessed 2 May 2006].116 See www.interbuild.com & www.themertonrule.org [Accessed 31 August 2006].117 Govt3 is a government programme aimed at improving government agency sustainability within their
activities. Energy effi ciency is a key part of this programme. See www.mfe.govt.nz/issues/sustainable-industry/govt3/ [Accessed 31 August 2006].
118 See www.caenz.com/info/programmes/programmes.html [Accessed 2 May 2006].119 See www.irl.cri.nz/newsandevents/innovate/Innovate-57/Energy-at-the-cross-roads.aspx [Accessed 29
April 2006].

G E T S M A R T, T H I N K S M A L L106
120 See www.landcareresearch.co.nz/about/tamaki/index.asp [Accessed 2 May 2006].121 See ite.massey.ac.nz/researchandconsultancy/EnergyResearchWebsite/contents.htm [Accessed
2 May 2006].122 See www.niwascience.co.nz/maori/energy [Accessed 2 May 2006].123 See www.scionresearch.com/bioenergy.aspx [Accessed 2 May 2006].124 See www.ontario-sea.org/pdf/PoweringOntarioCommunities.pdf#search=%22Suffi cient%20Contract%
20Length%2C%20Reliability%20and%20Stability%22 [Accessed 31 August 2006].125 See www.frst.govt.nz/database/abstracts/index.cfm [Accessed 31 August 2006].126 See www.frst.govt.nz/Business/fund_GPSRD.cfm [Accessed 31 August 2006].

P C E 107
ReferencesAustralian Greenhouse Offi ce (AGO). 2006. Photovoltaic Rebate Programme. AGO, Canberra:
Department of the Environment and Heritage. www.greenhouse.gov.au/renewable/
pv/index.html [Accessed 1 September 2006].
Brandon, R. 2004. T&I Distributed Energy Production Strategic Plan. Ottawa: Natural
Resources Canada. www.nrcan.gc.ca/es/etb/cetc/cetc01/TandI/pdf/TI-DEP-Strategy-
Plan_e.pdf [Accessed 2 July 2006].
Bush, R. 2004. BC Hydro begins hydrogen fuel cell fi eld trial with Ballard Power Systems’ Nexa
RM Series. www.tdworld.com/news/BC-Hydro-fuel-cell/ [Accessed 29 August 2006].
Charron, R. 2005. A Review of Low and Net-Zero Energy Solar Home Initiatives. Varennes,
Canada: CANMET Energy Technology Centre. www.cetc-varennes.nrcan.gc.ca/en/
er_re/pvb/p_p.html?2005-133 [Accessed 31 August 2006].
Cleland, D. 2005. Sustainable energy use and management. In: People and energy: how do
we use it? Proceedings of a conference organised by the Royal Society of New Zealand
in Christchurch, 18 November 2004. Miscellaneous Series 66. Wellington: The Royal
Society of New Zealand: 75-90. www.rsnz.org/topics/energy/peopleenergyconf/
energy.pdf [Accessed 8 November 2006].
Commerce Commission. 2006. Commission declines to grant Electricity Industry Reform Act
exemption to Eastland Networks. Release No. 111, issued 21 March 2006. Wellington:
Commerce Commission. www.comcom.govt.nz/MediaCentre/MediaReleases/
200506/commissiondeclinestograntelectrici.aspx [Accessed 8 November 2006].
Department of the Environment, Transport and the Regions (DETR). 1999. Fuel Poverty:
The New HEES – a programme for warmer, healthier homes. London: DETR.
www.defra.gov.uk/environment/consult/fp/index.htm [Accessed 1 September 2006].
Department of Trade and Industry (DTI). 2006a. Our Energy Challenge: Power from the
people. Microgeneration Strategy. DTI/Pub 8243/1k/03/06/NP. URN 06/993. London:
DTI. www.dti.gov.uk/fi les/fi le27575.pdf [Accessed 8 November 2006].
Department of Trade and Industry (DTI). 2006b. Small generator connection survey. URN 06/
879. London: DTI. www.dti.gov.uk/fi les/fi le29963.pdf [Accessed 8 November 2006].
Department of Trade and Industry (DTI). 2005. Microgeneration strategy and low carbon
buildings programme: Consultation. London: DTI. www.dti.gov.uk/fi les/fi le13989.pdf
[Accessed 8 November 2006].
Department of Trade and Industry (DTI). 2003. Energy White Paper: Our energy future
– creating a low carbon economy. Norwich: The Stationery Offi ce. www.dti.gov.uk/fi les/
fi le10719.pdf [Accessed 8 November 2006].
Dobbyn, J. and Thomas, G. 2005. Seeing the light: The impact of microgeneration on the
way we use energy. Qualitative research fi ndings. London: Sustainable Consumption
Roundtable. www.ncc.org.uk/responsibleconsumption/seeing_light.pdf [Accessed 3
November 2006].
Donn, M. and Thomas, G. 2001. Designing comfortable homes. Wellington: Cement &
Concrete Association of New Zealand.

G E T S M A R T, T H I N K S M A L L108
East Harbour Management Services (EHMS). 2006. Microgeneration potential in New
Zealand: A study of small-scale energy generation potential. Prepared for Parliamentary
Commissioner for the Environment. Wellington: Parliamentary Commissioner for the
Environment.
Energy Saving Trust, Element Energy Limited, E-Connect and Cambridge University Faculty
of Economics. 2005. Potential for microgeneration: Study and analysis. London:
Department of Trade and Industry. www.dti.gov.uk/fi les/fi le27558.pdf [Accessed 8
November 2006].
Energywatch (Gas and Electricity Consumer Council). 2005. Get Smart: Bringing meters into
the 21st Century. London: Energywatch. www.energywatch.org.uk/uploads/Smart_
meters.pdf [Accessed 3 July 2006].
European Solar Thermal Industry Federation (ESTIF). 2006. The Spanish Technical Building
Code (Royal Decree 314/2006 of 17 March 2006). English translation of the solar thermal
sections of the code. Belgium: ESTIF. www.estif.org/fi leadmin/downloads/CTE_solar_
thermal_sections_ENGLISH.pdf [Accessed 1 September 2006].
Gardiner, A.I. 2005. Improving Energy Supply Effi ciency – A Case for Distributed Generation.
Solar 2005: Renewable Energy for a Sustainable Future – A challenge for a post
carbon world, The 43rd Australia and New Zealand Solar Energy Society Annual
Conference, 28-30 November 2005, University of Otago, Dunedin. http://
www.civag.unimelb.edu.au/~lua/011.pdf [Accessed 9 November, 2006].
Gipe, P. 2006. Renewable Energy Policy Mechanisms. www.wind-works.org/FeedLaws/Renewa
bleEnergyPolicyMechanismsbyPaulGipe.pdf [Accessed 1 September 2006].
Greenpeace UK. 2005. Decentralising power: An energy revolution for the 21st century.
London: Greenpeace UK. www.greenpeace.org.uk/MultimediaFiles/Live/FullReport/
7154.pdf [Accessed 9 November 2006].
Hoffman, S.M. and High-Pippert, A. 2005. Community Energy: A Social Architecture for an
Alternative Energy Future. Bulletin of Science, Technology & Society 25(5): 387-401.
Howden-Chapman, P., Crane, J., Matheson, A., Viggers, H., Cunningham, M., Blakely, T.,
O’Dea, D., Cunningham, C., Woodward, A., Saville-Smith, K., Baker, M., Waipara,
N. 2005. Retrofi tting houses with insulation to reduce health inequalities: Aims and
methods of a clustered, randomised community-based trial. Social Science & Medicine
61(12): 2600-2610.
Jäger-Waldau, A. 2005. PV Status Report 2005: Research, Solar Cell Production and Market
Implementation of Photovoltaics. EUR 21836 EN. Luxembourg: Offi ce for Offi cial
Publications of the European Communities. http://streference.jrc.cec.eu.int/pdf/
PV%20Report%202005.pdf [Accessed 4 June 2006].
Lasseter, R., Akhil, A., Marnay, C., Stevens, J., Dagle, J., Guttromson, R., Sakis Meliopoulous,
A., Yinger, R. and Eto, J. 2003. Integration of Distributed Energy Resources: The CERTS
MicroGrid Concept. Sacramento, California: California Energy Commission. http:
//certs.lbl.gov/pdf/50829-app.pdf [Accessed 8 November 2006].
Lovins, A.B., Datta, E.K., Feiler, T., Rábago, K.R., Swisher, J.N., Lehmann, A. and Wicker, K.
2002. Small is Profi table: The Hidden Economic Benefi ts of Making Electricity Resources the
Right Size. Snowmass, Colorado: Rocky Mountain Institute.

P C E 109
Mazza, P. Undated. Northwest utilities looking at smart energy technologies to control bills and
improve service. Smart Energy Bulletin #4. http://www.climatesolutions.org/pubs/pdfs/
SmartEnergy4.pdf [Accessed 30 August 2006].
McChesney, I. 2006. Govt commitment to a Warm Home Standard call. Media Release,
Community Energy Action, 17 July 2006. www.scoop.co.nz/stories/PO0607/
S00164.htm [Accessed 20 July 2006].
Ministry of Economic Development (MED). 2006a. New Zealand Energy Data File January
2006. Wellington: MED. www.med.govt.nz/upload/28688/000-200601.pdf [Accessed
9 November 2006].
Ministry of Economic Development (MED). 2006b. New Zealand Energy in Brief March 2006.
Wellington: MED. www.med.govt.nz/upload/32800/2006.pdf [Accessed 9 November
2006].
Ministry of Economic Development (MED). 2006c. Investment in Electricity Generation
by Lines Companies. Wellington: MED. http://www.med.govt.nz/upload/34734/
discussion.pdf [Accessed 9 November 2006].
Ministry of Economic Development (MED). 2006d. Facilitating Distributed Generation.
Wellington: MED. www.med.govt.nz/upload/39385/distributed-generation-
discussion-paper-2006.pdf [Accessed 9 November 2006].
Ministry of Economic Development (MED). 2003. Facilitating Distributed Generation: A
discussion paper. Wellington: MED. www.med.govt.nz/upload/8641/discussion.pdf
[Accessed 9 November 2006].
Murray, P.E. 2005. Designing Sustainable Distributed Generation Systems for Rural
Communities: An Application of Optimisation Modelling and Decision Analysis to include
Sustainability Concepts and Uncertainty into Design Optimality. Thesis (PhD). Palmerston
North: Massey University.
Offi ce of the Deputy Prime Minister (ODPM). 2004. Planning Policy Statement 22: Renewable
Energy. Norwich: Her Majesty’s Stationery Offi ce. www.communities.gov.uk/pub/910/
PlanningPolicyStatement22RenewableEnergy_id1143910.pdf [Accessed 6 November
2006].
Organisation for Economic Co-operation and Development (OECD) and International
Energy Agency (IEA). 2004. Renewable Energy: Market and Policy Trends in IEA
Countries. Paris: OECD/IEA.
Parliamentary Commissioner for the Environment (PCE). 2006a. Electricity, energy, and
the environment: Environmental performance assessment 1 July 2004 – 30 June 2005.
Wellington: PCE.
Parliamentary Commissioner for the Environment (PCE). 2006b. Wind power, people, and
place. Wellington: PCE.
Parliamentary Commissioner for the Environment (PCE). 2006c. Healthy, wealthy and wise.
A health impact assessment of Future currents: Electricity scenarios for New Zealand
2005-2050. Wellington: PCE.
Parliamentary Commissioner for the Environment (PCE). 2005. Future currents: Electricity
scenarios for New Zealand 2005–2050. Wellington: PCE.

G E T S M A R T, T H I N K S M A L L110
Parliamentary Commissioner for the Environment (PCE). 2004. Electricity, energy and the
environment: Assessment framework. Wellington: PCE.
Parliamentary Commissioner for the Environment (PCE). 2000. Getting more from less: A
review of progress on energy effi ciency and renewable energy initiatives in New Zealand.
Wellington: PCE.
Penny, G. 2005. Energy in rural Maori communities. Water & Atmosphere 13(4).
www.niwascience.co.nz/pubs/wa/13-4/maori [Accessed 29 August 2006].
Rankine, J. 2005. Housing and health in Auckland: A summary of selected research. Auckland:
Auckland Regional Public Health Service. www.arphs.govt.nz/publications/
HealthyHousing/HsgHlthinAuckland.pdf [Accessed 9 November 2006].
Renewable Energy Action (REACT). 2004. The 100.000 Roofs Programme: Case study #8. The
Hague: SenterNovem. www.senternovem.nl/mmfi les/The%20100.000%20Roofs%20
Programme_tcm24-117023.pdf [Accessed 2 April 2006].
Renewable Energy Policy Network (REN21). 2005. Renewables 2005 Global Status Report.
Washington, DC: Worldwatch Institute.
Rifkin, J. 2002. The hydrogen economy: The creation of the world-wide energy web and the
redistribution of power on earth. New York: J.P. Tarcher/Putnam.
Skocpol, T. 2003. Diminished democracy: From membership to management in American civic
life. Norman, Oklahoma: University of Oklahoma Press.
The Economist. 2004. Building the energy internet. The Economist Technology Quarterly
March 13th 2004: 13-17.The Economist 370(8366).
U.S.-Canada Power System Outage Task Force. 2004. Final Report on the August 14, 2003
Blackout in the United States and Canada: Causes and Recommendations. Washington
D.C. and Ottawa: United States Government and Government of Canada. https:
//reports.energy.gov/BlackoutFinal-Web.pdf [Accessed June 2006].
World Alliance for Decentralized Energy (WADE). 2004. World survey of decentralized energy
2004. Edinburgh: WADE. http://www.localpower.org/documents_pub/report_
worldsurvey04.pdf [Accessed 3 November 2006].

P C E 111
Further readingBroehl, J. 2006. Ontario Renewable Energy Policy Breakthrough Hailed. 21st March, 2006.
Peterborough, New Hampshire: Renewable Energy Access. www.renewableenergyacc
ess.com/rea/news/story?id=44408. [Accessed 27 March 2006].
Distributed Generation – Future Energy Resources Consortium (DG-FER). 2004.
Roadmapping of the paths for the introduction of distributed generation in Europe.
www.dgfer.org/Downloads/DGFER_Road_Map.pdf [Accessed 8 November 2006].
Dunn, S. 2000. Micropower: The Next Electrical Era. Worldwatch Paper 151. Washington,
D.C.: Worldwatch Institute.
European Union. 2001. Directive 2001/77/EC of the European Parliament and of the
Council of 27 September 2001 on the promotion of electricity produced from
renewable energy sources in the internal electricity market. Offi cial Journal of the
European Communities 44(L 283): 33-40. www.europa.eu.int/eur-lex/pri/en/oj/dat/
2001/l_283/l_28320011027en00330040.pdf [Accessed 1 September 2006].
Gipe, P., Doncaster, D. and MacLeod, D. 2005. Powering Ontario communities: Proposed
policy for projects up to 10MW. Toronto, Ontario: Ontario Sustainable Energy
Association. www.ontario-sea.org/pdf/PoweringOntarioCommunities.pdf [Accessed 1
September 2006].
Loftness, V. 2005. e-BIDS: Linking Energy to Productivity and Health. Energy 2005 Conference,
August 14-17 2005, Long Beach Convention Centre, Long Beach, California. www.en
ergy2005.ee.doe.gov/pdfs/sus_4c.pdf [Accessed 9 November 2006].
Ministry of Research Science and Technology (MRST). 2006. Science for New Zealand: An
overview of the RS&T system 2006. Wellington: MRST. www.morst.govt.nz/Documents/
publications/policy/MoRST-Science-for-NZ.pdf [Accessed 9 November 2006].
Sauter, R., Watson, J. and Hughes, L. 2005. Metering, Communication and Control
Technologies for Micro-generation. Working Paper Series Number 2005/1. UK Economic
and Social Research Council Sustainable Technologies Programme. www.sustainablete
chnologies.ac.uk/PDF/Working%20papers/109_1.pdf [Accessed 9 November 2006].

G E T S M A R T, T H I N K S M A L L112
Appendix A: Summary of tables from EHMS studyTable A1 Energy from microgeneration in the residential sector (GWh/year)
Technology Short term (0-5 years)
GWh
Medium term (0-10 years)
GWh
Long term (0-30 years)
GWh
Electricity
Solar PV 0.1 5.1 42
Combined heat and power 0.3 0.8 23
Micro hydro 0.2 0.7 14
Wind turbine (adjacent to house) 3 10 64
Wind turbine (on rooftop) 0.2 7 29
Total – electricity generation 3.6 23.2 172
Heat
Pellet burner 27 143 401
Wood burner 61 179 366
Heat pump 182 440 1,304
Heat pump water heaters 3 112 603
Solar water heaters 115 927 1,893
Total – heat generation 387 1,800 4,568
Building performance
Ceiling insulation 120 177 243
Water heating effi ciency 11 33 152
Passive solar design (retrofi t) 54 107 321
Passive solar design (new) 116 231 693
Double glazing (retrofi t) 11 21 64
Double glazing (new) 71 282 679
Total – building performance 382 852 2,152
TOTAL 772 2,675 6,891
N.B. Some columns do not add up due to roundingSource: EHMS, 2006
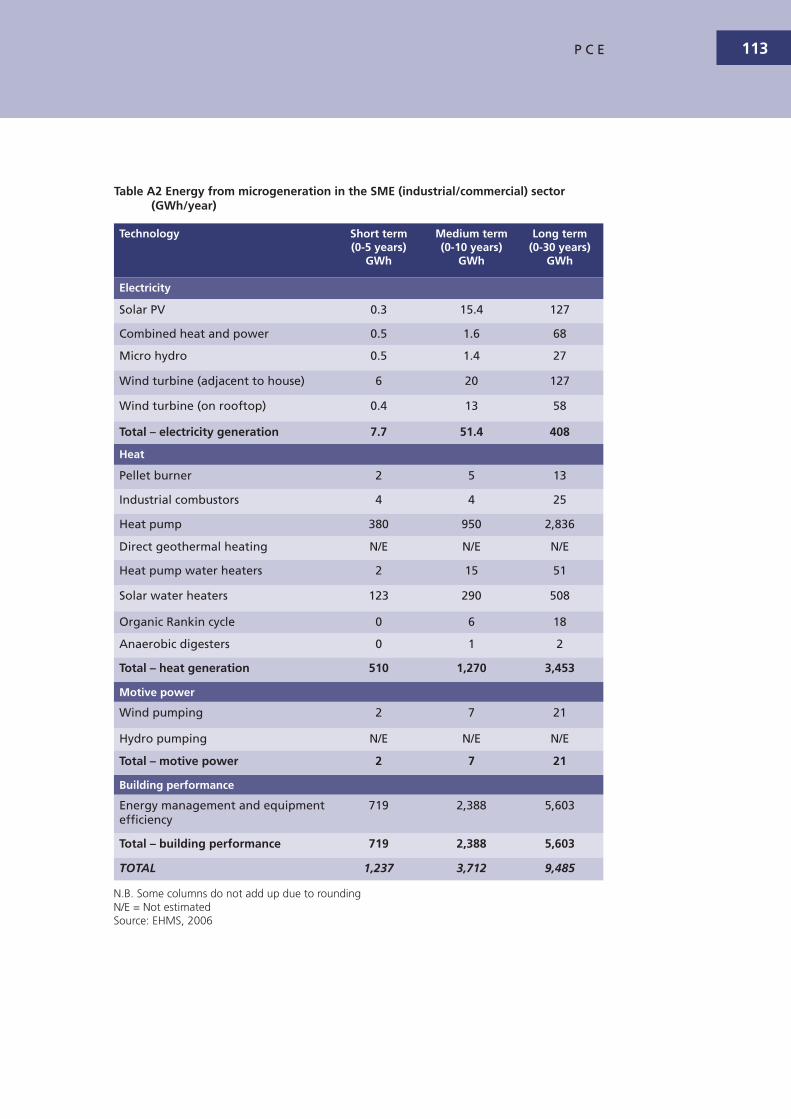
P C E 113
Table A2 Energy from microgeneration in the SME (industrial/commercial) sector (GWh/year)
Technology Short term (0-5 years)
GWh
Medium term(0-10 years)
GWh
Long term (0-30 years)
GWh
Electricity
Solar PV 0.3 15.4 127
Combined heat and power 0.5 1.6 68
Micro hydro 0.5 1.4 27
Wind turbine (adjacent to house) 6 20 127
Wind turbine (on rooftop) 0.4 13 58
Total – electricity generation 7.7 51.4 408
Heat
Pellet burner 2 5 13
Industrial combustors 4 4 25
Heat pump 380 950 2,836
Direct geothermal heating N/E N/E N/E
Heat pump water heaters 2 15 51
Solar water heaters 123 290 508
Organic Rankin cycle 0 6 18
Anaerobic digesters 0 1 2
Total – heat generation 510 1,270 3,453
Motive power
Wind pumping 2 7 21
Hydro pumping N/E N/E N/E
Total – motive power 2 7 21
Building performance
Energy management and equipment effi ciency
719 2,388 5,603
Total – building performance 719 2,388 5,603
TOTAL 1,237 3,712 9,485
N.B. Some columns do not add up due to roundingN/E = Not estimatedSource: EHMS, 2006

G E T S M A R T, T H I N K S M A L L114
Appendix B: Some key researchers and their projects
Some of the key researchers and their projects on local energy in New Zealand are
listed below. This list is by no means comprehensive, but indicates the depth and
breadth of local energy research in New Zealand.
• The Centre for Advanced Engineering has a broad ‘energy’ research portfolio, and
a specifi c research focus on Distributed Generation (DG).118
• Industrial Research Limited (IRL) is involved in research on energy system projects
for remote communities in the Totara Valley near Woodville, and Te Puia Springs,
Gisborne.119 IRL is also involved in the development of microgeneration systems,
including stationary fuel cells.
• Landcare has a portfolio of urban design research, and their new Auckland offi ce
development uses local energy technology and energy focused design.120
• Massey University’s Centre for Energy Research is involved in a number of projects
of relevance to local energy (including involvement in the Totara Valley project
with IRL).121
• National Institute of Water and Atmospheric Research (NIWA) has local energy
projects in two Maori communities in Waihi, near Lake Taupo and Waipoua,
Northland (described in the box in Section 2.4).122
• Scion is researching the use of biomass to produce bioenergy, and has put
together an energy proposal to make the energy supply of the City of Rotorua
totally renewable.123

P C E 115
Appendix C: Net metering, net billing, and standard offer contracts
Net metering and net billing
Net metering is a way of refunding people with microgeneration capacity for at
least a portion of the electricity they export into the wider network. The electricity
meter spins backwards when power is being exported rather than used, and the
microgenerator will either pay or receive a refund, depending on the net fl ow of
electricity, calculated using the retail tariff.
Net billing requires two meters: one each for the incoming and outgoing electricity.
There will also be two tariffs: one for electricity bought and the other for electricity
sold (usually at lower than the retail price). Net billing is more attractive to the
electricity retailer than net metering, as it can resell the electricity with some margin of
profi t, but net billing is more complex to administer.
Standard offer contracts
This is the most common method that regulators have used to promote the
microgeneration of electricity from renewable energy sources. These contracts are
also known as renewable energy tariffs, renewable energy feed-in tariffs (REFITs), feed
laws, and minimum price standards. They are intended to stimulate the adoption of
renewable energy – often in the form of local energy generation – by offering owners
a fi xed price for any electricity they export back to the grid. The designated price is
intended to better refl ect the full benefi ts provided by renewable energy sources.
The box describes the principles of standard offer contracts.124
Principles of standard offer contracts
Suffi cient contract length, reliability, and stability: Contracts need to be long enough to provide certainty for investors, so that they earn a reasonable rate of return and expectation of profi t.
Stable prices: In order to minimise risk, the price offered must be stable, predictable and high enough to attract investment. Potential investors, such as householders, community groups, and small businesses, will be less likely to afford the risk of variable and uncertain pricing.
Suffi cient pricing levels: The price offered can vary regionally, according to the strength of local resources. A tailored system provides an opportunity to attract investors in areas of low resource availability as well. Variable rates can also be applied to different technologies.
Simple, streamlined contracts: The process of applying for and awarding contracts needs to be straightforward and hassle free.

G E T S M A R T, T H I N K S M A L L116
Appendix D: Germany’s combined incentive scheme
Germany’s 100,000 Roofs Programme was integrated within the Renewable Energy
Law in April 2000. The law provided for surplus power from renewables to be sold
to the grid at a price that refl ects the cost of installation. This policy is a feed-in tariff
and owners of PV units could sell their surplus electricity for the attractive rate of
50.4 Euro cents/kWh. From 2005 the rate became 59.53 Euro cents/kWh for solar
electricity from small façade systems.
The Renewable Energy Law applies to all forms of renewable energy – not just on a
local energy scale. Table D1 shows that the level of adoption has been astonishing.
Table D1 German renewable energy installations and production in 2005
Installations Energy from renewables Economic effects
200,000 PV installations
2,000 biomass plants
550MW of farm biogas
6,000 hydro plants
18,000 wind turbines
About 10% of total supply (55 TWh/yr)
45,000 direct and indirect jobs in wind energy
30,000 jobs in the PV industry
Source: Gipe, 2006
Altogether 226,000 new renewable installations are operating in Germany and
150,000 new jobs have been created.

P C E 117
Appendix E: Funding for local energy research in New Zealand
In New Zealand, funding for research comes from public and private sources.
The Ministry of Research, Science and Technology (MRST) and the Foundation for
Research, Science and Technology (FRST) are the key government agencies involved in
research policy and funding, respectively.
The Government’s main funding of energy research is through FRST’s ‘Optimising
Physical Resource Use and Infrastructure Services (ORI)’ portfolio. In 2005/06 the
total for this portfolio was around $19.6 million.125 Of this, about $13.5 million
was directed to energy-related research. Analysis of research proposals on the FRST
website indicates that about $8 million worth of funding is directed at research that
could be interpreted as promoting local energy in New Zealand.
FRST also manages the TechNZ for Business programme, which includes the Grants for
Private Sector R&D (GPSRD) fund. This fund assists private sector companies where:
• a new production process needs development funding
• an existing product or process needs new features to be adapted for a
new market
• an existing product or process needs to be upgraded to provide new functions or
to meet new customer demands.
The eligibility criteria state:
Your business must be making a new investment in R&D that extends your capability to undertake R&D beyond current capacity. A new investment means an investment in an area of technological development or technological expertise that is new to the fi rm, that is relatively new to New Zealand, and that makes sense to be invested in locally from a global perspective.
The primary qualifying tests for R&D are identifying the technological or technical risk or uncertainty and planning the methodical resolution of the uncertainty. The fund is not available to support R&D that, in the context of the applicant fi rm, can be seen as ‘business as usual’.126

G E T S M A R T, T H I N K S M A L L118
Funding, however, is limited to up to 33.3 percent of the eligible project costs, to
a maximum of $100,000, and the minimum grant value is $10,000 including GST.
Businesses seeking the grant must have a good track record. Given the current state
of the local energy business sector, few businesses would have the capital to make up
the 67.7 percent of the project costs, or the track record required.
Funding is also available from New Zealand Trade and Enterprise but this organisation
is focused on assisting the development of existing small companies, not specifi c
technologies.

P C E 119

G E T S M A R T, T H I N K S M A L L120

About the Parliamentary Commissioner for the Environment
Te Kaitiaki Taiao a Te Whare Päremata
Independent scrutiny, advocacy and advice for a better environment
The Parliamentary Commissioner for the Environment (PCE) is an independent officer
of Parliament with wide-ranging powers to investigate environmental concerns. The
office was set up under the Environment Act 1986, and the Commissioner is appointed
for a five-year term. In 2002, Commissioner Dr Morgan Williams was appointed to a
second five-year term. The primary objective of the office is to contribute to maintaining
and improving the quality of the environment in New Zealand.
The PCE has five key roles:
• Environmental systems guardian – checking on the ability of management regimesto ensure that the quality of the environment is maintained or improved
• Environmental watchdog – responding to the general public’s enquiries andconcerns, and encouraging preventative measures and remedial actions to protectthe environment.
• Information provider, facilitator and catalyst - providing information about theenvironment to a wide range of groups and individuals
• Environmental management auditor – evaluating the performance of publicagencies to ensure they are meeting their environmental responsibilities
• Advisor to Parliamentary Select Committees – responding to requests from SelectCommittees to provide assistance and advice.

Get smart,think smallLocal energy systemsfor New ZealandREDESIGN
I've been designed to be easy to
read in electronic form as well. See
www.pce.govt.nz.
REDUCE
We always aim to reduce our own
resource use. I’m made of 100%
recycled paper.
REUSE
Don’t need to keep a copy? Feel free
to share me around or return me to
the PCE and they’ll pass me on to
someone else.
RECYCLE
I’m also 100% recyclable.
Parliamentary Commissioner for the EnvironmentTe Kaitiaki Taiao a Te Whare PäremataPO Box 10-241, WellingtonAotearoa New Zealandwww.pce.govt.nz