gerald c. ubben, major professor - digitalcommons.liberty.edu
TRANSCRIPT

To the Graduate Council:
I am submitting herewith a dissertation written by Leldon Wade Nichols entitled "Job Satisfaction of College and University Presidents and Academic Deans." I recommend that it be accepted in partial fulfillment of the requirements for the degree of Doctor of Education, with a major in Educational Administration and Supervision.
Gerald C. Ubben, Major Professor
We have read this dissertation and recommend its acceptance:
" t
/7 {~)t:. t~~--:t- ---:/~--L- <~" -1:-
Accepted for the Council:
Vice Chancellor Graduate Studies and Research

,
JOB SATISFACTION OF COLLEGE AND UNIVERSITY
PRESIDENTS AND ACADEMIC DEANS
A Dissertation
Presented for the
Doctor of Education
Degree
The University of Tennessee, Knoxville
Leldon Wade Nichols
August 1977

,
I
Copyright by Leldon Wade Nichols 1977 All Rights Reserved

ACKNOWLEDGEMENTS
I want to acknowledge and thank Professors Earl M. Ramer,
Charles M. Achilles, and Robert C. Maddox for their super
vision and guidance of this research project. I especially
want to thank Professor Gerald C. Ubben, Chairman of my com
mittee, for his careful evaluations and critiques at sequen
tial stages during the course of the study.
I want to express appreciation to Dr. Lee Roberson and
Dr. Jacob Gartenhaus for their friendly support and sugges
tions.
Gratitude must also be expressed to Marilyn Schneller
who carefully typed all drafts of the document and to Dan
Quarles, Curtis Rowell, and Phil Young for invaluable assis
tance with the computer programming and st'atistical design.
Most of all, I thank God for my wife and two children
whose love and patience were a constant source of encourage
ment through the years of study and preparation.
iii

J
ABSTRACT
The purpose of this study was to survey college and
university presidents and academic deans (a) to see if sig
nificant differences exist between administrators in the two
positions in perceived need satisfaction; (b) to analyze the
perceived need satisfaction of the total sample (presidents
and deans combined) as demographic group responses to 13
administrative characteristics. Job satisfaction was defined
as the condition which exists when psychological and social
needs are satisfied; generally a positive attitude toward
one's professional position.
Null hypotheses were stated for the following indepen
dent variables: (1) position, (2) length of tenure, (3) age,
(4) educational preparation, (5) religious preference, (6)
race, (7) institutional type, (8) full-time enrollment, and
(9) control of the institution.
The population of this study consisted of the chief
executive officers and the chief academic officers of the
671 institutions of higher education as identified in the
Proceedings (1976) of the Southern Association of Colleges
and Schools. One hundred and fifty (150) of the accredited
institutions from the population were randomly identified by
stratification of the institutions according to degree level.
The chief executive officers and the chief academic officers
from the 150 randomly selected institutions became the
iv

L
research sample. This sample size of 300 administrators
(150 presidents and 150 deans) represented 23 percent of the
total population of 1,342 administrators.
The quantitative data for this study were collected by
a revision of Lyman W. Porter's l3-item need satisfaction
questionnaire, which he developed for studying perceived
need satisfaction of managers.
One-way analyses of variance statistical techniques
were used to analyze the nine null hypotheses which were
stated in reference to the 13 individual job characteristic
statements on the questionnaire. Seven of the nine null
hypotheses were statistically rejected by the one-way
analyses of variance at the .05 confidence level.
v
Based on the findings of the research, the following
conclusive statements were inferred to the population of the
study:
1. Academic deans tend to perceive the job character
istics which are related to the higher level needs (autonomy
and self-actualization) as more deficient than do the presi
dents.
2. Administrators with 42 months or less tenure tend
to have higher need deficiencies in the higher order need
areas of autonomy and self-actualization, than administra
tors with more than 42 months tenure.
3. Age was not found to be a factor in differentiating

l
vi
perceived need deficiencies of college and university admin
istrators.
4. College and university administrators with earned
doctor's degrees tend to perceive more need deficiency than
do their colleagues with master's degrees.
5. Non-Protestants have a higher need deficiency than
Protestants with respect to the opportunity perceived for
personal growth and development in their administrative
positions.
6. Administrators of the minority races tend to have
higher perceived deficiencies of needs related to prestige
than do the Caucasian administrators.
7. Administrators in four-year institutions or above
tend to have a higher average of need deficiency in their job
characteristics than do administrators from two-year insti
tutions.
8. Administrators employed in institutions with less
than 3,000 students do not perceive their job character
istics differently than administrators in institutions with
full-time enrollments over 3,000.
9. Administrators from private colleges and univer
sities perceive less opportunities in their positions to
develop close friendships than do administrators in public
institutions.

TABLE OF CONTENTS
CHAPTER PAGE
1. INTRODUCTION. 1
II. REVIEW OF THE LITERATURE .. 11
III. METHODOLOGY OF THE STUDY. 34
IV. DATA ANALYSES . 47
V. SUNMARY 137
BIBLIOGRAPHY. 149
APPENDIXES. . · . . . . . . . . . . . 154
APPENDIX A. FIRST LETTER MAILED WITH QUESTIONNAIRE. 155
APPENDIX B. THE QUESTIONNAIRE. · · · · · · . 157
APPENDIX C. REQUEST CARDS. . · · · · · · · · · · 160
APPENDIX D. FOLLOW-UP LETTER · · · · · · · · 162
APPENDIX E. PORTER'S LETTER. · · · · · · · . . · · · 164
APPENDIX F. TYPICAL COMPUTER CARDS . 166
APPENDIX G. EXPLANATION OF FORMULA FOR ONE-WAY ANOVA. . . . . . . . . . • . . . 168
APPENDIX H. TYPICAL CROSSTABULATION. 170
VITA. . . . . 172
vii

TABLE
1.
2.
3.
4.
5.
6.
LIST OF TABLES
categories and Items from Porter's Original Study . . . . . . . . .. .....
Summary of Studies Which Used Porter's Questionnaire . . . . . . . . . . . . .
Stratification Totals by Institution Type .
Summary of Returned Questionnaires by Stratification Levels . . . . . .
Need Categories and Specific Need Items as Listed in the Questionnaire . . . . . .
Groups and Sample Sizes of the Independent Variables . . . .. ......... .
7. One-Way Analysis of Variance of Mean Scores for
PAGE
14
33
36
39
42
48
Item I-a by Position Groups (Security in Job) 50
8. One-Way Analysis of Variance of Mean Scores for Item II-a by Position Groups (Opportunity to Help People). . . . . . . . . . . . . . . . . .. 51
9. One-Way Analysis of Variance of Mean Scores for Item II-b by Position Groups (Opportunity for Friendships . . . . . . . . . . . . . . . . . .. 51
10. One-Way Analysis of Variance of Mean Scores for Item III-a by Position Groups (Feeling of Self-Esteem) . . . . . . . . . . . . . . . . . . . .. 52
11. One-Way Analysis of Variance of Mean Scores for Item III-b by Position Groups (Prestige Inside the Institution). . . . . . . . . . . . . . . .. 52
12. One-Way Analysis of Variance of Mean Scores for Item III-c by Position Groups (Prestige Outside the Institution). . . . . . . . . . . . . . . .. 53
13. One-Way Analysis of Variance of Mean Scores for Item IV-a by Position Groups (Authority in Position) . . . . . . . . . . . . . . . . . . .. 53
viii

ix
TABLE PAGE
14. One-Way Analysis of Variance of Mean Scores for Item IV-b by Position Groups (Opportunity for Independent Thought and Action) . . . . . . . .. 54
15. One-Way Analysis of Variance of Mean Scores for Item IV-c by Position Groups (Opportunity to Participate in Setting Goals) . . . . . . . . .. 54
16. One-Way Analysis of Variance of Mean Scores for Item IV-d by Position Groups (Opportunity to Determine Methods . . . . . . . . . . . . . . .. 55
17. One-Way Analysis of Variance of Mean Scores for Item V-a by Position Groups (Opportunity for Growth and Development) . . . . . . . . . . . .. 55
18. One-Way Analysis of Variance of Mean Scores for Item V-b by Position Groups (Feeling of SelfFulfillment). . . . . . . . . . . . . . . . . .. 56
19. One-Way Analysis of Variance of Mean Scores for Item V-c by Position Groups (Feeling of Accomplishment) . . . . . . .. ....... 56
20. Summary of Statistical Findings for Variable One Position of Administrators. .. ....... 57
21. One-Way Analysis of Variance of Mean Scores for Item I-a by Tenure Groups (Security in Job) . .. 60
22. One-Way Analysis of Variance of Mean Scores for Item II-a by Tenure Groups (Opportunity to Help People) . . . . . . . . . . . . . . . . . . . .. 61
23. One-Way Analysis of Variance of Mean Scores for Item II-b by Tenure Groups (Opportunity for Friendships). . . . . . . . . . . . . . . . . .. 61
24. One-Way Analysis of Variance of Mean Scores for Item III-a by Tenure Groups (Feeling of Self-Esteem) . . . . . . . . . . . . . . . . . . . .. 62
25. One-Way Analysis of Variance of Mean Scores for Item III-b by Tenure Groups (Prestige Inside the Institution). . . . . . . . . . . . . . . . . .. 62
26. One-Way Analysis of Variance of Hean Scores for Item III-c by Tenure Groups (Prestige Outside the Institution). . . . . . . . . . . . . . . .. 63

r
TABLE
27. One-Way Analysis of Variance of Mean Scores for Item IV-a by Tenure Groups (Authority in
x
PAGE
Position) . . . . . . . . . . . . . . . . . . .. 63
28. One-Way Analysis of Variance of Mean Scores for Item IV-b by Tenure Groups (Opportunity for Independent Thought and Action) . . . . . . . .. 64
29. One-Way Analysis of Variance of Mean Scores for Item IV-c by Tenure Groups (Opportunity to Participate in Setting Goals) . . . . . . . . .. 64
30. One-Way Analysis of Variance of Mean Scores for Item IV-d by Tenure Groups (Opportunity to Determine Methods). . . . . . . . . . . . . . .. 65
31. One-Way Analysis of Variance of Mean Scores for Item V-a by Tenure Groups (Opportunity for Growth and Development). . . . . . . . . . . . . . . .. 65
32. One-Way Analysis of Variance of Mean Scores for Item V-b by Tenure Groups (Feeling of SelfFulfillment). . . . . . . . . . . . . . . . . .. 66
33. One-Way Analysis of Variance of Mean Scores for Item V-c by Tenure Groups (Feeling of Accomplishment) . . . . . . .. ....... 66
34. Summary of Statistical -Findings for Variable Two Length of Tenure of Administrators. . . . . . .. 67
35. One-Way Analysis of'Variance of Mean Scores for Item I-a by Age Groups (Security in Job). . . .. 69
36. One-Way Analysis of Variance of Mean Scores for Item II-a by Age Groups (Opportunity to Help People) . . . . . . . . . . . . . . . . . . . .. 70
37. One-Way Analysis of Variance of Mean Scores for Item II-b by Age Groups (Opportunity for Fr iendships). . . . . . . . . . . . . . . . . .. 70
38. One-Way Analysis of Variance of Mean Scores for Item III-a by Age Groups (Feeling of Self-Esteem) . . . . . . . . . . . . . . . . . . . .. 71
39. One-Way Analysis of Variance of £Olean Scores for Item III-b by Age Groups (Prestige Inside the Institution). . . . . . . . . . . . . . . . . .. 71
TABLE
40.
41.
42.
43.
44.
45.
46.
47.
48.
One-Way Analysis of Variance of Mean Scores for Item III-c by Age Groups (Prestige Outside the Institution). . . . . . . . . . . . . . . . . . .
One-Way Analysis of Variance of Mean Scores for Item IV-a by Age Groups (Authority in Position)
One-Way Analysis of Variance of Mean Scores for Item IV-b by Age Groups (Opportunity for Independent Thought and Action) . . . . . . . . .
One-Way Analysis of Variance of Mean Scores for Item IV-c by Age Groups (Opportunity to Participate in Setting Goals) . . . . . . . . . .
One-Way Analysis of Variance of Mean Scores for Item IV-d by Age Groups (Opportunity to Determine Methods). . . . . . . . . . . . . . . .
One-Way Analysis of Variance of Mean Scores for Item V-a by Age Groups (Opportunity for Growth and Development). . . . . . . . . . . . . . . . .
One-Way Analysis of Variance of Mean Scores for Item V-b by Age Groups (Feeling of SelfFulfillment). . . . . . . . . . . . . . . . . . .
One-Way Analysis of Variance of Mean Scores for Item V-c by Age Groups (Feeling of Accomplishment) . . . . . . . .
Summary of Statistical Findings for Variable Three Age of Administrators .. ....
xi
PAGE
72
72
73
73
74
74
75
75
76
49. One-Way Analysis of Variance of Mean Scores for Item I-a by Educational Preparation Groups (Security in Job) . . . . . . . . . . . . . . .. 79
50. One-Way Analysis of Variance of Mean Scores for Item II-a by Educational Preparation Groups (Opportunity to Help People). . . . . . . . . .. 80
51. One-Way Analysis of Variance of Mean Scores for Item II-b by Educational Preparation Groups (Opportunity for Friendships) . . . . . . . . .. 80
52. One-Way Analysis of Variance of Mean Scores for Item III-a by Educational Preparation Groups (Feeling of Self-Esteem). . . . . , . . . . . .. 81
L
TABLE
53. One-Way Analysis of Variance of Mean Scores for Item III-b by Educational Preparation Groups
xii
PAGE
(Prestige Inside the Institution) . . . . . . .. 81
54. One-Way Analysis of Variance of Mean Scores for Item III-c by Educational Preparation Groups (Prestige Outside the Institution). . . . . . .. 82
55. One-Way Analysis of Variance of Mean Scores for Item IV-a by Educational Preparation Groups (Authority in Position) . . . . . . . . . . . .. 82
56. One-Way Analysis of Variance of Mean Scores for Item IV-b by Educational Preparation Groups (Opportunity for Independent Thought and Action) . 83
57. One-Way Analysis of Variance of Mean Scores for Item IV-c by Educational Preparation Groups (Opportunity to Participate in Setting Goals) 83
58. One-Way Analysis of Variance of Mean Scores for Item IV-d by Educational Preparation Groups (Opportunity to Determine Methods) . · · · · · · · 84
59. One-Way Analysis of Variance of Mean Scores for Item V-a by Educational Preparation Groups (Opportunity for Growth and Development) . · · · · 84
60. One-Way Analysis of Variance of Mean Scores for Item V-b by Educational Preparation Groups (Feeling of Self-Fulfillment) . . . · · · · · · · 85
61. One-Way Analysis of Variance of Mean Scores for Item V-c by Educational Preparation Groups (Feeling of Accomplishment) · · · · · · · 85
62. Summary of Statistical Findings for Variable Four Educational Preparation of Administrators . . .. 86
63. One-Way Analysis of Variance of Mean Scores for Item I-a by Religious Preference Groups (Security in Job) . . . . . . . . . . . . . . .. 89
64. One-Way Analysis of Variance of Mean Scores for Item II-a by Religious Preference Groups (Opportunity to Help People). . . . . . . . . .. 90
65. One-Way Analysis of Variance of Mean Scores for Item II-b by Religious Preference Groups (Opportunity for Friendships) . . . . . . . . .. 90

r
L
TABLE
66. One-Way Analysis of Variance of Mean Scores for Item III-a by Religious Preference Groups
xiii
PAGE
(Feeling of Self-Esteem). . . . . . . . . . . .. 91
67. One-Way Analysis of Variance of Mean Scores for Item III-b by Religious Preference Groups (Prestige Inside the Institution) . . . . . . .. 91
68. One-Way Analysis of Variance of Mean Scores for Item III-c by Religious Preference Groups (Prestige Outside the Institution). . . . . . .. 92
69. One-Way Analysis of Variance of Mean Scores for Item IV-a by Religious Preference Groups (Authority in Position) . . . . . . . . . . . .. 92
70. One-Way Analysis of Variance of Mean Scores for Item IV-b by Religious Preference Groups (Opportunity for Independent Thought and Action) . 93
71. One-Way Analysis of Variance of Mean Scores for Item IV-c by Religious Preference Groups (Opportunity to Participate in Setting Goals) 93
72. One-Way Analysis of Variance of Mean Scores for Item IV-d by Religious Preference Groups (Opportunity to Determine Methods). . . . . . .. 94
73. One-Way Analysis of Variance of Mean Scores for Item V-a by Religious Preference Groups (Opportunity for Growth and Development). . . .. 94
74. One-Way Analysis of Variance of Mean Scores for Item V-b by Religious Preference Groups (Feeling of Self-Fulfillment). . . . . . . . . . . . . .. 95
75. One-Way Analysis of Variance of Mean Scores for Item V-c by Religious Preference Groups (Feeling of Accomplishment). . . . . .. ..... 95
76. Summary of Statistical Findings for Variable Five Religious Preference of Administrators . 96
77. One-Way Analysis of Variance of Mean Scores for Item I-a by Race Groups (Security in Job) . . .. 99
78. One-Way Analysis of Variance of Mean Scores for Item II-a by Race Groups (Opportunity to Help People) 100

r
L
xiv
TABLE PAGE
79. One-Way Analysis of Variance of Mean Scores for Item II-b by Race Groups (Opportunity for Friendships). . . . . . . . . . . . . . . . . .. 100
80. One-Way Analysis of Variance of Mean Scores for Item III-a by Race Groups (Feeling of Self-Esteem) . . . . . . . . . . . . . . . . . . . . . 101
81. One-Way Analysis of Variance of Mean Scores for Item III-b by Race Groups (Prestige Inside the Institution) ................... 101
82. One-Way Analysis of Variance of Mean Scores for Item III-c by Race Groups (Prestige Outside the Institution). . . . . . . . . . . . . . . . . .. 102
83. One-Way Analysis of Variance of Mean Scores for Item IV-a by Race Groups (Authority in Position). 102
84. One-Way Analysis of Variance of Mean Scores Item IV-b by Race Groups (Opportunity for Independent Thought and Action) . . . . . .
85. One-Way Analysis of Variance of Mean Scores Item IV-c by Race Groups (Opportunity to Participate in Setting Goals) . . . . . . .
86. One-Way Analysis of Variance of Mean Scores Item IV-d by Race Groups (Opportunity to Determine Methods). . . . . . . . . . . . .
for
· · for
· · for
· ·
·
·
· 87. One-Way Analysis of Variance of Mean Scores for
Item V-a by Race Groups (Opportunity for Growth and Development). . . . . . . . . . . . . . . . .
88.
89.
90.
91.
One-Way Analysis of Variance of Mean Scores for Item V-b by Race Groups (Feeling of Self-Fulfillment) .................. .
One-Way Analysis of Variance of Mean Scores for Item V-c by Race Groups (Feeling of Accomplishment) . . . . . . . .
Summary of Statistical Findings for Variable Six Race of Administrators. . . .. . ..... .
One-Way Analysis of Variance of Mean Scores for Item I-a by Institutional Types Groups (Security in Job) . . . . . . . . . . . . . . . . . . . . .
103
103
104
104
105
105
106
109

TABLE
92. One-Way Analysis of Variance of Hean Scores Item II-a by Institutional Types Groups (opportunity to Help People). . . . . .
93. One-Way Analysis of Variance of Mean Scores Item II-b by Institutional Types Groups (Opportunity for Friendships) . . . . . . .
for
· · · for
· · · 94. One-Way Analysis of Variance of Mean Scores for
Item III-a by Institutional Types Groups (Feeling
xv
PAGE
110
110
of Self-Esteem) ............... III
95. One-Way Analysis of Variance of Mean Scores for Item III-b by Institutional Types Groups (Prestige Inside the Institution) . · · · · · ·
96. One-Way Analysis of Variance of Mean Scores for Item III-c by Institutional Types Groups (prestige Outside the Institution) . · · · · · ·
97. One-Way Analysis of Variance of Mean Scores for Item IV-a by Institutional Types Groups (Authority in Position) . . . . . . · · · · · ·
98. One-Way Analysis of Variance of Mean Scores for Item IV-b by Institutional Types Groups
· III
· 112
· 112
(Opportunity for Independent Thought and Action). 113
99. One-Way Analysis of Variance of Mean Scores for Item IV-c by Institutional Types Groups (Opportunity to Par~icipate in Setting Goals) 113
100. One-Way Analysis of Variance of Mean Scores for Item IV-d by Institutional Types Groups (Opportunity to Determine Methods). . . . . . . . 114
101. One-Way Analysis of Variance of Mean Scores for Item V-a by Institutional Types Groups (Opportunity for Growth and Development). . . . . 114
102. One-Way Analysis of Variance of Mean Scores for Item V-b by Institutional Types Groups (Feeling of Self-Fulfillment). . . . . . . . . . . . . . . 115
103. One-Way Analysis of Variance of Mean Scores for Item V-c by Institutional Types Groups (Feeling of JI.ccomplishment). . . . . .. ..... 115
104. Summary of Statistical Findings for Variable Seven Type of Institution . . . . . . 116

l
xvi
TABLE PAGE
105. One-Way Analysis of Variance of Mean Scores for Item I-a by FTE Groups (Security in Job). . . . . 118
106. One-Way Analysis of Variance of Mean Scores for Item II-a by FTE Groups (Opportunity to Help People) . . . . . . . . . . . . . . . . . . . . . 119
107. One-Way Analysis of Variance of Mean Scores for Item II-b by FTE Groups (Opportunity for Friendships). . . . . . . . . . . . . . . . . . . 119
108. One-Way Analysis of Variance of Mean Scores for Item III-a by FTE Groups (Feeling of Self-Es teem) . . . . . . . . . . . . . . . . . . . . . 120
109. One-Way Analysis of Variance of Mean Scores for Item III-b by FTE Groups (Prestige Inside the Institution). . . . . . . . . . . . . . . . . . . 120
110. One-Way Analysis of Variance of Mean Scores for Item III-c by FTE Groups (Prestige Outside the Institution). . . . . . . . . . . . . . . . . . . 121
111. One-Way Analysis of Variance of Mean Scores for Item IV-a by FTE Groups (Authority in Position) 121
112. One-Way Analysis of Variance of Mean Scores for Item IV-b by FTE Groups (Opportunity for Independent Thought and Action) · · · · · · · ·
113. One-Way Analysis of,Variance of Mean Scores for Item IV-c by FTE Groups (Opportunity to Participate in Setting Goals) . · · · · · · · ·
114. One-Way Analysis of Variance of Hean Scores for Item IV-d by FTE Groups (Opportunity to Determine Methods) . . . . . . . · · · · · · · ·
115. One-Way Analysis of Variance of Mean Scores for Item V-a by FTE Groups (Opportunity for Growth
· 122
· 122
· 123
and Development). . . . . . . . . . . . . . . . . 123
116. One-Way Analysis of Variance of Mean Scores for Item V-b by FTE Groups (Feeling of Self-Fulfillment). . . . . . . . . . . . . . . . . . . 124
117. One-Way Analysis of Variance of Hean Scores for Item V-c by FTE Groups (Feeling of Accomplisr...ment) . . . . . . . . . . . . . . . . . 124
TABLE
118. Summary of Statistical Findings for Variable Eight Full-Time Enrollment of Institutions.
119. One-Way Analysis of Variance of Mean Scores Item I-a by Institutional Control Groups (Security in Job) . . . . . . . . . . . . .
120. One-Way Analysis of Variance of Mean Scores Item II-a by Institutional Control Groups (Opportunity to Help People). . . . . . . .
121. One-Way Analysis of Variance of Mean Scores Item II-b by Institutional Control Groups (Opportunity for Friendships) . . . . . . .
122. One-Way Analysis of Variance of Mean Scores Item III-a by Institutional Control Groups (Feeling of Self-Esteem). . . . . . . . . .
123. One-Way Analysis of Variance of Mean Scores Item III-b by Institutional Control Groups (Prestige Inside the Institution) . . . . .
124. One-Way Analysis of Variance of Mean Scores Item III-c by Institutional Control Groups (Prestige Outside the Institution). . . . .
125. One-Way Analysis of Variance of Mean Scores Item IV-a by Institutional Control Groups (Authority in Position) . . . . . . . . . .
· · for
· · for
· · for
· · for
· · for
· · for
· · for
· · 126. One-Way Analysis of Variance of Mean Scores for
Item IV-b by Institutional Control Groups
xvii
PAGE
· 125
· 128
· 129
· 129
· 130
· 130
· 131
· 131
(Opportunity for Independent Thought and Action). 132
127. One-Way Analysis of Variance of Mean Scores for Item IV-c by Institutional Control Groups (Opportunity to Participate in Setting Goals) 132
128. One-Way Analysis of Variance of Mean Scores Item IV-d by Institutional Control Groups (Opportunity to Determine Methods). . . ..
for
129. One-Way Analysis of Variance of Mean Scores for Item V-a by Institutional Control Groups
133
(Opportunity for Growth and Development). . . . . 133

TABLE
130. One-Way Analysis of Variance of Mean Scores Item V-b by Institutional Control Groups (Feeling of Self-Fulfillment) . . . . . . .
131. One-Way Analysis of Variance of Mean Scores Item V-c by Institutional Control Groups (Feeling of Accomplishment) . . . .
for
. . . for
. . . 132. Summary of Statistical Findings for Variable Nine
xviii
PAGE
134
134
Control of Institutions . . .. ....... 135

xix
LIST OF FIGURES
FIGURE PAGE
1. Mean Scores of Perceived Deficiencies in Need Categories for Position Groups. · · · · · · · 58
2. Mean Scores of Perceived Deficiencies in Need Categories for Tenure Groups. · · · · · · · · 68
3. Mean Scores of Perceived Deficiencies in Need Categories for Age Groups . · · · · · · 77
4. Mean Scores of Perceived Deficiencies in Need Categories for Educational Preparation Groups · 87
5. Mean Scores of Perceived Deficiencies in Need Categories for Religious Preference Groups. · 97
6. Mean Scores of Perceived Deficiencies in Need Categories for Race Groups. · · · · · · · · · 107
7. Mean Scores of Perceived Deficiencies in Need Categories for Institutional Types Groups · · · 117
8. Mean Scores of Perceived Deficiencies in Need Categories for FTE Groups . · · · · · · 126
9. Mean Scores of Perceived Deficiencies in Need Categories for Control Groups · · 136

CHAPTER I
INTRODUCTION
The administrative structure of colleges and universi
ties is comparable in many ways to the formal organizational
structure found in industry and business. For example, the
positions of corporate chief executives, middle managers,
and supervisors generally parallel the administrative posi
tions in higher education of the presidents, deans, and
department heads. Even though colleges and universities do
not have a profit base or motive, the general organizational
structure has been compared with corporations, government
bureaus, and large foundations (Perkins, 1974).
Although substantial research has been done on job
satisfaction or workers in business and industry, there are
several limitations in attempting to generalize these find
ings to higher education. Therefore, this dissertation is a
report of the study which examined in higher education
variables which were found to be predictive of job satisfac
tion in business and industry.
The research of Lyman W. Porter (1961, 1962) has given
impetus to this investigation. Porter equated job satisfac
tion to perceived need-fulfillment. He has found signifi
cant differences between levels of management and perceived
need satisfaction. The study of this report used a revi
sion of Porterts questionnaire as a control factor for
1

2
comparing the results with other studies which have used the
same instrument.
In an interpretive statement of Porter's studies of
managerial levels and need-satisfaction, Argyris reasoned
that '·the probability to experience a sense of self-esteem,
autonomy, and self-actualization tends to increase as one
goes up the line and tends to decrease as one goes down the
line" (1964, p. 47). He concluded that a differential
opportunity does exist within levels of management to satisfy
different types of needs.
Brown used Porter's instrument and methodology in a
study of' secondary school administrators to research the
hypothesis that Ithigh-level administrators receive greater
satisfaction for their positions than lower level administra
tors" (1973, p. 6). This hypothesis has not been adequately
studied with respect to administrators in higher education.
Tenure of administrators in higher education is the
second independent variable in this study of perceived job
satisfaction of college presidents and deans. Vroom (1964)
concluded from his research that rate of personnel turnover
and job satisfaction are negatively correlated. Hemphill et
al. (1966) concluded from the New York Regents' Study of
College and University Presidents that longer administrative
experience was a characteristic of the more-satisfied
presidents.
In addition to position level and length of tenure, the
L
3
following independent variables, which have been found to be
significant in related studies, are included in this investi
gation in an effort to determine the significance of their
influence on perceived need-fulfillment of college and
university administrators:
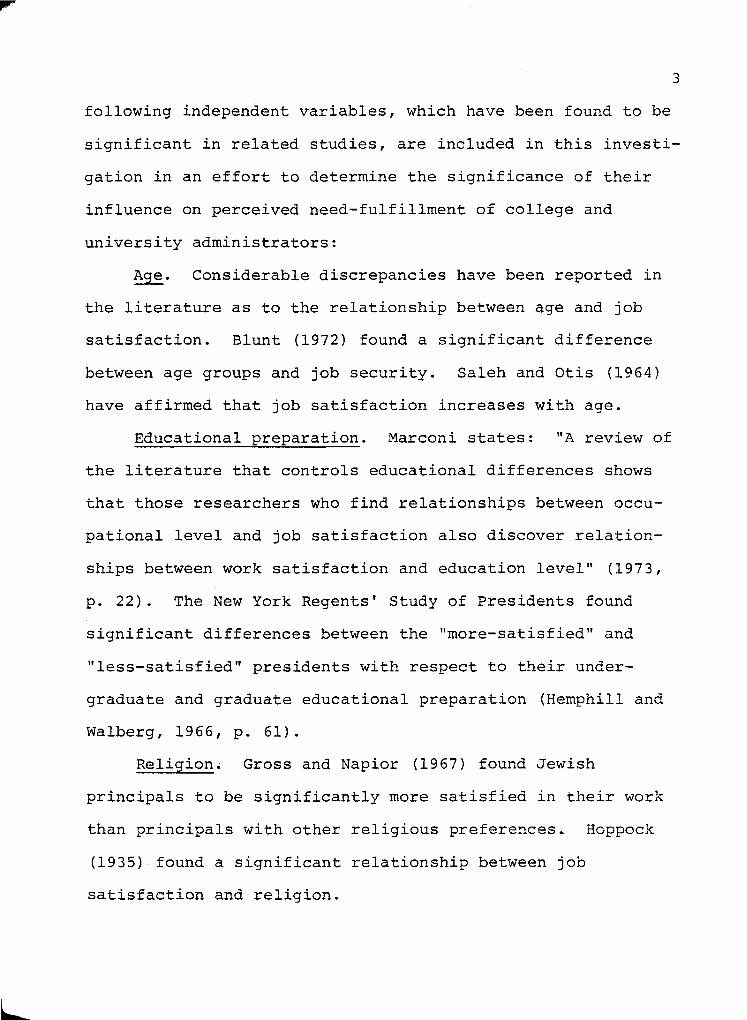
Age. Considerable discrepancies have been reported in
the literature as to the relationship between age and job
satisfaction. Blunt (1972) found a significant difference
between age groups and job security. Saleh and Otis (1964)
have affirmed that job satisfaction increases with age.
Educational preparation. Marconi states: "A review of
the literature that controls educational differences shows
that those researchers who find relationships between occu
pational level and job satisfaction also discover relation
ships between work satisfaction and education level" (1973,
p. 22). The New York Regents' Study of Presidents found
significant differences between the "more-satisfied" and
"less-satisfied" presidents with respect to their under
graduate and graduate educational preparation (Hemphill and
Walberg, 1966, p. 61).
Religion. Gross and Napior (1967) found Jewish
principals to be significantly more satisfied in their work
than principals with other religious preferences~ Hoppock
(1935) found a significant relationship between job
satisfaction and religion.
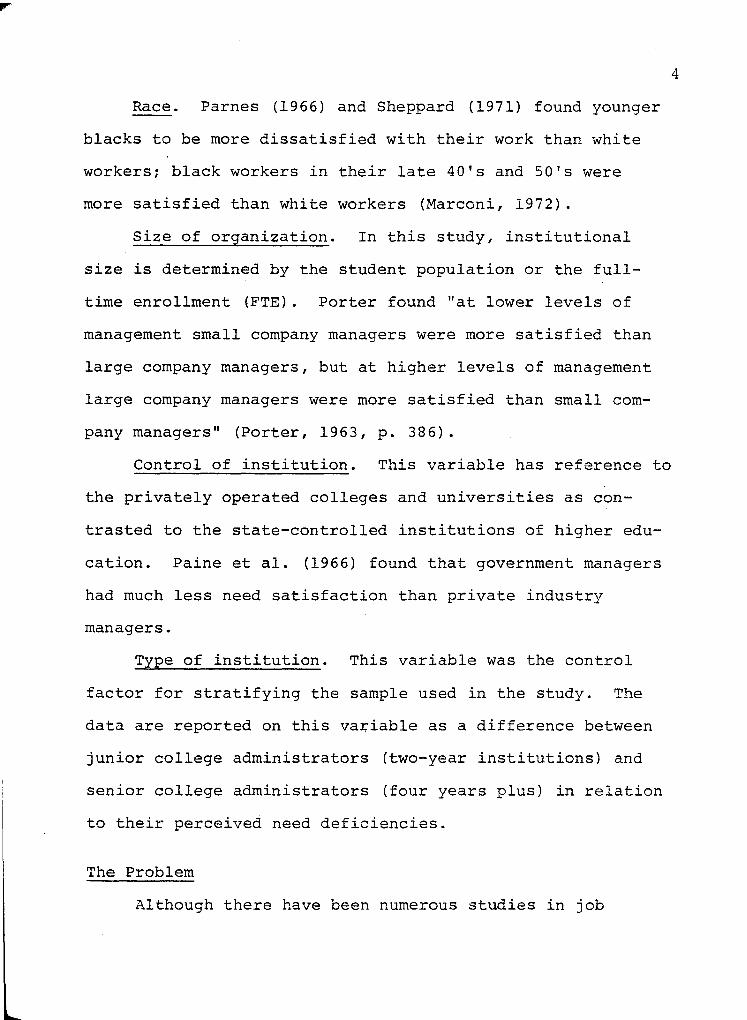
Race. Parnes (1966) and Sheppard (1971) found younger
blacks to be more dissatisfied with their work than white
workers; black workers in their late 40's and 50's were
more satisfied than white workers (Marconi, 1972).
Size of organization. In this study, institutional
size is determined by the student population or the full
time enrollment (FTE). Porter found "at lower levels of
management small company managers were more satisfied than
large company managers, but at higher levels of management
large company managers were more satisfied than small com
pany managers" (Porter, 1963, p. 386).
Control of institution. This variable has reference to
the privately operated colleges and universities as con
trasted to the state-controlled institutions of higher edu
cation. Paine et al. (1966) found that government managers
had much less need satisfaction than private industry
managers.
Type of institution. This variable was the control
factor for stratifying the sample used in the study. The
data are reported on this va~iable as a difference between
junior college administrators (two-year institutions) and
senior college administrators (four years plus) in relation
to their perceived need deficiencies.
The Problem
Although there have been numerous studies in job
4

5
satisfaction of workers in business and industry, little was
known of job satisfaction of college administrators. Lyman
W. Porter's research in perceived need deficiencies as
related to level of employment in organizational hierarchy
had concluded that significant relationships between job
satisfaction and job level do exist in business and industry.
Using Porter's model, Frank Brown (1970) and Trusty and
Sergiovanni (1966) had found a similar relationship in
secondary education. While parallel circumstances seemed to
exist at managerial levels in higher education, only limited
research had been conducted. At the time of this study the
differential relationship of the office of president to the
office of academic dean, which mayor may not be the same as
the relationship between the head of the corporation and a
middle manager, was not known.
Purpose of the Study
The purpose of this study was to survey college and
university presidents and deans (a) to see if significant
differences exist between perceived need satisfaction of
COllege and university presidents and college and university
academic deans; (b) to analyze the perceived need satisfac
tion of the total sample (presidents and deans combined) as
demographic group responses to 13 administrative character
istics.
6
Importance of the Study
This study helps to show the comparative relationships
between two administrative levels: (1) the chief executive
office, president; and (2) chief academic office, academic
dean. Furthermore, it contributes to the vocational, career
information for prospective administrators who aspire to
various positions and levels of administration in higher
education. This study also afforded an opportunity to com
pare need fulfillment of administrators functioning within
different systems of higher education. For example, it
allowed the opportunity to compare the dual systems of public
and private institutions and the dual types of two-year and
four-year institutions. This study is important as an initial
investigation in exploring factors which might be contribut
ing to the short tenure of college and university administra
tors today. Finally, this study has compared the findings
with the results of similar studies in education, government,
business, and industry.
Assumptions of the Study
1. It was assumed that the levels of occupation in
higher education are comparable to those in business and
industry, especially the respective relationships of corpo
rate chief executive to middle manager and college and uni
versity president to academic dean.
2. This study assumed that administrators of higher

7
education would be candid in their responses to the question
naire.
3. This study assumes that job satisfaction is deter
mined by fulfillment of sociological and psychological needs.
4. This study assumed that needs can be arranged into
at least two levels of hierarchal potency (lower and higher
order) .
Hypotheses
The following hypotheses are stated in relation to the
13 items of the questionnaire which are characteristics or
qualities connected with administrative positions.
Ho 1. There is no difference in perceived need defi
ciencies between college and university presidents and
college and university deans orr any of the 13 character
istics.
Ho 2. There is no difference in perceived need defi
ciencies between college and university administrators who
are grouped according to length of tenure on any of the 13
administrative characteristics.
Ho 3. There is no difference in perceived need defi
ciencies between college and university administrators who
are grouped according to age on any of the 13 administra
tive characteristics.
Ho 4. There is no difference in perceived need defi
ciencies between college and university administrators who

are grouped according to educational preparation on any of
the 13 administrative characteristics.
Ho 5. There is no difference in perceived need defi
ciencies between college and university administrators who
are grouped according to religious preference on any of the
13 administrative characteristics.
Ho 6. There is no difference in perceived need defi
ciencies between college and university administrators who
are grouped according to race on any of the 13 administra
tive characteristics.
Ho 7. There is no difference in perceived need defi
ciencies between college and university administrators who
are grouped according to institutional type on any of the
13 administrative characteristics.
8
Ho 8. There is no difference in perceived need defi
ciencies between college and university administrators who
are grouped according to full-time enrollment of their
institutions on any of the 13 administrative characteristics.
Ho 9. There is no difference in perceived need defi
ciencies between college and university administrators who
are grouped according to the control of their institutions
on any of the 13 administrative characteristics.
Definition of the Terms
1. Perceived need deficiency. A self-report of need
deprivation based on respondents rating item (b) of the
questionnaire, "How much should there be?" higher than item
(a), "How much is there now?"
9
2. Differential job level. Different authority levels
of the formal structure in higher education.
3. Job satisfaction. The condition which exists when
psychological and social needs are satisfied; generally, a
positive attitude toward one's professional position.
4. Need hierarchy. Abraham Maslow's theoretical
arrangement of human needs in their order of potency.
5. Perceived need satisfaction. A self-report of need
fulfillment based on respondents rating item (a) of the
questionnaire, "How much is there now?" equal to or higher
than item (b), "How much should there be?"
6. Higher order needs. Needs which are identified in
Porter's methodology as categories of Ca) Esteem, (b)
Autonomy, and (cl Self-actualization.
7. Lower order needs. Those needs identified in
Porter's methodology as categories (a) Security and (b)
Social.
The Organization of the Study
In this chapter a general introduction to the study has
been given.

L
10
In Chapter II a review of the selected literature which
is pertinent to the purpose of this study is presented.
In Chapter III a detailed discussion of the procedures
and methods of the research study will be explained. In
that chapter definitions and details relative to the popula
tion, the sample, the data, and the instrumentation will be
discussed. Also in that chapter the details of the statisti
cal designs employed for this study are given.
In Chapter IVan analysis of the collected data will be
presented.
In Chapter V the findings and conclusions of the study
will be given. Also the research findings will be discussed
in relation to the reviewed literature. Following statements
of implications and applications of the results, Chapter V
concludes with recommendations for additional research
relative to the scope of this study.

CHAPTER II
REVIEW OF THE LITERATURE
This chapter presents a review of selected literature
of job satisfaction and need fulfillment. The studies were
selected on the basis of either their similarity to the
methodology of this study or their relevant findings to the
independent variables of this study.
This chapter also presents empirical support for the
validity and reliability of the Porter questionnaire, which
has been modified and used in this study of perceived defi
ciencies in personal need fulfillment of college and uni
versity administrators.
The oldest major study of job satisfaction found was
that by Robert Hoppock C1935}. Part of his research
included a survey of 500 teachers. The 100 most satisfied
were compared to the 100 least satisfied, and significant
relationships were found between job satisfaction and per
sonal characteristics of emotional adjustment, religion,
feelings of success, interest in work, and fatigue.
In Marconi's naval research, 21 studies of job satis
faction were analyzed and compared to deter~ine the useful
ness of the studies for naval manpower policy (1973). She
found the methodology, terminology, and results to be too
divergent for formation of useful statements about job satis
faction in general (Marconi, 1973, p. 28).
11

12
In reviewing the literature on managerial motivation,
E1Salmi and Cummings (1967) point out that prior to 1959 the
focus of studies in job satisfaction had been largely limited
to blue collar workers (1967, p. 127). Haire (1959), Porter
(1961, 1964), and Vroom (1965) were cited by E1Salmi and
Cummings as authorities who have noted the dearth of studies
in the area of motivation and satisfaction of managers.
According to E1Salmi and Cu~~ings, studies in managerial
motivation have increased considerably since 1959 (E1Salmi
and Cummings, 1967, p. 128).
Porter (196l} asserted that previous studies of mana
gerial jobs had tended to focus on the technical aspects of
the jobs. Three examples of these technical aspects given
by Porter are Cal list of duties, (b) responsibility, and
(c) functions or activities performed (Porter, 1961, p. 1).
According to Porter (196l), Triandis was one of the
first to study industrial managers' perceptions of jobs and
people. lie used two 38-scale semantic differentials on
which 156 subjects rated jobs and people as they perceived
them CTriandis, 1959}. Porter stated: "l\.n understanding of
the nature of job perceptions held by individuals in manage
ment positions would seem to be appropriate for the study of
organizational problems" (Porter, 1961, p. l).
E1Salmi and Cummings identified two streams of thought
which emerged after 1959. These are "Ca} the need hierarchy
concept as a base for empirical research, and (b) motivation

13
hygiene concept as a framework for both supporting and con-
flicting research" (EISalmi and Cummings, 1967, p. 128).
I. THE PORTER STUDIES
.Using Maslow's need hierarchy (Maslow, 1943, 1945) as a
theoretical model, Lyman W. Porter developed a questionnaire
to study perceived need satisfactions of managers (1961).
Porter believed that the grouping of needs or motives accord-
ing to a hierarchy of prepotency is one of the most useful
systems for studying managerial motivation. In developing
the categories for his questionnaire, Porter made two devia-
tions from Maslow's categorical system. First, he left out
physiological needs category on the assumption that these
needs would be adequately met for any managers who may be
surveyed in his studies. Secondly, he added an "autonomyll
category between MasloW'S levels of esteem and self-
actualization. Table 1 shows the original items from
Porterts study.
In Porter's original study (1961), 64 bottom-managers
and 75 middle-managers, individuals in three industrial
organizations, completed questionnaires. Three separate
responses for each item were indicated on three respective
seven-point scales. An example of a typical item on this
questionnaire is:
The feeling of self-esteem a person gets from being in my management position:

TABLE 1
CATEGORIES AND ITEHS FROM PORTER'S ORIGINAL STUDY
I. Security needs
14
a. The feeling of security in my management position.
II. Social needs
a. The opportunity, in my management position, to give help to other people
b. The opportunity to develop close friendships in my management position
III. Esteem needs
a. The feeling of self-esteem a person gets from being in my management position
b. The prestige of my management position inside the company (that is, the regard received from others in the company)
c. The prestige of my position outside the company (that is, the regard received from others not in the company)
IV. Autonomy needs
a. The authority connected with my management position b. The opportunity for independent thought and action
in my management position. c. The opportunity, in my management position, for
participation in the setting of goals d. The opportunity, in my management position, for
participation in the determination of methods and procedures
V. Self-Actualization needs
a. The opportunity for personal growth and development in my management position
b. The feeling of self-fulfillment a person gets from being in my management position (that is, the feeling of being able to use one's own unique capabilities, realizing one's potentialities)
c. The feeling of worthwhile accomplishment in my management position

15
A. How much is there now? (min) 1 2 3 4 5 6 7 (max)
B. How much should there be? (min) 1 2 3 4 5 6 7 (max)
c. How important is this to me? (min) 1 2 3 4 5 6 7 (max)
Instructions for the questionnaire stated that "low
numbers represent low or minimum amounts and high numbers
represent high or maximum amounts" (Porter, 1961, p. 3). A
perceived deficiency was indicated when Part B was circled
higher than Part A. Part C was discontinued by Porter in
his later studies; it was not used often by others who
replicated Porter's research, and has been omitted from this
study.
Porter used a standard statistical design to test the
significance of differences between percentages. His con-
clusions were:
1. Vertical locations of management positions tended
to be an important variable in determining psychological
need-fulfillment.
2. Esteem, security, and autonomy needs were signifi-
cantly more often satisfied in middle than in bottom manage~
mente
3. Higher order needs were least satisfied in both
management positions.
4. Self-actualization and security were seen as the
most important a.reas of need satisfaction.

5. The highest order need of self-actualization was
the most critical need area in terms of both perceived
deficiency and perceived importance.
16
Porter (1962) administered the same questionnaire to
representatives of all levels of management in an effort to
study the perceived deficiency in need fulfillment as a
function of job level. Using age as a control variable, he
employed a statistical sign test to determine the signifi
cance of differences. In this study, Porter concluded:
1. Vertical level of position significantly relates to
perceived satisfaction of the three highest order needs -
self-actualization, autonomy, and esteem.
2. There were no significant differences in satisfac
tion in relation to management level for the two lower order
types of needs, security and social.
3. Among all need levels, self-actualization and auton
omy needs were consistently perceived as the least fulfilled
at all management levels. The five management levels identi
fied by Porter in this study were president, vice-president,
upper middle, lower middle, and lower (Porter, 1962).
Porter (1963) used the sample from the previous study
(1962) to research perceived deficiencies in need-fulfillment
as a function of company size. Data supplied on the first
study made it possible to examine perceived need-fulfillment
of managers on several independent variables. For this
analysis, Porter used the chi square statistic to determine

17
the significance of difference. Using job level as a con
trol variable, he found that ttas a whole, the results for
perceived need deficiency do not show small companies pro
ducing more favorable attitudes across all levels of manage-
ment: (1963, p. 395). However, he did find that "at lower
levels of management small company managers were more satis
fied than large company managers, but at higher levels of
management large company managers were more satisfied than
small company managers" (1963, p. 386).
Porter and Mitchell (1967) compared need satisfactions
in military and business hierarchies. Seven hundred and
three (703) commissioned officers and 594 non-commissioned
personnel of an overseas airforce command completed Porter's
l3-item questionnaire. The military ranks of (a) brigadier
generals and colonels, (b) lieutenant colonels and majors,
and (c) majors and lieutenants were paired with their equiva
lent civilian job levels from previous studies (1962) which
were (a) vice-presidents, (b) upper-middle managers, and (c)
lower-middle managers. Porter and Mitchell used a signed
rank test of differences of mean values between the pairs of
rank. The empirical results were that "military officers
were less fulfilled and less satisfied than their civilian
counterparts. However, fulfillment and satisfaction
increased in relation to military rank in the same way as
for civilian managers" (1967, p. 139).

L
II. USE OF PORTER'S QUESTIONNAIRE k~D METHODOLOGY
IN OTHER MANAGEMENT STUDIES
18
Herrick (1968) used the Porter questionnaire to compare
the perceptions of need fulfillment and their importance to
government executives. Seven hundred and sixty-two (762)
executives returned the completed questionnaire from the
random sample of 1,468 government employees. Level of
position holder, size of the organization, age of the execu
tive, and tenure or service of the executive were among the
35 hypothesized statements. The chi square and T test were
used by Herrick to test significance of the data. The
results were:
1. Higher graded executives perceived autonomy and
esteem needs as significantly more important than lower level
(graded) executives.
2. Executives in small organizations perceived signifi
cantly greater deficiency in fulfillment of autonomy needs.
3. There was a tendency for perceived deficiencies of
autonomy and self-actualization needs to be scored at higher
values (Herrick, 1968).
Blunt (1972) studied the relationship of age to need
satisfaction among middle managers in South Africa. Among
other reports, 263 English-speaking middle managers randomly
drawn from 13 firms completed a slightly revised Porter
questionnaire. A one-way analysis of variance revealed
significant discrepancies at the .01 level of confidence,

19
between the age groupings in the security need area. There
were no significant differences in the other need categories.
Furthermore, Blunt concluded that he found no evidence to
support the findings of Saleh and Otis (1964) who affirmed
that job satisfaction increased with age.
Herrick (1973) combined the findings of the previous
study (Herrick, 1968) with a similar study at the state level
to investigate work motives of female executives. Herrick
reports that "considered as a whole, the data from the two
studies differ consistently only in the discrepancy in
fulfillment of self-actualization needs. This does not seem
to mark any major differences between male and female execu
tives" (1973, p. 385). Thus it was concluded that need per
ceptions of females are like those of their male counter
parts. The Mann-Whitney U test was employed by Herrick to
test the significance of differences between the perceptions
of the two sex groups. Apparently, Herrick used the T test
in the earlier study (1968) but substituted the Mann-Whitney
U test for this study due to the smaller frequencies in the
research groups. Herrick reports that a significant differ
ence in the satisfaction of self-actualization needs was found
and "a difference approaching significance in security needs
and no difference in the other three levels" (1973, p. 383).
Paine et al. (1966) compared the need satisfactions cf
government managers working in different job settings.
Porter's l3-item questionnaire was mailed to 71 field managers

20
and 102 central office managers. Using the 33 responses from
the former and the 62 responses from the latter, the data
were analyzed by means of the Mann-Whitney U test.
The two research questions of Paine et al. were:
1. Is there a significant difference in perceived
need satisfaction between government managers in different
working positions?
2. What differences are indicated between government
managers and managers from private industry?
The reported results which answered the first question
·",ere: "Field managers felt significantly more satisfied than
central office managers with respect to their needs for self
esteem, independent thought and action, growth and develop
ment, and sense of self-fulfillment" (Paine et al., 1966,
p.248).
For the second question, it was found that government
managers had much less need satisfaction than private industry
managers. Statistical significance tests of this part of the
study could not be used because variability data from the
private managers was not available from an earlier study by
Porter (1962).
Cummings and EISalmi (1968) provide a helpful review of
other researchers who adopted Porter's methodology in their
studies of need satisfactions of managers. They have noted
that the studies of Edel (1966), Miller (1966), Eran (1966)
e-t al. "generally tend to confirm Porter's original findings"
(Cummings and ElSalmi, 1968, p. 132).

III. JOB SATISFACTION STUDIES
IN EDUCATION
21
For his doctoral dissertation, Sergiovanni (1966) inves
tigated factors which affect job satisfaction and job dis
satisfaction of teachers. The stated purpose of his study
was to test the Herzberg findings (Herzberg et al., 1959)
with teachers. A random selection of 40 teachers from Monroe
County, New York, were interviewed. Sergiovanni's methodology
of interpretation of the interviews followed closely that
used by Herzberg et ala (1959). The chi square test of
significance was employed to analyze the data.
Sergiovanni concluded that the results of his study
fended "to support the universality of Herzberg's findings"
(1966, p. 1,236-a).
The New York Regents Advisory Committee on Educational
Leadership sponsored a comprehensive study of college and
university presidents in the State of New York (Hemphill,
1966). The purpose of the study was to examine factors which
affect the role of presidents in higher education. A series
of questions related to college and university presidential
roles were examined. One of these questions was: "What satis-
factions do presidents derive from their work?" (1966, p. 19).
One hundred and eighty (180) presidents of institutions
of higher education in the State of New York completed a
questionnaire consisting of 92 multiple-choice items. Four

22
of these items were related to satisfactions of the position.
Nine sub-groups were established for analysis of the data.
The presidents were divided into two groups, (a) more-
satisfied presidents and (b) less-satisfied presidents.
Analyses were reported in percentages of each group on each
characteristic. One conclusion of the New York Regents study
was that the more-satisfied presidents characteristically had
longer administrative experience.
Hussein (1968) studied the effects of school size on
teacher satisfaction and participation. A representative
sample of teachers from a stratified random sample of ten
Michigan schools responded to a questionnaire based on a
model that theoretically would explain the ultimate impact of
school size on teacher satisfaction and participation. Sta-
tistical computations of correlations between the variables
of (a) organizational, (b) psychological, and (c) dependent
teacher1s satisfaction and teacher1s participation revealed
a statistically significant negative correlation between
school size and teacher satisfaction and participation.
The second major finding was that the data supported the theo-
retical model proposed to explain the effects of school size.
In this regard, Hussein states:
School size causes certain unfavorable organizational changes, which in turn tends to affect another group of psychologically-based variables, and both cause the ultimate impact of school size upon teacher's satisfaction and participation (1968, p. 2,480-a).
l
23
Dahl (1970) studied role perceptions and job satisfaction
among lower and middle level junior college administrators.
Twenty-four (24) administrators, 12 from each position level,
from eight junior colleges in Southern California were inter
viewed. Based on the interview, the researcher rated each
administrator on a seven-point job satisfaction scale. Three
of the stated findings were~
1. Job satisfaction was very high a~ong junior college
administrators at both levels.
2. Ratings of job satisfaction were not related to age.
3. Most administrators felt that they had not been
adequately prepared for thejr initial step into administration.
Dahl points out that "the professional literature has
had little to say in the area of job satisfaction of college
administrators (1970, p. 63). Advocating future study, he
states: "A doctoral study might utilize a Maslow-type con
ceptualization of types of needs, as did Porter, who studied
the vertical administrative structure in industry" (1970,
p. 63). He further states: "Job satisfaction among pro
fessionals in higher education is virtually an untapped
subject area for research" (1970, p. 63).
Smart and Morstain (1975) employed the Job Descriptive
Index (JDI) to assess job satisfaction among college adminis
trators. An alternate purpose of this study was to determine
the usefulness of the JDI in an academic environment. Pre
vously used in business by Smith et al. (1969), the JDI was
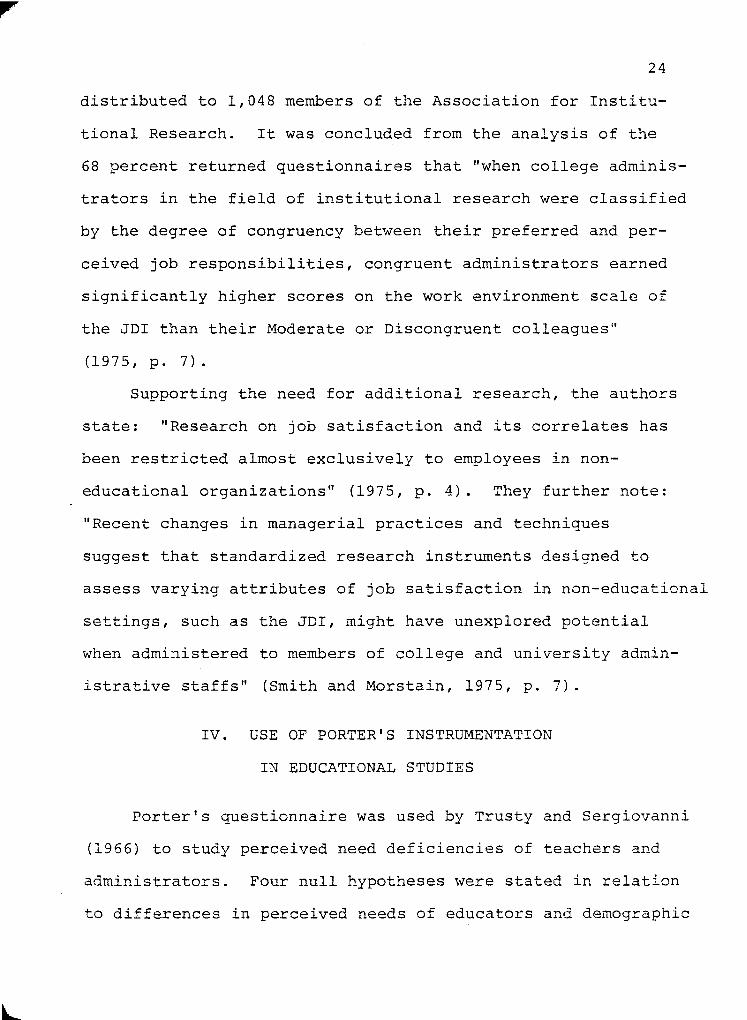
24
distributed to 1,048 members of the Association for Institu
tional Research. It was concluded from the analysis of the
68 percent returned questionnaires that "when college adminis
trators in the field of institutional research were classified
by the degree of congruency between their preferred and per
ceived job responsibilities, congruent administrators earned
significantly higher scores on the work environment scale of
the JDI than their Moderate or Discongruent colleagues"
(1975, p. 7).
Supporting the need for additional research, the authors
state: "Research on job satisfaction and its correlates has
been restricted almost exclusively to employees in non
educational organizations" (1975, p. 4). They further note:
"Recent changes in managerial practices and techniques
suggest that standardized research instruments designed to
assess varying attributes of job satisfaction in non-educational
settings, such as the JDI, might have unexplored potential
when administered to members of college and university admin
istrative staffs" (Smith and Morstain, 1975, p. 7).
IV. USE OF PORTER'S INSTRUMENTATION
IN EDUCATIONAL STUDIES
Porter's questionnaire was used by Trusty and Sergiovanni
(1966) to study perceived need deficiencies of teachers and
administrators. Four null hypotheses were stated in relation
to differences in perceived needs of educators and demographic

25
variables of age, experience, sex, and professional role
(level). Two hundred and twenty-three (223) out of 300
teachers and administrators from a single school district
completed and returned the questionnaire. Analysis of the
variance was the statistical design used to test the data.
The findings led to a rejection of the null-hypotheses re-
lated to age, sex, and professional role. The hypothesis
related to years of experience was confirmed.
Haller (1966) questioned the reliability and validity of
the Trusty-Sergiovanni (1966) study. First, he questioned
the relationship of the instrument to Maslow's need-hierarchy
theory. He questioned the use of "null-language" in stating
the hypotheses. He further challenged the instrumentation
used by Trusty and Sergiovanni by stating: "The authors
completely neglect to report any evidence of validity or
reliability" (Haller, 1966, p. 269).
Trusty and Sergiovanni (1966) replied to Haller's criti-
cism on most points. Particularly to answer Haller's con-
tent ion that a multi-dimensional needs-satisfaction question-
naire does not measure job satisfaction, the researchers
stated:
The need deficiency study is indeed a job satisfaction study. This should not come as a sur .... prise to readers, for it is generally accepted that job satisfaction is related to need-fulfillment. Applewhite (1965) for example, in his review of Porter~s work with the Maslow hierarchy, considers the Porter need categories as the basis for job satisfaction wants. The conceptual consistency of the need-deficiency study is demonstrated by the

l
use of the need hierarchy dimensions as critical components of job satisfaction II (1966, p. 277).
26
Brown (1970) used Porter's instrumentation to study need
satisfaction of public school administrators in California.
The major research question concerned the relationship of
level of administration to need satisfaction. Questions con-
cerning other characteristics which might determine job
satisfaction were also stated. The data were statistically
interpreted by a randomized factorial design employing analy-
sis of variance techniques.
Brown found no relation between administrators' need
satisfaction and (a) age, (b) sex, and (c) organizational
size. Significant relationships were found between adminis-
trators' satisfaction and (a) job level, (b) level of educa-
tion, and (c) minority student composition of the schools
(l970, p. 6,295-a).
Building on the research from his dissertation, Brown
(1973) presented a paper at the annual meeting of the American
Educational Research Association. The paper was entitled
liThe Job Satisfaction of Administrators vvi thin a Multi-Ethnic
Setting. II The results of his original study were enlarged
upon in this paper, and it was stated that "minority student
composition did not affect central office administrators' job
satisfaction . . nevertheless, at the principalship level,
principals of schools with a 20 percent or more minority
student enrollment enjoyed their positions less than those
with fewer minority students: (Brown, 1973, p. 7).

27
Carroll (1974) administered a modification of "the
popular and respected need satisfaction questionnaire
developed by Lyman W. Porter" (1974, p. 56). The purpose of
the study was to examine role conflict of university depart
ment chairmen. Including the Porter instrument, 148 depart
ment chairmen completed and returned a four-part question
naire. The second part was a series of 12 questions designed
to index the perceptions of role conflict by the administra
tors. Four role conflict types were identified. These were
(a) intersender conflict, (b) intrasender conflict, (c)
interrole conflict, (d) person-role conflict.
Carroll used correlational statistics to investigate
the relationship bet'\.veen administrators' perceived role con
flict and their perceived need deficiency. It was found
that a significant correlation between all four role conflict
types and need deficiency does exist (1974, p. 59).
V. THE INSTRUMENTATION AND RATIONALE
With the exception of Trusty and SErgiovanni's defense,
nothing was stated in any of the literature identified to
this point about the validity or reliability of Porter's
instrument. However, empirical support for the instrument
does exist and is reported here.
Imparato (1972) examined the relationship between
Porter's questionnaire and the Job Descriptive Index (JDI)
developed by Smith et al. Both questionnaires were

L
28
administered to 381 employees of a Veteran's Administration
Hospital in Brooklyn. The participants volunteered to
cooperate in the research. In explaining the results,
Imparato states: liThe multiple correlation between the five
scales of the JOI and the PNSQ (Porter Need Satisfaction
Questionnaire) total was .69" (1972, p. 401).
In concluding the study, Imparato says:
The residual question, then, concerns the point at which the two tests can be accepted as operations of a single, although multi-dimensional, construct. The correlation of .69 may be as high as one could expect given the effects of unreliability and the possibility of a truncated range on both scales (1972, p. 402).
In reporting on the reliability and validity of the JOI,
Smith (1967) pointed out that "there is no single general
criterion measure which can be used to validate a measure of
job satisfaction. What is needed is evidence that the scales
relate to other independent meaningful indicies of satisfac-
tion in the situation ll (1967, p. 349). The major approach
used to validate the JOI was correlational studies of the
JOI scales to other measures of job satisfaction. Smith
reports that the scales correlate highly with other measures
of satisfaction with an average correlation of .70.
Using Smith's rationale, it could be argued that
Imparato's correlation between the JOI and Porter's instru-
ment of .69 indicates empirical validity for the latter.
Waters and Roach (1973) drew the following conclusion
from their factor analysis of Porterts questionnaire ite.TTls:

It does appear that Porter-type items can be used to differentiate higher order and lower order need satisfaction, and that over-all job satisfaction is primarily a function of satisfaction of higher order needs (1973, p. 189).
It was found by Waters and Roach that all items in the
Esteem, Autonomy, and Self-actualization categories loaded
29
above criterion level on the factor analysis. Only one item
in the lower need categories (Security and Social) loaded on
the factor. The second subgeneral (factor B) was interpreted
as lower order need fulfillment. Three items in Social and
Security categories loaded on this factor; none of the items
in the higher order categories loaded on the factor.
In comparing their findings to Payne (1970) and Roberts
et ale (197l), Waters and Roach concluded that the three
studies agreed that lithe items do not cluster as classified
according to the Maslow system" (1973, p. 189).
The reliability of the instrument has been studied by
Dore and Meacham (1973). Before using the questionnaire in a
study of job satisfaction of managers, they conducted a small
reliability study to determine the test-retest reliability.
On two occasions, the questionnaire was administered to 30
subjects. A three-week interval elapsed between the two
administrations of the questionnaire. The test group con-
sisted of managers and graduate students of business adminis-
tration. It was determined that the test-retest reliability
coefficient was .83 (Pearson r).
Reliability of the instrument is further supported by

the relative consistency of findings from repeated utiliza
tion of the instrument.
In his permission letter (Appendix E) Porter briefly
comments on the reliability and validity of his question
naire.
30
The instrument yields scores in five need categories,
which can be grouped and interpreted as lower order and
higher order needs. Furthermore the instrument is short,
easily administered, and easily scored. Additional data
analyses need to be completed before statements of certainty
can be made in support of the instrument's validity and
reliability.
Concerning the theoretical methodology on which the
instrument was based, Wolf (1967) sets forth a theoretical
"reformulation" of job satisfaction and job motivation. He
states: "Job motivation can be considered as a sub
classification of general motivations; as such, it follows
the principles of the need hierarchy (Maslow, 1954)" (Wolf,
1967, p. 91).
Wolf's theory proposes to account for all the discrepant
research results related to Herzberg's (1959) two-factor
theory and Maslow's (1954) need hierarchy theory. The indi
vidual's perception of job characteristics and behaviors is
emphasized by Wolf as the key to synthesis of the two
theories. The author's abstract of his integrative theory
states:

l
It is theorized that Herzberg's content and context elements are related to both satisfaction and dissatisfaction in terms of the level of gratification of the various needs within Maslow's hierarchy. It is further theorized that job motivation results from an individual's perception of the relationship between specific job-related behaviors and desired need-gratifying consequences. Context elements are interpreted as being unlikely
. to be perceived as leading to increased gratification of active needs through job-related behaviors, while content items are likely to be so perceived.
VI. SUMMARY
It is estimated that more than 3,000 articles investi-
gating job satisfaction have been published since the
appearance of Hoppock's work of 1935 (Imparato, 1972).
No pretense is made by the writer to give the reader
more than a general representation of the literature on job
satisfaction. Particular attention has been given to those
studies which reported findings relative to the variables
of this study.
The research indicates that job satisfaction among
31
managers was minimal until about 1959. The studies that were
done focused on the techniques of the job itself. Phenomeno-
logical or psychological aspects of individual perception of
jobs were introduced in 1959 by Triandis (1959). The famous
Cornell Studies (JDI) initiated in 1959, examined personal
and psychological aspects of worker values, frame of
reference, and attitudes (Smith, 1967).
The more psychological approach to the study of job
l
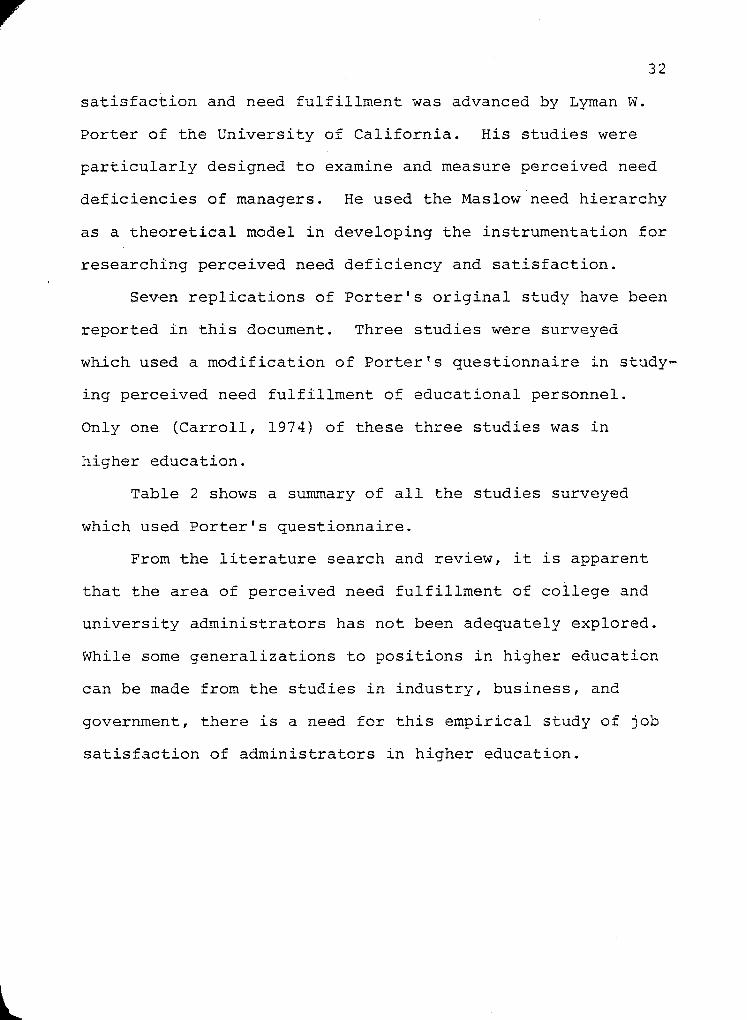
32
satisfaction and need fulfillment was advanced by Lyman W.
Porter of the University of California. His studies were
particularly designed to examine and measure perceived need
deficiencies of managers. He used the Maslow need hierarchy
as a theoretical model in developing the instrumentation for
researching perceived need deficiency and satisfaction.
Seven replications of Porter's original study have been
reported in this document. Three studies were surveyed
which used a modification of Porter's questionnaire in study
ing perceived need fulfillment of educational personnel.
Only one (Carroll, 1974) of these three studies was in
higher education.
Table 2 shows a summary of all the studies surveyed
which used Porter's questionnaire.
From the literature search and review, it is apparent
that the area of perceived need fulfillment of college and
university administrators has not been adequately explored.
While some generalizations to positions in higher education
can be made from the studies in industry, business, and
government, there is a need for this empirical study of job
satisfaction of administrators in higher education.

r
TABLE 2
SUMMARY OF STUDIES WHICH USED PORTER1S QUESTIONNAIRE
NAME AND DATE RESEARCH SAMPLE
Porter (196l) 64 bottom-level managers
Porter (1962) 1,958 managers
Porter (1963) Same as 1962
Porter and Mitchell (1967) 703 commissioned officers
Paire et al. (1966)
Herrick (1968)
Blunt (1972)
Herr ick (1972)
Trusty-Sergiovanni (1966)
Brm·m (1970)
Carroll (1974)
594 non-commissioned officers
95 government managers
762 government executives
263 English-speaking middle managers in South America
Combined 1968 sample with 173 state employees
233 teachers and administrators from a public school district
1,000 public school administrators in California
148 university department chairmen
STATISTICAL DESIGN
Significance of difference between percentages
Sign test
Chi square
Signed-rank (pair of ranks)
Mann-Whitney U test
Chi square and T test
One-way ANOVA
Mann-Whitney U test
ANOVA
ANOVA
Correlation

CHAPTER III
METHODOLOGY OF THE STUDY
In this chapter the procedures and methods of the
research study are given including definitions and details
relative to the population, the sample, the data, and the
instrumentation.
Population
The population of this study consists of the chief
executive officers and the chief academic officers of the
671 member institutions of the Southern Association of
Colleges and Schools. The population was identified in the
Proceedings (March, 1976) of the Southern Association of
Colleges and Schools. This publication gives the following
information about each member institution:
1. An alphabetical listing of institution by State
with address and name of chief executive officer.
2. The initial accreditation date and most recent
reaffirmed date.
3. fu~ indication of institutional type by degree level:
Level I - Associate Degree Level II - Bachelor's Degree Level III - Bachelor's and Master's Degrees Level IV - Bachelor's, Master's, and Doctor's Degrees Level V - Graduate and Professional Degrees only
4. Separate listing of full-time enrollment for credit
and enrollment for non-credit.
34

35
It was assumed that the chief executive officer listed
in the Proceedings would normally occupy the position of
president of the institution. It was also assumed that each
member institution of the Southern Association would have
one administrator who would receive mail addressed to the
chief academic officer. The title of dean will be used
often in this report to represent the administrators serving
as chief academic officers. The total population of the two
administrative positions of accredited institutions in the
South is 1,342 (671 presidents and 671 deans) .
Sample
The sample was drawn along the following procedures:
One hundred and fifty institutions of higher education
from the population of 671 institutions were randomly
selected. This was done by stratifying the institutions
according to degree level. As indicated above, the
Proceedings identified the degree level of each accredited
institution listed. The degree level summary information
was used to determine the stratification of institutions by
types. The types by level are: Level I, Two-Year; Level II,
Four-Year; Level III (Levels III and IV combined) Four-Year
Plus; Level IV, Graduate or Professional.
After the stratification was determined, the researcher
then used a standard procedure of random numbers in select
ing the appropriate ratio of 150 institutions for the sample.
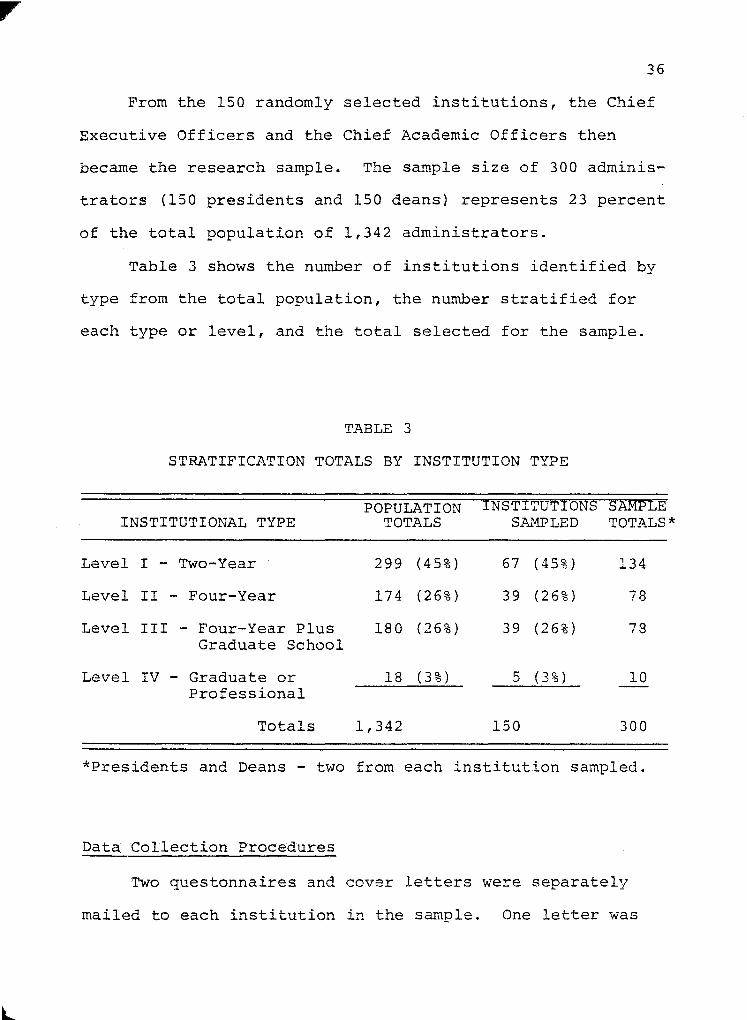
36
From the 150 randomly selected institutions, the Chief
Executive Officers and the Chief Academic Officers then
became the research sample. The sample size of 300 adminis~
trators (150 presidents and 150 deans) represents 23 percent
of the total population of 1,342 administrators.
Table 3 shows the number of institutions identified by
type from the total population, the number stratified for
each type or level, and the total selected for the sample.
T}\BLE 3
STRATIFICATION TOTALS BY INSTITUTION TYPE
POPULATION INSTITUTIONS SAMPLE INSTITUTIONAL TYPE TOTALS S~1\J.'V[P LE D TOTALS *
Level I - Two-Year 299 (45% ) 67 (45%) 134
Level II - Four-Year 174 (26% ) 39 (26% ) 78
Level III - Four-Year Plus 180 (26% ) 39 (26% ) 78 Graduate School
Level IV - Graduate or 18 (3%) 5 (3 %) 10 Professional
Totals 1,342 150 300
*Presidents and Deans - two from each institution sampled.
Data Collection Procedures
Two questonnaires and cover letters were separately
mailed to each institution in the sample. One letter was

L
37
personally addressed to the chief executive. The names of
the chief executives, the addresses of the institutions, and
zip codes were taken from the Proceedings. The second
letter was addressed to the "Chief Academic Officer" of the
institution since the names of the chief academic officers
were not known.
The envelopes and letterheads were from the Department
of Educational Administration and Supervision of the
University of Tennessee at Knoxville. Each envelope mailed
contained a letter (Appendix A) briefly explaining the study,
the questionnaire (Appendix B), business reply envelope, and
a post card (Appendix C) .
The recipients of the mail-out were informed in the
letter of the availability of a free summary which could be
obtained by returning the post card separately.
The 300 questionnaires were mailed out the first week in
January, 1977. Within two weeks from that date, 153 question
naires were returned to the University's Bureau of
Educational Research. In the next ten days, another 29
questionnaires were received.
Four weeks after the original mailing, 60 percent of the
questionnaires had been received. At that time, a follow-up
letter was mailed (Appendix D). The follow-up letter con
tained the same enclosures as the original mail-out.
The recipients of the follow-up letter were determined
by a combination of identifying those who had returned the

l
38
post cards and the institutions whose zip codes on the
business reply envelope could be identified with certainty.
Since the researcher had stated anonymity for the partici
pants, no codes were placed on the questionnaire to identify
those who had returned the questionnaire.
The follow-up consisted of 152 letters - 52 to chief
executive officers and 50 to chief academic officers. About
50 admini.strators responded to the follow-up. The last
returns were collected on April 25, 1977.
The total questionnaires returned was 230 of which 224
were usable for the study. The usable questionnaires
represent 74.6 percent of the sample of 300. Two question
naires were returned with notes from secretaries indicating
that the chief executi.ve was no longer with the institution.
Four questionnaires were returned with only one side of the
instrument completed. Five questionnaires were returned from
presidents and 13 from deans with partial information omit
ted; these were used in the study and will account for slight
variations in group sizes. Of the 224 questionnaires
returned, 108 were from presidents (48 percent) and 116 were
from dea.ns (52 percent}.
One hundred and sixty-five (165) post cards were
returned from administrators requesting a summary of the
research.
Table 4 shows the number of returns and percentages
according to the stratification.

TABLE 4
SUMMARY OF RETURNED QUESTIONNAIRES BY STRATIFICATION LEVELS
TOTAL PERCENTAGE OF INSTITUTIONAL TYPE RETURNED TOTAL RETURN
Level I - Two-Year 100 45%
Level II - Four-Year 59 26%
Level III - Four-Year Plus 54 24% Graduate School
Level IV - Graduate or 9 4% Professional
-222*
*Two questionnaires were not marked on this variable.
The researcher estimates the total cost of the survey
to be $225.00. This amount includes the printing of the
questionnaire and the post cards, the purchasing of the
letterheads and envelopes, and the postage.
The sample of 224 administrators in this study is 16
39
percent of the population's size of 1,342 administrators of
institutions in the South. This percentage of the total
population coupled with the 74.6 percent of the 300 in the
sample, gives an adequate data base for inferential hypothesis

40
analysis. With an alpha of .05, the researcher does not
believe that either the Type I or the Type II error was made
in analyzing the data with reference to the stated hypothe-
ses.
I. THE QUESTIONNAIRE
The quantitative portion of the questionnaire used for
the study was developed by Lyman W. Porter of the University
of California. Porter (1961, 1962, 1963, and 1967) used the
13-item questionnaire in a series of studies on perceived
need satisfaciton of managers. Slight modifications had to
be made in the wording of the items to make them appropriate
for administrators in higher education. The following shows
a typical item as originally worded by Porter and the modifi-
cations made for this study:
The prestige of my management position inside the company (that is, the regard received from others in the company)
Modification of the same item:
The prestige of my administrative position inside the institution (that is, the regard received from others inside the institution)
The instructions for completing the questionnaire were
also revised to make the statements apply to administrative
positions rather than management positions. The administra-
tors who received the questionnaire were instructed to com-
plete this portion of the questionnaire by giving two ratings
for each item. The two Likert-type, seven-point scales were

41
identified as (a) How much of the characteristic is there
now connected with your administrative position? and (b)
How much of the characteristic do you think should be con
nected with your administrative position? The participants
were asked to answer the two questions by blackening a
number on the rating scale from one to seven, where low
numbers represent low or minimum amounts, and the high num
bers represent high or maximum amounts.
A perceived need deficiency was indicated when an
administrator rated question b (How much should there be?)
higher on the sacle than question a (How much is there now?).
As in the other Porter studies, it is assumed that these
13 items do independently measure perceived need deficiencies
of the administrators who completed the questionnaire. The
items constitute the dependent variables of the study and
were coded and scored to yield interval level data.
Table 5 shows the arrangement of the 13 dependent vari
ables according to the need categories. This arrangement is
identical to that used by Porter (1961) and others who have
used the questionnaire to study perceived need deficiency
or satisfaction.
The second portion of the instrument consisted of nine
independent variables. These variables were identified on
the questionnaire as (1) position, (2) length of tenure, (3)
age, (4) educational preparation (highest degree), (5)
religious preference, (6) race, (7) type of institution,

TABLE 5
NEED CATEGORIES AND SPECIFIC NEED ITEMS AS LISTED IN THE QUESTIONNAIRE
I. Security needs
42
a. The feeling of security in my administrative position
II. Social needs
a. The opportunity, in my administrative position, to give help to other people
b. The opportunity to develop close friendships in my administrative position
III. Esteem needs
a. The feeling of self-esteem a person gets from being in my administrative position
b. The prestige of my administrative position inside the institution (that is, the regard received from others in the institution)
c. The prestige of my administrative position outside the institution (that is, the regard received from others not in the institution)
IV. Autonomy needs
a. The authority connected with my administrative position
b. The opportunity for independent thought and action in my administrative position
c. The opportunity, in my administrative position, for participation in the setting of goals
d. The opportunity, in my administrative position, for participation in the determination of methods and procedures
V. Self-actualization needs
a. The opportunity for personal growth and development in my administrative position
b. The feeling of self-fulfillment a person gets from being in my administrative position (that is, the feeling of being able to use one's own unique capabilities, realizing one's potentialities)
c. The feeling of worthwhile accomplishment in my administrative position

43
C8} full-time enrollment, and (9) control of institution. A
series of response categories were given for each variable
(Appendix B).
The instructions for this portion read "Please respond
by blackening the appropriate circle of each item."
The researcher marked the first variable, position,
prior to sending the questionnaire to the administrators.
Since the envelopes were addressed to chief executive offi
cer or the chief academic officer, this information was
known to the researcher before submitting the questionnaire.
The time needed to complete both sides of the question
naire was estimated from four to six minutes.
II. DATA PROCESSING AND STATISTICAL DESIGN
The independent and dependent variables of the question
naire were numbered to represent the card columns on a
standard 80-column computer punch card. In Appendix F two
typical data cards are shown as punched in columns I through
35.
One data card was punched for each usable questionnaire.
The total number of data cards prepared for the computer pro
cedures was 224. The Statistical Package for the Social
Sciences (Nie et al., 1975) manual was used in computer pro
graming for crosstabulations and one-way analyses of variance.
The calculations of one-way analysis of variance procedures
result in an F-ratio. The F-ratio is a ratio of the variance

L
between groups to the variance within groups (Meyers and
Grossen , 1974). The one-way analysis of variance formula
and computation are explained in Appendix G.
44
Although some controversies have existed concerning
types of scales and the using of appropriate statistical
designs (Gardner, 1975), it was concluded by the researcher
that the questionnaire could be scored for interval level
data analysis.
The 13 dependent variables of the questionnaire were
scored in the following way to yield interval level data.
If in responding to a particular characteristic an adminis
trator scored the first question Ca} "How much is there now?"
as a'·' 4" and the second question (b) "How much should there
be?" as a "7, It the amount of perceived need deficiency \vould
be the difference between the two scores; and in this case,
a "3." The greater the difference between the two responses,
the greater is the perceived need deficiency.
A one-way analysis of variance was computed on each
dependent variable of the questionnaire independently of the
other 12 variables. It was assumed that the 13 statements
of job characteristics would yield important information
which should be analyzed independently of the other cha~ac-
teristics. It is believed that the research and data do
meet the assumptions of the one-way analysis of variance
(Meyers and Grossen, 1974). Because the research group
sizes were unequal, Bartlett's test for homogeneity was
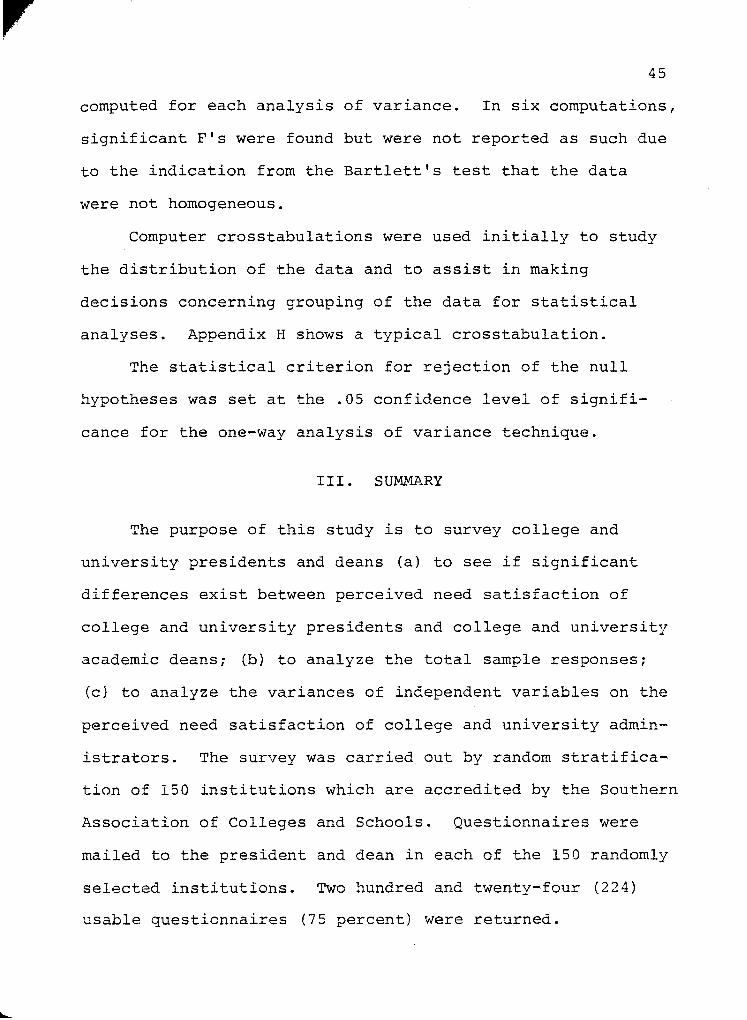
45
computed for each analysis of variance. In six computations,
significant F's were found but were not reported as such due
to the indication from the Bartlett's test that the data
were not homogeneous.
Computer crosstabulations were used initially to study
the distribution of the data and to assist in making
decisions concerning grouping of the data for statistical
analyses. Appendix H shows a typical crosstabulation.
The statistical criterion for rejection of the null
hypotheses was set at the .05 confidence level of signifi
cance for the one-way analysis of variance technique.
III. SUMMARY
The purpose of this study is to survey college and
university presidents and deans (a) to see if significant
differences exist between perceived need satisfaction of
college and university presidents and college and university
academic deansi (b) to analyze the total sample responsesi
ecl to analyze the variances of independent variables on the
perceived need satisfaction of college and university admin
istrators. The survey was carried out by random stratifica
tion of 150 institutions which are accredited by the Southern
Association of Colleges and Schools. Questionnaires were
mailed to the president and dean in each of the 150 randomly
selected institutions. Two hundred and twenty-four (224)
usable questionnaires (75 percent) were returned.

46
The statistical design used for computer procedures and
computation in the study was the one-way analysis of vari
ance.

CHAPTER IV
DATA ANALYSES
In this chapter the data from the study are reported
and interpreted in light of the stated null hypotheses.
One-way analyses tables, summary tables, and histograms
are presented to show the research results.
The purpose of this study was to analyze the perceived
deficiencies in personal needs fulfillment of college and
university presidents and academic deans. The statistical
design used in the study was the one-way analysis of vari
ance. Crosstabulations were used initially to study the
distribution of the data and to assist in making decisions
concerning the grouping of the data for statistical analyses.
Independent variable classes were combined to avoid large
deviations in group sizes. For example, the crosstab in
Appendix G shows a frequency of five for the age classifica
tion 25 - 34. For this variable, classes 1 and 2 were com
bined to give a total of 72 for research group 1. Table 6
shows the group structures and sizes of the independent
variables.
The statistical criterion for rejection of the null
hypotheses was set at the .05 confidence level of signifi
cance for the one-way analyses of variance.
47

r 48
TABLE 6
GROUPS AND SAMPLE SIZES OF THE INDEPENDENT VARIABLES
VARIABLE GROUPS NUMBERS
1- Position Gr. 1 Presidents 108 Gr. 2 Deans 116
2. Tenure Gr. 1 42 Months or Less 77 Gr. 2 43 Months and Over 140
3. Age Gr. 1 25 - 44 72 Gr. 2 45 - 54 91 Gr. 3 55 and Over 55
4. Ed. Preparation Gr. 1 Master's Degree 50 Gr. 2 Doctor's Degree 155
5. Religious Pref. Gr. 1 Protestants 183 Gr. 2 Non-Protestants 39
6. Race Gr. 1 Caucasian 204 Gr. 2 Minority 17
7. Type Gr. 1 Two-Year 100 Gr. 2 Four-Year Plus 122
8. F.T.E. Gr. 1 3,000 or Less 152 Gr. 2 Over 3,000 70
9. Control Gr. 1 Public 141 Gr. 2 Private 80
Tables and Graphic Techniques
There were 13 one-way analyses of variance computed for
each null hypothesis; therefore, 13 ANOVA tables are shown
following each hypothesis statement and research response.
The statistical findings for each null hypothesis are
reported in a summary table following the 13 ANOVA tables.
l
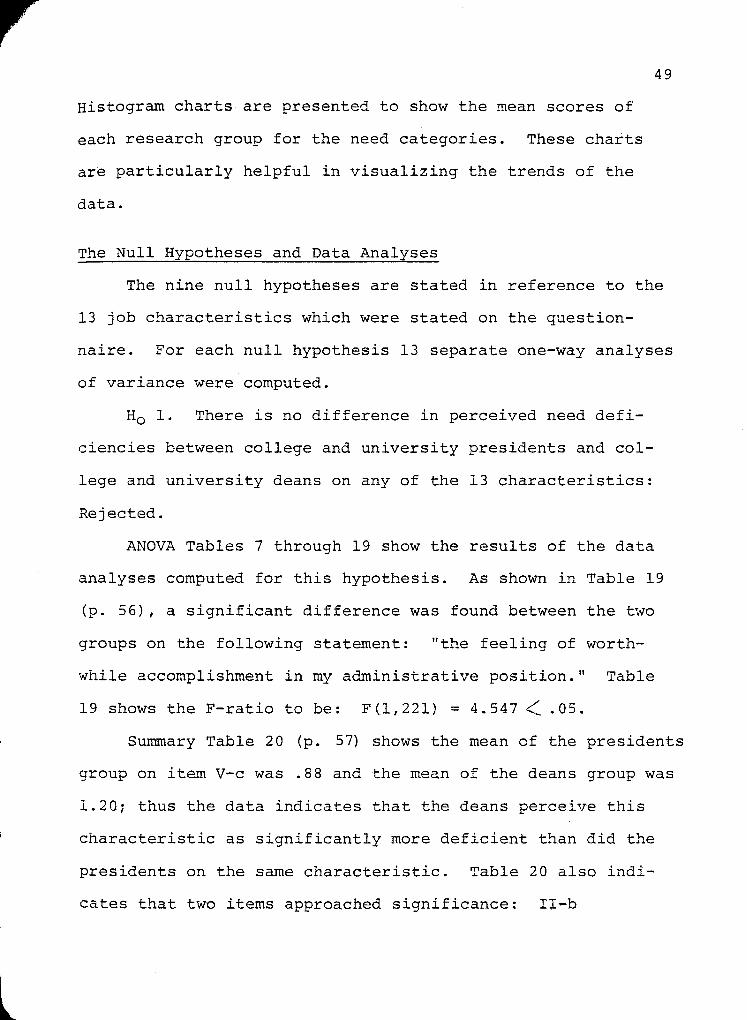
l
Histogram charts are presented to show the mean scores of
each research group for the need categories. These charts
are particularly helpful in visualizing the trends of the
data.
The Null Hypotheses and Data Analyses
49
The nine null hypotheses are stated in reference to the
13 job characteristics which were stated on the question
naire. For each null hypothesis 13 separate one-way analyses
of variance were computed.
Ho 1. There is no difference in perceived need defi
ciencies between college and university presidents and col
lege and university deans on any of the 13 characteristics:
Rejected.
ANOVA Tables 7 through 19 show the results of the data
analyses computed for this hypothesis. As shown in Table 19
(p. 56), a significant difference was found between the two
groups on the following statement: "the feeling of worth
while accomplishment in my administrative position." Table
19 shows the F-ratio to be: F(l,22l) = 4.547 < .05.
Summary Table 20 (p. 57) shows the mean of the presidents
group on item V-c was .88 and the mean of the deans group was
1.20; thus the data indicates that the deans perceive this
characteristic as significantly more deficient than did the
presidents on the same characteristic. Table 20 also indi
cates that two items approached significance: II-b
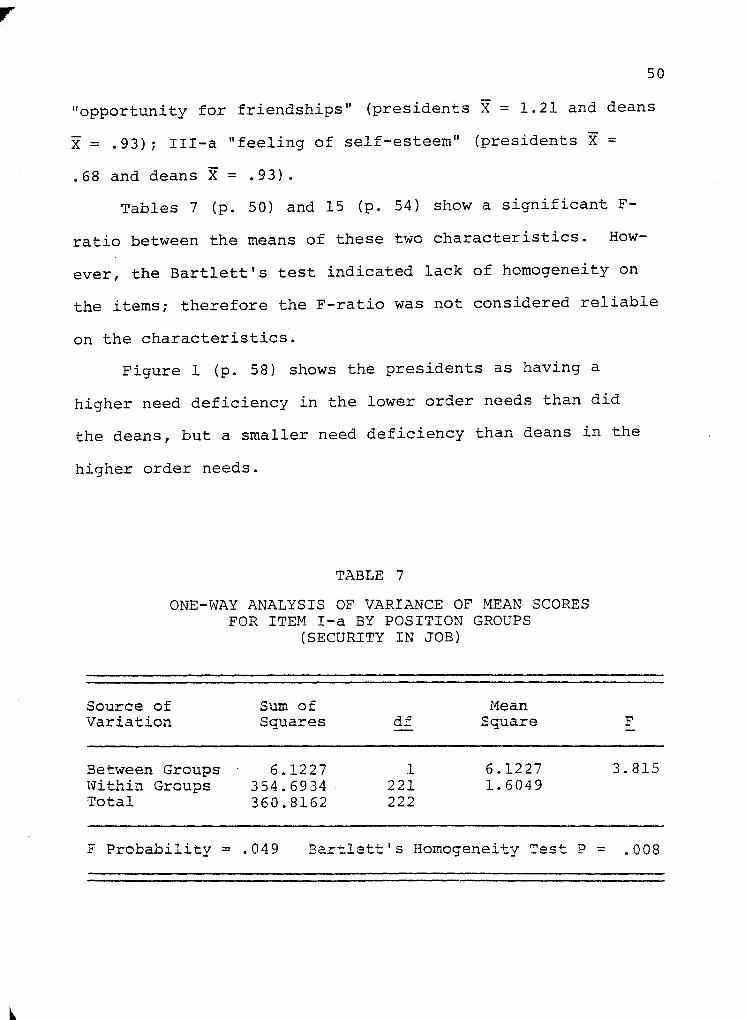
50
"opportunity for friendships" (presidents X = 1.21 and deans
X = .93); III-a "feeling of self-esteem" (presidents X =
.68 and deans X = .93).
Tables 7 (p. 50) and 15 (p. 54) show a significant F-
ratio between the means of these two characteristics. How-
ever, the Bartlett's test indicated lack of homogeneity on
the items; therefore the F-ratio was not considered reliable
on the characteristics.
Figure 1 (p. 58) shows the presidents as having a
higher need deficiency in the lower order needs than did
the deans, but a smaller need deficiency than deans in the
higher order needs.
TABLE 7
ONE-WAY ANALYSIS OF VARIANCE OF MEAN SCORES FOR ITEM I-a BY POSITION GROUPS
(SECURITY IN JOB)
Source of Sum of Mean Variation Squares df Square
Between Groups 6.1227 1 6.1227 Within Groups 354.6934 221 1.6049 Total 360.8162 222
F
3.815
F Probability = .049 Bartlett's Homogenei~y Test P = .008
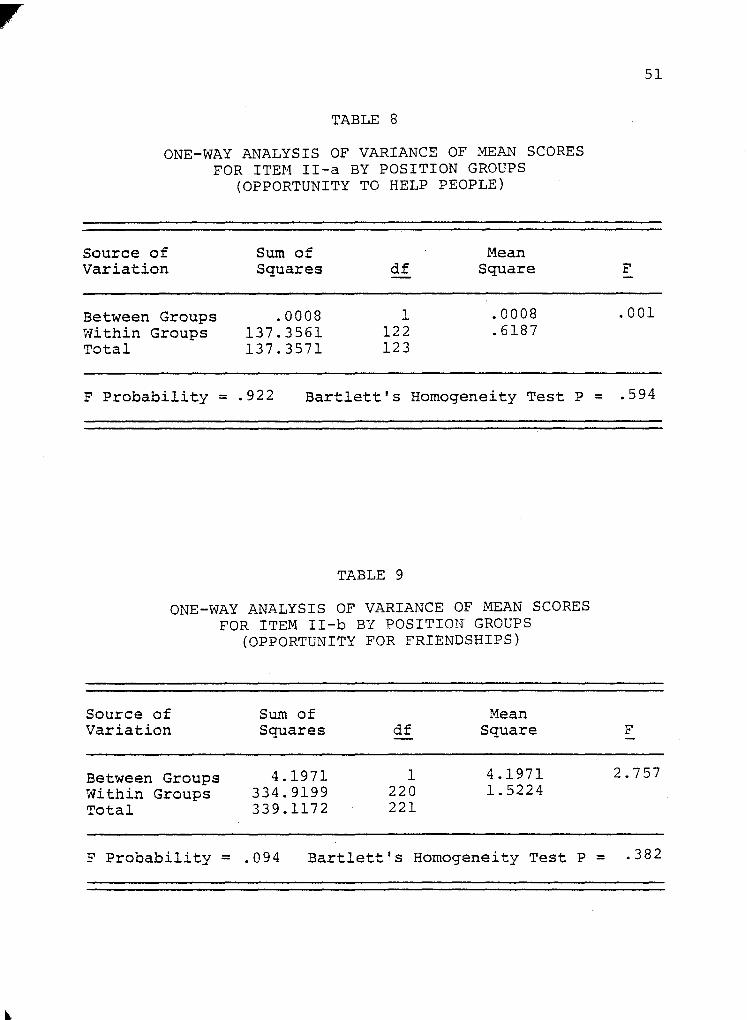
TABLE 8
ONE-WAY ANALYSIS OF VARIANCE OF ~EAN SCORES FOR ITE~1 II-a BY POSITION GROUPS
(OPPORTUNITY TO HELP PEOPLE)
Source of Sum of Mean Variation Squares df Square
Between Groups .0008 1 .0008 vli thin Groups 137.3561 122 .6187 Total 137.3571 123
F Probability = .922 Bartlett's Homogeneity Test P
TABLE 9
ONE-WAY ANALYSIS OF VARIANCE OF MEAN SCORES FOR ITEM II-b BY POSITION GROUPS
(OPPORTUNITY FOR FRIENDSHIPS)
Source of Sum of Mean Variation Squares df Square
Between Groups 4.1971 1 4.1971 Within Groups 334.9199 220 1.5224 Total 339.1172 221
F Probability = .094 Bartlett's Homogeneity Test P
51
F
.001
= .594
F
2.757
= .382

TABLE 10
ONE-WAY ANALYSIS OF VARIANCE OF MEAN SCORES FOR ITEM III-a BY POSITION GROUPS
(FEELING OF SELF-ESTEEM)
Source of Sum of ?1ean Variation Squares df Square
Between Groups 3.3499 1 3.3499 Within Groups 260.7397 221 1.1798 Total 264.0896 222
52
F
2.839
F Probability = .089 Bartlett's Homogeneity Test P = .583
TABLE 11
ONE-WAY ANALYSIS OF VARIANCE OF MEAN SCORES FOR ITEM III-b BY POSITION GROUPS (PRESTIGE INSIDE THE INSTITUTION)
Source of Sum of Mean Variation Squares df Square
Between Groups .0271 1 .0271 Within Groups 173.0225 220 .7865 Total 173.0496 221
F Probability = .831 Bartlett's Homogeneity Test P
F
.034
= .157
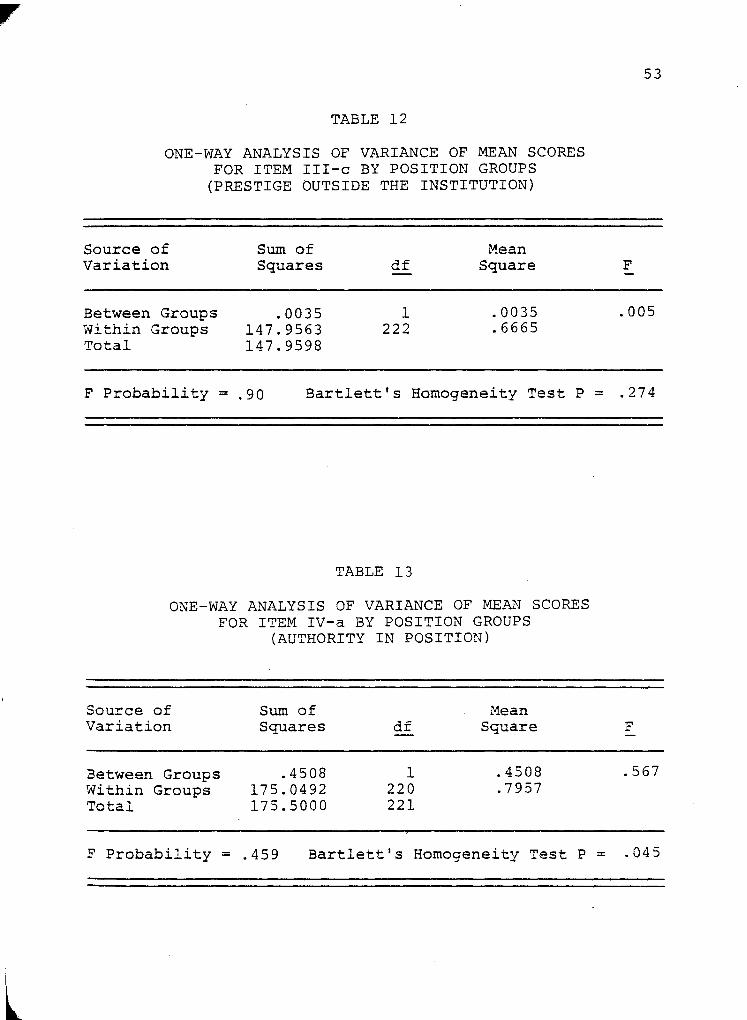
l
TABLE 12
ONE-WAY ANALYSIS OF VARIANCE OF MEAN SCORES FOR ITEM III-c BY POSITION GROUPS
(PRESTIGE OUTSIDE THE INSTITUTION)
Source of Sum of r-1ean Variation Squares df Square
Between Groups .0035 1 .0035 Within Groups 147.9563 222 .6665 Total 147.9598
F Probability = .90 Bartlett's Homogeneity Test P
TABLE 13
ONE-WAY ANALYSIS OF VARIANCE OF MEAN SCORES FOR ITEM IV-a BY POSITION GROUPS
(AUTHORITY IN POSITION)
Source of Sum of Mean Variation Squares df Square
Between Groups .4508 1 .4508 Within Groups 175.0492 220 .7957 Total 175.5000 221
F Probability = .459 Bartlett's Homogeneity Test P
53
F
.005
= .274
F
.567
= .045
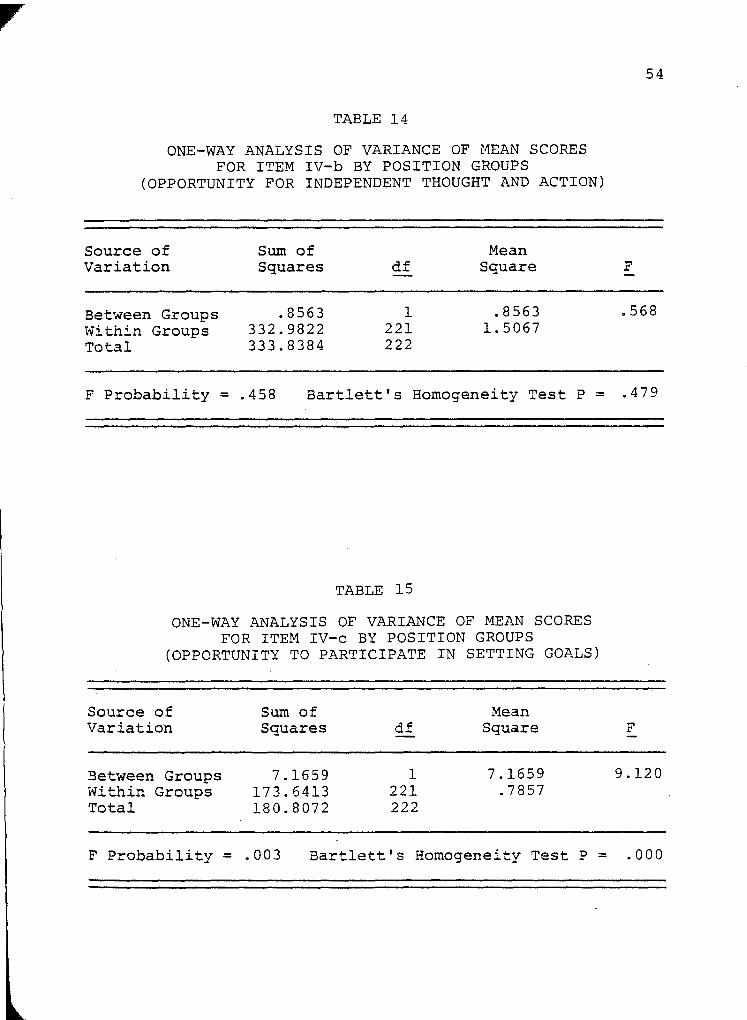
TABLE 14
ONE-WAY ANALYSIS OF VARIANCE OF !'lEAN SCORES FOR ITEM IV-b BY POSITION GROUPS
(OPPORTUNITY FOR INDEPENDENT THOUGHT AND ACTION)
Source of Sum of Hean Variation Squares df Square
Between Groups .8563 1 .8563 Within Groups 332.9822 221 1.5067 Total 333.8384 222
F Probability = .458 Bartlett's Homogeneity Test P =
TABLE 15
ONE-WAY ANALYSIS OF VARIANCE OF MEAN SCORES FOR ITEM IV-c BY POSITION GROUPS
(OPPORTUNITY TO PARTICIPATE IN SETTING GOALS)
Source of Sum of Mean Variation Squares df Square
Between Groups 7.1659 1 7.1659 Within Groups 173.6413 221 .7857 Total 180.8072 222
F Probability = .003 Bartlett's Homogeneity Test P =
54
F
.568
.479
F
9.120
.000
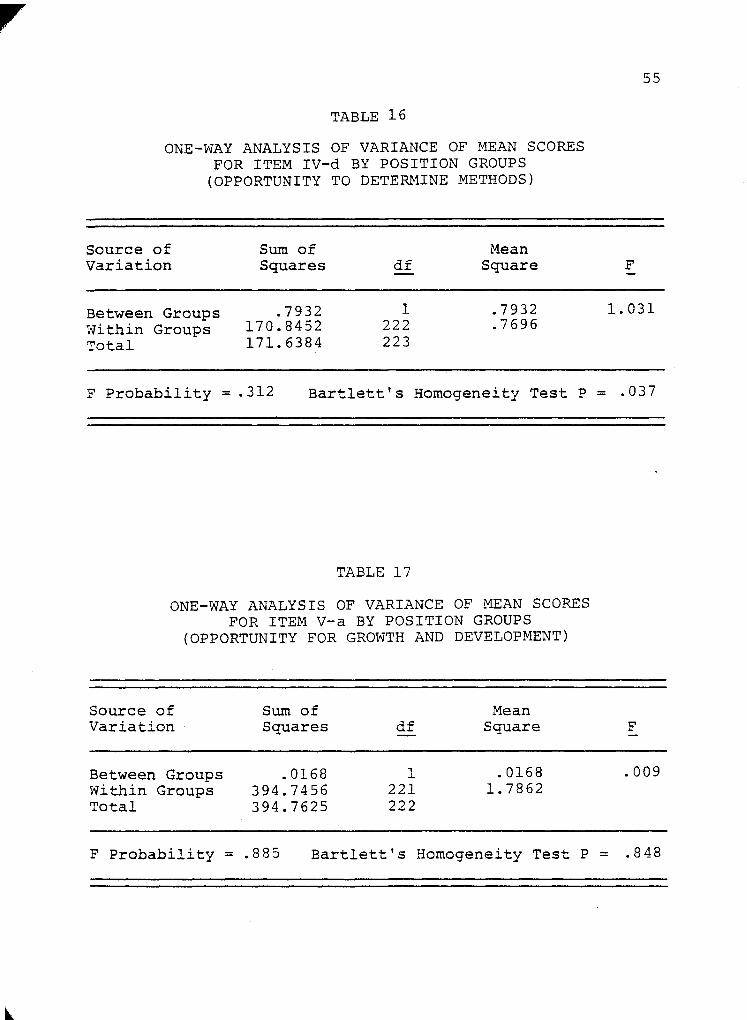
TABLE 16
ONE-WAY ANALYSIS OF VARIANCE OF MEAN SCORES FOR ITEM IV-d BY POSITION GROUPS
(OPPORTUNITY TO DETERMINE METHODS)
Source of Sum of Mean Variation Squares df Square
Between Groups .7932 1 .7932 Within Groups 170.8452 222 .7696 Total 171.6384 223
55
F
1.031
F Probability = .312 Bartlett's Homogeneity Test P = .037
TABLE 17
ONE-WAY ANALYSIS OF VARIANCE OF MEAN SCORES FOR ITEM V-a BY POSITION GROUPS
(OPPORTUNITY FOR GROWTH AND DEVELOPMENT)
Source of Sum of Mean Variation Squares df Square
Between Groups .0168 1 .0168 Within Groups 394.7456 221 1.7862 Total 394.7625 222
F Probability = .885 Bartlett's Homogeneity Test P
F
.009
= .848

,.
TABLE 18
ONE-WAY ANALYSIS OF VARIANCE OF MEAN SCORES FOR ITEM V-b BY POSITION GROUPS
(FEELING OF SELF-FULFILLMENT)
Source of Sum of Hean Variation Squares df Square
Between Groups 3.2415 1 3.2415 Within Groups 324.7410 222 1.4628 Total 327.9824 223
F Probability = .134 Bartlett's Homogeneity Test P
TABLE 19
ONE-WAY ANALYSIS OF VARIANCE OF M.EAN SCORES FOR ITEM V-c BY POSITION GROUPS
(FEELING OF ACCOMPLISHMENT)
Source of Sum of Mean Variation Squares df Square
Between Groups 5.7164 1 5.7164 Within Groups 277.8352 221 1.2572 Total 283.5515 222
56
F
2.216
= .544
F
4.547
F Probability = .032 Bartlett's Homogeneity Test P = .406

'TABLE 20
SUMMARY OF STATISTICAL FINDINGS FOP. VARIABLE ONE POSITION OF ADMINISTRATORS
57
Group 1 - Presidents (n - 108) Group 2 - Deans (n 116)
Group 1 Group 2 Need Categories and Items Mean Mean Significance
I. Security Needs
a. (security in job) 1. 02 .69 ns
II. Social Needs (.83 ) (.69)
a. (opportunity to help people) .44 .45 ns
b. (opportunity for friendships) 1. 21 .93 nsa
III. Esteem Needs (.58) (.65)
a. (feeling of self-esteem) .68 .93 ns a
b. (prestige inside institution) .56 .53 ns
c. (prestige outside institution) .49 .48 ns
IV. Autonomy Needs (.53) (.64 )
a. (authority in position) .45 .54 ns
b. (opportunity for independent 1. 03 .91 ns thought and action)
c. (opportunity to participate .25 .61 ns in setting goals)
d. (opportunity to participate .39 .51 ns in determining methods)
V. Self-Actualization Needs (1. 06) (1. 24)
a. (o?portuni ty for growth 1. 29 1. 27 ns and development)
b. (feeling of self-fulfillment) 1. 01 1. 25 TIS
c. (feeling of accomplishment) .88 1.20 .03
Note: The larger the mean, the less the need satisfaction.
ns means not significant at .05 level of significance as determined by ct one-way ANOVA (F probability).
ns a means not significant at .05 level but less than .10.

i Q.O r
I
~ til e.. H Z ::>
Cil ..:l ~ I u til
58
1.24 DEA.;'lS
g ''-; .jJ
LOWER ORDER HIGHER ORDER III OJ .... ,.., ro ::;
;:., ;:., .:.J .j.J e () .... ,.., e 0 ~ .. III tl) a I ::s ''-; III 0 44 () u .jJ ~ ..... Q) 0 Ul ::l (!)
en til Cil .::: til , I I I I
NEED CATEGORIES
FIGURE 1
~1EAN SCORES OF FERCEIVED DEFICIENCIES IN NEE!) CATEGORIES FOR POSITION GROUPS
PRESIDENTS
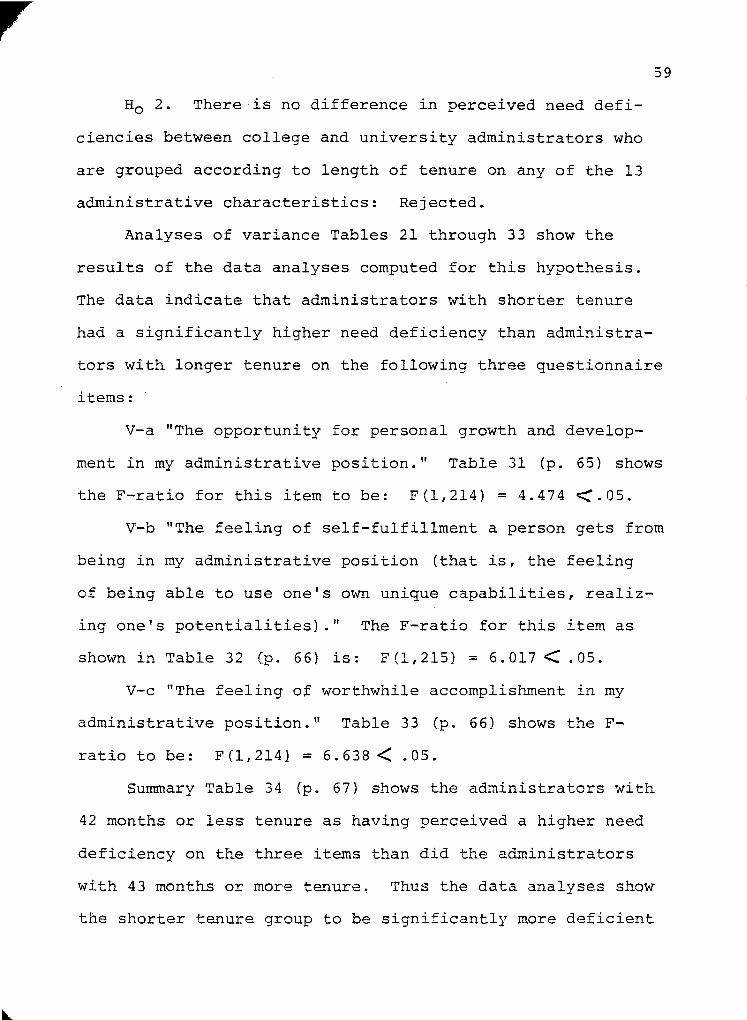
Ho 2. There is no difference in perceived need defi
ciencies between college and university administrators who
are grouped according to length of tenure on any of the 13
administrative charac.teristics: Rejected.
59
Analyses of variance Tables 21 through 33 show the
results of the data analyses computed for this hypothesis.
The data indicate that administrators with shorter tenure
had a significantly higher need deficiency than administra
tors with longer tenure on the following three questionnaire
items:
V-a "The opportunity for personal growth and develop
ment in my administrative position." Table 31 (p. 65) shows
the F-ratio for this item to be: F(1,214) = 4.474 ~.05.
V-b "The feeling of self-fulfillment a person gets from
being in my administrative position (that is, the feeling
of being able to use one's own unique capabilities, realiz
ing one's potentialities)." The F-ratio for this item as
shown in Table 32 (p. 66) is: F(1,215) = 6.017 < .05.
V-c "The feeling of worthwhile accomplishment in my
administrative position. II. Table 33 (p. 66) shows the F
ratio to be: F(1,214] = 6.638 < .05.
Summary Table 34 (p. 67) shows the administrators with
42 months or less tenure as having perceived a higher need
deficiency on the three items than did the administrators
with 43 months or more tenure. Thus the data analyses show
the shorter tenure group to be significantly more deficient

60
on the need fulfillment of these three characteristics than
were the longer tenured group. Item III-b approached sig-
nificance with opposite results. That is, administrators
with 43 months or more tenure had a mean of .63 on this item
and administrators with 42 months or less tenure had an
average of .42.
Figure 2 (p. 68) shows the low tenured group averaging
a higher need deficiency than the high tenured group in both
the lower order and higher order need areas.
TABLE 21
ONE-WAY ANALYSIS OF VARIANCE OF MEAN SCORES FOR ITEM I-a BY TENURE GROUPS
(SECURITY IN JOB)
Source of Sum of Mean Variation Squares df Square
Between Groups 3.4740 1 3.4740 Within Groups 339.1741 214 1.5849 Total 342.6479 215
F Probability = .136 Bartlett's Homogeneity Test P
F
2.192
= .724
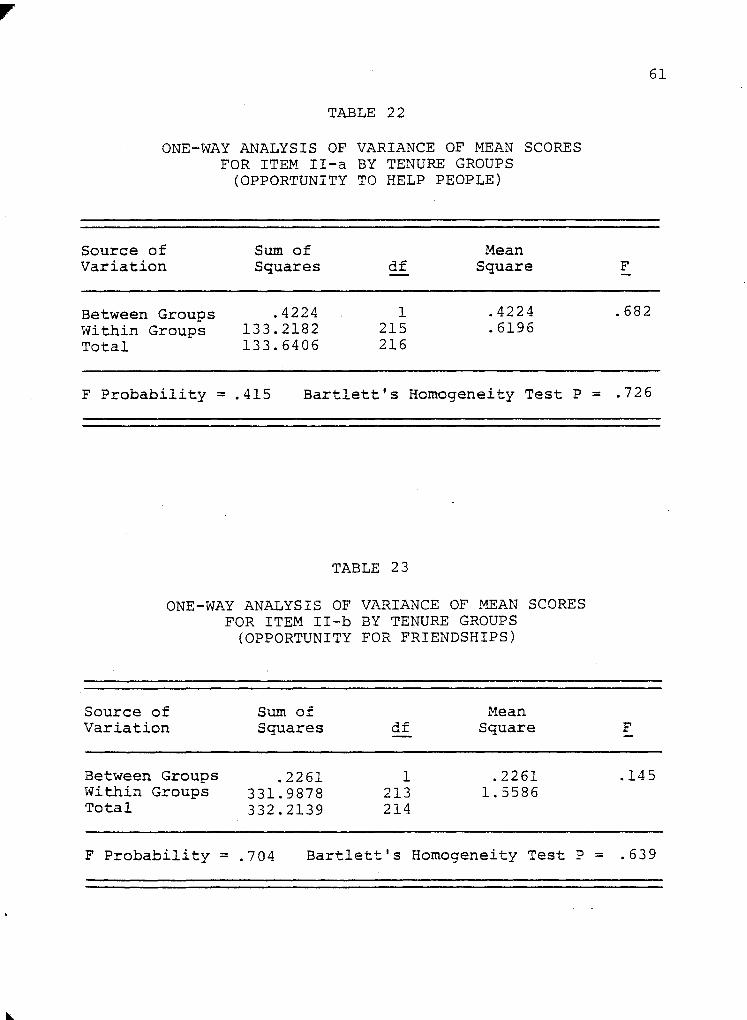
TABLE 22
ONE-WAY ANALYSIS OF VARIANCE OF MEAN SCORES FOR ITEM II-a BY TENURE GROUPS
(OPPORTUNITY TO HELP PEOPLE)
Source of Sum of !-lean Variation Squares df Square
Between Groups .4224 1 .4224 Within Groups 133.2182 215 .6196 Total 133.6406 216
F Probability = .415 Bartlett's Homogeneity Test P
TABLE 23
ONE-WAY ANALYSIS OF VARIANCE OF MEAN SCORES FOR ITEM II-b BY TENURE GROUPS
(OPPORTUNITY FOR FRIENDSHIPS)
Source of Sum of Mean Variation Squares df Square
Between Groups .2261 1 .2261 Within Groups 331.9878 213 1.5586 Total 332.2139 214
61
F
.682
= .726
F
.145
F Probability = .704 Bartlett's Homogeneity Test P = .639

TABLE 24
ONE-WAY ANALYSIS OF VARIANCE OF MEAN SCORES FOR ITEM III-a BY TENURE GROUPS
(FEELING OF SELF-ESTEEM)
Source of Sum of Mean Variation Squares df Square
Between Groups 1.3417 1 1.3417 Within Groups 257.0981 214 1.2014 Total 258.4397 215
F Probability = .292 Bartlett's Homogeneity Test P
TABLE 25
ONE-WAY ANALYSIS OF VARIANCE OF MEAN SCORES FOR ITEM III-b BY TENURE GROUPS
(PRESTIGE INSIDE THE INSTITUTION)
Source of Sunl of Mean Variation Squares df Square
Between Groups 2.2814 1 2.2814 Within Groups 168.8535 213 .7927 Total 171.1349 214
62
F
1.117
= .746
F
2.878
F Probability = .087 Bartlett's Homogeneity Test P = .209

TABLE 26
ONE-WAY ANALYSIS OF VARIANCE OF MEAN SCORES FOR ITEM III-c BY TENURE GROUPS
(PRESTIGE OUTSIDE THE INSTITUTION)
Source of Sum of !1ean Variation Squares df Square
Between Groups .0188 1 .0188 Within Groups 146.2208 215 .6801 Total 146.2396 216
F Probability = .843 Bartlett's Homogeneity Test P
TABLE 27
ONE-WAY ANALYSIS OF VARIANCE OF ~ffiAN SCORES FOR ITEM IV-a BY TENURE GROUPS
(AUTHORITY IN POSITION)
Source of Sum of Mean Variation Squares df Square
Between Groups 1.3607 1 1.3607 Within Groups 170.3881 213 .7999 Total 171.7488 214
F Probability = .190 Bartlett's Homogeneity Test P
63
F
.028
= .510
F
1.701
= .045

TABLE 28
ONE-WAY ANALYSIS OF VARIANCE OF MEAN SCORES FOR ITEM IV-b BY TENURE GROUPS
(OPPORTUNITY FOR INDEPENDENT THOUGHT AND ACTION)
Source of Sum of Mean Variation Squares df Square
Between Groups 1.3597 1 1.3597 Within Groups 325.2651 214 1.5199 Total 326.6250 215
F Probability = .348 Bartlett's Homogeneity Test P =
TABLE 29
ONE-WAY ANALYSIS OF VARIANCE OF HEAN SCORES FOR ITEM IV-c BY TENURE GROUPS
(OPPORTUNITY TO PARTICIPATE IN SETTING GOALS)
Source of Sum of Mean Variation Squares df Square
Between Groups 1.3353 1 1.3353 Within Groups 175.8823 214 .8219 Total 177.2176 215
F Probability = .201 Bartlett's Homogeneity Test P =
64
F
.895
.130
F
1.625
.077

I
L
TABLE 30
ONE-WAY ANALYSIS OF VARIANCE OF MEAN SCORES FOR ITEM IV-d BY TENURE GROUPS
(OPPORTUNITY TO DETERMINE METHODS)
Source of Sum of Mean Variation Squares df Square
Between Groups .7642 1 .7642 Within Groups 167.2266 215 .7778 Total 167.9908 216
F Probability = .324 Bartlett's Homogeneity Test P
TABLE 31
ONE-WAY ANALYSIS OF VARIANCE OF MEAN SCORES FOR ITEM V-a BY TENURE GROUPS
(OPPORTUNITY FOR GROWTH AND DEVELOPMENT)
Source of Sum of Mean Variation Squares df Square
Between Groups 7.9905 1 7.9905 Within Groups 382.2134 214 1.7860 Total 390.2039 215
F Probability = .034 Bartlett's Homogeneity Test P
65
F
.982
= .075
F
4.474
= .706

TABLE 32
ONE-WAY ANALYSIS OF VARIANCE OF MEAN SCORES FOR ITEM V-b BY TENURE GROUPS (FEELING OF SELF-FULFILLMENT)
Source of Sum of ~1ean
Variation Squares df Squa,re
Between Groups 8.6333 1 8.6333 Within Groups 308.4912 215 1.4348 Total 317.1245 216
F Probability = .014 Bartlett's Homogeneity Test P
TABLE 33
ONE-WAY ANALYSIS OF VARIANCE OF HEAN SCORES FOR ITEM V-c BY TENURE GROUPS
(FEELING OF ACCOMPLISHMENT)
Source of Sum of Mean Variation Squares df Square
Between Groups 8.3705 1 8.3705 Within Groups 269.8472 214 1.2610 Total 278.2175 215
66
F
6.017
= .178
F
6.638
F Probability = .010 Bartlett's Homogeneity Test P = .069
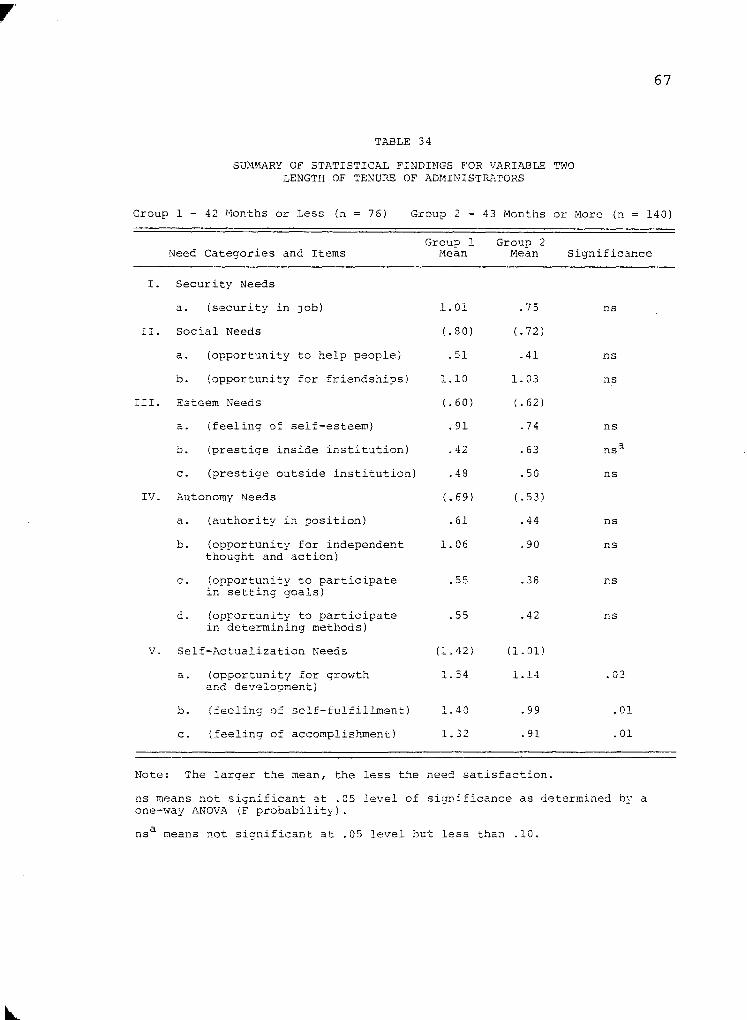
TABLE 34
SUMMARY OF STATISTICAL FINDINGS FOR VARLu.BLE TWO LENGTH OF TENURE OF ADMINIST~u.TORS
Group 1 - 42 Months or Less (n 76) Group 2 43 Mon~hs or More (n
67
140)
Need Categories and Items Group 1
Mean Group 2
Mean Significance
I. Security Needs
a. (security in job) 1. OJ.. .75 ns
II. Social Needs (.80) (.72 )
a. (opportunity to help people) .51 .41 ns
b. (opportunity for friendships) 1.10 1. 03 ns
III. Esteem Needs (.60) (.62)
a. (feeling of self-esteem) .91 .74 ns
b. (prestige inside institution) .42 .63
c. (prestige outside institution) .48 .50 ns
IV. Autonomy Needs (.69) (.53)
a. (authority in position) .61 .44 ns
b. (opportunity for independent 1. 06 .90 ns thought and action)
c. (opportunity to participate .55 .38 ns in setting goals)
d. (opportuni ty to participate .55 .42 ns in determining methods)
V. Self-Actualization Needs (I. 42) (1. 01)
a. (opportunity for growth 1. 54 1.14 .03 and development)
b. (feeling of self-fulfillment) 1. 40 .99 .01
c. (feeling of accomplishment) 1. 32 .91 .01
Note: The larger the mean, the less the need satisfaction.
ns means not significant at .05 level of significance as determined by a one-,,,ay ANOVA (F probability).
nsa means not significant at .05 level but less than .10.

2.0 I
1. 42
- --.60 .53
§ LOWER ORDER
0";
HIGHER ORDER +' III N
0.., ...; III ::!
:>, ... I:
I: u 0 ..:
Ql c: I Ql 0 '+4 .iJ .iJ ...; Ul ::! Ql "-l ..: Cf.l
NEED CATEGORIES
FIGURE 2
MR;N SCORES OF PERCEIVED DEFICIENCIES IN NEED CATEGORIES FOR TENURE GROUPS
LOW TENURE
There is no difference in perceived need defi-
ciencies between college and university administrators who
68
are grouped according to age on any of the 13 administrative
characteristics: Confirmed.
ANOVA Tables 35 through 47 show the summaries of the
13 one-way analyses of variance that were computed in test-
ing this null hypothesis. No significant differences \'lere

69
found between the three age groups of administrators on any
of the 13 job characteristics; the null hypothesis is
accepted.
In reviewing summary Table 48 (p. 76) it can be observed
that there are no distinguishable patterns of differences
between the means of the three age groups. It should be
noted that in six of the one-way analyses of variance, the
Bartlett's test showed that the variance was not homogeneous
among the age groups.
Figure 3 (p. 77) shows the mean scores of perceived
deficiencies in need categories for the age groups.
TABLE 35
ONE-WAY ANALYSIS OF VARIANCE OF HEAN SCORES FOR ITEH I-a BY AGE GROUPS
(SECURITY IN JOB)
Source of Sum of Mean Variation Squares df Square
Between Groups 3.3716 2 1.6858 Within Groups 334.4993 214 1.5631 Total 337.8708 216
F Probability = .343 Bartlett's Homogeneity Test P
F
1. 079
= .007

TABLE 36
ONE-WAY ANALYSIS OF VARIANCE OF MEAN SCORES FOR ITEM II-a BY AGE GROUPS
(OPPORTUNITY TO HELP PEOPLE)
Source of Sum of Hean Variation Squares df Square
Between Groups 1.3173 2 .6587 Within Groups 126.2836 215 .5874 Total 127.6009 217
F Probability = .328 Bartlett's Homogeneity Test P
TABLE 37
ONE-WAY ANALYSIS OF VARIANCE OF MEAN SCORES FOR ITEM II-b BY AGE GROUPS
(OPPORTUNITY FOR FRIENDSHIPS)
Source of Sum of !-lean Variation Squares df Square
Between Groups 1.0166 2 .5083 Within Groups 315.8677 213 1.4829 Total 316.8843 215
F Probability = .715 Bartlett's Homogeneity Test P
70
F
1.121
= .004
F
.343
= .638

TABLE 38
ONE-WAY ANALYSIS OF VARIANCE OF MEAN SCORES FOR ITEM III-a BY AGE GROUPS
(FEELING OF SELF-ESTEEM)
Source of Sum of Mean Variation Squares df Square
Between Groups .0669 2 .0334 Within Groups 254.4124 214 1.1888 Total 254.4793 216
F Probability = .960 Bartlett's Homogeneity Test P
TABLE 39
ONE-WAY ANALYSIS OF VARIANCE OF MEAN SCORES FOR ITEM III-b BY AGE GROUPS
(PRESTIGE INSIDE THE INSTITUTION)
Source of Sum of Mean Variation Squares df Square
Between Groups .7203 2 .3601 Within Groups 170.8168 213 .8020 Total 171. 5370 215
71
F
.028
= .163
F
.449
F Probability = .645 Bartlett's Homogeneity Test P = .961
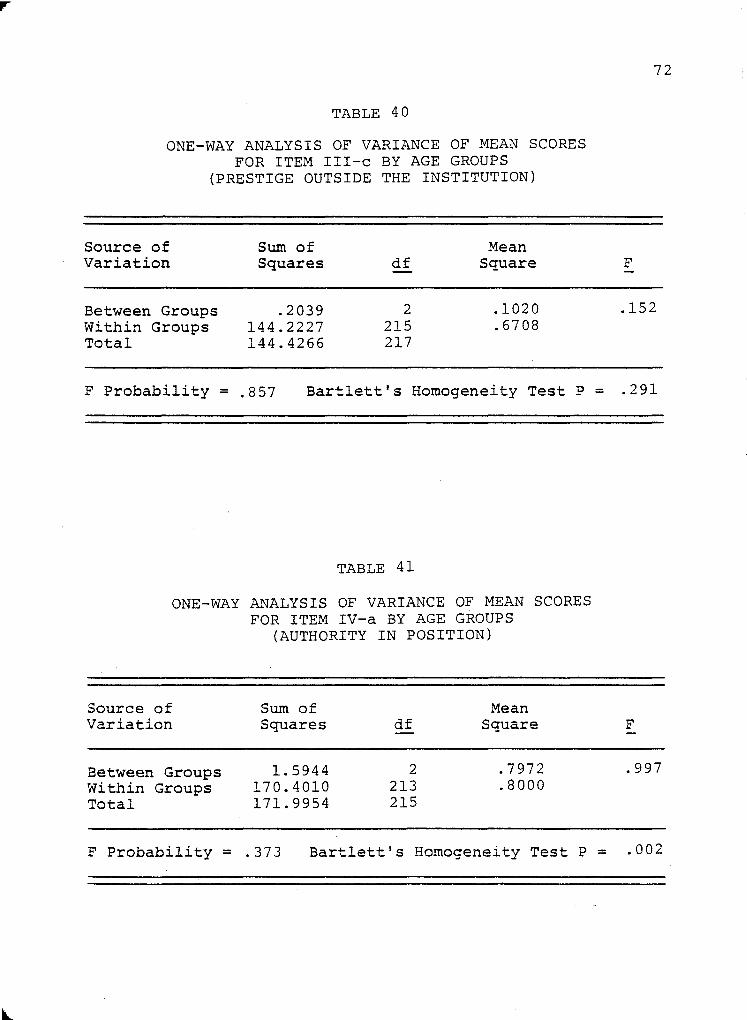
TABLE 40
ONE-WAY ANALYSIS OF VARIANCE OF MEAN SCORES FOR ITEM III-c BY AGE GROUPS
(PRESTIGE OUTSIDE THE INSTITUTION)
Source of Sum of Mean Variation Squares df Square
Between Groups .2039 2 .1020 Within Groups 144.2227 215 .6708 Total 144.4266 217
F Probability = .857 Bartlett's Homogeneity Test P
TABLE 41
ONE-WAY ANALYSIS OF VARIANCE OF MEAN SCORES FOR ITEM IV-a BY AGE GROUPS
(AUTHORITY IN POSITION)
Source of Sum of Mean Variation Squares df Square
Between Groups 1. 5944 2 .7972 Within Groups 170.4010 213 .8000 Total 171.9954 215
72
F
.152
= .291
F
.997
F Probability = .373 Bartlett's Homogeneity Test P = .002

TABLE 42
ONE-WAY ANALYSIS OF VARIANCE OF r'1EAN SCORES FOR ITEM IV-b BY AGE GROUPS
(OPPORTUNITY FOR INDEPENDENT THOUGHT AND ACTION)
Source of Sum of Mean Variation Squares df Square
Between Groups 4.7381 2 2.3690 Within Groups 308.8010 214 1.4430 Total 313.5391 216
F Probability = .194 Bartlett's Homogeneity Test P
TABLE 43
ONE-WAY ANALYSIS OF VARIANCE OF MEAN SCORES FOR ITEH IV-c BY AGE GROUPS
(OPPORTUNITY TO PARTICIPATE IN SETTING GOALS)
Source of Sum of Mean Variation Squares df Square
Between Groups .7878 2 .3939 Within Groups 167.8850 214 .7845 Total 168.6728 216
=
73
F
1.642
.039
F
.502
F Probability = .612 Bartlett's Homogeneity Test P = .738
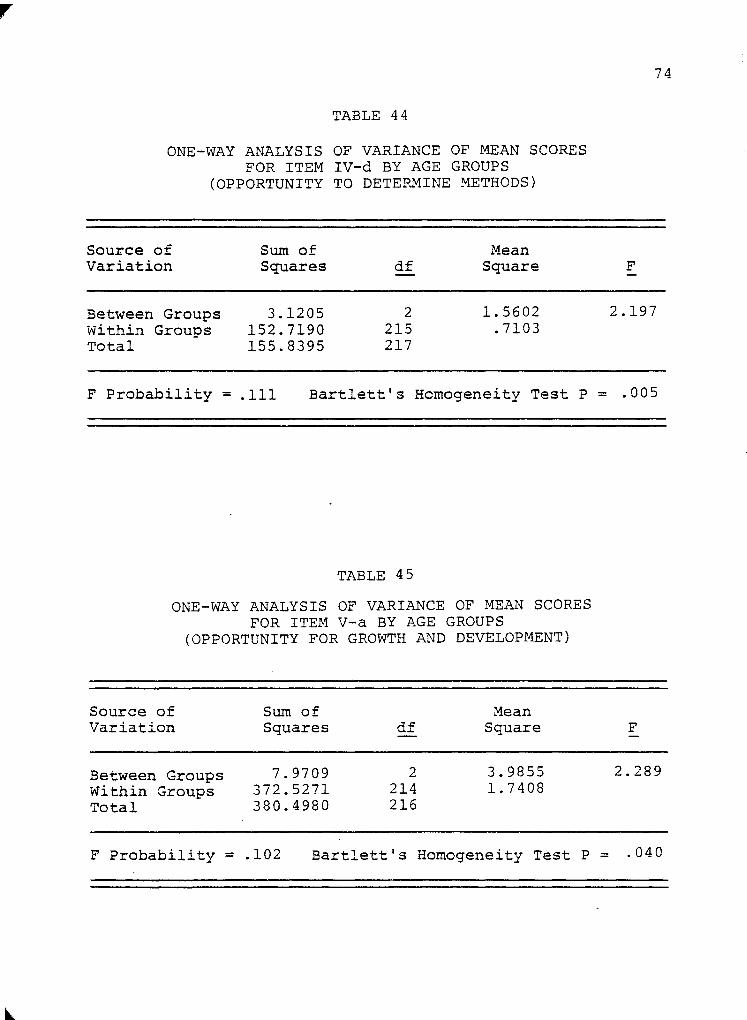
TABLE 44
ONE-WAY ANALYSIS OF VARIANCE OF MEAN SCORES FOR ITEM IV-d BY AGE GROUPS
(OPPORTUNITY TO DETERMINE METHODS)
Source of Sum of Mean Variation Squares df Square
Between Groups 3.1205 2 1.5602 Within Groups 152.7190 215 .7103 Total 155.8395 217
F Probability = .111 Bartlett's Homogeneity Test P
TABLE 45
ONE-WAY ANALYSIS OF VARIANCE OF MEAN SCORES FOR ITEM V-a BY AGE GROUPS
(OPPORTUNITY FOR GROWTH AND DEVELOPMENT)
Source of Sum of Mean Variation Squares df Square
Between Groups 7.9709 2 3.9855 Within Groups 372.5271 214 1.7408 Total 380.4980 216
74
F
2.197
= .005
F
2.289
F Probability = .102 Bartlett's Homogeneity Test P = .040

TABLE 46
ONE-WAY ANALYSIS OF VARIANCE OF MEAN SCORES FOR ITEM V-b BY AGE GROUPS
(FEELING OF SELF-FULFILll1ENT)
Source of Sum of Mean Variation Squares df Square
Between Groups .5342 2 .2671 Within Groups 305.5991 215 1.4214 Total 306.1333 217
F Probability = .829 Bartlett's Homogeneity Test P
TABLE 47
ONE-WAY ANALYSIS OF VARIANCE OF MEAN SCORES FOR ITEM V-c BY AGE GROUPS (FEELING OF ACCOMPLISHMENT)
Source of Sum of Mean Variation Squares df Square
Between Groups 2.6961 2 1.3481 Within Groups 267.0088 214 1.2477 Total 269.7051 216
75
F
.188
= .747
F
1.080
F Probability = .342 Bartlett's Homogeneity Test P = .442

TABLE 48
SUMMARY OF STATISTICAL FINDINGS FOR VARIABLE THREE AGE OF ADHINISTRATORS
Group 1 - 25-44 (72) Group 2 - 45-54 (91) Group 3 - 55 Over (55)
76
Group 1 Group 2 Group 3 Signifi-Need Categories and Items
I. Security Needs
a. (security in job)
II. Social Needs
a. (opportunity to help people)
b. (opportunity for friendships)
III. Esteem Needs
a .. (authority in position)
b. (prestige inside institution)
c. (prestige outside institution)
IV. Autonomy Needs
a.
b.
d.
(authority in position)
(opportunity for independent thought and action)
(opportunity to participate in setting goals)
(opportunity to participate in determining methods)
V. Self-Actualization Needs
a. (opportunity for growth and development)
b. (feeling of self-fulfillment)
c. (feeling of accomplishment)
Hean Mean Mean cance
.90 .86 .59 ns
(.71) (.88) (.64)
.37 .52 .36 ns
1. 04 1. 08 .91 !1S
(.58) (.63) (.61)
.79 .82 .78 ns
.47 .61 .55 TIS
.48 .45 .52 ns
(.44 ) (.62) (.68 )
.40 .49 .63 ns
.75 1. 02 1.11 ns
.33 .47 .43 ns
.28 .51 .56 ns
(1.11) (.91) (1. 00)
1. 24 .46 .98 ns
1.18 1.10 1. 05 ns
.91 1.16 .98 TIS
Note: The larger the mean, the less the need satisfaction.
ns means not significant at .05 level of significance as determined by a one-way ANOVA (F probability).

0.0 I > til ....
H Z !:l
....
...:I ..:; U til
1.11
.86·:~-- ___ :~8 ;/ . .-. :-;~ 1.00 ----...:7'):"--- 68 .. - -' .91 . - - 63 • - ..., ---_.::-------: _ .. -' .,' .- .. -~. -. .. -~:-- ..... ....:.----., .59 .64 ----.~
.58 • . 44
s:: 0
-.-I .jJ
I,OWER ORDER HIGHER ORDER III N
-.-I o-i III ::l
>. >. .jJ .jJ = U • .-1 o-i = 0 ..:;
1-1 III Q) C I ::I • .-1 (J) 0 .... u u .jJ .jJ ,...; Q) 0 !Il ::I (J)
til til .... ..:; til
NEED CATEGORIES
FIGURE 3
MEA..~ SCORES OF PERCEIVED DEFICIENCIES IN NEED CATEGORIES FOR AGE GRotJPS
77
25 - 44 55 Over 45 - 54

HO 4. There is no difference in perceived need defi
ciencies between college and university administrators who
are grouped according to educational preparation on any of
the 13 administrative characteristics: Rejected.
78
As reported in data analyses Tables 49 through 61,
administrators who have earned doctor's degrees were found
to have a significantly higher perceived need deficiency in
their responses to three job characteristics than do admin
istrators with master's degrees on the same characteristics.
The characteristics are:
IV-b "The opportunity for independent thought and
action in my administrative position." As shown in Table 56
(p. 83), the F-ratio for this item is: F(1,202) = 4.279 < .05.
V-a "The opportunity for personal growth and develop
ment in my administrative position." Table 59 (p. 84) shows
the data of the F-ratio for this characteristic as:
F(1,202) = 6.731 < .05.
V-b "The feeling of self-fulfillment a person gets from
being in my administrative position (that is, the feeling of
being able to use one's own unique capabilities, realizing
one's potentialities). Table 60 (p. 85) shows the F-ratio
to be: F(1,203) = 3.674 < .05.
Summary Table 62 (p. 86) shows the mean of the adminis
trators with doctor's degree to be consistently higher on all
13 items than administrators with master's degrees.
Figure 4 (po 87) shows the mean deficiencies of

79
administrators grouped according to educational preparation
in the need categories. It can be seen that the discrep-
ancies between the two groups is fairly symmetrical with
reference to the lower order and higher order needs.
TABLE 49
ONE-WAY ANALYSIS OF VARIANCE OF MEAN SCORES FOR ITEM I-a BY EDUCATIONAL PREPARATION GROUPS
(SECURITY IN JOB)
Source of Sum of Mean Variation Squares df Square
Between Groups .6443 1 .6443 Within Groups 307.6448 202 1.5230 Total 308.2891 203
F Probability = .524 Bartlett's Homogeneity Test P
F
.423
= .686
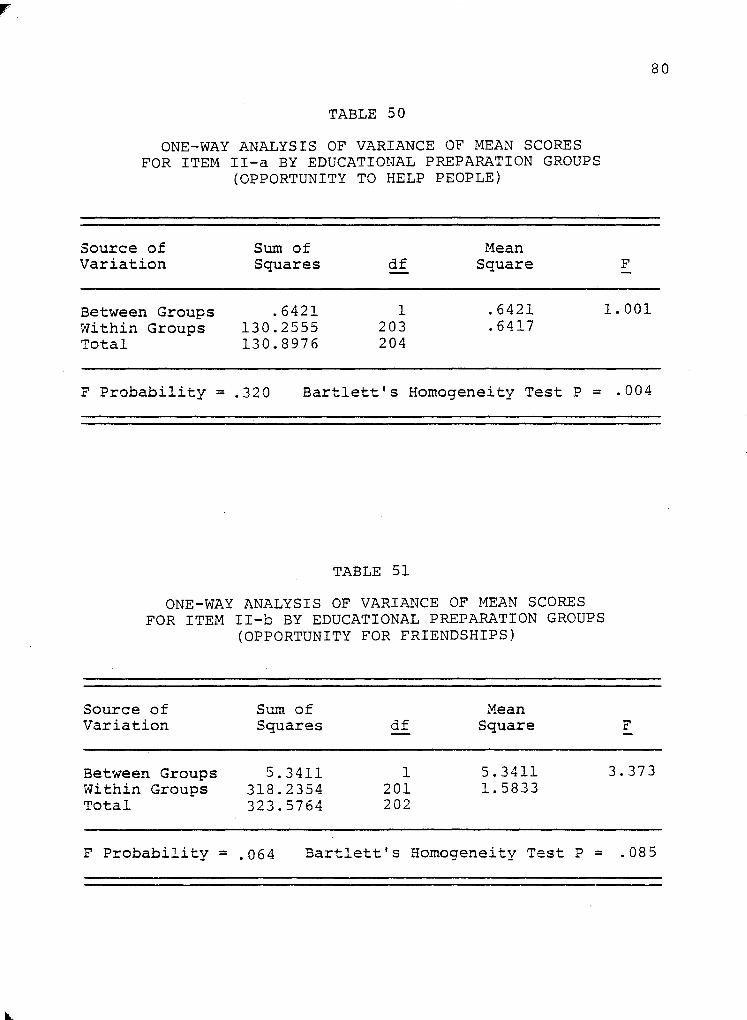
TABLE 50
ONE-WAY ANALYSIS OF VARIANCE OF ~mAN SCORES FOR ITEM II-a BY EDUCATIONAL PREPARATION GROUPS
(OPPORTUNITY TO HELP PEOPLE)
Source of Sum of Hean Variation Squares df Square
80
F
Between Groups .6421 1 .6421 1.001 Within Groups 130.2555 203 .6417 Total 130.8976 204
F Probability = .320 Bartlett's Homogeneity Test P =
TABLE 51
ONE-WAY ANALYSIS OF VARIANCE OF MEAN SCORES FOR ITEM II-b BY EDUCATIONAL PREPARATION GROUPS
(OPPORTUNITY FOR FRIENDSHIPS)
Source of Sum of Mean Variation Squares df Square
Bet<,.;een Groups 5.3411 1 5.3411 Within Groups 318.2354 201 1.5833 Total 323.5764 202
F Probability = .064 Bartlett's Homogeneity Test P =
.004
F
3.373
.085

TABLE 52
ONE-WAY ANALYSIS OF VARIANCE OF MEAN SCORES FOR ITE1-1 III-a BY EDUCATIONAL PREPARATION GROUPS
(FEELING OF SELF-ESTEEM)
Source of Sum of Hean Variation Squares df Square
Between Groups .0988 1 .0988 Within Groups 226.1904 202 1.1198 Total 226.2892 203
F Probability = .760 Bartlett's Homogeneity Test P =
TABLE 53
ONE-WAY ANALYSIS OF VARIANCE OF MEAN SCORES FOR ITEM III-b BY EDUCATIONAL PREPARATION GROUPS
(PRESTIGE INSIDE THE INSTITUTION)
Source of Sum of Mean Variation Squares df Square
Between Groups 1.5692 1 1.5692 Within Groups 162.8377 202 .8061 Total 164.4069 203
81
F
.088
.264
F
1.947
F Probability = .161 Bartlett's Homogeneity Test P = .257

, TABLE 52
ONE-WAY ANALYSIS OF VARIANCE OF MEAN SCORES FOR ITEM III-a BY EDUCATIONAL PREPARATION GROUPS
(FEELING OF SELF-ESTEEM)
Source of Sum of !-1ean Variation Squares df Square
Between Groups .0988 1 .0988 Within Groups 226 .. 1904 202 1.1198 Total 226.2892 203
F Probability = .760 Bartlett's Homogeneity Test P =
TABLE 53
ONE-WAY ANALYSIS OF VARIANCE OF MEAN SCORES FOR ITEM III-b BY EDUCATIONAL PREPARATION GROUPS
(PRESTIGE INSIDE THE INSTITUTION)
Source of Sum of Mean Variation Squares df Square
Between Groups 1.5692 1 1.5692 Within Groups 162.8377 202 .8061 Total 164.4069 203
F Probability = .161 Bartlett's Homogeneity Test P =
81
F
.088
.264
F
1.947
.257

r
TABLE 54
ONE-WAY ANALYSIS OF VARIANCE OF MEAN SCORES FOR ITEM III-c BY EDUCATIONAL PREPARATION GROUPS
(PRESTIGE OUTSIDE THE INSTITUTION)
Source of Sum of Mean Variation Squares df Square
82
F
Between Groups 1.9719 1 1.9719 2.834 Within Groups 141.2671 203 .6959 Total 143.2390 204 .
F Probability = .090 Bartlett's Homogeneity Test P =
TABLE 55
ONE-WAY ANALYSIS OF VARIANCE OF !'-1EAN SCORES FOR ITEM IV-a BY EDUCATIONAL PREPARATION GROUPS
(AUTHORITY IN POSITION)
Source of Sum of Mean Variation Squares df Square
Between Groups 1.1792 1 1.1792 Within Groups 161.5696 201 .8038 Total 162.7488 202
.279
F
1.467
F Probability = .225 Bartlett's Homogeneity Test P = .033

r
TABLE 56
ONE-WAY ANALYSIS OF VARIANCE OF MEAN SCORES FOR ITEM IV-b BY EDUCATIONAL PREPARATION GROUPS
(OPPORTUNITY FOR INDEPENDENT THOUGHT AND ACTION)
Source of Sum of Mean Variation Squares df Square
83
F
Between Groups 6.6089 1 6.6089 4.279 Within Groups 311.9939 202 1.5445 Total 318.6028 203
F Probability = .038 Bartlett's Homogeneity Test P =
TABLE 57
ONE-WAY ANALYSIS OF VARIANCE OF HE AN SCORES FOR ITEM IV-c BY EDUCATIONAL PREPARATION GROUPS
(OPPORTUNITY TO PARTICIPATE IN SETTING GOALS)
Source of Sum of Mean Variation Squares df Square
Between Groups 2.8707 1 2.8707 Within Groups 171.7322 202 .8502 Total 174.6030 203
.. 198
F
3.377
F Probability = .064 Bartlett's Homogeneity Test P = .000
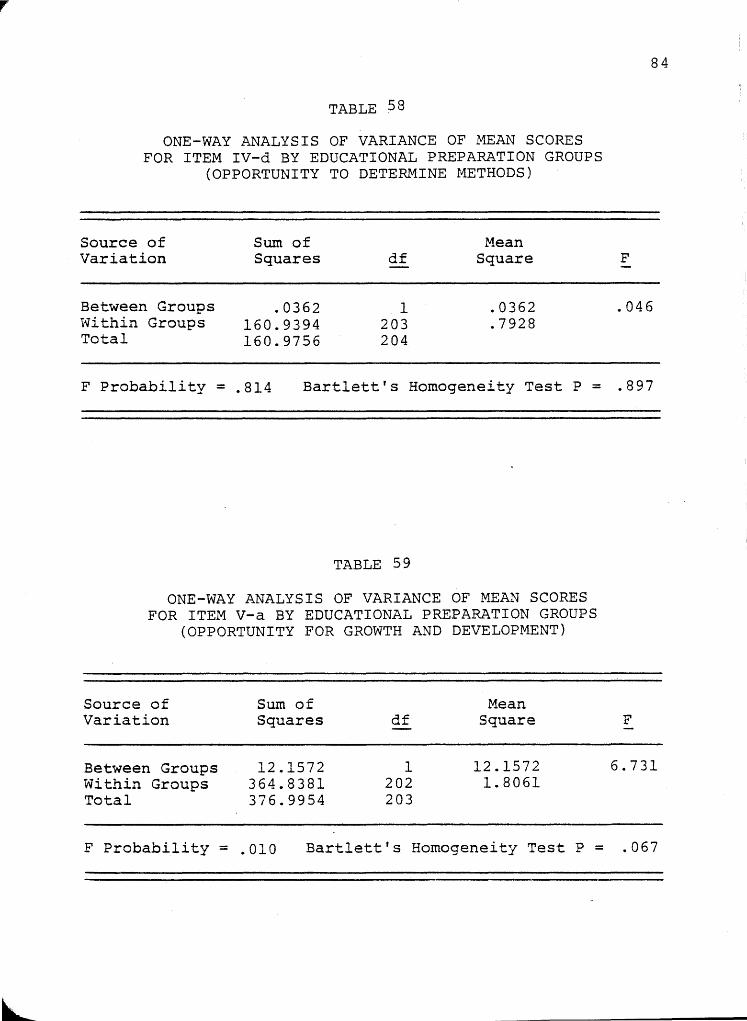
r
TABLE ;58
ONE-WAY ANALYSIS OF VARIANCE OF MEAN SCORES FOR ITEM IV-d BY EDUCATIONAL PREPARATION GROUPS
(OPPORTUNITY TO DETERMINE METHODS)
Source of Sum of Mean Variation Squares df Square
Between Groups .0362 1 .0362 Within Groups 160.9394 203 .7928 Total 160.9756 204
F Probability = .814 Bartlett's Homogeneity Test P =
TABLE 59
ONE-WAY ANALYSIS OF VARIANCE OF MEAN SCORES FOR ITEM V-a BY EDUCATIONAL PREPARATION GROUPS
(OPPORTUNITY FOR GROWTH AND DEVELOPMENT)
Source of Sum of Mean Variation Squares df Square
Between Groups 12.1572 1 12.1572 Within Groups 364.8381 202 1.8061 Total 376.9954 203
84
F
.046
.897
F
6.731
F Probability = .010 Bartlett's Homogeneity Test P = .067

TABLE 60
ONE-WAY ANALYSIS OF VARIANCE OF MEAN SCORES FOR ITEM V-b BY EDUCATIONAL PREPARATION GROUPS
(FEELING OF SELF-FULFILLMENT)
Source of Sum of Mean Variation Squares df Square
Between Groups 5.3853 1 5.3853 Within Groups 297.5710 203 1.4659 Total 302.9563 204
F Probability = .054 Bartlett's Homogeneity Test P
TABLE 61
=
ONE-WAY ANALYSIS OF VARIANCE OF MEAN SCORES FOR ITEM V-c BY EDUCATIONAL PREPARATION GROUPS
(FEELING OF ACCO~1PLISH!'1ENT)
Source of Sum of Mean Variation Squares df Square
Between Groups 2.6079 1 2.6079 Within Groups· 266.1372 202 1.3175 Total 268.7451 203
85
F
3.674
.198
F
1.979
F Probability = .157 Bartlett's Homogeneity Test P = .519

TABLE 62
SUMMARY OF STATISTICAL FINDINGS FOR VARIABLE FOUR EDUCATIONAL PREPARATION OF ADMINISTRATORS
Group 1 - Master's Degree (n 50) Group 2 - Doctor's Degree (n 155)
Need Categories and Items Group 1
Mean Group 2
Mean. Significance
I. Security Needs
a. (security in job)
II. Social Needs
a. (opportunity to help people)
b. (opportunity for friendships)
III. Esteem Needs
a. (feeling of self-esteem)
b. (prestige inside institution)
c. (prestige outside institution)
IV. Autonomy Needs
a. (authority in position)
b. (opportunity for independent thought and action)
c. (opportunity to participate in setting goals)
d. (opportunity to participate in determining methods)
V. Self-Actualization Needs
a. (opportunity for growth and development)
b. (feeling of self-fulfillment)
c. (feeling of accomplishment)
.72
(.58)
.36
.80
(.62)
.78
.40
.68
(.42)
.36
.64
.24
.44
(1. 89)
.90
.90
.88
.85
(.84)
.50
1.18
(.63)
.83
.60
.45
(.65)
.55
1. 06
.52
.47
(1. 27)
1. 46
1. 28
1. 08
Note: The larger the mean, the less the need satisfaction.
ns
ns
ns
ns
ns
.04
ns
ns
.01
.05
ns
ns means not significant at .05 level of significance as determined by a one-way ANOVA (F probability).
ns a means not significant at .05 level but less than .10.
86

I 2.0 I
1.0
0.0
1.27 DOCTORS
,., .85 84 .... / •
.--------..:.,-___ ".63 .65/ .... ' /.89 .72 ______ . -----:~----. /
.58 .62 _____ •
LOWER ORDER
NEED CATEGORIES
r-i
"" -r-i U o U)
. 42
HIGHER ORDER
FIGURE 4
~mfu~ SCORES OF PERCEIVED DEFICIENCIES IN NEED CATEGORIES FOR EDUCATIONAL PREPARATION GROUPS
MASTERS
87

Ho 5. There is no difference in perceived need defi
ciencies between college and university administrators who
are grouped according to religious preference on any of the
13 administrative characteristics: Rejected.
88
Data analyses Tables 63 through 75 summarize the com
putation for the one-way analyses of variance on this
hypothesis. As shown in Table 73 (p. 94), a significant
difference was found between Protestant administrators and
non-Protestant administrators on the following characteristic:
V-a "The opportunity for personal growth and development in
my administrative position." The F-ratio summation for this
item is: F(l,219) = 3.563 < .05. As seen in summary Table
76, (p. 96) the mean perception of the Protestant group on
this item was 1.20 and the mean perception on the non
Protestant group was 1.64. Therefore, the research finding
was that non-Protestants had a significantly higher need
deficiency than Protestants in their average responses to
this job characteristic.
A significant F probability was found on item III-c
(Table 68, p. 92). However, the Bartlett's homogeneity test
probability was less than .05; thus the significant F finding
was not concluded to be reliable.
Figure 5 (p. 97) shows the mean scores of perceived
deficiencies in need categories for the two religious
preference groups.

r
TABLE 63
ONE-WAY ANALYSIS OF VARIANCE OF HEAN SCORES FOR ITEM I-a BY RELIGIOUS PREFERENCE GROUPS
(SECURITY IN JOB)
Source of Sum of Mean Variation Squares .. ..s::
C4.J.. Square
Between Groups 4.3960 1 4.3960 Within Groups 341.7214 219 1.5604 Total 346.1174 220
F
2.817
F Probability = .091 Bartlett's Homogeneity Test P = .084
89
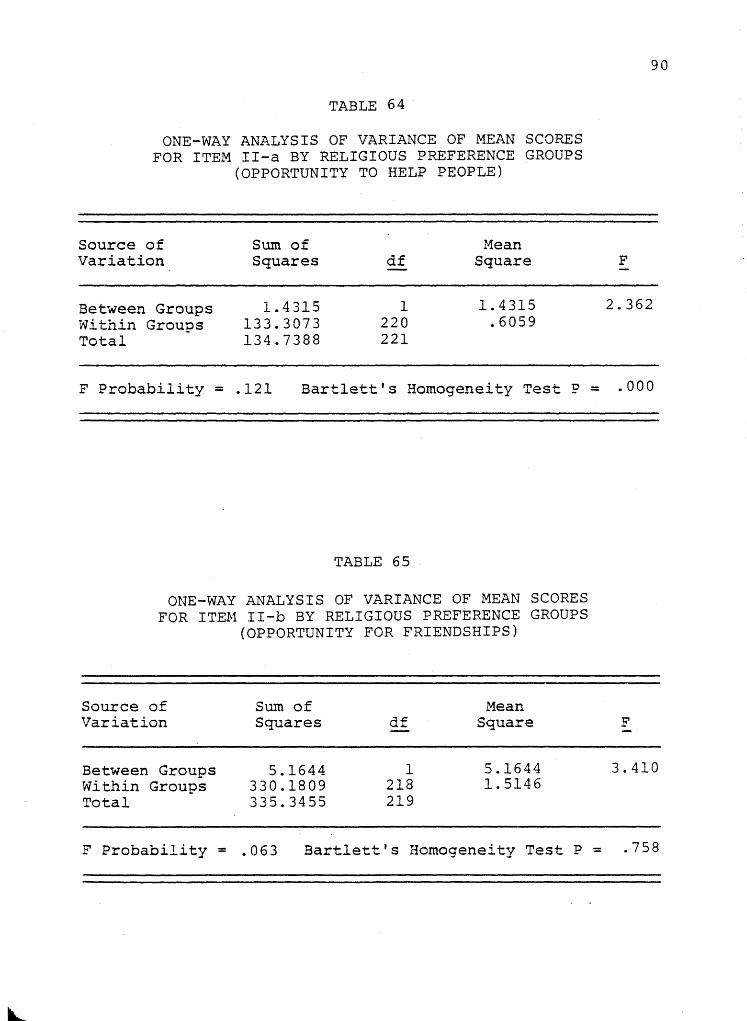
TABLE 64
ONE-WAY ANALYSIS OF VARIANCE OF MEAN SCORES FOR ITEM II-a BY RELIGIOUS PREFERENCE GROUPS
(OPPORTUNITY TO HELP PEOPLE)
Source of Sum of Mean Variation Squares df Square
Between Groups 1.4315 1 1.4315 Within Groups 133.3073 220 .6059 Total 134.7388 221
F Probability = .121 Bartlett's Homogeneity Test P
TABLE 65
ONE-WAY ANALYSIS OF VARIANCE OF MEAN SCORES FOR ITEM II-b BY RELIGIOUS PREFERENCE GROUPS
(OPPORTUNITY FOR FRIENDSHIPS)
Source of Sum of Mean Variation Squares df Square
Between Groups 5.1644 1 5.1644 Within Groups 330.1809 218 1.5146 Total 335.3455 219
90
F
2.362
= .000
F
3.410
F Probability = . 063 Bartlett t s Homogeneity Test P = . 758
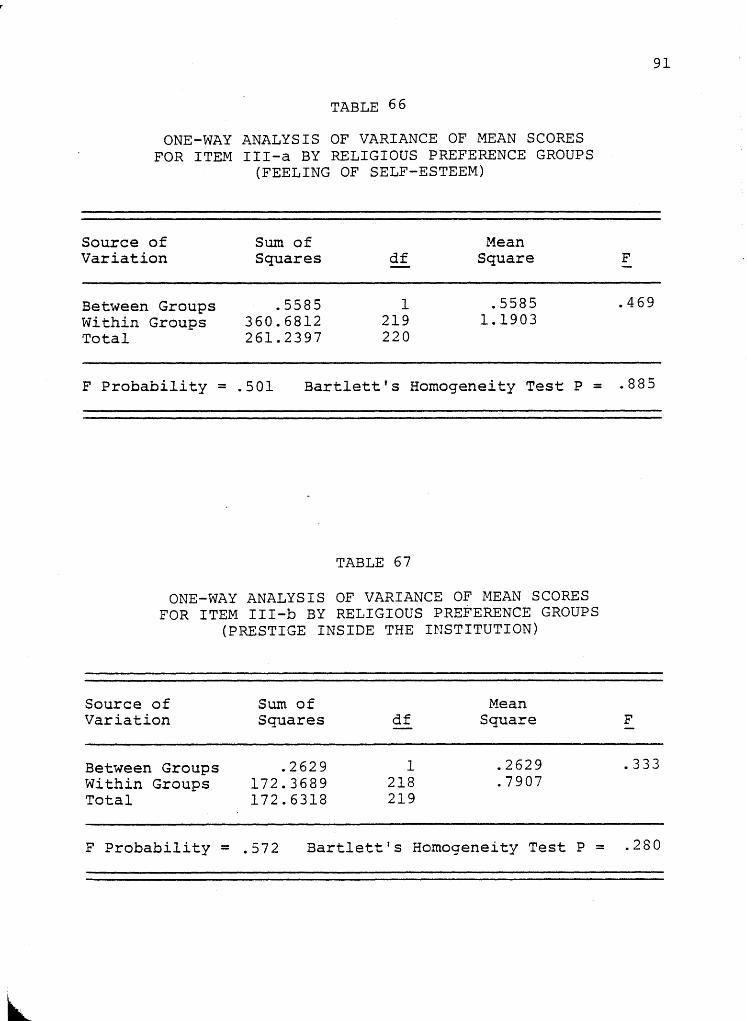
TABLE 66
ONE-WAY ANALYSIS OF VARIANCE OF MEAN SCORES FOR ITEM III-a BY RELIGIOUS PREFERENCE GROUPS
(FEELING OF SELF-ESTEEM)
Source of Sum of Mean Variation Squares df Square
Between Groups .5585 1 .5585 Within Groups 360.6812 219 1.1903 Total 261.2397 220
F Probability = .501 Bartlett's Homogeneity Test P =
TABLE 67
ONE-WAY ANALYSIS OF VARIANCE OF MEAN SCORES FOR ITEM III-b BY RELIGIOUS PREFERENCE GROUPS
(PRESTIGE INSIDE THE INSTITUTION)
Source of Sum of Mean Variation Squares df Square
Between Groups .2629 1 .2629 Within Groups 172.3689 218 .7907 Total 172.6318 219
F Probability = .572 Bartlett's Homogeneity Test P =
91
F
.469
.885
F
.333
.280

TABLE 68·
ONE-WAY ANALYSIS OF VARIANCE OF HEAN SCORES FOR ITEM III-c BY RELIGIOUS PREFERENCE GROUPS
(PRESTIGE OUTSIDE THE INSTITUTION)
Source of Sum of Mean Variation Squares df Square
Between Groups 2.5044 1 2.5044 Within Groups 144.9550 220 .6589 Total 147.4595 221
92
F
3.801
F Probability = .050 Bartlett's Homogeneity Test P = .002
TABLE 69
ONE-WAY ANALYSIS OF VARIANCE OF MEAN SCORES FOR ITEM IV-a BY RELIGIOUS PREFERENCE GROUPS
(AUTHORITY IN POSITION)
Source of Sum of Mean Variation Squares df Square
Between Groups .0701 1 .0701 Within Groups 174.9299 218 .8024 Total 175.0000 219
F
.087
F Probability = .761 Bartlett's Homogeneity Test P = .657
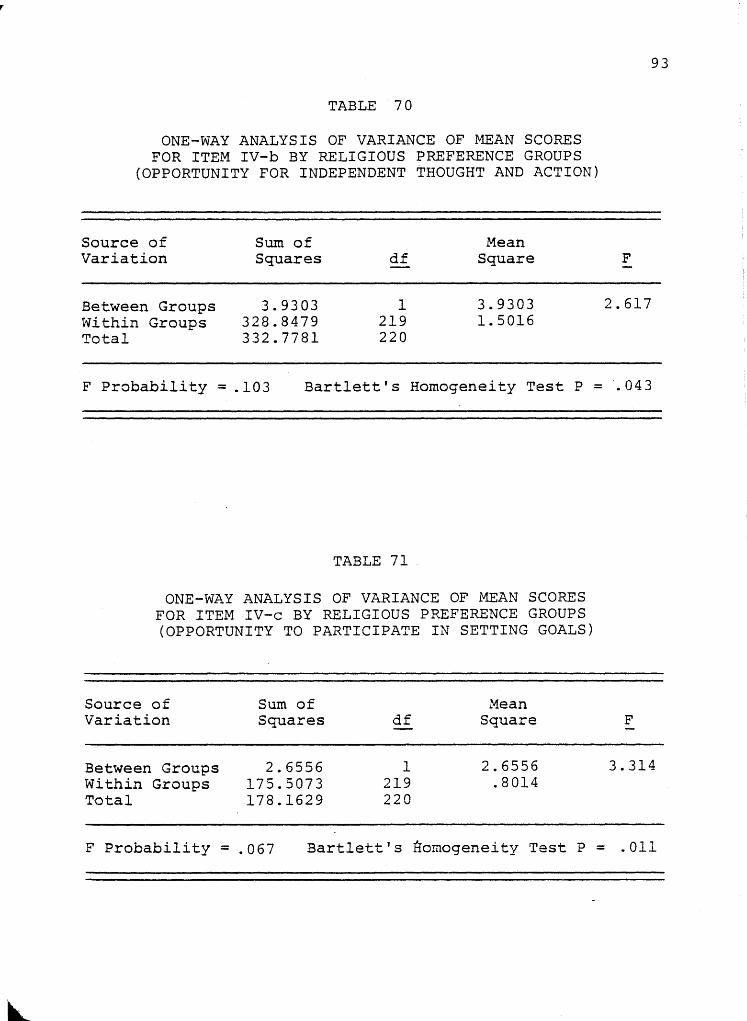
TABLE 70
ONE-WAY ANALYSIS OF VARIANCE OF MEAN SCORES FOR ITEM IV-b BY RELIGIOUS PREFERENCE GROUPS
(OPPORTUNITY FOR INDEPENDENT THOUGHT AND ACTION)
Source of Sum of l1ean Variation Squares df Square
Between Groups 3.9303 1 3.9303 Within Groups 328.8479 219 1.5016 Total 332.7781 220
F Probability = .103 Bartlett's Homogeneity Test P
TABLE 71 .
ONE-WAY ANALYSIS OF VARIANCE OF MEAN SCORES FOR ITEM IV-c BY RELIGIOUS PREFERENCE GROUPS (OPPORTUNITY TO PARTICIPATE IN SETTING GOALS)
Source of Sum of Mean Variation Squares df Square
Between Groups 2.6556 1 2.6556 Within Groups 175.5073 219 .8014 Total 178.1629 220
=
93
F
2.617
.043
F
3.314
F Probability = .067 Bartlett 1 s Homogeneity Test P = .011

r
TABLE 72
ONE-WAY ANALYSIS OF VARIANCE OF r~AN SCORES FOR ITEM IV-d BY RELIGIOUS PREFERENCE GROUPS
(OPPORTUNITY TO DETERMINE METHODS)
Source of Sum of !-1ean Variation Squares df Square
Between Groups 1.4144 1 1.4144 Within Groups 167.6352 220 .7620 Total 169.0496 221
F Probability = .171 Bartlett's Homogeneity Test P
TABLE 73
ONE-WAY ANALYSIS OF VARIANCE OF 11EAN SCORES FOR ITEM V-a BY RELIGIOUS PREFERENCE GROUPS
(OPPORTUNITY FOR GROWTH AND DEVELOPMENT)
Source of Sum of Mean Variation Squares df Square
Between Groups 6.3096 1 6.3096 Within Groups 387.8538 219 1.7710 Total 394.1633 220
F Probability = .057 Bartlett's Homogeneity Test P
94
F
1.856
= .095
F
3.563
= .236
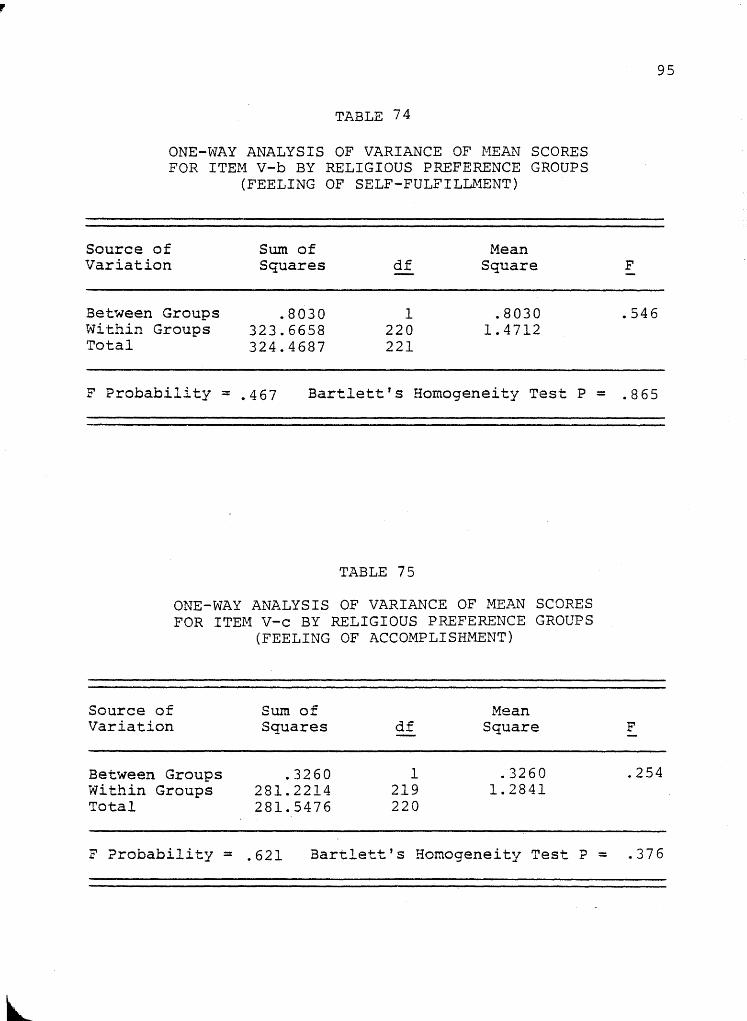
TABLE 74
ONE-~vAY ANALYSIS OF VARIANCE OF MEAN SCORES FOR ITEM V-b BY RELIGIOUS PREFERENCE GROUPS
(FEELING OF SELF-FULFILLMENT)
Source of Sum of Hean Variation Squares df Square
Between Groups .8030 1 .8030 Within Groups 323.6658 220 1.4712 Total 324.4687 221
F Probability = .467 Bartlett's Homogeneity Test P
TABLE 75
ONE-WAY ANALYSIS OF VARIANCE OF MEAN SCORES FOR ITE!'-1 V-c BY RELIGIOUS PREFERENCE GROUPS
(FEELING OF ACCOMPLISHMENT)
Source of Sum of Mean Variation Squares df Square
Between Groups .3260 1 .3260 Within Groups 281.2214 219 1.2841 Total 281.5476 220
F Probability = .621 Bartlett's Homogeneity Test P
95
F
.546
= .865
F
.254
= .376
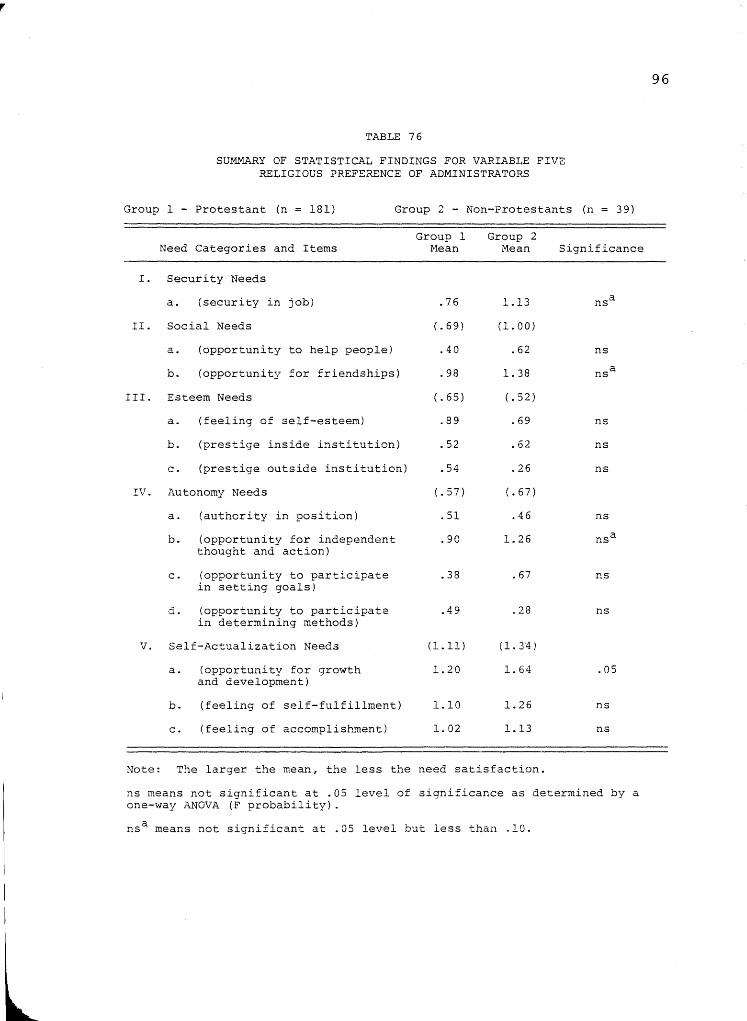
r
TABLE 76
SUMMARY OF STATISTICAL FINDINGS FOR VARIABLE FIVE RELIGIOUS PREFERENCE OF ADMINISTRATORS
Group 1 - Protestant (n 181) Group 2 - Non-Protestants (n 39)
Need Categories and Items Group 1
Mean Group 2
Mean Significance
I. Security Needs
a. (security in job)
II. Social Needs
a. (opportunity to help people)
b. (opportunity for friendships)
III. Esteem Needs
a. (feeling of self-esteem)
b. (prestige inside institution)
c. (prestige outside instit~tion)
IV. Autonomy Needs
a. (authority in position)
b. (opportunity for independent thought and action)
c. (opportunity to participate in setting goals)
d. (opportunity to participate in determining methods)
V. Self-Actualization Needs
a. (opportunity for growth and development)
b. (feeling of self-fulfillment)
c. (feeling of accornplish.lTIent)
.76
(.69)
.40
.98
(.65)
.89
.52
.54
(.57)
.51
.90
.38
.49
(1.11)
1.20
1.10
1. 02
1.13
(1. 00)
.62
1. 38
(.52)
.69
.62
.26
(.67)
.46
1. 26
.67
.28
(1. 34)
1. 64
1. 26
1.13
Note: The larger the mean, the less the need satisfaction.
ns
ns
ns
ns
ns
ns
ns
.05
ns
ns
ns means not significant at .05 level of significance as determined by a one-way ANOVA (F probability).
ns a means not significant at .05 level but less than .10.
96

2.0
1.0
0.0
1.34 . 1.13
'----- 1.00 ----- . "
'-.76 /
"" ~.11 .65 .67 ,;/'
----.;.""""0-__ - •
,'~ . • 69 , ...
..... - .57 .52
LOWER ORDER HIGHER ORDER
NEED CATEGORIES
FIGURE 5
M&~ SCORES OF PERCEIVED DEFICIENCIES IN NEED CATEGORIES FOR RELIGIOUS PREFE~JCE GROUPS
97
NON-PROTESTANTS
PROTESTANTS

Ho 6. There is no difference in perceived need defi
ciencies between college and university administrators who
are grouped according to race on any of the 13 administra
tive characteristics: Rejected.
98
Data analyses Tables 77 through 89 show the results of
the computation for this hypothesis. The findings of the
data analyses are that the minority group had a significantly
greater mean need deficiency than the Caucasian group on the
following two administrative characteristics:
III-b "The prestige of my administrative position in
side the institution (that is, the regard received from
others in the institution).n Table 81 (p. 101) shows the
F-ratio for this item to be: F(l,217) = 3.955 < .05.
III-c "The prestige of my administrative position out
side the institution (that is, the regard received from
others not in the institution}." Table 82 (p. 102) shows
the F-ratio for this item to be: F(l,219) = 4.601 < .05.
Summary Table 90 (p. 106) shows the mean for the
Caucasian group on item III-b as .50 and the mean for the
minority group on the same item as .94. The means for item
III-c are: Caucasians, .45; and minorities, .88.
Figure 6 (p. 107) shows the perceived deficiency mean
scores of the two race groups in need categories.

TABLE 77
ONE-WAY ANALYSIS OF VARIANCE OF MEAN SCORES FOR ITEM I-a BY RACE GROUPS
(SECURITY IN JOB)
Source of Sum of Mean Variation Squares df Square
Between Groups .6592 1 .6592 Within Groups 327.9363 218 1.5043 Total 328.5955 219
99
F
.438
F Probability = .516 Bartlett's Homogeneity ~est P = .737

TABLE 78
ONE-WAY ANALYSIS OF VARIANCE OF MEAN SCORES FOR ITEM II-a BY RACE GROUPS (OPPORTUNITY TO HELP PEOPLE)
Source of Sum of Mean Variation Squares df Square
Between Groups .7300 1 .7300 Within Groups 131.5686 219 .6008 Total 132.2986 220
F Probability = .271 Bartlett's Homogeneity Test P
TABLE 79
ONE-WAY ANALYSIS OF VARIANCE OF MEAN SCORES FOR ITEM II-b BY RACE GROUPS (OPPORTUNITY FOR FRIENDSHIPS)
Source of Sum of Mean Variation Squares df Square
Between Groups .9471 1 .9471 Within Groups 333.5002 217 1.5369 Total 334.4475 218
F Probability = .439 Bartlett's Homogeneity Test P
100
F
1.215
= .006
F
.616
= .786

TABLE 80
ONE-WAY ANALYSIS OF VARIANCE OF MEAN SCORES FOR ITEM III-a BY RACE GROUPS
(FEELING OF SELF-ESTEEM)
Source of Sum of Mean Variation Squares df Square
Between Groups 3.6382 1 3.6382 Within Groups 252.7436 218 1.1594 Total 256.3818 219
F Probability = .074 Bartlett's Homogeneity Test P
TABLE 81
ONE-WAY ANALYSIS OF VARIANCE OF ~mAN SCORES FOR ITEM III-b BY RACE GROUPS
(PRESTIGE INSIDE THE INSTITUTION)
Source of Sum of Mean Variation Squares df Square
Between Groups 3.0520 1 3.0520 Within Groups 167.4412 217 .7716 Total 170.4932 218
101
F
3.138
= .797
F
3.955
F Probability = .045 Bartlett's Homogeneity Test P = .082
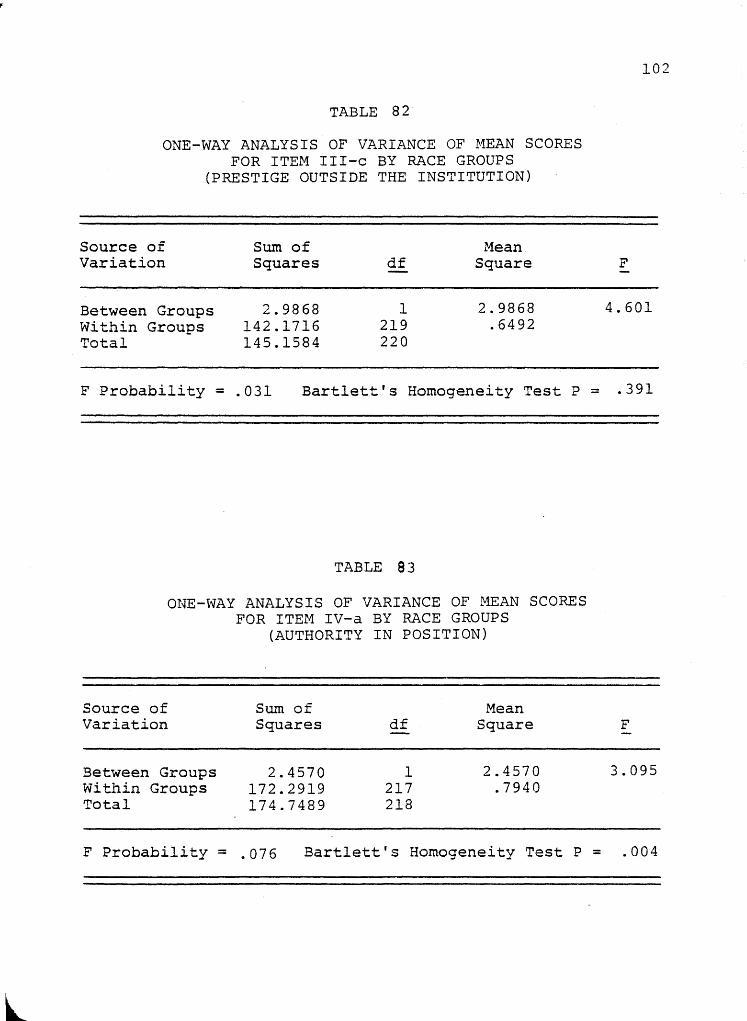
TABLE 82
ONE-WAY ANALYSIS OF VARIANCE OF ~1EAN SCORES FOR ITEH III-c BY RACE GROUPS
(PRESTIGE OUTSIDE THE INSTITUTION)
Source of Sum of Mean Variation Squares df Square
Between Groups 2.9868 1 2.9868 Within Groups 142.1716 219 .6492 Total 145.1584 220
F Probability = .031 Bartlett's Homogeneity Test P
TABLE 83
ONE-~\TAY ANALYSIS OF VARIANCE OF MEAN SCORES FOR ITEM IV-a BY RACE GROUPS
(AUTHORITY IN POSITION)
Source of Sum of Mean Variation Squares df Square
Between Groups 2.4570 1 2.4570 Within Groups 172.2919 217 .7940 Total 174.7489 218
F Probability = .076 Bartlett's Homogeneity Test P
102
F
4.601
= .391
F
3.095
= .004

TABLE 84
ONE-WAY ANALYSIS OF VARIANCE OF MEAN SCORES FOR ITEM IV-b BY RACE GROUPS
(OPPORTUNITY FOR INDEPENDENT THOUGHT AND ACTION)
Source of Sum of !1ean Variation Squares df Square
Between Groups .4901 1 .4901 Within Groups 323.0552 218 1.4819 Total 323.5454 219
F Probability = .573 Bartlett's Homogeneity Test P
TABLE 85
ONE-WAY ANALYSIS OF VARIANCE OF MEAN SCORES FOR ITEM IV-c BY RACE GROUPS
(OPPORTUNITY TO PARTICIPATE IN SETTING GOALS)
Source of Sum of Mean Variation Squares df Square
Between Groups .0557 1 .0557 Within Groups 177.9216 218 .8162 Total 177.9773 219
=
103
F
.331
.269
F
.068
F Probability = .783 Bartlett's Homogeneity Test P = .236

TABLE 86
ONE-WAy'ANALYSIS OF VARIANCE OF MEAN SCORES FOR ITEM IV-d BY RACE GROUPS
(OPPORTUNITY TO DETERMINE METHODS)
Source of Sum of !1ean Variation Squares df Square
Between Groups .3624 1 .3624 Within Groups 166.2892 219 .7593 Total 166.6516 220
F Probability = .498 Bartlett's Homogeneity Test P
TABLE 87
ONE-WAY ANALYSIS OF VARIANCE OF MEAN SCORES FOR ITEM V-a BY RACE GROUPS
(OPPORTUNITY FOR GROWTH AND DEVELOPMENT)
Source of Sum of Mean Variation Squares df Square
Between Groups .1873 1 .1873 Within Groups 393.8994 218 1.8069 Total 394.0867 219
F Probabi.lity = .744 Bartlett's Homogeneity Test P
104
F
.477
= .614
F
.104
= .071

TABLE 88
ONE-WAY ANALYSIS OF VARIANCE OF !-1EAN SCORES FOR ITEM V-b BY RACE GROUPS
(FEELING OF SELF-FULFILLMENT)
Source of Sum of Mean Variation Squares df Square
Between Groups .0737 1 .0737 Within Groups 323.6279 219 1.4778 Total 323.7017 220
F Probability = .808 Bartlett's Homogeneity Test P
TABLE 89
ONE-WAY ANALYSIS OF VARIANCE OF MEAN SCORES FOR ITEM V-c BY R.z\CE GROUPS (FEELING OF ACCOMPLISHMENT)
Source of Sum of Mean Variation Squares df Square
Between Groups .7220 1 .7220 Within Groups 280.8235 218 1.2882 Total 281.5454 219
F Probability = .461 Bartlett's Homogeneity Test P
105
F
.050
= .728
F
.560
= .724

Group 1 -
TABLE 90
SUMMARY OF STATISTICAL FINDINGS FOR VARIABLE SIX RACE OF ADMINISTRATORS
Caucasian (n 203) Group 2 - Minority
Group 1 Group 2
106
(n 17)
Need Categories and Items Mean Mean Significance
I. Security Needs
a. (security in job) .79 1. 00 ns
II. Social Needs (.76) (.53)
a. (opportunity to help people) .45 .24 ns
b. (opportunity for friendships) 1. 07 .82 ns
III. Esteem Needs (.57) (1. 02)
a. (feeling of self-esteem) .75 1. 24 nsa
b. (prestige inside institution) .50 .94 .04
c. (prestige outside institution) .45 .88 .03
IV. Autonomy Needs (.57) (.74 )
a. (authority in position) .47 .87 ns
b. (opportunity for independent .94 1.12 ns thought and action)
c. (opportunity to participate .44 .37 ns in setting goals)
d. (opportunity to participate .44 .59 ns in determining methods)
V. Self-Actualization Needs (1.18) (1.16)
a. (opportunity for growth 1. 28 1.18 ns and development)
b. (feeling of self-fulfillment) 1. 23 1. 06 ns
c. (feeling of accomplishment) 1.03 1.25 ns
Note: The larger the mean, the less the need satisfaction.
ns means not significant at .05 level of significance as determined by a one-way AN OVA (F probability).
nsa means not significant at .05 level but less than .10.

2.0 ~
l 1.0
I
0.0
tJ)
E-< ,.., Z 0
riI ...:l ~ t.l tJ)
1.18
1.0~ /_: .76 ,,/ -~--_ 74 ... '" - 1.16
.79--~--·~ --<-.----, // . .
.57 .57
1. 00
.53
~ 0
• .-j
~
LOl'lER ORDER HIGHER ORDER ~ N
.,.j
r-1 ~ ::l
>t >t .j.J
+l e u .,.j ..... e 0 ~ 1-4 ill Q) C I ~ .,.j Q) 0 ~
u U +l o4.J r-1 Q) 0 III ::l III
tJ) tJ) ~ ~ tJ)
NEED CATEGORIES
FIGURE 6
MEAN SCORES OF PERCEIVED DEFICIENCIES IN NEED CATEGORIES FOR RACE GROUPS
107
CAUCASIANS
MINORITIES

108
Ho 7. There is no difference in perceived need defi
ciencies between college and university administrators who
are grouped according to institutional type on any of the 13
administrative characteristics: Rejected.
Data analyses Tables 91 through 103 show that adminis
trators in four-year and above colleges and universities had
significantly higher mean need deficiencies than the means
of administrators in two-year colleges on the following two
administrative characteristics:
II-a "The opportunity in my administrative position to
give help to other people .. " Table 92 (p. 110) shows the F
ratio to be: F(1,220) = 3.753 < .05.
V-a "The opportunity for personal growth and develop
ment in my administrative position. p Table 101 (p. 114)
shows the F-ratio on this item as: F(1,219) = 3.970 < .05.
Summary Table 104 (p. 116) shows the means of the two
groups for the significant items as follows: II-a the mean
of the administrators in two-year colleges and universities
is .33 as compared to the mean for administrators in four
year and above colleges and universities, which was .53; V-a
the mean of the two-year administrators group is 1.08 and the
mean for the four-year and above administrators group is
1.43.
Although items II-b and IV-b had significant F proba
bilities, they were not accepted because of lack of homo
geneity of variance as determined by the Bartlett's Test.
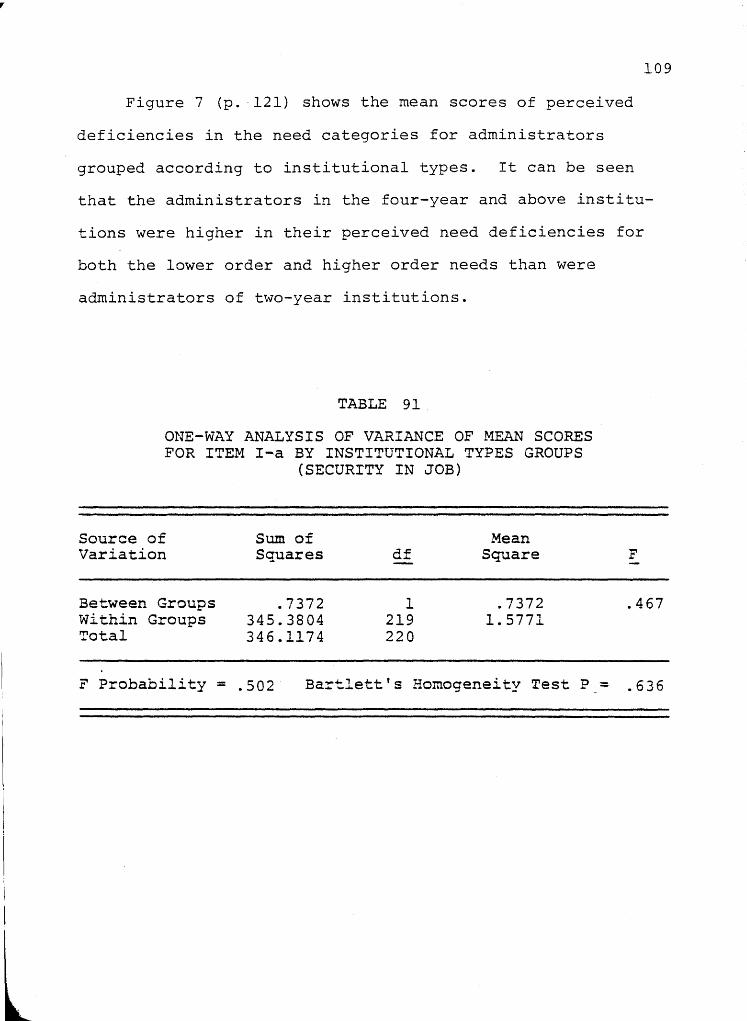
,
109
Figure 7 (p. 121) shows the mean scores of perceived
deficiencies in the need categories for administrators
grouped according to institutional types. It can be seen
that the administrators in the four-year and above institu-
tions were higher in their perceived need deficiencies for
both the lower order and higher order needs than were
administrators of two-year institutions.
TABLE 91
ONE-WAY ANALYSIS OF VARIANCE OF MEAN SCORES FOR ITEM I-a BY INSTITUTIONAL TYPES GROUPS
(SECURITY IN JOB)
Source of Sum of Mean Variation Squares df Square
Between Groups .7372 1 .7372 Within Groups 345.3804 219 1.5771 Total 346.1174 220
F
.467
F Probability = .502 Bartlett's Homogeneity Test P = .636

TABLE 92
ONE-WAY ANALYSIS OF VARIANCE OF MEAN SCORES FOR ITEM II-a BY INSTITUTIONAL TYPES GROUPS
(OPPORTUNITY TO HELP PEOPLE)
Source of Sum 6f Mean Vari'ation Squares df Square
Between Groups 2.2599 1 2.2599 Within Groups 132.4789 220 .6022 Total 134.7388 221
110
F
3.753
F Probability = .051 Bartlett's Homogeneity Test P = .121
TABLE 93
ONE-WAY ANALYSIS OF VARIANCE OF MEAN SCORES FOR ITEM II-b BY INSTITUTIONAL TYPES GROUPS
(OPPORTUNITY FOR FRIENDSHIPS)
Source of Sum of Mean Variation Squares df Square
Bet~veen Groups 11.8484 1 11.8484 Within Groups 323.4971 218 1.4839 Total 335.3455 219
F Probability = .005 Bartlett's Homogeneity Test P
F
7.984
= .049

TABLE 94
ONE-WAY ANALYSIS OF VARIANCE OF rlliAN SCORES FOR ITEM III-a BY INSTITUTIONAL TYPES GROUPS
(FEELING OF SELF-ESTEEM)
Source of Sum of Mean Variation Squares df Square
Between Groups .3056 1 .3056 Nithin Groups 260.9341 219 1.1915 Total 261.2397 220
F Probability = .619 Bartlett's Homogeneity Test P
TABLE 95
ONE-WAY ANALYSIS OF VARIANCE OF MEAN SCORES FOR ITEM III-b BY INSTITUTIONAL TYPES GROUPS
(PRESTIGE INSIDE THE INSTITUTION)
Source of Sum of Mean Variation Squares df Square
Between Groups .9218 1 .9218 Within Groups 171.7100 218 .7877 Total 172.6318 219
III
F
.256
= .103
F
1.170
F Probability = .280 Bartlett's Homogeneity Test P = .102

TABLE 96
ONE-WAY ANALYSIS OF VARIANCE OF MEAN SCORES FOR ITEM III-c BY INSTITUTIONAL TYPES GROUPS
(PRESTIGE OUTSIDE THE INSTITUTION)
Source of Sum of Mean Variation Squares df Square
Between Groups .1277 1 .1277 Within Groups 147.3318 220 .6697 Total 147.4595 221
F Probability = .666 Bartlett's Homogeneity Test P
TABLE 97
ONE-WAY ANALYSIS OF VARIANCE OF MEAN SCORES FOR ITEM IV-a BY INSTITUTIONAL TYPES GROUPS
(AUTHORITY IN POSITION)
Source of Sum of Mean Variation Squares df Square
Between Groups .0413 1 .0413 tiithin Groups 174.9587 218 .8026 Total 175.0000 219
112
F
.191
= .817
F
.051
F Probability = .805 Bartlett's Homogeneity Test P = .475

TABLE 98
ONE-WAY ANALYSIS OF VARIANCE OF HEAN SCORES FOR ITEH IV-b BY INSTITUTIONAL TYPES GROUPS
(OPPORTUNITY FOR INDEPENDENT THOUGHT AND ACTION)
Source of Sum of Mean Variation Squares df Square
Between Groups 11.2629 1 11.2629 Within Groups 321.5154 219 1.4681 Total 332.7781 220
F Probability = .006 Bartlett's Homogeneity Test P =
TABLE 99
ONE-WAY ANALYSIS OF VARIANCE OF MEAN SCORES FOR ITEM IV-c BY INSTITUTIONAL TYPES GROUPS
(OPPORTUNITY TO PARTICIPATE IN SETTING GOALS)
Source of Sum of Mean Variation Squares df Square
Between Groups .2314 1 .2314 Within Groups 177.9315 219 .8125 Total 178.1629 220
F Probability = .601 Bartlett's Homogeneity Test P =
113
F
7.672
.049
F
.285
.487
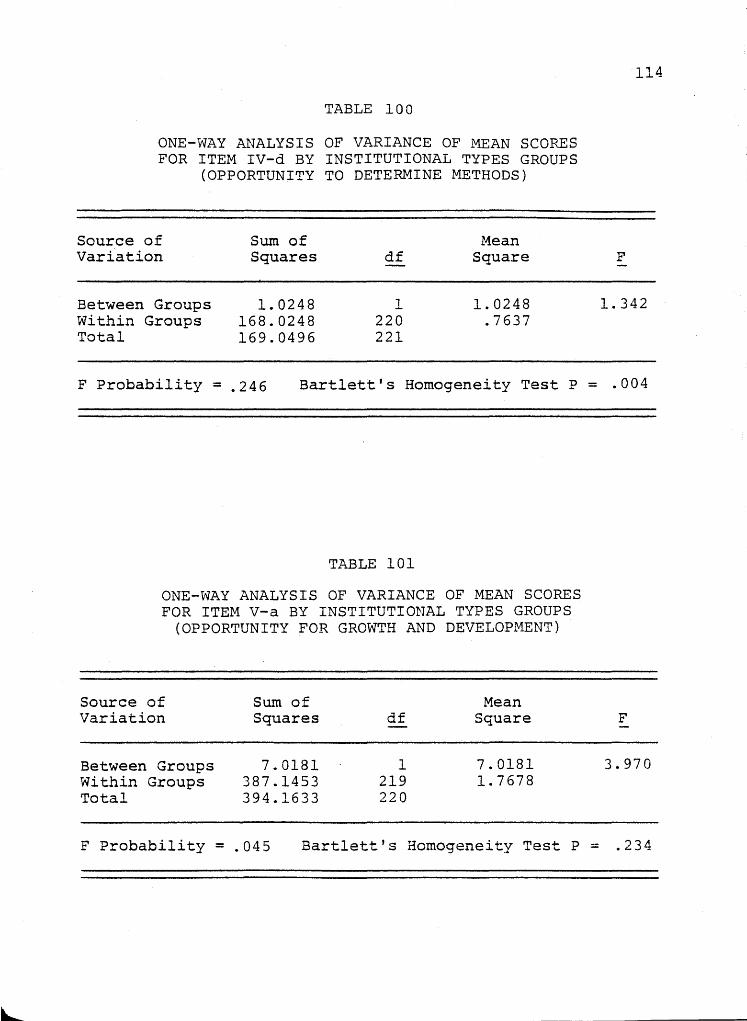
TABLE 100
ONE-WAY ANALYSIS OF VARIANCE OF MEAN SCORES FOR ITEM IV-d BY INSTITUTIONAL TYPES GROUPS
(OPPORTUNITY TO DETERMINE METHODS)
Source of Sum of Mean Variation Squares df Square
Between Groups 1.0248 1 1.0248 Within Groups 168.0248 220 .7637 Total 169.0496 221
F Probability = .246 Bartlett's Homogeneity Test P
TABLE 101
ONE-WAY ANALYSIS OF VARIANCE OF MEAN SCORES FOR ITEM V-a BY INSTITUTIONAL TYPES GROUPS
(OPPORTUNITY FOR GROWTH AND DEVELOPMENT)
Source of Sum of Mean Variation Squares df Square
Between Groups 7.0181 1 7.0181 Within Groups 387.1453 219 1.7678 Total 394.1633 220
F Probability = .045 Bartlett's Homogeneity Test P
114
F
1.342
= .004
F
3.970
= .234

,..
TABLE 102
ONE-WAY ANALYSIS OF VARIANCE OF ~ffiAN SCORES FOR ITEM V-b BY INSTITUTIONAL TYPES GROUPS
(FEELING OF SELF-FULFILLMENT)
Source of Sum of Mean Variation Squares df Square
Between Groups 1.0544 1 1.0544 Within Groups 323.4143 220 1.4701 Total 324.4687 221
F Probability = .403 Bartlett's Homogeneity Test P
TABLE 103
ONE-WAY ANALYSIS OF VARIANCE OF MEAN SCORES FOR ITEM V-c BY INSTITUTIONAL TYPES GROUPS
(FEELING OF ACCOMPLISHMENT)
Source of Sum of Mean Variation Squares df Square
Between Groups 3.3411 1 3.3411 Within Groups 278.2065 219 1.2703 Total 281.5476 220
F Probability = .102 Bartlett's Homogeneity Test P
115
F
.717
= .488
F
2.630
= .094

TABLE 104
SUMMARY OF STATISTICAL FINDINGS FOR VARIABLE SEVEN TYPE OF INSTITUTIONS
Group 1 - Two-Year (n 100) Group 2 - Four-Year Above (n
116
121)
Need Categories and Items Group 1
Mean Group 2
Mean Significance
I. Security Needs
a. (security in job)
II. Social Needs
a. (opportunity to help people)
b. (opportunity for friendships)
III. Esteem Needs
a. (authority in position)
b. (prestige inside institution)
c. (prestige outside institution)
IV. Autonomy Needs
a. (authority in position)
b. (opportunity for independent thought and action)
c. (opportunity to participate in setting goals)
d. (opportunity to participate in determining methods)
V. Self-Actualization Needs
a. (opportunity for growth and development)
b. (feeling of self-fulfillment)
c. (feeling of accomplishment)
.76 .88
(.57) (.90)
.33 .53
.80 1. 26
(.56) (.65 )
.76 .83
.47 .60
.46 .51
(.53 ) (.63)
.48 .51
.72 1.17
.39 .46
.53 .39
(1. 01) (1.26
1. 08 1. 43
1. 05 1.19
.91 1.16
Note: The larger the mean, the less the need satisfaction.
ns
.05
ns
ns
ns
ns
ns
ns
ns
ns
.04
ns
ns
ns means not significant at .05 level of significance as determined by a one-way ANOVA (F probability).

2.0
1.0
0.0
til 8 H Z ::,.,
~ H ~ U til
I
1.26
'" .88 .90 ",,,,,,, • -----------.--- /'" .01 • '-,-_ .65 .63 ,,'
.76__________.. --.---------.' . . . • 57 .56
.53
I:: 0 .... 4.l
LOWER ORDER HIGHER ORDER ftj N
..-i a-4 ftj ::s
:>., +J :>., E u +J
E 0 ..=: -.-I a-4 ~ ftj ILl I:: I ::s • .-1 ILl 0 4-1 U U +J +J ,....f
Q.l 0 til ::s Q.l
~ til til til ~
NEED CATEGORIES
FIGURE 7
MEAN SCORES OF PERCEIVED DEFICIENCIES IN NEED CATEGORIES FOR INSTITUTIONAL TYPES GROu~S
117
FOUR-YEAR +
TWO-YEAR

HO 8. There is no difference in perceived need defi
ciencies between college and university administrators who
118
are grouped according to full-time enrollment of their insti-
tutions on any of the 13 administrative characteristics:
Confirmed.
Tables 105 through 117 show that there were no signifi-
cant F-ratios on any of the 13 analyses of variance. The F
probability as seen in Table 112 (p. 122) is .03; however, the
Bartlett's homogeneity probability is .001. Therefore, the
F test was concluded to be unreliable.
A comparison of the summary Table 118 (p. 125) with
Figure 8 (p. 126) reveals that there were no distinguishable
patterns in need deficiencies between the administrators
grouped according to the size of their institutions.
TABLE 105
ONE-WAY ANALYSIS OF VARIANCE OF MEAN SCORES FOR ITEM I-a BY FTE GROUPS
(SECURITY IN JOB)
Source of Sum of Mean Variation Squares df Square
Between Groups .3675 1 .3675 within Groups 345.7500 219 1.5788 Total 346.1174 220
F Probability = .635 Bartlett's Homogeneity Test P
F
.233
= .214
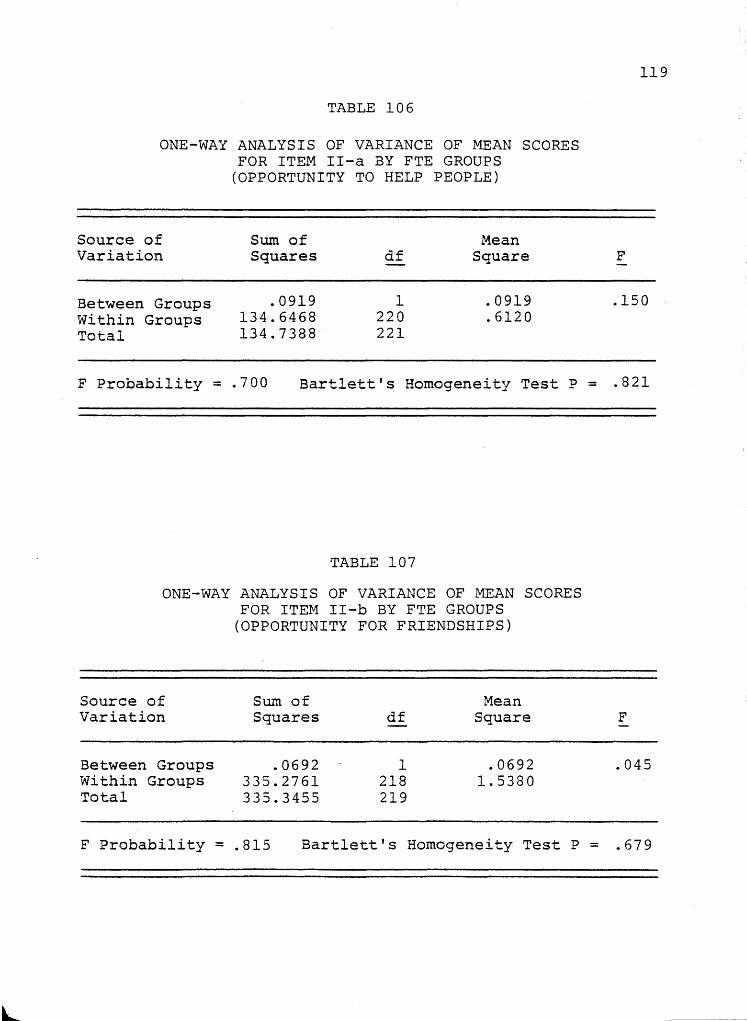
TABLE 106
ONE-WAY ANALYSIS OF VARIANCE OF MEAN SCORES FOR ITEM II-a BY FTE GROUPS
(OPPORTUNITY TO HELP PEOPLE)
Source of Sum of Mean Variation Squares df Square
Between Groups .0919 1 .0919 Within Groups 134.6468 220 .6120 Total 134.7388 221
F Probability = .700 Bartlett's Homogeneity Test P
TABLE 107
ONE-WAY ANALYSIS OF VARIANCE OF MEAN SCORES FOR ITEM II-b BY FTE GROUPS
(OPPORTUNITY FOR FRIENDSHIPS)
Source of Sum of Mean Variation Squares df Square
Between Groups .0692 1 .0692 Within Groups 335.2761 218 1.5380 Total 335.3455 219
119
F
.150
= .821
F
.045
F Probability = .815 Bartlett's Homogeneity Test P = .679

TABLE 108
ONE-WAY ANALYSIS OF VARIANCE OF HEAN SCORES FOR ITEM III-a BY FTE GROUPS
(FEELING OF SELF-ESTEEM)
Source of Sum of Mean Variation Squares df Square
Between Groups .0890 1 .0890 Within Groups 261.1506 219 1.1925 Total 261.2397 220
F Probability = .776 Bartlett's Homogeneity Test P
TABLE 109
ONE-WAY ANALYSIS OF VARIANCE OF MEAN SCORES FOR ITEM III-b BY FTE GROUPS
(PRESTIGE INSIDE THE INSTITUTION)
Source of Sum of Mean Variation Squares df Square
Between Groups .0594 1 .0594 Within Groups 172.5724 218 .7916 Total 172.6318 219
F Probability = .775 Bartlett's Homogeneity Test P
120
F
.075
= .290
F
.075
= .689

TABLE 110
ONE-WAY ANALYSIS OF VARIANCE OF MEAN SCORES FOR ITEM III-c BY FTE GROUPS
(PRESTIGE OUTSIDE THE INSTITUTION)
Source of Sum of Mean Variation Squares df Square
Between Groups .0187 1 .0187 Within Groups 147.4408 220 .6702 Total 147.4595 221
F Probability = .843 Bartlett's Homogeneity Test P
TABLE III
ONE-WAY ANALYSIS OF VARIANCE OF ~1EAN SCORES FOR ITEM IV-a BY FTE GROUPS
(AUTHORITY IN POSITION)
Source of Sum of Mean Variation Squares df • Square
Between Groups 1.3622 1 1.3622 Within Groups 173.6378 218 .7965 Total 175.0000 219
F Probability = .189 Bartlett's Homogeneity Test P
121
F
.028
= .436
F
1.710
= .000

TABLE 112
ONE-WAY ANALYSIS OF VARIANCE OF MEAN SCORES FOR ITEM IV-b BY FTE GROUPS
(OPPORTUNITY FOR INDEPENDENT THOUGHT AND ACTION)
Source of Sum of Mean Variation Squares df Square
Between Groups 6.9387 1 6.9387 Within Groups 325.8396 219 1.4879 Total 332.7781 220
F Probability = .030 Bartlett's Homogeneity Test P =
TABLE 113
ONE-WAY ANALYSIS OF VARIANCE OF HEAN SCORES FOR ITEM IV-c BY FTE GROUPS
(OPPORTUNITY TO PARTICIPATE IN SETTING GOALS)
Source of Sum of Mean Variation Squares df Square
Between Groups .7302 1 .7302 Within Groups 177.4327 219 .8102 Total 178.1629 220
F Probability = .346 Bartlett's Homogeneity Test P =
122
F
4 .. 664
.001
F
.901
.017

TABLE 114
ONE-WAY ANALYSIS OF VARIANCE OF HE AN SCORES FOR ITEM IV-d BY FTE GROUPS
(OPPORTUNITY TO DETERMINE METHODS)
Source of Sum of Mean Variation Squares df Square
Between Groups .5540 1 .5540 Within Groups 168.4955 220 .7659 Total 169.0496 221
F Probability = .401 Bartlett's Homogeneity Test P
TABLE 115
ONE-WAY ANALYSIS OF VARIANCE OF MEAN SCORES FOR ITE~1 V-a BY FTE GROUPS
(OPPORTUNITY FOR GROWTH M~D DEVELOPMENT)
Source of Sum of Mean Variation Squares df Square
Between Groups .8354 1 .8354 Within Groups 393.3279 219 1.7960 Total 394.1633 220
F Probability = .503 Bartlett's Homogeneity Test P
123
F
.723
= .032
F
.465
= .074

TABLE 116
ONE-WAY ANALYSIS OF VARIANCE OF MEAN SCORES FOR ITEM V-b BY FTE GROUPS
(FEELING OF SELF-FULFILLMENT)
Source of Sum of Mean Variation Squares df Square
Between Groups .0984 1 .0984 Within Groups 324.3704 220 1.4744 Total 324.4687 221
F Probability = .785 Bartlett's Homogeneity Test P
TABLE 117
ONE-WAY ANALYSIS OF VARIANCE OF MEAN SCORES FOR ITEM V-c BY FTE GROUPS (FEELING OF ACCOMPLISHMENT)
Source of Sum of Mean Variation Squares df Square
Between Groups 2.9730 1 2.9730 Within Groups 278.5747 219 1.2720 Total 281.5476 220
F Probability = .123 Bartlett's Homogeneity Test P
124
F
.067
= .522
F
2.337
.- .469

TABLE 118
SUMMARY OF STATISTICAL FINDINGS FOR VARIABLE EIGHT FULL-TIME ENROLLMENT OF INSTITUTIONS
Group 1 - Below 3,000 (n 151) Group 2 = Over 3,000 (n
125
70)
Need Categories and Items Group 1
Mean Group 2
Mean Significance
I. Security Needs
a. (security in job)
II. Social Needs
a. (opportunity to help people)
b. (opportunity for friendships)
III. Esteem Needs
a. (feeling of self-esteem)
b. (prestige inside institution)
c. (prestige outside institution)
IV. Autonomy Needs
a. (authority in position)
b. (opportunity for independent thought and action)
c. (opportunity to participate in setting goals)
d. (opportunity to participate in determining methods)
V. Self-Actualization Needs
a. (opportunity for growth and development)
b. (feeling of self-fulfillment)
c. (feeling of accomplishment)
.80
(.75)
.43
1. 07
(.61)
.81
.53
.48
(.53 )
.45
.85
.39
.42
(1.13)
1. 32
1.11
.97
.88
(.75)
.47
1. 03
(.61)
.77
.57
.50
(.72 )
.62
1. 23
.51
.53
(1.19)
1.19
1.16
1. 22
Note: The larger the mean, the less the need staisfaction.
ns
ns
ns
ns
ns
ns
ns
ns
ns
ns
ns
ns
ns
ns means not sionificant at .05 level of significance as determined by a one-way AN OVA CF probability).

2.0
1.0
o.J I
126
1.19 OVER 3,000
.88 .... ,. ... ' .. • ---__ .75 72 /,..... 1.13 .. - .. --.... .61· _ .... ' ~
.80 .7~".~--·--' • 61 •
.53
LOWER- ORDER HIGHER ORDER
NEED CATEGORIES
FIGURE 8
!-1EAN SCORES OF PERCEIVED DEFICIENCIES IN NEED CATEGORIES FOR PTE GROUPS
L"NDER 3,000
127
HO 9. There is no difference in perceived need defi
ciencies between college and university administrators who
are grouped according to the control of their institutions
on any of the 13 administrative characteristics: Rejected.
ANOVA Tables 119 through 131 show the results of the
data analyses computed for this hypothesis. It was found
that administrators in private colleges and universities
perceived a significantly greater mean need deficiency than
did administrators in public institutions on the following
item: II-b "Opportunity to develop close friendships in my
administrative position." As shown in Table 121 (p. 129),
the F-ratio summation of this item is: F(1,217) = 5.436<.05.
Summary Table 132 (p. 135) shows the mean of the public
administrator group on this item to be .91 and the mean of
the private administrator group to be 1.32.
Figure 9 (p. 136) shows the mean scores of perceived
deficiencies in the need categories for the administrators
grouped according to institutional control. The most dis
tinguishable discrepancy was in the lower order need area
with private administrators having a higher average defi
ciency in the social category.
Summary
This chapter has presented the data analyses of the
research and stated the interpretation of the data in rela
tion to the null hypotheses. Seven of the nine null
hypotheses were rejected.
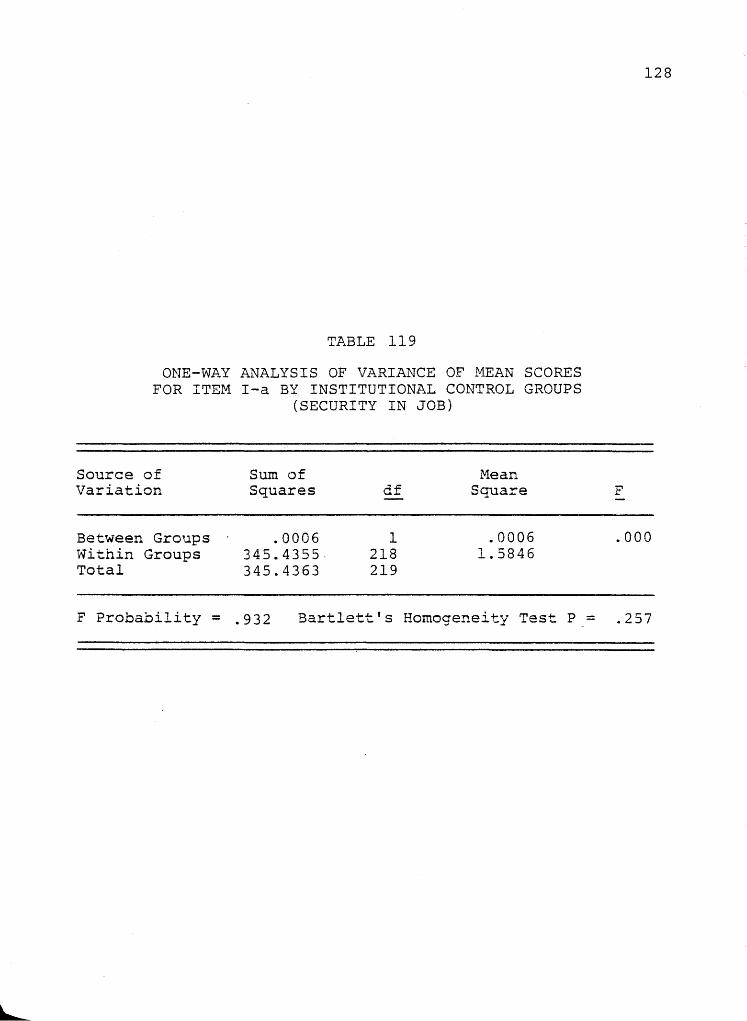
TABLE 119
ONE-WAY ANALYSIS OF VARIANCE OF ~mAN SCORES FOR ITEM I-a BY INSTITUTIONAL CONTROL GROUPS
(SECURITY IN JOB)
Source of Sum of Mean Variation Squares df Square
Between Groups .0006 1 .0006 Within Groups 345.4355. 218 1.5846 Total 345.4363 219
128
F
.000
F Probability = .932 Bartlett's Homogeneity Test P = .257

r
TABLE 120
ONE-WAY ANALYSIS OF VARIANCE OF MEAN SCORES FOR ITEH II-a BY INSTITUTIONAL CONTROL GROUPS
(OPPORTUNITY TO HELP PEOPLE)
Source of Sum of Mean Variation Squares df Square
Between Groups 1. 7775 1 1.7775 Within Groups 132.7655 219 .6062 Total 134.5430 220
F Probability = .084 Bartlett's Homogeneity Test P =
TABLE 121
ONE-WAY ANALYSIS OF VARIANCE OF MEAN SCORES FOR ITEM II-b BY INSTITUTIONAL CONTROL GROUPS
(OPPORTUNITY FOR FRIENDSHIPS)
Source of Sum of Mean Variation Squares df Square
Between Groups 8.1682 1 8.1682 Within Groups 326.0601 217 1.5026 Total 334.2283 218
F Probability = .020 Bartlett's Homogeneity Test P =
129
F
2.932
.208
F
5.436
.089
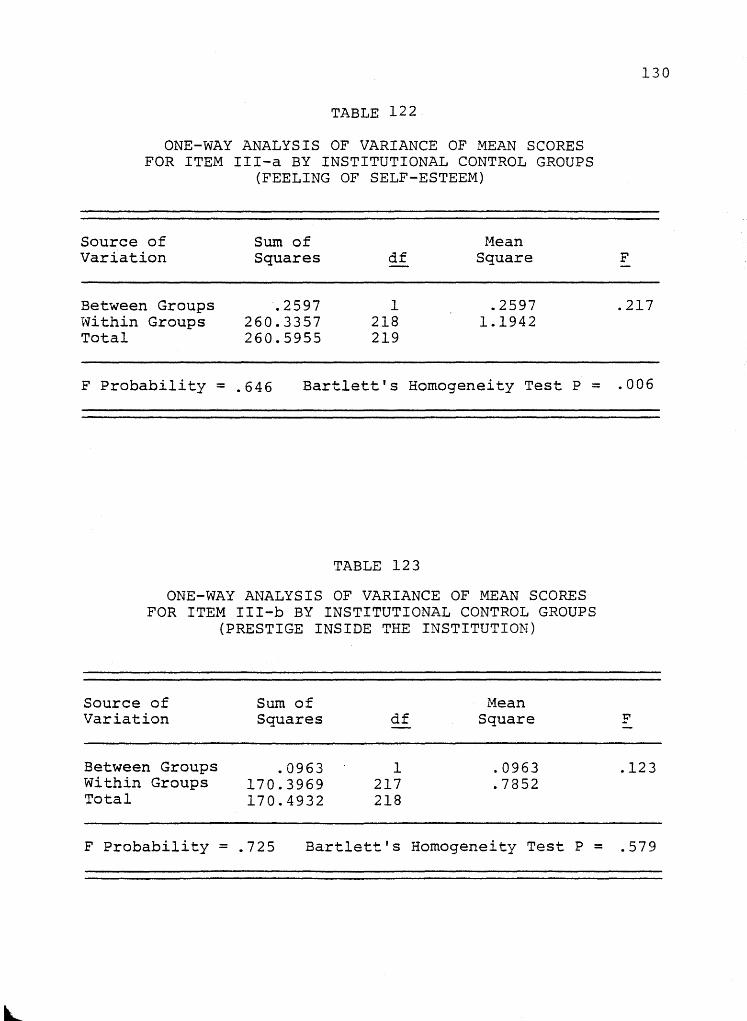
TABLE 122.
ONE-WAY ANALYSIS OF VARIANCE OF MEAN SCORES FOR ITEM III-a BY INSTITUTIONAL CONTROL GROUPS
(FEELING OF SELF-ESTEEM)
Source of Sum of r-iean Variation Squares df Square
Between Groups .2597 1 .2597 ~'1i thin Groups 260.3357 218 1.1942 Total 260.5955 219
F Probability = .646 Bartlett's Homogeneity Test P =
TABLE 123
ONE-WAY ANALYSIS OF VARIANCE OF MEAN SCORES FOR ITEM III-b BY INSTITUTIONAL CONTROL GROUPS
(PRESTIGE INSIDE THE INSTITUTION)
Source of Sum of Mean Variation Squares df Square
Between Groups .0963 1 .0963 Within Groups 170.3969 217 .7852 Total 170.4932 218
F Probability = .725 Bartlett's Homogeneity Test P =
130
F
.217
.006
F
.123
.579

TABLE 124
ONE-WAY ANALYSIS OF VARIANCE OF MEAN SCORES FOR ITEM III-c BY INSTITUTIONAL CONTROL GROUPS
(PRESTIGE OUTSIDE THE INSTITUTION)
Source of Sum of Mean Variation Squares df Square
Between Groups .3285 1 .3285 Within Groups 146.8932 219 .6707 Total 147.2217 220
F Probability = .492 Bartlett's Homogeneity Test P =
TABLE 125
ONE-WAY ANALYSIS OF VARIANCE OF MEAN SCORES FOR ITEM IV-a BY INSTITUTIONAL CONTROL GROUPS
(AUTHORITY IN POSITION)
Source of Sum of Mean Variation Squares df Square
Between Groups 1.6606 1 1.6606 Within Groups 173.0882 217 .7976 Total 174.7489 218
F Probability = .146 Bartlett's Homogeneity Test P =
131
F
.490
.268
F
2.082
.034

TABLE 126
ONE-WAY ANALYSIS OF VARIANCE OF ~mAN SCORES FOR ITEM IV-b BY INSTITUTIONAL CONTROL GROUPS
(OPPORTUNITY FOR INDEPENDENT THOUGHT AND ACTION)
Source of Sum of Mean Variation Squares df Square
Between Groups .1599 1 .1599 Within Groups 331.6763 218 1.5215 Total 331.8362 219
F Probability = .742 Bartlett's Homogeneity Test P =
TABLE 127
ONE-WAY ANALYSIS OF VARIANCE OF MEAN SCORES FOR ITEM IV-c BY INSTITUTIONAL CONTROL GROUPS (OPPORTUNITY TO PARTICIPATE IN SETTING GOALS)
Source of Sum of !vIe an Variation Squares df Square
Between Groups .1273 1 .1273 Within Groups 177.8500 218 .8158 Total 177.9773 219
F Probability = .695 Bartlett's Homogeneity Test P =
132
F
.105
.782
F
.156
.154
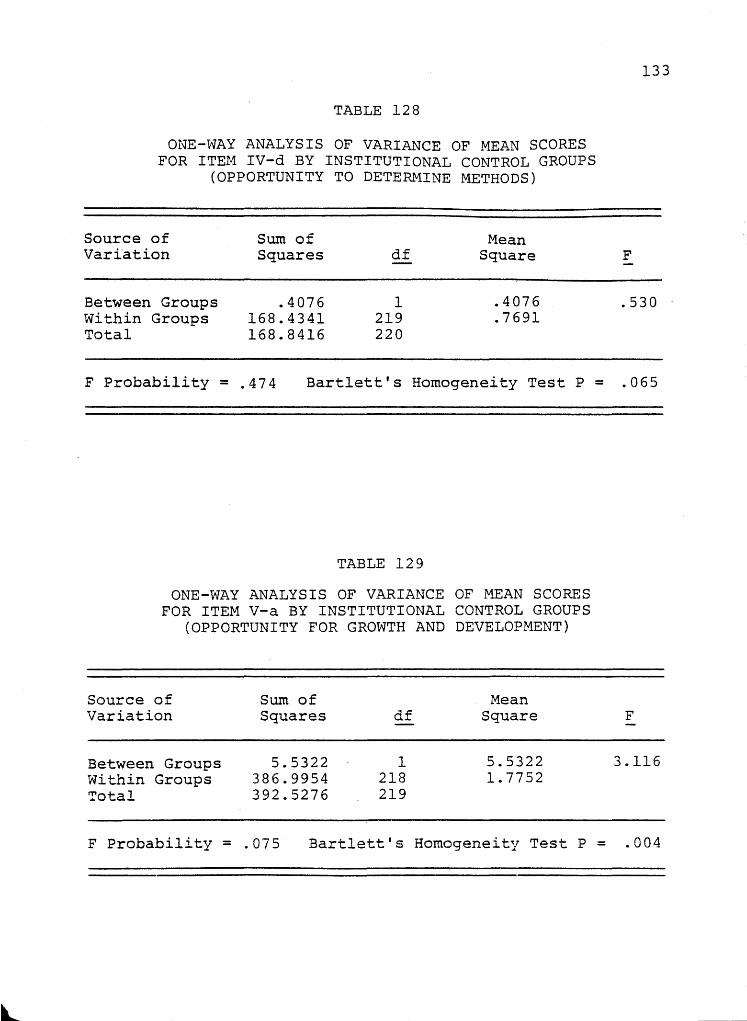
TABLE 128
ONE-WAY ANALYSIS OF VARIANCE OF MEAN SCORES FOR ITEM IV-d BY INSTITUTIONAL CONTROL GROUPS
(OPPORTUNITY TO DETERMINE METHODS)
Source of Sum of Hean Vari'ation Squares df Square
Between Groups .4076 1 .4076 Within Groups 168.4341 219 .7691 Total 168.8416 220
F Probability = .474 Bartlett's Homogeneity Test P
TABLE 129
ONE-WAY ANALYSIS OF VARIANCE OF MEAN SCORES FOR ITEM V-a BY INSTITUTIONAL CONTROL GROUPS
(OPPORTUNITY FOR GROWTH AND DEVELOPMENT)
Source of Sum of Mean Variation Squares df Square
Between Groups 5.5322 1 5.5322 Within Groups 386.9954 218 1.7752 Total 392.5276 219
=
133
F
.530
.065
F
3.116
F Probability = .075 Bartlett's Homogeneity Test P = .004
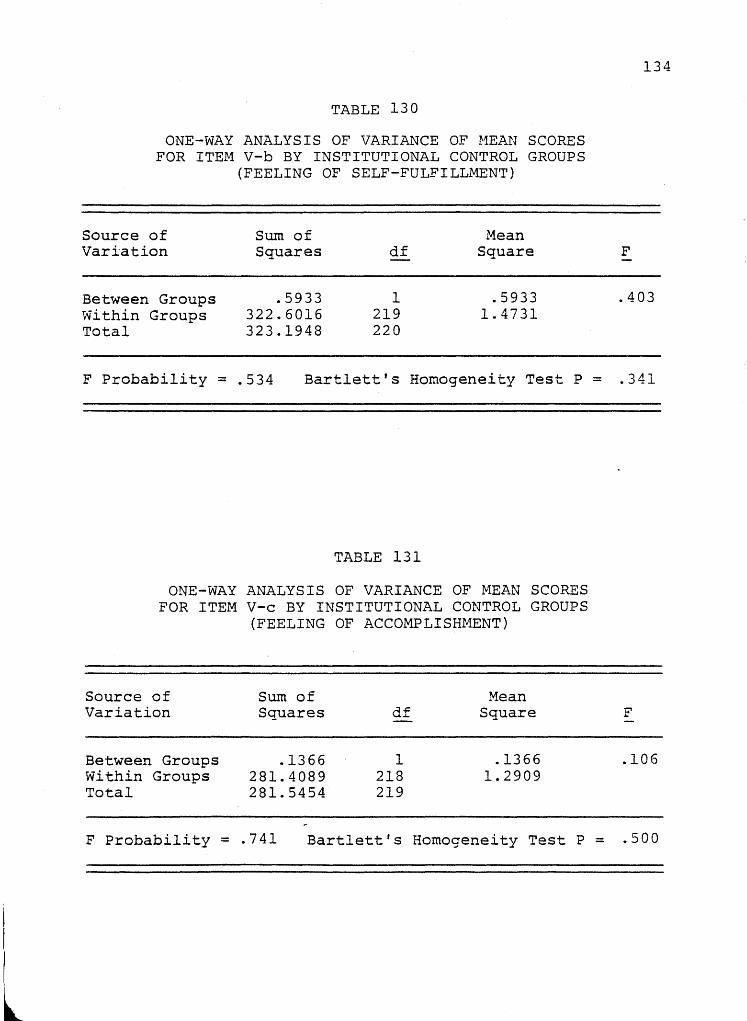
TABLE 130
ONE-WAY ANALYSIS OF VARIANCE OF r1EAN SCORES FOR ITEM V-b BY INSTITUTIONAL CONTROL GROUPS
(FEELING OF SELF-FULFILLMENT)
Source of Sum of Hean Variation Squares df Square
Between Groups .5933 1 .5933 Within Groups 322.6016 219 1.4731 Total 323.1948 220
F Probability = .534 Bartlett's Homogeneity Test P
TABLE 131
ONE-WAY ANALYSIS OF VARIANCE OF MEAN SCORES FOR ITEM V-c BY INSTITUTIONAL CONTROL GROUPS
(FEELING OF ACCOMPLISHMENT)
Source of Sum of Mean Variation Squares df Square
Between Groups .1366 1 .1366 Within Groups 281.4089 218 1.2909 Total 281.5454 219
F Probability = .741 Bartlett's Homogeneity Test P
134
F
.403
= .341
F
.106
= .500

TABLE 132
SUMMARY OF STATISTICAL FINDINGS FOR VARIABLE NINE CONTROL OF INSTITUTIONS
Group 1 - Public (n 140) Group 2 - Pr~vate (n 80)
Need Categories and Items Group 1
Mean Group 2
Mean Significance
I. Security Needs
a. (security in job)
II. Social Needs
a. (opportunity to help people)
b. (opportunity for friendships)
III. Esteem Needs
a. (feeling of self-esteem)
b. (prestige inside institution)
c. (prestige outside institution)
IV. Autonomy Needs
a. (authority in position)
b. (opportunity for independent thought and action)
c. (opportunity to participate in setting goals)
d. (opportunity to participate in determining methods)
V. Self-Actualization Needs
a. (opportunity for growth and development)
b. (feeling of self-fulfillment)
c. (feeling of accomplishment)
.83
(.64)
.38
.91
(.62)
.78
.55
.52
(.63)
.57
.99
.45
.49
(1. 23)
1.16
1. 09
1. 06
.82
(.94 )
.56
1. 32
(.60)
.85
.50
.44
(.53)
.39
.94
.40
.40
(1.10)
1. 49
1. 20
1. 01
Note: The larger the mean, the less the need satisfaction.
ns
.02
ns
ns
ns
ns
ns
ns
ns
ns
ns
ns
ns means not significant at .05 level of significance as determined by a one-way ANOVA (F probability).
a ns means not significant at .05 level but less than .10.
135
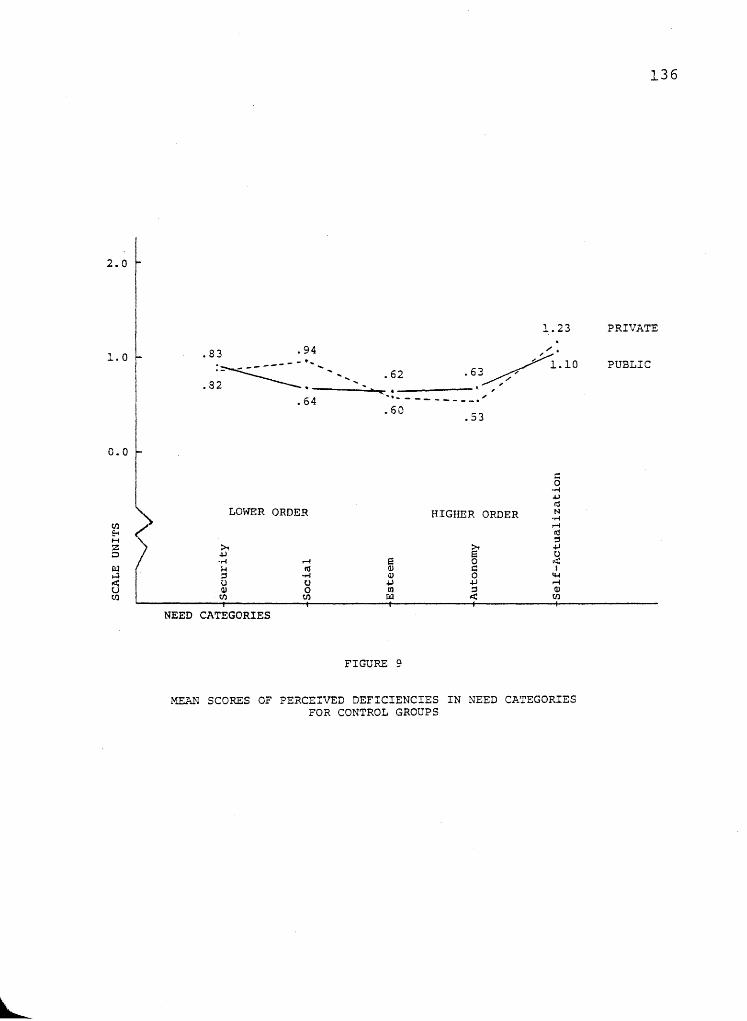
2.0
1.0
0.0
I
1. 23
.83 .94 :~----- ..........
.82 ------, ......... ,
.64
/ . .63~·lO
< t ___ --- l ,"
.... - - -- ----_."
.62
.60 .53
LOWER ORDER HIGHER ORDER
NEED CATEGORIES
FIGURE 9
MEAN SCORES OF PERCEIVED DEFICIENCIES IN NEED CATEGORIES FOR CONTROL GROUPS
136
PRIVATE
PUBLIC

CHAPTER V
SUMMARY
The purpose of this study was to survey perceived need
deficiencies of college and university presidents and aca
demic deans. Of major interest was the determination of
what effect the differential job levels of the two adminis
trative positions have on the administrator's responses to
perceived job characteristics .
. Although studies of job satisfaction of workers in
business and industry have been replicated many times,
little research has been reported of the job satisfaction of
college administrators.
This study followed the methodology used by Lyman W.
Porter (1961, 1962) who studied job satisfaction as per
ceived need fulfillment of managers in business and industry.
The questionnaire, ~vhich was revised for applica tionto the
population of the study, was originated by Porter to relate
to five need categories similar to those in Maslow's need
hierarchy.
In addition to reporting the demographic data, adminis
trators who were selected to participate in the study on a
stratified random basis completed the questionnaire by giv
ing two responses to each of the 13 statements of job char
acteristics. The first response to each statement was given
by rating on a Likert-type seven-point scale the amount of
137

138
the characteristic which the administrator presently per
ceived as being a characteristic in his administrative
position. The second response was indicated on an identical
scale to report the amount of the characteristic which the
administrator believed should be a characteristic of his
administrative position. A perceived need deficiency was
indicated when the numeric value of the second response
exceeded the numeric value of the first response. The mag
nitude of the deficiency was measured by the numeric dif
ference between the two responses. Thus it was concluded
that the greater the diff'erence between the two responses,
the greater the need deficiency.
The population of this study to which the findings can
be inferred are the 671 chief academic officers and the 671
chief executive officers of institutions accredited by the
Southern Association of Colleges and Schools. Sixteen per
cent (224) of the population's total of 1,342 administrators
responded to the questionnaire. The procedure for randomiza~
tion was based upon a stratification of institution by type
as listed in the Proceedings (March, 1976) of the Southern
Association of Colleges and Schools. From the total sample
of 300 administrators, 224 usable questionnaires (74.6 per
cent) were completed and returned.
The Findings
The one-way analysis of variance statistical technique
was used to analyze the data.

139
Nine null hypotheses were stated with reference to the
13 individual job characteristic statements on the question
naire. Seven of the nine null hypotheses were statistically
rejected by one-way analyses of variance at the .05 confi
dence level.
The following independent variables were controlled for
in data analyses: (1) position, (2) tenure, (3} age, (4)
educational preparation, (5) religious preference, (6) race,
(7) type, (8) full-time enrollment, and (9) control of the
institution.
For variable l,a significant difference was found be
tween deans and presidents in their responses to the follow
ing questionnaire item: "The feeling-of worthwhile accom
plishment in my administrative position." The mean response
given by the presidents was significantly higher than the
average response given by the deans on this statement which
falls in the higher order need area of self-actualization.
Although not significant at the .05 level, the perceived need
deficiencies of the presidents were higher than deans on six
of the other nine items in the higher order need categories.
Administrators with 42 months or less tenure in their
positions were found to be significantly more deficient in
their perceived need satisfaction in relation to three
higher order job characteristics. These characteristics as
stated in the questionnaire were:
1. "The opportunity for personal growth and
140
development in my administrative position. tt
2. "The feeling of self-fulfillment a person gets from
being in my administrative position (that is, the feeling
of being able to use one's own unique capabilities, realiz
ing one's potentialities)."
3. "The feeling of worthwhile accomplishment in my
administrative position."
For variable 3, there were no significant differences
between the three age groups of college and university
administrators. The null hypothesis related to age was
confirmed.
Significant differences were found between administra
tors with master's degrees and administrators with doctor's
degrees on the following three job characteristics:
1. "The opportunity for independent thought and action
in my administrative position."
2. "The opportunity for personal growth and develop
ment in my administrative position. If
3. "The feeling of self-fulfillment a person gets from
being in my administrative position (that is, the feeling of
being able to use onel·s own unique capabilities, realizing
one's potentialities)."
The d,:')ctor "'s degree group had significantly higher
need de:eiciencies on these three items than the master's
degree group. Addi tionally, the doctor I. s degree group
averaged a higher perceived need deficiency than the master I'S

141
degree group on 12 of the 13 questionnaire items.
On variable 5, non-Protestants were found to have a
significantly higher need deficiency than Protestants in
their mean responses to the following job characteristic:
nThe opportunity for personal growth and development in my
administrative position." Differences between the two
groups approached significance with the same interpretation
in three other job characteristics.
Two significant differences were found between the
means of Caucasian administrators and administrators of
minority races. On the following questionnaire items re
lated to prestige, minority administrators had a signifi
cantly higher mean need deficiency than did the Caucasian
administrators:
1. "The prestige of my administrative position inside
the institution (that is, the regard received from others in
the institution}."
2. "The prestige of my administrative position outside
the institution. (that is, the regard received from others
not in the institution}."
For variable 7, it was found that administrators in
four-year and above colleges and universities had signifi
cantly higher mean need deficiencies than did administrators
in two-year colleges on the following characteristics:
1. "The opportunity in my administrative position to
give help to other people. it
r
2. "The opportunity for personal growth and develop
ment in my administrative position. II
142
The first characteristic is related to social satis
faction, and the latter related to self-actualization.
Administrators from four-year institutions averaged a
higher need deficiency on 11 of the 13 questionnaire items.
No significant differences were found between the means
of administrators grouped according to institutional size.
Administrators employed in institutions of higher learning
with less than 3,000 full-time student enrollment were com
pared with administrators employed in institutions with
full-time enrollments over 3,000.
On variable 9, administrators in private colleges and
universities reported a significantly greater average need
deficiency than did administrators in public institutions on
the following questionnaire item: "The opportunity to
develop close friendships in my administrative position."
Conclusions
This study has investigated the psychological phenome
non of differences in perception of personal needs fulfill
ment of the 224 college and university administrators who
participated in the study. Of the 117 statistical proce
dures calculated on the data, 13 indicated nonchance (.05
confidence level) differences between the groups in their
responses to the questionnaire. Based on the findings of

the research, the following conclusive statements are
inferred to the population of the study:
143
1. Academic deans tend to perceive the job character
istics which are related to the higher level needs (autonomy
and self-actualization) as more deficient than do the presi
dents~
2. Administrators with 42 months or less tenure tend
to have higher need deficiencies in the higher order need
areas of autonomy and self-actualization, than administra
tors with more than 42 months tenure.
3. Age was not found to be a factor in differentiating
perceived need deficiencies of college and university admin
istrators.
4. College and university administrators with earned
doctor's degrees tend to perceive more need deficiency than
do their colleagues with master's degrees.
5. Non-Protestants have a higher need deficiency than
Protestants with respect to the opportunity perceived for
personal growth and development in their administrative
positions.
6. Administrators of the minority races tend to have
higher perceived deficiencies of needs related to prestige
than do the Caucasian administrators.
7. Administrators in four-year institutions or above
tend to have a higher average of need deficiency in their job
characteristics than do administrators from two-year insti
tutions.

144
8. Administrators employed in institutions with less
than 3,000 students do not perceive their job character
istics differently than administrators in institutions with
full-time enrollments over 3,000.
9. Administrators from private colleges and univer
sities' perceive less opportunities in their positions to
develop close friendships than do administrators in public
institutions.
Comparison of Research Findings with Previously Reported
Literature
In this section the results of the research are dis
cussed in light of the literature reviewed in Chapter II.
The findings for each independent variable of this study
will be compared and contrasted to those previously reported.
Porter (1962), Trusty and Sergiovanni (1966), and Brown
(1973) all found vertical job position to be a significant
determiner in the satisfaction of the high order needs. The
findings of this study tend to confirm those conclusions in
that the deans w-ere significantly more deficient in their
perception of need fulfillment on one item at the self
actualization level. Also in five of the seven items which
make up the upper division categories of autonomy and self
actualization, the deans' average deficiencies were higher
than that of the presidents.
In relation to length of experience or tenure, two

145
previous studies had contradicted. Trusty and Sergiovanni
(1966) did not find years of experience to be a significant
factor in perceived need fulfillment of secondary school
administrators. However, in the conclusion of the New York
Regent's Study it was stated that the more-satisfied presi
dents characteristically had longer administrative experi
ence. The findings of this present study would tend to con
firm the latter. It was found that a~~inistrators with 43
months or more tenure had significantly less need deficiency
in higher order needs than administrators with shorter
tenure.
As to the age of administrators, this research did not
find significant d~fferences in any category or on any item.
Blunt (l972) had found significant discrepancies between age
groups in the security need category. This research did not
find the same. It did, however, support the findings of
Dahl (1970), Trusty and S,ergiovanni (1976), and Brown (1970),
who all found no significant relationships between adminis ....
trators· satisfaction and age.
Brown (1970) found level of education to be a signifi
cant factor in job satisfaction. His findings indicated
that higher educational level resulted in greater need
satisfaction. The results of this study did not confirm the
conclusion that Brown drew from his findings. On three job
characteristics, it was found that administrators holding
the doctor's degree were significantly more deficient in
146
their perception of needs than were administrators with the
master's degree. Furthermore, on 12 of the 13 characteris
tics the average perceived deficiency for administrators
with doctor's degrees was greater than that of administra
tors with master's degrees. In the one exception (prestige
outside the institution), the difference approached signifi
cance with administrators with master's degrees reporting
a near significant higher deficiency than administrators
with doctor's degrees.
Concerning institutional types, Dahl (1970) had
reported that job satisfaction of junior college administra
tors was very high. The findings of this research would
concur with Dahl's statement in that junior college adminis
trators reported significantly smaller deficiencies on two
job characteristics than administrators from four-year or
above institutions., There was also an additional charac
teristic which approached significance with the same inter
pretation. Furthermore, on all 13 characteristics, adminis
trators from the four-year institutions averaged a higher
need deficiency than administrators from the two-year insti
tutions.
Porter (1963) and Hussein (1968) found some relationship
of need satisfaction to institutional size. Brown (1970)
found no relation between administrators' need satisfaction
and organizational size. The findings of this study confirm
the latter. There was no discernable pattern or trends in

147
the average deficiencies between the administrators who were
grouped according to institutional size.
As to the control factor of the institution, Porter and
Mitchell (1967) and Paine et al. (1966) all found government
sponsored officers and managers to be less satisfied than
their civilian or private counterparts. This study did not
find similar results. Conversely, a social need of adminis
trators in private institutions was found to be significantly
more deficient than those of administrators in publicly
supported institutions.
Applications and Tmplications
The application of the empirical results of this study
are both theoretical and practical. First, the research
findings can be interpreted in light of Maslow's need
hierarchy theory. If one accepts the face validity of the
items from the instrument and their constitution of the
various need categories, a number of interesting comparisons
can be made with Maslow's need hierarchy. For example, self
actualization does appear to be highly valued by the college
and university administrators who participated in this study
in that job characteristics related to self-actualization
were consistently more deficient than other need categories.
The research has practical application in that it does
contribute to the occupational information for prospective
administrators who would like to know how other administra
tors perceive characteristics in their jobs.

148
Some precaution should be taken, however, not to over
generalize the evidence of this study to unrelated popula-
tions. Inferential statements of conclusions and projec-
tions are primarily restricted to academic deans and presi
dents of accredited institutions in the South.
Need for Additional Research
This study has been a preliminary report of perceived
need deficiencies of college and university administrators.
There is a need for additional studies using similar or
divergent methodology. The results of future studies should
be compared with this one to indicate strengths or weak
nesses of the latter.
Replications of this study using another regional
accrediting association as the population could give some
indication as to the effect of geographic locations on per
ceived need deficiencies of administrators in higher
education.
Perceptions of job characteristics of administrators in
different academic roles and position levels should be sur
veyed for differential analysis. For example, differences
in perceptions of need fulfillment between academic depart
ment heads and college and university vice presidents could
be studied.
With additional research, and in time, there may emerge
a better understanding of the vocational dynamics of admin
istrators in higher education.

BIBLIOGRAPHY

~ ';
150
BIBLIOGRAPHY
Books
Applewhite, P. Organizational Behavior. Englewood Cliffs, New Jersey: Prentice-Hall, 1965.
Argyris, C. Integrating the Individual and the Organization . . New York: John Wiley and Sons, Inc., 1964.
Brown, F. The Job Satisfaction of Administrators Within a Multi-Ethnic Setting. Washington: HEW Educational Research Service, 1973.
Gross, Neal, and David Napior. The Job and Career Satisfaction of Men School Principals. Cambridge, Massachusetts: Harvard University Publication, June, 1967.
Hemphill, J. K., and H. J. Walberg. College and University Presidents: An Empirical Study of College and University Presidents in the State of New York. Princeton: Educational Testing Service, 1966.
Herzberg, F., B. Mausner, and B. B. Snyderman. The Motivation to Work. New York: Wiley, 1959-.--
Hoppock, R. Job Satisfaction. New York: Harper and Brothers, 1935.
k~Marconi, Kathenne. Survey of Research on Job Satisfaction. Technical Report, The George Washington University, 1973.
Maslow, A. H. Motivation and Personality. New York: Harper, 1954.
Meyers, L. 8., and N. E. Grossen. Theory, Procedure, and Design. Freedman and Co., 1974.
Behavioral Research San Francisco: W. H.
Nie, Norman H., et ale Statistical Package for the Social Sciences I 2nd Edi t.ion. New York: ~lcGraw-Hill Book Co., 1975.
Parnes, H., et ale Department of
Career Thresholds. Labor, 1966.
Vol. I, u.s.
Perkins, J. A. The University as an Organization. New York: McGraw-Hill Book Company, 1974.

151
Smith, P. C. "The Development of a Hethod of Measuring Job Satisfaction: The Cornell Studies." Studies in Personnel and Industrial Psychology, E. A. Fleishman, ed., Homewood: The Dorsey Press. 2nd Edition, 1967.
Vroom, V. Motivation in Management. New York: American Foundation for Management Research, 1965.
Vroom, V. H., Work and Motivation. New York: John Wiley and Sons, Inc., 1964.
Periodicals
Blunt, P. IIAge and Need Satisfaction Amongst Missle Management in South Africa." Journal of Behavioral Science, 1, No.4, 1972, 227-235.
Carroll, A. B. "Role Conflict in Academic Organizations: An Exploratory Examination of the Department Chairman1s Experience." Educational Administration Quarterly, 10, No.2, 1974, 51-64.
Dahl, E. w. nRole Perceptions and Job Satisfaction Among Lower and Middle Level Junior College Administrators." California Journal of Educational Research, 11, No.2, 1970,57-63.
Dore, R", and M. Meacham. "Self-Concept and Interests Related to Job Satisfaction of Managers." Personnel Psychology, 1973, 26, 49-59.
Edel, E. c. nA Study in Managerial Motivation." Personnel ~dministration, 29, 1966, 31-38.
ElSalmi, A.t1., and L. L. Cummings. "Empirical Research on the Bases and Correlates of Managerial Motivation: A Review of the Literature." Psychology Bulletin, 70, 1968, 127-144.
Eran, M. "Relationships Between Self-Perceived Personality Traits and Job Attitudes in Middle Management. Journal of Applied Psychology, 50, 1966, 424-430.
Gardner, P. L. "Scales and Statistics." Review of Educational Research, 1975, Vol. 45, No.1, pp. 43-57.
Herrick, John S. "Work Motives of Female Executives." Public Personnel Management, 2, No.5, 1973, 380-387.

152
Haire, M. "Psychological Problems Relevant to Business and Industry." Psychological Bulletin, 60, 1959, 169-194.
Haller, E. J. IISome Uncongenial Comments." Educational Administration Quarterly, 3, No.3, 1967, 266-274.
Imparato, Nicholas. "Relationship Between Porter's Need Satisfaction Questionnaire and the Job Descriptive Index." Journal of Applied Psychology, 56, 1972, 397-405.
Maslow, A. H. "A Theory of Human Motivation." Psychology Review, 50, 1943, 370-396.
Miller, E. IIJob Satisfaction of National Union Officials." Personnel Psychology, 19, 1966, 261-274.
Paine, F., S. Carrol, and B. Leete. "Need Satisfaction of Managerial Level Personnel in a Government Agency." Journal of Applied Psychology, 50, 1966, 247-249.
Paine, R. "Factor Analysis of a Maslow-Type Need Satisfaction Questionnaire." Personnel Psychology, 1970, 23, 251-268.
Porter, L. W. "A Study of Perceived Need Satisfactions in Bottom and Middle Management Jobs." Journal of Applied Psychology, 45, No.1, (1961), 1-10 .
. , and U. F. !-1itche11. "Comparative Study of Need ---~ Satisfaction in Military and Business Hierarchies."
Journal of Applied Psychology, 51, No.2, 1967, 139-144.
"Job Attitudes in Management: T Perceived Deficiencies in Need Fulfillment as a Function of Job Level." Journal of Applied Psychology, 46, 1962, 375-384.
"Job Attitudes in Management: IV. Perceived Deficiencies in Need Fulfillment as a Function of Size of Company." Journal of Applied Psychology, 47, (1963), 386-397.
Proceedings. Atlanta.
Southern Association of Colleges and Schools, Volume 28, No.5, March, 1976.
:hOberts, K. H., and C. W. Waters. "Correlates of Job ! :~ Satisfaction and Job Dissatisfaction Among Female
Clerical Workers." Journal of Applied Psychology, 1969, 53, 388-391.
\
153
._ckBaleh, S. D., and J. L. Otis. "Age and Level of Job f' Satisfaction. II Personnel Psychology, 1964 I 17, 425-430.
-~4-Sheppard, H. L. "Discontented Blue-Collar Workers, A case " Study." Monthly Labor Review, XCIV, April, 1971, 25-32.
Smart, J. C., and B. R. Morstain. "Assessment of Job Satisfaction Among College Administrators." Research in Higher Education, 3, 1975, 1-9.
Triandis, H. C. "Differential Perception of Certain Jobs and People by Managers, Clerks, and Workers in Industry." Journal of Applied Psychology, 43, No.4, 1959, 221-225.
Trusty, F. M., and T. J. Sergiovanni. "Perceived Need Deficiencies of Teachers and Administrators." Educational Administration Quarterly, II, Autumn, 1966, 168-180 .
----. , and T. IJ. Sergiovanni. "Teacher and Administrator Need Deficiencies Revisited." Educational Administration Quarterly, 3, No.3, 1967, 275-280.
Waters, L. K., and D. Roach. "A Factor Analysis of Need Fulfillment Items Designed to Measure Maslow Need Categories. H Personnel Psychology, 1973, 26, 185-190.
~lo1f, M. G. "The Relationship of Content and Context Factors to Attitudes Toward Company and Job." Personnel Psychology, 20, 1967, 121-132.
~npublished Works
Bro\-ln, ,F. "Need Satisfac,tion of Educational Administrators." Diss. University of California, Berkeley, 1970.
Herrick, John S. "A Comparison of the Perceptions of Need Fulfillment and of Their Importance to Government Executives." Diss. George Washington University, 1968.
Hussein, I. M. "The Effect of School Size upon Teacher Satisfaction and Participation." Diss. University of Michigan, 1968.
Sergiovanni, T. J. "Investigation of Factors which Affect Job Satisfaction and Job Dissatisfaction of Teachers." Diss. University of Rochester, New York, 1966.

APPENDIXES
L

APPENDIX A
FIRST LETTER !1AILED
WITH
QUESTIONNAIRE
L
OEP'ARTMENT OF
EDUCATIONAL ADMINISTRATION
AND SUPERVISION
THE UNIVERSITY OF TENNESSEE
KNOXVILLE 37916
COLLEGE OF EDUCATION
January 4, 1977
Tenure of college and univ~rsity administrators is at an all time low. Recent research states the.t the average length of employment for educational administrators in higher education is about four years.
Hany factors may be contributing to this phenomenon. The problem of personal needs fulfillment seems to be cne of the most important determiners of job satisfaction. In an effort to research the validity of this assumption, the enclosed questionnaire, which is based on Abraham Maslow's need hierarchy, has been selected for use in this study. The research proposes to help college and university administrators better understand the conditions which influence their positions.
Completion of the questionnaire will take just a few minutes of your valuable time. After completing, please return it in the enclosed envelope. This study is completely confidential; care will be taken not to identify the participants or their institutions.
If you would like to receive a summary of this study, separately return the enclosed post card, and a copy will be sent to you.
I hope you will cooperate in this project.
Uffl/mfs
Sincerely yours,
L. W. ~icho1s
Project Director
156

APPENDIX B
THE QUESTIONNAIRE

This questionnaire is designed to study factors whidt relate to the
admmistration of higher education. The pmpose of this study can best
be realized if you answer the items CAREFULLY and CANDIDLY.
Please respond by blQckening the appropriate circle of each item.
The data collected trom this questionnaire will be report~d in such a
way as to insure that the anonymity of the respondents is protected, as
well as complying with allY other requirements in Ihe Dt-lEW Policy on
Protection of tiuman SUbjects.
1. Position (ty President @ Dedn
L.-________ . __
[.-;~) 2~-J (g) 35 14 @ 45 :;4 @) 551
---------
I~ength of Tenure in Position
(1) Less than 6 months ® 6 months to 18 l1Ionll1S <:31 19 months to 30 months @ :j1 months to 42 months L cfD 43 months and over
4. Educntional Preparation (Highest Degree) CD Bachelors Degree (Z) Masters Degree @ Ed. S. Degree ® Doctorate (5) Honorary Doctorate ® Oilier
~neliglOus Prcferencc I :). G) Plokst311t 6. Race 7. Type of Institution
0) Two-Year
dJ Jewlsll @ Olhpr L @ Calilollc
___ @ NooAIf''',!ed ____ _
------------_.
8. Full-Time Enrollment CD Below 500 ® 501 to 1,500· @ 1,501 to 3,000 @ 3,001 to 6,000 @ 6.0011
____________________________ J
(l) Caucasian (~) Afro·American @ Onental @) American Indldr1 @ Other
(OVER)
9. Control of Institution CD Public
(2) FOUl-Year @ Four-Year plus Graduate School (4) Graduate or Prufessionai
® Private _ .. Non-Sectarian ® Private -_. D"nullllllatlonal

,
I I
I I I
! I
!nstructiCjns: Ljst£.~d uelo)N .,(8 !hirtee~ characteristics of qualitIes connectarJ v/ith r.1d~ljnis1:ia'iive PGsitions. Fer eaCI1 such ::har3cteristic. you wi!! be asked iO give two f"3tings:
21 H'J\~ rnucn of the characteristic is there now connected with jour "dmmistr iltl've pOSition?
0) HcH''' much 01 tnc characteristic do you think ShOL;ld be connected ·,'lIth your admin,strat;v.:; position?
For each of the thirteen items oiease answer the above two questions by blacker:inq a f1;.!iilDN on the rating scale from .j to 7, where'!ow numbers represent low or minimum amounts, and high numbers represent high or m<'lximum amounts.·'
QU~SnONNA.IRE F:)R COLi.SGE .~N.C UNIVERSITY ADMiNiSTRATORS D'3vej~ped oy Lyman \"'1. Por1er
"\e\lised by L. '1'1. Nichols
How much snnl..iiC
i18-~9) T~~ O~JDO(~:J;:it'/ my 2dnL;,istrdt".'e pcsiton. fer par~lC::lpatJ("}(1 in
-ncttlC'ds 3;)'~ ~'rccedures
159
Page 2

APPENDIX C
REQUEST CARDS

The University of Tennessee College of Education Department of Educational
Administration and Supervison Knoxville, Tennessee 37916
Place Stamp Here
~------------------------------------------------------------------~
Please send me Lhe free summary of the study on job satisfaction.
Name ---------------------------------------------Address
----------------------------.--------------City State ----------------.----------- -------------
Zip _________ __
161

APPENDIX D
FOLLOW-UP LETTER
DEPARTMENT OF
EOUCATIONAL AOMIN ISTRATION
AND SUPERVISION
THE UNIVERSITY OF TENNESSEE
KNOXVILLE 37916
COLL.EGE OF EDUCATION
February 2, 1977
A few weeks ago, I wrote to 300 college and university administrators asking them to participate in an important study of job satisfaction. The final result of this study proposes to be most informative to all administra.tors in higher education. This follow-up letter 1s twofold: First, it is a reminder to those who have not returned the questionnaire; and secondly, it is an expression of my appreciation to those who have already responded.
Since there is a slight possibility that you did not receive the first letter, I am enclosing the questionnaire which is being used for this study. It is based on Abraham Maslow's need hierarchy theory and is designed to indicate discrepancies in perceived need fulfillment. After completing, please return it in the enclosed envelope. I assure you that this study is completely confidential, 'and care is being taken not to identify the participants or their institutions.
If you would like to receive a summary of this study, separately return the enclosed post card, and a copy will be sent to you.
Your cooperation in this project will be appreciated.
LWN/mfs
Enclosures
Sincerely,
L. W. Nichols Project Director
163

APPENDIX E
PORTER t S LETTER

UNIVERSITY OF CALIFORNIA, IRVINE
BERKELEY' DAVIS • lRVI~E • LOS ANGELES' RIVERSIDE' SAN DIEGO' SAN FRA."1CISCO SAI'TA BARBARA' SANTA CRt.'7
OFFICE OF THE DEAN
GRADUATE SCHOOL OF ADMINISTRATION
Mr. 1. W. Nichols 3801 Conner Street Chattanooga, Tenn. 37411
Dear Mr. Nichols:
IRVINE, CALIFORNIA 92.664
June 6, 1977
This is in response to your recent inquiry regarding my ~eed Satisfaction Questionnaire.
Reliability data on the instrument have been reported in a Ph.D. dissertation in the School of Public Administration at the University of Southern California by Thomas Carlson (approximately 1969). Also, an article by Dare and M~acham in the Spring, 1973 issue of PersoEnel ysychology provides reliability data. As you can see, a reliability of approximately .80 seems indicated. The question of validity for an instrument of this type presents an interesting conceptual problem because of the issue of "what is the criterion?" against which to measure validity. My own view is that for an instrument of this type, its pattern of relationships with other relevant variables provides a kind of indirect measure. (Apropos of this, )70U may find the article by waters and Roach in the Summer, 1973 issue of Personnel Psychology, is relevant.) Thus, any of the studies that have used the questionnaire and have formed meaningful relationshi.ps with independent variables are providing data relevant to validity.
In conclusion, let me say that the in"?trument was developed for limited purposes (at the time of the original research with it some ten years ago) and mayor may not be appropriate to your needs (vis-a-vis other possible instruments). The questionnaire itself is printed in Managerial Attitudes and Performance, 1968, by myself and Edward E. Lawler. In any event, you have my permission to use it, and my good wishes for the best of luck in your research project.
Sincerely yours,
,(~ 0.P",T~ Lyman W. Porter
L'W'P: em
165
APPENDIX F
TYPICAL COMPUTER CARDS

~ #' -\ I-,,. . - ... .... -:: ... - -::
-~ - ... .... -'" -'" - .... -.. - _e - .... -... - - ... - ... '" ... _e - ... - - Oft"" ... .. -'" - -... .. ... ... -_e - ... .... .. -... .... - - ... .... .. ... .... .. - ... ..... ... .... _I! -_::: - ... .. -::: -= - ... .. : - .... - - -= - .... ... -= ""- - .... ... - .... ..... -... = - - ... :: -= - .... - ... = .. ::: - - ... <: - ... _::: coo,. - ... at" - ... ",,:2 - ... .... on - ... :: -_:2 - .... ..- .. - -:;: - ..... .. -... - .... ..... .. --: - ... .... ... = -= - .... .. j!f - .... ... ... ~ _I:: - -- ... .. .. - ..,:t -:;; - .. - ~ -_:t - .. .. :t - ,." .... -... - ... .... -.... - ... .... ... - ... ~ _e:: - .. .... , .. .. - _::I - ... -.... .. ... -:t - ... ... .... :II - ... ... " ... ... -::: - ... -:
t:J1 ... co : - - ...
..... .... 0 -" - .... - ... ~ -::: - "" "" ... ~ - ... ~ -:: - .. U <:2 ::1 - - -::1 -- ... :: ... -(:4 .... .. " ... -(:il
... : - ... - ... :: ...:: - ... ... :: ... -= -= - .... ... .... E-t ... _J'I ... .... .. ... ., ~ .... .... .. I .... ... .... ... - - -= .... .... en'" :t r'- ..... - _;l:
"J::j ~~ - ... - -~ 0 ii) ... CD ',0 ...- -C :"'- ... ... .... .. ,!J,) .... ... :::
to ..... ... .... Co') -H
0,.0 .... ;::g -iO .... _J'I
.c:: oJ) ..... -'" :~~ U <r H W :fl -p. ~j ...
"" - \jj ...- ->< 'Jl .... ... - ,.0 .... E-t \.I") ..... ... - 0·0 ...
;"j ,;<) ... ,~ ... - i~ i'- ... .. - • .0 -;'0 ... '" - ... _ ..
~. ...'" - -:;, -'" '.(1 - -lJ") .. '-0 i'- - ;r) '.:J - ,';<) .... :rJ ... - ',.0 ... <I) ... .... - ... " tt) '.0 .... .... - en'" ..0
'J:") ... ... en'" (') ... :: -;'- - '.J:J 'D - '1" ~ -- oft ... '::» - "1" )J - .... - :~t) .-... ... ... ... ... - -.... .... - --:r .... ::j ',1" .... .. ':t' ... ..
'~') -D .- - ... ~ ,,:t) - .... -- - 1"lJ. ... -"~"""""'" -......... ..... -,.-" .. ".-,~---".~,~-... // --~---=-(? ...... __ 00"_ ...... " .. .-.; .. _.,
(J)
..-1 +J r-! en c: en (J)
0 Q) "d 0 c: "d '.-j "d 14 '.-1 en 14 c.. . .-j en 0. Q) en :>1 (J) U :>10 U E-t Q) E-t
14 p..
167
L

APPENDIX G
EXPLANATION OF FORMULA
FOR
ONE-WAY ANOVA

L
Nie et al.* (1975) explain the basis of analysis of
variance as the decomposition of variation of sums of
squares corrected for the means (SS). An illustration of
the procedures of a one-way analysis of variance with a
dependent variable Y and a categorical independent variable
(factor A} is as follows:
55 :1 5Sbetween + 5Swithin
where
5Swithin
(y, , J~
in which Y is the mean of Y over the whole sample (known as the grand mean) I
and the s~~ations are over all individual cases i in each category j of the factor A
in which Y~. is the mean of Y in the catego~y j~ and Nj ,is the number of cases ~n categcry J
One-way ANOVA tests the null hypothesis that sample
groups were drawn from the same population which is symbol-
ized: 0, = 2 6\ = o. Therefore, the ANOVA procedure
calculates the within group and between group variance as
independent estimates of the same quality. The formula for
the one-way ANOVA procedure is:
F = SSerror / (N - k) MSerror
Where (K - 1) is the n~~er of categories in A - 1,
and (N - k) degrees of freedom.
*From Statistical Package for the Social Sciences, Second Edition, Nie.et al., New York: McGraw-Hill Book Company, 1975, pp. 400-401.
169
APPENDIX H
TYPICAL CROSSTABULATION

0'1/211 n PAGI" 19
FILV (CHI-:f\T[.!N flATI ::.: OSI) Jill)
.. • • .. • .. .. .. • .. • .. * * .. • • • :' H r ISS T f\ II II " A T I () ~J (l r ..... * .. .. • • • • .. ., .. .. .. * :t t V flPO] A(;F:
• .. t .. • * • • • .. .. .. t .. • • • .. .. 1\'( VAR50 SUCIAL ....... '* .............. , ........ ..- .. .. .. • .. .. .. .. .. .. ... PAGE 1 III-"
V l\f/',O Clll/tJ r I
kfl';J PCT 1 fHI"') COL p:r I Tfl'fl\J, T!lT PCT r 0.1 1.1 2.1
VAPO] --------1--------1----·---1--------1 (). I 2 I '1 1 0' () 141.1 I /;".1 f 0.01 7.7 I 1.11 r 1.1l 1 0.0 I 1 0.'1 t t.A 1 0.0 I
-J-~----~-I--------t--------I 1. 1 1 J I I 3 t <)
I 20.0 I } il • 0 J 110.0 t '} • 2 J ~.I\ I \.0 1 l.1l I I 0.4 I 'l.1 J 1.] I
-1---~----r--------l--------1 } • 1 (I J ~ r) I 2. ~ I () '/
I 11.1 I ')).2 J ~1 •• I 2q.9 1 :>2.0 t ~ •• " T 7.<).1 I J 4.0 I l'1.h I to.l I
-1--------r--------I------·-1 J • I 1 q I ,1 1 Til I q 1
1 70. q 1 'l'1 • 1 1 H. 1 I <1 n • (j I 4h.J J ~li.4 1 1'1.) I 1 H • r; , 1 ;1 •. l t 1 l. H r
-r--------I--------I-~--~---I 1. J 10 t Ji I )'2 I '-,<\ ,J 1H.? I 11.H J '10.0 I /4.6 I )1 .1 I ') ) • 1 r ')" • ~~ r J '1 • I) II! I • .~ ( <) • H I
-1--------1--------1--------1 (' I II, II '1 \J1 1 PH I '/ ) ') ,1
\' I IT I'd , 1 Ii. i 'If, • It i') • J 1 () q • n

VITA
Leldon Wade Nichols was born in Russellville, Alabama,
on February 19, 1944. He attended elementary schools in
Alabama, Florida, and Kentucky. He graduated from
Russellville High School, Russellville, Alabama, in 1962.
In June 1963 he entered Tennessee Temple College, and in May
1967 he received a Bachelor of Arts Degree in Psychology.
In the spring semester of 1969 he entered the University of
Alabama Graduate School and began study toward a Master's
Degree. The Master of Arts Degree in Student Personnel
Work and Higher Education was awarded in May 1969.
From 1969 to 1971 he was employed by Tennessee Temple
College as an instructor in Psychology. He served as
Chairman of the Psychology Department at Tennessee Temple
from 1971 to 1976. From 1976 to the present he has served
that institution as Academic Dean. He received the Doctor
of Education Degree with a major in Educational Administra
tion and Supervision in August, 1977.
Mr. Nichols will continue his employment with Tennessee
Temple College as Academic Dean after graduation.
He is married to the former LeeAnne Roberson of
Chattanooga, Tennessee. They have two children, Robbie and
Caroline.
172