gerald bowes, ph.d. patricia fernandez senior water
TRANSCRIPT

TO: Gerald Bowes, Ph.D.
Manager, Cal/EPA Scientific Peer Review Program Office of Research, Planning and Performance
FROM: Patricia Fernandez Senior Water Resources Engineer DIVISION OF WATER RIGHTS
DATE: March 22, 2012
SUBJECT: REQUEST FOR EXTERNAL PEER REVIEW OF AGRICULTURAL ECONOMIC MODELING FOR THE PHASE 1 UPDATE TO THE 2006 WATER QUALITY CONTROL PLAN FOR THE SAN FRANCISCO BAY/SACRAMENTO-SAN JOAQUIN DELTA ESTUARY (2006 BAY-DELTA PLAN)
In accordance with Health and Safety Code section 57004, the State Water Resources Control Board (State Water Board), Division of Water Rights (Division) submits this request for identification of at least three peer reviewers to conduct a peer review of the State Water Board’s draft report titled “Agricultural Economic Effects of Lower San Joaquin River Flow Alternatives” (Agricultural Economics Report). This report is part of the environmental documentation being prepared by the State Water Board in support of potential Phase 1 modifications to the 2006 Bay-Delta Plan, which include modifications to the San Joaquin River flow objectives for the protection of fish and wildlife beneficial uses, and water quality objectives for the protection of southern Delta agricultural beneficial uses and the program of implementation for those objectives. The Draft Agricultural Economics Report was developed to provide estimates of the potential effects to agricultural production and related sectors of the Lower San Joaquin River (LSJR) watershed economy from estimated changes in allowable surface water diversions that may be needed to achieve potential LSJR flow alternatives. For this peer review, we suggest that you solicit reviewers with expertise in the following areas: 1. Agricultural economics
2. Experience with the use of economic models, such as the Statewide Agricultural Production (SWAP) and Impact Analysis for Planning (IMPLAN) models, and the interpretation of model results
The following attachments are enclosed in this request: Attachment 1: Plain English Summary of the Draft Report “Agricultural Economic Effects
of Lower San Joaquin River Flow Alternatives”

Gerald Bowes, Ph.D. - 2 - MAR 22 2012
Attachment 2: Listing of Economic Conclusions or Assumptions Subject to Review
Attachment 3: List of Participants Involved in Development of the Draft Agricultural Economics Report
Attachment 4: Rationale for the Development of the Draft Agricultural Economics Report
Attachment 5: Draft Agricultural Economics Report Expected Date of State Water Board Action: The State Water Board released the Draft Agricultural Economics Report for public review on February 24, 2012, and will be holding a public workshop on this report and the related environmental documentation in June 2012. The final documents are anticipated to be released in August 2012. In order to meet this schedule, we request receipt of the peer reviewers’ comments within 20 days of receipt of the peer review package. If you have any questions regarding this request, please contact me at (916) 319-9141, or via email at [email protected]. Attachments cc: Les Grober
Assistant Deputy Director Division of Water Rights Diane Riddle Environmental Program Manager Hearings and Special Projects Section Karen Niiya Senior Water Resource Control Engineer Special Projects Unit Mark Gowdy Senior Water Resource Control Engineer Special Projects Unit

Gerald Bowes, PhD. - 3 - MAR 22 2012
Attachment 1: Plain English Summary of the Draft Report “Agricultural Economic Effects of Lower San Joaquin River Flow Alternatives”
INTRODUCTION The State Water Resources Control Board (State Water Board) is in the process of reviewing and potentially modifying the San Joaquin River flow objectives for the protection of fish and wildlife beneficial uses and water quality objectives for the protection of southern Delta agricultural beneficial uses and the program of implementation for those objectives included in the 2006 Water Quality Control Plan for the San Francisco Bay/Sacramento-San Joaquin Delta Estuary (2006 Bay-Delta Plan). In support of that review, the State Water Board is developing environmental and technical documents that analyze potential amendments to the 2006 Bay-Delta Plan and their associated potential environmental and economic impacts. Part of the State Water Board’s evaluation of potential economic impacts is contained in a draft report titled “Agricultural Economic Effects of Lower San Joaquin River Flow Alternatives” (Agricultural Economics Report), which is the subject of this peer review. The Draft Agricultural Economics Report provides estimates of the potential effects to agricultural production and related sectors of the Lower San Joaquin River (LSJR) watershed economy from estimated changes in allowable surface water diversions that may be needed to achieve potential LSJR flow alternatives. This analysis does not address potential effects to other beneficial uses or environmental resources potentially caused by the LSJR flow alternatives. Those effects will be addressed separately in the environmental document that will be written for the proposed amendments to the 2006 Bay-Delta Plan. The analysis in the Draft Agricultural Economics Report followed three major steps. First, the LSJR flow alternatives’ effects on allowable surface water diversions were estimated relative to baseline conditions using the Water Supply Effects (WSE) model previously described in Chapter 5 of the State Water Board’s October 2011 Draft Scientific Basis for San Joaquin River Flow and Southern Delta Salinity Objectives (Scientific Report). For the purposes of the analysis, baseline flow conditions were assumed to be the conditions that existed in the LSJR watershed in 2009. Second, the Statewide Agricultural Production (SWAP) model, an agricultural production model, was used to estimate the direct effect of the changes in allowable surface water diversions on agricultural production and related revenues. Third, the Impact Analysis for Planning (IMPLAN), a regional economic model, was used to estimate the total economic and jobs effects, including the indirect and induced effects, of the changes in allowable surface water diversion on agricultural production on all connected sectors of the regional economy. Please note that the analysis and results reported in the section of the Draft Agricultural Economics Report titled “Surface Water Diversion Estimates” are used as inputs to the economic analysis, and are not the subject of this peer review. As stated previously, the surface water diversion estimates were generated using methods described in a previously peer-reviewed document, the Scientific Report, which can be found at: http://www.waterboards.ca.gov/waterrights/water_issues/programs/bay_delta/bay_delta_plan/water_quality_control_planning/docs/scientific_report.pdf. The peer review comments on the Scientific Report can be found at: http://www.swrcb.ca.gov/water_issues/programs/peer_review/sanjoaquin_river_flow.shtml

Gerald Bowes, PhD. - 4 - MAR 22 2012
The State Water Board will make a determination, concerning the required percentage of unimpaired flow, based, in part, on the consideration of environmental impacts of LSJR flow alternative percentages (20, 40, and 60 percent), economic information, and information concerning other competing beneficial uses of water. The State Water Board is required to consider a reasonable range of economic factors and economic considerations in its deliberative process. The Draft Agricultural Economics Report that is the subject of this peer review provides an analysis of the potential agricultural economic effects of the range of unimpaired flows (20 to 60 percent) that are being considered. The conclusions in the Draft Agricultural Economics Report will be used to inform the State Water Board’s decision-making process in the selection of the preferred LSJR flow alternative.

Gerald Bowes, PhD. - 5 - MAR 22 2012
Attachment 2: Listing of Economic Conclusions or Assumptions Subject to Review
The statutory mandate for external scientific peer review (Health and Safety Code, § 57004) states that the reviewer's responsibility is to determine whether the scientific portion of any proposed rule is based upon sound scientific knowledge, methods, and practices. Similarly, for this review of the agriculture-related economic effects, we request that you make a determination whether the subject economic analysis is based upon sound economic knowledge, methods, and practices. This determination should be made for each of the following issues regarding the analyses in the draft report titled “Agricultural Economic Effects of Lower San Joaquin River Flow Alternatives” (Agricultural Economics Report). An explanatory statement is provided for each issue to focus the review. For those work products which are not proposed rules, such as the case with the review that is the subject of this document, reviewers must measure the quality of the product with respect to the same exacting standard as if it was subject to Health and Safety Code section 57004. The State Water Board requests that the peer reviewers review the Draft Agricultural Economics Report, which includes estimates of the potential effects on agricultural production and related Lower San Joaquin River (LSJR) watershed economy from estimated changes in allowable surface water diversions needed to meet potential LSJR flow alternatives. This peer review is requested to assure that the best economic analysis and available models are appropriately used and interpreted. Please note that the analysis and results reported in the section of the report titled “Surface Water Diversion Estimates” are used as inputs to the economic analysis, and are not the subject of this peer review. These inputs were generated using methods described in a previously peer-reviewed document, titled “Draft Scientific Basis for San Joaquin River Flow and Southern Delta Salinity Objectives (Scientific Report) which can be found at: http://www.waterboards.ca.gov/waterrights/water_issues/programs/bay_delta/bay_delta_plan/water_quality_control_planning/docs/scientific_report.pdf. In the event peer reviewers have a question on a topic or issue in the Draft Agricultural Economics Report, which requires further clarification from the State Water Board, they are asked to submit their request for clarification to Patricia Fernandez via email at [email protected]. All requests for clarification will be responded to via email and will be made a part of the report. Economic Conclusions or Assumptions Regarding the Analysis Approach in the Draft Agricultural Economics Report
1. Use of the Statewide Agricultural Production (SWAP) model was based on sound
economic knowledge, methods, and practices.
State Water Board staff reviewed models for estimating agricultural production and revenues associated with the surface water diversions potentially needed under the LSJR flow alternatives and baseline conditions. Staff found that the SWAP model was an appropriate model for estimating the effect of the LSJR flow alternatives and baseline conditions. For the purposes of this analysis, the SWAP model was calibrated to the Department of Water Resources (DWR) estimates of land use and applied water data for

Gerald Bowes, PhD. - 6 - MAR 22 2012
water year 2005, because this water year represented the most recent normal water year in terms of both water availability and crop prices. This data is presented in Table X-7 of the report. Annual surface water diversion changes estimated in the section of the report titled “Surface Water Diversion Estimates” were input to the SWAP model to estimate the associated agricultural production and revenues. For each water year, SWAP uses a Positive Mathematical Programming (PMP) methodology to calculate the crop acreage mix that would maximize revenue from the annual available surface water diversions. The output from the SWAP model was used as input to the IMPLAN model. State Water Board staff believes the use of the SWAP model with the described assumptions and approach was based on sound economic knowledge, methods, and practices.
2. Use of version 3 of the Impact Analysis for Planning (IMPLAN) model was based on sound economic knowledge, methods, and practices.
Version 3.0 of the IMPLAN model was used to predict the indirect, and induced economic effects associated with the changes to agricultural direct revenue estimated by the SWAP model. Output from the SWAP model, appropriate region-specific multipliers, and other assumptions, were input to IMPLAN to estimate the indirect and induced economic activity on the agricultural industry in the LSJR, and related effects on other connected sectors of the economy. State Water Board staff believes the use of the IMPLAN model with the described assumptions and approach was based on sound economic knowledge, methods, and practices.
3. The LSJR flow alternatives have the potential to affect the amount of allowable surface water diversions from within the LSJR watershed. The economic analysis assumes that construction or installation of alternative water supplies would not be implemented in response to changes in estimated allowable surface water deliveries. Staff believes this is a conservative assumption.
For the purposes of this analysis it was assumed that irrigation water from alternative water supplies, such as groundwater pumping or Central Valley Project water deliveries, would not be increased to make up for any decrease in surface water diversions. This is a conservative assumption that would result in higher economic impacts than an analysis that assumes implementation of alternative water supplies.
4. Reasonableness of other assumptions.
Other assumptions beyond those identified above were utilized in the analysis. For example, a time series of 82 annual estimates of differences in crop acreages and revenue was used to estimate effects on crop acreages and agricultural revenue. It was also assumed that surface water diversion reductions can be applied equally across the Central Valley Production Model regions analyzed. Another key assumption in the IMPLAN analysis was that trading patterns between industries were fixed. State Water Board staff believes these assumptions and others, as described in the report, are conservatively valid and are consistent with those used in similar types of economic analyses.
5. The level of effort used in analyzing the potential economic effects to agriculture covers a reasonable range of economic factors and considerations.
As a certified regulatory program, the State Water Board is required to take economic considerations into account, but is not required to perform a cost/benefit analysis. Therefore, State Water Board staff believes the level of detail in the report’s analysis

Gerald Bowes, PhD. - 7 - MAR 22 2012
appropriately considers a reasonable range of economic factors and economic considerations as they relate to the impacts of the proposed project on agriculture, is consistent with the requirements of a certified regulatory program, and provides adequate input to the State Water Board’s decision-making process.
6. The results of the analysis are valid.
The Draft Agricultural Economics Report contains conclusions regarding the agricultural economic effects of the proposed flow alternatives. Table X-9 of the report displays the predicted changes in economic output for crop production that would be associated with the proposed flow alternatives. Estimates of total sector output changes from baseline conditions ranged from an increase of 0.3 percent to a decrease of 4.1 percent. Table X-10 of the report displays the estimated change in regional employment that would be associated with the proposed flow alternatives, which ranged between an increase of 0.3 percent to a reduction of 4.1 percent from baseline conditions. State Water Board staff believes these results are valid estimates of the effects of the proposed flow alternatives on the regional economy of the LSJR watershed.
7. Other Issues
Additionally, reviewers are not limited to addressing only the specific issues presented above, and are asked to contemplate the following “Big Picture” questions: In reading the Draft Agricultural Economics Report, are there any additional agriculture-
related economic issues that should be a part of the report’s analysis that are not described above? Effects of the LSJR flow alternatives on other non-agriculture related sectors of the economy will be addressed elsewhere in the SED.
Taken as a whole, is the report’s analysis based upon sound economic knowledge, methods, and practices?
Reviewers should note that some conclusions or proposed actions, for instance selection of flow alternatives for the amended Bay-Delta Plan, may rely significantly on professional judgment in instances where economic data and our understanding of the underlying processes are not as extensive as may be ideal. Nonetheless, the evaluation of the economic data and use of professional judgment are appropriate in the context of current economic knowledge regarding such actions. In these situations, the proposed course of action is favored over no action. The preceding guidance will ensure that reviewers have an opportunity to comment on all aspects of the agriculture-related economic effects of the proposed State Water Board action. At the same time, reviewers also should recognize that the State Water Board has a legal obligation to consider and respond to all feedback on the proposed rules. Because of this obligation, reviewers are encouraged to focus feedback on economic issues that are relevant to the central regulatory elements being proposed.

Gerald Bowes, PhD. - 8 - MAR 22 2012
Attachment 3: List of Participants Involved in Development of the Draft Agricultural Economics Report State Water Board staff, with the assistance of consultants, prepared this report using regulatory guidance, available economic literature, and the examples of other regulatory programs. ICF International and UC Davis are assisting the State Water Board with the development of a Substitute Environmental Document and supporting documents, which include this report. ICF International and UC Davis are under separate consultant contracts with the State Water Board. State Water Board staff: Les Grober Mark Gowdy Lucas Sharkey Collaborating non-staff members: Russ Brown (ICF International) Nicole Williams (ICF International) Tom Wegge (ICF International subconsultant) Mark Roberson (ICF International subconsultant) Richard Howitt (UC Davis) Josue Medellin-Azuara (UC Davis) Jay Lund (UC Davis)

Gerald Bowes, PhD. - 9 - MAR 22 2012
Attachment 4: Rationale for the Development of the Draft Agricultural Economics Report San Francisco Bay/Sacramento-San Joaquin Delta Estuary Water Quality Control Planning The State Water Resources Control Board (State Water Board) is in the process of reviewing and potentially modifying the San Joaquin River flow objectives for the protection of fish and wildlife beneficial uses and water quality objectives for the protection of southern Delta agricultural beneficial uses and the program of implementation for those objectives included in the 2006 Water Quality Control Plan for the San Francisco Bay/Sacramento-San Joaquin Delta Estuary (2006 Bay-Delta Plan). The State Water Board is considering amendments to the 2006 Bay-Delta Plan pursuant to the provisions of the Porter-Cologne Water Quality Control Act (Porter-Cologne) and the federal Clean Water Act. Fundamentally, a water quality control plan consists of three parts: 1) establishment, for the waters within a specified area, of the beneficial uses to be protected; 2) establishment of water quality objectives; and 3) a program of implementation (Wat. Code, § 13050(j)). Together, the beneficial uses and the water quality objectives established to reasonably protect the beneficial uses are called water quality standards, under the terminology of the federal Clean Water Act. Components of the Bay-Delta Plan when implemented also: 1) carry out provisions of the reasonable use doctrine (Cal. Const. Art. X, § 2; Wat. Code, §§ 100, 275, and 1050); 2) protect public trust resources (See National Audubon Society v. Superior Court (1983) 33 Cal.3d 419, 189 Cal.Rptr. 346); and 3) carry out statutory principles pertaining to water rights (Wat. Code, §§ 183, 1243, 1243.5, 1251, 1253, and 1256-1258). As such, the 2006 Bay-Delta Plan addresses the interrelated fields of water quality and water supply and plans for their coordination. The current San Joaquin River flow objectives for the protection of fish and wildlife beneficial uses are included in Table 3 on page 15 of the 2006 Bay-Delta Plan, and the program of implementation for these objectives starts on page 23. Water quality objectives for the protection of agricultural beneficial uses are currently included in Table 2 on page 13 of the 2006 Bay-Delta Plan, and the program of implementation for these objectives starts on page 27. Draft Changes to the 2006 Bay-Delta Plan The State Water Board developed a report titled “Technical Report on the Scientific Basis for Alternative San Joaquin River Flow Objectives for the Protection of Fish and Wildlife Beneficial Uses and Water Quality Objectives for the Protection of Southern Delta Agricultural Beneficial Uses and the Program of Implementation for Those Objectives” (Technical Report) in October 2010. The report was modified in response to comments received at two public workshops in 2011, and then submitted for scientific peer review in October 2011. A revised draft of the Technical Report, renamed the Draft Scientific Basis for San Joaquin River Flow and Southern Delta Salinity Objectives (Scientific Report), was released in February 2012, and contained modifications to address the comments received through the scientific peer review. This report contains State Water Board staff’s review of existing scientific information concerning flow needs for the protection of fish and wildlife beneficial uses in the San Joaquin River basin, and salinity and other needs for the protection of southern Delta agricultural beneficial uses. The Scientific Report also contains information about tools that will be used to develop and evaluate alternatives for those objectives. The tools described in the Scientific Report were used to develop the flow inputs needed for the economic analysis in the Draft Agricultural Economics Report.

Gerald Bowes, PhD. - 10 - MAR 22 2012
One of the conclusions in the Scientific Report is that higher and more variable inflows during the spring period (February through June) from the three salmon bearing tributaries to the mainstem San Joaquin River (Stanislaus, Tuolumne, Merced Rivers) are needed to reasonably protect fish and wildlife beneficial uses. The Scientific Report also noted, however, that flow objectives established for the reasonable protection of fish and wildlife beneficial uses would need to consider the competing demands for water. Competing beneficial uses of water in the San Joaquin River watershed include municipal and industrial, agricultural, and other environmental uses. The State Water Board’s draft program of implementation for the flow objectives specifies that the narrative San Joaquin River flow objective is to be implemented through water right actions, water quality actions, and actions by other agencies in an adaptive management framework informed by required monitoring, special studies, and reporting. The purpose of the implementation framework is to achieve the narrative San Joaquin River flow objective by: 1) providing less altered flow conditions that more closely mimic the shape of the unimpaired1 hydrograph, including: increased flow of a more natural spatial and temporal pattern; 2) providing for adaptive management, in order to respond to changing information on flow needs and to minimize water supply costs; and 3) allowing for and encouraging coordination and integration of existing and future regulatory processes. Specifically, the draft program of implementation provides for maintaining a certain percent of unimpaired flow (20 to 60 percent), during February through June, from each of the three salmon bearing tributaries to the mainstem San Joaquin River at Vernalis. A minimum flow that must be maintained at Vernalis during this period, along with a maximum flow at which point additional flows would not be required, will also be specified. Statutory Requirements for Economic Analysis The State Water Board’s water quality control planning process is a certified regulatory program under the California Environmental Quality Act (CEQA), and is not required to prepare an environmental impact report. Instead, certified regulatory programs are required to prepare a substitute environmental document (SED) that describes the proposed project, project alternatives, and mitigation measures to avoid or reduce any significant or potentially significant effects that the project might have on the environment. As such, the State Water Board is not required to include a discussion of economic or social effects, or an economic cost/benefit analysis of a proposed project. However, California Public Resources Code section 21159(a)(c) requires environmental analyses conducted in accordance with a certified regulatory program to take into account a reasonable range of environmental, economic, and technical factors, population and geographic areas, and specific sites. In addition, California Water Code section 13141 specifies that a water quality control plan shall include an estimate of the total cost of the program, together with identification of potential sources of funding, and that when establishing water quality objectives, the State Water Board must take economic considerations into account (among other things).
1 In this case, unimpaired flow is a modeled flow generally based on historical gage data with factors applied to primarily remove the effects of dams and diversions within the watersheds. The modeled unimpaired flow does not attempt to remove changes that have occurred such as channelization and levees, loss of floodplain and wetlands, deforestation, and urbanization.

Gerald Bowes, PhD. - 11 - MAR 22 2012
There is a high level of stakeholder interest in the water quality planning process for amending the 2006 Bay-Delta Plan due to the wide variety of beneficial uses associated with the waters of the Delta. Examples of the beneficial uses of the Delta include agricultural supply, municipal and domestic supply throughout a large portion of California, hydroelectric generation, fish migration, and preservation of endangered species. Given the level of stakeholder interest, the State Water Board has chosen to prepare an analysis of the potential economic effects to agriculture that may result from the proposed flow alternatives.

State Water Resources Control Board
California Environmental Protection Agency
DRAFT
APPENDIX X*: AGRICULTURAL ECONOMIC EFFECTS OF LOWER SAN JOAQUIN RIVER FLOW
ALTERNATIVES
February 2012
*Lettering of Appendix to be determined during the preparation of the Draft Substitute Environmental Document


DRAFT Evaluation of San Joaquin River Flow and Southern Delta Water Quality Objectives and Implementation
X‐1 February 2012
ICF 00427.11
Appendix X DRAFT Agricultural Economic Effects of Lower San
Joaquin River Flow Alternatives
X.1 Table of Contents Appendix X DRAFT Agricultural Economic Effects of Lower San Joaquin River Flow
Alternatives .............................................................................................................. X‐1
X.1 Table of Contents ............................................................................................................. X‐1
X.2 Introduction ..................................................................................................................... X‐2
X.3 Surface Water Diversion Estimates ................................................................................. X‐3
X.3.1 WSE Model Inputs and Approach .................................................................................... X‐3
X.3.2 Summary of Results ......................................................................................................... X‐6
X.4 Effects on Agricultural Production ................................................................................. X‐12
X.4.1 SWAP Model Overview .................................................................................................. X‐12
X.4.2 Model Inputs and Approach .......................................................................................... X‐14
X.4.3 Summary of Results ....................................................................................................... X‐19
X.5 Effects on Regional Economy ......................................................................................... X‐28
X.5.1 IMPLAN Model and Approach ....................................................................................... X‐28
X.5.2 Summary of Results ....................................................................................................... X‐29
X.6 References ..................................................................................................................... X‐34

State Water Resources Control Board California Environmental Protection Agency
DRAFT Agricultural Economic Effects of Lower San Joaquin River Flow Alternatives
DRAFT Evaluation of San Joaquin River Flow and Southern Delta Water Quality Objectives and Implementation
X‐2 February 2012
ICF 00427.11
X.2 Introduction AgriculturalproductionintheLowerSanJoaquinRiver(LSJR)watershedisdependentonirrigationwatersupplyfromvarioussources,includingsurfacewaterdiversions,groundwaterpumping,anddeliveriesfromthestateandfederalwaterprojects.TheLSJRflowobjectiveshavethepotentialtoaffecttheamountofallowablesurfacewaterdiversionsfromwithintheLSJRwatershed,andhenceagriculturalproductiondependentonthosediversions.
TheanalysisinthisappendixestimatesthepotentialeffectstoagriculturalproductionandrelatedsectorsoftheLSJRwatershedeconomyfromestimatedchangesinallowablesurfacewaterdiversionsneededtomeettheLSJRflowalternatives.ThisanalysisdoesnotaddresspotentialeffectstootherbeneficialusesorenvironmentalresourcespotentiallycausedbytheLSJRflowalternatives.ThoseeffectsareaddressedseparatelyinvariouschaptersoftheSubstituteEnvironmentalDocument(SED).
Theanalysisinthisappendixfollowsthreemajorsteps,eachdescribedinSectionsX.3throughX.5below.First,theeffectsonallowablesurfacewaterdiversionsforeachoftheLSJRalternativesareestimatedrelativetobaselineconditionsusingtheWaterSupplyEffects(WSE)model.Forthepurposesoftheanalysis,baselineflowconditionsarethoserepresentingwhatexistedintheLSJRwatershedin2009.Second,theStatewideAgriculturalProduction(SWAP)model,anagriculturalproductionmodel,isusedtoestimatethedirecteffectofthesechangesonagriculturalproductionandrelatedrevenues.Third,ImpactAnalysisforPlanning(IMPLAN),aregionaleconomicmodel,isusedtoestimatethetotaleconomicandjobseffects,includingtheindirectandinducedeffects,ofthesechangesinagriculturalproductiononallconnectedsectorsoftheregionaleconomy.
TherearethreeLSJRflowalternatives,eachconsistingofspecifiedpercentageofunimpairedflowrequirementfortheStanislaus,Tuolumne,andMercedRivers.Foraparticularalternative,eachtributarymustmeetthespecifiedpercentageofitsownunimpairedflowatitsconfluencewiththeLSJRduringthemonthsofFebruarythroughJune.Thepercentageunimpairedflowrequirementsare20%,40%and60%respectivelyforeachLSJRflowalternative,andapplywhenflowsareotherwisebelowaspecifiedtriggerlevel.Flowsmustnotdropbelowspecifiedlevelsoneachtributary,andtogethermustmaintainaminimumflowontheSJRatVernalis.SpecifictriggerandminimumflowlevelsandotherdetailsoftheLSJRflowalternativesarepresentedinSection3.2oftheSED,andarethebasisforhowthealternativesaremodeledinthisappendix.
TheallowablesurfacewaterdiversionsandassociatedagriculturalproductiongeneratedbySWAPandrelatedeconomicvalueestimatedbyIMPLANforeachoftheLSJRflowalternativesarecomparedagainstthoseestimatedforbaselineflowconditionsintheLSJRwatershed.Thenetdifferenceistheagriculturalproductionandrelatedeconomiceffectattributedtoimplementingthatalternative.TheanalysesincorporatesseveralconservativeassumptionsasdetailedinSectionsX.3throughX.5,including:noincreaseduseofgroundwatertoaugmentwatersupplyreductionsfortheSWAPanalysisandfixedtradingpatternsbetweenindustriesforIMPLAN.Ingeneral,asflowrequirementsoneachoftheriversincrease,thesurfacewaterdiversionswouldneedtodecrease,andhaveacorrespondingeffectonagriculturalproductionandtheregionaleconomy.

State Water Resources Control Board California Environmental Protection Agency
DRAFT Agricultural Economic Effects of Lower San Joaquin River Flow Alternatives
DRAFT Evaluation of San Joaquin River Flow and Southern Delta Water Quality Objectives and Implementation
X‐3 February 2012
ICF 00427.11
X.3 Surface Water Diversion Estimates ThissectiondescribesinputstotheStateWaterBoardLSJRWSEmodelanditsestimatesofallowableagriculturalsurfacewaterdiversionsforthethreeLSJRflowalternatives.Italsodescribesthedifferencesbetweenthoseestimatesandthebaselinecondition.AnoverviewoftheWSEmodelanditscalculationsarepresentedinAppendixX(drafttechnicalreport).Toimprovetheresolutionofthisanalysis,inadditiontothe20%,40%,and60%unimpairedflowLSJRalternatives,modelrunswerealsoperformedatintermediatelevelsof30%and50%ofunimpairedflow.Estimatesofthesurfacewaterdiversionsallowableunderbaselineconditionswereobtaineddirectlyfromthe“Current(2009)Conditions”CALSIMIImodelrunfromtheCaliforniaDepartmentofWaterResources(DWR)StateWaterProjectReliabilityReport2009.TheseestimatesarethenusedasinputstotheagriculturalproductionmodeldescribedfurtherinSectionX.4.
X.3.1 WSE Model Inputs and Approach
TheWSEmodelisamonthlywaterbalancespreadsheetmodelthatestimatesallowablesurfacewaterdiversionsandreservoiroperationsneededtoachievethetargetflowrequirementsoftheLSJRflowalternativesonthethreeeast‐sidetributariestotheLSJR.AmoredetaileddescriptionofthecalculationsinthemodelispresentedinAppendixX(drafttechnicalreport).Themodelallowsforuser‐definedconstraintsoneachtributary,including:1)minimumandmaximummonthlyflows,2)diversiondeliveryrulecurves,3)monthlydiversiondistributionpatterns,and4)reservoirfloodcontrolstoragelimitations.Withintheseconstraintsthemodelusesawaterbalancetocalculatetheresultingriverflows,allowablesurfacewaterdiversions,andreservoirstoragelevels.Modelcalculationsareperformedonamonthlytimestepforeachtributaryusingthe82yearsofCALSIMIIhydrologyasinputtoNewMelones,NewDonPedro,andLakeMcClurerespectively.
Model Inputs
ThefollowingsetsofinputswereusedintheWSEmodeltoestimatetheeffectsoftheLSJRFlowAlternatives:
TableX‐1containstheminimummonthlyflowrequirementsandmaximumtriggerlevelsforeachtributary.ThetargetpercentunimpairedflowrequirementsforaparticularLSJRflowalternativeonlyapplywhenflowsarebelowthespecifiedtriggerleveloneachtributary.Thiseliminatesthepercentageunimpairedflowrequirementwhenflowsareabovealevelthatcouldpotentialcontributetofloodingorothernegativedownstreameffects;althoughreservoirfloodcontrolreleases,asrequiredbytheU.S.ArmyCorpsofEngineers(USACE),couldotherwisecauseriverflowstoexceedtheselimits.Flowsmustnotdropbelowspecifiedlevelsoneachtributary,andtogethermustmaintainaminimumflowontheSJRatVernalisfortheprotectionoffisheriesinthetributariesandLSJR.
TablesX‐2athroughX‐2cshowtheuser‐defineddiversiondeliveryrulecurvesusedinthisanalysisforeachofthethreemainreservoirs(NewMelones,NewDonPedro,andLakeMcClure).TheserulecurvesrelatetheendofJanuarystorageeachyeartotheallowabletotalsurfacewaterdiversions(asapercentageofthemaximumallowableannualdiversion)fortheremainderofthatyear,startinginFebruaryandendingthefollowingJanuary.Intheirrespectivetables,Januarystorageforeachreservoirisdividedintofourlevelswithcorrespondingannualcutbackpercentagesfordiversions.Thefirstandfourthlevelsrepresentmaximumstorageanddead‐pool(minimum)storageforeachreservoir.Thecurveswere

State Water Resources Control Board California Environmental Protection Agency
DRAFT Agricultural Economic Effects of Lower San Joaquin River Flow Alternatives
DRAFT Evaluation of San Joaquin River Flow and Southern Delta Water Quality Objectives and Implementation
X‐4 February 2012
ICF 00427.11
developediterativelytomaximizediversionsandminimizethenumberofyearsresultingincarryoverstoragelowerthan300thousandacrefeet(TAF),500TAF,and200TAFforNewMelones,NewDonPedro,andLakeMcClurereservoirsrespectively.Maximumallowableannualsurfacewaterdiversionswereestablishedat750TAF,1,100TAF,and625TAFontheStanislaus,Tuolumne,andMercedriversrespectivelybasedonthemaximumdiversionratesallowedintheCALSIMmodel.
TableX‐3showshowtheannualallowablesurfacewaterdiversions(asdeterminedbythediversiondeliveryrulecurvedescribeabove)aredistributedacrosseachmonthoftheyearstartinginFebruaryandendingthefollowingJanuary.AsexplainedinAppendixX(drafttechnicalreport),themonthlydiversiondistributionpatternsusedforeachtributaryarederivedfromthesamepatternexhibitedintheCALSIMbaselinemodelrun.
TableX‐4containsthefloodcontrolstoragelimitationsusedintheWSEmodelforNewMelones,NewDonPedro,andLakeMcClurereservoirs.ThesearebasedonamonthlyinterpretationofUSACEfloodcontrolcurvesforeachreservoir.Whenstoragewouldotherwisebegreaterthantheselimitations,theWSEmodelreleasestheadditionalflowtobringthestoragelevelsdowntothelimitation.
Table X‐1. Minimum Monthly Flow Requirements and Maximum Trigger Levels Input to WSE Model for Each LSJR Flow Objective Alternative
CalendarMonth
MinimumMonthlyFlow(cfs) MaximumTriggerFlow(cfs)
Stanislaus Tuolumne Merced Stanislaus Tuolumne Merced
2 150 200 150 2,500 3,500 2,000
3 150 200 150 2,500 3,500 2,000
4 150 200 150 2,500 3,500 2,000
5 150 200 150 2,500 3,500 2,000
6 150 200 150 2,500 3,500 2,000
Notes:NoflowssetforJulythroughJanuaryasnochangesfrombaselineflowaremadeinthosemonths.
cfs=cubicfeetpersecond
Table X‐2a. Stanislaus River Diversion Delivery (Cutback) Curves at New Melones Reservoir for each LSJR Flow Objective Alternative
NewMelonesStanislaus
20%Alternative 30%Alternative 40%Alternative 50%Alternative 60%Alternative
Storage
(TAF)
Delivery
(%)
Storage
(TAF)
Delivery
(%)
Storage
(TAF)
Delivery
(%)
Storage
(TAF)
Delivery
(%)
Storage
(TAF)
Delivery
(%)
Level1 1,970 100% 1,970 100% 1,970 100% 1,970 90% 1,970 80%
Level2 1,500 95% 100 50% 100 40% 100 35% 100 30%
Level3 100 50% 99 0% 99 0% 99 0% 99 0%
Level4 99 0% NA NA NA NA NA NA NA NA

State Water Resources Control Board California Environmental Protection Agency
DRAFT Agricultural Economic Effects of Lower San Joaquin River Flow Alternatives
DRAFT Evaluation of San Joaquin River Flow and Southern Delta Water Quality Objectives and Implementation
X‐5 February 2012
ICF 00427.11
Table X‐2b. Tuolumne River Diversion Delivery (Cutback) Curves at New Don Pedro Reservoir for Each LSJR Flow Objective Alternative
NewDonPedro–Tuolumne
20%Alternative 30%Alternative 40%Alternative 50%Alternative 60%Alternative
Storage
(TAF)
Delivery
(%)
Storage
(TAF)
Delivery
(%)
Storage
(TAF)
Delivery
(%)
Storage
(TAF)
Delivery
(%)
Storage
(TAF)
Delivery
(%)
Level1 1,690 95% 1,690 85% 1,690 80% 1,690 70% 1,690 65%
Level2 1,000 55% 850 45% 1,000 45% 1,000 38% 1,000 30%
Level3 115 20% 115 15% 115 10% 115 5% 115 0%
Level4 114 0% 114 0% 114 0% 114 0% NA NA
Table X‐2c. Merced River Diversion Delivery (Cutback) Curves at Lake McClure for Each LSJR Flow Objective Alternative.
LakeMcClureMerced
20%Alternative 30%Alternative 40%Alternative 50%Alternative 60%Alternative
Storage
(TAF)
Delivery
(%)
Storage
(TAF)
Delivery
(%)
Storage
(TAF)
Delivery
(%)
Storage
(TAF)
Delivery
(%)
Storage
(TAF)
Delivery
(%)
Level1 675 95% 675 90% 675 85% 675 80% 675 75%
Level2 100 40% 300 60% 100 30% 100 25% 100 20%
Level3 99 0% 100 30% 99 0% 99 0% 99 0%
Level4 NA NA 99 0% NA NA NA NA NA NA
Table X‐3. Monthly Distribution Pattern (Starting in February Through the Following January) for Annual Allowable Diversions on Each Tributary
CalendarMonth
Stanislaus
(%ofannual)
Tuolumne
(%ofannual)
Merced
(%ofannual)
2 1.5% 2.1% 0.2%
3 4.7% 5.1% 3.3%
4 10.9% 11.1% 10.3%
5 15.4% 15.0% 16.1%
6 16.1% 15.4% 19.7%
7 17.4% 18.3% 21.3%
8 16.0% 15.7% 17.4%
9 9.3% 8.6% 8.2%
10 4.1% 4.8% 3.0%
11 2.0% 0.7% 0.2%
12 1.3% 1.0% 0.2%
1 1.3% 2.1% 0.1%
Total 100% 100% 100%

State Water Resources Control Board California Environmental Protection Agency
DRAFT Agricultural Economic Effects of Lower San Joaquin River Flow Alternatives
DRAFT Evaluation of San Joaquin River Flow and Southern Delta Water Quality Objectives and Implementation
X‐6 February 2012
ICF 00427.11
Table X‐4. Monthly Flood Control Storage Limitations Applied to New Melones, New Don Pedro, and Lake McClure Reservoirs in the WSE Model
NewMelones NewDonPedro LakeMcClure
CalendarMonth (TAF) (TAF) (TAF)
1 1,970 1,690 674.6
2 1,970 1,690 674.6
3 2,030 1,690 735
4 2,220 1,718 845
5 2,420 2,002 970
6 2,420 2,030 1,024
7 2,300 2,030 1,024
8 2,130 2,030 1,024
9 2,000 1,773 850
10 1,970 1,690 674.6
11 1,970 1,690 674.6
12 1,970 1,690 674.6
BasedonmonthlyinterpretationofUSACEdefinedfloodcurves.
Maximumstoragevolume(tospillway)inNewMelones=2,420TAF;NewDonPedro=2,030TAF;andLakeMcClure=1,024TAF
X.3.2 Summary of Results
TheWSEmodelgeneratesatimeseriesofestimatedallowablemonthlydiversionsfrom1922through2003.ForthepurposesofthisanalysisthesemonthlyvaluesareaddedtogetherforagivenyearandpresentedasannualallowablediversionsinTAF.TheresultsarealsopresentedforeachalternativeasanannualdifferenceinTAFandasapercentdifference,bothrelativetobaselineconditions.TheresultsoftheWSEmodelneededforsubsequentagriculturalproductionandeconomiceffectsanalysisarepresentedbelow.TheWSEresultsarepresentedbothastotalsfortheentirewatershedandfortheindividualtributaries.
Entire LSJR Project Area
WatersuppliesandrelatedconditionsintheLSJRwatershedarehighlyvariableovertime,andassociateddataormodelingresultsaresometimesbettercharacterizedbyexceedanceplotsthanbysimpleaverageormedianstatistics.FigureX‐1presentsanexceedanceplotofWSEestimatesfortotalLSJRwatershedannualsurfacewaterdiversionsforeachoftheLSJRflowobjectivesandthebaselineconditionacrossthe82yearsofsimulation.
ForaparticularLSJRalternative,thediversionsestimatedforagivenyear,maybeaboveorbelowthatsameyear’sestimateforthebaselinecondition.Thisdifferenceinannualdiversionsaboveorbelowthebaselineconditioniscalculatedacrossall82yearsofsimulationforeachLSJRflowalternativeandpresentedonanexceedanceplotinFigureX‐2.Toputinrelativeterms,thesesameannualdifferencesarepresentedinFigureX‐3asapercentdifferenceaboveorbelowthebaselinecondition.

State Water Resources Control Board California Environmental Protection Agency
DRAFT Agricultural Economic Effects of Lower San Joaquin River Flow Alternatives
DRAFT Evaluation of San Joaquin River Flow and Southern Delta Water Quality Objectives and Implementation
X‐7 February 2012
ICF 00427.11
Figure X‐1. Exceedance Plot of WSE Estimates for Total LSJR Watershed Annual Surface Water Diversions for Each of the LSJR Flow Objectives and the Baseline Condition Across the 82 Years of Simulation
Figure X‐2. Exceedance plot of WSE Estimates of the Difference in Total LSJR Watershed Annual Surface Water Diversions for Each of the LSJR Flow Objectives and the Baseline Condition
0.0
0.5
1.0
1.5
2.0
2.5
3.0
0% 10% 20% 30% 40% 50% 60% 70% 80% 90% 100%
Annu
al D
iver
sion
s (m
af)
Percent of Time Equaled or Exceeded
Project Area Diversions Compared to Baseline
Maximum Diversion
20% unimpaired alternative
40% unimpaired alternative
60% unimpaired alternative
Baseline
-1400
-1200
-1000
-800
-600
-400
-200
0
200
400
600
0% 10% 20% 30% 40% 50% 60% 70% 80% 90% 100%
Annu
al D
iver
sion
Cha
nge
from
Bas
elin
e (ta
f)
Percent of Time Equaled or Exceeded
Project Area Diversions Compared to Baseline
20% unimpaired alternative
40% unimpaired alternative
60% unimpaired alternative

State Water Resources Control Board California Environmental Protection Agency
DRAFT Agricultural Economic Effects of Lower San Joaquin River Flow Alternatives
DRAFT Evaluation of San Joaquin River Flow and Southern Delta Water Quality Objectives and Implementation
X‐8 February 2012
ICF 00427.11
-80%
-60%
-40%
-20%
0%
20%
40%
60%
0% 10% 20% 30% 40% 50% 60% 70% 80% 90% 100%
Annu
al D
iver
sion
Cha
nge
from
Bas
elin
e (%
)
Percent of Time Equaled or Exceeded
Project Area Diversions Compared to Baseline
20% unimpaired alternative
40% unimpaired alternative
60% unimpaired alternative
Figure X‐3. Exceedance Plot of WSE Estimates for Total LSJR Watershed Annual Surface Water Diversions for Each of the LSJR Flow Objectives, as a Percent Difference Above or Below the Baseline Condition, Across the 82 Years of Simulation
Tributary Breakdown
TableX‐5summarizestheaveragedifferenceinallowablediversionsaboveorbelowthebaselinecondition,andtheaveragepercentdifferencefromthebaseline,foreachofthethreetributariesandtheentireLSJRwatershedacross82yearsofsimulation.Thisinformationprovidesageneralpictureoftherelativedistributionbetweenthetributariesofthediversionreductionsthatwouldbeneeded.Ingeneral,asthepercentofunimpairedflowincreases,theaveragedifferenceindiversionsforaparticularalternativerelativetobaselineconditionsincreases(i.e.,greaterdiversionreductionswouldbeneededtoaccommodatetheincreaseinunimpairedflow).PotentialdiversionreductionsontheStanislausRiveraregenerallylessthanthosepotentiallyneededontheTuolumneandMercedRivers.ThisisduetothegenerallyhigherlevelofexistingflowsontheStanislausRiver,asdescribedinChapter2ofAppendixX(drafttechnicalreport).

State Water Resources Control Board California Environmental Protection Agency
DRAFT Agricultural Economic Effects of Lower San Joaquin River Flow Alternatives
DRAFT Evaluation of San Joaquin River Flow and Southern Delta Water Quality Objectives and Implementation
X‐9 February 2012
ICF 00427.11
Table X‐5. Average Difference in Diversions Above or Below the Baseline Condition, Along with the Average Percent Difference from the Baseline, for Each of the Three Tributaries and the Entire LSJR Watershed Across 82 Years of Simulation
PercentofUnimpairedFlowAlternative
Stanislaus
(TAF)
Tuolumne
(TAF)
Merced
(TAF)
LSJRWatershed(TAF)
20%Alternative +96 ‐5 ‐10 +83
40%Alternative +4 ‐172 ‐87 ‐255
60%Alternative ‐115 ‐328 ‐163 ‐606
(%) (%) (%) (%)
20%Alternative +18% 0% +1% +5%
40%Alternative +1% ‐19% ‐14% ‐13%
60%Alternative ‐20% ‐37% ‐29% ‐31%
FigureX‐4throughFigureX‐6presentsexceedanceplotsofthedifferenceinannualallowablediversionsaboveorbelowthebaselineconditionforeachLSJRflowalternativeacrossall82yearsofsimulationontheStanislaus,Tuolumne,andMercedRiversrespectively.Thisprovidesthedistributionandvariabilityofthedifferencesoneachtributary.Positivevaluesindicatediversionsforagivenyearcouldbegreaterthanbaselineconditions,andnegativevaluesindicatediversionsinagivenyearwouldneedtobelessthanbaselineconditions.Overallmorediversionreductionswouldbeneededtomeethigherpercentunimpairedflowrequirements.PotentialdiversionreductionsontheStanislausfortheunimpairedflowalternativesaregenerallylessthantheothertworiversduetothegenerallyhigherlevelofexistingflowsontheStanislausRiver.
Tofurtherdescribethevariablenatureofrevenuesoverthe82yearsofsimulation,FiguresX‐7throughX‐9presenttheWSEestimatesofallowableannualdiversionsfromtheStanislaus,Tuolumne,andMercedRiversrespectivelyforthebaselineandtheLSJRflowalternativesastime‐seriesoverthe82yearsimulation.ThesefiguresdemonstratethevariabilityofdiversionsthatwouldbeexpectedthroughaseriesofdryandwetwateryearsforbaselineconditionsandundertheLSJRflowalternatives.TheyalsoshowthedifferencesthatwouldbeexpectedforthethreeLSJRtributaries.

State Water Resources Control Board California Environmental Protection Agency
DRAFT Agricultural Economic Effects of Lower San Joaquin River Flow Alternatives
DRAFT Evaluation of San Joaquin River Flow and Southern Delta Water Quality Objectives and Implementation
X‐10 February 2012
ICF 00427.11
-400
-300
-200
-100
0
100
200
300
400
0% 10% 20% 30% 40% 50% 60% 70% 80% 90% 100%
Annu
al C
hang
e in
Div
ersi
on (t
af)
Percent of Time Equaled or Exceeded
Stanislaus River Diversions Compared to Baseline
20% unimpaired alternative
40% unimpaired alternative
60% unimpaired alternative
Figure X‐4. Exceedance Plot of Difference in Annual Allowable Diversions Above or Below the Baseline Condition for Each LSJR Flow Alternative on the Stanislaus River Across 82 Years of Simulation
-700
-600
-500
-400
-300
-200
-100
0
100
200
300
0% 10% 20% 30% 40% 50% 60% 70% 80% 90% 100%
Annu
al C
hang
e in
Div
ersi
ons
(taf)
Percent of Time Equaled or Exceeded
Tuolumne River Diversions Compared to Baseline
20% unimpaired alternative
40% unimpaired alternative
60% unimpaired alternative
Figure X‐5. Exceedance Plot of Difference in Annual Allowable Diversions Above or Below the Baseline Condition for Each LSJR Flow Alternative on the Tuolumne River Across 82 Years of Simulation

State Water Resources Control Board California Environmental Protection Agency
DRAFT Agricultural Economic Effects of Lower San Joaquin River Flow Alternatives
DRAFT Evaluation of San Joaquin River Flow and Southern Delta Water Quality Objectives and Implementation
X‐11 February 2012
ICF 00427.11
-500
-400
-300
-200
-100
0
100
200
300
0% 10% 20% 30% 40% 50% 60% 70% 80% 90% 100%
Annu
al C
hang
e in
Div
ersi
ons
(taf)
Percent of Time Equaled or Exceeded
Merced River Diversions Compared to Baseline
20% unimpaired alternative
40% unimpaired alternative
60% unimpaired alternative
Figure X‐6. Exceedance Plot of Difference in Annual Allowable Diversions Above or Below the Baseline Condition for Each LSJR Flow Alternative on the Merced River Across 82 Years of Simulation
0
100
200
300
400
500
600
700
800
1920 1930 1940 1950 1960 1970 1980 1990 2000
An
nu
al
Div
ers
ion
Deli
very
(T
AF
/yr)
Year
Annual Diversion Delivery from Stanislaus River
Baseline 20% 40% 60%
Figure X‐7. Estimated Stanislaus River Allowable Annual Diversions from WSE Model for 1922 through 2003

State Water Resources Control Board California Environmental Protection Agency
DRAFT Agricultural Economic Effects of Lower San Joaquin River Flow Alternatives
DRAFT Evaluation of San Joaquin River Flow and Southern Delta Water Quality Objectives and Implementation
X‐12 February 2012
ICF 00427.11
0
200
400
600
800
1000
1200
1920 1930 1940 1950 1960 1970 1980 1990 2000
An
nu
al
Div
ers
ion
Deli
very
(T
AF
/yr)
Year
Annual Diversion Delivery from Tuolumne River
Baseline 20% 40% 60%
Figure X‐8. Estimated Tuolumne River Allowable Annual Diversions from WSE Model for 1922 through 2003
0
100
200
300
400
500
600
700
1920 1930 1940 1950 1960 1970 1980 1990 2000
An
nu
al
Div
ers
ion
Deliv
ery
(T
AF
/yr)
Year
Annual Diversion Delivery from Merced River
Baseline 20% 40% 60%
Figure X‐9. Estimated Merced River Allowable Annual Diversions from WSE Model for 1922 through 2003
X.4 Effects on Agricultural Production Changestotheamountofsurfacewaterdiversionshavethepotentialtoeffectwateravailableforcropirrigationandthushavethepotentialtoaffectagriculturalproductivity.TheestimatesofthesurfacewaterdiversionsdevelopedintheprevioussectionareusedintheSWAPmodeltoestimateagriculturalproductionandrevenuesforeachoftheLSJRflowalternatives.Theagriculturalproductionandrevenuesarethencomparedtothebaselinecondition.BecausetheWSEmodelsimulateschangesinsurfacewaterdiversionsover82yearsofhydrology,theresultsarehighlyvariableacrossarangeofpossibleannualeffects.
X.4.1 SWAP Model Overview
TheSWAPmodelwasselectedtoestimatetheagriculturalproduction(cropacreages)andrevenues(totalproductionvalue)associatedwiththesurfacewaterdiversionspotentiallyneededundertheLSJRflowalternativesandbaselineconditions.SWAPisanagriculturalproductionmodelthat

State Water Resources Control Board California Environmental Protection Agency
DRAFT Agricultural Economic Effects of Lower San Joaquin River Flow Alternatives
DRAFT Evaluation of San Joaquin River Flow and Southern Delta Water Quality Objectives and Implementation
X‐13 February 2012
ICF 00427.11
simulatesthedecisionsoffarmersataregionallevelbasedonprinciplesofeconomicoptimization.Themodelassumesthatfarmersmaximizeprofit(revenueminuscosts)subjecttoresource,technical,andmarketconstraints.Themodelselectsthosecrops,watersupplies,andirrigationtechnologythatmaximizeprofitsubjecttotheseequationsandconstraints.Themodelaccountsforlandandwateravailabilityconstraintsgivenasetoffactorsforproductionprices,andcalibratesexactlytoobservedyearlyvaluesofland,labor,waterandsuppliesuseforeachregion.
Justification and Previous Applications
ThebasisforSWAPisPositiveMathematicalProgramming(PMP),whichisaself‐calibratingagriculturalproductionmodelaimedtomaximizefarmprofitsandemployingacalibrationmethodthatensuresthatcropproductionmatchestheobservedbasedatainagivenyear(Howitt1995).PMPintroducesanon‐linearcostfunctionderivedfromthefirstorderconditionsofLeontiefproductionconstrainedmodel.AdditionaldetailsonthePMPmethodologyarepresentedinseveralreportsandpeerreviewedpublicationsincluding:Howittetal.(2010),Medellín‐Azuaraetal.(2010),andMedellín‐Azuaraetal.(2012).
PMPhasbecomeawidelyacceptedmethodforanalyzingwaterdemandandundertakingpolicyanalysisandaredeemedasthedominantmethodwithrespecttoinductive(statistical)basedmodelstorepresentagriculturalproduction(Young2005;Scheierlingetal.2006).Thistypeofmodelworkswellwiththemultitudeofresource,policy,andenvironmentalconstraintsoftenobservedinpractice(Griffin2006).Furthermore,PMPdoesnotrequirelargedatasets,isdirectlybasedonprofit‐maximizingbehavioroffarmers,andisbettersuitedtoestimatepolicyresponseoffarmingactivitiesthanstrictlystatisticalmethods(Howittetal.2010).Incontrasttostatisticalmethods,SWAPmoreexplicitlyaccountsforchangesinwateravailabilityduetoreduceddiversionsaspartoftheconstraintsetinthemodel.Bycomparingabasecasewithcurrentdiversionsandapolicyscenariowithreduceddiversions,theanalystisabletoeconomicallyquantifychangesinrevenue,croppingpatternsandappliedwaterperunitarea.
SWAPalsohassomecomparativeadvantagesovercurrentandpreviouslyusedagriculturalwaterusemodels.TwosuchmodelsareDWRCaliforniaAgriculture(CALAG)andDWRNetCropRevenueModels(NCRMs).ThefollowingisabriefdescriptionofthosemodelsandthecomparativeadvantagesofSWAP.
CALAGisanextendedandimprovedversionofCVPM.LikeSWAPthenumericalbasisofCALAGisPMP(CaliforniaDepartmentofWaterResources2008).CALAG,however,doesnotexplicitlyincludecostsofproductionsfactorsintheirformulation,andinsteaduseconstantvariableproductioncostsbycropandregion.SWAPincontrast,cancapturefarmeradjustmentsininputusesuchaswaterperacrechangesduringdroughtconditions.ThusCVPMandCALAGarewellsuitedtorepresentwatersupplyoperationsbutarelessusefulformodelingdetailedchangesinproductionsuchaswaterperunitarea,laborperunitareaorsuppliesperunitarea.SWAPestimatescroppingpatternsandinputuseforallpoliciesevaluated,capturingadaptationofcropfarmingproductiontochangingwateravailabilityconditions.Whenfacedwithincreasingwaterscarcity,farmershavebeenshowntoadjustinthreeways,changesinwaterperacre,changesincropmix,andchangesintotalirrigatedacres.CVPMandCALAGarerobustmodelsthatcanaccountfortwoofthesechanges,butSWAPhasbeenextendedtoincorporateallthreeadjustments.SWAPincorporatesinformationfrombothmodels,intermsofwatersupplysourcesandusesregionscompatiblewithbothmodels.SWAPhasadditionalmodulestoaccountfortechnologicalimprovement,climatechange,changesincroppricesandwaterquality.

State Water Resources Control Board California Environmental Protection Agency
DRAFT Agricultural Economic Effects of Lower San Joaquin River Flow Alternatives
DRAFT Evaluation of San Joaquin River Flow and Southern Delta Water Quality Objectives and Implementation
X‐14 February 2012
ICF 00427.11
TheNCRMsarespreadsheetprogramsthatestimateaveragenetcroprevenuesfor26cropgroupsin27Californiacountiesandregions.Thesemodelscombinedataonacres,andaverageyieldsandpricesfromnumerouscountyandstatesources.Thespreadsheetsprice‐leveladjustcostandgrossrevenuedatatoacommonyear,adjustforchangesinvariouscosts,andthencalculateweighted‐averageestimatesofatypicalgrower'sannualnetcroprevenue,whetherprofitorloss(CaliforniaDepartmentofWaterResources2008).Howeverusingfixedbudgets,itisnotpossibletomodelreactionstochangesinwateravailabilitybasedonfarmersprofit‐maximizingbehaviorascanbedoneinSWAP.Instead,theNCRMspreadsheetsprovideasnapshotofagriculturebutdonotcapturechangesincroppingpatternsorproductioninputuseasaresultofchangingwateravailability.
TheSWAPmodelhasbeenusedinawiderangeofpolicyanalysisprojects.Thefirstformalapplicationofthismodelwastoestimatetheeconomicscarcitycostsofwaterforagricultureinthestatewidehydro‐economicoptimizationmodelforwatermanagementinCaliforniaknownastheCaliforniaValueIntegratedNetwork(CALVIN)model.SWAPprovideseconomicvalueofwatershortagetoCALVINbymonthandregionthatisweightedagainstvalueofshortageinotherusesindecidingwaterallocation.(Draperetal.2003).Also,DWRusedSWAPsubsequenttotheCALAGmodeltoaidindevelopmentofplanningscenariosandstudiessupportingpreparationofthe2009WaterPlanUpdate(http://www.waterplan.water.ca.gov/cwpu2009/index.cfm#volume4).
SWAPhasalsobeenusedbytheStockholmEnvironmentInstituteasasubsidiarymodelforaWaterEvaluationandPlanning(WEAP)modelapplicationintheCaliforniaCentralValley,withotherparticipantssuchastheU.S.BureauofReclamationandconsultingfirmsincludingCH2MHILL.WEAPisaclimate‐driven,waterresourcemodelthatsystematicallysimulatesnaturalwaterflowsandmanagementofinfrastructuretobalancesupplyanddemand.SWAPtakesadvantageoftheWEAPpriority‐basedallocationandprovidescroppingpatternsforawiderangeofwateravailabilityconditions.Indoingthis,SWAPturnsawaterallocationsimulationmodelintoahydro‐economicmodelthatallocateswaterbasedoneconomicvalueofthefinaluse(Yatesetal.2005).
Morerecently,SWAPapplicationshavebeengreatlyexpandedtoincludesalinityinsoilandshallowgroundwaterintheSacramento‐SanJoaquinDeltainCalifornia(Lundetal.2007)andsouthoftheDelta(Howittetal.2009a;Tanakaetal.2008),climatechange(Howittetal.2009c;Medellin‐Azuara,etal.2007),anddroughtimpactanalysis(Howittetal.2009b).
X.4.2 Model Inputs and Approach
SWAPwasconfiguredtomodelagriculturalproductioninthemainagriculturalareasoftheLSJRwatershedandcalibratedtoDWRlanduseandappliedwaterdatafor2005.UsingoutputfromtheWSEmodel,theSWAPmodelestimatestheagriculturalproduction(cropacreages)andrevenues(totalproductionvalue)resultingfromeachoftheLSJRflowalternativesandthebaseline.TheannualresultsforeachLSJRflowalternativearethencomparedtothoseforthebaselineconditiontocalculatetheneteffectofthealternatives.
SWAP Regions
SWAPdisaggregatestheCentralValleyusingtheCentralValleyProductionModel(CVPM)regionsasdescribedintheCentralValleyProjectImprovementActProgrammaticEnvironmentalImpactStatement(UnitedStatesBureauofReclamation1997).ForanalysisofLSJRflowalternatives,CVPM
State Water Resources Control Board California Environmental Protection Agency
DRAFT Agricultural Economic Effects of Lower San Joaquin River Flow Alternatives
DRAFT Evaluation of San Joaquin River Flow and Southern Delta Water Quality Objectives and Implementation
X‐15 February 2012
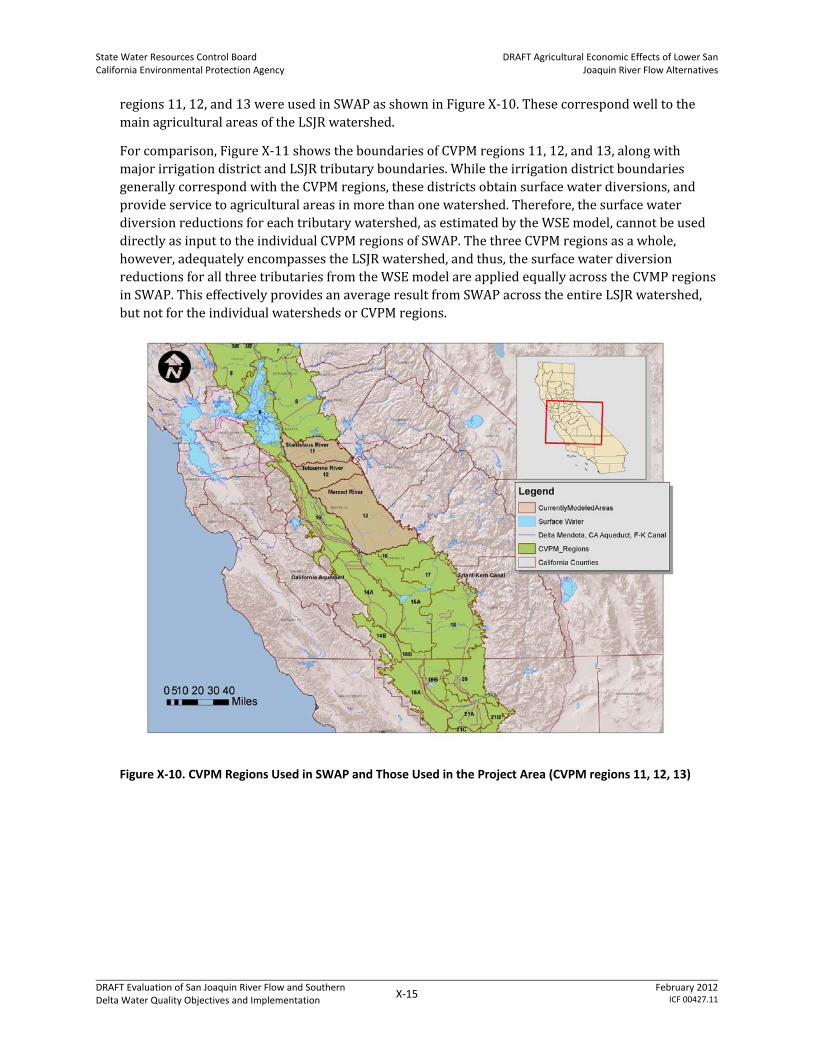
ICF 00427.11
regions11,12,and13wereusedinSWAPasshowninFigureX‐10.ThesecorrespondwelltothemainagriculturalareasoftheLSJRwatershed.
Forcomparison,FigureX‐11showstheboundariesofCVPMregions11,12,and13,alongwithmajorirrigationdistrictandLSJRtributaryboundaries.WhiletheirrigationdistrictboundariesgenerallycorrespondwiththeCVPMregions,thesedistrictsobtainsurfacewaterdiversions,andprovideservicetoagriculturalareasinmorethanonewatershed.Therefore,thesurfacewaterdiversionreductionsforeachtributarywatershed,asestimatedbytheWSEmodel,cannotbeuseddirectlyasinputtotheindividualCVPMregionsofSWAP.ThethreeCVPMregionsasawhole,however,adequatelyencompassestheLSJRwatershed,andthus,thesurfacewaterdiversionreductionsforallthreetributariesfromtheWSEmodelareappliedequallyacrosstheCVMPregionsinSWAP.ThiseffectivelyprovidesanaverageresultfromSWAPacrosstheentireLSJRwatershed,butnotfortheindividualwatershedsorCVPMregions.
Figure X‐10. CVPM Regions Used in SWAP and Those Used in the Project Area (CVPM regions 11, 12, 13)

State Water Resources Control Board California Environmental Protection Agency
DRAFT Evaluation of San Joaquin River Flow and Southern Delta Water Quality Objectives
X‐16 2012
ICF 00427.11
Figure X‐11. Major Water District Boundaries Within the Project Area (CVPM regions 11, 12, 13)

State Water Resources Control Board California Environmental Protection Agency
DRAFT Evaluation of San Joaquin River Flow and Southern Delta Water Quality Objectives
X‐17
SWAP Calibration
SWAPiscalibratedtoDWRestimatesoflanduseandappliedwaterdataforwateryear2005.Thisrepresentsthemostrecentnormalwateryearintermsofbothwateravailabilityandcropprices.Theseestimateswerealsousedforpreparationofthe2009CaliforniaStateWaterPlan.Todeveloptheseestimates,DWRsurveyslandandwateruseswithineachcountyperiodicallydependingonchangesthathaveoccurredwithinthatcounty.Surveysbeganin1947withthefirstdigitizedsurveycompletedin1988,andareavailablefromtheDWRwebsite.TableX‐6belowliststhecountieswithintheprojectareaandwhenthelatestlandusesurveywastaken.DWRusestheAgricultureCommissionerannualreportstothenupdatecropyieldsappropriateforwateryear2005.
Table X‐6. Counties Within Project Area and Date Last Surveyed by DWR
County YearLastLandSurveyed
DateLastEstimatedbyDWRfromCommissionerReports
Calaveras 2000 2005
Madera 2001 2005
Mariposa 1998 2005
SanJoaquin 1996 2005
Stanislaus 2004 2005
Tuolumne 1997 2005
Merced 2002 2005
TheDWRlandusesurveyscontainabreakdownbyirrigatedandnon‐irrigatedlandsandcropgroups.ThecropgroupsinSWAPfollowtheDWRclassificationsandinclude:almondsandpistachios,alfalfa,corn,cotton,cucurbits,drybeans,freshtomato,processingtomato,grains,onionandgarlic,pasture,potato,rice,safflower,citrusandsubtropical,andvineyards,aswellasotherorchards,fieldcrops,andtruckcrops.TableX‐7summarizesacrosstheprojectarea(CVPMregions11,12,and13)thetotal2005acreagesforthesecropgroups,alongwiththeassociatedwateruseandproductionvaluesperacre.

State Water Resources Control Board California Environmental Protection Agency
DRAFT Agricultural Economic Effects of Lower San Joaquin River Flow Alternatives
DRAFT Evaluation of San Joaquin River Flow and Southern Delta Water Quality Objectives and Implementation
X‐18 February 2012
ICF 00427.11
Table X‐7. Irrigated Crop Area, Water Use Intensity, and Crop Type by Crop Groups Used in SWAP
CropGroup2005DWRIrrigatedCropArea(Acres)
WaterUse(Acre‐feet/Acre)
Value
($/Acre) CropType
Alfalfa 97,704 4.05 $ 918 Perennial
Almond/Pistachio 296,773 3.32 $ 3,871 Perennial
Corn 148,872 2.48 $ 673 Annual
Cotton 31,577 3.08 $ 906 Annual
Cucurbits 2,709 1.66 $ 3,802 Annual
DryBean 1,937 2.15 $ 994 Annual
Field 92,576 2.41 $ 332 Annual
FreshTomato 6,778 1.5 $ 5,811 Annual
Grain 21,446 0.74 $ 285 Annual
OnionandGarlic 819 2.01 $ 4,348 Annual
Orchards 66,200 3.39 $ 2,718 Perennial
Pasture 112,218 4.43 $ 631 Annual
Rice 6,370 5.37 $ 754 Annual
Safflower 446 1.58 $ 472 Annual
Subtropical 5,859 2.52 $ 6,639 Perennial
Sugarbeet 2,495 1.25 $ 1,275 Annual
Tomato‐Processing 12,428 2.38 $ 2,018 Annual
TruckCrops 30,435 0.96 $ 5,192 Annual
Vine 112,602 2.25 $ 4,066 Perennial
SWAP Simulation of Alternatives and Baseline Condition
TheseannualsurfacewaterdiversionchangesestimatedbytheWSEmodel(describedinSectionX.3)wereinputtoSWAPtoestimatetheassociatedagriculturalproduction(cropacreages)andrevenues(totalproductionvalue).ForeachwateryearSWAPusesthePMPmethodologytocalculatethecropacreagemixthatwouldmaximizerevenuefromtheannualavailablesurfacewaterdiversions.
Forthepurposeofthisanalysisitwasassumedthatirrigationsuppliedfromgroundwaterandothersources(e.g.,CVPprojectdeliveries,etc.)wouldnotbeincreasedtomakeupforanydecreaseinsurfacewaterdiversions.Whilesomeadditionalalternativesupplymightactuallybeavailablefromothersources,forthepurposeofeconomicanalysis,thisisaconservativeassumption.
TheSWAPoutputforaparticularLSJRflowalternativeorthebaselineconditionisatime‐seriesof82annualestimatesoftheassociatedcropacreages,appliedwater,andrevenueacrosstheperiodofsimulation.ForthepurposeofevaluatingeachLSJRflowalternative,theseestimatesforagivenyeararecomparedagainstthoseforthebaselinecondition.Theresultisatimeseriesacrossall82yearsofsimulationofannualdifferencesincropacreagesandrevenueassociatedwithLSJRalternativewhencomparedtothebaselinecondition.

State Water Resources Control Board California Environmental Protection Agency
DRAFT Agricultural Economic Effects of Lower San Joaquin River Flow Alternatives
DRAFT Evaluation of San Joaquin River Flow and Southern Delta Water Quality Objectives and Implementation
X‐19 February 2012
ICF 00427.11
X.4.3 Summary of Results
ThissectionpresentsSWAPmodeloutputcharacterizingthetotalagriculturalproduction(cropacreages)anddirectly‐relatedrevenues(totalproductionvalue)associatedwiththethreeLSJRflowalternativesandthebaselinecondition.AlsopresentedarethedifferencesinthesevaluesbetweenthethreeLSJRalternativesandthebaselinecondition.Asdescribedearlier,SWAPprovidesanaverageresultacrosstheLSJRwatershed.
Effects on Crop Acreage
TableX‐8presentstheaverageoverthe82‐yearstudyperiodoftheannualirrigatedacreageofeachcroptypeforthebaselineconditionandtheaveragedifference,inbothacresandpercent,betweenLSJRflowalternativesandthebaselinecondition.Aswaterbecomeslessavailable,thecropsmostaffectedarerice,pasture,andfieldcrops,followedbycorn.Theseareaffectedmorebecausetheyarerelativelyhighwater‐useannualcropswithlowervaluecropsperacre.ThelowvaluecropgroupsthatcoverlargeareasaresubstantiallyreducedastheLSJRflowalternativeincreasesfrom20%to60%ofunimpairedflow.FiguresX‐12throughX‐15presenttheannualcropacreageforeachcropgroupasatimeseriesfrom1960to2003forthebaselineconditionandthe20%,40%and60%LSJRflowalternativesrespectively.,Insomeyearsofextremedrought,pastureandfieldcropsarenearlyeliminatedfromproductionparticularlyunderthe40%and60%alternatives.
FigureX‐16presentstheannualcropacreageforselectedcrops(cotton,grain,processtomatoes,sub‐tropicalfruit,riceanddrybeans)asatimeseriesfrom1960to2003foreachoftheLSJRflowalternatives.Thisdemonstratesthathighervaluecrops,suchastomatoesarelessaffectedbyincreaseddiversionreductionsthanlowervalue,highwater‐usecrops,suchasrice,andthattheeffectsaregenerallygreaterduringthehigherpercentagealternatives.FigureX‐17presentstheannualcropacreageforsomelow‐acreagecrops(freshtomatoes,cucurbits,sugarbeets,onions/garlic,andsafflower)asatimeseriesfrom1960to2003foreachoftheLSJRflowalternatives.Generally,thesecropsarenotasaffectedbydiversionreductions.Perennialcropssuchasvines,almondsandpistachios,andsub‐tropicalcropgroupsexperiencedecreasesinproductiononlyinprolongedextremedroughtsuchasexperiencedintheearly1990s.Thisisshownbyaconstantacreagefromyeartoyearevenastheflowobjectivealternativeisincreased.

State Water Resources Control Board California Environmental Protection Agency
DRAFT Agricultural Economic Effects of Lower San Joaquin River Flow Alternatives
DRAFT Evaluation of San Joaquin River Flow and Southern Delta Water Quality Objectives and Implementation
X‐20 February 2012
ICF 00427.11
Table X‐8. Average Annual Acreage of Irrigated Crops for Baseline Condition and Average Difference (in Acres and Percent) Between LSJR Flow Alternatives and Baseline Condition by Crop Group
CropGroup
Baseline 20%Alternative 40%Alternative 60%Alternative
(TAF) +/‐TAF %Change +/‐TAF %Change +/‐TAF %Change
Alfalfa 94,180 +569 +1% ‐3,439 ‐4% ‐10,283 ‐11%
Almonds/Pistachios
295,630 +157 <+1% ‐670 <‐1% ‐2,651 ‐1%
Corn 137,020 +945 +1% ‐14,517 ‐11% ‐38,576 ‐28%
Cotton 30,660 +180 +1% ‐468 ‐2% ‐1,213 ‐4%
Cucurbits 2,700 +2 <+1% ‐7 <‐1% ‐23 ‐1%
DryBean 1,890 +6 <+1% ‐42 ‐2% ‐239 ‐13%
Field 57,510 +5,290 +9% ‐23,004 ‐40% ‐42,752 ‐74%
FreshTomato 6,770 +2 <+1% ‐4 <‐1% ‐10 <‐1%
Grain 21,220 +75 <+1% ‐318 ‐1% ‐1,092 ‐5%
OnionandGarlic 820 +1 <+1% ‐1 <‐1% ‐4 ‐1%
Orchards 65,420 +111 <+1% ‐542 ‐1% ‐4,422 ‐7%
Pasture 76,570 +2,603 +3% ‐27,400 ‐36% ‐56,386 ‐74%
Rice 4,520 +54 +1% ‐1,595 ‐35% ‐3,442 ‐76%
Safflower 430 +3 +1% ‐14 ‐3% ‐46 ‐11%
Subtropical 5,850 +2 <+1% ‐3 <‐1% ‐8 <‐1%
Sugarbeet 2,480 +3 <+1% ‐7 <‐1% ‐15 ‐1%
Tomato(Processing)
12,330 +20 <+1% ‐57 <‐1% ‐238 ‐2%
TruckCrops 30,410 +4 <+1% ‐16 <‐1% ‐55 <‐1%
Vine 112,390 +42 <+1% ‐107 <‐1% ‐289 <‐1%
TOTAL 958,800 +10,069 +1% ‐72,211 ‐8% ‐161,744 ‐17%

State Water Resources Control Board California Environmental Protection Agency
DRAFT Agricultural Economic Effects of Lower San Joaquin River Flow Alternatives
DRAFT Evaluation of San Joaquin River Flow and Southern Delta Water Quality Objectives and Implementation
X‐21 February 2012
ICF 00427.11
0
20000
40000
60000
80000
100000
120000
140000
160000
19
60
19
61
19
62
19
63
19
64
19
65
19
66
19
67
19
68
19
69
19
70
19
71
19
72
19
73
19
74
19
75
19
76
19
77
19
78
19
79
19
80
19
81
19
82
19
83
19
84
19
85
19
86
19
87
19
88
19
89
19
90
19
91
19
92
19
93
19
94
19
95
19
96
19
97
19
98
19
99
20
00
20
01
20
02
20
03
Are
a o
f Ir
rigat
ed C
rop
s pe
r ye
ar (
acr
es)
Year
Area of Irrigated Crops : Baseline
Corn
Vines
Alfalfa
Pasture
Other Field Crops
Deciduous
Other Truck Crops
Cotton
Cucurbits
Dry Beans
Fresh Tomatoes
Grain
Onions/Garlic
Rice
Safflower
Subtropical
Sugar Beet
Process Tomatoe
Figure X‐12. Annual Crop Acreage by Crop Group Under Baseline Conditions from 1960 to 2003
0
20000
40000
60000
80000
100000
120000
140000
160000
1960
1961
1962
1963
1964
1965
1966
1967
1968
1969
1970
1971
1972
1973
1974
1975
1976
1977
1978
1979
1980
1981
1982
1983
1984
1985
1986
1987
1988
1989
1990
1991
1992
1993
1994
1995
1996
1997
1998
1999
2000
2001
2002
2003
Are
a of
Irrig
ated
Cro
ps p
er y
ear
(acr
es)
Year
Area of Irrigated Crops : 20% Unimpaired Flow Objective
Corn
Vines
Alfalfa
Pasture
Other Field Crops
Deciduous
Other Truck Crops
Cotton
Cucurbits
Dry Beans
Fresh Tomatoes
Grain
Onions/Garlic
Rice
Safflower
Subtropical
Sugar Beet
Process Tomatoe
Figure X‐13. Annual Crop Acreage by Crop Group Under 20% Unimpaired Flow Alternative from 1960 to 2003

State Water Resources Control Board California Environmental Protection Agency
DRAFT Agricultural Economic Effects of Lower San Joaquin River Flow Alternatives
DRAFT Evaluation of San Joaquin River Flow and Southern Delta Water Quality Objectives and Implementation
X‐22 February 2012
ICF 00427.11
0
20000
40000
60000
80000
100000
120000
140000
160000
1960
1961
1962
1963
1964
1965
1966
1967
1968
1969
1970
1971
1972
1973
1974
1975
1976
1977
1978
1979
1980
1981
1982
1983
1984
1985
1986
1987
1988
1989
1990
1991
1992
1993
1994
1995
1996
1997
1998
1999
2000
2001
2002
2003
Are
a of
Irrig
ated
Cro
ps p
er y
ear
(acr
es)
Year
Area of Irrigated Crops : 40% Unimpaired Flow Objective
Corn
Vines
Alfalfa
Pasture
Other Field Crops
Deciduous
Other Truck Crops
Cotton
Cucurbits
Dry Beans
Fresh Tomatoes
Grain
Onions/Garlic
Rice
Safflower
Subtropical
Sugar Beet
Process Tomatoe
Figure X‐14. Annual Crop Acreage by Crop Group Under 40% Unimpaired Flow Alternative from 1960 to 2003
0
20000
40000
60000
80000
100000
120000
140000
160000
1960
1961
1962
1963
1964
1965
1966
1967
1968
1969
1970
1971
1972
1973
1974
1975
1976
1977
1978
1979
1980
1981
1982
1983
1984
1985
1986
1987
1988
1989
1990
1991
1992
1993
1994
1995
1996
1997
1998
1999
2000
2001
2002
2003
Are
a of
Irrig
ated
Cro
ps p
er y
ear
(acr
es)
Year
Area of Irrigated Crops : 60% Unimpaired Flow Objective
Corn
Vines
Alfalfa
Pasture
Other Field Crops
Deciduous
Other Truck Crops
Cotton
Cucurbits
Dry Beans
Fresh Tomatoes
Grain
Onions/Garlic
Rice
Safflower
Subtropical
Sugar Beet
Process Tomatoe
Figure X‐15. Annual Crop Acreage by Crop Group Under 60% Unimpaired Flow Alternative from 1960 to 2003

State Water Resources Control Board California Environmental Protection Agency
DRAFT Agricultural Economic Effects of Lower San Joaquin River Flow Alternatives
DRAFT Evaluation of San Joaquin River Flow and Southern Delta Water Quality Objectives and Implementation
X‐23 February 2012
ICF 00427.11
0
5000
10000
15000
20000
25000
30000
35000
1960
1961
1962
1963
1964
1965
1966
1967
1968
1969
1970
1971
1972
1973
1974
1975
1976
1977
1978
1979
1980
1981
1982
1983
1984
1985
1986
1987
1988
1989
1990
1991
1992
1993
1994
1995
1996
1997
1998
1999
2000
2001
2002
2003
Are
a of
Irrig
ated
Cro
ps p
er y
ear
(acr
es)
Year
Acreage of Selected Crops : 20, 40, and 60 Percent of Unimpaired Flow
Cotton
Grain
Process Tomatoes
Sub‐Tropical
Dry Beans
Rice
20%
40%
60%
20%
40%
60%
Figure X‐16. Annual Crop Acreage by Crop Group Under 20%, 40%, and 60% Unimpaired Flow Alternatives from 1960 to 2003 for Selected Crops
0
1000
2000
3000
4000
5000
6000
7000
8000
1960
1961
1962
1963
1964
1965
1966
1967
1968
1969
1970
1971
1972
1973
1974
1975
1976
1977
1978
1979
1980
1981
1982
1983
1984
1985
1986
1987
1988
1989
1990
1991
1992
1993
1994
1995
1996
1997
1998
1999
2000
2001
2002
2003
Are
a of
Irrig
ated
Cro
ps p
er
year
(ac
res)
Year
Acreage of Small Acreage Crops : 20, 40, and 60 Percent of Unimpaired Flow
Fresh Tomatoes
Cucurbits
Sugar Beets
Safflower
Onions/Garlic
Figure X‐17. Annual Crop Acreage by Crop Group Under 20%, 40%, and 60% Unimpaired Flow Alternatives from 1960 to 2003 for Selected Higher‐Value Crops with Low Total Acreage

State Water Resources Control Board California Environmental Protection Agency
DRAFT Agricultural Economic Effects of Lower San Joaquin River Flow Alternatives
DRAFT Evaluation of San Joaquin River Flow and Southern Delta Water Quality Objectives and Implementation
X‐24 February 2012
ICF 00427.11
Effects on Agricultural Revenue
SWAPestimatesthetotaldirectgrosscroprevenuesgeneratedacrossCVPMregions11,12,and13forthethreeLSJRflowalternativesandthebaselinecondition.Thesearethedirectrevenuesgeneratedbyfarmingoperations(i.e.,grosstotalproductionvalue).Itdoesnotincludetheassociatedindirectorinducedeffectontheregionaleconomy,whichwillbeaddressedinthenextsection.SWAPiscalibratedandoutputisreportedin2005dollars,butissubsequentlyadjustedusingEngineeringNewsRecordconstructioncostindicesandreportedbelowin2008dollarstocorrespondwiththesubsequentregionaleconomicanalysis.
WatersuppliesandrelatedconditionsintheLSJRwatershedarehighlyvariableovertime,andassociateddataormodelingresultsaresometimebettercharacterizedbyexceedanceplotsthanbysimpleaverageormedianstatistics.Tocharacterizethemagnitudeandvariabilityofrevenues,FigureX‐18presentsanexceedanceplotofSWAPestimatesfortotalLSJRwatershedannualagriculturalrevenuesacrossthe82yearsofsimulationforeachoftheLSJRflowobjectivesandthebaselinecondition.
Revenuesestimatedforaparticularyear,foraparticularLSJRalternative,maybeaboveorbelowthatsameyear’sestimateforthebaselinecondition.Tounderstandthisdifference,it’simportanttonotcomparetheexceedanceplotsinFigureX‐18,butratheruseaplotoftheannualdifferences.Thedifferenceinannualrevenueaboveorbelowthebaselineconditioniscalculatedacrossall82yearsofsimulationforeachLSJRflowalternativeandpresentedonanexceedanceplotinFigureX‐19.Under60%unimpairedflowrequirementsthemodelsestimatesadecreaseinagriculturalproductivityinallyears,whileat20%itestimatesmanyyearswithanincrease.Toputinrelativeterms,thesesameannualdifferencesarepresentedinFigureX‐20asapercentdifferenceaboveorbelowthebaselinecondition.
$2.3
$2.4
$2.5
$2.6
$2.7
$2.8
$2.9
0% 10% 20% 30% 40% 50% 60% 70% 80% 90% 100%
Ag
ricu
ltu
re D
irect
Reven
ue (
$ B
illi
on
)
Percent of Time Equaled or Exceeded
Project Area Direct Revenue Compared to Baseline
Baseline 20% Alternative 40% Alternative 60% Alternative
Figure X‐18. Exceedance Plot of SWAP Estimates for Total LSJR Watershed Annual Agricultural Revenues for Each of the LSJR Flow Objectives and the Baseline Condition Across the 82 Years of Simulation

State Water Resources Control Board California Environmental Protection Agency
DRAFT Agricultural Economic Effects of Lower San Joaquin River Flow Alternatives
DRAFT Evaluation of San Joaquin River Flow and Southern Delta Water Quality Objectives and Implementation
X‐25 February 2012
ICF 00427.11
-$400
-$350
-$300
-$250
-$200
-$150
-$100
-$50
$0
$50
$100
0% 10% 20% 30% 40% 50% 60% 70% 80% 90% 100%
Ch
an
ge i
n A
gri
cu
ltu
re D
irect
Reven
ue (
$ M
illi
on
)
Percent of Time Equaled or Exceeded
Project Area Direct Effects Compared to Baseline
20% Alternative 40% Alternative 60% Alternative
Figure X‐19. Exceedance Plot of the Difference in SWAP Estimates of Total LSJR Watershed Annual Agricultural Revenues Between the Three LSJR flow Objectives and the Baseline Condition Across the 82 Years of Simulation
-14%
-12%
-10%
-8%
-6%
-4%
-2%
0%
2%
4%
0% 10% 20% 30% 40% 50% 60% 70% 80% 90% 100%
Ch
an
ge i
n A
gri
cu
ltu
re D
irect
Reven
ue (
%)
Percent of Time Equaled or Exceeded
Project Area Direct Effects Compared to Baseline
20% Alternative 40% Alternative 60% Alternative
Figure X‐20. Exceedance Plot of the Percent Difference in SWAP Estimates of Total LSJR Watershed Annual Agricultural Revenues between the Three LSJR Flow Objectives and the Baseline Condition Across the 82 Years of Simulation

State Water Resources Control Board California Environmental Protection Agency
DRAFT Agricultural Economic Effects of Lower San Joaquin River Flow Alternatives
DRAFT Evaluation of San Joaquin River Flow and Southern Delta Water Quality Objectives and Implementation
X‐26 February 2012
ICF 00427.11
Tofurtherdescribethevariablenatureofrevenuesoverthe82yearsofsimulation,FigureX‐21presentsthetotalannualdirectrevenueasatime‐seriesforyears1922through2003forthebaselineandthreeLSJRalternatives.Tounderstandtherelativemagnitudeoftheeffectonrevenuesassociatedwiththealternatives,FigureX‐22presentsthepercentdifferenceintotalannualdirectrevenuebetweenthethreeLSJRalternativesandthebaselineconditionasatime‐seriesforyears1922through2003.
Asdiversionreductionsincrease(i.e.,assurfacewaterdiversionsbecomelessavailable)theeffectonagriculturalrevenuesrelatedtoanadditionalincreaseindiversionreductionsbeginstoclimbfaster.Todemonstratethis,FigureX‐23displaysthemarginalrevenuelossperacre‐footofdiversionreductionforLSJRflowalternativesrangingfrom25%to60%ofunimpairedflow.
$2.3
$2.4
$2.5
$2.6
$2.7
$2.8
$2.9
1920 1930 1940 1950 1960 1970 1980 1990 2000
An
nu
al D
irec
t R
even
ue
($B
illi
on
)
Year
Agriculture Sector Direct Revenue Compared to Baseline
Baseline Direct Revenue 20% Alternative Direct Revenue
40% Alternative Direct Revenue 60% Alternative Direct Revenue
Figure X‐21. Total Annual Direct Revenue ($Billion) for Years 1922 through 2003 for the Baseline and Three LSJR Alternatives

State Water Resources Control Board California Environmental Protection Agency
DRAFT Agricultural Economic Effects of Lower San Joaquin River Flow Alternatives
DRAFT Evaluation of San Joaquin River Flow and Southern Delta Water Quality Objectives and Implementation
X‐27 February 2012
ICF 00427.11
-15%
-10%
-5%
0%
5%
1920 1930 1940 1950 1960 1970 1980 1990 2000
Ch
ang
e in
Dir
ect
Rev
enu
e (%
of
Bas
elin
e)
Year
Agriculture Sector Direct Revenue Compared to Baseline
20% Alternative Direct Revenue 40% Alternative DirectRevenue
60% Alternative Direct Revenue
Figure X‐22. Percent Difference in Total Annual Direct Revenue Between the Three LSJR Alternatives and the Baseline Condition for Years 1922 through 2003
‐300
‐280
‐260
‐240
‐220
‐200
‐180
‐160
‐140
‐120
‐100
500 600 700 800 900 1,000 1,100 1,200
Reven
ue Losses ($200
8/acre‐ft)
Average Annual Diversion Reduction from Three East Side Tributaries (taf)
Marginal Revenue Loss
25% UF
30% UF
35% UF
40% UF
45% UF50% UF
55% UF
60% UF
UF = Unimpaired Flow
Figure X‐23. Marginal Revenue Loss Per Acre‐Foot of Additional Diversion Reduction for LSJR flow Alternatives Ranging from 25% to 60% of Unimpaired Flow

State Water Resources Control Board California Environmental Protection Agency
DRAFT Agricultural Economic Effects of Lower San Joaquin River Flow Alternatives
DRAFT Evaluation of San Joaquin River Flow and Southern Delta Water Quality Objectives and Implementation
X‐28 February 2012
ICF 00427.11
X.5 Effects on Regional Economy TheanalysisinthissectionprovidesestimatesofthetotalregionaleconomicactivityassociatedwithagriculturalproductionintheLSJRwatershedforeachoftheLSJRflowalternativesandcomparestheseestimatestobaselineconditions.ThisanalysisusestheIMPLANeconomicmodeltoestimatetheindirectandinducedeconomicactivityassociatedwiththedirectagricultural‐relatedrevenuefromtheSWAPmodel(asdiscussedandpresentedintheprevioussection).Ingeneral,changesinagriculturalproductionandrelatedjobswouldalsoaffectbusinessesservingfarmingoperationsandfarmworkers.TheIMPLANmodelappliesjobandincomemultiplierstocalculatetheeffectstootherconnectedsectorsoftheregionaleconomy.Thedirectagricultural‐relatedrevenueeffectsfromtheSWAPmodelandtheindirectandinducedeconomiceffectsfromtheIMPLANmodeltogetherprovideanestimateofthetotaleconomicsectoroutputandjobseffectsfortheregion.
X.5.1 IMPLAN Model and Approach
Reductionsinwaterdeliveriestoagriculturaluserswouldaffectseveralsectorsoftheeconomy,notjustagriculture.Whenfarmproductionfallsasaresultofreducedwateravailability,farmerswouldhirefewerseasonalworkersandmaylayoffsomeyear‐roundworkers.Withoutjobs,householdspendingbytheseworkersislikelytofall,affectingretailersandotherbusinessesinthearea.Inaddition,farmerswouldreducepurchasesofequipment,materials,andservicesfromlocalbusinesses,reducingjobsandincomewiththesesuppliers.Thetotalregionaleconomiceffectisthesumofthedirecteffectstoagricultureandtheseassociatedindirectandinducedeffects.
ToestimatetheregionaleconomiceffectstheLSJRflowalternatives,the2009ImpactAnalysisforPlanningmodel(IMPLAN)Version3.0(2009)wasused.IMPLANhasbeenusedformanyyearsbystate,federal,andmunicipalentitiesthroughoutthecountrytocalculateeconomiceffects.ThisincludestheCaliforniaDepartmentofWaterResources,theStateWaterBoard,theU.S.ArmyCorpsofEngineers,U.S.BureauofReclamation,theBureauofEconomicAnalysis,andtheBureauofLandManagement.IMPLANwasusedpreviouslybytheStateWaterBoardtodeterminethepotentialregionaleffectsofreducedfarmproductionintheSanJoaquinValleyintheEIRfortheImplementationofthe1995Bay/DeltaWaterQualityControlPlan(StateWaterResourcesControlBoard1999).ThisprevioususewassimilartothecurrentuseofIMPLANtodeterminetheregionaleconomiceffectsoftheLSJRflowobjectivesalternatives.
IMPLANisaninput‐outputmultipliermodelandconsidersinterrelationshipsamongsectorsandinstitutionsintheregionaleconomy.ProductioninthedifferenteconomicsectorsissimulatedinIMPLANbyusingfixedfactors,whichaccountfordynamicssuchasproductionperunitofinput,valueadded,andemployment.Itthenappliesthesefactorsinasocialaccountingmatrix,whichaccountsforchangesintransactionsbetweenproducersandintermediateandfinalconsumersinothersectorsoftheeconomy.TheIMPLANapproachalsoconsidersnon‐markettransactionssuchunemploymentinsurancepaymentsandassociatedchangesintaxrevenuesforgovernment.
TheIMPLANmodelusesregion‐specificmultiplierstoestimatetheindirectandinducedeconomiceffects(positiveornegative)ofchangesinonesectoronallotherconnectedsectorsintheregionaleconomy.Forthisanalysis,thetendefaultIMPLANcropgroupswereaggregatedintosector111(cropproduction)oftheNorthAmericanIndustryClassificationSystem(NAICS)Thusdirectrevenueeffect,anoutputfromtheSWAPmodel(describedinSectionX.4above),wereappliedto

State Water Resources Control Board California Environmental Protection Agency
DRAFT Agricultural Economic Effects of Lower San Joaquin River Flow Alternatives
DRAFT Evaluation of San Joaquin River Flow and Southern Delta Water Quality Objectives and Implementation
X‐29 February 2012
ICF 00427.11
sector111asawhole.Theindirectandinducedeffectsarethencalculatedbyapplyingthesemultipliersforeachsectoraffectedbychangestosector111.BecausemultipliersareappliedtothedirectrevenuesfromtheSWAPmodel,itwaspossibletolimitthemodeledareaintheregionaleffectsmodelingtotheareamodeledbySWAPandasshownpreviouslyinFigureX‐10.ThemajorityoftheareamodeledinIMPLANiscontainedwithinthecountiesofMadera,Merced,andStanislausandisagoodrepresentationoftheagriculturalareaintheLSJRwatershed.
TheIMPLANmodelthenusesabuilt‐insetofregionalmultiplierstodevelopthedirect,indirectandinducedeffectsonemploymentandsectoroutput.Asmentionedearlier,changesinagriculturalrevenuescorrespondtodirectimpactsonsectoroutput.Thebuilt‐inratiosofjobsperunitofsectoroutputarethenusedtocalculatedirectimpactsofagriculturalrevenuelossesinregionalemployment.Thusthedirecteffecttoemploymentisthedirectrevenueeffectmultipliedbytheagriculturesectoremploymentmultiplier.Theadditionalindirectandinducedemploymenteffectistheindirectandinducedeconomiceffectmultipliedbytheagriculturesectoremploymentmultiplier.
Input‐outputanalysisapproachemployedbyIMPLANusuallyoverestimatesindirectjobandincomelosses.Oneofthefundamentalassumptionsininput‐outputanalysisisthattradingpatternsbetweenindustriesarefixed.Thisassumptionimpliesthatsuppliersalwayscutproductionandlayoffworkersinproportiontotheamountofproductsuppliedtofarmsorotherindustriesreducingproduction.Inreality,businessesarealwaysadaptingtochangingconditions.Whenafarmcutsbackproduction,somesupplierswouldbeabletomakeuppartoftheirlossesinbusinessbyfindingnewmarketsinotherareas.Growthinotherpartsofthelocaleconomyisexpectedtoprovideopportunitiesforthesefirms.Fortheseandotherreasons,jobandincomelossesestimatedusinginput‐outputanalysisshouldoftenbetreatedasupperlimitsontheactuallossesexpected(SWRCB1999).
X.5.2 Summary of Results
ThissectionpresentsestimatesofthetotaleconomicoutputfromIMPLANforcropproduction(Sector111)andrelatedeconomicsectorsassociatedwiththeLSJRflowalternatives.Thisincludesboththedirecteffectsonagricultural‐relatedrevenuesandjobsasestimatedbytheSWAPmodel(whichareinputtothecropproductionsectorofIMPLAN)andtheassociatedindirectandinducedeffectsontheagriculture‐relatedregionaleconomyandjobmarketasestimatedbyIMPLAN.
Entire LSJR Project Area
Asanoverview,TableX‐9,presentsthebaselineaveragetotaloutputfromSector111–CropProductionplusallothersectorswithassociatedindirectorinducedeffectsalongwiththedifferencefrombaseline,bothindollarsandpercent,foreachLSJRflowalternative.Tobetterunderstandtheeffectsasafunctionofpercentageunimpairedflow,outputisalsopresentedfor30and50%ofunimpairedflow.Thetablefurthersplitsthetotalsectoroutputintoaveragedirecteffectsandaverageinducedandindirecteffects.Ingeneral,asthepercentofunimpairedflowforanalternativeincreases,theeconomicandrelatedemploymenteffectsalsoincrease.

State Water Resources Control Board California Environmental Protection Agency
DRAFT Agricultural Economic Effects of Lower San Joaquin River Flow Alternatives
DRAFT Evaluation of San Joaquin River Flow and Southern Delta Water Quality Objectives and Implementation
X‐30 February 2012
ICF 00427.11
Table X‐9. Average (Over the 82 Years of Simulation) Baseline Economic Output for the Crop Production and Related Sectors and Changes Associated with Various Percentage of Unimpaired Flow Requirements
ChangefromBaselinebyPercentUnimpairedFlow($Millions)
EconomicEffects(2008Dollars)
Baseline($Millions)
20% 30% 40% 50% 60%
TotalSectorOutput $4,701 +$13 ‐$29 ‐$75 ‐$131 ‐$193
%ofSector 100% +0.3% ‐0.6% ‐1.6% ‐2.8% ‐4.1%
Direct $2,760 +$7 ‐$17 ‐$44 ‐$77 ‐$113
IndirectandInduced $1,941 +$5 ‐$12 ‐$31 ‐$54 ‐$80
Tocharacterizethemagnitudeandvariabilityofrevenues,FigureX‐24presentsanexceedanceplotofthetotaleconomicoutputfromtheIMPLANcropproductionandrelatedsectorsacrossthe82yearsofsimulationforeachoftheLSJRflowobjectivesandthebaselinecondition.
Thedifferenceinthistotaleconomicoutputaboveorbelowthebaselineconditioniscalculatedacrossall82yearsofsimulationforeachLSJRflowalternativeandpresentedonanexceedanceplotinFigureX‐25.Toputinrelativeterms,thesesameannualdifferencesarepresentedinFigureX‐26asapercentdifferenceaboveorbelowthebaselinecondition.
TheSWAPandIMPLANmodelingoutputisnotdisaggregatedtotheindividualtributarywatersheds.AsdemonstratedearlierinTableX‐5,theLSJRflowalternativeswouldbeexpectedtoreducesurfacewaterdiversionsoverallontheTuolumneandMercedRiversmorethanthoseontheStanislausRiver.Solikewise,theassociatedeconomiceffectsarenotexpectedtobedistributedequallyacrossthethreeLSJRtributarywatersheds.
$4.0
$4.1
$4.2
$4.3
$4.4
$4.5
$4.6
$4.7
$4.8
$4.9
0% 10% 20% 30% 40% 50% 60% 70% 80% 90% 100%
Re
gio
nal
Secto
r O
utp
ut
($ B
illi
on
)
Percent of Time Equaled or Exceeded
Project Area Sector Output Compared to Baseline
Baseline 20% Alternative 40% Alternative 60% Alternative
Figure X‐24. Exceedance Plot of IMPLAN Estimates for Total Economic Output from the Crop Production and Related Sectors for Each of the LSJR Flow Objectives and the Baseline Condition Across 82 Years of Simulation

State Water Resources Control Board California Environmental Protection Agency
DRAFT Agricultural Economic Effects of Lower San Joaquin River Flow Alternatives
DRAFT Evaluation of San Joaquin River Flow and Southern Delta Water Quality Objectives and Implementation
X‐31 February 2012
ICF 00427.11
-$600
-$500
-$400
-$300
-$200
-$100
$0
$100
$200
0% 10% 20% 30% 40% 50% 60% 70% 80% 90% 100%
Ch
an
ge i
n R
eg
ion
al
Secto
r O
utp
ut
($ M
illi
on
)
Percent of Time Equaled or Exceeded
Project Area Sector Output Compared to Baseline
20% Alternative 40% Alternative 60% Alternative
Figure X‐25. Exceedance Plot of the Difference in IMPLAN Estimates for Total Economic Output from the Crop Production and Related Sectors between the Three LSJR Flow Objectives and the Baseline Condition across 82 Years of Simulation
-25%
-20%
-15%
-10%
-5%
0%
5%
10%
0% 10% 20% 30% 40% 50% 60% 70% 80% 90% 100%
Ch
an
ge i
n R
eg
ion
al
Secto
r O
utp
ut
(%)
Percent of Time Equaled or Exceeded
Project Area Sector Output Compared to Baseline
20% Alternative 40% Alternative 60% Alternative
Figure X‐26. Exceedance Plot of the Percent Difference in IMPLAN Estimates for Total Economic Output from the Crop Production and Related Sectors Between the Three LSJR Flow Objectives and the Baseline Condition Across the 82 Years of Simulation
Inadditiontorevenue,theIMPLANmodelalsoestimatesthenumberofjobsassociatedwiththecropproductionandrelated(indirectandinduced)sectorsoftheeconomy.ThetotaleffectsonjobsassociatedwiththeLSJRflowobjectivesaresimilar,inrelativeterms,totheeffectoneconomic

State Water Resources Control Board California Environmental Protection Agency
DRAFT Agricultural Economic Effects of Lower San Joaquin River Flow Alternatives
DRAFT Evaluation of San Joaquin River Flow and Southern Delta Water Quality Objectives and Implementation
X‐32 February 2012
ICF 00427.11
output.TableX‐10presentsasummaryofthetotalnumberofjobsassociatedwiththeIMPLANcropproductionandrelatedsectorsandhowtheyareaffectedonaveragebyvariouspercentageofunimpairedflowrequirements.Italsopresentsthebreakdownofjobswithinthecropproductionsector(directeffects)andthosewithintherelatedsectors(indirectandinduced).
Table X‐10. Average (over the 82 Years of Simulation) Number of Crop Production and Related Sector Jobs for Baseline Condition and Changes Associated with Various Percentage of Unimpaired Flow Alternatives.
ChangefromBaselinebyPercentUnimpairedFlow
EconomicEffects Baseline 20% 30% 40% 50% 60%
TotalRegionalEffecttoEmployment(#jobs)
31,787 +86 ‐196 ‐504 ‐889 ‐1,302
%ofSector 100% +0.3% ‐0.6% ‐1.6% ‐2.8% ‐4.1%
Direct 13,080 +35 ‐81 ‐207 ‐366 ‐536
IndirectandInduced 18,707 +50 ‐115 ‐297 ‐523 ‐766
FigureX‐27presentsanexceedanceplotofIMPLANestimatesofthetotalnumberofcropproductionandrelated(indirectandinduced)sectorjobseachyearintheLSJRwatershedforeachoftheLSJRflowobjectivesandthebaselineconditionacrossthe82yearsofsimulation.Thedifferenceinthenumberofjobseachyearaboveorbelowthebaselineconditioniscalculatedacrossall82yearsofsimulationforeachLSJRflowalternativeandpresentedonanexceedanceplotinFigureX‐28.FigureX‐29presentsanexceedanceplotofthepercentdifferenceinthetotalnumberofjobseachyearintheLSJRwatershedbetweenthethreeLSJRflowobjectivesandthebaselineconditionacrossthe82yearsofsimulation.TheeffectoftheLSJRflowalternativesonjobsissimilarinrelativemagnitudetotheireconomiceffect.
27,000
28,000
29,000
30,000
31,000
32,000
33,000
0% 10% 20% 30% 40% 50% 60% 70% 80% 90% 100%
Reg
ion
al
Em
plo
ymen
t (#
Jo
bs)
Percent of Time Equaled or Exceeded
Project Area Regional Employment Compared to Baseline
Baseline 20% Alternative 40% Alternative 60% Alternative
Figure X‐27. Exceedance Plot of IMPLAN Estimates for Total Jobs for the Crop Production and Related Sectors in the LSJR Watershed for Each of the LSJR Flow Objectives and the Baseline Condition Across 82 Years of Simulation

State Water Resources Control Board California Environmental Protection Agency
DRAFT Agricultural Economic Effects of Lower San Joaquin River Flow Alternatives
DRAFT Evaluation of San Joaquin River Flow and Southern Delta Water Quality Objectives and Implementation
X‐33 February 2012
ICF 00427.11
-4,000
-3,500
-3,000
-2,500
-2,000
-1,500
-1,000
-500
0
500
1,000
0% 10% 20% 30% 40% 50% 60% 70% 80% 90% 100%
Ch
an
ge i
n R
eg
ion
al
Em
plo
ymen
t (#
Jo
bs)
Percent of Time Equaled or Exceeded
Project Area Regional Employment Compared to Baseline
20% Alternative 40% Alternative 60% Alternative
Figure X‐28. Exceedance Plot of the Difference in IMPLAN Estimates for Total Jobs for the Crop Production and Related Sectors Each Year Above or Below the Baseline Condition in the LSJR Watershed for the Three LSJR Flow Objectives Across 82 Years of Simulation
-14%
-12%
-10%
-8%
-6%
-4%
-2%
0%
2%
4%
0% 10% 20% 30% 40% 50% 60% 70% 80% 90% 100%
Ch
an
ge i
n R
eg
ion
al
Em
plo
ymen
t (%
)
Percent of Time Equaled or Exceeded
Project Area Regional Employment Compared to Baseline
20% Alternative 40% Alternative 60% Alternative
Figure X‐29. Exceedance Plot of the Percent Difference in IMPLAN Estimates for Total Jobs for the Crop Production and Related Sectors Each Year Above or Below the Baseline Condition in the LSJR Watershed Between the Three LSJR Flow Objectives and the Baseline Condition Across 82 Years of Simulation

State Water Resources Control Board California Environmental Protection Agency
DRAFT Agricultural Economic Effects of Lower San Joaquin River Flow Alternatives
DRAFT Evaluation of San Joaquin River Flow and Southern Delta Water Quality Objectives and Implementation
X‐34 February 2012
ICF 00427.11
X.6 References CaliforniaDepartmentofWaterResources(DWR).2008.EconomicAnalysisGuidebook.(ed.
DepartmentofWaterResources),pp.59.DepartmentofWaterResources,,SacramentoCalifornia.Availableat<http://www.water.ca.gov/pubs/planning/economic_analysis_guidebook/econguidebook.pdf>.January2010.
Draper,A.J.,M.W.Jenkins,K.W.Kirby,J.R.Lund,andR.E.Howitt.2003.Economic‐engineeringoptimizationforCaliforniawatermanagement.JournalOfWaterResourcesPlanningAndManagement,129,155‐164.
Griffin,R.C.2006.Waterresourceeconomics:theanalysisofscarcity,policies,andprojects.Cambridge,Mass.;London,England:MITPress.
Howitt,R.E.1995.Positivemathematicalprogramming.AmericanJournalofAgriculturalEconomics,77,329‐342.
Howitt,R.,J.Kaplan,D.Larson,D.MacEwan,J.Medellin‐Azuara,G.Horner,andN.S.Lee.2009aCentralValleySalinityReport.ReportfortheStateWaterResourcesControlBoard.UniversityofCalifornia,Davis,California.Availableat<http://swap.ucdavis.edu/>.01November2009.
Howitt,R.,J.Medellin‐Azuara,D.MacEwan.2009b.MeasuringtheEmploymentImpactofWaterReductions.UniversityofCalifornia:Davis,California,p.10.Availableathttp://swap.ucdavis.edu
Howitt,R.E.,J.Medellin‐Azuara,D.MacEwan.2009c.EstimatingEconomicImpactsofAgriculturalYieldRelatedChanges.CaliforniaEnergyCommission,PublicInterestEnergyResearch(PIER):Sacramento,CA.
Howitt,R.,D.MacEwan,J.Medellin‐Azuara,andJ.R.Lund.2010.EconomicModelingofAgricultureandWaterinCaliforniaUsingtheStatewideAgriculturalProductionModel.pp.25.UniversityofCalifornia,Davis.Availableat.
Lund,J.R.,E.Hanak,W.Fleenor,R.Howitt,J.Mount,andP.Moyle.2007.EnvisioningFuturesfortheSacramento‐SanJoaquinRiverDelta.(edP.P.I.o.California),pp.300.PublicPolicyInstituteofCalifornia,SanFrancisco,California.Availableat<http://www.ppic.org/main/publication.asp?i=671>.
Maneta,M.,M.Torres,S.A.Vosti,W.W.Wallender,S.Allen,L.H.Bassoi,L.Bennett,R.Howitt,L.Rodrigues,andJ.Young.2009.Assessingagriculture‐waterlinksatthebasinscale:hydrologicandeconomicmodelsoftheSaoFranciscoRiverBasin,Brazil.WaterInternational,34,88‐103.
Medellin‐Azuara,J.,R.E.Howitt,andJ.R.Lund.2007.Californiaagriculturalwaterdemandsforyear2050underhistoricandwarmingclimates.InCaliforniaEnergyCommission,PIERProgram.CEC‐500‐2005‐195,CaliforniaEnergyCommission.Sacramento,California:CaliforniaEnergyCommission.

State Water Resources Control Board California Environmental Protection Agency
DRAFT Agricultural Economic Effects of Lower San Joaquin River Flow Alternatives
DRAFT Evaluation of San Joaquin River Flow and Southern Delta Water Quality Objectives and Implementation
X‐35 February 2012
ICF 00427.11
Medellín‐Azuara,J.,J.J.Harou,andR.E.Howitt.2010.Estimatingeconomicvalueofagriculturalwaterunderchangingconditionsandtheeffectsofspatialaggregation.ScienceofTheTotalEnvironment,408,5639‐5648.
Medellin‐Azuara,J.,R.E.Howitt,D.MacEwan,andJ.R.Lund.2012.EconomicImpactsofClimate‐RelatedYieldChangesinCalifornia.ClimaticChange,109,387‐405.
Scheierling,S.M.,J.B.Loomis,andR.A.Young.2006.Irrigationwaterdemand:Ameta‐analysisofpriceelasticities.WaterResourcesResearch,42,9.
StateWaterResourcesControlBoard(StateWaterBoard).1999.FinalEnvironmentalImpactReportforImplementationofthe1995Bay/DeltaWaterQualityControlPlan.
Tanaka,S.K.,C.R.Connell,K.Madani,J.Lund,E.Hanak,andJ.Medellin‐Azuara.2008.TheEconomicCostsandAdaptationsforAlternativeDeltaRegulations.InComparingFuturesfortheSacramento‐SanJoaquinDelta,eds.J.R.Lund,E.Hanak,W.Fleenor,W.Bennett,R.E.Howitt,J.Mount&P.Moyle.SanFrancisco,California:PublicPolicyInstituteofCalifornia.
UnitedStatesBureauofReclamation(USBR).1997.CentralValleyProjectImprovementAct.DraftProgrammaticEnvironmentalImpactStatement.TechnicalAppendixVolumeEight.U.S.DepartmentofInterior.U.S.BureauofReclamation,Sacramento,California.Availableat<http://www.usbr.gov/mp/cvpia/docs_reports/fpeis/index.html>.December2010.
Yates,D.,J.Sieber,D.Purkey,andA.Huber‐Lee.2005.WEAP21‐Ademand‐,priority‐,andpreference‐drivenwaterplanningmodelPart1:Modelcharacteristics.WaterInternational,30,487‐500.
Young,R.A.2005.Determiningtheeconomicvalueofwater:conceptsandmethods.ResourcesfortheFuture,Washington,D.C.