geotge psacharopoulos curriculum...
TRANSCRIPT

World Bank Reprint Series: Number 363
Geotge Psacharopoulos
Curriculum Diversification inColombia and Tanzania:An Evaluation
Reprinted with permission from Comparative Education Review, vol. 29, no. 4 (1985), pp. 507-25,
published by the University of Chicago Press.
Pub
lic D
iscl
osur
e A
utho
rized
Pub
lic D
iscl
osur
e A
utho
rized
Pub
lic D
iscl
osur
e A
utho
rized
Pub
lic D
iscl
osur
e A
utho
rized
Pub
lic D
iscl
osur
e A
utho
rized
Pub
lic D
iscl
osur
e A
utho
rized
Pub
lic D
iscl
osur
e A
utho
rized
Pub
lic D
iscl
osur
e A
utho
rized
Curriculum Diversification in Colombiaand Tanzania: An Evaluation
GEORGE PSACHAROPOULOS
Diversifying the secondary school curriculum to include prevocationalsubjects has been an educational policy that has flourished over the lastdecade in many Third World countries. The oft-cited objective of div-ersification is to provide a wider set of future career options relative tothe traditional academic curriculum and a better match between the skillslearned in school and those needed in the labor market.
In spite of numerous arguments put forth in support of or oppositionto diversified education in the Third World, little empirical evidence existsto confirm or reject hypotheses in favor of this type of school.' Thepurpose of this study is to compare any advantages that might haveaccrued to diversified school students and graduates with more conventionaltypes of formal training. Potential advantages stemming from diversificationcould be measured in three ways: first, wider access to secondary schoolingby less privileged socioeconomic groups of the population (equity); second,higher cognitive attainment measured by test scores in both prevocationaland academic subjects (internal efficiency); and third, better labor marketoutcomes, such as better employment opportunities or higher returns toinvestments in acquiring a combination of academic and prevocationalskills as opposed to merely one or the other (external efficiency).
Countries selected for the empirical investigation of diversificationshould meet at least two criteria that would allow a proper evaluation:programs should have been in place long enough and be well implemented,and diversification should have been introduced on a scale large enoughto permit appropriate sampling. Colombia has been chosen as a casecountry in Latin America because it extensively implemented public di-
This paper is based on a more comprehensive World Bank research project on DiversifiedSecondary Curricula (DiSCuS, RPO 672-45), in collaboration with the Colombia Ministry of Education,the Instituto SER de Investigaci6n (Eduarado Velez and Carlos Rojas), the Tanzania Ministry ofEducation and the Institute of Education, and the University of Dar es Salaam (Issa Omari). WilliamLoxley was the main consultant to the project and Ana-Maria Arriagada served as research assistant.Philip Foster, Keith Hinchliffe, and Antonio Zabalza provided various input to the project. RobinHorn was very helpful in revising the first draft. The views expressed here are those of the researchersand should not be attributed to the World Bank or the governments of the two countries.
' For a review of the related literature and a more extended analysis of the issues treated here,see George Psacharopoulos and William Loxley, Diversified Secondary Education and Development: Evidencefrom Colombia and Tanzania (Baltimore: Johns Hopkins University Press, 1985), in press; and K. Lillisand D. Hogan, "Dilemmas of Diversification: Problerms Associated with Vocational Education inDeveloping Countries," Comparative Education 19, no. 1 (1983): 89-107.
Comparative Education Review, vol. 29, no. 4.( 1985 by the Comparative and International Education Society. All rights reserved.00 10-4086/85/2904-000r4$0 1.00
Comparative Education Review 507

PSACHAROPOULOS
versified education alongside purely vocational and academic secondaryschools. Tanzania has been selected as a case country in East Africa becausediversification there is a well-established policy based on self-reliance andhas spread throughout the educational system.
Colombia and Tanzania: Alternate Routes to Diversification
Because of basic differences in their cultural, political, and economicenvironments, Colombia and Tanzania provide two different provinggrounds for evaluating curriculum diversification. Colombia has a multi-track diversified system. The diversified secondary schools, called INEM(Institutos Nacionales de Educacion Media), combine academic with pre-vocational subject tracks under one roof in a 6-year program. During thefirst 2 years, students are exposed to prevocational subjects in order toacquaint them with knowledge and career options in the various trades.The second 2 years are devoted to a vocational orientation such as agricultureor commerce along with some academic study, but the emphasis is clearlyon the vocational course work. During the last 2-year cycle, further spe-cialization takes place. For example, students enrolled in the general in-dustrial training program in the preceeding cycle might now focus onmetal work, construction, or perhaps electrical mechanics, or they mayconcentrate in an academic option. In addition to the diversified educationsystem, there remains the traditional academic course of study in privateand public secondary schools, as well as purely vocational schools at thesame level.
Tanzania has a unitrack diversified system, which is better understoodwhen placed in the context of the country's economic organization thatstresses public ownership and control of most major enterprises. Theeducational system is largely geared to providing the trained manpowerneeded if this sector is to run efficiently. But the main impetus for div-ersification stems from a strong sense of commitment to the ideals ofwork education similar to that found in socialist countries. Because ofTIanzania's philosophy of self-reliance, students are required to gain ex-perience in practical subjects in addition to academic pursuits by "majoring"in a vocational subject of their choice while in secondary school.
Methodology
In spite of the intuitive reasoning that specialized knowledge wouldbe beneficial for an expanding modern economy, there exists no definitiveevidence in support of this assumption. The central research question iswhether the outcomes of diversified education vary substantially fromthose of conventional academic and purely vocational secondary schooling.Two clusters of outcomes have been identified as the main "dependent
508 November 1985
CURRICULUM DIVERSIFICATION
variables" in this study: (1) what is learned in school and (2) what is lateraccomplished in postsecondary economic or further education activities.
The external outcomes of diversification could be tested in the frame-work of their stated rationale, that is, that such curricular reform leadsto: less private demand for postsecondary schooling; a closer relationshipbetween school bias and specialization of postschool training; a higherpropensity for labor force participation at the end of secondary schooling;employment in the field of prevocational specialization; shorter periodsof unemployment (ob search) following secondary school graduation;higher graduate earnings; and higher social returns to investment ineducation.
Given the time span between the socioeducational inputs and outputs,a longitudinal tracer study was chosen.2 I have defined three testing pointsin time for assessing the possible effects of diversified curricula: (a) effectsobservable while the student is still in school; (b) effects observable about1 year after graduation, when the graduate might be in his or her firstemployment or further education; and (c) a fuller assessment after thegraduate has been out of schoolfor some years.
The starting point in each country case was the school or schools ina given district where diversified curricula have existed for a number ofyears, along with other nondiversified schools. Random sampling wasused to obtain representative national coverage of high school studentsin proportion to their numbers enrolled in particular curricular programs.A survey administered to high school seniors just prior to graduation wasused to collect baseline information. A follow-up survey was administeredto the same cohort 1 to 3 years after graduation in order to assess theinitial postschool outcomes. Of course, in order to assess the performanceof diversified schools (the target group) on a set of agreed criteria, in-formation was collected on a number of students who did not attend suchschools (the control group). Thus, the testing of hypotheses reduces tothe statistical significance of differences between target and control groupmean performance on a set of indicators, standardized for a set of non-school-related factors. In Colombia, the baseline sample consisted of8,051 students, of which 4,800 belonged to the control group-that is,those in traditional vocational schools pursuing specialties that correspondto INEM specialties or in standard academic secondary schools. The Tan-zanian sample consisted of 4,181 students, of which 1,025 belonged bydefault to the control group-that is, those schools that have not yet beenbiased and thus offering a traditional academic curriculum.
Three sets of instruments have been used in each country to collectthe necessary information for hypothesis testing: (a) an individual student
2 George Psacharopoulos and Keith Hinchliffe, "Tracer Studv Guidelines," mimeographed(Washington, D.C.: World Bank, Educationi Department, 1983).
Comparative Education Review 509

PSACHAROPOULOS
questionnaire, administered to those still in the last year of target andcontrol secondary schools; (b) a school questionnaire, filled in by theheadmaster of the schools included in the survey; and (c) a graduatefollow-up questionnaire administered to those who left school 1 yearbefore (and also 3 years before, in the case of Colombia).3 Thus, theinformation for each individual student included parental characteristicssuch as education, occupation, and income level; personal characteristicssuch as age, sex, and verbal and mathematical ability;4 cognitive achievementscores on commerce, agriculture, and technical subjects, as well as academicsubject matter;5 noncognitive outcomes based on tests of psychologicalmodernity; and further training and employment indicators (e.g., forthose who during the follow-up were in training or further education,the type of institution and field of study were recorded). For those inemployment, the sector of economic activity, occupation, earnings, andhours of work were recorded, as well as how long they waited beforegetting ajob. For those who were looking for work, information was raisedon their reservation wage and sources of finance.Who Attends Diversified Schools?
Table 1 shows that in Colombia the INEM schools, irrespective ofsubject, recruit more from the lower-income families. Thus, as intended,diversification has successfully drawn more secondary students from lowersocioeconomic backgrounds. Presumably, some of these students mightnot have attended high school if INEMs had not been introduced. But,of course, such students might have enrolled in any type of secondaryschool built in their area.
Regarding Tanzania, table 2 shows significant differences in backgroundcharacteristics of students attending agricultural and commercial subjects.Although it is at the entrance to secondary schools where social selectivitymainly occurs, there is virtually no difference between the socioeconomicorigins of those who attend diversified school as a whole and controlschools.
Cognitive Achievement
Because raw achievement score differences do not take into accountout-of-school influences such as sex, age, ability, and social origins-whichmight differentially affect achievement independent of school placement-regression analysis was employed to control for those out-of-school influ-
For the actual questionnaires used, see George Psacharopoulos and William Loxlev, "DiversifiedSecondary Curriculum Studv (DiSCuS)-Survev Instruments," mimeographed (Washington, D.C.-World Bank, Education Department, Februarv 1984).
General ability scores from selected items from the ICFES tests (National Examination Board)in Colombia were intended to tap general aptitude rather than achievement on a specific subject.In Tanzania, both verbal and quantitative tests of general abilitv constructed bv the local researchteam were administered to students in the sample during the base-year data collection.
Examination items can be found in Psacharopoulos and Loxley, 'DiSCuS-Survev Instruments.'
510 November 1985

CURRICULUM DIVERSIFICATION
TABLE 1FAMILY CHARACTERISTICS OF STUDENTS BY SCHOOL TYPE AND CURRICULUM SUBJECT:
COLOMBIA, 1981 COHORT
Subject Family Characteristic INEM Control
Academic:Family income (pesos/month) 24,602 37,564Father's education (years) 6.9 7.8
Commercial:Family income 22,859 31,080Father's education 5.6 6.6
Industrial:Family income 21,367 25,517Father's education 5.6 6.3
Agricultural:Family income 17,230 19,342Father's education 5.4 4 7
Social services:Family income 19,595 29,556Father's education 5.5 7.4
Overall:Family income 22,220 30,282Father's education 5.9 6.8
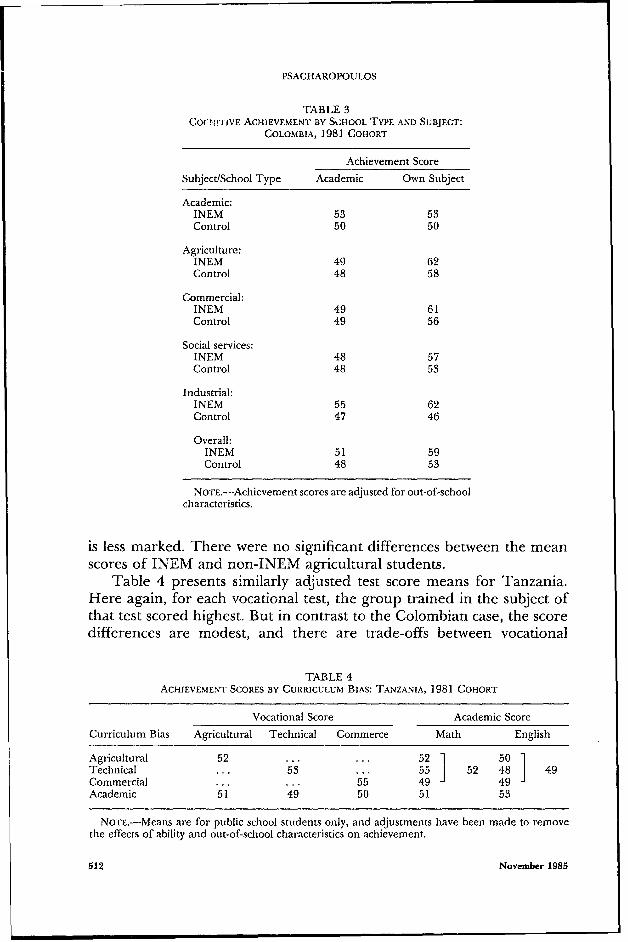
ences that might account for higher scores before students were assignedto various schools or curriculum programs. Table 3 gives group test scoremeans in academic achievement and the test score mean in each vocationalspecialization for all students taking that specialization in the Colombiansample. (Raw scores have been standardized to a mean of 50 and a standarddeviation of 10.) Thus, in the academic subsample, INEM students earned3 points more on average than control students on the academic achievementtest, after adjusting for differences in family background, ability, andschool quality. Industrial students in INEM schools performed substantiallybetter than control students on the industrial achievement test (16 pointshigher) and also on the academic achievement test (8 points higher). Thisimplies that industrial learning was not acquired at the sacrifice of academiclearning. This is true of commercial and social science students as well,though the advantage of the INEM progral.i in the field of specialization
TABLE 2FATHERS' CHARA(CTERISTI(CS OF SECONDARY SCHOOL STUDENIS BY
CURRICULUM BIAS: TANZANIA, 1981 COHORT
Curriculum Bias Income (Shillings) Education (Years)
Agricultural 6,656 715.7 1TecA,nical 6,688 7,193 5.2 5.8C,ommercial 7,834 6.6Academic (control) 7,181 5.9
Comparative Education Review 511
PSACHAROPOULOS
TABLE 3COCri!TIVE ACHIEVEMENT BY SCHOOL TYPE AND SUBJECT:
COLOMBIA, 1981 COHORT
Achievement ScoreSubject/School Type Academic Own Subject
Academic:INEM 53 53Control 50 50
Agriculture:INEM 49 62Control 48 58
Commercial:INEM 49 61Control 49 56
Social services:INEM 48 57Control 48 53
Industrial:INEM 55 62Control 47 46
Overall:INEM 51 59Control 48 53
NOTE.-Achievement scores are adjusted for out-of-schoolcharacteristics.
is less marked. There were no significant differences between the meanscores of INEM and non-INEM agricultural students.
Table 4 presents similarly adjusted test score means for Tanzania.Here again, for each vocational test, the group trained in the subject ofthat test scored highest. But in contrast to the Colombian case, the scoredifferences are modest, and there are trade-offs between vocational
TABLE 4ACHIEVEMENT SCORES BY CURRICULUM BIAS: TANZANIA, 1981 COHORT
Vocational Score Academic ScoreCurriculum Bias Agricultural Technical Commerce Math English
Agricultural 52 ... ... 52 1 50 1Technical ... 53 ... 551 52 481 49Commercial ... ... 55 49 49Academic 51 49 50 51 53
NOTE.-Means are for public school students only, and adjustments have been made to removethe effects of ability and out-of-school characteristics on achievement.
512 November 1985

CURRICULUM DIVERSIFICATION
achievement (gain) and academic achievement (loss), especially in theEnglish academic subtest.
Comparing Costs with Outcomes
The cost of schooling can be looked at from three viewpoints-society,government, and the individual (or household). The specific cost com-ponents that may be relevant to these actors are (a) forgone output orearnings; (b) capital costs of buildings, furniture, and equipment; and (c)direct recurrent costs. Since annualized capital costs are typically smalland the opportunity cost of study can be assumed to be nearly equal forall students in the sample, we focus here on the last and major costcomponent.'
Table 5 reports the cost structure in Colombia, showing that INEMacademic and commercial tracks are around 20 percent and 14 percent,respectively, more expensive than the control counterparts. But INEMagriculture and industry tracks are significantly less expensive than thecontrol counter-rts (28 percent and 25 percent), and the same is truefor the social services specialty but to a lesser extent (11 percent). Table6 combines the information on differential achievement and costs betweenINEM and control schools by reporting the INEM advantage on the basisof cost per unit. Industrial and social service INEMs are especially cost-effective in raising achievement in their own subject relative to the controls(negative coefficients), whereas academic and commercial INEMs raiseachievement at a higher cost, relative to the controls.
Table 7 shows that costs are 14 percent higher in the "biased" schoolsthan in those emphasizing academic subjects in Tanzania. Regarding thegovernment-financed part of the recurrent cost, biased schools are onaverage 34 percent more costly. Table 8 gives the unit cost of raisingachievement in the various vocational tracks relative to a purely academic
TABLE 5ANNUAL DIRECT UNIT COST BY SCHOOL TYPE AND SUBJECT:
COLOMBIA, 1981 (Pesos)
Subject INEM Control
Academic 25,700 22,200Agricultural 26,200 33,700Commercial 25,200 23,200Social services 25,000 27,800Industrial 25,300 31,900
Overall 25,480 27,760
NOTE.-Cost refers to public schools only and includes school-related expenses by students.
'The data sources and assumptions lying behind the cost calculations are described in KeithHinchliffe, 'Cost Structures of Secondary Schooling in Tanzania and Colombia," mimeographed(Washington, D.C.: World Bank, Education Department, 1983).
Comparative Education Review 513

PSACHAROPOULOS
TABLE 6ACHIEVEMENT ScoRE GAIN ASSOCIATED WITH INEM PROGRAMS:
COLOMBIA, 1981 COHORT
Cost ofRaising
AchievementSubsamplerTest Achievement Gain 1 Point (Pesos)
Academic:Academic 3.28 1,067
Commercial:Commercial 5.10 392Academic .43 4,651
Industrial:Industrial 15.71 -420Academic 8.01 -824
Social services:Social services 4.47 -626
NOTE.-Background, ability, and school factors controlled for. Allreported gains statistically significant at the 5% level or better. Theagricultural subsample and social services academic achievement gainswere not statistically significant.
curriculum, showing that the agricultural biased schools are the least cost-effective.Graduate Destinations
Table 9 gives the main activity destinations by school type and curriculumprogram in Colombia. Thus, 1 year later, roughly one-third of the graduateswere in school; one-third were working full-time; and, aside from 11percent studying and working part-time simultaneously, about one-quarterof the sample was neither studying nor working. There is virtually nodifference in the proportions of academic and prevocational studentsfrom either type of school who continue studying. Neither curriculumdiversification nor the introduction of INEMs has led to a reduction inthe desire of secondary students to continue with some type of formaleducation. Thus, prevocational studies appear to be used in the same way
TABLE 7ANNUAL UNIT COST BY CURRICULUM BIAS:
TANZANIA, 1981
Annual Unit CostCurriculum Bias (Shillings)
Agricultural 3,449Teclinical 3,263 J 3,291Commercial 3,160Academic 2,888
NOTE.-Cost refers to public schools only.
514 November 1985

CURRICULUM DIVERSIFICATION
TABLE 8ACHIEVEMENT SCORE GAIN ASSOCIATED WITH DIVERSIFIED SCHOOLS COMPARED
WITH ACADEMIC CONTROL GROUP: TANZANIA, 1981 COHORT
Cost of RaisingAchievement 1 Point
School Bias/Test Achievement Gain (Shillings)
Technical:Technical 5.26 71English -4.05 ...
Commercial:Commercial 5.43 50English -2.27 ...
Agricultural:Agricultural 1.61 348English -2.24 ...
Academic:Commercial - 2.74 0Technical -4.09 0English - 2.24 0
NOTE.-Background, ability, and school factors controlled for. All achievementscore differences staiistically significant at the 5% level or better.
as academic studies, namely, to gain qualifications for further academicstudy.
Do those coming from vocational curricula experience less unem-ployment before getting ajob? The data for Colombia do not substantiatethis hypothesis. If anything, they show the reverse, as is indicated in table
TABLE 91982 DEsrINATION BY ScHooL. TYPE AND SUBJEC(T: COL.OMBIA, 1981 COHORT (%)
Postschool Activity, 1982
School Type/Subject, 1981 Study Work Study/Work Other
INEM:Academic 34 30 9 27Agricultural 29 27 15 29Commercial 39 29 10 22Social services 43 26 9 23Industrial 36 31 8 25
Average 37 29 10 24
Control:Academic 38 29 13 20Agricultural 34 36 11 19Conimercial 36 32 9 23Social services 46 26 12 16Industrial 34 32 11 23Pedagogy 41 29 10 20
Average 37 30 11 22
Overall average 37 30 11 22
Comparative Education Review 515

PSACHAROPOULOS
TABLE 10PERIOD OF UNEMPLOYMENT BEFORE FIRST JOB BY SCHOOL TYPE
AND TRACK: COLOMBIA, 1981 COHORT (Weeks)
School TypeTrack INEM Control
Academic 21.2 21.6Vocational 25.6 26.4
NOTE.-Between-subject differences are significant at the .01 level.
10; that is, those who have followed vocational courses in either INEMor control schools nave significantly longer periods of unemployment. Ofthose seeking jobs, 85 percent claim to be still financially dependent ontheir parents or relatives, with no difference between INEM and non-INEM affiliation. On average, job seekers have been looking unsuccessfullyfor work during the past 22 weeks and would be willing to work for12,000 pesos per month, a reservation wage that is much higher than thewage rates of those already employed.
Table 11 gives the mean earnings of INEM and control graduatesworking full-time. Earnings differences are very modest. But academicgraduates earn more, relative to the rest. With the exception of INEMacademic graduates, actual earnings are clearly less than what graduateswere hoping to earn before entering the labor market.
The range of occupations entered by graduates is very wide and hasbeen narrowed down into groupings. Comparing outcomes by INEM/control dichotomies produces no obvious pattern, apart from teachingbeing a much less likely occupation for control graduates. In summary,although proportions of INEM and control graduates looking for workare much the same, and although both groups expect to earn much thesame once ajob is found, few differences can be discerned regarding thekind of employment sought by individuals from the two groups.
In Tanzania, the major post-form IV avenues available to graduates
TABLE 11MONTHLY EARNINGS BY SCHOOL TYPE AND SUBJECT: COLOMBIA, 1981 COHORT (Pesos)
1982 EarningsCurriculum Subject INEM Control Sample
Academic 10,639 10,0710 10,207Agricultural 9,520 9,596 9,556Commercial 9,664 9,322 9,493Social services 9,556 9,577 9,568Industrial 9,408 10,291 9,902Overall 9,854 9,980 9,887
516 November 1985
CURRICULUM DIVERSIFICATION
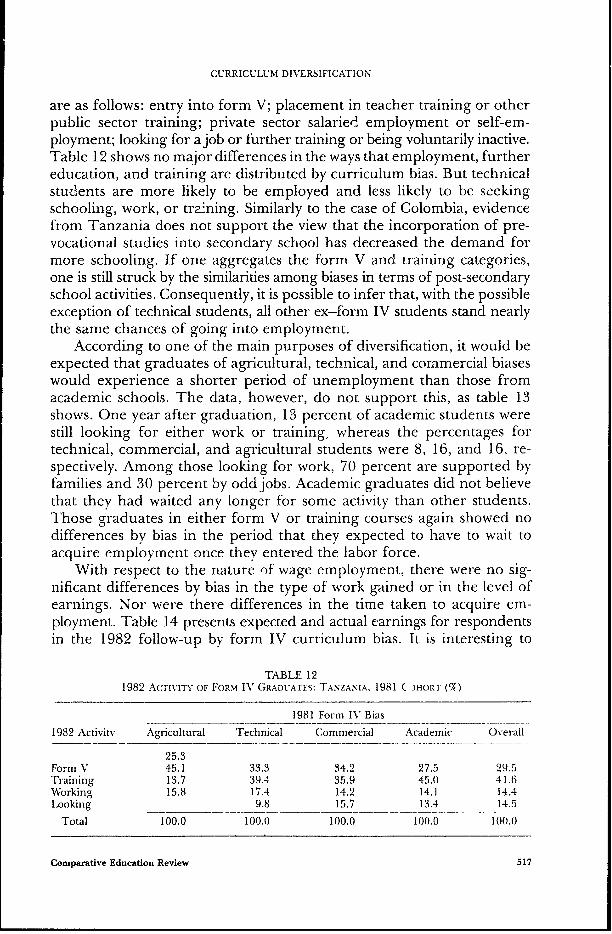
are as follows: entry into form V; placement in teacher training or otherpublic sector training; private sector salaried employment or self-em-ployment; looking for a job or further training or being voluntarily inactive.Table 12 shows no major differences in the ways that employment, furthereducation, and training are distributed by curriculum bias. But technicalstudents are more likely to be employed and less likely to be seekingschooling, work, or trazning. Similarly to the case of Colombia, evidencefrom Tanzania does not support the view that the incorporation of pre-vocational studies into secondary school has decreased the demand formore schooling. If one aggregates the form V and training categories,one is still struck by the similarities among biases in terms of post-secondaryschool activities. Consequently, it is possible to infer that, with the possibleexception of technical students, all other ex-form IV students stand nearlythe same chances of going into employment.
According to one of the main purposes of diversification, it would beexpected that graduates of agricultural, technical, and commercial biaseswould experience a shorter period of unemployment than those fromacademic schools. The data, however, do not support this, as table 13shows. One year after graduation, 13 percent of academic students werestill looking for either work or training, whereas the percentages fortechnical, commercial, and agricultural students were 8, 16, and 16, re-spectively. Among those looking for work, 70 percent are supported byfamilies and 30 percent by odd jobs. Academic graduates did not believethat they had waited any longer for some activity than other students.Those graduates in either form V or training courses again showed nodifferences by bias in the period that they expected to have to wait toacquire employment once they entered the labor force.
With respect to the nature of wage employment, there were no sig-nificant differences by bias in the type of work gained or in the level ofearnings. Nor were there differences in the time taken to acquire em-ployment. Table 14 presents expected and actual earnings for respondentsin the 1982 follow-up by form IV curriculum bias. It is interesting to
TABLE 121982 A:TrnIry OF FORM, IV GRADUATES: TANZANIA, 1981 ( )HORI (%)
1981 Form IN' Bias
1982 Activitv Agricultural Technical Commercial Academic Overall
25.3Form V 45.1 33.3 34.2 27.5 29.5Training 13.7 39.4 35.9 45.0 41.6Working 15.8 17.4 14.2 14.1 14.4Looking 9.8 15.7 13.4 14.5
Total 100.0 1(0.( 100.0 10(.0 1((l.()
Compaative Education Review 517

PSACHAROPOULOS
TABLE 13UNEMPLOYMENT RATES [N 1982 AND EXPECTED PERIODS OF JOB SEARCH: TANZANIA, 1981 COHORT
Agricultural Technical Commercial Academic
Unemplovment rate (%) 16 8 16 13Expected time to find work (weeks):
Those looking I1 9 9 10Those in form V 34 38 36 38Those in training 35 36 32 31
note that those still looking for work put the level of "minimum acceptableearnings" at a much higher level of Sh 957, ranging from Sh 859 foracademic students to Sh 1,051 for commercial students.
One-half of those who did obtain wage employment found publicsector clerical jobs. ln general, it is not possible to observe any corre-spondence between bias and job type. For instance, commerce studentsare no more likely to be working in clerical jobs than are academic- oragriculture-bias students. Thus, graduates from the academic, agricultural,and commercial streams show no differences in their pattern of employment.Technical stream graduates, however, obtain employment more in linewith their specialization.
The Colombian Class of 1978 Three Years Later
Given the long, inherent gestation period associated with longitudinalstudies, it was felt that the project could yield some early indications onthe labor market destination and on performance of secondary schoolgraduates by introducing a pseudopanel component to it. After the selectionof the sample of schools and students for the 1981 cohort, addresses wereobtained from the same school of the graduates of the 1978 class. A targetsample of 2,000 such graduates was randomly selected from the schoolrecords for the administration of a special questionnaire. This questionnaireraised retrospective information on the student's further education andoccupational record between 1978 and the fall of 1981, when the interviewstook place. The questionnaires were completed by personal interview atthe house of each selected graduate. This data set was used to test thesame hypotheses related to diversification as with the 1981 cohort, exceptof course those related to achievement because it was not feasible toadminister cognitive tests to the 1978 cohort.7
It was found that INEMs draw students from the lower socioeconomicgroups. This finding is similar to the one obtained using data from the
For a more comprehensive analNsis of the 1978 cohort, see George Psacharopoulos andAntonio Zabalza, The Destination and Early Career Performance of Secondarv School Graduates in Colombia:Finding.s from the 1978 Cohort, Staff Working Paper no. 653 (Washington, D.C.: World Bank, 1984).
518 November 1985

TABLE 14EXPECTED MONTHI.Y EARNINGS AT THREE POINTS IN TIME AND 1982 ACTUAI. EARNINGS BY SECTOR OF EMPLOYMENT:
TANZANIA, 1981 COHORT (Sh/Month)
Expected Earnings Actual Earnings
Without With With Public Private Self-Employed AllForm IV Form IV Post-Form IV Sector Sector Sectors
StudiesForm IV Bias (1) (2) (3) (4) (5) (6) (7)
Agricultural 755 830 1,325 772 776 1,676 1,100Technical 773 844 1,247 702 580 1,560 892Commercia! 754 852 1,356 697 820 1,252 932
Academic 792 883 1,252 746 787 1,532 1,065
Average 766 852 1,307 716 777 1,504 1,013
NO

PSACHAROPOULOS
1981 cohort. Graduation from an INEM and an academic subject arestrongly associated with the propensity to study after secondary school.Also, those who studied agriculture in INEMs had a much higher chanceof continuing their studies than entering the labor market immediatelyafter secondary school. Those coming from INEM schools were less likelyto participate in the labor force or hold a job 3 years after graduation.Standardization for other factors influencing the employment probabilityaccentuated the INEM disadvantage in producing employable graduates.
Of the entire cohort, 18 percent was looking for ajob in 1981. However,most of those looking for ajob either already held ajob or were studying.Excluding such cases, the overall unemployment rate among the cohortin 1981 was 6 percent, with a negligible overall difference between INEMand control schools. But the unemployment rate was especially pronouncedamong control agricultural graduates (17.3 percent). Control industrialgraduates were the least likely to be searching for a job in 1981 (1.9percent).
The 1978 graduates spent 14 weeks on average to get their first job.Those coming from INEM schools had an advantage of 1 week over thecontrol group in getting a job. However, school type and subject werestatistically insignificant in explaining job search duration. In contrast,job seekers had a reservation wage much higher than their classmateswho were already employed.
Testing the Causal Links between School Type, Cognitive Skills, and EarningsA path model was fitted to those working full-time 1 year after grad-
uation in Colombia. Father's education and verbal aptitude were treatedas prior factors to school type (INEM vs. control), academic achievement,and earnings 1 year after graduation from secondary school. Figure 1gives estimates of the model using academic achievement as an intermediatevariable. The model is fitted to all graduates with earnings in 1982, sinceall were exposed to the academic subject. No one factor was shown tohave a significant direct effect on earnings, including achievement. Theschool-type-to-earnings link reveals no advantage of INEM over controlschools in this context. This simply repeats our earlier finding that INEMversus control earnings differences are slight. When industrial achievementis substituted for academic achievement, achievement marginally causeshigher earnings (i.e., a standardized path coefficient of .078, which isstatistically significant at the 10 percent level). Substituting other testscores in commercial, social services, and agricultural subjects shows noeffects.
We alo examined the links between father's education, student ability(a composite of verbal and nonverbal scores), school type (i.e., diversifiedvs. control), subject achievement score, and earnings 1 year after graduationfrom form IV in Tanzania. Figure 2 presents the results of the path
520 November 1985

CURRICULUM DIVERSIFICATION
- ~ ~ ~ ~ ~ - A \054
Fmll/ \
rAcndemc
-Ach:evementAbRlly 404
FIG. 1.-Path model estimation (Colombia); R = .007, N = 510, *-statistically significantpath at .10 level.
model using the agricultural score as the intermediate achiev2ment variable.The achievement score was not found to have a significant effect onearnings; neither did school type. When other tests were substituted intothe achievement variable in place of the agricultural score, neither technical,commerce, mathematics, nor English achievement played any significant
I \
-~ 09
FIG. 2.-Path model estimation (Tanzania); R' .015, N =302, * = statistically significantpath.
Comparative Education Review 521

PSACHAROPOULOS
TABLE 15APPROXIMATE SOCIAL RATES OF RETURN TO INVESTMENT IN SECONDARY
EDUCATION BY SUBJECT AND SCHOOL TYPE: COLOMBIA, 1978 COHORT (%)
Subject INEM Control
Agricultural 9.1 1 7.2 1Commercial 8.4 9.3Social services 7.2 8.8 7.8.3Industrial 9.2 9.9Academic 7.7 9.3
NOTE.-Based on earnings adjusted for ability and socioeconomic factors.
role in influencing earnings. Thus the agricultural, technical, or commercialbiases have no effect on earnings different from the academic.The Returns to Investment in Diversified Curricula
Regression-adjusted 1981 earnings differentials were used to estimaterates of return to investment in various curricula. The fact that in thecase of Colombia we are dealing with a 3-year-old cohort allows us toapproximate a more valid "flat equivalent" earnings differential at age 22and hence use the "shortcut" rate-of-return ,iethod.8 Abstracting fromthe particular vocational specialization, INEM schools appear to haveslightly higher returns (see table 15). But the academic subject in controlschools appears to be associated with an even higher rate of return. Giventhe nature of the earnings and cost data and the simplifying assumptionsof the shortcut formula, the differences in the rates of return betweenINEM and control schools cannot be regarded as significant. Althoughsome tracks appear to have higher profitability than others, the differencesare not wide enough to conclude that the introduction of prevocationaltracks results in secondary schooling being more economically efficient.
The data set for Tanzania is not appropriate for a social rate-of-returncalculation. This is true for at least three reasons: (a) only a very smallfraction of the 1981 cohort was in employment in 1982; (b) most of thosewho are employed work in the noncompetitive sector of the economy,hence their earnings do not necessarily reflect the marginal product oflabor; and (c) the relative earnings refer too early in the career of thegraduate to approximate the flat lifetime equivalent earnings differentialassumed by the shortcut method. Subject to the qualifications above,regression-adjusted earnings were used to calculate indicative social ratesof return to investment in the four curriculum biases-if nothing else,in order to summarize the cost and benefit differentials associated withthem.
8 See George Psacharopoulos, "Returns to Education: An Updated International Comparison,"Comparative Education 17, no. 3 (1981): 321-41.
522 November 1985

CURRICULUM DIVERSIFICATION
Table 16 presents the estimated "rates of return," which in fact highlightthe interplay of costs and benefits differences among the four curricula.Thus the academic (control) bias exhibits the highest rate of return (6.3percent) and the technical bias, the least (1.7 percent). Of course, theusefulness of this calculation lies more in the relative comparison amongbiases than in the absolute level of the returns.
Discussion
This study has been concerned with whether the introduction of di-versified curricula into secondary schools has resulted in any differencesbetween those groups of students who enrolled in diversified schoolsoffering prevocational subjects and those who concentrated solely onacademic programs on a number of "outcomes" such as equity, highercognitive achievement, or better labor market performance.
It is always difficult, if not dangerous, to derive firm policy implicationson the basis of the results of a single study in two countries using youngcohorts of graduates. Ideally, one might have to repeat this study in severalother countries and also wait several years (decades) until the now-youngcohorts of graduates reach their full earning capacity. On the other hand,decisions are made daily on how to shape a secondary educational systemand on what types of curriculum to provide. It would be of little use totell the policymaker to wait longer, especially when many policy decisionstoday are based on intuition rather than on facts.
Although limited in the number of countries and years of graduatefollow-up, this study has added a few factual pieces of information onthe evaluation of diversified secondary school curricula. Below is a seriesof considerations that the policymaker could confidently take into accountwhen designing a secondary school system in developing countries.
a) Diversified curricula are difficult to implement. Development of the newinstructional material, the provision of teachers with new qualifications,and the supply of associated laboratories and hardware can cause logistical
TABLE 16INDICATIVE SOCIAL RATES OF RETURN TOINVESTrMENT IN SECONDARY EDUCATION:
TANZANIA, 1981 COHORT (7C)
Curriculum Bias Rate of Return
Agricultural 5.4 1TI echnical 1.7 3.4Commercial 3.2Academic (control) 6.3
NOTE.-Returns based on mean earnings adjustedfor ability and other socioeconomic factors.
Comparative Education Review 523
PSACHAROPOULOS
problems and cause the reform to fail in the beginning. Unless a countryhas the necessary infrastructure to implement thoroughly a diversifiedcurriculum, the reform may not reach the full system (as in the case ofTanzania). To put it differently, curriculum diversification does not meanonly the supply of new buildings; it must be accompanied by a series ofsoftware components that may well prove to be a bottleneck in the im-plementation of the reform.
b) Curriculum diversification is expensive, in the sense that the unit costof keeping a student in a diversified school is often higher than that fora conventional (academic) school. The main reason for the higher unitcost of a diversified school is the specialized equipment used. Therefore,the policymaker should weigh this cost against potential extra benefitsthat such schools confer to the recipients of the new kind of educationor to society at large. Of course, such benefits can be monetary or non-monetary.
c) This study provides no evidence that monetary benefits are greater thanthose of conventional schools. All forms of secondary education increase theproductivity of the worker, but diversified schools have not yet proventhemselves better in this respect than conventional schools.
d) Unsupported by this study'sfindings are some of the main policy rationalesput forward to institute such schools, such as "to improve the fit betweenthe school and the world of work" or "to stop the one-way street fromschool to the university." Graduates from both types of schools spendroughly the same amount of time finding employment, and in some casesgraduates of diversified schools are more prone to continue their studiesat the university.
e) Neither has the prevocational argument of "preparation for further study"been borne out by the data. Specifically, those who have studied a particularcourse in secondary school (e.g., agriculture or technical trades) oftenstudy a completely different subject later at the university (e.g., liberalarts).
Of course, on the basis of such results one should hot halt the furtherdevelopment of diversified curricula: each case should be considered onits own merit and the expectations for their effects should be more realistic. 9
But perhaps there is one clear situation where diversified schools shouldnot be offered as part of a country's development effort. This is when thecountry's secondary school system is very selective and only, say, 20 percentor less of the eligible population age group attends secondary education.In this case, the expansion of any type of secondary schooling will belegitimately seen by students and their families as opening the door to
9 Our conclusions are consistent with 'Foster's thesis"; see P. Foster, 'The Vocational SchoolFallacy in Development Planning," in Education and Economic Development, ed. C. A. Anderson andMaryJ. Bowman (Chicago: Aldine, 1965).
524 November 1985

CURRICULUM DIVERSIFICATION
upward mobility, including university entrance or a start in a nonmanualoccupation (such as teaching). But such expansion could have been achievedby less costly means and also would not predicate the outcome of thereform.
The paradox we seem to be left with is that the lower the overall levelof a country's development, the weaker the case for introducing a diversifiedcurriculum. The more developed the country, the more it may be ableto afford diversification. This conclusion is exactly the opposite of whatnow happens in practice-that is, the poorer the country, the greater thepressure to make the secondary school curriculum "morerelevant to the world of work."
Comparative Education Review 525