geosynthetic subsurface drainage systems for...
TRANSCRIPT

GeosyntheticGeosynthetic Subsurface SubsurfaceDrainage Systems ForDrainage Systems For
PavementsPavements
Foundation PerformanceFoundation PerformanceAssociationAssociation
January 10, 2007January 10, 2007


Subbase
Compacted Subgrade
Surface CourseBinder CourseBase Course
Natural Subgrade
Seal Coat Tack Coat
CONVENTIONAL FLEXIBLEPAVEMENTS
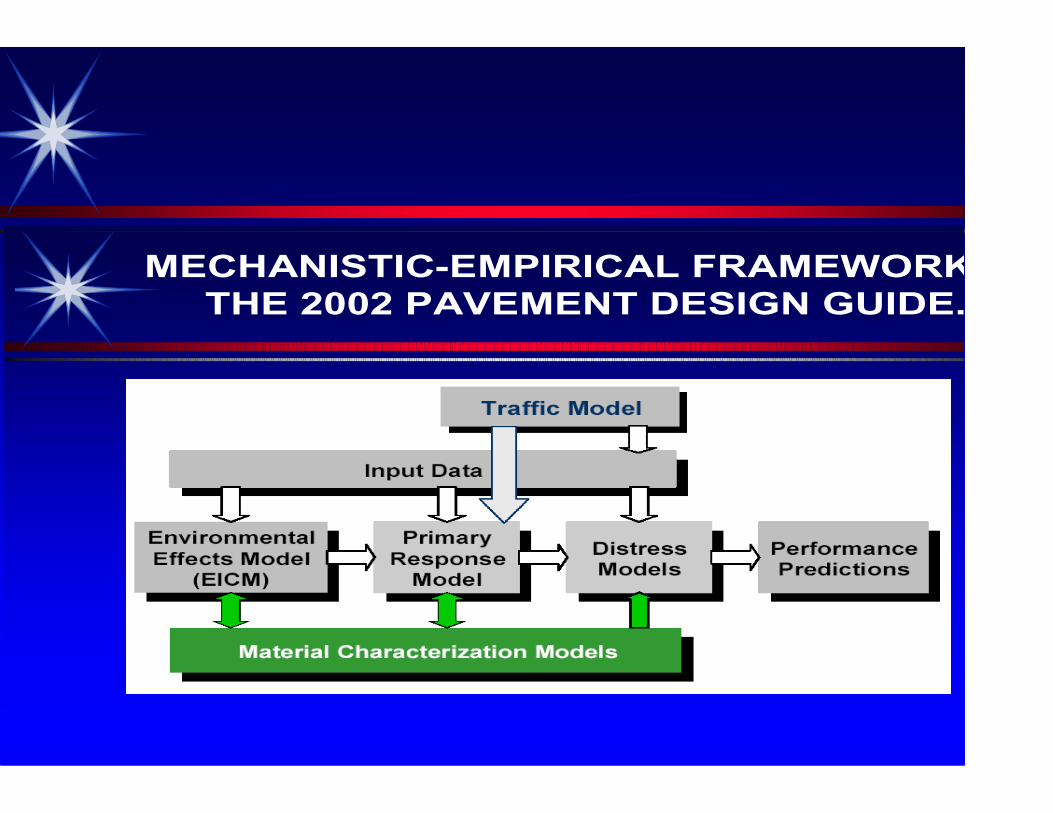
MECHANISTIC-EMPIRICAL FRAMEWORK IN
THE 2002 PAVEMENT DESIGN GUIDE.
Related References
FHWA, 1992, Demonstration project 87: “Drainable pavement systems”, ParticipantNotebook, FHWA-SA-92-008.
US Army Corps of Engineers, 1992, “Engineering and design drainage layers forpavements”, Engineer Technical Letter, 1110-3-435, Department of Army.
Cedergren, 1987, “Drainage of highway and airfield pavements”, R. E. Kriegerpublishing Co, FL
Christopher and McGuffey, 1997, NCHRP Synthesis of highway practice 239,“Pavement subsurface drainage systems”, Transportation Research Board.
Christopher, Hayden, and Zhao, 1999, “Roadway Base and Subgrade GeocompositeDrainage Layers, “ ASTM STP 1390, American Society for Testing and Materials, June.
Christopher and Zhao, 2001, “Design manual for roadway geocomposite underdrainsystems”, Tenax Corporation.

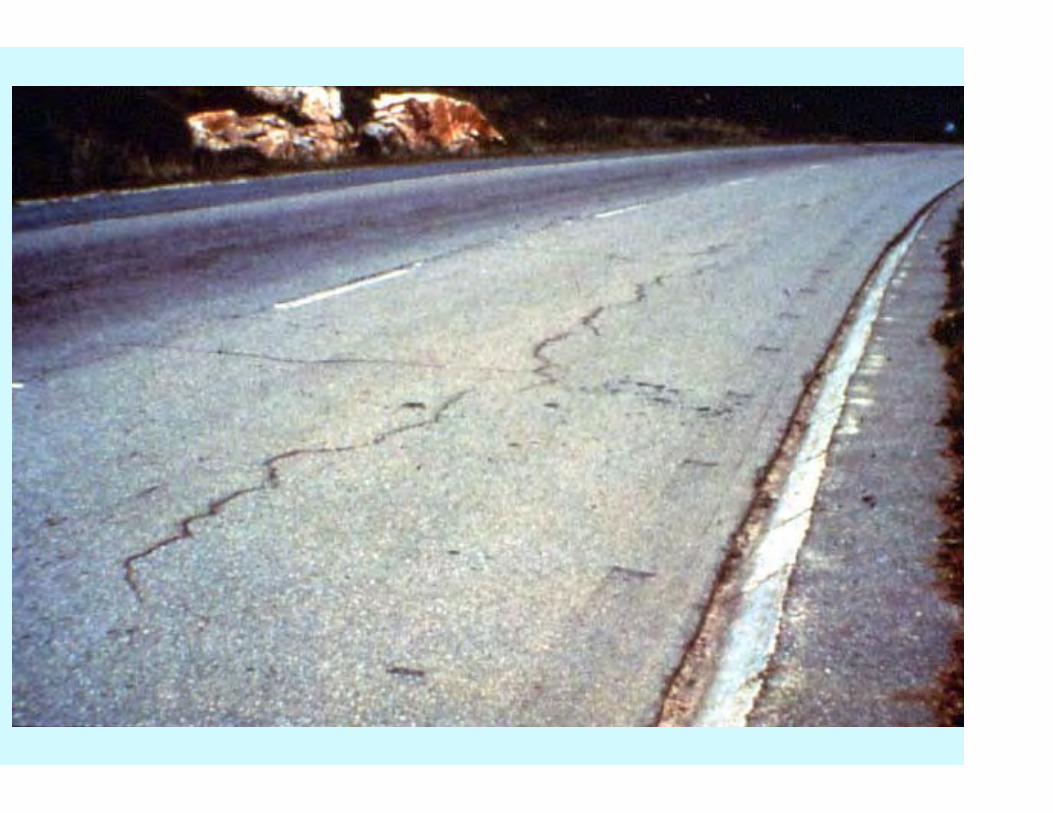
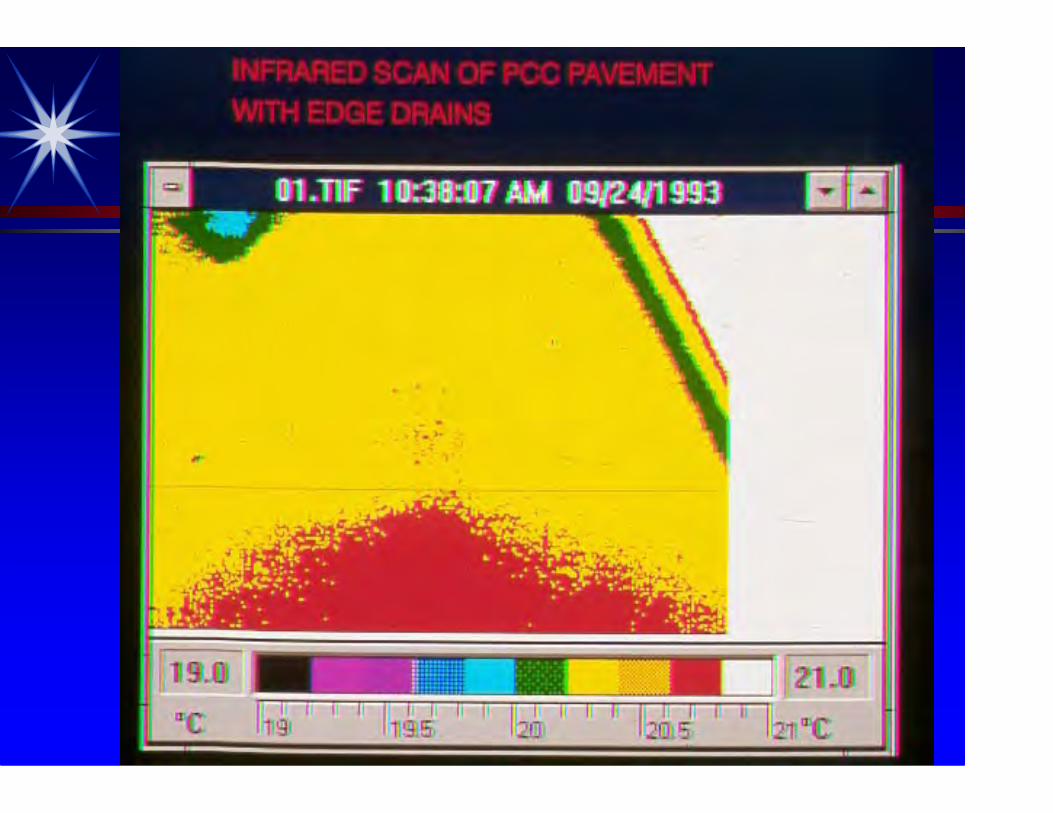
Waterin thePavementStructure
PrimaryCause ofDistress
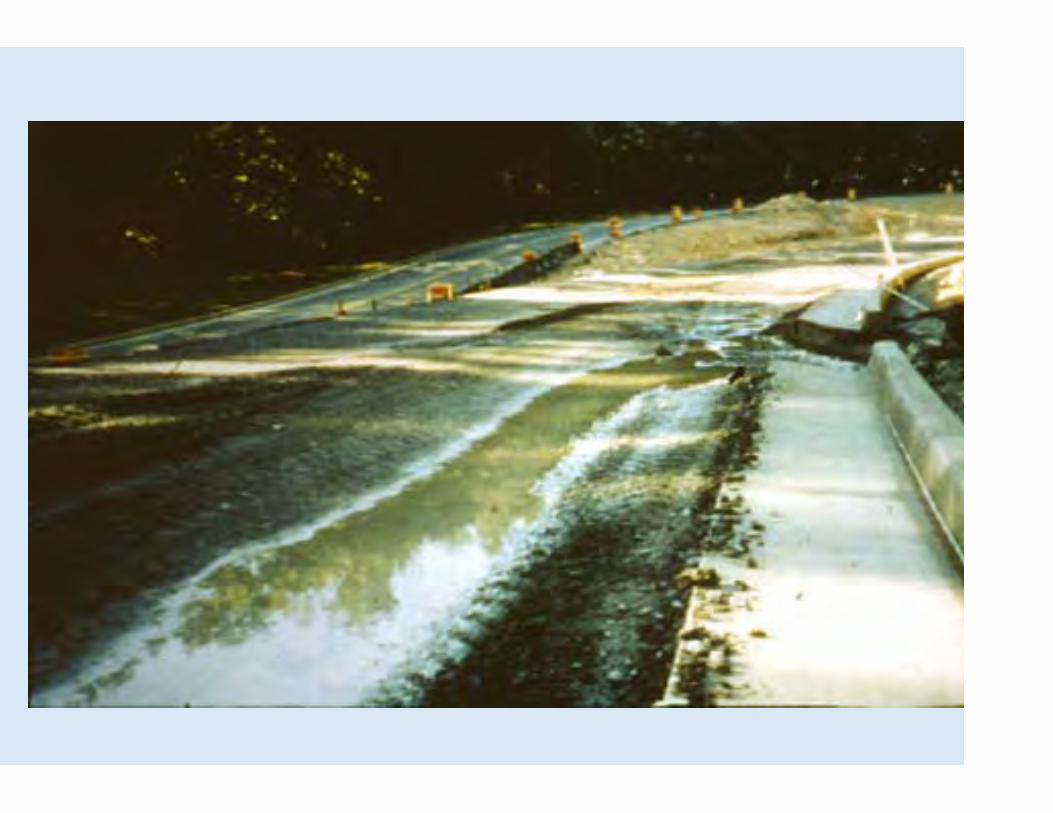
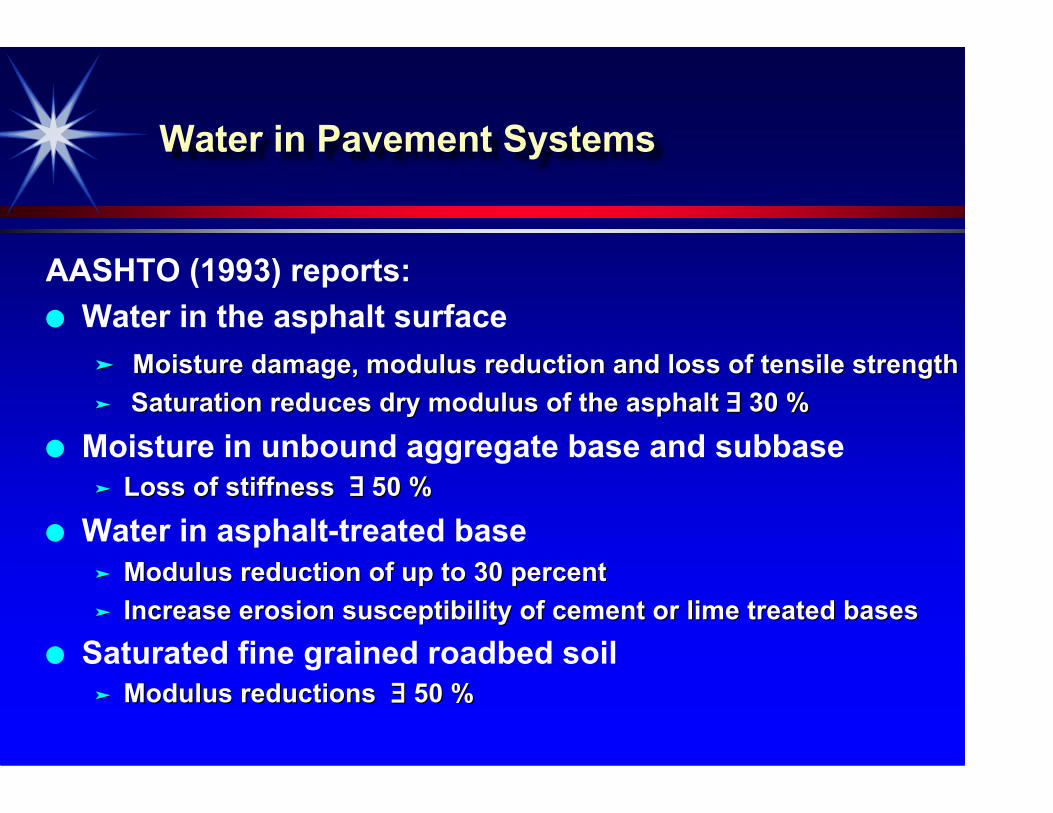
Water in Pavement Systems
AASHTO (1993) reports: Water in the asphalt surface
Moisture damage, modulus reduction and loss of tensile strengthMoisture damage, modulus reduction and loss of tensile strength Saturation reduces dry modulus of the asphalt Saturation reduces dry modulus of the asphalt ∃∃ 30 % 30 %
Moisture in unbound aggregate base and subbase Loss of stiffness Loss of stiffness ∃∃ 50 %50 %
Water in asphalt-treated base Modulus reduction of up to 30 percentModulus reduction of up to 30 percent Increase erosion susceptibility of cement or lime treated basesIncrease erosion susceptibility of cement or lime treated bases
Saturated fine grained roadbed soil Modulus reductions Modulus reductions ∃∃ 50 % 50 %

% of Time Structural Section is Saturated
0 10 20 30 40 50
0
20
40
60
80
100S = Severity Factor
S=5
S=10
S=20
For a pavement section with a moderate severity factor of 10, if 10% of timethe pavement is approaching saturation, the pavement service life could bereduced by half.
Ref. Cedergren, H.R. 1987, Drainage of highway and airfield pavements, Robert E Krieger Publishing Co, FL.
Severity factormeasuresthe relativedamagebetween wetand dry periods
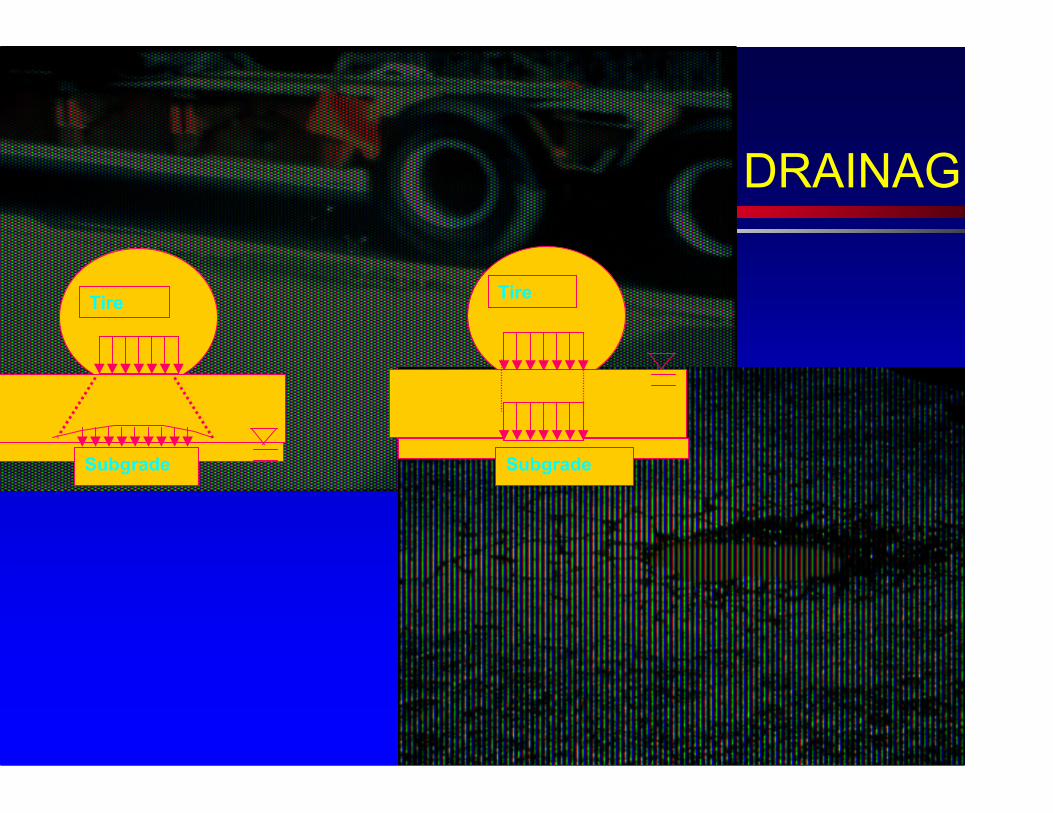
TireTire
Subgrade Subgrade
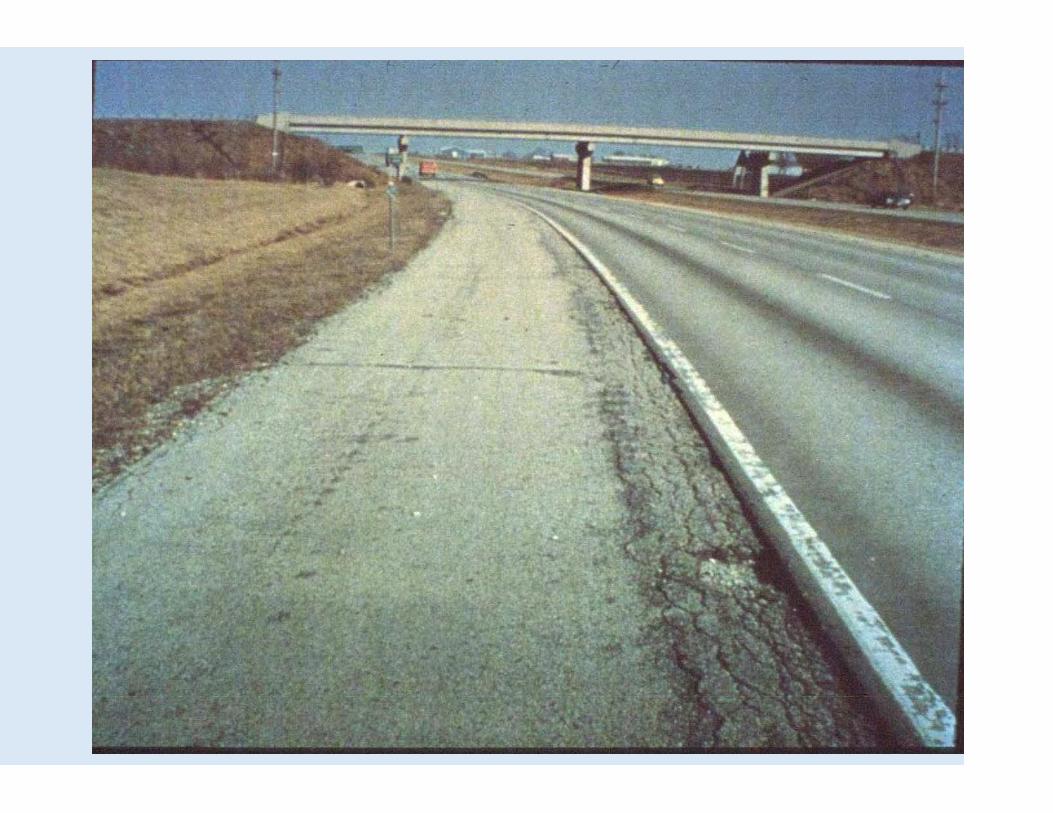
DRAINAGE
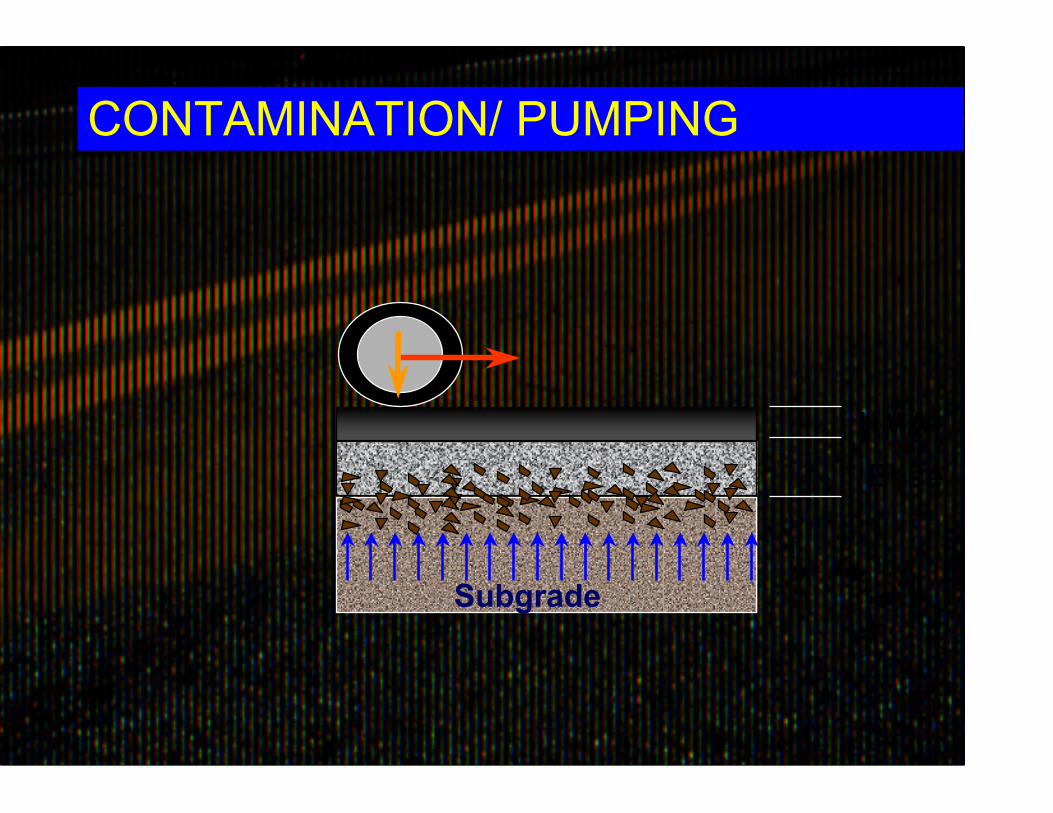
CONTAMINATION/ PUMPING
HMABase
Subgrade

AGGREGATE PENETRATION
HMABase
Subgrade

JOINT DETERIORATION


Water in Pavements Summary
• Stripping in HMA
• Loss of Subgrade Support
• Reduction of Granular LayerStiffness
• Erosion of Cement-Treated BaseLayers
• Reduction in the Pavement ServiceLife If Base Is Saturated forSometime
• Debond between Layers

HOW TO ADDRESS THE PROBLEM?
Pavement geometry (slopes and ditches) Crack sealing Treated Layer Thicker Layers Full Width Subsurface Drainage
0.02 m/m 0.04 m/m
1 : 41 : 6
Subgrade
Treated baseHMA
Aggregate base

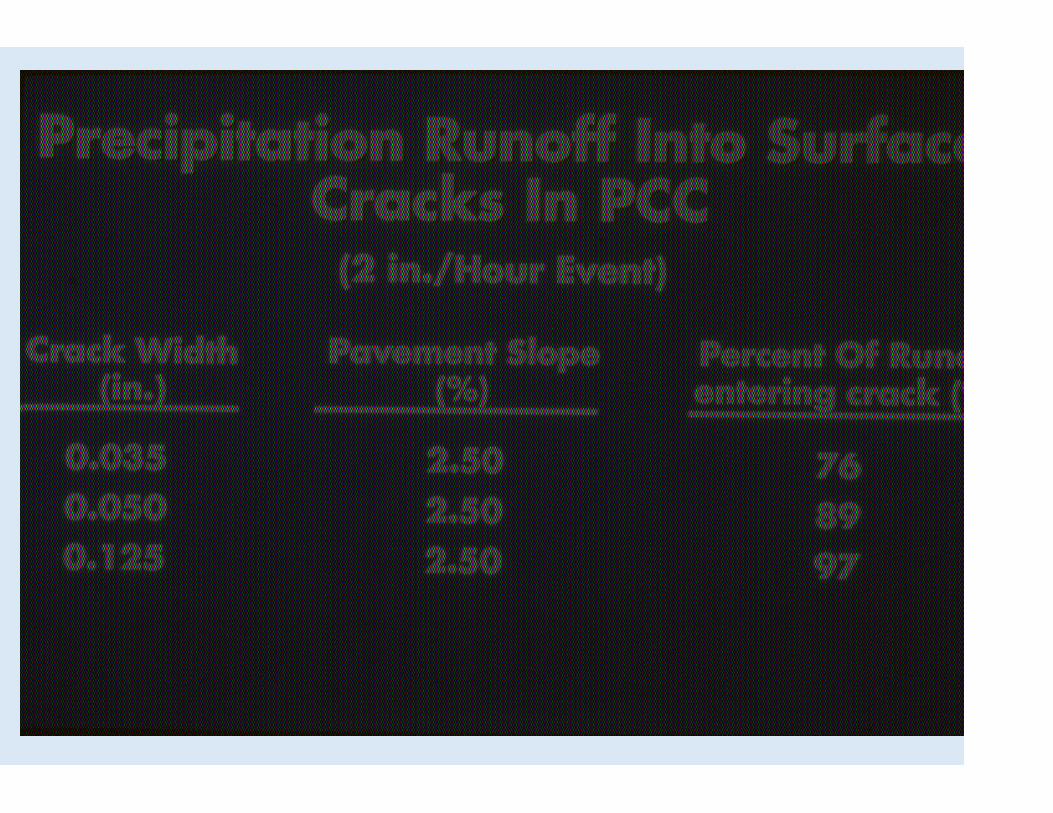


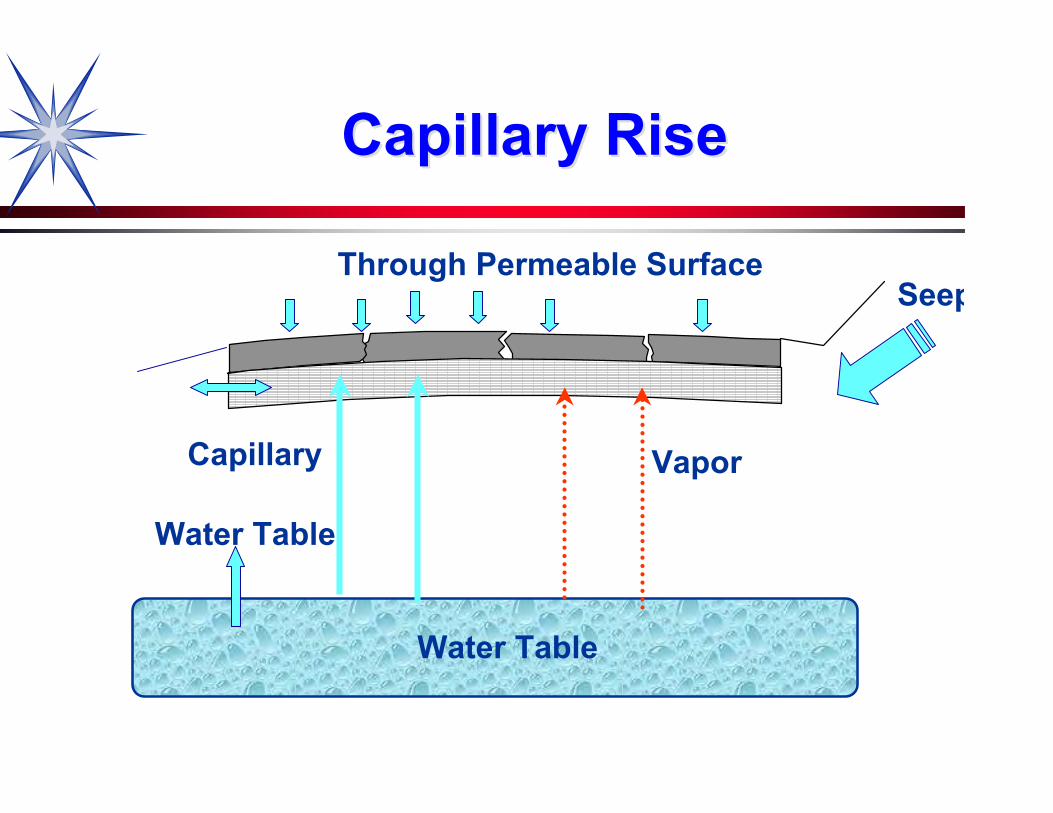
SeepageThrough Permeable Surface
Water Table
Capillary Vapor
Water Table
Capillary RiseCapillary Rise
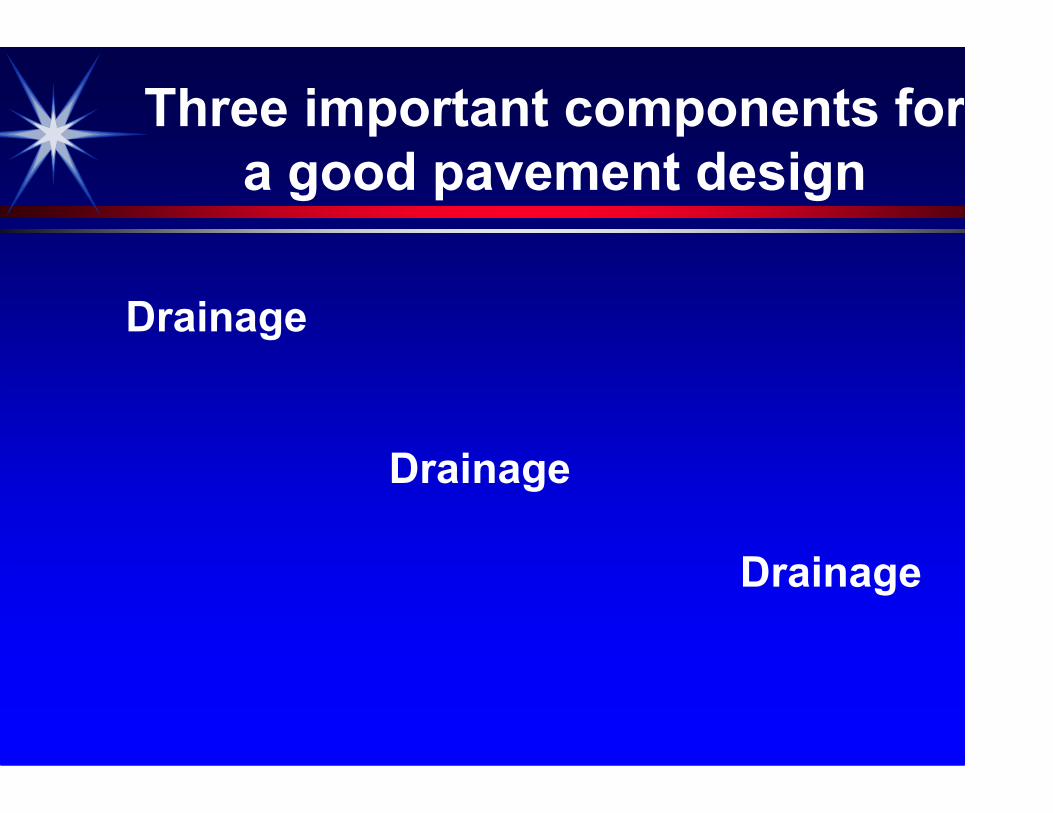
Three important components fora good pavement design
Drainage
Drainage
Drainage

AASHTO Drainage Definitions
Quality of Drainage
Excellent
Good
Fair
Poor
Very Poor
Water Removed Within*
2 Hours
1 Day
1 Week
1 Month
Water will not Drain
AASHTO Guide for Design of Pavement Structures, 1993
*Based on time to drain*Based on time to drain

Design for Drainage(AASHTO, 1993 Design Method)
Structural Number (SN) for a pavement section is:
SN = a1*d1 + a2*d2*m2 + a3*d3*m3
a1 a2 a3 = layer coefficients for AC, BC and Sub base layers
d1, d2, d3 = their thickness
m2, m3 = drainage coefficients for the base and sub base layer
log10W18 = (ZR)(S0) + (9.36)(log10(SN+1) - 0.20 + log10[ΔPSI/(4.2-
1.5)]/[0.40 + (1.094/(SN+1)5.19)] + (2.32)(log10MR) - 8.07
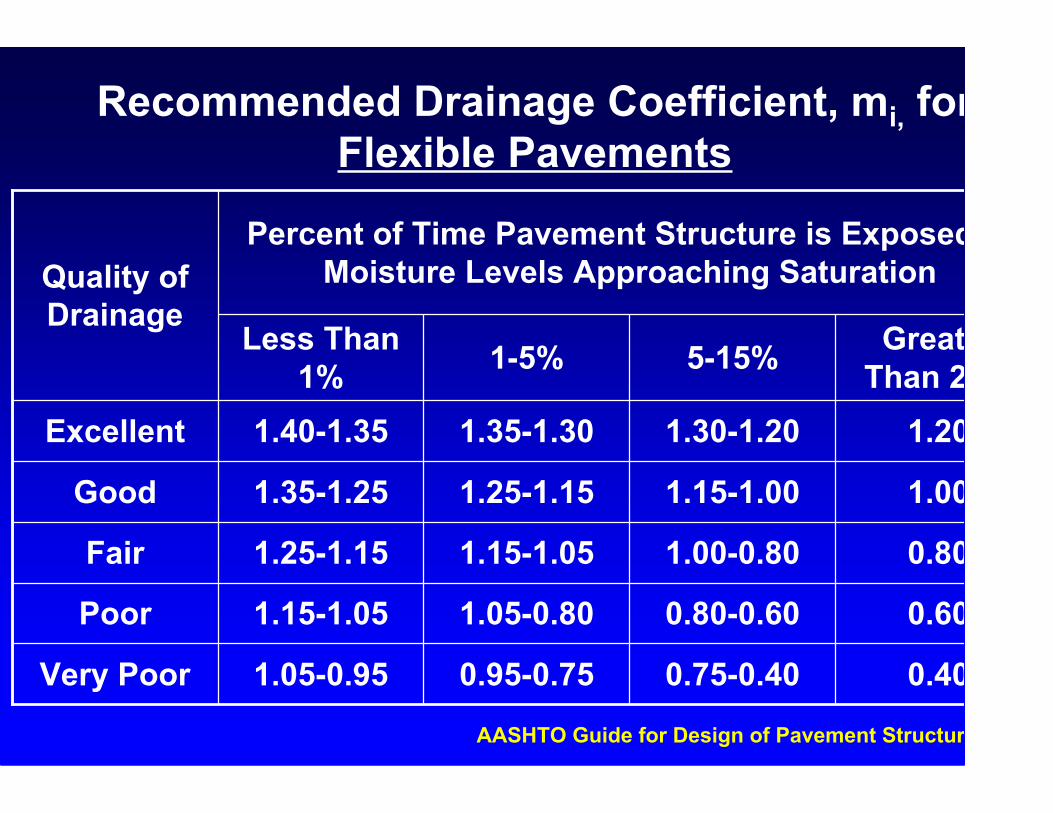
0.400.75-0.400.95-0.751.05-0.95Very Poor
0.600.80-0.601.05-0.801.15-1.05Poor
0.801.00-0.801.15-1.051.25-1.15Fair
1.001.15-1.001.25-1.151.35-1.25Good
1.201.30-1.201.35-1.301.40-1.35Excellent
GreaterThan 25%5-15%1-5%Less Than
1%
Percent of Time Pavement Structure is Exposed toMoisture Levels Approaching SaturationQuality of
Drainage
AASHTO Guide for Design of Pavement Structures, 1993
Recommended Drainage Coefficient, mi, forFlexible Pavements

Time to drain
For two lane road - Lane width = 24 ft, Slope = 0.01
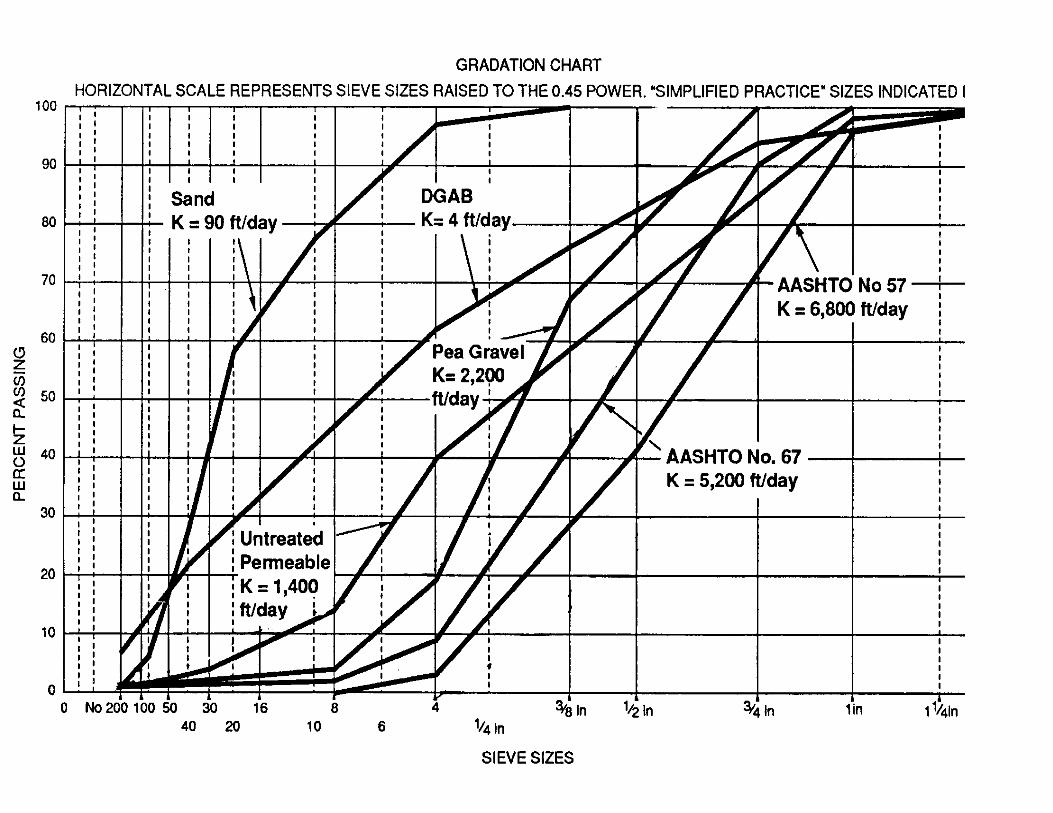
Base k time to drain Quality
OGB 1000 ft/day 2 hrs to drain Excellent
DGAB 1 ft/day 1 week Fair
DGAB w/ fines 0.1 ft/day 1 month Poor
Reality no drains does not drain Very Poor

Pavement Drainage


SUBSURFACE DRAINAGE
OGDL EDGE DRAIN
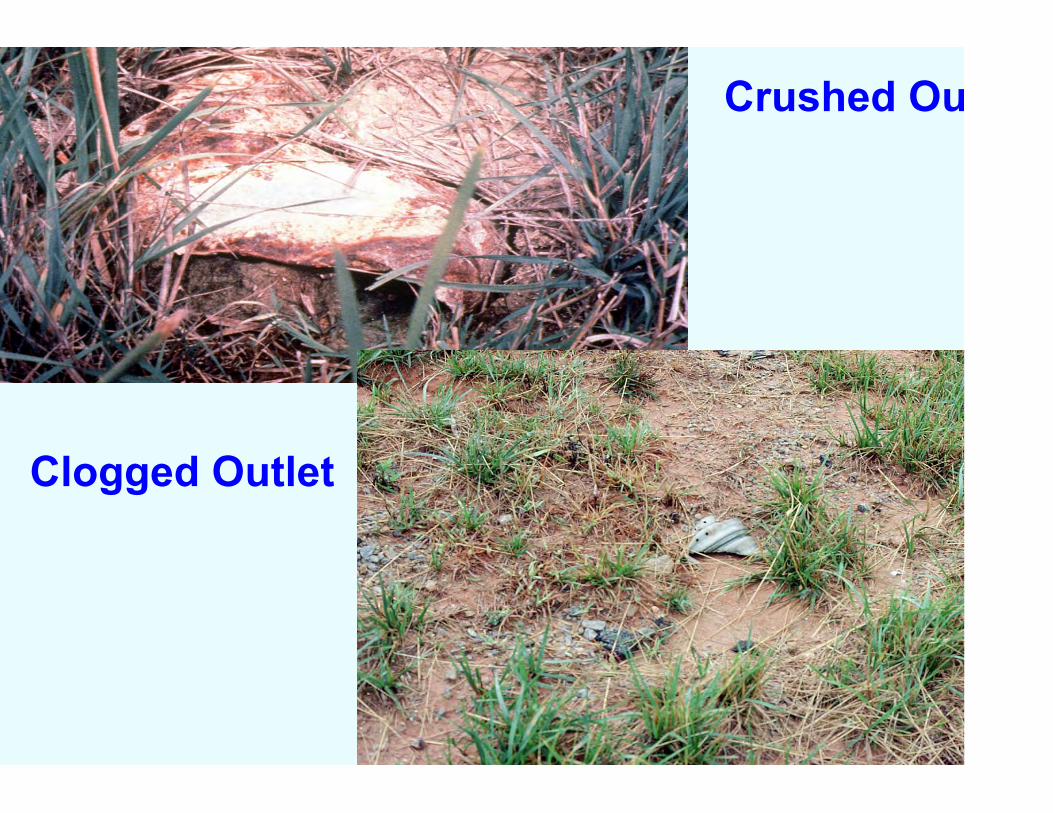
Crushed Outlet
Clogged Outlet


Geocomposite Drainage Layers
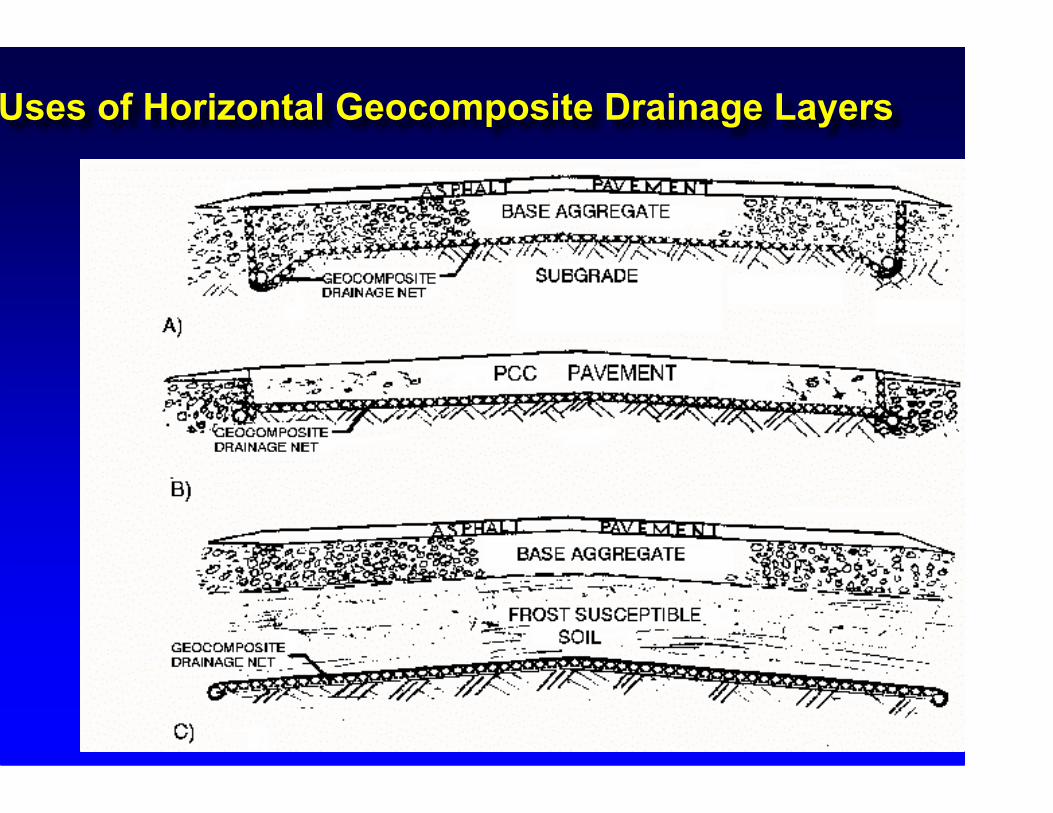
Uses of Horizontal Geocomposite Drainage Layers

Drainage For Rigid Pavements
Improved DesignImproved Design >> Cd Cd
For Flexible Pavements Improved design lifeImproved design life
Geocomposite Drainage Layer Solutions -Replace OGAB

Drainage - Improved Pavement DesignImproved Pavement Design > m or> m or C Cdd
> SN> SN Separation
Improved long term performanceImproved long term performance
Geocomposite Drainage Layer Solutions -Improve Performance of DGAB
Stabilization Improved constructionImproved construction
Reinforcement Improved Support - LCRImproved Support - LCR

Geocomposite Drain Requirements
Sufficient stiffness to support trafficwithout significant deformationunder dynamic loading
Inflow capacity > infiltration fromadjacent layers
Sufficient transmissivity to rapidlydrain the pavement section andprevent saturation of the base
Sufficient air voids within geo-composite to provide a capillarybreak

Drainage Geocomposite -Important Properties
Transmissivity = 4500 ft2/day (0.005 m2/sec) Estimated Discharge: 30 ftEstimated Discharge: 30 ft33/day /ft/day /ft
Creep Resistance under high Loads Long-term Resistance to Compression Stability Traffic Loads = Univ. of Illinois Study Effective Porosity = 0.7 Geotextile Filtration Requirements

Tri-Planar Important Properties (Cont.)
Transmissivity = 4500 ft2/day (0.005 m2/sec):
TransmissivityTransmissivity of 4in-OGDL (k =1000 of 4in-OGDL (k =1000––3000 ft/day) = 300-3000 ft/day) = 300-1000 ft1000 ft33/day/ft/day/ft
OGDL flow rate @2% = 6OGDL flow rate @2% = 6––20 ft20 ft33/day/ft/day/ft
TransmissivityTransmissivity of tri-planar = 1500 ft of tri-planar = 1500 ft33/day/ft @15ksf/day/ft @15ksf(considering an equivalency factor between tri-planar and(considering an equivalency factor between tri-planar andsoil drains)soil drains)
Tri-planar flow rate @2% = 30 ftTri-planar flow rate @2% = 30 ft33/day/ft/day/ft

Tri-Planar Drainage System
Replaces OGDL
Provides ExcellentDrainage Capability
Capillary Break
May Provide StrainEnergy AbsorptionCapabilities
Time-to-Drain Design Assumptions
During a rainfall event water infiltrates intothe permeable base until it is saturated
Excess rainwater runs off to a side ditch
Time required to drain certain amount ofwater from the drainage layer after a rainevent
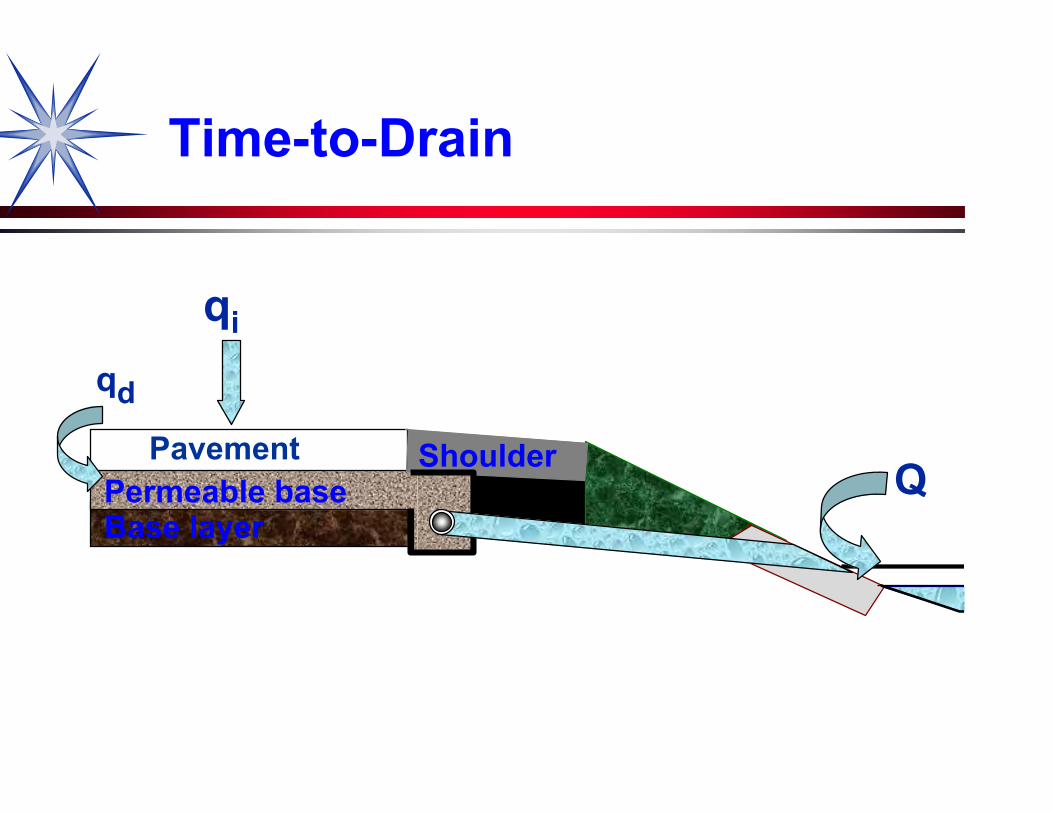
Time-to-Drain
PavementPermeable baseBase layer
Shoulder
qi
qd
Q

AASHTO Drainage Definitions(For Pavements - 50% time to drain)
Quality of Drainage
Excellent
Good
Fair
Poor
Very Poor
Water Removed Within
2 Hours
1 Day
1 Week
1 Month
Water will not Drain
AASHTO Guide for Design of Pavement Structures, 1993
• For Interstate highways: 50% drained in 2 hrs• If heavy traffic, in 1 hr
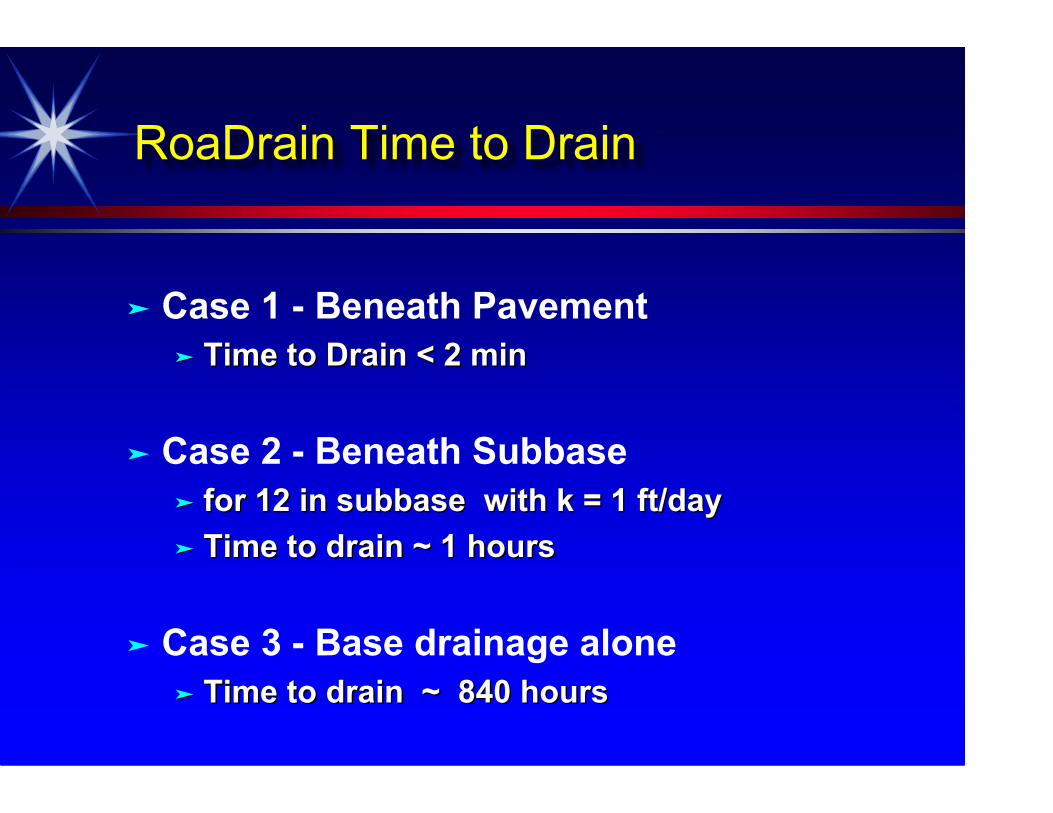
RoaDrain Time to Drain
Case 1 - Beneath Pavement Time to Drain < 2 minTime to Drain < 2 min
Case 2 - Beneath Subbase for 12 in subbase with k = 1 ft/dayfor 12 in subbase with k = 1 ft/day Time to drain ~ 1 hoursTime to drain ~ 1 hours
Case 3 - Base drainage alone Time to drain ~ 840 hoursTime to drain ~ 840 hours
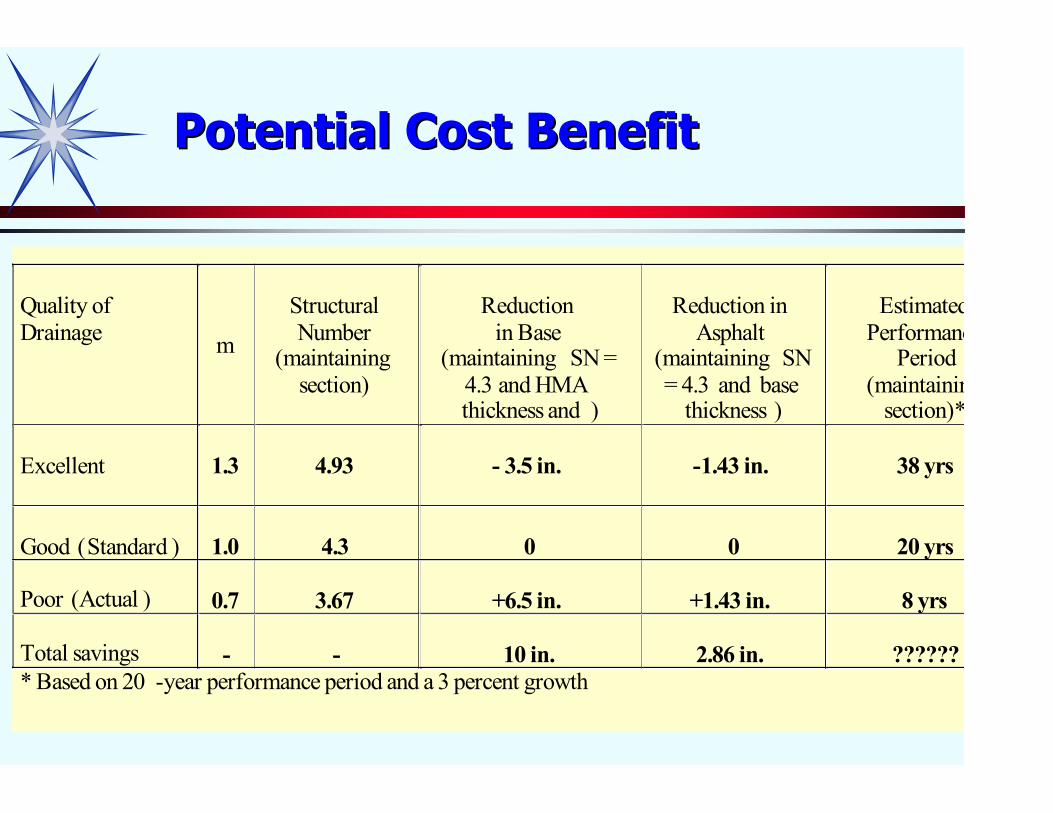
Quality of Drainage
m
Structural Number
(maintaining section)
Reduction
in Base (maintaining SN =
4.3 and HMA thickness and )
Reduction in
Asphalt (maintaining SN = 4.3 and base
thickness )
Estimated
Performance Period
(maintainin g section)*
Excellent
1.3
4.93
- 3.5 in.
-1.43 in.
38 yrs
Good (Standard )
1.0
4.3
0
0
20 yrs
Poor (Actual )
0.7
3.67
+6.5 in.
+1.43 in.
8 yrs
Total savings
-
-
10 in.
2.86 in.
??????
* Based on 20 -year performance period and a 3 percent growth
Potential Cost BenefitPotential Cost Benefit
Some Case Studies

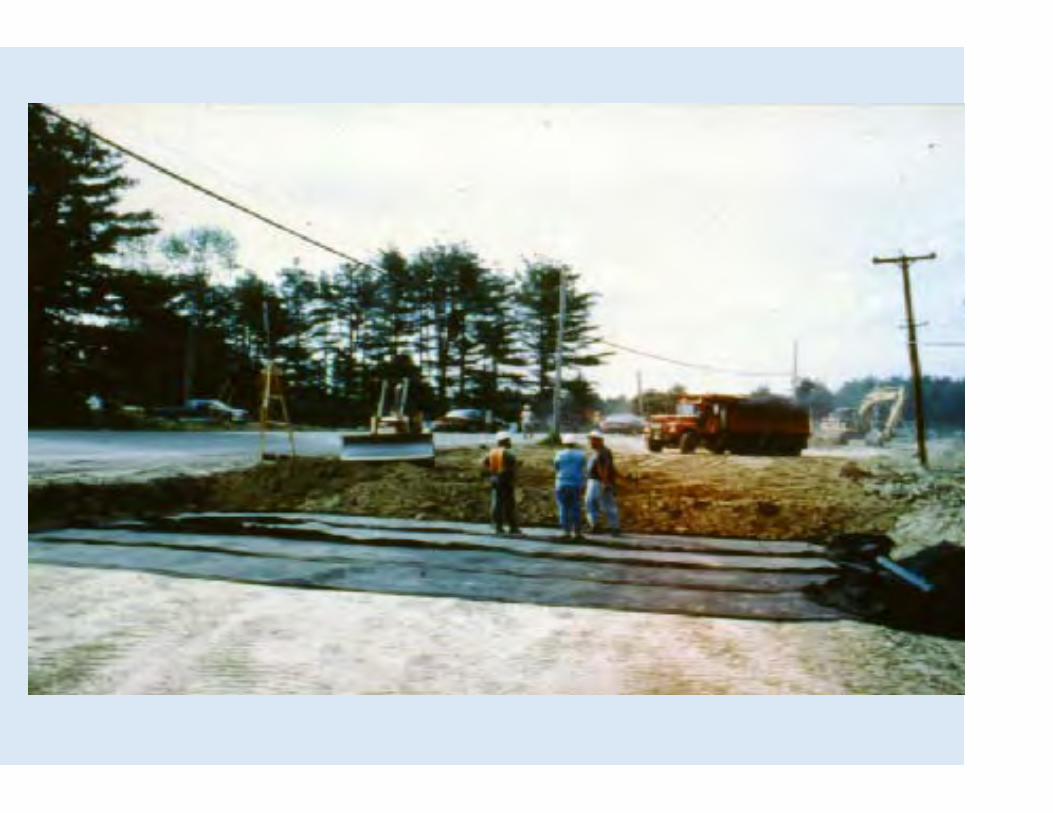
Maine DOT -Maine DOT -Frankfort to Winterport HighwayFrankfort to Winterport Highway

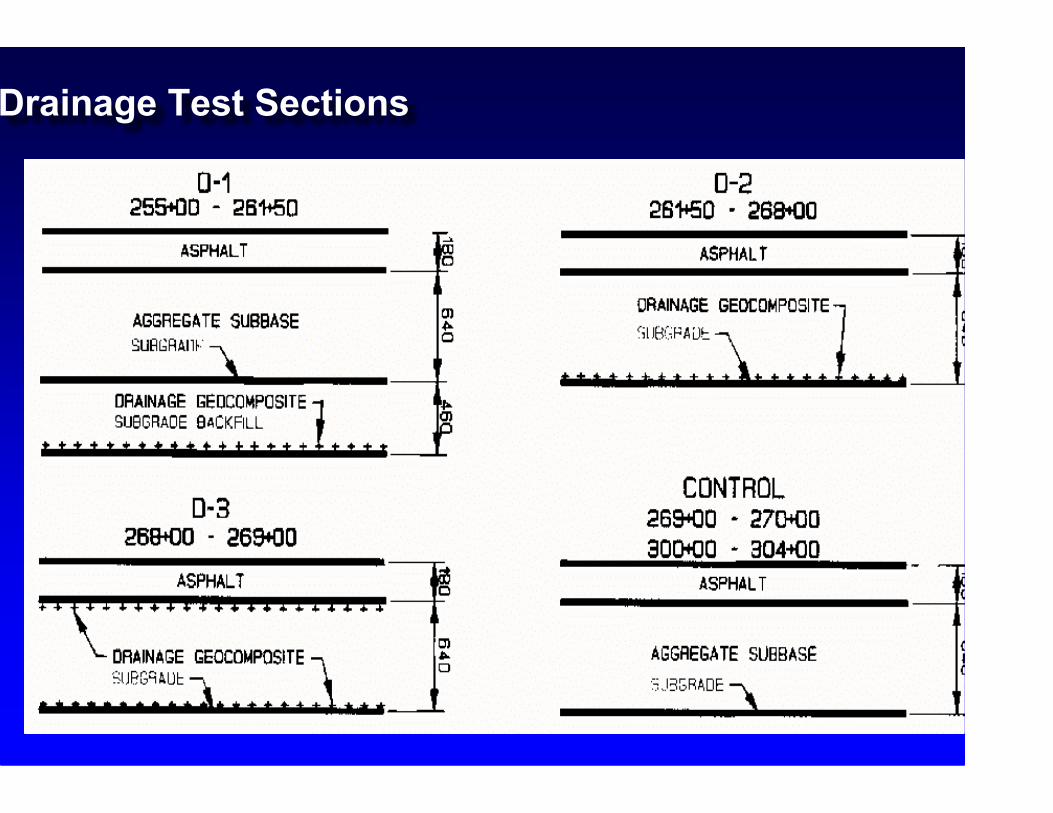
Drainage Test Sections

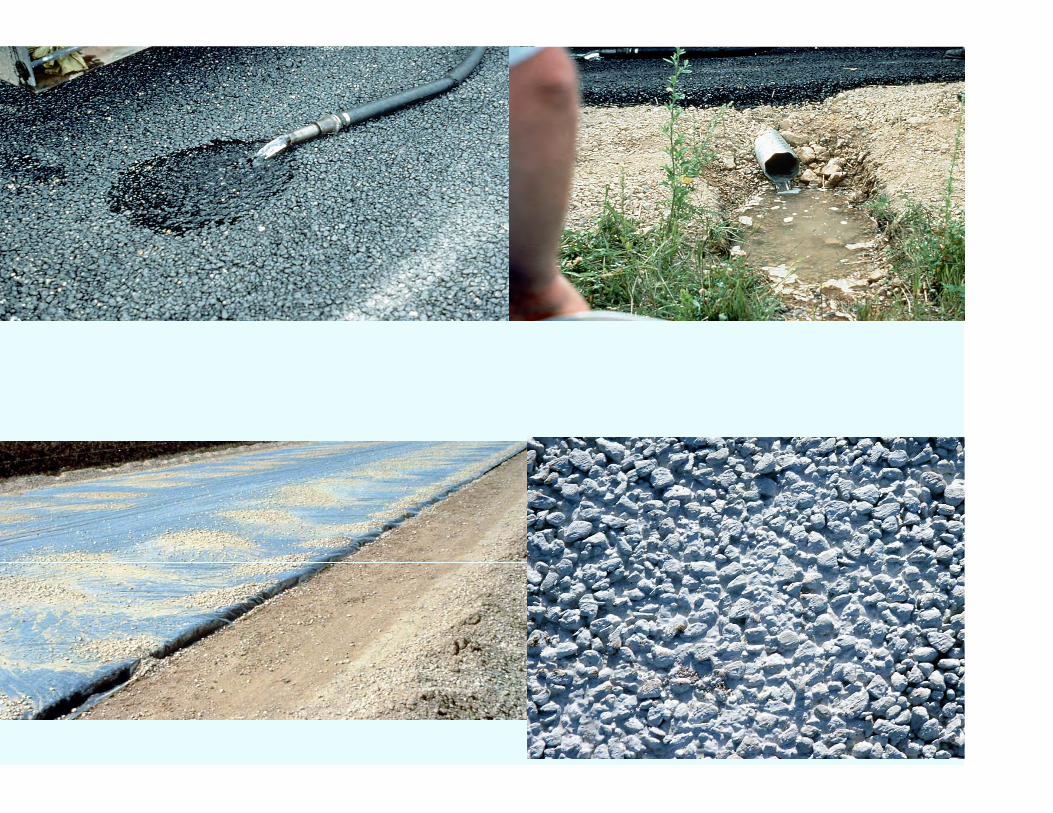
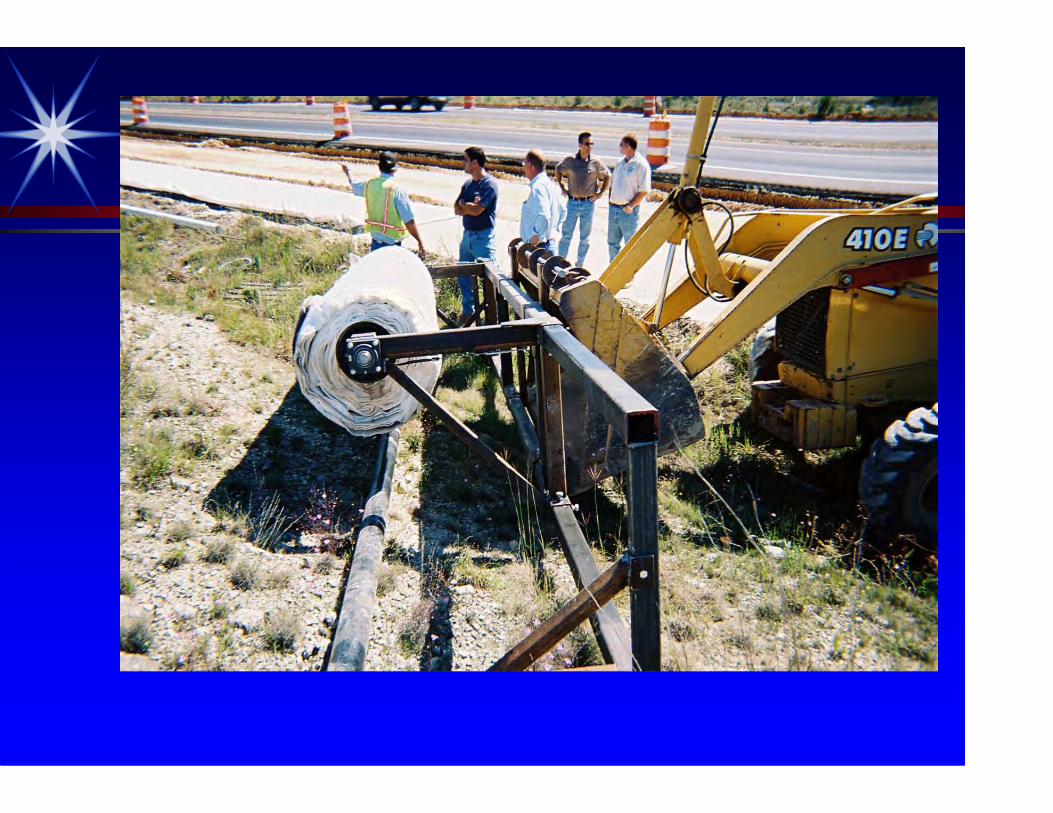
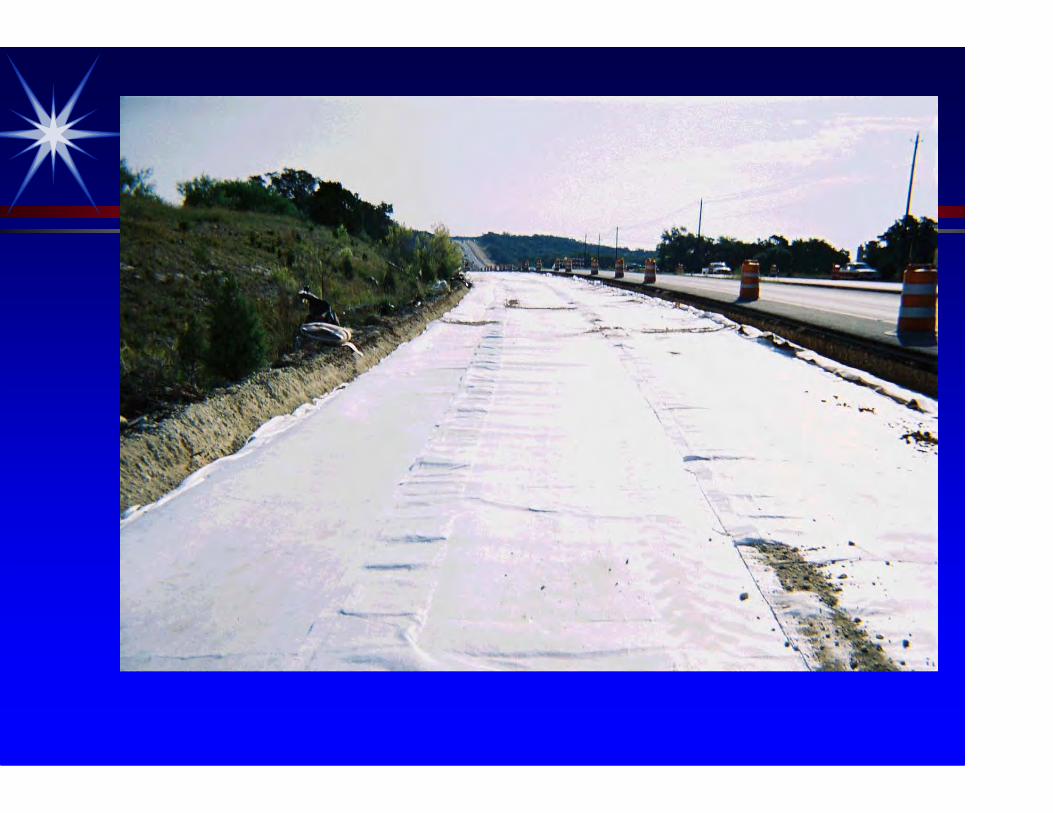
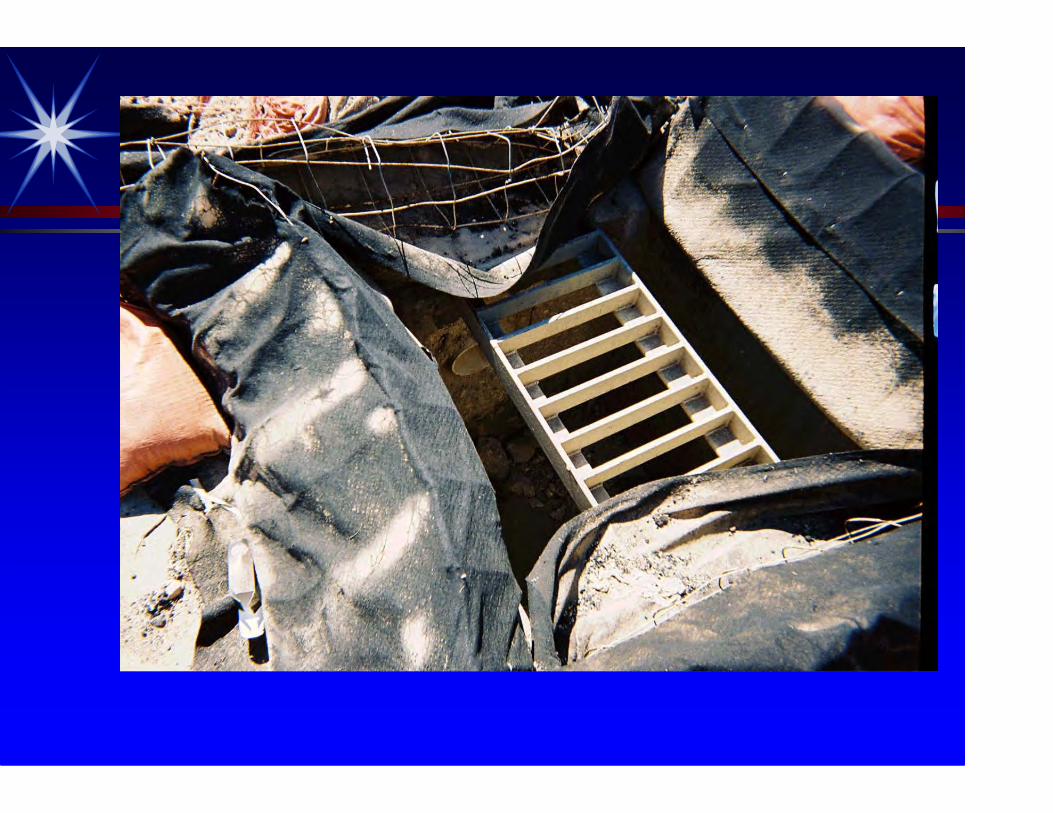
Construction DetailsGeocomposite Placement
Installing theRoadrain
Plastic ties tosecure connectionbetween rolls
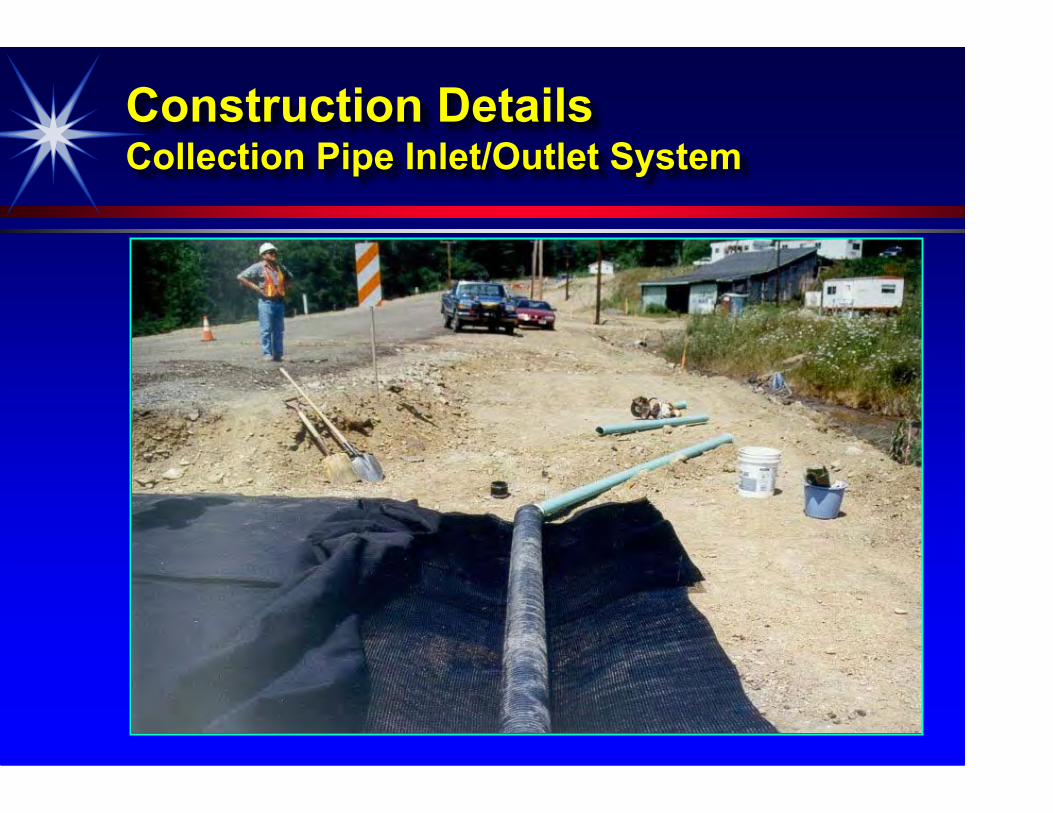
Construction DetailsConstruction DetailsCollection Pipe Inlet/Outlet SystemCollection Pipe Inlet/Outlet System

Underneath HMA
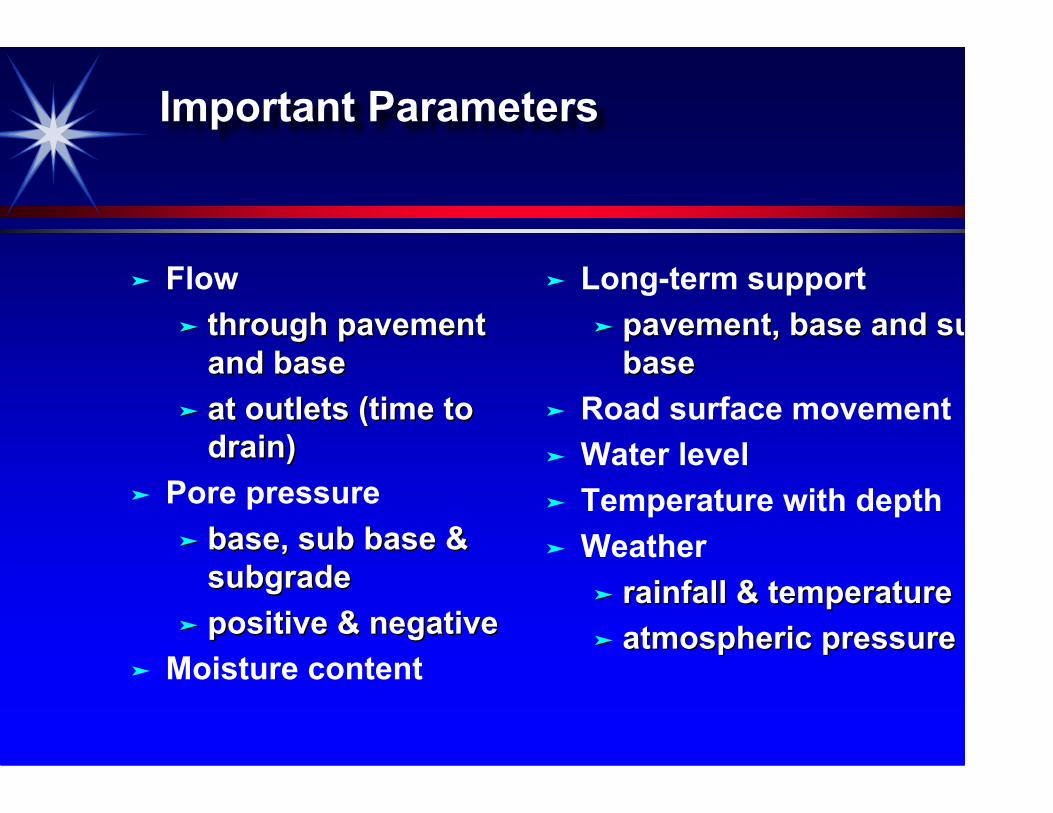
Important Parameters
Flow through pavementthrough pavement
and baseand base at outlets (time toat outlets (time to
drain)drain) Pore pressure
base, sub base &base, sub base &subgradesubgrade
positive & negativepositive & negative Moisture content
Long-term support pavement, base and subpavement, base and sub
basebase Road surface movement Water level Temperature with depth Weather
rainfall & temperaturerainfall & temperature atmospheric pressureatmospheric pressure

Drainage Discharge
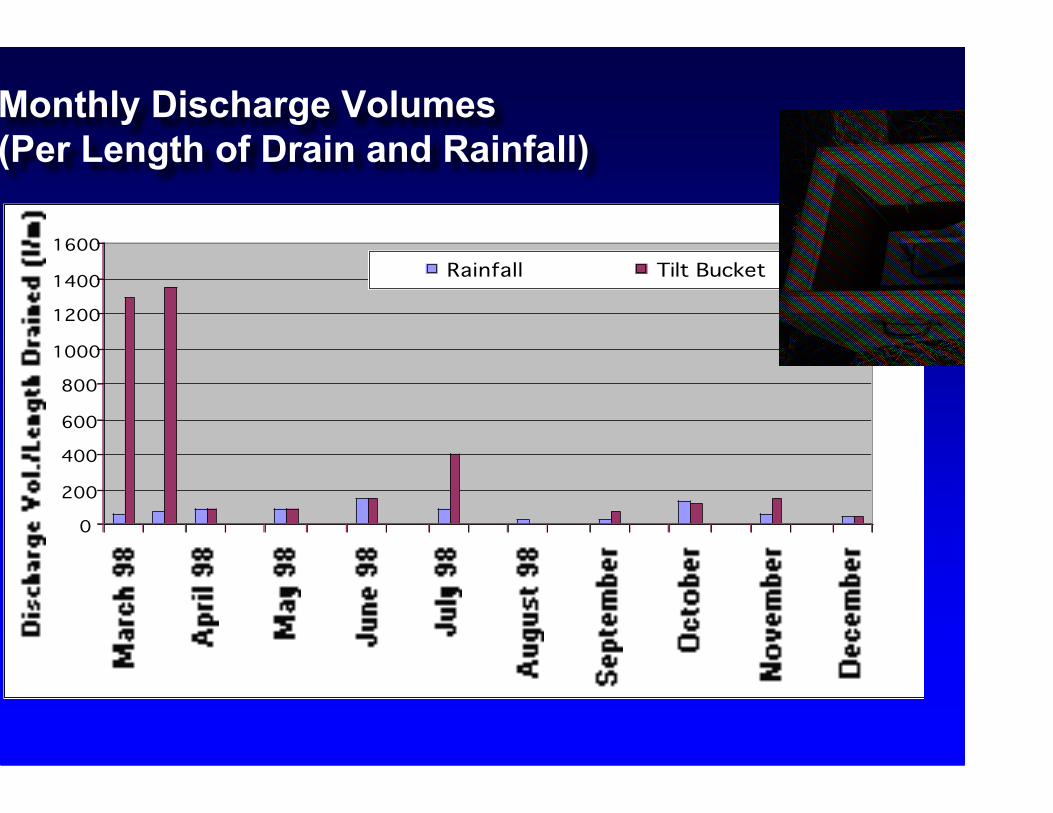
Monthly Discharge Volumes(Per Length of Drain and Rainfall)
0
200
400
600
800
1000
1200
1400
1600Rainfall Tilt Bucket

Falling Weight Deflectometer (FWD) Results (Drainage Sections), Maine DOT
0
1
2
3
4
5
6
7
8
Str
uct
ura
l N
um
ber
,
SN
(in
ch)
D1 D2 D3 F1
(Control)
Test Sections
Original
Jul-98
Jul-99
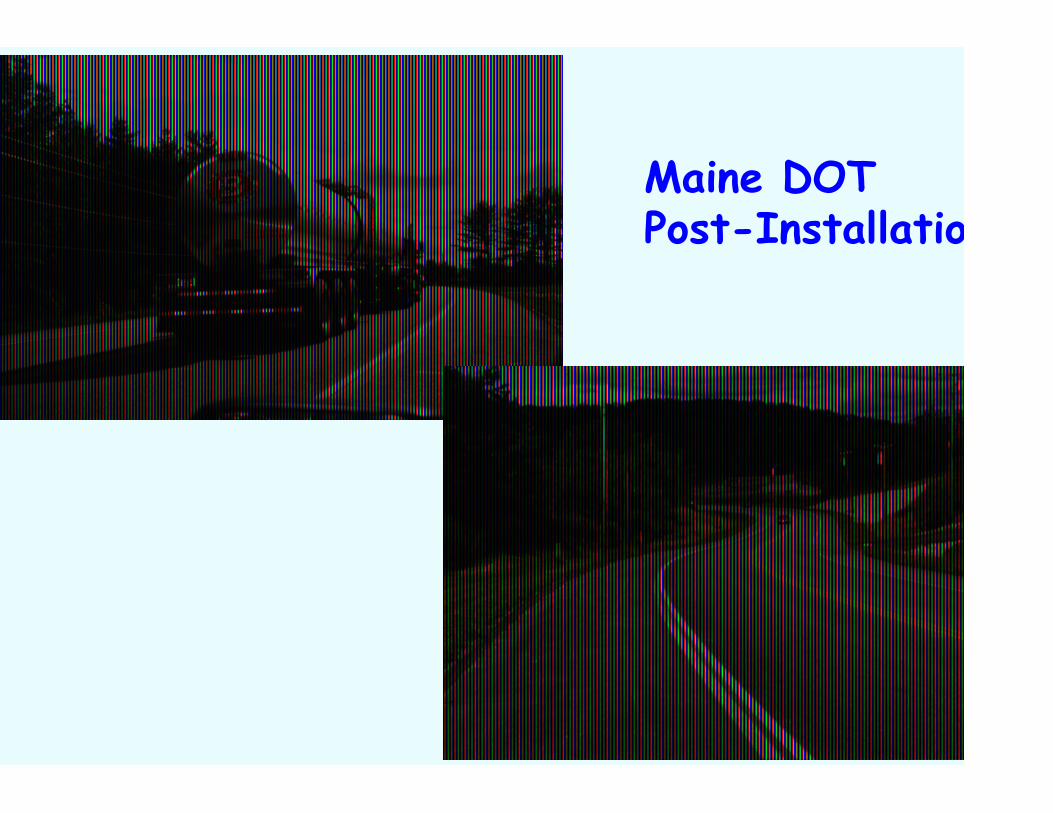
Maine DOTPost-Installation
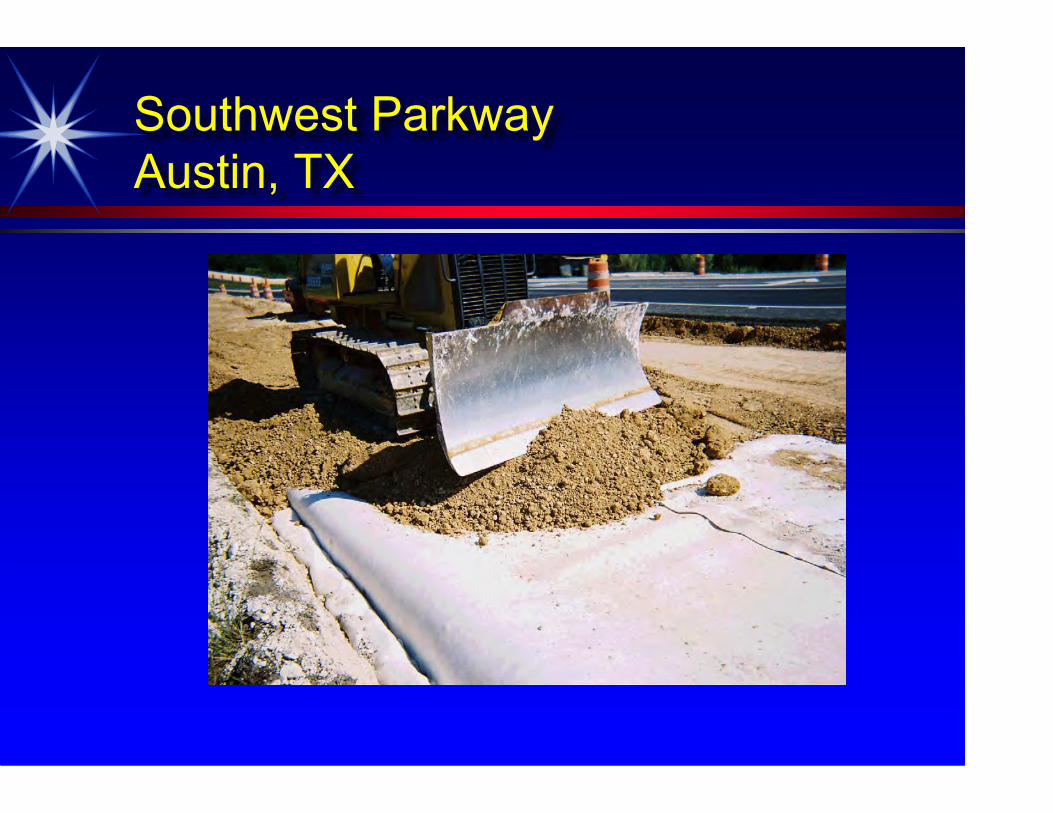
Southwest ParkwayAustin, TX


VADOT-Route 58 Rehabilitation ProjectVADOT-Route 58 Rehabilitation Project
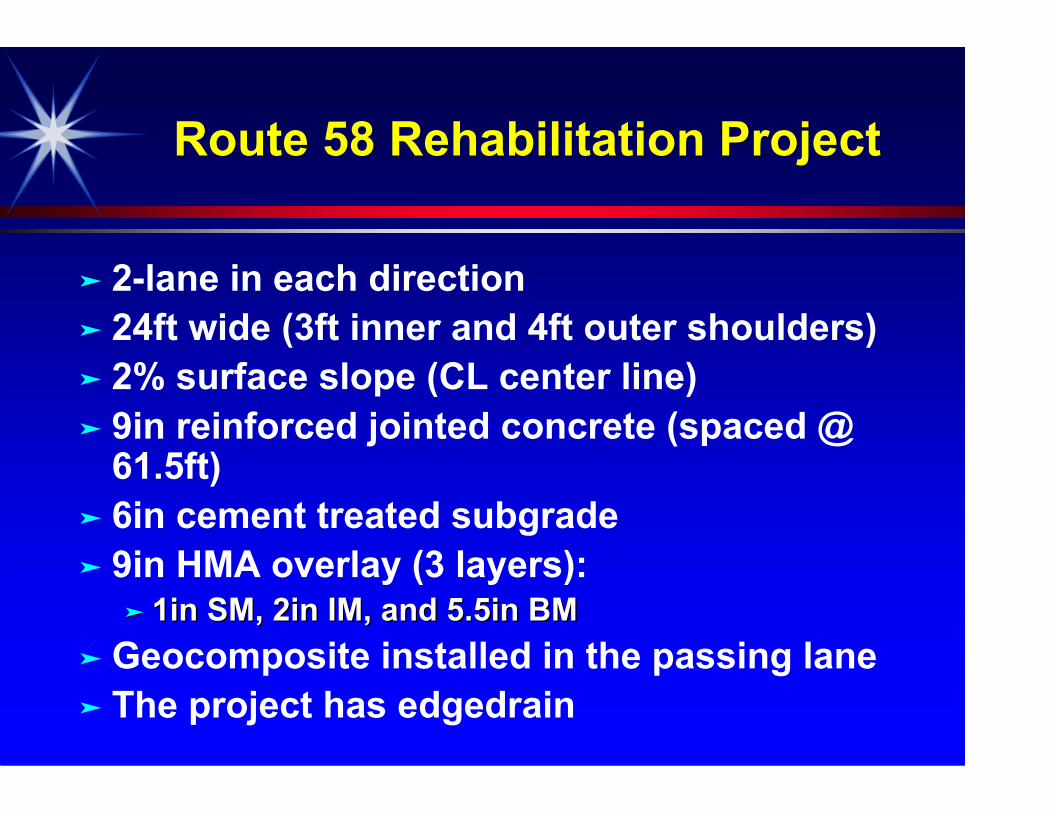
Route 58 Rehabilitation Project
2-lane in each direction 24ft wide (3ft inner and 4ft outer shoulders) 2% surface slope (CL center line) 9in reinforced jointed concrete (spaced @
61.5ft) 6in cement treated subgrade 9in HMA overlay (3 layers):
1in SM, 2in IM, and 5.5in BM1in SM, 2in IM, and 5.5in BM Geocomposite installed in the passing lane The project has edgedrain
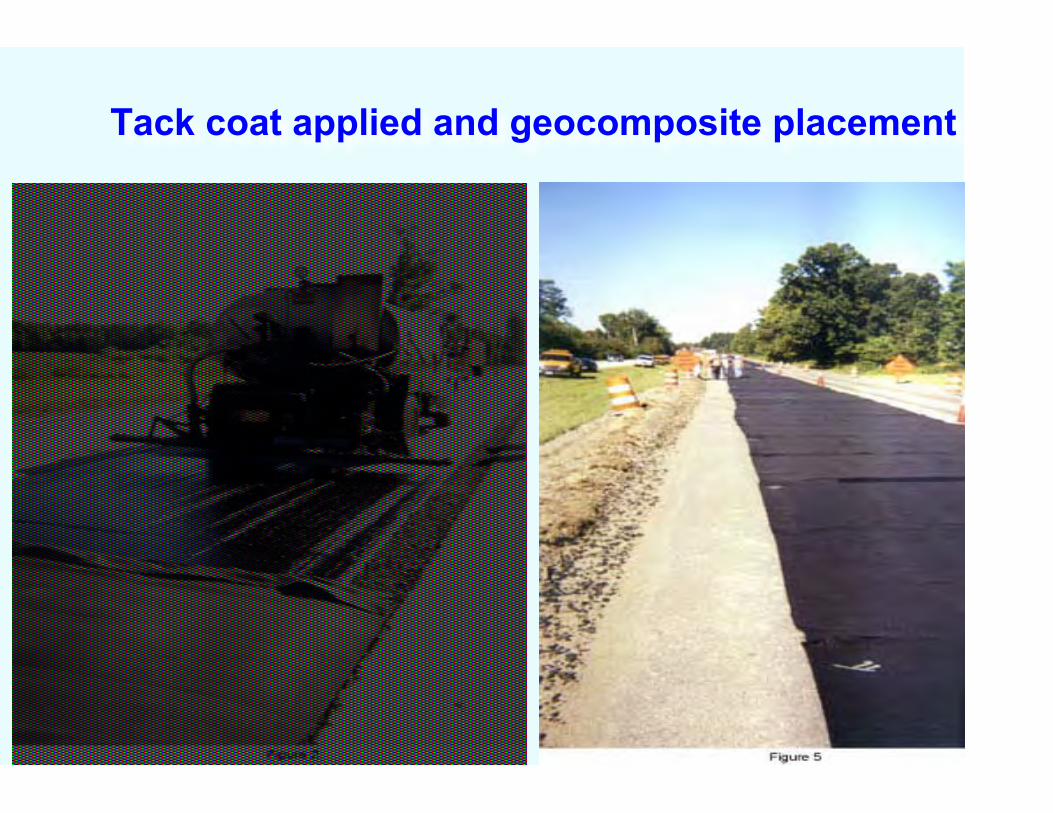
Tack coat applied and geocomposite placement
Traffic over the geocomposite panel
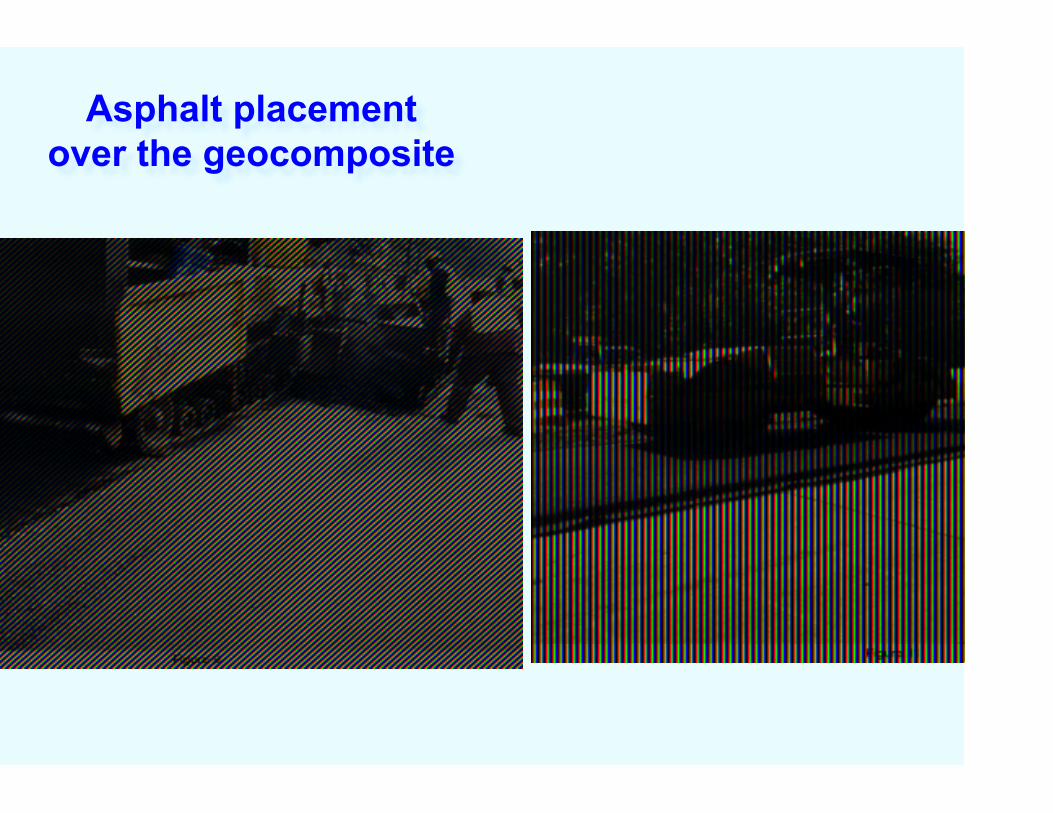
Asphalt placementover the geocomposite

HMA over HMA over GeocompositeGeocomposite
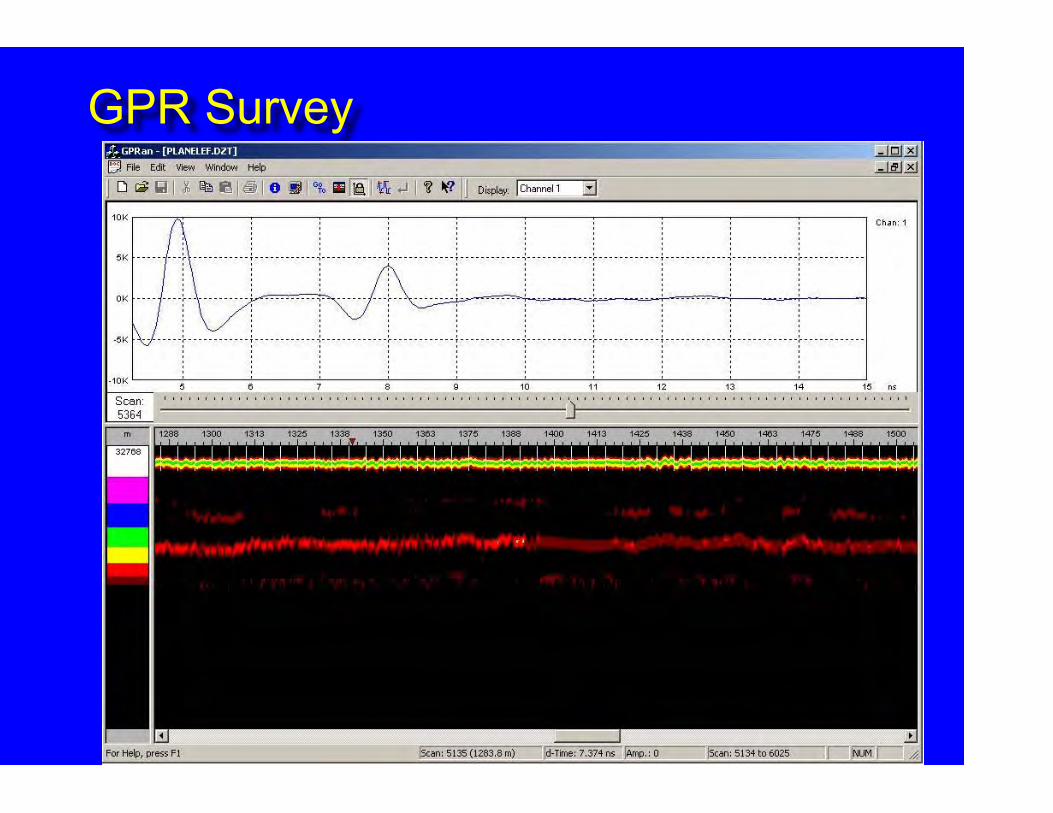
GPR Survey

Missouri DOTRoute 63- Ashland MO
Concrete Joint RepairWith JointDrain

Failed Joints on Route 63- Ashland, MOMO DOT Project
Cutting out a 25’ section of concretebetween 2 failed concrete joints
Clearing debris to prepare subgrade Compacting subgrade in preparation forthe installation of JointDrain

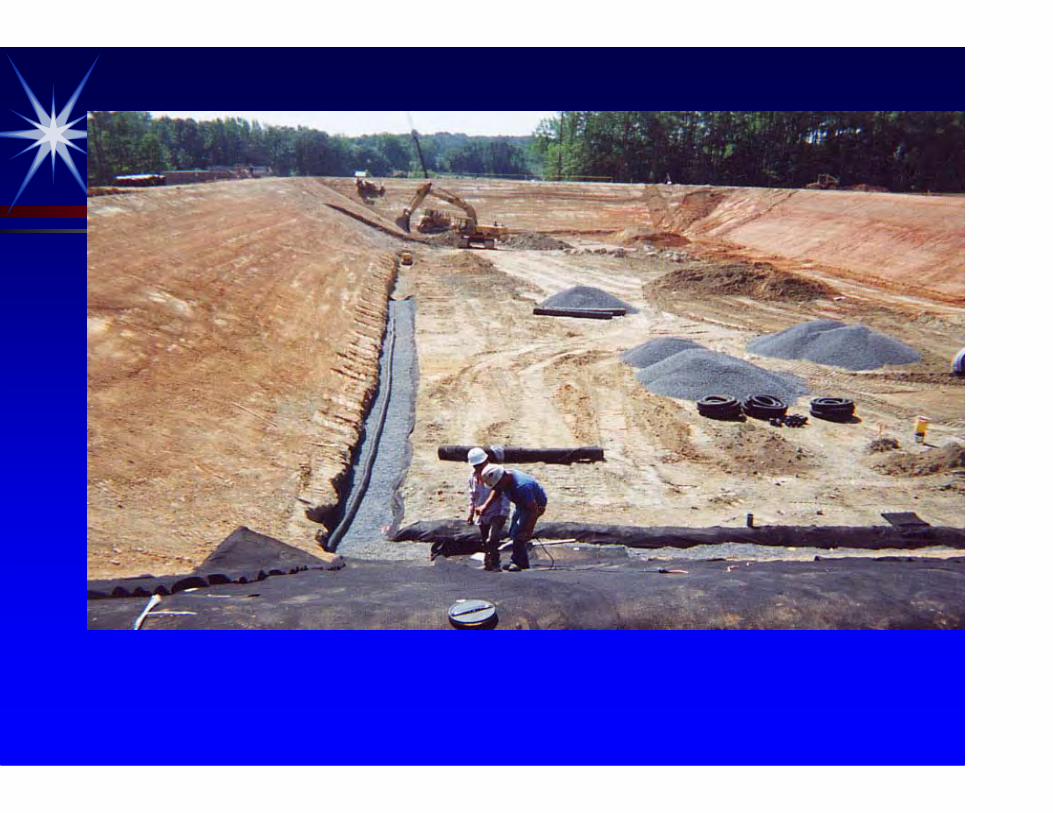
A drainage trench must be dug at the edge of the road to collectmoisture that drains through the JointDrain.
Drilling dowel holes at the edge of eachconcrete “cut”
Applying epoxy into dowel holes beforeplacement of dowel rods
Placement of dowel rods
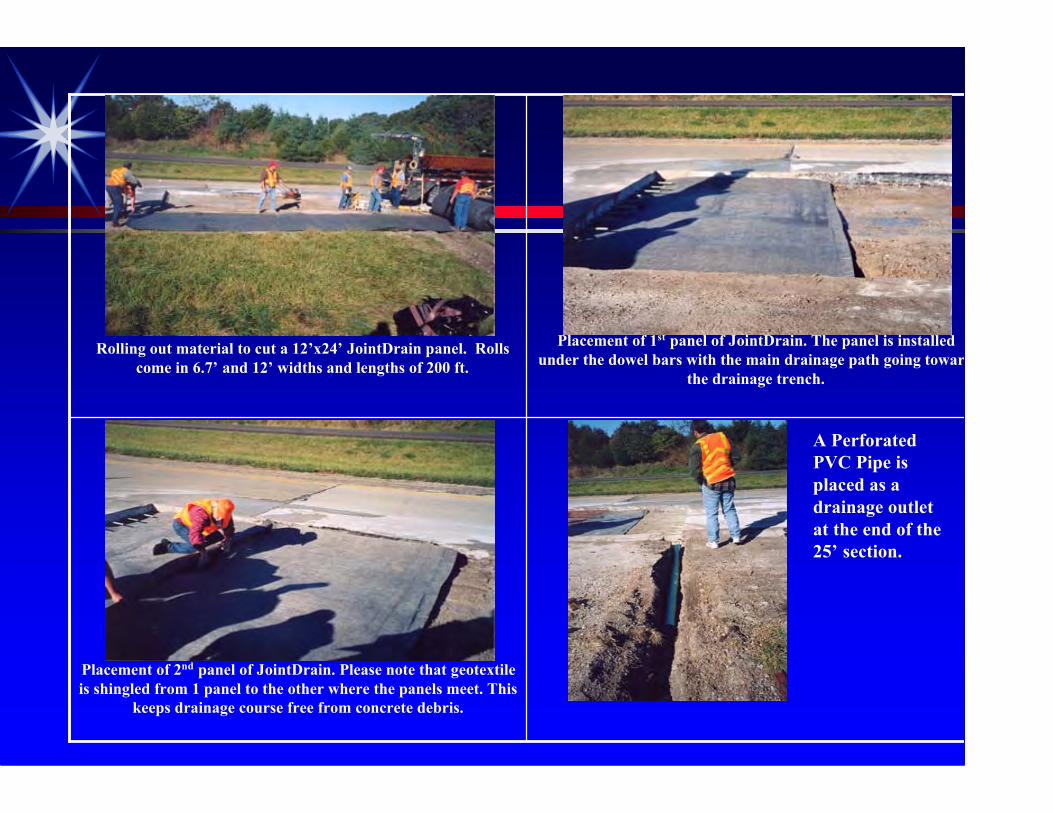
Rolling out material to cut a 12’x24’ JointDrain panel. Rollscome in 6.7’ and 12’ widths and lengths of 200 ft.
Placement of 1st panel of JointDrain. The panel is installedunder the dowel bars with the main drainage path going toward
the drainage trench.
Placement of 2nd panel of JointDrain. Please note that geotextileis shingled from 1 panel to the other where the panels meet. This
keeps drainage course free from concrete debris.
A PerforatedPVC Pipe isplaced as adrainage outletat the end of the25’ section.

After last panel of JointDrain is placed,metal mesh is placed. Metal mesh isrested on dow bars, and on top of
JointDrain panel.
Ready-mix concrete is poured directlyon JointDrain panels.
Screed is used to smooth and flattenthe poured concrete.
After a couple of passes of thescreed, the concrete is ready for
finishing touches.
As a final step, the concrete is brushedfor a finished look.
The final poured concrete that waspoured on top of JointDrain in
order to repair 2 faulty concretejoints.

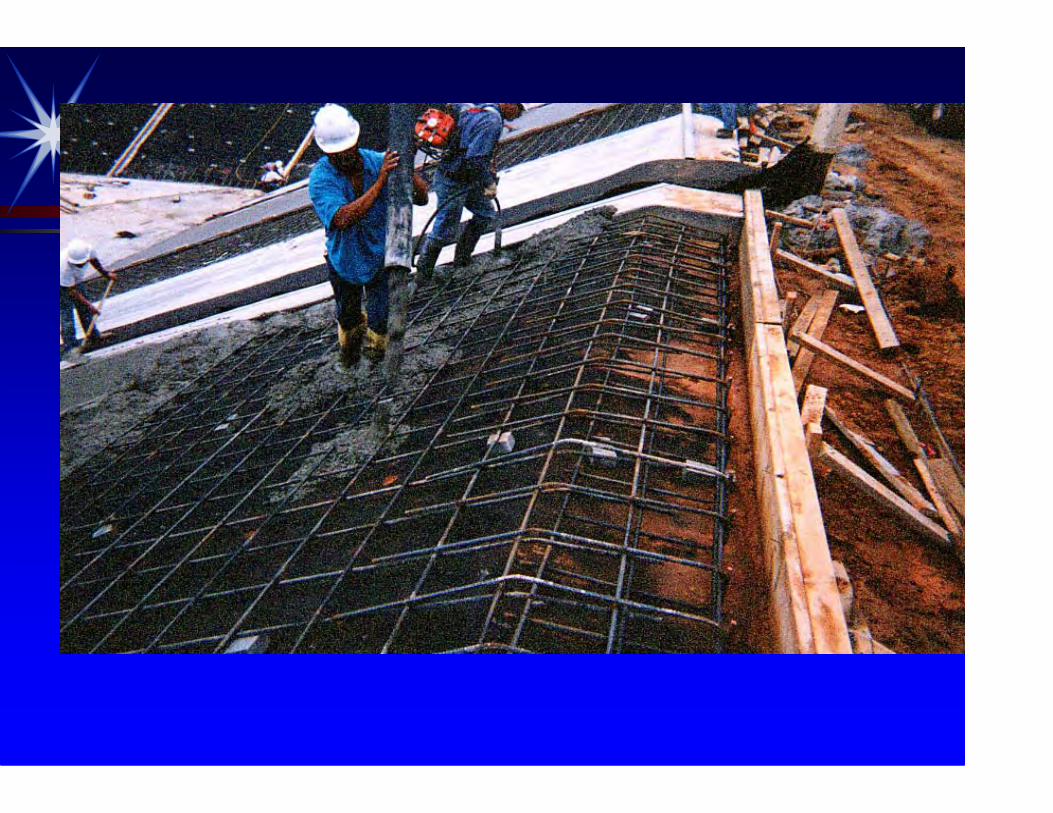
Equalization Basin Detail
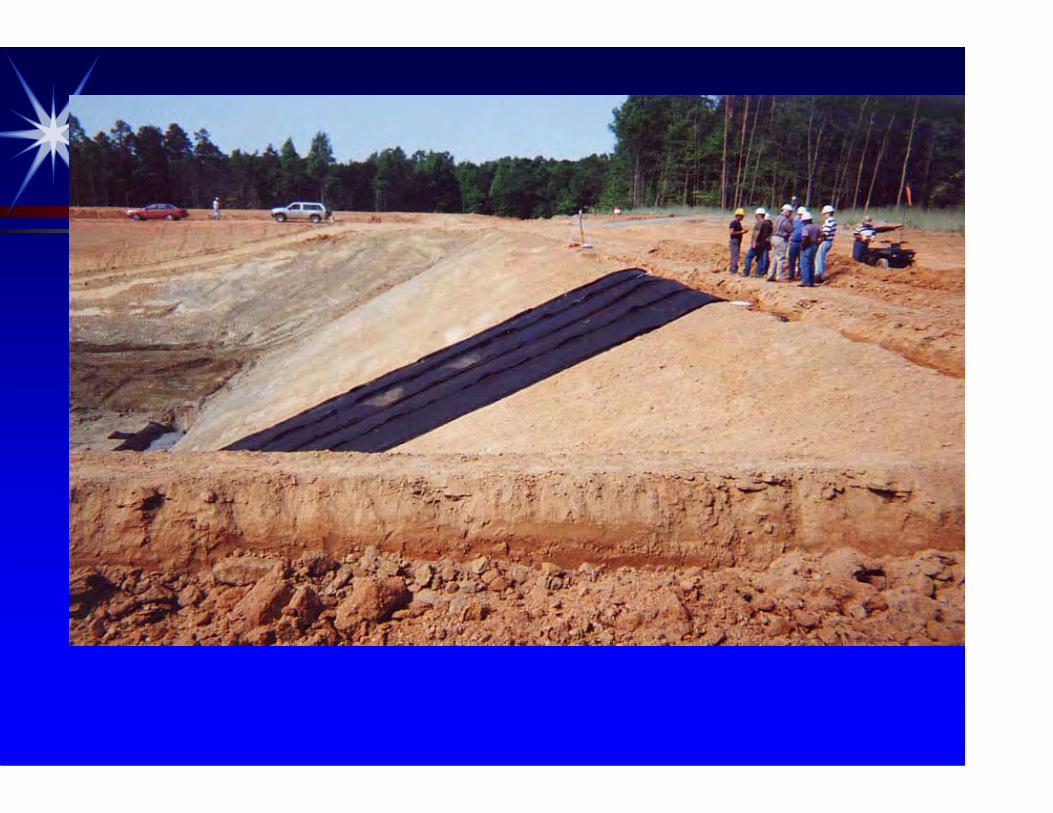
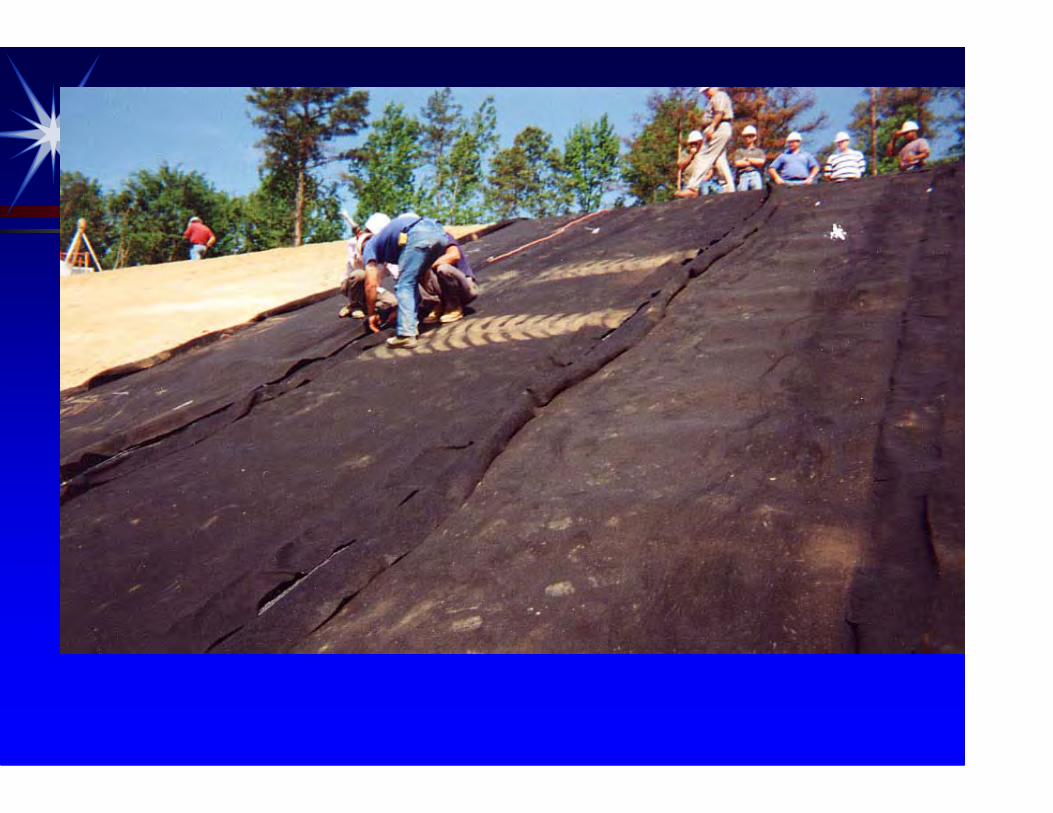
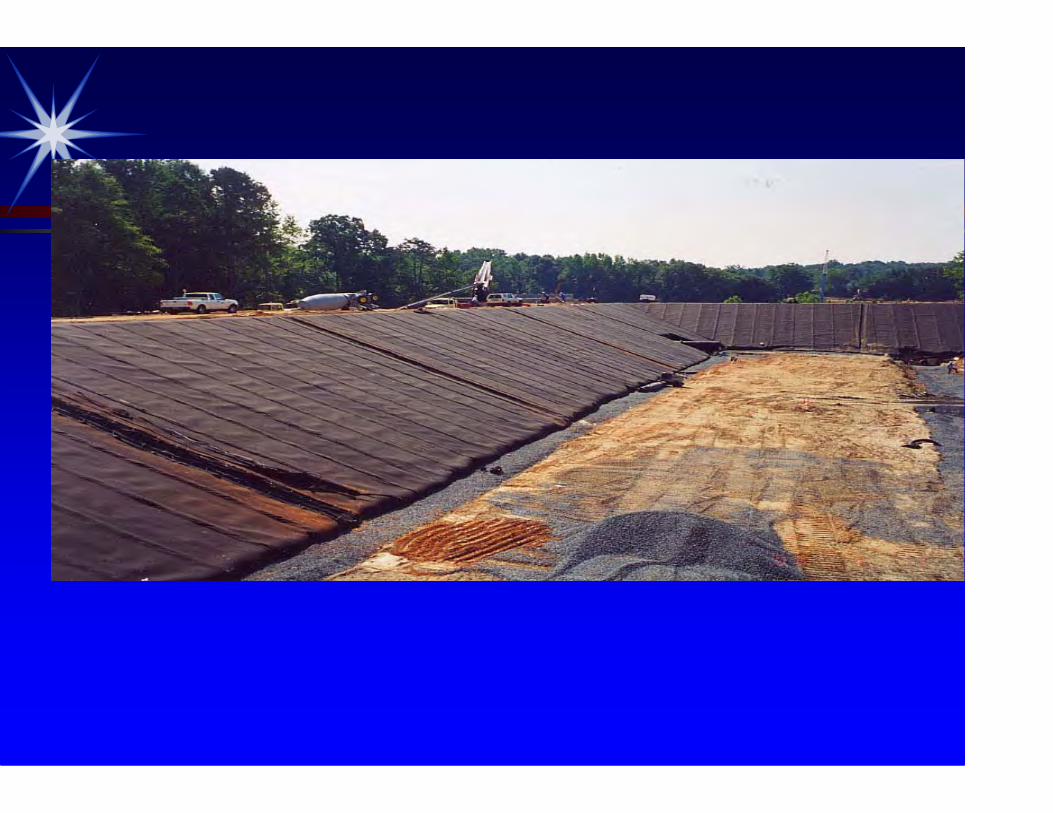

Pouring of Concrete on Geocomposite


Conclusions
The RoaDrain geocomposite drainage layer is aneffective alternative for pavement drainage.
Calculations based on time-to drain approach indicate: adequate infiltration rates to handle significant storm events.adequate infiltration rates to handle significant storm events. < 10 min. to drain the geocomposite layer.< 10 min. to drain the geocomposite layer. < 2 hours hours to drain the road even when placed beneath< 2 hours hours to drain the road even when placed beneath
moderately permeable dense graded aggregate base.moderately permeable dense graded aggregate base. i.e. excellent drainage based on AASHTO 1998 criteria.i.e. excellent drainage based on AASHTO 1998 criteria.

QUESTIONS ?