geostatistics. hydrogeologist iii / salary range: $48,980 - $72,632 per year (doq). first published...
TRANSCRIPT

Geostatistics

Hydrogeologist III / Salary Range: $48,980 - $72,632 per year (DOQ).
First Published 02/03/04
Broward County Department of Planning and Environmental Protection Water Resources Division. Position requires hydrologic modeling of surface water and groundwater flows in Broward County, Florida in support of natural resource protection and restoration, and urban water resource planning. Work requires the use of experienced judgment and advanced modeling and theoretical skills. Candidates should have knowledge of reference sources, current trends, and recent research in hydrogeologic modeling and water resource management; the ability to apply scientific and technical knowledge with accuracy and sound judgment; and the ability to communicate effectively both orally and in writing. Please see full position announcement for qualification requirements and how to apply at http://205.166.161.20/hrcurrjobs/XML/1638.htm

Goals

Basic definitions
• Variance:
• Standard Deviation:
n
meani KKn
K1
21)var(
)var(2 K
)var(K

Basic definitions
• Number of pairs

Basic definitions
• Number of pairs:
2
)1(
nnnpairs

Basic definitions
• Lag (h)– Separation distance
(and possibly direction)
h

Basic definitions
• Variance:
• Variogram:
)(
1
2)()()(2
1 h
hxxh
hn
KKn
h n
meani KKn
K1
21)var(

The variogram
• Captures the intuitive notion that samples taken close together are more likely to be similar than samples taken far apart

Common Variogram Models

Common Variogram Models

Basic definitions
Kriging:
N
iiKwK1
x
N
iw1
1BLUE

Kriging Estimates

Where to get software:
http://www.ucc.ie/gnuplot/Release 4, gp400win32.zip
ftp://globec.whoi.edu/pub/software/kriging/easy_krig/V3.0.1/
http://sgems.sourceforge.net/doc/sgems_manual.pdf
http://sgems.sourceforge.net/

S-GeMS Object file formatww (49x30)3xypore1 1 121 1 141 1 161 1 181 1 1101 1 0121 1 0141 1 0161 1 0181 1 0201 1 0…
Load object
Import as point set

Random Numbers; Pure Nugget

Unconditioned Simulation• Specify mean and neighborhood• Specify variogram• Simulation should honor variogram

Unconditional Simulation

Simulated Field/Known Variogram

USGS Sections
http://sofia.usgs.gov/publications/wri/90-4108/wri904108plates.pdf

http://sofia.usgs.gov/publications/wri/90-4108/wri904108plates.pdf

USGS Aquifer Tests

USGS Site IdentificationSites are identified by the standard U.S. Geological Survey (USGS)
identification number, which is based on an initial determination of latitude and longitude of the site. The site identification serves as a unique
identification number in files and databases of the USGS and indicates the approximate geographic location of each site. The identification consists of
15 digits: the first 6 digits denote the degrees, minutes, and seconds of latitude; the next 7 digits denote degrees, minutes, and seconds of longitude;
and the last 2 digits (assigned sequentially) identify the site within a 1-second grid. For example, site 363530116021401 is at approximately
36°35'30" latitude and 116°02'14" longitude, and it is the first site recorded in that 1-second grid. Even if a more precise latitude and longitude are
subsequently determined, the site identification number remains unchanged. Latitude and longitude shown for a site, therefore, are the most accurate
locators.

Coordinate Extraction

Lat/Lon State PlaneNGS Horizontal Blue Book format - *80* (Control Point) Record. Only the *80* records in a Blue Book file are used by NADCON, the other records are passed through without change to the output. On the *80* records, only the latitude
and longitude are modified - the rest of the record is unchanged. Thus, this format can be used with either 'old' Blue Book files or 'new' Blue Book files. On the *80* records, the direction of the latitude must be north positive ('N')
and the direction of the longitude must be west positive ('W'). The precision of the output will be the same as the precision of the input latitude.
For more information on this format, please refer to:
'Input Formats and Specifications of the National Geodetic Survey Data Base' 'Volume 1. Horizontal Control Data'. Published by the Federal Geodetic Control Committee in January, 1989 and available from: the National Geodetic Survey, NOAA, Rockville, MD 20852.
The following input example is a *80* record from a Blue Book file with NAD 27 coordinates:
004560*80*096 KNOXVILLE CT HSE 411906578 N0930548534 W 277
The following example is of the output *80* record with the transformed NAD 83 latitude and longitude.
004560*80*096 KNOXVILLE CT HSE 411906566 N0930549268 W 277
http://www.ngs.noaa.gov/cgi-bin/nadcon.prl?explain=Y&input_format=3
http://www.ngs.noaa.gov/

Biscayne Aquifer K

Specific Capacity
• Flow per Drawdown, Q/s (gpm/ft)
• T (gpd/ft) ~ 2000 Q/s (gpm/ft)
• T = 2 x 10⁶ gpd/ft (extreme!)
• Q/s = T/2000 = 103 gpm/ft
• Q = 100 gpm =>
• s = 1/10 ft (~3 cm)
• Data: Q/s = 7000 gpm/ftDriscoll, F. G. 1986. Groundwater and Wells, Johnson Division, Minneapolis.

Specific Capacity Data

Specific CapacityVariance of data: 3,509,048 (gpm/ft)2
Slow initial growth in variance with lag => Gaussian variogram model
Range: 0.07 degrees

Specific CapacityVariance of data: 3,509,048 (gpm/ft)2
Slow initial growth in variance with lag => Gaussian variogram model
Range: 0.07 degrees

Conditional Gaussian Simulation
• Specify data
• Fit and specify variogram
• Simulation should honor variogram and be responsive to values at ‘conditioning’ points

Kriging• Specify data
• Fit and specify variogram
• Simulation should honor variogram and return exact values at sampling points
• Optimal estimate too far from sample data is mean

Gaussian Simulation/Kriging

Gaussian Simulation/KrigingHistogram
0
50
100
150
-500
0
-400
0
-300
0
-200
0
-100
0 0
1000
2000
3000
4000
5000
6000
7000
8000
9000
1000
0
Mor
e
Bin
Fre
qu
en
cyGaussian
Kriging
Histogram
0100200300400500
-500
0
-400
0
-300
0
-200
0
-100
0 0
1000
2000
3000
4000
5000
6000
7000
8000
9000
1000
0
Mor
e
Bin
Fre
qu
ency

Kriging
5 conditioning points
1 conditioning point
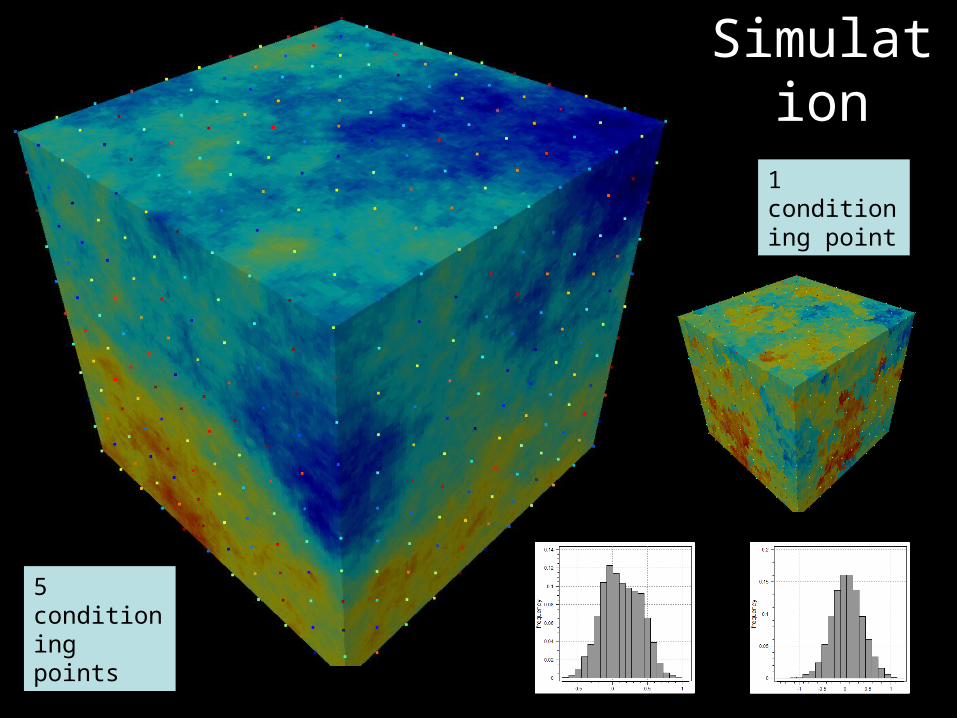
Simulation
5 conditioning points
1 conditioning point