geospatial techniques for heritage site …geospatial techniques for heritage site monitoring and...
TRANSCRIPT

GEOSPATIAL TECHNIQUES FOR HERITAGE SITE MONITORING AND
EVALUATION OF TOURISM POTENTIAL IN UTTARAKHAND
Sudha Ravindranath1 ,Vidya A.
1, Parul Bukadia
2 and Uday Raj
3
1Regional Remote Sensing Center-South, National Remote Sensing Centre, Marathahalli Outer Ring Road,
Bengaluru- 560037 Email: [email protected]
2M.Sc. Remote Sensing and GIS,Kumaun University, Almora-263601
3Regional Centres, National Remote Sensing Centre, Hyderabad-500037
KEY WORDS: CARTOSAT-1, LISS-IV, Landuse/Landcover, weighted ranking method, monitoring
ABSTRACT: India is culturally rich country known for its cultural heritage through its nationally important
archeological heritage sites and monuments. Monitoring of the heritage sites/monuments is essential as they face
increasing risk due to unplanned urbanization, tourism, natural and man-made disasters, etc. In this study,
geospatial techniques have been used for monitoring six national monuments / heritage sites (for eg. Kalinga
monument in Dehradun, old cemetery in Roorkee) in Uttarakhand which are located in diverse geographic and
economic conditions with different religious backgrounds. Multi-temporal high resolution satellite images viz.,
Landsat ETM+ (2000-2001), Cartosat-1 & LISS IV (2009-10) and other ancillary data have been used to monitor
the development/expansion around the heritage sites within a specific buffer area encompassing its management
zones viz., prohibited and regulated boundary. Landuse / Landcover (LU/LC) change analysis indicated changes in
vegetation and built-up area categories, especially in the sites located within a city/town viz., Dehradun and
Kashipur as compared to others located in remote areas, providing an important input for authorities for effective
management. Evaluation of the tourism potential of these sites has been carried out to suggest planning strategies
for overall area improvement including economic development. The tourism potential of the sites have been
evaluated based on physical, social, and environmental parameters using weighted ranking method, a popular multi-
criteria decision making tool. Based on the total tourist potential scores, the sites have been classified into four
categories very high, high, medium and low potential and the planning strategies for improvement has been worked
out. The methodology adopted in the study for monitoring can be extended to other nationally important
monuments in Uttarakhand region for efficient management and conservation. The weighted ranking approach can
be used to prepare a tourism developmental plan for improving the tourist inflows for other important heritage sites
and monuments.
1 INTRODUCTION
Archaeological/heritage sites and monuments are often located in places which had value in the past and are still
regarded as valuable.In Indian context, monuments are considered as architectural works, works of monumental
sculpture and paints, elements or structure of archaeological nature, inscriptions, cave dwellings and combination of
features which have outstanding heritage value from the point of view of history, art or science. Sites are defined as
works of man or combined work of man and nature with outstanding value of history, aesthetics, ethnology or
anthropology. The interrelationship among variety of cultural and natural parameters existing within the vicinity of
the site determines the preservation, conservation and management practices of heritage. Monitoring of the heritage
sites/monuments is essential as they face increasing risk due to unplanned urbanization, tourism, natural and man-
made disasters, etc. In the recent years, Satellite remote sensing has become a common tool of investigation,
prediction and forecast of environmental change and being a non-destructive technique, it can contribute to the
investigation of an archaeological site too. Geospatial techniques are now being extensively used for monitoring
and management of heritage sites world over and in Indian context also. National Remote Sensing Centre (NRSC )
& Archeological Survey of India (ASI), in a joint collaborative project has carried out systematic inventory &
generation of management zones for nearly 3600 nationally important monuments of the country and hosted the
geospatial database on BHUVAN (web: bhuvan.nrsc.gov.in/governance/culture_monuments)
Maintenance of ancient monuments and archaeological sites & remains of national importance is the prime concern
of the ASI, Ministry of Culture. It regulates all archaeological activities in the country as per the provisions of the
Ancient Monuments and Archaeological Sites and Remains Act, 1958 & 2010. According to this act, three
management zones have been defined viz., Protected boundary, Prohibited boundary and Regulated boundary.
These three boundaries define site management zone for a particular monument/site which clearly specifies the
rules & regulations, heritage bye-laws to be implemented etc. Monitoring of the heritage sites over period of time is
an important requirement which can be met through use of geospatial techniques.(Sankhala,2014, Samanta, 2012,
Noor,2015)
Another important concept associated with the heritage sites is its attraction to tourists. It is well known that,
contribution of tourism can be significant to sustainable development and economical up-liftment of a region if
planned methodically. Literature survey has revealed that tourism potential is an important concept which describes
the tourist attractiveness of a place which can be a qualitative or a quantitative measure. To name a few studies, use
of remote sensing and GIS to carry site suitability analysis for tourism development (Ibrahim Rizk Hegazya, 2015,
Pareta, 2013); policies for protection of World Heritage Sites (Mario Hernandeza, 2008; Mukesh, 2009); Integrated
planning for World Heritage town of Paphos in Cyprus (Hadjimitsis,2006) andWeb enabled tourist information
system (Gupta, 2015). Corneliu, 2010, has considered Tourism potential as function of demand and supply
interaction while Abdulla Al Mamun and Soumen Mitra, 2012, formulated a simple methodology to quantify
tourism potential for a region from secondary sources, where detail data is not readily available. Other studies by
Yuan, 2011 and Poonia, 2013 also describe methods for tourist potential evaluation.
In the present paper, role of remote sensing and GIS as a monitoring tool in analyzing land use/ land cover change
patternas well as forevaluation of tourist potential in conjunction with ancillary information collected through
secondary sources has been presented.
2 Objective of the study
The study aims to identify and compare changes in land use and land cover over time and space in and around the
heritage sites & monuments. There are 42 nationally important heritage/archaeological sites under ASI in
Uttarakhand which includes temples, fortress, excavated sites, rock inscription, caves and Cemetery. A systematic
evaluation of all the 42 sites with respect to geographical setting, architectural structure/construction, culture, time
period etc., has been carried out and six sites have been chosen for detailed study with the following objectives.
Monitoring of six nationally important heritage sites of Uttarakhand using remote sensing and GIS technique
over time and space.
To examine the changes occurred within the management zones of the heritage sites or monuments over time
and space.
To examine the Tourism Potential of six nationally important heritage sites and suggest suitable measures to
enhance the tourism potential.
3 Study Area and Data Used
ASI under the provisions of the AMASR Act, 1958, protects monuments, sites and remains of national importance.
According to this act, three management zones have been defined: Protected boundary (monument boundary),
Prohibited boundary (100m from protected boundary) and Regulated boundary (200m from prohibited boundary).
As mentioned earlier, these three boundaries define site management zone for a particular monument/site. In this
study remote sensing data has been used to study the change in landuse/landcover from the year 2000 to 2010
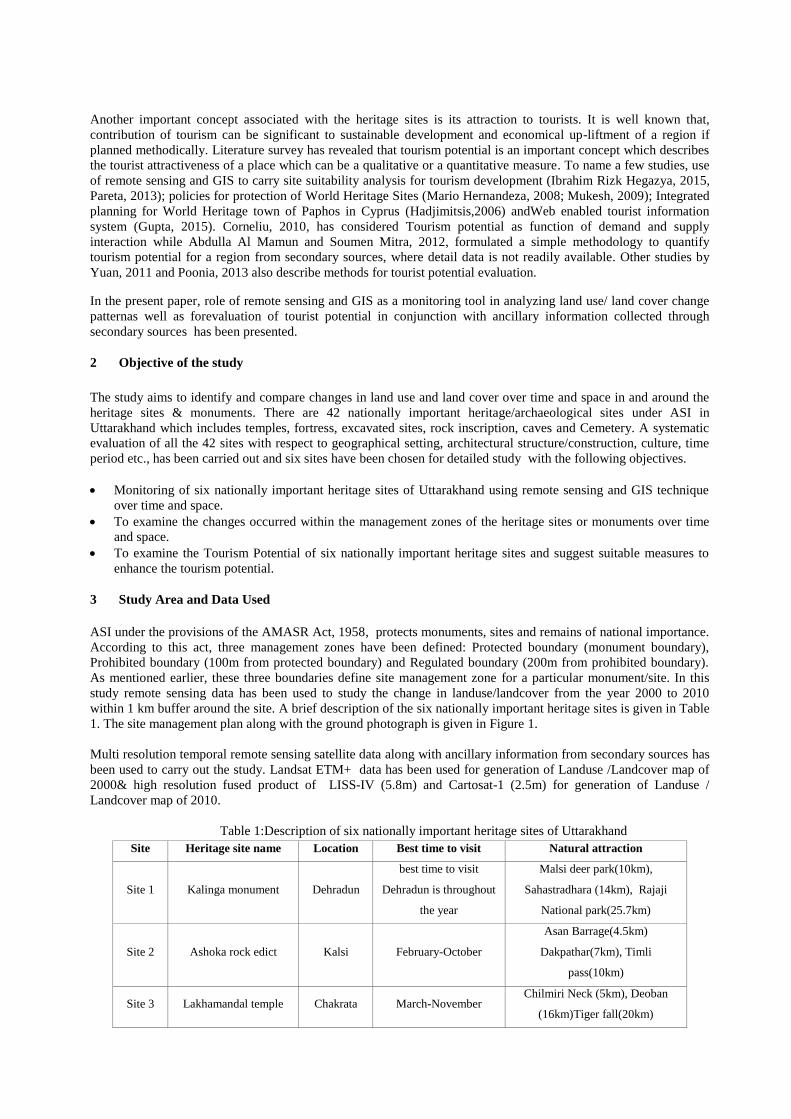
within 1 km buffer around the site. A brief description of the six nationally important heritage sites is given in Table
1. The site management plan along with the ground photograph is given in Figure 1.
Multi resolution temporal remote sensing satellite data along with ancillary information from secondary sources has
been used to carry out the study. Landsat ETM+ data has been used for generation of Landuse /Landcover map of
2000& high resolution fused product of LISS-IV (5.8m) and Cartosat-1 (2.5m) for generation of Landuse /
Landcover map of 2010.
Table 1:Description of six nationally important heritage sites of Uttarakhand
Site Heritage site name Location Best time to visit Natural attraction
Site 1 Kalinga monument Dehradun
best time to visit
Dehradun is throughout
the year
Malsi deer park(10km),
Sahastradhara (14km), Rajaji
National park(25.7km)
Site 2 Ashoka rock edict Kalsi February-October
Asan Barrage(4.5km)
Dakpathar(7km), Timli
pass(10km)
Site 3 Lakhamandal temple Chakrata March-November Chilmiri Neck (5km), Deoban
(16km)Tiger fall(20km)

Site 4 Old cemetery Roorkee October-March
SolaniAqeduct(1.5km) Neel
dharapakshivihar(30km),
Harkipauri
Site 5 Mound (Site of
Govisana Fort) Kashipur
February-April and
September-October
Dronasagar(0.5km), GiriSarovar
(2km), Jim Corbett National park
(29km)
Site 6 Three temples of Indo-
AryaShikara type Garur October-May
Kausani (14km), Kausani tea
estate(18km) Binsar(28km)
Figure 1:Six Nationally Important Heritage sites with respective site management plans
4 Methodology
The database includes generation of time series satellite data of two periods - Landsat ETM+ images of 2000 and
Cartosat 1 and LISS-IV merged images of the year 2010. The satellite images have been used to generate landuse
maps of the study area to study the changes happened around the monuments over the years. A brief methodology
used in the study for monitoring and evaluation of tourist potential is shown in Figure 2a and Figure 2b. The natural
and cultural attraction parameters have been considered while choosing the 6 sites.
4.1 Monitoring of Heritage sites
The methodology followed for monitoring of heritage sites over time and space is given above in Figure 2a.
Satellite Image chips have been extracted for each site for an area of 1 km buffer from two data sets. Using visual
interpretation techniques, landuse/landcover maps have been generated and also area statistics computed. Basically
six major classes have been delineated viz., Monument and its extent, Built-up, Road network, Vegetation, Water
Body, Open lands/Fallow land. Final landuse change analysis has been carried out and three types of changes have
been identified, viz., no change, positive and negative change areas. Generally, change from fallow areas to
vegetation is considered as positive whereas change into built up from vegetation or fallow land or water body is
considered as negative. The areas where the landuse has not changed over time have been considered as no change.
The landuse/landover maps have also provided inputs for computation of tourist potential evaluation. For e.g. if
Site 1 Site 2
Site 3 Site 4
Site 5
Site 6

there is more vegetation and less settlement around heritage site, it might indicate that there is less connectivity and
accessibility which has a direct/or indirect impact on tourism.
Figure 2a and 2b: Brief methodology used for monitoring of Heritage sites and Evaluation of Tourism Potential
4.2 Monitoring of Heritage sites
The methodology followed for monitoring of heritage sites over time and space is given above in Figure 2a.
Satellite Image chips have been extracted for each site for an area of 1 km buffer from two data sets. Using visual
interpretation techniques, landuse/landcover maps have been generated and also area statistics computed. Basically
six major classes have been delineated viz., Monument and its extent, Built-up, Road network, Vegetation, Water
Body, Open lands/Fallow land. Final landuse change analysis has been carried out and three types of changes have
been identified, viz., no change, positive and negative change areas.Generally, change from fallow areas to
vegetation is considered as positive whereas change into built up from vegetation or fallow land or water body is
considered as negative. The areas which remained intact over time have been considered as no change. The
landuse/landover maps have also provided inputs for computation of tourist potential evaluation. For e.g. if there is
more vegetation and less settlement around heritage site, then it might indicate that there is less connectivity and
accessibility which has a direct/or indirect impact on tourism.
4.3 Tourism Potential Evaluation
Tourism Potential Evaluation is a method of quantifying and qualifying the potential of tourist place/site in terms of
scenic/aesthetic, scientific, cultural/historical, and social/economic values as shown in Figure 2b. In this study with
the help of GIS analyst tools and other techniques, the tourist potential for 6 heritage sites have been evaluated.
Composite index has been computed for the heritage sites to find out the level of availability of infrastructure for
tourism. This has been done by selecting indicators/parameters and index has been calculated for the selected six
heritage sites/monuments. Indicators/parameters have been finalized based on the literature survey as well as
observation of the sites. A total of 11 parameters have been used in the study on the basis of physical, social and
environmental aspects to evaluate the Tourism potential. Some of the parameters may not relate directly with tourist
arrivals and their stay but they play a crucial role in tourism satisfaction enhancement. It was observed from the
collected in formation that the Tourist arrival is at peak in the month of March to May or September to November.
4.3.1 Rank assignment to the parameters of three aspects: As observed in many researches, potential of tourist arrival is dependent upon the quality of service, availability of
tourism infrastructure and socio- cultural background of the tourist. Tourist has many options for choosing
destination and this choice value can be enhanced by upgrading the quality of service and availability of tourism
infrastructure. For analyzing tourist potential, first step is to assign rank (potential value) to all the eleven
parameters of physical, social and environmental aspects used in the study. One to five ranks have been assigned to
the parameters according to the importance of the facility for tourist and depends upon the availability of facility
near heritage site. Highest rank (5th
rank) assigned to the site where more facilities are present near destination and
lower rank (1st rank) assigned to the site where the less facilities are present. The rank assignment based on physical
parameters, social parameters and environmental parameters are given in Table 2a and 2b, Table 3 and Table 4
respectively.

4.3.2 Computation of aggregate Potential value
After assigning ranks to all the parameters, second step is to calculate the aggregate potential value. All the
potential values will generally range from 1-5, where lower values indicate weakness as compared to strength. The
aggregate value works as an indicator for tourism potential; however, it may not identify the intensity and strength
in different aspects of heritage sites. Potential value of a heritage site is finally aggregated in an additive way.
Aggregate potential value of physical, social and environmental aspects is the sum of potential value of all the
parameters given in Eq 1, Eq2 and Eq3.
( p) ( ) ( ) ( ) ( ) ( ) {Equation 1}
( ) ( ) ( ) ( ) {Equation 2}
( ) ( ) ( ) ( ) {Equation 3}
4.3.3 Analysis of tourism potential evaluation in six sites of Uttarakhand
“Weighted Sum Method” a popular multi-criteria decision making tool, has been adopted for computing the total
tourism potential of each site. In this method, the total potential values of VP, VS and VE have been normalized and
then summed up after applying suitable weights for each aspect. Differential weights have been assigned to the
three aspects based on their importance for increasing the tourism potential. The weights given on a scale of 100 are
physical aspect (40) ,Environmental aspect (40) and Social aspect ( 20). Eq.4, Eq. 5 and Eq.6 has been used to
calculate the normalized value and hence the total tourism potential Vt has been calculated for each site using Eq. 7.
p ( p
) {Equation 4}
(
) {Equation 5}
(
) {Equation 6}
( ) ( ) ( ) ( ) {Equation 7}
Table 2a: Rank assignment to the physical parameters
No. of
Hotel
(P1)
Type of hotel
Types of
transportation
(P2)
Distance
Vehicle
accessibility
(P3)
Vehicle
arrival
time
Ranks
>25 Star hotel Bus, Railway and air
facility
Within
5km
Deluxe or semi
delux buses, taxi,
autocabs
within 30
min 5
16-25 resort Bus, Railway and air
facility 5-10kms
Delux or semi
delux buses, taxi,
autocabs
every
hour 4
11-15 Budget hotel Bus, Railway facility 10-15
kms
Private buses and
taxi
within 1-
2 hr 3
6-10 Lodges Bus, Railway facility 15-20
kms
Private buses and
taxi
within 2-
4 hr 2
1-5 Dharamsaala Only bus and taxi
facility > 20kms
No buses are
available only taxi
not
scheduled 1

Table 2b: Rank assignment to the physical parameters
Nearby
cities
(P4)
time taken
Others
(banks,
ATM, Petrol pumps)
(P5)
At Distance Ranks
within
10-15kms <25 min
facility of banks,ATMs and
petrol pumps Within 5km 5
within
15-25kms 25-40 min
Facility of banks,ATMs petrol
pumps. 5-10 kms 4
Within
25-45kms 40-60 min
Facility of banks and petrol
pumps.
10-15
kms 3
within
45-75kms 1- 1:30 hr
facility of banks and petrol
only purchase by local traders
15-20
kms 2
>75kms >1:30 hr cooperative banks and no
petrol pumps >20km 1
Table 3 : Rank assignment to the Social parameters
Recreational
activities(Mall,
Parks)(S1)
Security(S2)
Health facility(S3)
At
distance Rank
Facility of Malls
and Parks
Facility of
police station
Facility of govt. and private hospitals,
PHC and medical shops.
Within
5kms 5
Facility of Malls
and Parks
Facility of
police station
Facility of govt. and private hospitals,
PHC and medical shops. 5-10kms 4
Facility of Malls
and Parks
Facility of
police station
Private hospitals, PHC and medical
shops. 10-15kms 3
Only park or mall
facility
Facility of
police station
only medical shops or private
hospitals 15-20kms 2
No malls and
parks
No police
station
No govt. hospitals only medical shops
or private hospitals > 20kms 1
Table 4 : Rank assignment to the Environmental parameters
Best time to
visit (E1)
Average
temp(°C)
Elevation/altitude
(m)(E2) Threat/disaster (E3) Rank
Jan-Dec <15°C >1500 No threat 5
Feb-Oct 15-20°C 1000-1500 less threat 4
March-Nov 20-25°C 500-1000 Medium threat 3
Oct-May 25-30°C 250-500 High threat 2
Feb-April and
Sep-Oct >30°C 100-250
High threat(disaster
prone area) 1

5 RESULTS AND DISCUSSIONS
5.1 Land use/Land cover (LU/LC) distribution and Change analysis of six sites
In this study, totally, six LU/LC classes have been considered viz., monument, river, vegetation, built-up, fallow
land, road, DronaSagar (waterbody) and infrastructure. The site –wise image chips from both the data sets viz.,
Landsat ETM+ merged with PAN band (2001) and Cartosat 1 + LISS IV fused data (2010), have been visually
interpreted and different LU/LC categories have been delineated. For each site, different landuseclasses percentage
areas have been computed. The two landuse / landcover maps have been compared to identify the changes that have
occurred in and around the sites. For e.g. in LU/LC (2000-01) of Site 1(Kalinga monument) only 3 % of land area
is engaged in road but in LU/LC (2009-10) 21% of area is covered by road. This percentage difference of road class
between 2000 and 2010 images shows increased development of infrastructure and thereby urban development. A
similar analysis has been carried out for each site class-wise. The change in landuse classes is shown in Figure 3 for
the six heritage sites. It can be observed from the Figure 3 that negative change has happened in the regulated zone
of the site management area. The area statistics are given in Table 5.
Figure 3: Landuse landcover change analysis for six heritage sites
Site 1 Site 2 Site 3
Site 4 Site 5 Site 6

Table 5: Change in the landuse landcover area over a period from 2000 to 2010
Monument
Area(Ha)
No
Change(Ha)
Negative
Change(Ha)
Total
Area(Ha)
Site 1(Kalinga
monument) 0.367 278.06 39.41 317.84
Site 2(Ashoka rock
edict) 0.48 288.05 29.92 318.46
Site 3(Lakhamandal
temple) 0.33 312.31 1.72 314.36
Site 4(Old cemetery) 3.04 244.45 67.74 315.24
Site 5(Excavated site) 38.08 20.36 38.8 313.56
Site 6(Three temples
of Indo-AryaShikara) 0.11 288.67 60.64 362.45
5.2 Evaluation of tourist potential in six sites of Uttarakhand
In the present study, tourism potential of the six selected heritage sites has been computed and evaluated for the
gaps. The table 5 gives the ranking of each site parameter-wise and aggregate potentials of physical, social &
environmental aspects. From the table 5, it seen that with respect to physical parameters, Site 1 has the highest
aggregate potential followed by Site 4 and Site 5. A similar trend is observed with respect to aggregate potential
value of social aspect. This is due to the fact that Site 1, Site 4 and Site 5 are located in Dehradun, Roorkee and
Kashipur cities However in case of aggregate potential value of environmental aspect, Site 3 followed by & Site 6
Table 6: Aggregate potential value of physical, social and environmental aspect
Heritage site P1 P2 P3 P4 P5 Vp(Eq.1
) S1 S2 S3 Vs (Eq. 2) E1 E2 E3 Ve (Eq.3)
Site 1(Kalinga
monument) 4 5 5 4 5 23 5 5 5 15 3 2 4 9
Site 2(Ashoka
rock edict) 3 2 3 2 3 13 2 4 4 10 4 2 3 9
Site
3(Lakhamanda
l temple)
2 1 2 1 3 8 3 3 3 9 5 5 2 12
Site 4(Old
cemetery) 5 4 5 3 5 22 5 5 5 15 2 2 4 8
Site
5(Excavated
site)
4 4 3 4 4 19 4 5 5 14 3 1 4 8
Site 6(Three
temples of
Indo-Arya
Shikara)
1 1 2 2 1 7 1 2 2 5 4 4 2 10
The Total tourism potential has been classified into four classes viz., Very High >75 score, high 50-75 scores,
medium 25-50 scores and low <25 score. In Table 7, it is seen that Site 1(Kalinga monument, Vt=80.8) and Site 4
(old cemetery Vt=76.5) have relatively very high tourism potential which indicates that level of all the facilities
such as availability of tourism infrastructure, tourism attraction near destination and quality of service provided to
the users is better than the other heritage sites which itself increases the potential of heritage site and makes the first
choice for the tourist. Site 5 (Excavated site, Vt= 70.4), Site 2 (Ashoka rock edict, Vt=58.13) and Site
3(Lakhamandal temple, Vt=56.8) with high tourism potential and last heritage site in Site 6 at Garur, Bageshwar
known as three temples of Indo-Aryan Shikara type (Lakshmi-Narayan, Deval, Satya Narayan temple) has medium
tourism potential (Vt=44.5) because of having minimum facility of tourism infrastructure for e.g. vehicle
acce ibility, le accommodation facility and tran portation facility. Hence there i le touri t’ inflow in thi
place.

From the study, it is observed that the physical aspects play an important role in determining that tourist inflow at
any heritage site. Improvement of the physical aspects such as road connectivity, transportation facility and
accommodation facility will improve the tourist inflow.
Table 7: Tourism potential of heritage sites
Heritage
site
Normalized Vp
(Eq.4)
Normalized Vs
(Eq.5)
Normalized Ve
(Eq.6)
Total tourism
potential Vt(Eq. 7)
Classification of
Total Tourism
Potential Vt
Site 1 0.92 1 0.6 80.8 Very High
Site 2 0.52 0.66 0.6 58.13 High
Site 3 0.32 0.6 0.8 56.8 High
Site 4 0.88 1 0.53 76.5 Very High
Site 5 0.76 0.93 0.53 70.4 High
Site 6 0.28 0.33 0.66 44.2 Medium
.
6 CONCLUSION
This study presents the results of monitoring and tourism potential evaluation of six nationally important sites of
Uttarakhand using geospatial techniques. High resolution satellite images of two times viz., Landsat ETM data of
2000 and CARTOSAT+LISSIV fused data of 2010 have been used for generating Landuse/landcover maps within
1km buffer of the heritage sites which encompasses site management zones also. The landuse change analysis has
been carried out and three types of changes have been identified, viz., no change, positive and negative change
areas. The results have shown that negative changes have occurred within the site management zones of heritage
sites, more so in the sites occurring in towns/cities. It ranges from 0% to 38%. These negative changes indicate that
the monument/heritage site is under threat of encroachment and also that the heritage bye laws may not be
implemented in strict compliance. Thus, using the satellite data it has been possible to monitor the LU/LC changes
occurring over the decade and also to identify the heritage sites which are under threat and need to be conserved.
Another important component was to evaluate the tourism potential of these sites, by which one can increase the
economy of the place. A normalized weighted sum method of the parameters has been used to carry out the tourism
potential evaluation. The sites have been studied for three aspects viz., physical, social and environmental. Under
each aspects, different parameters have been identified and rankings have been assigned based on the literature and
experts opinions. A total tourist potential has been computed and all the sites have been classified into four
categories (very high, high, medium and low). In the study, it has emerged that only Site 6 has medium tourist
potential which needs to be enhanced by way of improving the parameters of physical aspect like transportation and
accommodation facility near the heritage site.
From the present study it is seen that monitoring of heritage sites over time and space is an important component for
conservation and protection and effective management of heritage sites. The geospatial techniques used in the
present study helps in identifying the sites which are under threat of encroachment within the site management
zones. Hence a systematic monitoring of all the important heritage sites is an important exercise to be routinely
carried out for proper and efficient management of sites. Tourist potential evaluation helps in identifying the gaps in
the tourist infrastructure and the actions that needs to be taken by the policy formulators/government to improve the
tourism and thereby improve the economy of the place.
Acknowledgement
The authors would like to thank Director, NRSC for the encouragement given for carrying out this research work.
The contribution rendered by Archeological survey of India (ASI) team in the study is duly acknowledged.
References from Journals
1. B. S. S. Sankhala, "Evaluation of urban sprawl and land use land cover change using remote sensing and GIS
techniques: a case study of Jaipur City, India," International journal on Emerging technologies, p. 66–72, 2014.
2. M. R. K. Ibrahim RizkHegazya, "Monitoring urban growth and land use change detection with GIS and remote
sensing techniques in Daqahlia governorate Egypt," International Journal of Sustainable Built Environment, p.
117–124, 1, June 2015.

3. D. K. Pareta, "Remote Sensing AndGis Based Site Suitability Analysis For Tourism Development,"
International Journal of Advanced Research in, pp. 43-58, May 2013.
4. P. I. Corneliu, "A critical analysis on the evaluation of tourism attractiveness in Romania.Case study: the region
of Moldavia," in Proceedings of the 5th WSEAS International Conference on Economy and Management
Transformation (Volume I, ROMANIA) , 2010.
5. S. H. Kaberi Samanta, "Landuse / Landcover change study of Jharkhali Island Sundarbans, West Bengal using
Remote Sensing and GIS," International Journal Of Geomatics And Geosciences, Volume 3, No 2, 2012 , pp.
299-306, 2012.
6. U. H. G. S. Mario Hernandeza, "Earth Observation from Space for the protection Of UNESCO World Heritage
Sites: DLR Assisting UNESCO," The International Archives of the Photogrammetry, Remote Sensing and
Spatial Information Sciences. Vol. XXXVII. Part B8, pp. 643-646, 2008.
7. N. M. Noor, "Geospatial Analysis In Monitoring Land Use Encroahment Into Heritage Site In Bujang Valley,"
Journal Of Architecture, Planning & Construction Management, 2015.
8. K. T. D.G. Hadjimitsis a, "Utilizing Geographical Information Systems (Gis) & Satellite Remote Sensing
Analysis For Integrated Planning: A Case Study Of Paphos District Area - Unesco World Heritage Town
(Paphos, Cyprus)," in XXI International CIPA Symposium,, Athens, 2006.
9. D. A. N. GUPTA, "Web Enabled Heritage Information System -A Case Study of Bundi District (Rajasthan),"
South Asian Journal of Tourism and Heritage Vol. 8, No. 1, pp. 56-62, 2015.
10. AnamikaPoonia, "Applications of Remote sensing and GIS in Tourism potential Evaluation," International
Journal of Remote Sensing and GIS,Volume 2,Issue 1,pp. 11-20, 2013.
11. S. M. Abdulla Al Mamun and Soumen Mitra, "A Methodology for Assessing Tourism Potential: Case Study
Murshidabad District, West Bengal, India," International Journal of Scientific and Research Publications,
Volume 2, Issue 9, pp. 1-8, 2012.
12. Y. Yuan, "Potential evaluation of tourism development based on multi-level grey theory," in International
Conference on Management Science and Industrial Engineering (MSIE), , Harbin, 2011.
13. M. Mamun, "A Methodology for Assessing Tourism Potential: Case Study Murshidabad District, West Bengal,
India," International Journal of Scientific and Research Publications, Volume 2, Issue 9, p. 8, 2012.
References from websites
1. K. Mukesh, "Geospatial monitoring and evaluation of UNESCO world heritage forest areas in the Tropics,"
Umeå , 2009.
2. bhuvan.nrsc.gov.in/governance/culture_monuments