geos confidential - geos energy consulting, calgary ab, canada no portion of this presentation may...
TRANSCRIPT

GEOS
CONFIDENTIAL - GEOS Energy Consulting, Calgary AB, Canada No portion of this presentation may be reproduced in any form without prior written consent
The Future of Oil & Gas in North America…
The Canadian Perspective
George Eynon
GEOS Energy Consulting, Calgary
GCAGS, Austin TX — Nov 1, 2002

GEOS
Outline
Production >> Consumption = Exports Resource base changing
— Deeper-, Tighter-, Coalbed- Gas; Heavier Barrel; More Remote
Wells, drilling season, rig fleet, etc.— Limitations on resource development
WCSB conventional & unconventional Gas Coalbed methane Heavy oil & oilsands Frontiers
— Newfoundland, Scotian Shelf, Arctic, West Coast, Gas Hydrates.
Pace of E&P?— E&P structure, economics, infrastructure & Kyoto
GEOS
Production, Demand & Exports

GEOS
US is Canada’s Export Market
Canada’s production >> domestic consumption— Gas: North American market + North American pricing— Crude oil: US market + World pricing
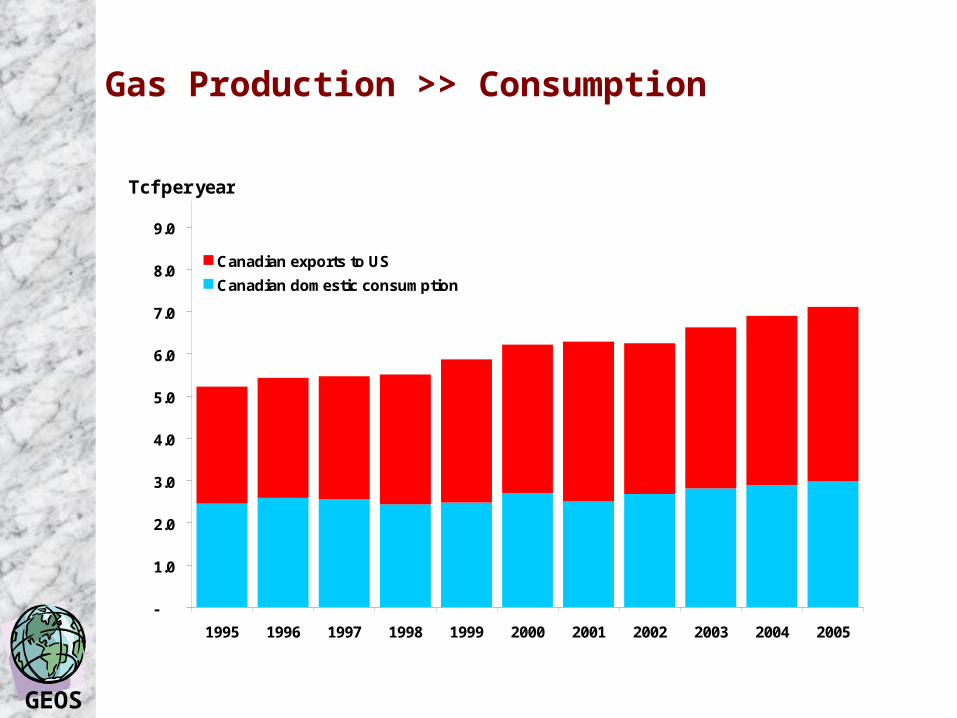
Gas production increasing since mid-80s— Domestic consumption increasing only marginally— Now export almost 60%
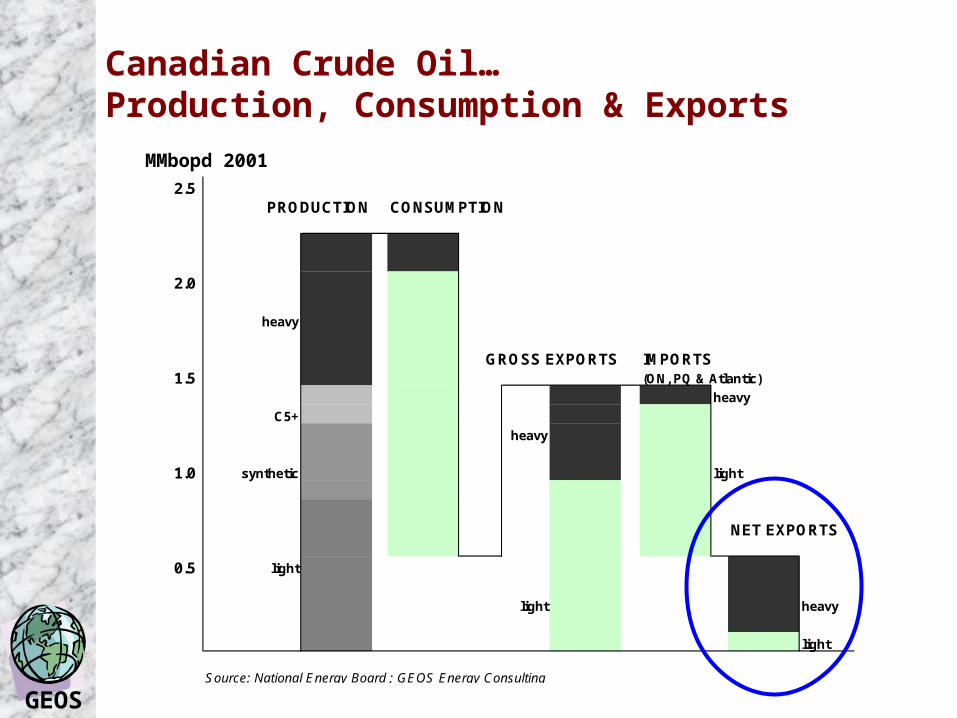
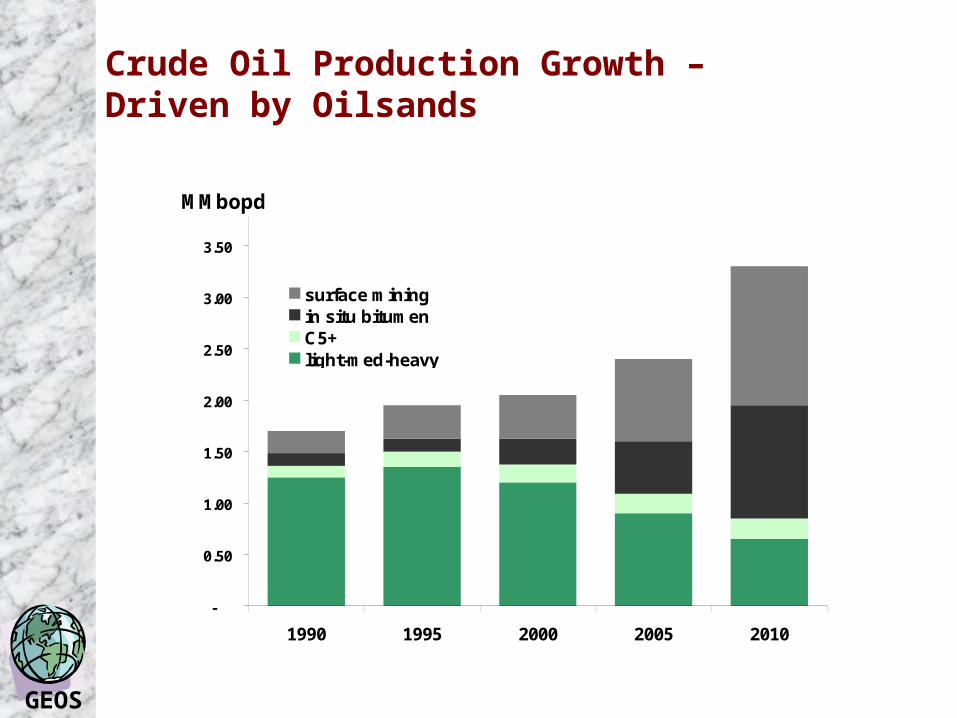
Oil production increasing, but heavier barrel— Light oil in decline; except offshore Newfoundland— Heavy oil and steam-assisted in situ bitumen— Oil sands mining— Upgraded & synthetic crude oil exported
GEOS
Gas Production >> Consumption
-
1.0
2.0
3.0
4.0
5.0
6.0
7.0
8.0
9.0
10.0
1995 1996 1997 1998 1999 2000 2001 2002 2003 2004 2005
Tcf per year
Canadian exports to US
Canadian domestic consumption
GEOS
Canadian Crude Oil…Production, Consumption & Exports
2.5 PRODUCTION CONSUMPTION
2.0
heavy
GROSS EXPORTS IMPORTS1.5 (ON, PQ & Atlantic)
heavy
C5+
heavy
1.0 synthetic light
NET EXPORTS
0.5 light
light heavy
light
Source: National Energy Board ; GEOS Energy Consulting
MMbopd 2001

GEOS
Resources & Supply Regions

GEOS
Resource Base Not the Problem
Increasing conventional gas Adding unconventional (deep/tight gas, CBM, oilsands) Frontier regions oil & gas Gas hydrates – commerciality 15 years away

GEOS
Gas Production & R/P RatioWCSB - Production & R/P Ratio
-
1
2
3
4
5
6
7
1975 1980 1985 1990 1995
Tcf Per year
-
5
10
15
20
25
30
35R/P ratio
Export pipe expansion& developing the treadmill
Deregulation &working off inventory
Domestic consumption
Exports
GEOS
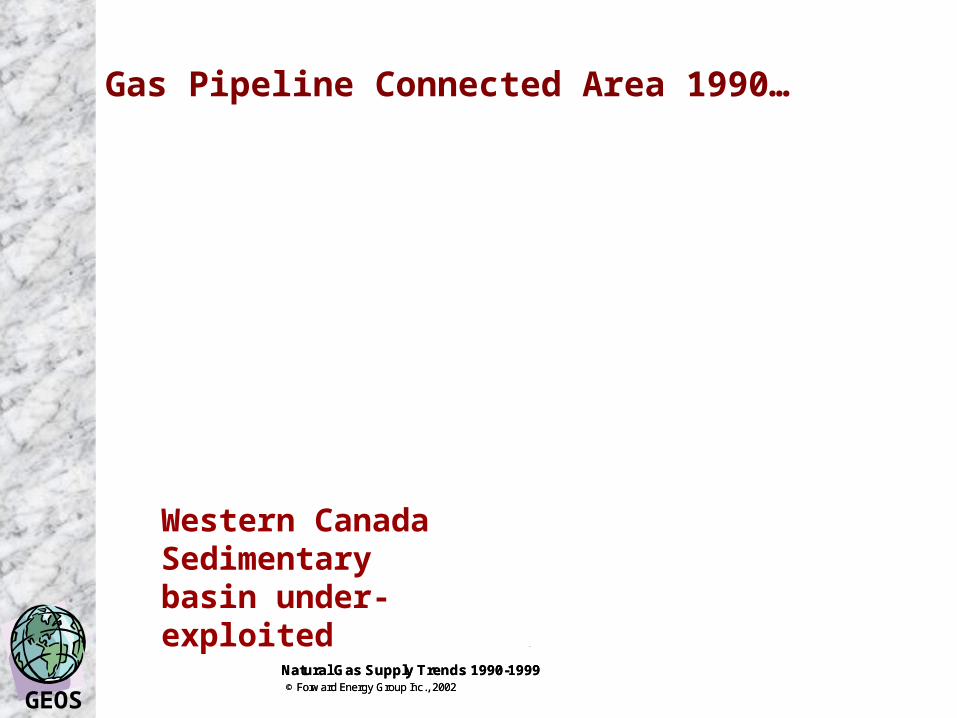
Gas Pipeline Connected Area 1990…
60ºN
90
80
6M
49ºN
120
100
110
70
60
50
80
60
70
40
50
90
100
120
110
10
1
20
30
5M
3M4M
Fort Nelson
Grande Prairie
Fort St. John
Lethbridge
Calgary
Hinton
Swift Current
Medicine Hat
Saskatoon
Lloydminster
Edmonton
Fort McMurray
110
20
10
30
40
50
70
60
90
80
100
120
126
1
Period Township Connected Onstream
No 1990-1999 Additions to Pre-1990 Township (355)Township Connected 1990 - 1999 (1925)Township Connected Pre-1990 (1943)
Natural Gas Supply Trends 1990-1999
Period TownshipConnected OnstreamEarliest Gas Production in Township
© Forward Energy Group Inc., 2002
Western Canada Sedimentary basin under-exploited
GEOS
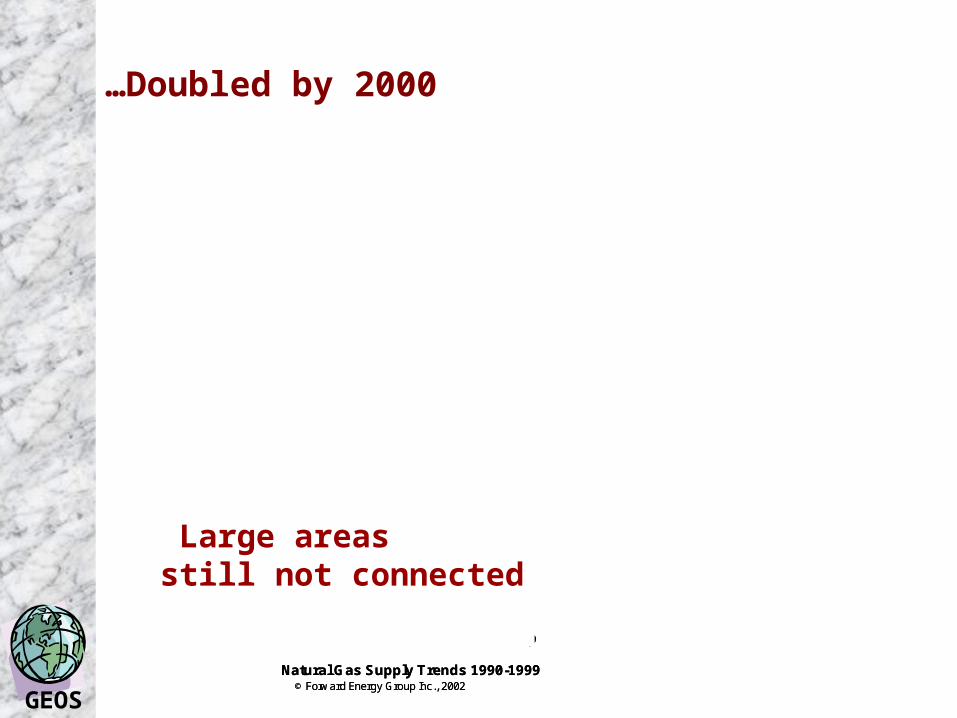
…Doubled by 2000
60ºN
90
80
6M
49ºN
120
100
110
70
60
50
80
60
70
40
50
90
100
120
110
10
1
20
30
5M
3M4M
Fort Nelson
Grande Prairie
Fort St. John
Lethbridge
Calgary
Hinton
Swift Current
Medicine Hat
Saskatoon
Lloydminster
Edmonton
Fort McMurray
110
20
10
30
40
50
70
60
90
80
100
120
126
1
Period Township Connected Onstream
No 1990-1999 Additions to Pre-1990 Township (355)Township Connected 1990 - 1999 (1925)Township Connected Pre-1990 (1943)
Natural Gas Supply Trends 1990-1999
Period TownshipConnected OnstreamEarliest Gas Production in Township
© Forward Energy Group Inc., 2002
Large areas still not connected
GEOS
Wells, Drilling Season, Rig Fleet ...
GEOS
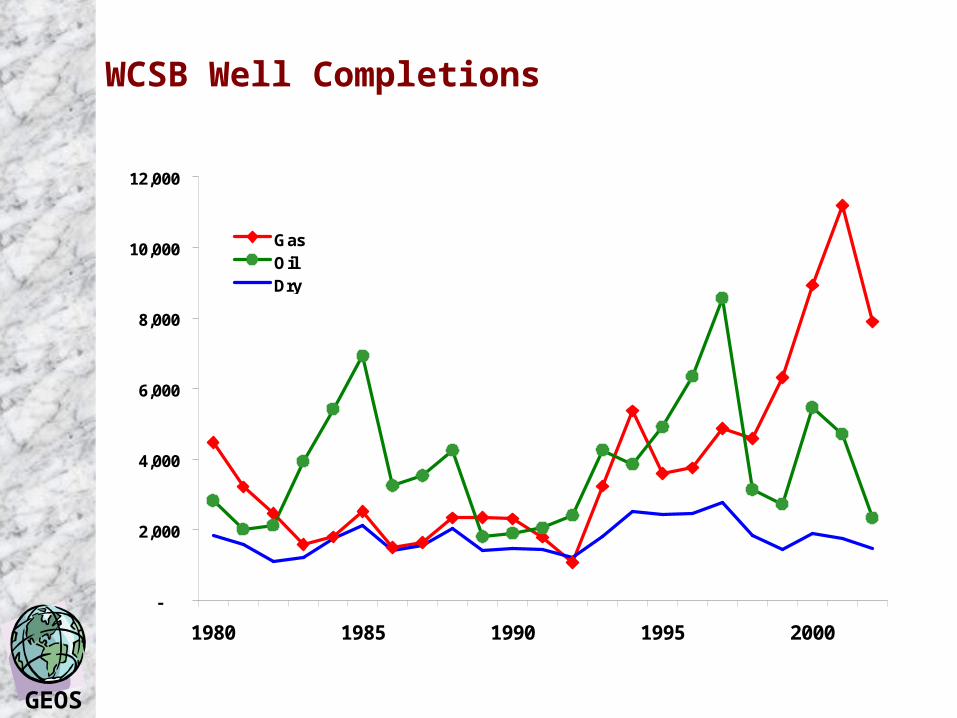
WCSB Well Completions
-
2,000
4,000
6,000
8,000
10,000
12,000
1980 1985 1990 1995 2000
GasOilDry
GEOS
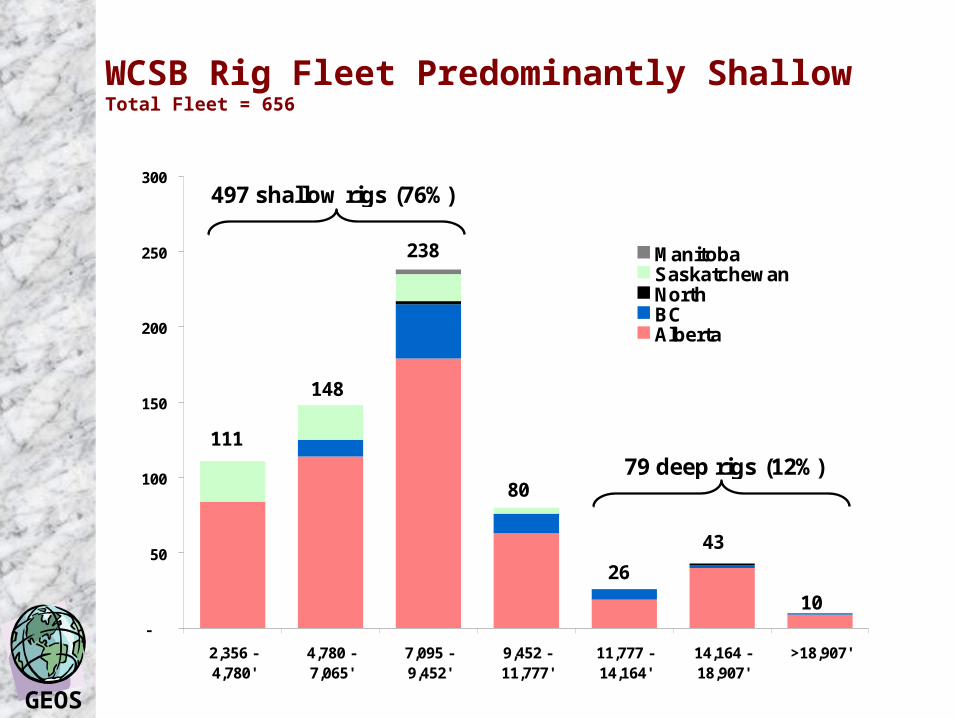
WCSB Rig Fleet Predominantly ShallowTotal Fleet = 656
-
50
100
150
200
250
300
2,356 -4,780'
4,780 -7,065'
7,095 -9,452'
9,452 -11,777'
11,777 -14,164'
14,164 -18,907'
>18,907'
ManitobaSaskatchewanNorthBCAlberta
111
148
238
80
26
43
10
79 deep rigs (12%)
497 shallow rigs (76%)

GEOS
Canada & US Rig Fleets – Depth Capability
69%
22%
7%2% 0%
30%28%
20% 19%
3%
0%
10%
20%
30%
40%
50%
60%
70%
80%
<3,750'Shallow
3,750-7,500'Medium
7,500-10,000'Deep
10,000-15,000'Very Deep
>15,000'Ultra deep
Canada
USA
GEOS
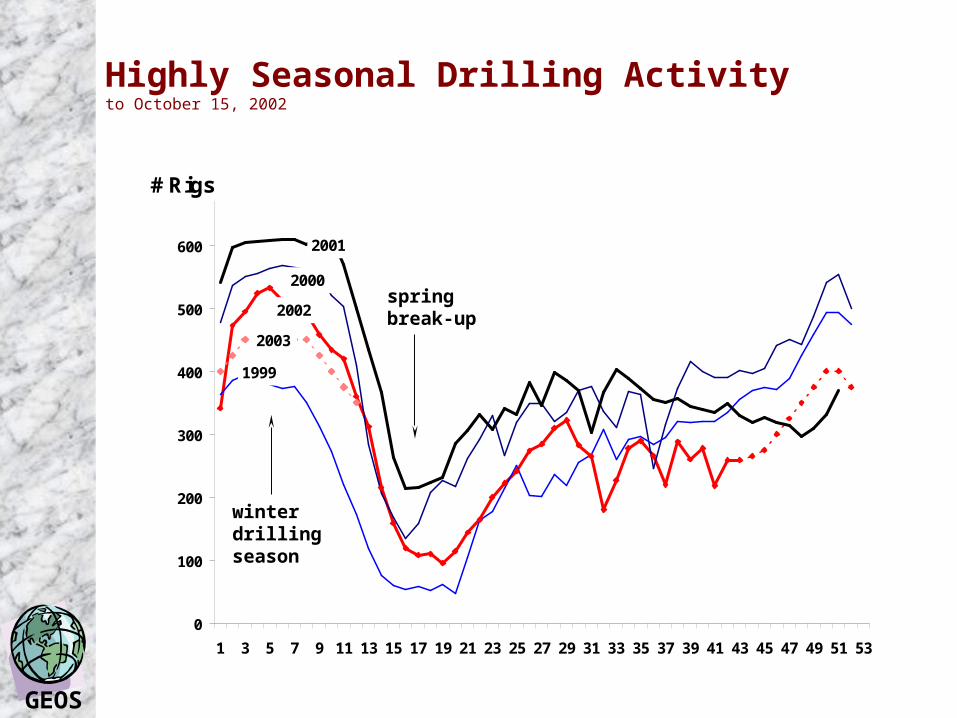
Highly Seasonal Drilling Activity to October 15, 2002
winter drilling season
spring break-up
0
100
200
300
400
500
600
700
1 3 5 7 9 11 13 15 17 19 21 23 25 27 29 31 33 35 37 39 41 43 45 47 49 51 53
# Rigs
2001
2002
2000
1999
2003
GEOS
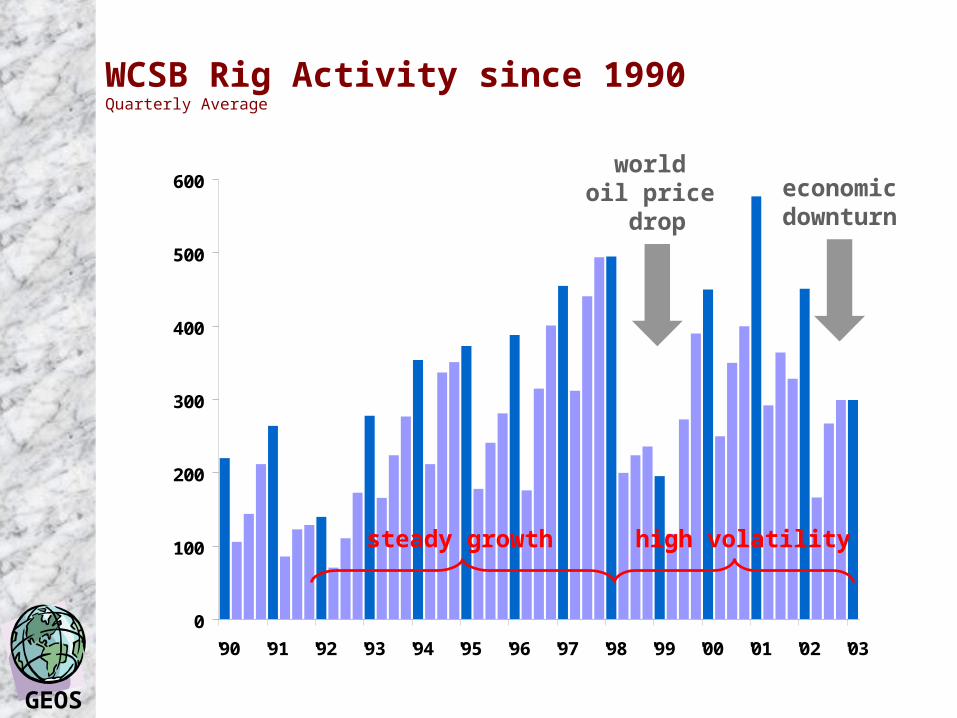
WCSB Rig Activity since 1990 Quarterly Average
0
100
200
300
400
500
600
'90 '91 '92 '93 '94 '95 '96 '97 '98 '99 '00 '01 '02 '03
world oil price
drop
economicdownturn
high volatilitysteady growth
GEOS
WCSB Natural Gas –Shallow, Deep & Tight, Structured
GEOS
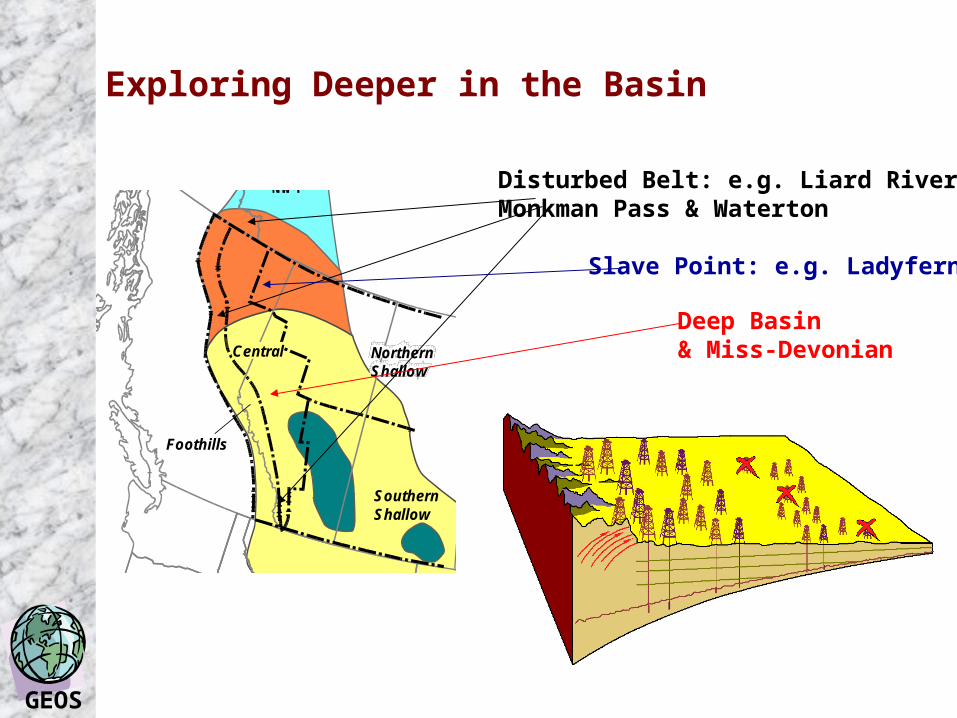
Exploring Deeper in the Basin
Undeveloped
Known Gas Area
Underdeveloped
Relatively Mature
SouthernNWT
SouthernShallow
Central NorthernShallow
Foothills
Disturbed Belt: e.g. Liard River, Monkman Pass & Waterton
Deep Basin & Miss-Devonian
Slave Point: e.g. Ladyfern

GEOS
Annual Decline Rate Flattened Out
Western Canada Region-Wide Annual Decline Rate
15.9%
-1.2%
9.5% 9.8%
14.2%
13.8% 14.0%
16.9% 16.8%18.0%
-5%
0%
5%
10%
15%
20%
25%
1990 1995 2000 2005
Percent Decline
Increase from 10% in early 90sto >15% by 2000then slower increase
GEOS
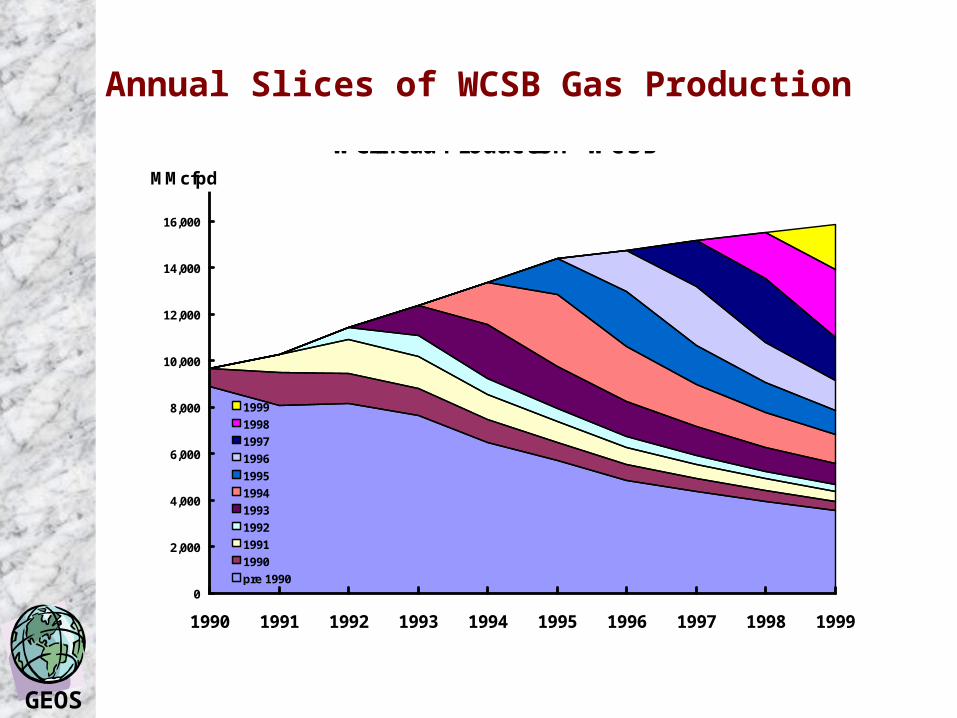
Annual Slices of WCSB Gas Production
Wellhead Production - WCSB
0
2,000
4,000
6,000
8,000
10,000
12,000
14,000
16,000
18,000
1990 1991 1992 1993 1994 1995 1996 1997 1998 1999
MMcfpd
1999
1998
1997
1996
1995
1994
1993
1992
1991
1990
pre 1990
GEOS
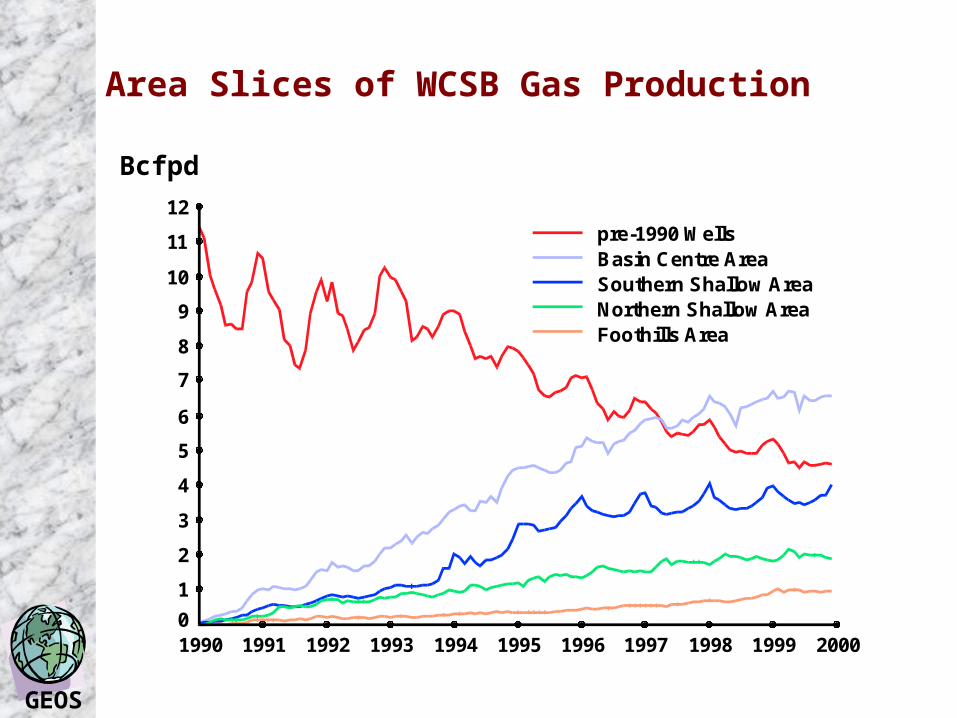
Area Slices of WCSB Gas Production
12
19921990
8
7
6
5
1
01993 1994 1995 1996 1997 1998 1999
2
3
9
10
pre-1990 WellsBasin Centre AreaSouthern Shallow AreaNorthern Shallow AreaFoothills Area
1991 2000
4
11
SalesGas
(BillionCubic
Feetper
Day)
Bcfpd
GEOS
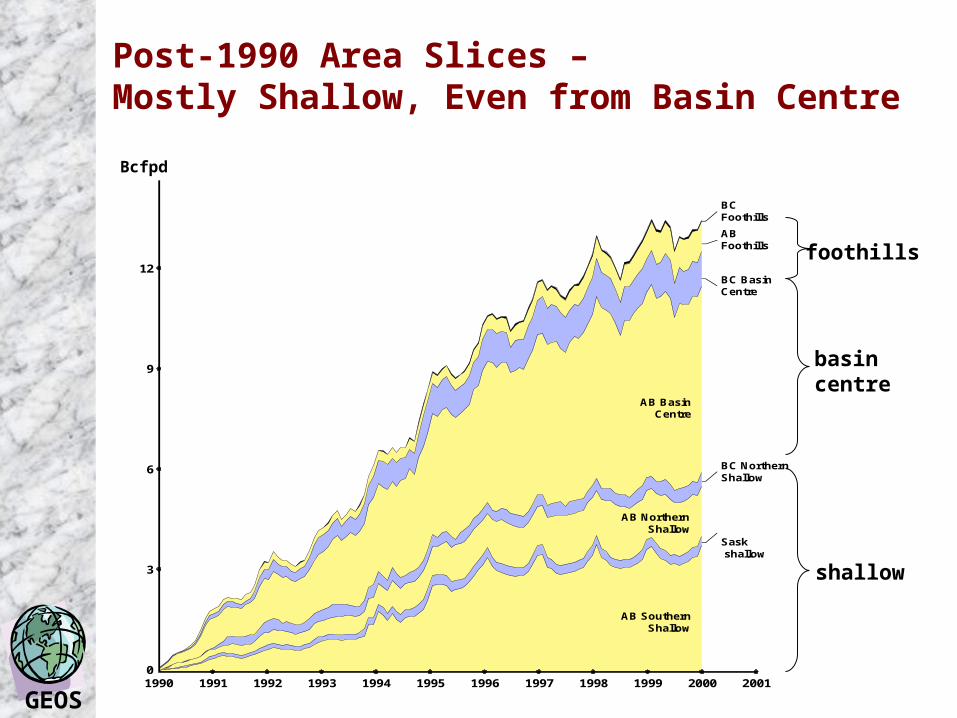
Post-1990 Area Slices – Mostly Shallow, Even from Basin Centre
BillionCubic
FeetperDay
2000
15
1999199719961994199319911990
12
01992 1995 1998
3
6
9
BCFoothills
ABFoothills
BC BasinCentre
AB BasinCentre
BC NorthernShallow
AB NorthernShallow
Sask shallow
AB SouthernShallow
2001
shallow
basin centre
foothills
Bcfpd
GEOS
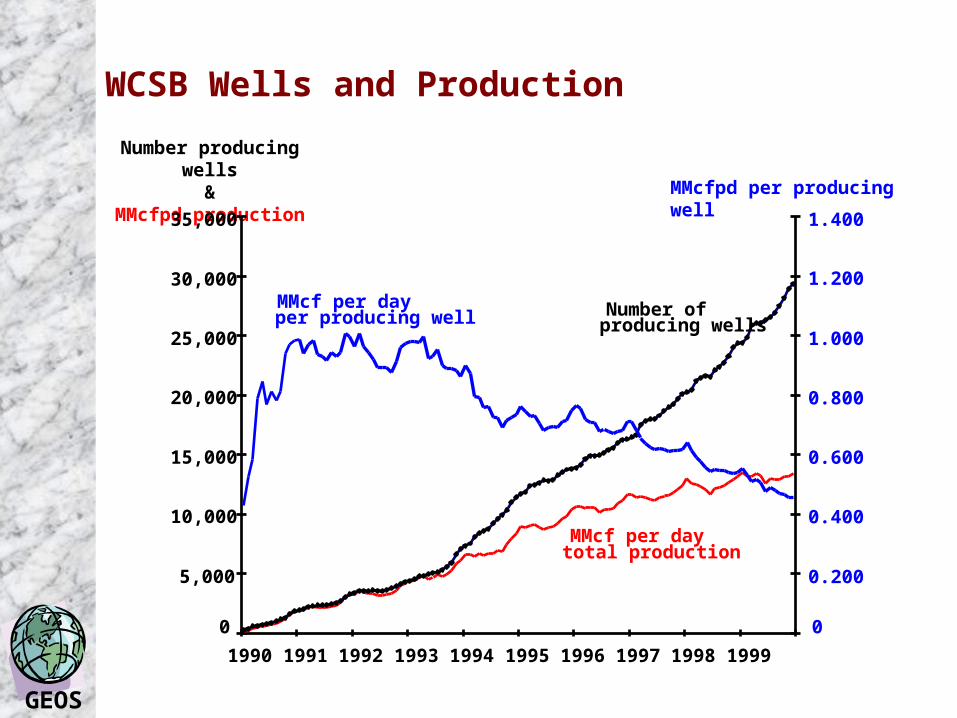
WCSB Wells and Production
Number producing wells &
MMcfpd production MMcfpd per producing well
0
5,000
10,000
15,000
20,000
25,000
30,000
35,000
1990 1991 1992 1993 1994 1995 1996 1997 1998 1999
0
0.200
0.400
0.600
0.800
1.000
1.200
1.400
Number of producing wells
MMcf per day per producing well
MMcf per day total production
GEOS
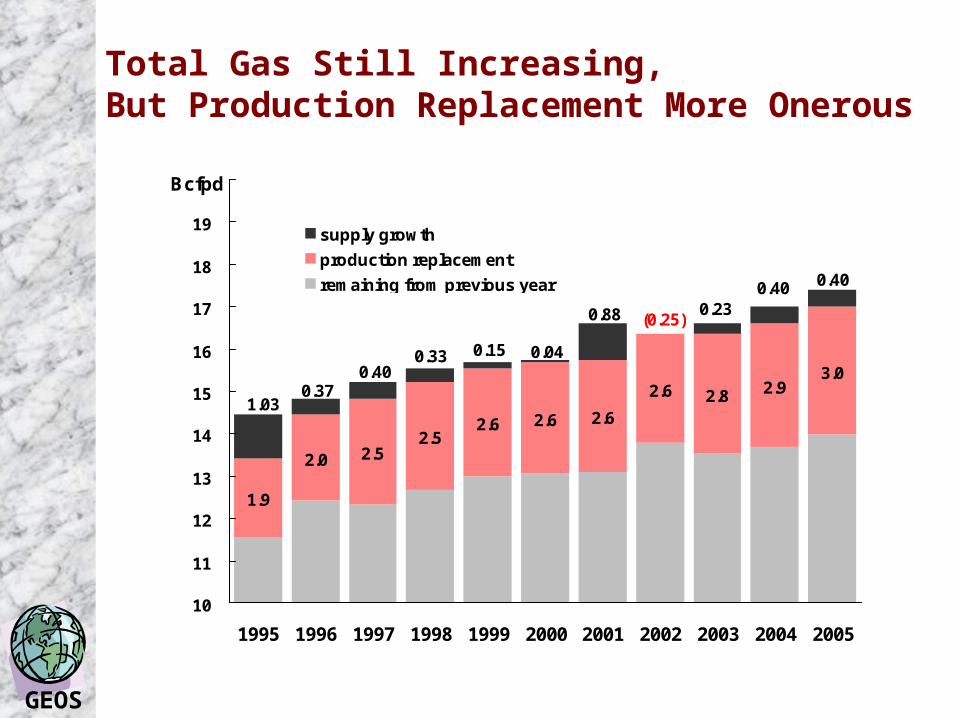
Total Gas Still Increasing,But Production Replacement More Onerous
1.9
2.0 2.52.5
2.6 2.6 2.6
2.6 2.8 2.93.0
1.03
0.40
0.040.150.330.40
0.37
0.400.23
(0.25)0.88
10
11
12
13
14
15
16
17
18
19
20
1995 1996 1997 1998 1999 2000 2001 2002 2003 2004 2005
Bcfpd
supply growth
production replacement
remaining from previous year
GEOS
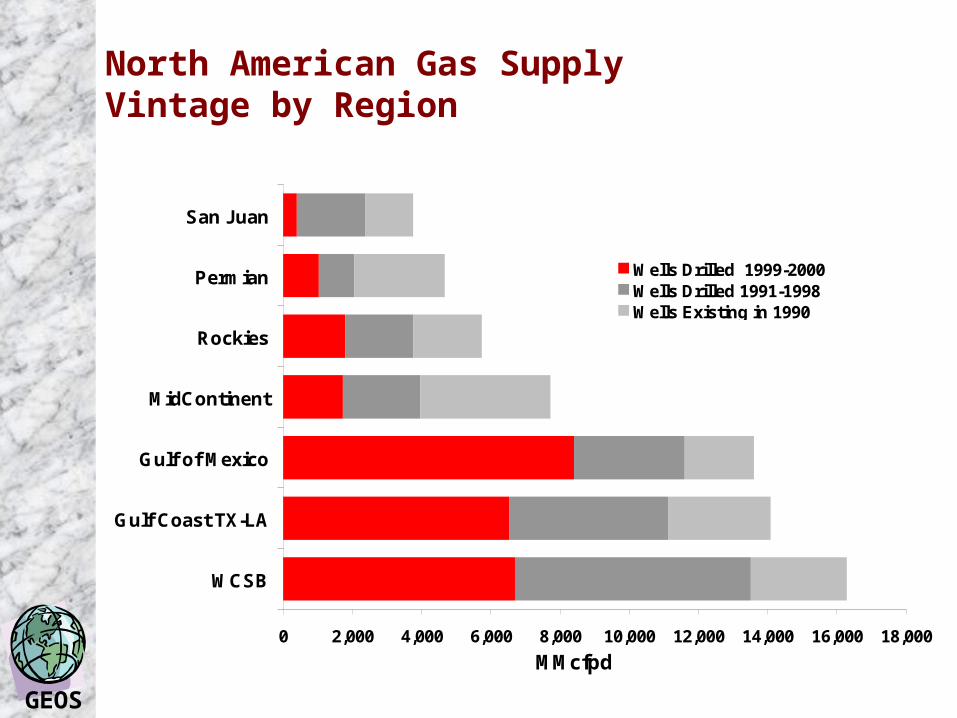
North American Gas Supply Vintage by Region
0 2,000 4,000 6,000 8,000 10,000 12,000 14,000 16,000 18,000
WCSB
Gulf Coast TX-LA
Gulf of Mexico
MidContinent
Rockies
Permian
San Juan
Wells Drilled 1999-2000Wells Drilled 1991-1998Wells Existing in 1990
MMcfpd
GEOS
Canada’s Coalbed Methane -A Sleeping Giant?
GEOS
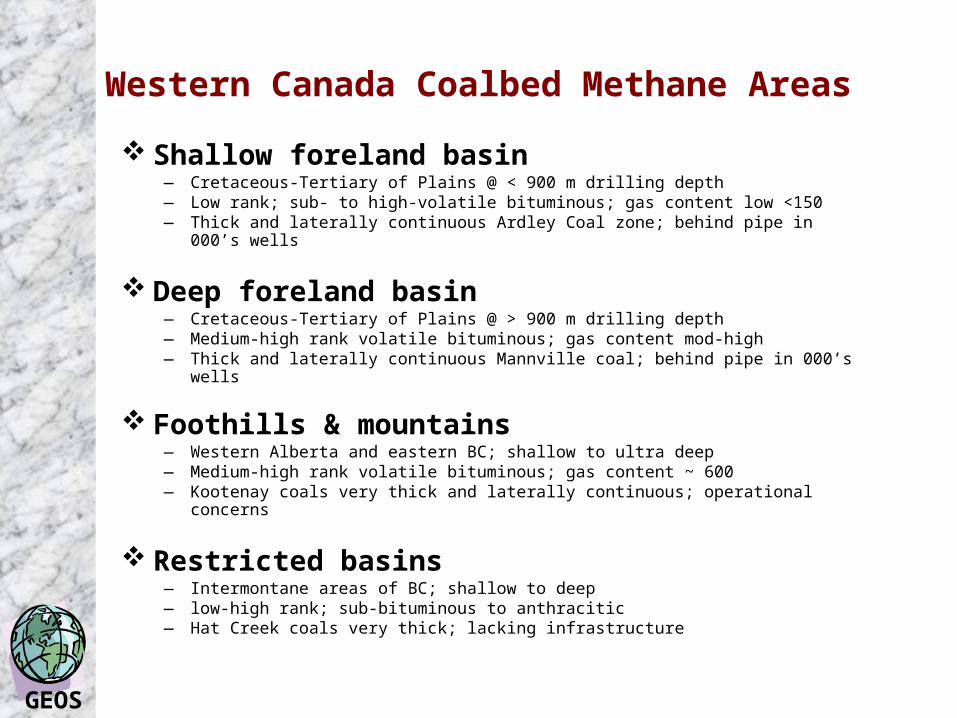
Western Canada Coalbed Methane Areas Shallow foreland basin
— Cretaceous-Tertiary of Plains @ < 900 m drilling depth— Low rank; sub- to high-volatile bituminous; gas content low <150— Thick and laterally continuous Ardley Coal zone; behind pipe in 000’s wells
Deep foreland basin— Cretaceous-Tertiary of Plains @ > 900 m drilling depth— Medium-high rank volatile bituminous; gas content mod-high— Thick and laterally continuous Mannville coal; behind pipe in 000’s wells
Foothills & mountains— Western Alberta and eastern BC; shallow to ultra deep— Medium-high rank volatile bituminous; gas content ~ 600— Kootenay coals very thick and laterally continuous; operational concerns
Restricted basins— Intermontane areas of BC; shallow to deep— low-high rank; sub-bituminous to anthracitic— Hat Creek coals very thick; lacking infrastructure
GEOS
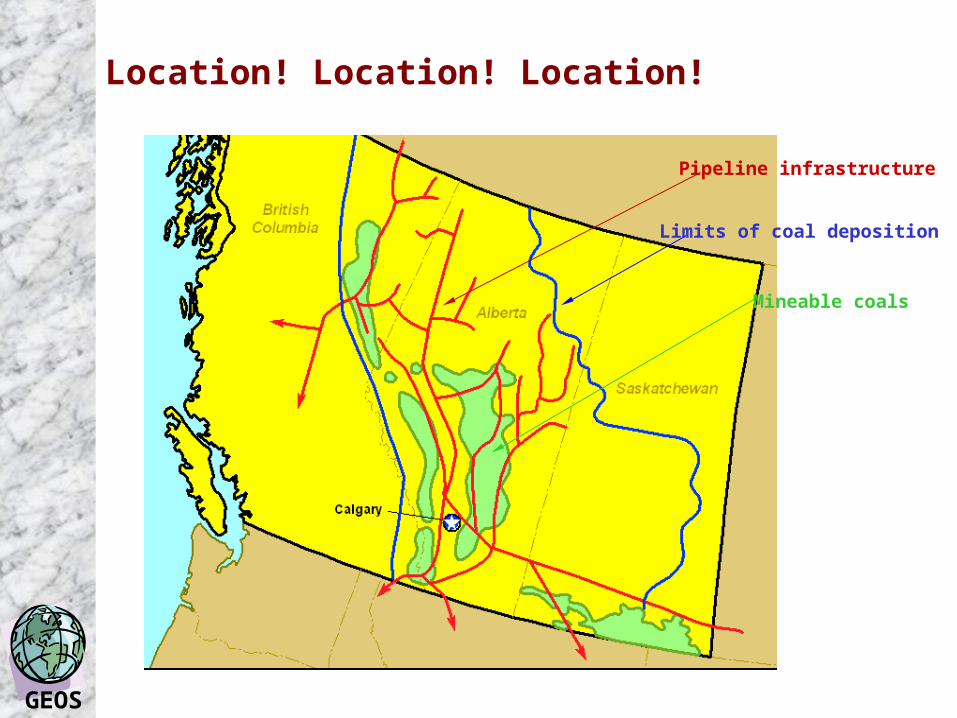
Location! Location! Location!
Limits of coal deposition
Mineable coals
Pipeline infrastructure
GEOS
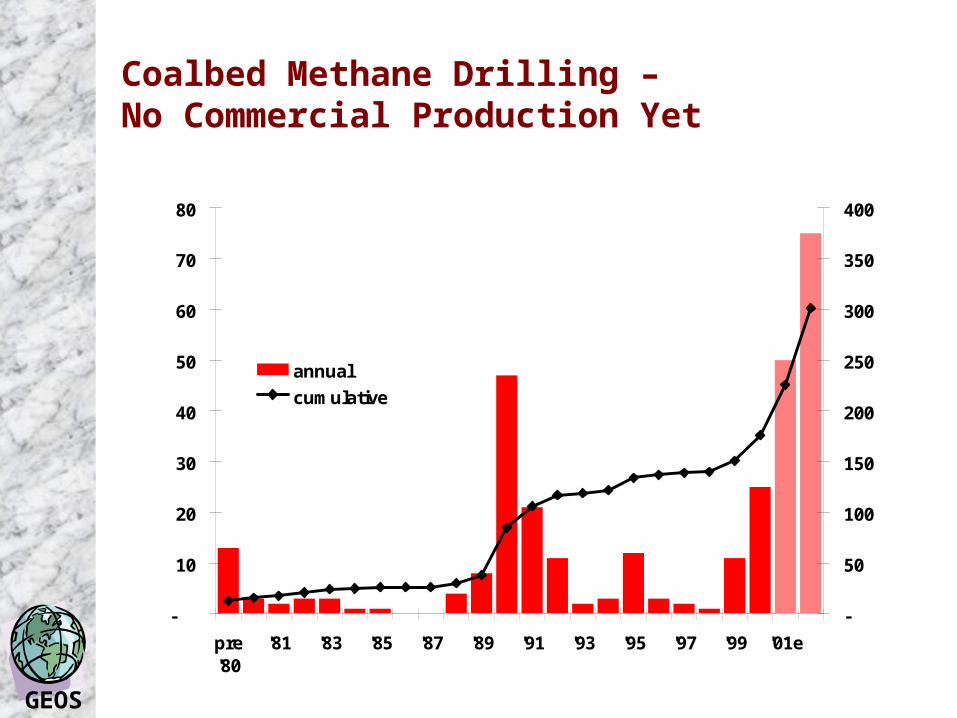
Coalbed Methane Drilling – No Commercial Production Yet
-
10
20
30
40
50
60
70
80
pre'80
'81 '83 '85 '87 '89 '91 '93 '95 '97 '99 '01e
-
50
100
150
200
250
300
350
400
annual
cumulative
GEOS
Western Canada OilsandsThe Future is Now!
GEOS
Crude Oil Production Growth – Driven by Oilsands
-
0.50
1.00
1.50
2.00
2.50
3.00
3.50
4.00
1990 1995 2000 2005 2010
MMbopd
surface miningin situ bitumen C5+ light-med-heavy
GEOS
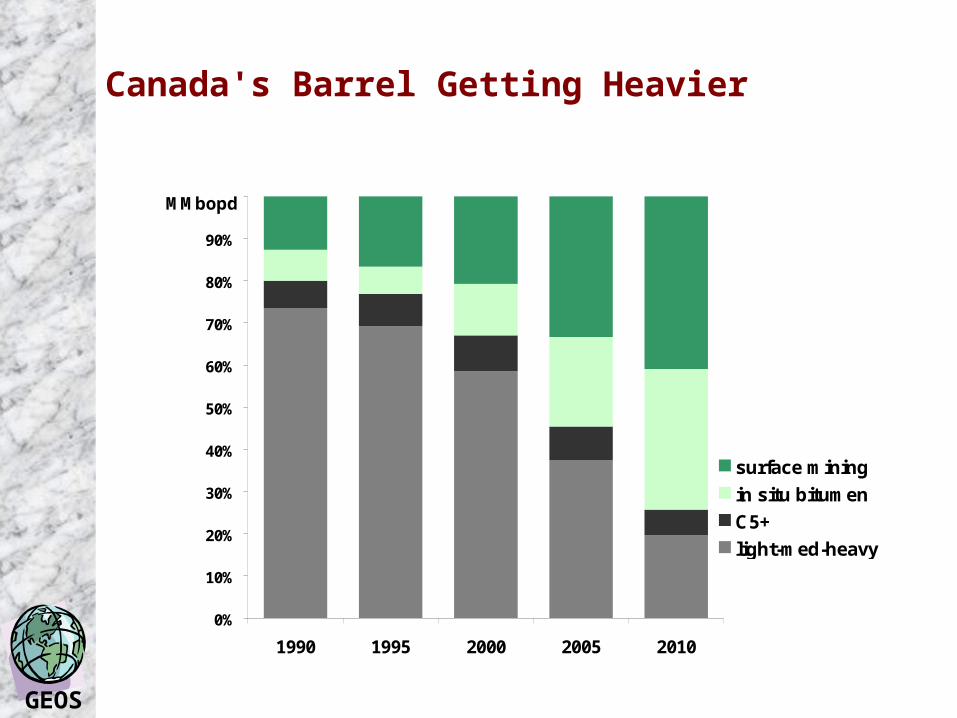
Canada's Barrel Getting Heavier
0%
10%
20%
30%
40%
50%
60%
70%
80%
90%
100%
1990 1995 2000 2005 2010
MMbopd
surface mining
in situ bitumen
C5+
light-med-heavy

GEOS
Oilsands Mining Capacity
-
250
500
750
1,000
1,250
1,500
1999 2000 2001 2002 2003 2004 2005 2006 2007 2008 2009 2010
Mbopd
OthersShellSyncrudeSuncor

GEOS
Diluent requirements –Lagging in situ Bitumen Production
-
0.25
0.50
0.75
1.00
1.25
1.50
1990 1995 2000 2005 2010
MMbopd
in situ bitumen production
C5+ production
GEOS
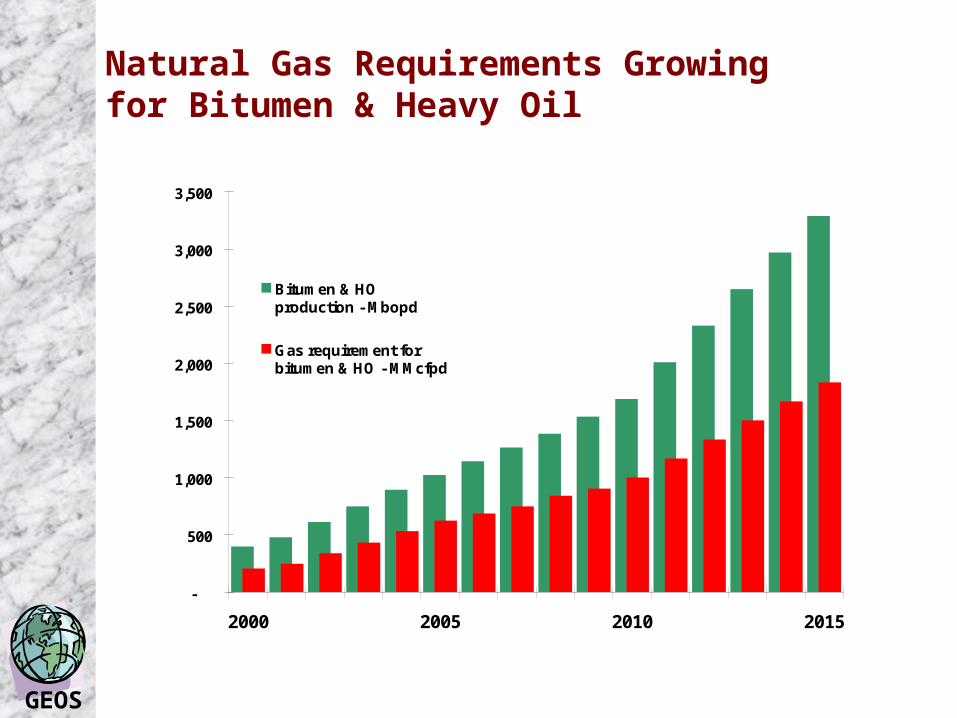
Natural Gas Requirements Growingfor Bitumen & Heavy Oil
-
500
1,000
1,500
2,000
2,500
3,000
3,500
2000 2005 2010 2015
Bitumen & HOproduction - Mbopd
Gas requirement forbitumen & HO - MMcfpd
GEOS
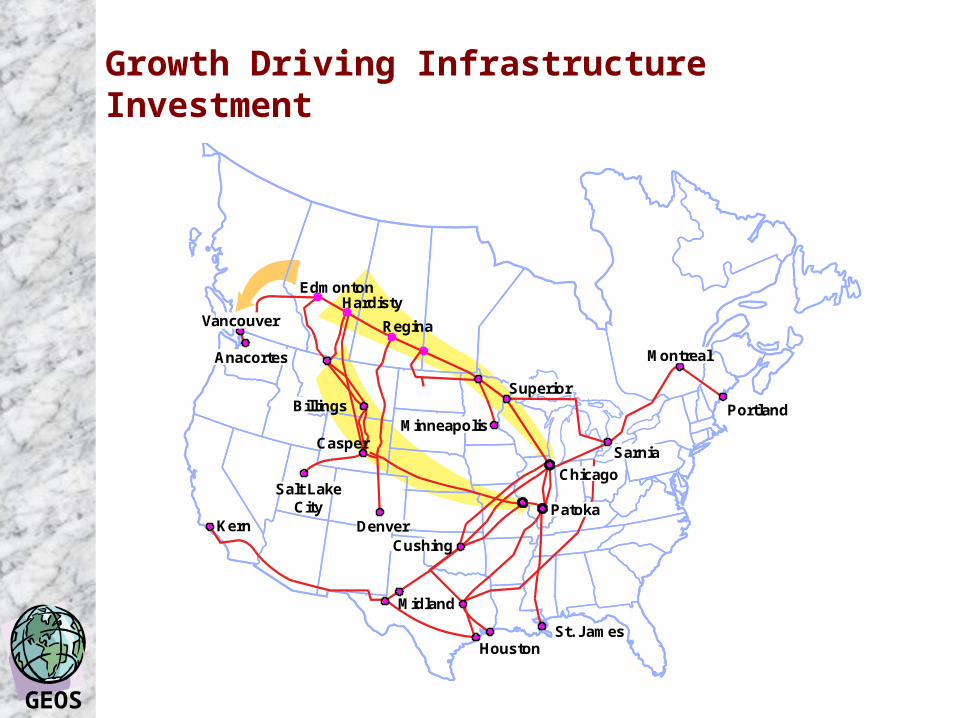
Growth Driving Infrastructure Investment
EdmontonHardisty
Regina
Portland
St. JamesHouston
Midland
Kern
Casper
Salt LakeCity
Superior
Montreal
MinneapolisBillings
Vancouver
Anacortes
DenverCushing
Patoka
Chicago
Sarnia
GEOS
Canadian Frontier Supply Regions…
GEOS
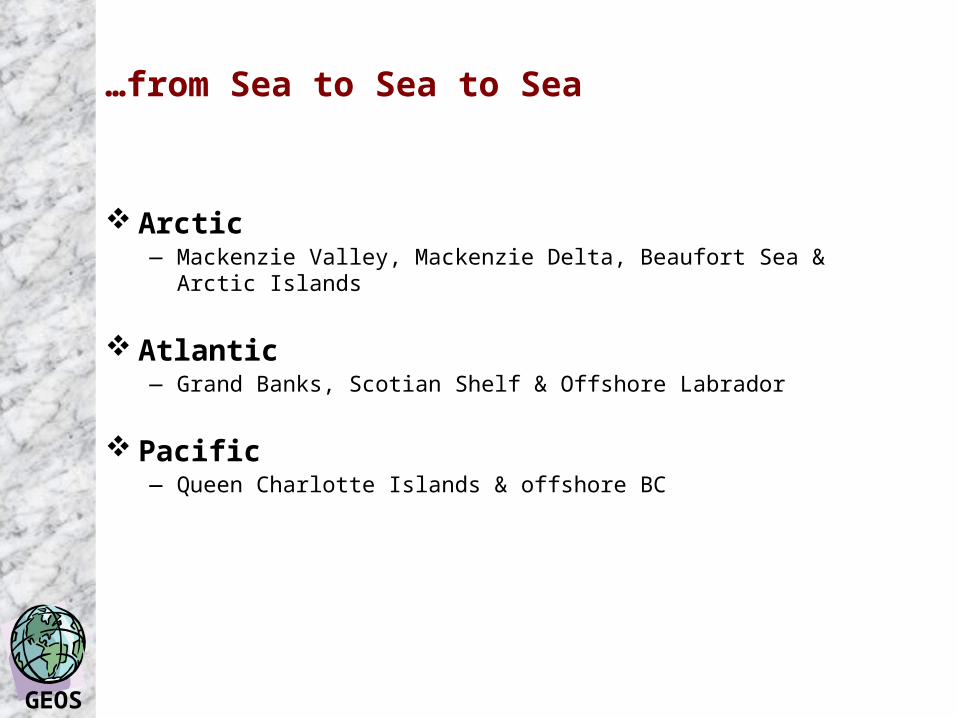
…from Sea to Sea to Sea
Arctic— Mackenzie Valley, Mackenzie Delta, Beaufort Sea & Arctic Islands
Atlantic— Grand Banks, Scotian Shelf & Offshore Labrador
Pacific— Queen Charlotte Islands & offshore BC
GEOS
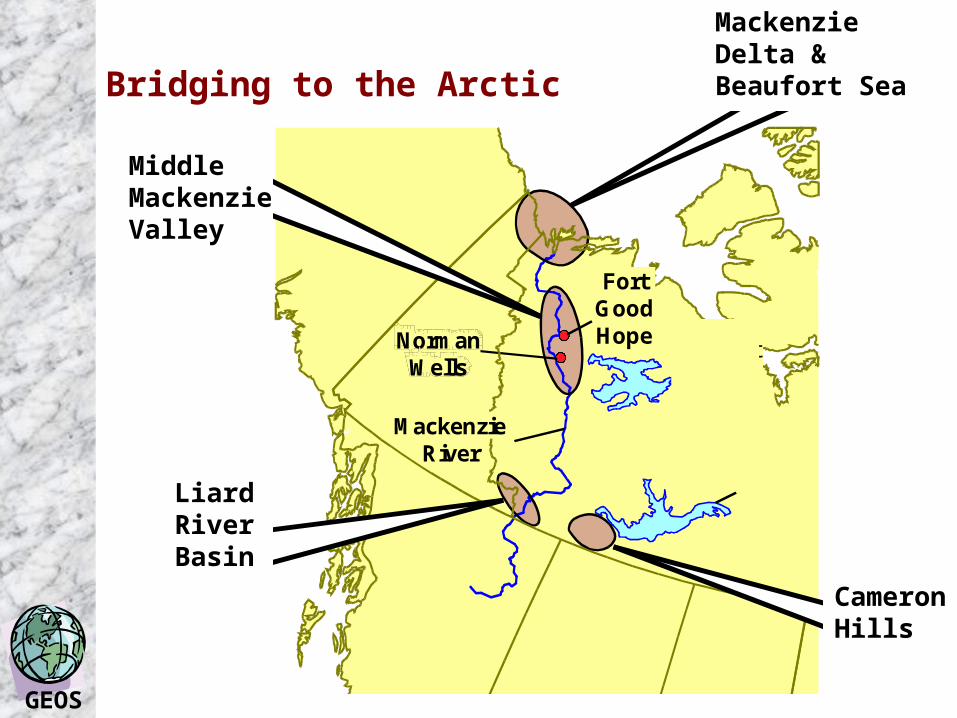
Bridging to the Arctic
NormanWells
GreatSlaveLake
NorthwestTerrotories
GreatBearLake
FortGoodHope
MackenzieRiver
Fort Liard
ParamountCanadian Forest Oil
BP Amoco CanadaPanCandian Petroleum
Suncor Energy
Chevron CanadaRanger Oil
148,15646,241
27,54013,025
5,622
5,1105,090
Undiscovered Potential: 20 Tcf
Beaufort Sea and Mackenzie Delta
BP Amoco CanadaAEC
Talisman EnergyPetro-Canada
Burlington Ranada
Imperial OilGulf Canada
Shell CanadaSuncor Energy
Ikhil ResourcesChevron Canada
425,632214,088
175,810147,822
145,629
100,73792,838
20,5734,843
3,1322,738
Undiscovered Potential: 45 Tcf
Mackenzie Valley
Grand River ResourcesAEC
Ranger OilFoxboro
Inter. Frontier Res.
Canadian AbraxasMurphy Oil
Petro-CanadaBP Amoco Canada
Imperial Oil
352,467262,093
139,63175,196
71,816
46,73834,204
29,6879,391
3,603
Undiscovered Potential: 5–10 Tcf
Cameron Hills
ParamountPhillips
BP Amoco Canada
34,4893,771
321
Undiscovered Potential: 1 Tcf
Mackenzie Delta & Beaufort Sea
Middle Mackenzie Valley
LiardRiverBasin
CameronHills
GEOS
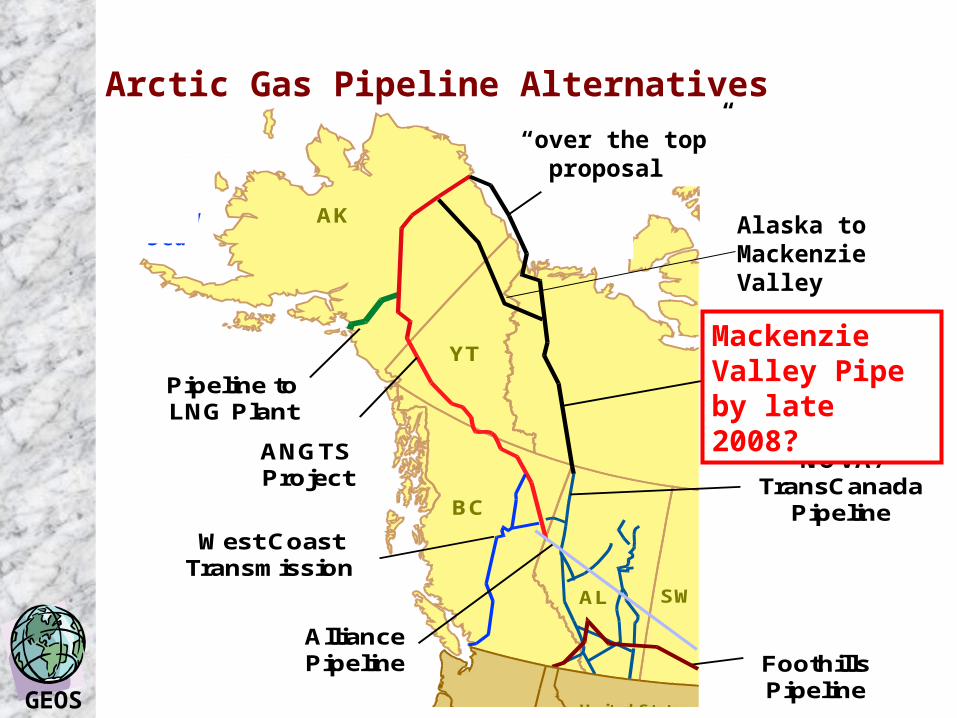
Arctic Gas Pipeline Alternatives
Pipeline toLNG Plant
ARCProposal
ANGTSProject
MackenzieProposal
PacificOcean
Gulf ofAlaska
BeringSea
BeaufortSea
ArcticOcean
AK
BC
AL
AlliancePipeline Foothills
Pipeline
West CoastTransmission
NOVA/TransCanada
Pipeline
United Statesof America
SW
YT
Alaska toMackenzie Valley
“over the top” proposal
Mackenzie Valley Pipe by late 2008?
GEOS
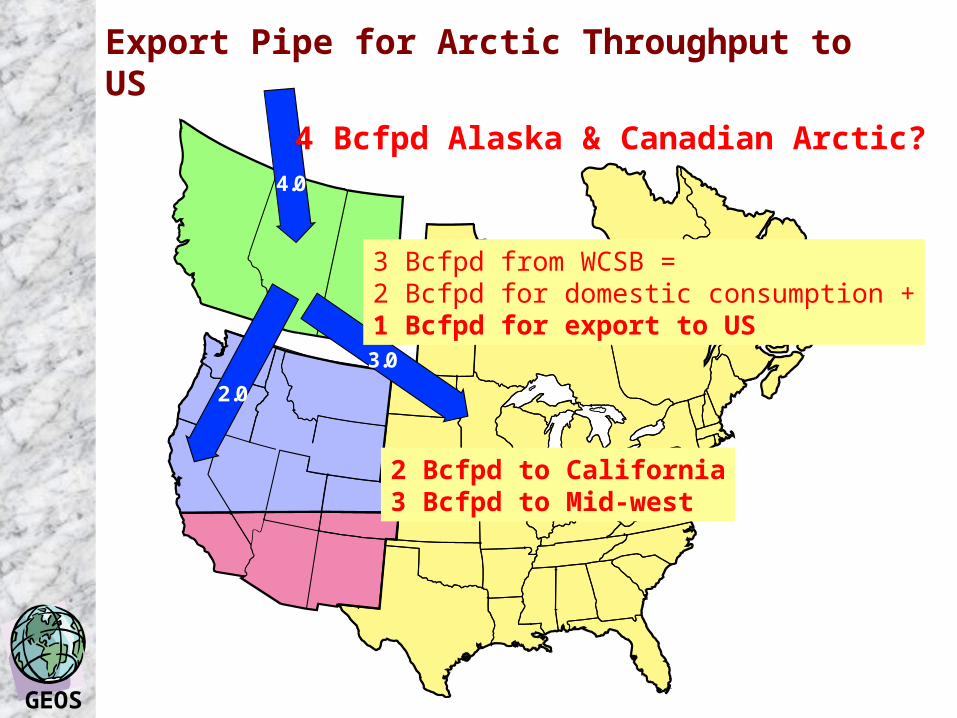
Export Pipe for Arctic Throughput to US
4.0
3.0
2.0
4 Bcfpd Alaska & Canadian Arctic?
3 Bcfpd from WCSB =2 Bcfpd for domestic consumption +1 Bcfpd for export to US
2 Bcfpd to California3 Bcfpd to Mid-west

GEOS
Atlantic Canada Geography
SCOTIAN SHELFSCOTIAN SHELF
GRAND BANKS GRAND BANKS Sable IslandSable Island
150 km150 km
HiberniaHibernia
Terra NovaTerra NovaSt. JohnSt. John
HalifaxHalifax
CharlottetownCharlottetown
St. John’sSt. John’s
SCOTIAN SHELFSCOTIAN SHELF
GRAND BANKS GRAND BANKS Sable IslandSable IslandSable IslandSable Island
150 km150 km150 km150 km
HiberniaHiberniaHiberniaHibernia
Terra NovaTerra NovaTerra NovaTerra NovaSt. JohnSt. JohnSt. JohnSt. John
HalifaxHalifaxHalifaxHalifax
CharlottetownCharlottetownCharlottetownCharlottetown
St. John’sSt. John’sSt. John’sSt. John’s
GEOS
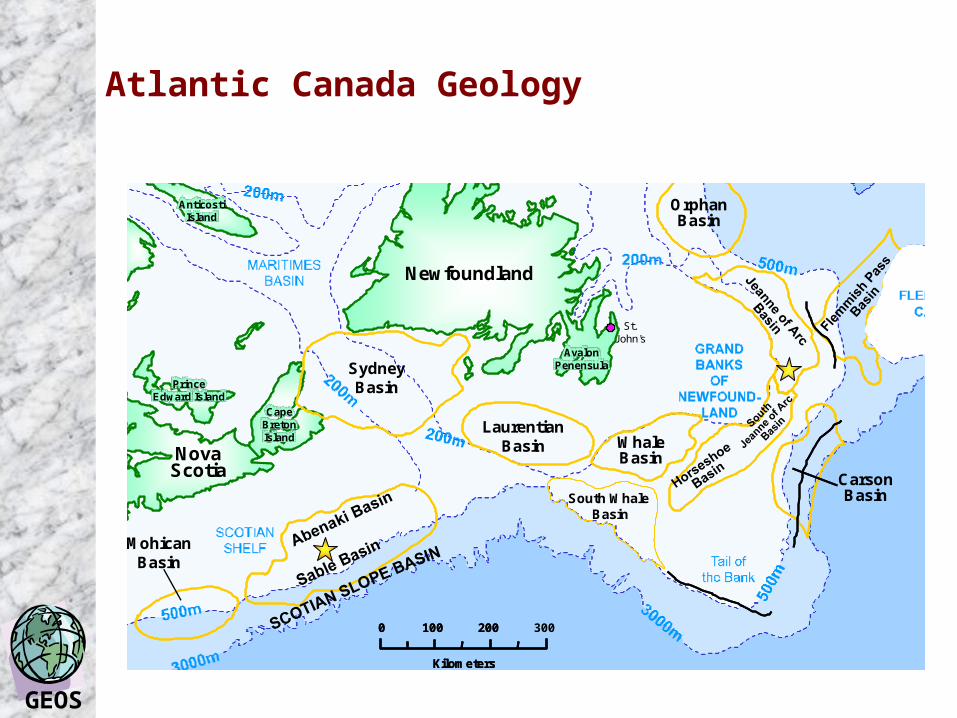
Atlantic Canada Geology
Kilometers
0 100 200 300
NovaScotia
PrinceEdward Island
CapeBretonIsland
AnticostiIsland
Newfoundland
AvalonPenensula
St.John's
MohicanBasin
SydneyBasin
LaurentianBasin Whale
Basin
South Whale Basin
OrphanBasin
CarsonBasin
Kilometers
0 100 200
Kilometers
0 100 200 300
NovaScotia
PrinceEdward Island
CapeBretonIsland
AnticostiIsland
Newfoundland
AvalonPenensula
St.John's
MohicanBasin
SydneyBasin
LaurentianBasin Whale
Basin
South Whale Basin
OrphanBasin
CarsonBasin
GEOS
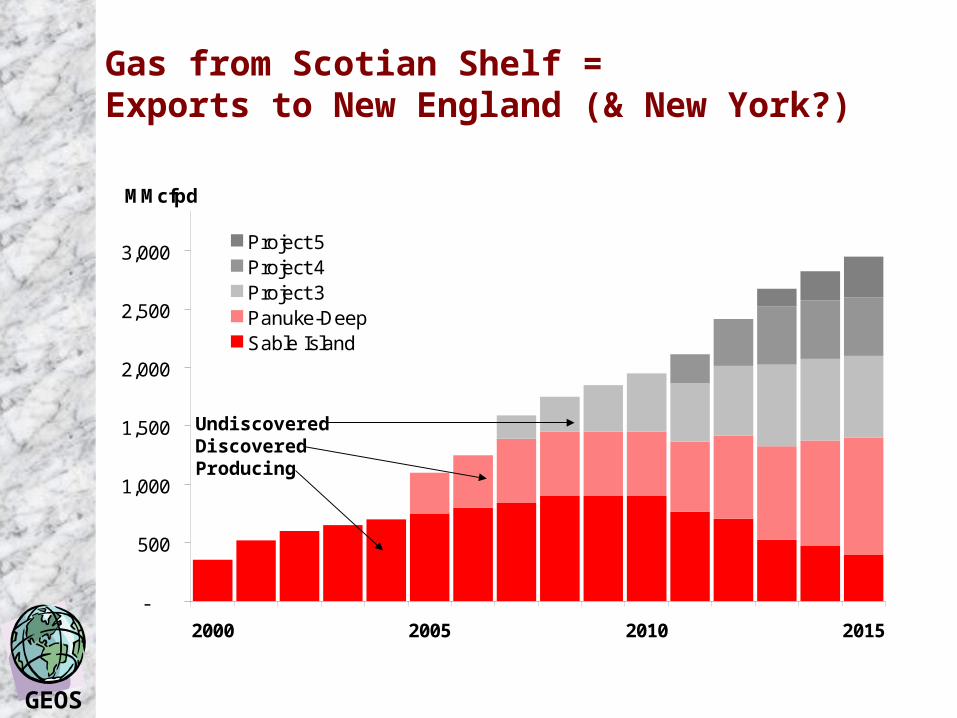
Gas from Scotian Shelf = Exports to New England (& New York?)
-
500
1,000
1,500
2,000
2,500
3,000
3,500
2000 2005 2010 2015
MMcfpd
Project 5Project 4Project 3Panuke-DeepSable Island
UndiscoveredDiscoveredProducing
GEOS
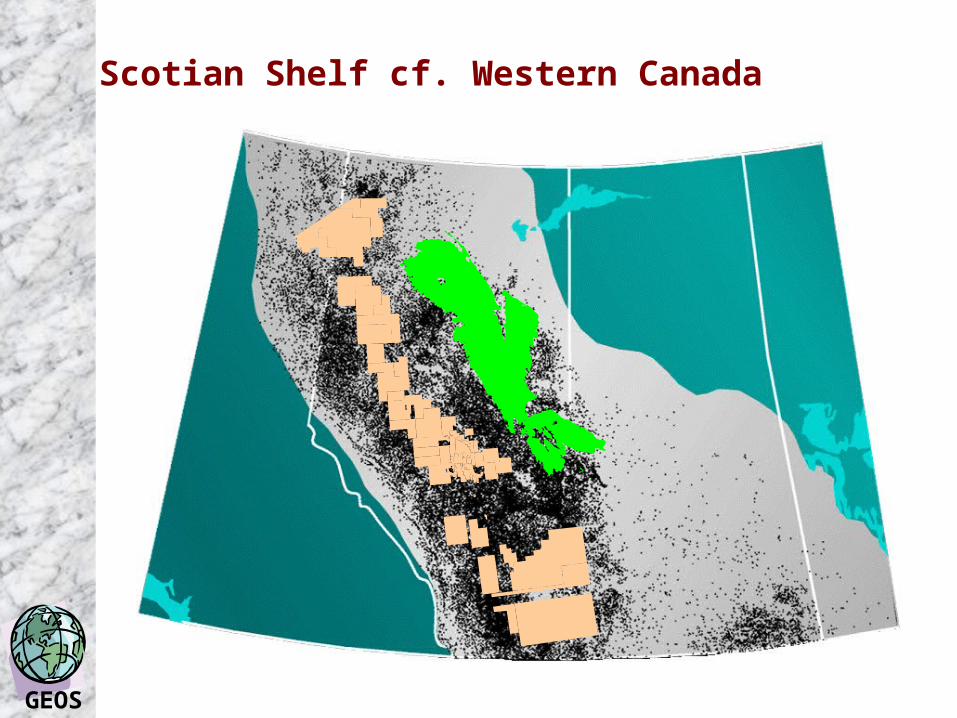
Scotian Shelf cf. Western Canada
GEOS
Canadian Oil & Gas into US

GEOS
4 Bcfpd More Canadian Gas by 2010?(1-2 Bcfpd more by 2015?)
154350
477
905
1,4501,660
1,829
2,324 2,420
3,500
(1,102) (827) (104)
(2,000)
(1,500)
(1,000)
(500)
-
500
1,000
1,500
2,000
2,500
3,000
3,500
4,000
Mid
Co
nti
nen
t
San
Ju
an
Per
mia
n
Wes
t C
oas
t
Eas
tern
US
Gu
lf C
oas
t
Un
des
ig L
48
Sco
tian
Sh
elf
Wes
tern
Can
ada
Gu
lf o
f M
exic
o
Ro
ckie
s
LN
G
Arc
tic
MMcfpd
~1,000
GEOS
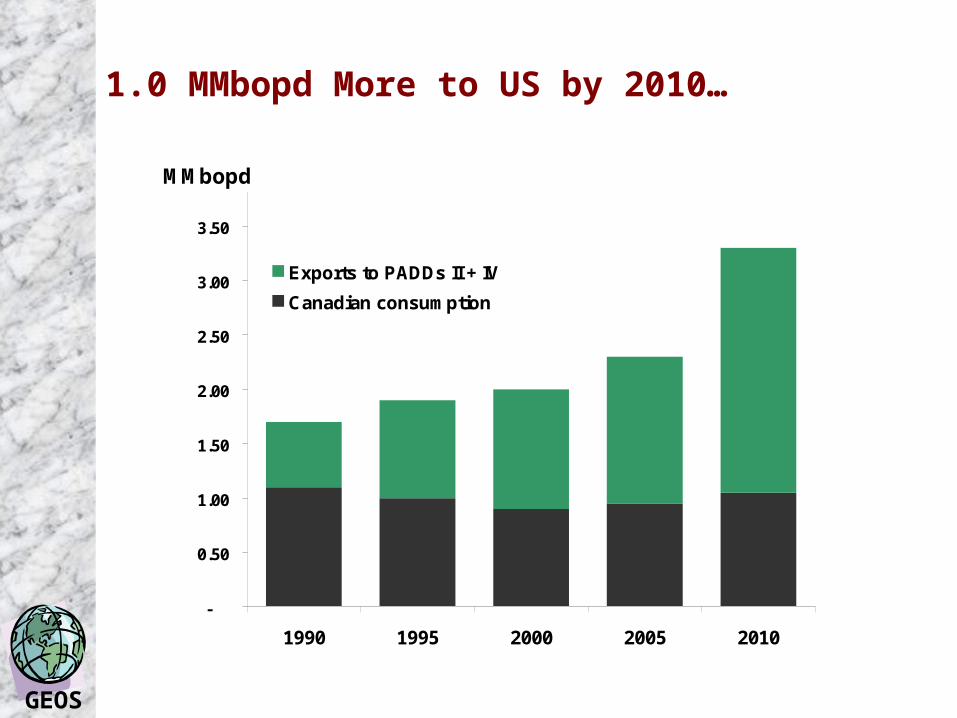
1.0 MMbopd More to US by 2010…
-
0.50
1.00
1.50
2.00
2.50
3.00
3.50
4.00
1990 1995 2000 2005 2010
MMbopd
Exports to PADDs II + IV
Canadian consumption
GEOS
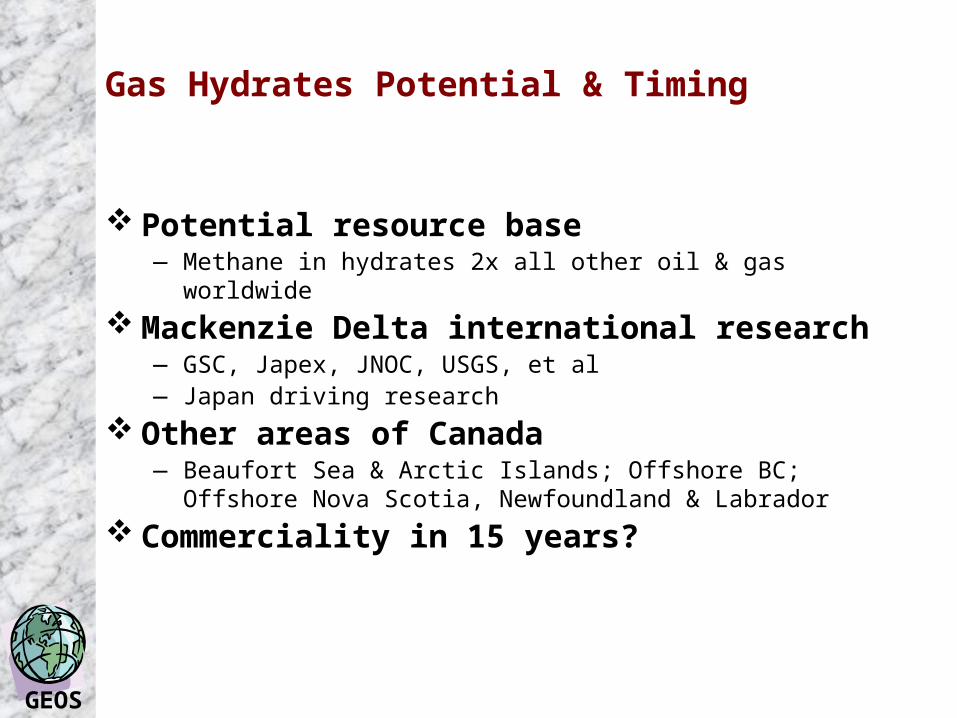
Gas Hydrates Potential & Timing
Potential resource base — Methane in hydrates 2x all other oil & gas worldwide
Mackenzie Delta international research — GSC, Japex, JNOC, USGS, et al— Japan driving research
Other areas of Canada— Beaufort Sea & Arctic Islands; Offshore BC; Offshore Nova Scotia,
Newfoundland & Labrador
Commerciality in 15 years?
GEOS
Future of Canadian E&P Activity
GEOS
Impacting the Pace of Canada’s E&P
Structure of Canada’s E&P sector — M&A: “invasion of the body snatchers”; Mid-size companies swallowed-up— Limited real exploration by US companies in Canada— “Start-ups” small and privately funded— Producing assets in Royalty Income Trusts — Cash flow not fully reinvested; Large dividends to shareholders
Economic recession & recovery in US— Market slowdown; Gas demand restructured
Infrastructure requirements— Arctic gas through Alberta to Midwest & California— Scotian shelf gas to Boston & New York— refineries & upgraders— Canadian producers lack vertical integration
Politics - the Kyoto quagmire— Doing some of the right things for the wrong reasons?