georgia: selected issues - imf · international monetary fund georgia selected issues prepared by...
TRANSCRIPT
© 2006 International Monetary Fund May 2006
IMF Country Report No. 06/170
Georgia: Selected Issues
This Selected Issues paper for Georgia was prepared by a staff team of the International Monetary Fund as background documentation for the periodic consultation with the member country. It is based on the information available at the time it was completed on March 17, 2006. The views expressed in this document are those of the staff team and do not necessarily reflect the views of the government of Georgia or the Executive Board of the IMF. The policy of publication of staff reports and other documents by the IMF allows for the deletion of market-sensitive information.
To assist the IMF in evaluating the publication policy, reader comments are invited and may be sent by e-mail to [email protected].
Copies of this report are available to the public from
International Monetary Fund ● Publication Services 700 19th Street, N.W. ● Washington, D.C. 20431
Telephone: (202) 623 7430 ● Telefax: (202) 623 7201 E-mail: [email protected] ● Internet: http://www.imf.org
Price: $15.00 a copy
International Monetary Fund
Washington, D.C.

INTERNATIONAL MONETARY FUND
GEORGIA
Selected Issues
Prepared by Susan M. George, Andreas Billmeier, Shuang Ding, Konstantin Fedorov (all MCD), Irene Yackovlev (FAD), and Joerg Zeuner (PDR)
Approved by Middle East and Central Asia Department
March 17, 2006
Contents Page
I. Financing Economic Development in Georgia .............................................................. 4 A. Introduction ....................................................................................................... 4 B. Recent Financial Sector Developments in Georgia........................................... 6 C. Why Has Financial Development in Georgia Lagged?................................... 12 D. Is Georgia Prepared for a Catch-Up? .............................................................. 14 E. Conclusions ..................................................................................................... 18 References.............................................................................................................................. 19 II. Recent Surveys on the Business Environment ............................................................ 21 A. Introduction ..................................................................................................... 21 B. Surveys of 2005............................................................................................... 21 C. BEEPS ............................................................................................................. 22 D. Doing Business................................................................................................ 23 E. Global Competitiveness................................................................................... 24 F. Nations in Transit............................................................................................. 25 G. Economic Freedom ......................................................................................... 26 H. Corruption Perception ..................................................................................... 26 I. Reporters Without Borders .............................................................................. 27 J. Conclusions ..................................................................................................... 28 References.............................................................................................................................. 29 III. Measuring the Shadow Economy: The Impact of the Georgian Anti-Corruption Drive ............................................................................................................................ 30 A. Introduction ..................................................................................................... 30 B. Background: Driving Out Endemic Corruption .............................................. 31 C. Shadow Economy: Survey-Based Estimates................................................... 32 D. Shadow Economy: The Demand for Cash ...................................................... 35 E. Conclusions ..................................................................................................... 38
- 2 -
References.............................................................................................................................. 40 IV. Legal Entities of Public Law in Georgia: Accountability and Reform........................ 41 A. Current Situation ............................................................................................. 41 B. Fiscal Implications and Risks........................................................................... 42 C. International Experiences ................................................................................ 46 D. Next Steps ....................................................................................................... 47 References.............................................................................................................................. 50 V. Is Georgia Competitive?............................................................................................... 51 A. Introduction ..................................................................................................... 51 B. Recent Trends in Key Competitiveness Indicators ......................................... 52 C. Further Considerations .................................................................................... 56 D. Policy Recommendations................................................................................ 58 References.............................................................................................................................. 61
Boxes 1. Why is Financial Development Important? ................................................................... 5 2. Why and Why Now? A Survey of Leading Banks on the Recent Credit Boom.......... 12
Figures II.1. Business Environment.................................................................................................. 23 II.2. Comparison of National Institutions and Sectors......................................................... 27 II.3. Worldwide Press Freedom Index ................................................................................. 27 III.1. Georgia and Selected CIS Countries: Sales Reported for Tax Purposes, 2002 and 2005 .............................................................................................................. 32 III.2. Shadow Economy Estimates (SDS Survey Method), 2001–05 ................................... 34 III.3. Comparing Shadow Economy Estimates, 2003–05...................................................... 36 III.4. Domestic and Foreign Currency Deposits, 2001–05 ................................................... 37 IV.1 Number of LEPLs, 1999–2005 .................................................................................... 41 IV.2 Sources of Local Government Revenue, 2003–05....................................................... 45 IV.3. Vertical Fiscal Imbalance, 2003–05............................................................................. 45 V.1. Real Effective Exchange Rates, 2001–05 .................................................................... 52 V.2. Real Effective Exchange Rates for the Region, 1995–2005 ........................................ 53 V.3. Transportation Cost for a 40 ft. Container ................................................................... 54 V.4. Share in Main Trading Partners’ Import Markets, 1995Q1–2005Q1 .......................... 55 V.5. Composition of Exports, 2004 ..................................................................................... 56 Tables I.1. Selected Transition Economies: Financial Sector Development, 1996–2005 ............... 7 I.2. Financial Soundness Indicators, 2000–05.................................................................... 10 II.1. Rankings of Selected Countries, 2005 ......................................................................... 23 II.2. Georgia in a Comparative Perspective: Selected Indicators of Doing Business.......... 24 II.3. Trading Across Borders ............................................................................................... 24
- 3 -
II.4. Growth Competitiveness Index Rankings; 2005 and 2004 Comparisons.................... 25 II.5. Selected Democracy Scores, 2005 ............................................................................... 25 II.6. Economic Freedom Category....................................................................................... 26 II.7. Corruption Perception Index (CPI), 2005 .................................................................... 26 V.1. Average Monthly U.S. Dollar Wages for the Region, 1999–2004 .............................. 54 V.2. Selected Balance of Payments and Monetary Indicators, 2002–05 ............................. 57
- 4 -
I. FINANCING ECONOMIC DEVELOPMENT IN GEORGIA1
A. Introduction
1. Economic development in Georgia has gained momentum in the past five years following more than a decade of sluggish growth. Georgia’s output contracted sharply at the beginning of the transition period, owing mainly to episodes of civil unrest as well as the interruption of the chain of production and loss of traditional markets after the breakup of the Soviet Union. The economy registered a strong rebound in the mid-1990s, only to be set back by the Russian crisis in 1998. Since 2001, policies aimed at macroeconomic stability have allowed the economy to grow at almost 7 percent per year in an environment of modest inflation. After the Rose Revolution in late 2003, economic reform gained fresh momentum, focusing on strengthening the country’s fiscal position, addressing constraints in infrastructure, and improving the business climate. However, real output is still believed to be below the 1989 level, indicating great potential for catch-up.2
2. The recent economic expansion in Georgia has not been accompanied by significant financial sector deepening. In Georgia, and more broadly in the Caucasus, monetization remains below 20 percent of GDP, and commercial banks have targeted their activities to a small group of companies and consumers, resulting in much lower credit to the private sector than seen in the more advanced transition economies. Financial sector development in the Baltic states, for example, has progressed much further. Monetization and private sector credit started from a similarly low level in these countries following independence from the Soviet Union, but have broadly reached the level of the early reformers in the central and east Europe (CEE).3
3. While studies on the causality between financial and economic development are inconclusive, empirical evidence strongly supports the proposition that a well-developed, efficient and robust financial system contributes positively to a country’s economic development (Box I.1).4 A growing body of empirical analysis—including firm-level studies, industry-level studies, individual-country studies, time-series studies, panel 1 Prepared by Andreas Billmeier and Shuang Ding.
2 Available data show that real GDP in 2005 amounts to about half of the 1989 level. However, the data are subject to measurement errors, and tend to overstate pre-transition output due to the accounting of unwanted goods and understate post-transition output in the informal economy.
3 See Schipke, Beddies, George and Sheridan (2004) for a discussion of the Baltics, and Mihaljek (2004) on the CEE.
4 Under the “supply-leading” hypothesis, financial institutions are created and financial services are provided in advance of demand for them—a variant of Say’s law. The “demand-following” hypothesis, on the other hand, asserts that economic growth necessitates financial services, and modern financial institutions are established in response; see Patrick (1966).

- 5 -
investigations, and broad cross-country comparisons—demonstrates a strong positive link between the functioning of the financial system and long-run economic growth (Levine, 2004). This raises the question of whether the still-low level of financial intermediation will become a constraint in realizing Georgia’s economic potential.
Box I.1. Why Is Financial Development Important?
While economists disagree about the direction of causality between financial sector deepening and economic development, there is evidence that countries with better functioning banks and markets grow faster (Levine, Loayza, and Beck, 2000). An efficient financial system can promote economic development by • Mobilizing and pooling savings. The financial system has the ability to mobilize small and
short-term savings from many diverse individuals, and make it possible to invest in large and longer-term risky projects. In an open economy, the financial system can also attract resources from abroad.
• Channeling investment toward higher return activities. Financial intermediaries may reduce the cost of acquiring and processing information associated with evaluating firms, managers, and market conditions, thereby improving the ex ante assessment of investment opportunities with positive ramifications on resource allocation. By accurately assessing risks and reflecting these risks in the interest rates charged to borrowers, the financial system can ideally allocate resources in a way that maximizes the risk-adjusted rate of return of capital.
• Exerting corporate governance. As the intermediary between savers and borrowers, financial institutions are entrusted with the task of monitoring firms after providing finance. Such external oversight can induce managers to maximize firm value, making savers more willing to finance production and innovation.
• Facilitating management of risks. The financial system may mitigate the risks associated with individual projects, firms, industries, regions, and countries by providing risk diversification services. Channeling funds to riskier projects with higher expected returns would encourage innovative activity with positive implications for productivity growth.
4. The economic transformation currently underway in Georgia adds to the urgency for financial development. Given the limited financial intermediation in Georgia, the allocation of resources appears to have relied less on the financial system, and more on privatization-related investment, retained earnings, and unofficial financing.5 Foreign direct investment (FDI), external aid, and remittances have also been important sources of financing in recent years.6 However, as the privatization of key sectors comes to fruition, legalization of the economy reduces the size of the informal economy, and companies
5 In fact, recent surveys showed that more than 70 percent of small and medium enterprises (SMEs) and about 60 percent of large enterprises have never approached banks for credit. Moreover, almost 80 percent of capital investments in SMEs are financed by retained earnings and the owners’ private savings; see IFC (2004).
6 Giuliano and Ruiz-Arranz (2005) show for a sample of over 100 countries that remittances can substitute for a lack of financial development and hence promote growth.
- 6 -
expand operations in response to deregulation, the traditional modalities of corporate finance will need to be replaced with more efficient funding through the financial system. In addition, given that the major FDI-financed projects (oil and gas pipelines) are largely completed, and foreign aid could decline over time, the financial system will need to play a larger role in economic development going forward.
5. In this context, the development of the banking system is especially important, while a greater role for capital markets should also be explored. A recent study concluded that banks and capital markets are complementary, and the structure of the financial system has no incremental impact on domestic investment (Ndikumana, 2005). On the other hand, some studies show that the development in the banking sector is a precondition for equity market development (e.g., Chinn and Ito, 2005). In small open economies, the number of sufficiently large enterprises is usually inadequate to make corporate issues of debt or equity cost effective, and banks are especially important for financing the operation of small firms and the creation of new firms. Georgia’s stock market is still small and active trading is limited to shares of a few companies.7 The economies of scale may call for the development of capital markets at the regional level, as the Baltic states have done by introducing the joint Baltic market concept. There had been no corporate bond issuance in Georgia until late 2005, when two commercial banks issued bonds totaling about US$4 million. In light of the small amount of outstanding corporate bonds, experiences in other countries have pointed to the importance of ensuring active trading in the government securities market to foster development of a debt market in general.
6. This chapter reviews the financial sector development in Georgia in recent years and investigates why it has lagged behind economic development, as well as developments in more advanced transition economies. The chapter first briefly reviews recent financial sector development in Georgia, comparing it with developments in its neighboring countries in the Caucasus, the seven poorest countries in the Commonwealth of Independent States (CIS-7), the Baltics, and the CEE (Section B). Section C analyzes possible factors constraining financial intermediation in Georgia and in some of the CIS countries more generally. Looking forward, Section D outlines ways to bolster healthy financial sector development. Section E presents conclusions.
B. Recent Financial Sector Developments in Georgia
7. Georgia’s financial sector remains small by international standards and in comparison with more advanced transition economies when measured by conventional indicators (Table I.1). From end-2000 to end-2005, liquid liabilities as a percent of GDP have increased from 10 percent to 16 percent in Georgia, and banking system credit to the
7 In 2005, the total annual turnover amounted to GEL 62 million, or about 0.5 percent of GDP. About 44 percent of total turnover stems from trading of the only continuously listed company. Shares of 279 other companies are admitted for trade but not continuously listed.

- 7 -
private sector remained below 10 percent of GDP until end-2004, when rapid credit growth set in.8 These ratios are low compared with more advanced transition economies, such as the Baltics or the CEE economies. While the same holds true for most other CIS countries (including those in the Caucasus), Kazakhstan has achieved faster financial sector development from a base similar to the one in Georgia.9
1996 1998 2000 2002 2004 2005Est.
Banking system credit to economyGeorgia 3.3 4.7 7.3 8.3 9.5 15.0Kazakhstan 5.1 5.9 11.1 18.5 28.2 38.6Caucasus 1/ 3.4 5.2 7.9 6.2 8.2 9.0CIS-7 8.4 10.8 19.5 14.5 15.1 13.2Selected CEE 2/ 36.5 35.4 35.8 31.3 35.5 39.0Baltics 3/ 11.8 16.1 17.5 22.4 37.62 54.1
Monetization 4/Georgia 6.7 7.3 10.3 11.6 15.2 16.5Kazakhstan 9.5 8.6 15.4 20.3 29.5 30.3Caucasus 1/ 9.8 10.5 12.9 14.3 16.5 16.5CIS-7 12.6 12.0 12.9 14.9 18.2 15.8Selected CEE 2/ 49.7 48.0 51.1 53.6 53.3 55.4Baltics 3/ 21.6 23.6 28.9 33.6 38.7 47.6
Sources: International Monetary Fund, IFS , WEO , and MCD centralized databases.
1/ Includes Armenia and Azerbaijan; excludes Georgia; simple average.2/ Includes Poland, Czech Republic, Hungary; simple average.3/ Includes Estonia, Latvia, Lithuania; simple average.4/ M3 where available, M2 otherwise.
Table I.1. Selected Transition Economies: Financial Sector Development, 1996–2005(In percent of GDP)
8. Georgia’s financial sector is dominated by the banking system, which continues to be in a process of consolidation. After a recent takeover, there are currently 18 banks, of which 16 are private Georgian banks, and the others are branches of Turkish and Azeri banks. Notwithstanding the sharp decrease in the number of banks from the peak of 229 in 1994—partly due to the new minimum capital requirement that obliges all existing banks to increase their paid-in capital to about US$6.5 million by 2008—the country is still
8 Liquid liabilities equal broad money (M3) in Georgia, which includes foreign currency deposits. There are no restrictions on withdrawing deposits in foreign or domestic currency.
9 Early structural reforms, prudent macroeconomic management, and more importantly booming oil revenues have contributed to economic growth averaging about 10 percent per year over the last six years in Kazakhstan. The financial sector, in turn, has benefited through higher bank deposits, increased lending operations, and the development of nonbank activities, including private pension funds that are accumulating substantial resources (on the order of 10 percent of GDP).
- 8 -
considered to be over-banked relative to the size of the population and the economy. 10 11 In tandem with banking sector consolidation, the concentration of assets and liabilities has increased. At end-2005, the six largest banks in Georgia held about 87 percent of the system’s total assets, 90 percent of total loans, and about 89 percent of deposits—as compared to 1998, when the top six banks held only 56 percent of assets and 58 percent of deposits. As of end-2005, the Herfindahl-Hirschman Index for Georgia’s banking system—based on each bank’s share in total loans—was 1495, indicating a moderately concentrated market by the U.S. standard.12 The same index amounted to 718 at end-1998. The impact of other financial institutions is rather limited: 42 credit unions—with total assets of GEL 1.8 million, less than 0.02 percent of GDP—serve mainly rural areas, and a number of micro finance companies assist very small entrepreneurs to develop new businesses. Although growing strongly, the insurance sector in Georgia is still of minor importance, with total premia collected in 2004 amounting to GEL 45 million, or 0.5 percent of GDP.
9. There are, in principle, no legal or regulatory barriers impeding foreign investment in the Georgian banking system, but foreign competition is not significant at present.13 Although only two wholly foreign-owned banks—for a combined 1 percent of total banking assets—operate currently on Georgian territory, foreign investors maintain shares in 12 resident banks and account for about half of the authorized capital of commercial banks, including investments by international financial institutions (IFIs) such as the EBRD, the IFC, and the German KfW and DEG. There is, however, no substantial engagement by a leading international commercial bank.
10. The balance sheets of Georgian banks are highly dollarized, constraining the central bank’s capability to conduct effective monetary policy and posing risks to commercial bank operations. The National Bank of Georgia (NBG) has taken steps to stimulate lari demand (including differentiated reserve requirements for domestic and foreign currencies). These, together with better enforcement of tax collections (payable in lari) and increased confidence in the Georgian banking sector, have also resulted in a rapid reduction in deposit dollarization from about 86 percent at end-2003 to 72 percent in December 2005, and loan dollarization from 88 percent to 76 percent. Despite enhanced public trust in the 10 New entrants are required to meet the new capital requirement from the outset.
11 In the Baltics, consolidation has advanced somewhat further, where the number of banks decreased to 12 in Lithuania and to 7 in Estonia at end-2005. See also Schipke, Beddies, George, and Sheridan (2004).
12 The Herfindahl-Hirschman Index is a commonly accepted measure of market concentration. It is calculated by squaring the market share of each firm competing in the market and then summing the resulting numbers. The U.S. Department of Justice uses the index for evaluating mergers, and considers markets with a value of less than 1000 to be competitive; a value of 1000-1800 to be moderately concentrated; and a value in excess of 1800 to be concentrated.
13 In fact, one restriction that may work against foreign investment is the limit of 25 percent ownership in a Georgian bank. This limit, however, only applies to nonbank investors; see paragraph 20 below.

- 9 -
lari as a result of relatively stable prices and currency appreciation, a solid track record of prudent fiscal and monetary policies would be necessary to further reduce dollarization.14 By comparison, the level of dollarization in the other Caucasus economies has experienced a similar but less pronounced trend over the past few years, with unweighted average deposit dollarization declining from 83 percent in 2001 to 73 percent in 2005. Dollarization in the Baltic economies has always been lower than in the Caucasus; for example, the level of deposit dollarization decreased from an unweighted average of 43 percent in 1999 to 36 percent by mid-2003. High dollarization entails the risk of currency mismatch of banks’ assets and liabilities. So far, the currency risk has been mitigated through the capital adequacy requirements (CAR), as all dollar-denominated loans are risk-weighted at twice the international standard unless borrowers have a demonstrated source of foreign currency earnings.
11. The banking system is generally sound, but the interest rate spread remains high (Table I.2). Average spreads between deposit and lending rates have been declining, but stood at 10 percent as of end-2005. Spreads remain high for a number of reasons, including high operating costs, high reserve requirements that are remunerated at below-market rate, and perceived credit risk. As of end-2005, the nonperforming loan ratio amounted to 3.8 percent of total loans, down from 6.2 percent at end-2004. Asset quality risks appear to have been covered through adequate reserves for loan losses, and the CAR stands at 17.5 percent at end-2005. Liquid assets remain relatively high at about 76 percent of total assets. The tier I capital ratio was 12.2 percent, adequate to provide for existing risks and moderate potential devaluation. Profitability indicators are improving, reflected by positive earnings for all but three banks in 2005 and a sector-wide return on equity of almost 15 percent—a 50 percent improvement over 2004.
12. Georgia is starting to witness a credit boom—albeit from a very low level. As government demand for domestic financing declines and new business opportunities emerge, banks have amplified their lending to the private sector since early 2005, especially in lari. During 2005, the number of outstanding loans has grown by 34 percent—or about 83 percent by value—lifting private sector credit to 15 percent of estimated 2005 GDP from about 10 percent in 2004. The sectoral distribution of loans has changed little, but there is some evidence that loans to the retail and service and the construction sectors are on the rise—whereas the share of loans to individuals (mortgages and consumer loans) fell slightly.15 Prudential indicators suggest that, so far, the banking sector remains sound. However, it is too early to make a full assessment of the new loan portfolio, as some indicators—for instance, the non-performing loan ratio—are lagging indicators of emerging risks.
14 See Ize and Levi Yeyati (2005).
15 The amount of loans outstanding to the retail and service sector more than doubled in 2005, from GEL 323 million to GEL 698 million.

- 10 -
2000 2001 2002 2003 2004 2005
Capital adequacyCapital to assets 33.6 30.5 28.3 26.2 21.9 18.8Regulatory capital to risk-weighted assets 36.7 33.1 21.9 20.3 18.8 17.5
Asset qualityNonperforming loans to total gross loans 7.1 11.6 7.9 7.5 6.2 3.8Loans collaterlized by real estate ... 30.2 33.3 31.9 33.5 30.8Sectoral distribution of loans to total loans
Retail or Service ... ... ... ... 34.7 40.7Energy Sector ... ... ... ... 2.8 1.9Agriculture and Forestry ... ... ... ... 1.3 0.7Construction ... ... ... ... 5.4 6.6Mining and Mineral Processing ... ... ... ... 15.0 11.6Transportation or Communications ... ... ... ... 1.9 2.8Individuals ... ... ... ... 30.1 28.5Other ... ... ... ... 8.8 7.1
Earnings and profitabilityReturn on assets 0.5 1.6 4.2 4.0 2.4 3.1Return on equity 1.5 5.0 14.9 15.0 10.0 14.9Net Interest income to gross income 56.4 63.3 62.9 66.0 61.2 61.4Noninterest expenses to gross income 62.9 53.2 56.1 54.9 61.6 57.2Spread between reference lending and deposit rates
In domestic currency 15.0 22.0 19.0 22.6 13.3 9.2In foreign currency 23.0 22.0 14.4 18.5 19.4 17.0
LiquidityLiquid assets to short-term liabilities ... 28.1 32.5 30.7 34.7 33.3Liquid assets to total assets ... 80.4 92.6 92.1 104.2 76.5
Exposure to foreign exchange riskNet open position in foreign exchange to capital 15.7 6.9 9.3 8.5 7.4 7.5Foreign currency-denominated loans to total loans 81.4 81.4 83.8 87.7 86.7 76.2Foreign currency-denominated deposits to total deposits 77.9 85.7 84.9 86.1 74.3 71.6
Sources: National Bank of Georgia; and Fund staff calculations.
Table I.2. Georgia: Financial Soundness Indicators, 2000–05(In percent, unless otherwise indicated)
13. The recent credit boom in the Georgian banking system is accompanied by longer loan maturities, lower lending rates, and de-dollarization. During 2005, the average loan size increased by GEL 1,500 to GEL 5,900, and the share of large loans (over GEL 100,000) remained stable at almost 70 percent (by amount) of total loans. Notwithstanding a substantial increase in the number of very short-term loans (up to one month), the maturity structure of loans has changed toward longer arrangements—the ratio of loans (by amount) with maturity longer than 12 months over short-term loans (up to 12 months) increased from 1.6 to 1.9 over the same period. The stock of long-maturity loans grew by GEL 540 million in 2005, or 4.7 percent of GDP. Lending interest rates have continued to come down, and loans concentrate increasingly in the 10–20 percent interest

- 11 -
range.16 Banks have also simplified loan applications especially for small loans, where the amount of collateral has decreased substantially—or collateral is not required at all.17 Almost one-fourth of outstanding loans are denominated in domestic currency, a sharp increase from 15 percent only 12 months ago. Total domestic private sector credit grew by 83 percent in 2005, and lari-denominated lending tripled. Banks have financed their increased lending activity mainly by attracting deposits, which grew by 31 percent over the same period, and a build-up of foreign liabilities, which increased by GEL 230 million (2 percent of GDP). The build-up of liabilities matches the structural changes on the asset side, with lari deposits increasing by 45 percent as opposed to foreign-currency denominated deposits, which grew 23 percent.
14. The credit expansion took place four years after Georgia had started to register strong growth—but only one year after the Rose Revolution, when macroeconomic stability was finally established and the structural reform effort gained fresh momentum. In Georgia, the strengthening of the fiscal position and improvement in governance since the new government came into power have enhanced public confidence in the economy and the financial system. The generally favorable economic conditions, an improved business environment, and the awakening of an “entrepreneurial spirit” have been cited as the main contributors to the expansion of financial intermediation. From the consumer side, demand for durables and real estate has increased as households consider the recent increase in income levels as permanent. A survey of leading commercial banks in Georgia also sheds light on how the practitioners view the recent credit boom (Box I.2).
16 As of December 31, 2004, less than 60 percent (by value) of total loans fell into that bracket, compared to more than 80 percent 12 months later. On the banks’ liabilities side, competition for deposits has given rise to a slight increase in deposit interest rates.
17 At one bank, for example, this is the case for loans smaller than GEL 6,000, as opposed to GEL 1,000 previously.
- 12 -
Box I.2. Why and Why Now? A Survey of Leading Banks on the Recent Credit Boom18
The recent credit boom is concentrated in the six biggest banks—they accounted for 94 percent of the additional loan portfolio in 2005. However, this boom started rather abruptly in the first quarter of 2005, without an obvious reason, such as a removal of prudential credit limits. Commercial banks have mentioned a variety of explanations for why the credit boom lagged behind economic growth in Georgia: • Several banks made the point that per-capita income needed to exceed a threshold to create
sufficient demand for financial intermediation, when larger investment (or consumption) activities would need to be financed by bank loans.
• Moreover, the credit boom was made possible by strong deposit growth; it is difficult to discern, however, to what extent this is due to an increase in confidence in the Georgian banking system or, alternatively, to the legalization of the economy.
• Some banks cited asymmetric information on credit risks as a reason for limited lending in the past and noted that the recently-established credit information bureau should contribute to a continued healthy credit expansion. Others noted that so far, the benefits derived from the bureau were limited.
• Some banks also mentioned that not until recently were they able to attract (via competitive salaries) experienced bankers from abroad with strong professional skills (both Georgians and foreigners), who are able to manage quickly-expanding financial sector operations.
Conversely, banks do not think that recent changes in the tax system removed a major hurdle to financial development, nor do they think that the court system improved significantly to the extent that it would contribute to a more liberal lending policy (based on better enforcement of property rights in case of non-performing loans).
C. Why Has Financial Development in Georgia Lagged?
15. This section tries to identify factors that could have affected the level and quality of financial intermediation in Georgia, drawing upon experiences of other transition countries in the Baltics and the CEE, as well as discussions with Georgia’s leading commercial banks and the NBG. One obvious reason for the delay in financial deepening compared to more advanced transition economies is the continued civil unrest in Georgia, which prevailed until the mid-1990s. On economic grounds, financial intermediation appears to have been impeded by (i) delays in establishing macroeconomic stability; (ii) the lack of
18 During the October 2005 mission, staff met with five of the six leading commercial banks: TBC Bank (23 percent of total banking sector assets at end-2005), Bank of Georgia (18 percent), Procredit Bank (13 percent), Cartu Bank (10 percent), and Bank Republic (8 percent). The mission team did not meet with the third-largest bank by assets, United Georgian Bank (15 percent).
- 13 -
loanable funds; (iii) low demand for credit; (iv) weak institutions; (v) financial regulations; and (vi) market structure. Many of these arguments elaborated below apply in a similar way to the group of poor CIS countries more generally, as they are at a very similar stage of economic development and facing common structural impediments.
16. A difficult macroeconomic environment appears to have retarded the pace of remonetization of the economy, limiting the size of commercial banks’ balance sheets. A period of hyperinflation after independence in the early 1990s and significant depreciation of the lari following the Russian financial crisis in 1998/99 seriously damaged the credibility of the domestic currency. Lack of confidence in the currency, together with the slow recovery of economic activities, depressed demand for money, hence the low level of money supply in the economy. As a result, despite a recent acceleration of monetization, broad money (including foreign currency deposits) still accounts for only 16 percent of Georgia’s annual GDP (Table 1).19
17. In addition, the amount of loanable funds is limited by the high cash ratio and reserve requirements. In Georgia, financial intermediation is hampered by the fact that a large portion of the money is held outside the banking system, in the form of cash.20 In this regard, increased confidence in the banking system, legalization of the informal economy, and a better payment system should over time help bring cash to the banking system. The weighted average of reserve requirement in Georgia is about 10 percent, implying that only 90 percent of the funds attracted by the banks are available for extending loans.21
18. Until recently, demand for credit had been sluggish, owing mainly to the lack of profitable investment opportunities, which could be attributed to the still low income level and a business environment that left much to be desired. High interest rates also depressed the demand. More recently, as the income level rises and investment climate becomes more friendly, demand for loans—including consumer loans—has increased rapidly. In response, credit to the economy has started to expand at a very fast pace. Moreover, legalization of the informal economy—triggered by stronger tax administration—implies that more investment opportunities can be satisfied through the formal banking system.
19. As in other transition economies, there is evidence that banks refrain from lending to unfamiliar firms and individuals for a number of capacity as well as institutional reasons, which include limited information about companies’ performance, lack of expertise in evaluating risk, and above all weak creditor rights and an inefficient 19 “True” monetization could be much higher than reported as the sizable foreign currency cash holdings are not included in the definition of broad money.
20 As of end-December 2005, domestic currency held by the public accounted for 69 percent of broad money excluding foreign currency deposits, and 39 percent of broad money including foreign currency deposits.
21 The reserve requirements are currently 13 percent for foreign currency deposits and 2 percent for lari deposits.
- 14 -
judicial system. In Georgia, lingering difficulties in enforcing property rights and seizing collateral have been considered to be main factors behind the high level of excess reserves held by the banks.22 Excess reserves of commercial banks declined following the recent credit boom. However, it is not clear whether the increased willingness to lend reflects an improvement in the legal environment and better risk evaluation or simply a departure from prudent banking.
20. While financial regulation is generally prudent and sound, some regulatory rules appear to have held back financial sector expansion: (i) the ceiling (25 percent) on equity stakes in domestic banks by non-industry investors has caused problems in commercial banks’ attempts to streamline their international ownership structure and attract strategic partners; (ii) some banks consider the 200 percent risk weighting for some foreign currency loans too restrictive; and (iii) in the longer run, the current capital adequacy requirements could tie up resources otherwise available for lending. 23
21. The market remains over-banked, especially by a number of small banks that are perceived to be financially weak. Like many other transition economies, Georgia started developing the financial system by liberally granting licenses to new banks to foster competition and bring interest rates down. This not only led to excessive competition and declining profitability, but also put pressures on supervisory capacity. Although the number of banks has been reduced significantly to 18, it is still large for the size of the economy. While most of the large banks perform well, smaller banks—facing high overhead expenses—have major difficulties surviving in an increasingly competitive market.24 Experience shows that the existence of weak banks can undermine public confidence in the banking system as a whole, which in turn could result in disintermediation.
D. Is Georgia Prepared for a Catch-Up?
22. The recent expansion holds the potential for reversing years of financial repression and could herald a period of sustained financial deepening. This has happened in the Baltic states and most CEE economies following the restoration of macroeconomic stability and the creation of an environment conducive to financial sector development. In Georgia, further monetization of the economy is indispensable for the realization of such potential. Apart from pursuing prudent macroeconomic policies and
22 Several commercial banks mentioned that sale of collateral could take up to two years.
23 The capital adequacy ratio in Georgia is 12 percent, of which Tier I capital should be no less than 8 percent of the risk-weighted assets.
24 Out of the six largest banks, only two recorded a return on equity (ROE) of less than 10 percent in 2005. The other four, recorded returns between 15 percent and 26 percent. Almost all small banks—each with assets of less than 1 percent of total sector assets—achieved an ROE of less than ten percent, and all three banks with negative ROE were small banks.

- 15 -
deregulating the economy, the government needs to address remaining constraints that hold back financial development.
23. The authorities have already set in motion some of the processes that are anticipated to promote financial intermediation over time:
• The credit information bureau was recently set up. It will collect and share information about borrowers from participating commercial banks, which is expected to reduce the counterpart risk and facilitate commercial lending.
• The government has been actively seeking sovereign credit ratings from renowned rating agencies to improve access to external sources of financing. In December 2005, Standard & Poor’s assigned its “B+” long-term and “B” short-term sovereign credit ratings to the government of Georgia, with positive outlook. The ratings, the first since Georgia’s independence, are expected to help local banks borrow from abroad at more favorable terms.
• The NBG plans to introduce a deposit insurance scheme—possibly in 2007—in the hope of increasing the public trust in the Georgian banking sector. However, the scheme needs to be carefully designed, and some preconditions should be satisfied prior to its establishment to avoid moral hazard, adverse selection, and agency problems.25 Weak banks need to be closed or merged before the introduction of the scheme to minimize the risk of immediate depletion of the deposit insurance fund.
• The NBG has introduced legislation to parliament that will eliminate the restrictions on bank ownership. In effect, this will allow any individual or legal entity to own 100 percent of a commercial bank, facilitating ownership restructuring, and mergers and acquisitions in the banking sector.
• The NBG has proposed to parliament the adoption of revised fit-and-proper criteria for bank owners and managers to minimize the risk of substandard corporate governance in the banking sector.
• The new capital requirements are expected to further reduce the number of small banks, which, on average, display weaker CAMEL ratings.
24. However, more needs to be done to address the fundamental issues. In this regard, the following measures are worth considering:
25 The scheme should encompass appropriate coverage limits, scope of coverage, coinsurance, funding, premia structure, management, and membership requirements. The preconditions include a strong banking system, a good system of bank supervision, clear rules for financial reporting and accounting, and a strong and fair judiciary system that supports collateral and creditor rights.
- 16 -
• Strengthening institutions and infrastructure. There is evidence that countries with greater support for creditor rights, contract enforcement, and information disclosure have higher levels of development of both capital markets and financial intermediaries. In Georgia, creditor rights should be better protected, and court procedures should be expedited. The government should also promote accounting and auditing standards and disclosure requirements that comply with international best practices. These are key underpinnings for the healthy development of the financial sector, and should render it attractive to foreign investors.
• Further consolidating the banking sector. In many transition economies in the CEE and the Baltics, excessive proliferation of banks early on during the transition period was followed by a wave of mergers and consolidation that contributed to more efficient intermediation. In Georgia, there is still room for further consolidation to achieve economies of scale and scope without compromising competitiveness. A recent study found no evidence that competitiveness is negatively related to banking system concentration, and confirmed that contestability determines effective competition by allowing bank entry and reducing activity restrictions on banks.26 In particular, most small banks in Georgia are deemed weak by the public and serve only a small clientele. The closure or merging of these banks would improve the reputation of the banking sector, with limited impact on competitiveness and depositors as long as the system remains open to new entrants. Therefore, the authorities should enforce strictly the prudential regulations and close weak banks in a timely and transparent manner.
• Encouraging foreign entry. Experiences in the Baltic states show that entry of established foreign banks can bring in much-needed capital, financial know-how, sound corporate governance practices, and more competition. More broadly, foreign bank ownership could also increase the overall level of confidence in the banking sector, and reduce the risk of a government bailout in case of a crisis, contributing to improved stability of the banking system and prospects of market integration with the West. In Georgia, the absence of reputable international banks to date is likely due to—as indicated by some leading banks—the small size of the market and the perceived country risk. A solid record of political and economic stability, strengthened property rights, an improved business climate, and more cooperation with its neighbors in financial matters could make the Georgian market more attractive to foreign banks—especially for those with a regional perspective.
26 See Claessens and Laeven (2004). Contestability theory holds that in “perfectly contestable markets” where potential entrants face no barrier to entry or exit and incumbent firms cannot respond quickly enough with a reduction in price to close off a temporary profit opportunity to an entrant, the threat of competition by potential entrants can discipline firms to price their products in a socially efficient manner that yields only normal returns.

- 17 -
• Streamlining regulations. The authorities have to strike a delicate balance between safeguarding the integrity of the financial system and avoiding over-regulation. As public confidence in the banking system improves further following the shutdown of weak banks, and provided that the definitions of capital and risk assets are not diluted, lowering the capital adequacy ratio could be considered in the longer run to reduce the cost of financial intermediation.
25. In the meantime, the authorities need to be wary of the risks associated with rapid financial expansion. Rapid expansion of financial assets and liabilities without quality control can give rise to financial fragility, and inefficient financial intermediation can increase its cost and eventually repress intermediation. A rough estimate shows that an increase in the ratio of credit to GDP from 10 percent to 40 percent in eight years—broadly similar to development in the Baltics starting in 1996—would imply credit growth of 30 percent per year on average.27 This would put tremendous pressure on commercial banks’ capacity to evaluate loans and supervisors’ capacity to ensure banking system stability.
26. Recent credit boom in other transition economies points to both macroeconomic and sectoral risks.28 In Bulgaria and Romania, for example, credit booms over the past couple of years have contributed to widening macroeconomic imbalances and heightened external vulnerability, which has been dealt with successfully through tight fiscal policy to restore the saving-investment balance. Credit expansion in Ukraine, on the other hand, has led to concerns over loan quality and banking sector stability.
27. Therefore, while promoting financial intermediation, the authorities need to be prepared to deal with the fallout of the credit boom. Policymakers need to step up measures if the credit boom accelerates. When necessary, fiscal and/or monetary policy will have to be tightened to reduce demand pressures. In any event, supervisory capacity should be strengthened to deal with a much larger and more complicated loan portfolio. The NBG needs to ensure that commercial banks put in place comprehensive risk management strategies, policies, and systems as well as qualified staff to implement them. If warranted, the NBG may need to strengthen prudential requirements, for example, by tightening loan concentration ratios and asset classification rules for property and consumer loans and reducing the loan-to-value ratio for mortgage lending. To complement official supervision, a better incentive structure should be put in place to encourage private monitoring of banks, including by enforcing more stringent disclosure requirements. Moreover, the authorities will need to respond to a trend toward universal banking, for example, by encouraging information exchange and cooperation between industry supervisors and by enhancing consolidated reporting.
27 Assuming nominal GDP will grow by 9 percent each year.
28 See Duenwald, Gueorguiev, and Schaechter (2005).
- 18 -
E. Conclusions
28. Financial deepening has lagged behind economic development in Georgia, as well as in many other CIS economies, with monetization and private sector credit remaining low by international standards. More advanced transition countries in the CEE and the Baltic countries, however, have successfully developed a sizeable and efficient financial sector. As both theory and empirical evidence point to the positive role the financial intermediation can play to boost growth, Georgia will need to avoid a situation in which an underdeveloped financial sector constrains the achievement of its economic potential.
29. A number of factors may have hindered financial sector development in Georgia. Lack of confidence in the financial sector—and the economy in general—has lead to cash-based transactions and a sizable informal economy, slowing the pace of remonetization. Until recently, limited investment opportunities also constrained the demand for bank credit. Weak institutions and infrastructure, unhealthy competition, and some regulatory restrictions also prevented financial institutions from expanding business. In 2005, banks have nonetheless started to massively expand their loan portfolio, resulting in an 83-percent increase of credit to the private sector. Similar to other transition economies, this expansion could be the beginning of a period of sustained financial deepening—but could also lead to the pitfalls of an explosive credit boom.
30. Continued macroeconomic stability, prudent regulation, and strengthened institutions will create an environment conducive to financial development. The authorities need to strike a balance between exercising strong regulation and giving the financial system adequate freedom to engage in creative activities. Effective competition should be promoted by closing weak banks and encouraging foreign entry. To this end, improvement in institutions (especially creditor rights and the judicial system) is indispensable for a further expansion of the financial sector, including for the entry of a foreign reputable commercial bank. However, fast credit growth poses potential problems to the banking system, and while in principle welcome, requires close supervision to avoid overheating or deteriorating loan quality.

- 19 -
References
Chinn, Menzie, and Hiro Ito, 2005, “What Matters for Financial Development? Capital Controls, Institutions, and Interactions,” National Bureau of Economic Research, Working Paper Series No. 11370.
Claessens, Stijn, and Luc Laeven, 2004, “What Drives Bank Competition? Some
International Evidence,” Journal of Money, Credit, and Banking, Vol. 36, No. 3(II), pp. 563–584.
Duenwald, Christoph, Nikolay Gueorguiev, and Andrea Schaechter, 2005, “Too Much of a
Good Thing? Credit Booms in Transition Economies: The Cases of Bulgaria, Romania, and Ukraine,” IMF Working Paper No. 05/128 (Washington: International Monetary Fund).
Giuliano, Paola, and Marta Ruiz-Arranz, 2005, “Remittances, Financial Development, and
Growth,” IMF Working Paper No. 05/234 (Washington: International Monetary Fund).
IFC (International Finance Corporation), 2004, Business Environment in Georgia As Seen By
Small and Medium Enterprises 2004 (Washington: International Finance Corporation).
Ize, Alain, and Eduardo Levi Yeyati, 2005, “Financial De-Dollarization: Is It for Real?” IMF
Working Paper 05/187 (Washington, DC: International Monetary Fund). Levine, Ross, 2004, “Finance and Growth: Theory and Evidence,” NBER Working Paper
Series No. 10766 (Cambridge: National Bureau of Economic Research). ———, Norman Loayza, and Thorsten Beck, 2000, “Financial Intermediation and Growth:
Causality and Causes,” Journal of Monetary Economics, Vol. 46 (1), pp. 31–77. Mihaljek, Dubravko, 2004, “Banking Industry in Central and Eastern Europe: The
Unexpected Leader in the Transition and Integration with the EU,” Financial Intermediation in the New Europe: Banks, markets and regulation in EU Accession Countries (Massachusetts: Edward Elgar Publishing, Inc.).
Ndikumana, Léonce, 2005, “Financial Development, Financial Structure, and Domestic
Investment: International Evidence,” Journal of International Money and Finance 24 (2005) 651–673.
Patrick, Hugh T., 1966, “Financial Development and Economic Growth in Underdeveloped
Countries,” Economic Development and Cultural Change, Vol. 9, pp. 174–189.

- 20 -
Schipke, Alfred, Christian Beddies, Susan M. George, and Niamh Sheridan, 2004, Capital Market and Financial Intermediation in The Baltics, IMF Occasional Paper No. 228 (Washington: International Monetary Fund).
- 21 -
II. RECENT SURVEYS ON THE BUSINESS ENVIRONMENT29
“Posner points out that corruption flourishes with a weak legal system, and with larger government. Obviously, if governments strongly regulate many activities, then companies, unions, and other groups that are regulated can do better if they can "bribe" officials to overlook or relax these regulations. So the wider is the reach of governments, the greater is the corruption potential.” The Becker-Posner Blog, August 28, 2005
A. Introduction
31. Georgia has come a long way since the Rose Revolution of January 2004 brought the current administration into power. The last years of the Shevernadze government saw poor management of public resources, and increasing corruption in the public sector, which lead to low tax collections and rapidly rising domestic arrears. January 2004 swept in Saakashvili and other politicians, ready to engender a new policy environment based on the slogan, “Georgia without Corruption.”
32. Reforms were revitalized under the new administration. The anti-corruption drive became the focal point, and the themes of change were to reduce graft in tax and customs administration, and to improve governance in the public sector.
33. An important step taken to reduce corruption early on was to improve the incentives for public officials. High-ranking officials were sacked or prosecuted, and in many cases, had to make large reparations payments to the state. This resulted in a remarkable surge in tax revenues, with the tax to GDP ratios increasing by 25 percent in 2004, and 9 percent in 2005. These revenues gave room to the authorities to undertake many important programs—such as further improving public sector incentives by higher civil sector wages and pensions, upgrading the country’s defense capacity, and clearing the bulk of arrears from the previous administration—while maintaining fiscal stability.
34. The Georgian authorities have clearly established momentum in these areas, and a series of surveys that came out in 2005 and early 2006 already reflect improvements resulting from the policy changes undertaken. This chapter examines these survey-based business indicators and internationally accepted indices of governance.
B. Surveys of 2005
35. The surveys were selected to show recent changes in various areas related to business environment and governance, as well as to show the relative rankings in the region and comparisons to more advanced transition countries.30 The surveys are 29 Prepared by Susan M. George.
30This paper assumes that corruption misallocates resources and lowers efficiency (Murphy, Schleifer, and Vishny, 1993), and hence any reduction in corruption is an economic good.
- 22 -
BEEPS, Doing Business, Global Competitiveness, Freedom House, Economic Freedom, Corruption Perception, and Reporters without Borders.
C. BEEPS
36. The Business Environment and Enterprise Performance Survey, referred to as BEEPS, is a large survey of firms in transition economies, jointly conducted by the World Bank and the European Bank for Reconstruction and Development. There have been three such surveys conducted in 2000, 2002, and 2005, and the identical sampling approach used for all three years makes for good comparison over time. The sampling techniques used includes the sectoral composition of the firms that reflects relative contribution to GDP, size that covers small to large firms, and ownership that includes both foreign and state-owned firms.
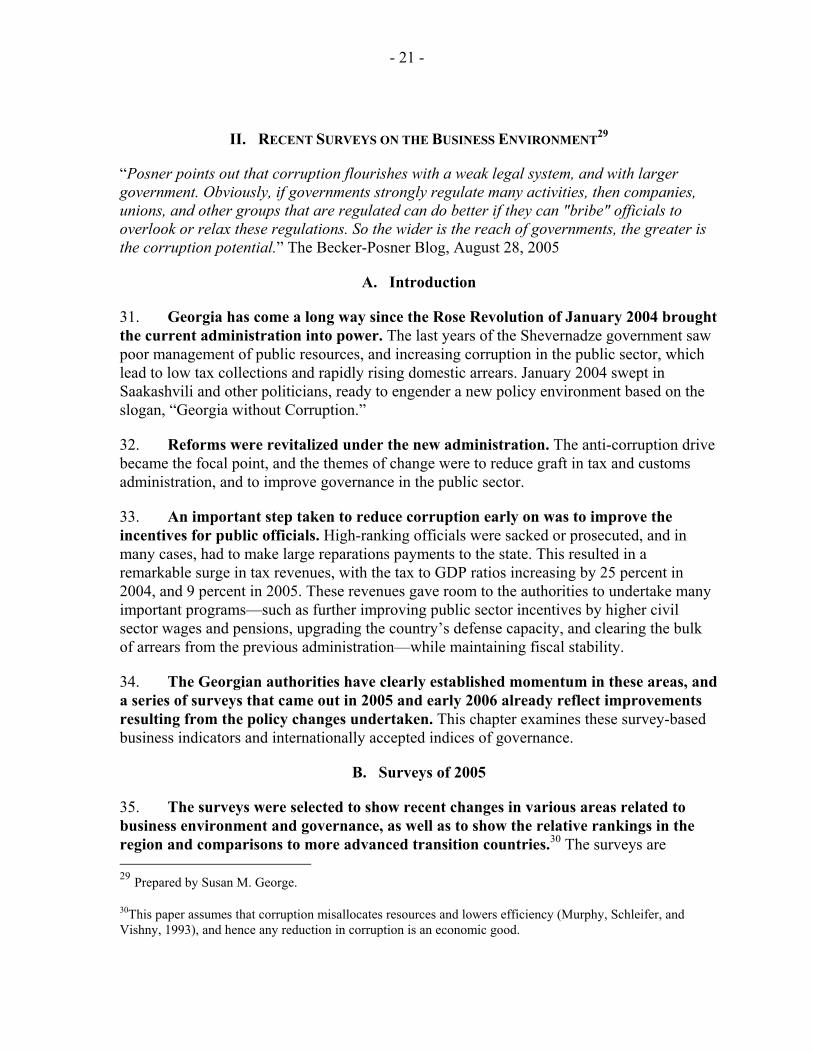
37. The 2005 results for Georgia show impressive improvement in the areas targeted by the authorities (Figure II.1). Macroeconomic stability and taxes were less of a constraint to doing business, and there was a dramatic drop in firms citing tax administration as a problem (from 84 percent of respondent firms in 2002 to 23 percent in 2005). While there was only modest improvement in the constraints placed by business licensing and permits and customs regulatory requirements, the percent of firms that reported corruption as a problem saw a large drop from 66 percent in 2002 to 39 percent in 2005.
38. A disturbing development has been the lack of improvement in the judiciary, and the increase in contract violations as faced by firms. The limitations in infrastructure—transportation, energy, and telecommunications are the areas highlighted in the survey—created obstacles to business activities in Georgia. These results reinforce the authorities’ focus and priorities to rehabilitate public infrastructure.

- 23 -
Figure II.1. Georgia: Business Environment
0%
10%
20%
30%
40%
50%
60%
70%
80%
90%
Macroeconomic instability Tax rates Tax administration
20022005
The macroeconomic situation improved ...
0%
10%
20%
30%
40%
50%
60%
70%
Business licensing andpermits
Customs and trade regulations Corruption
Corruption fell ...
0%
10%
20%
30%
40%
50%
60%
Contract violations Functioning of the judiciary
But the judicial system became more of a constraint ...
0%
10%
20%
30%
40%
50%
60%
Transportation Electricity Telecommunications
And infrastructure remains a bottleneck.
Source: Business Environment and Enterprise Performance Survey (BEEPS).
D. Doing Business
39. The World Bank’s Doing Business 2005 surveys professionals—e.g. lawyers and accountants—about procedures, rules, and laws required for various hypothetical transactions, such as building warehouses and buying land. While BEEPS reflects effective constraints to doing business, this complementary survey shows the existing procedural and regulatory framework as experienced by the relevant professionals.
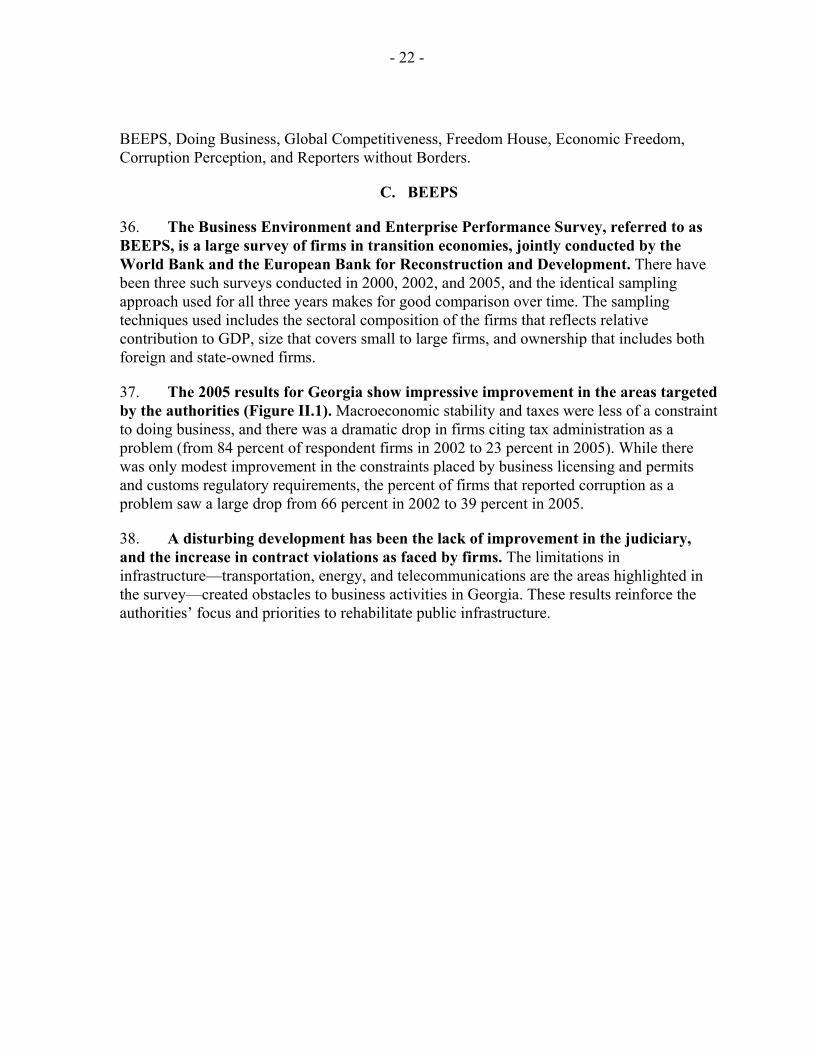
40. Overall, Georgia showed the second largest improvement in 2005 over the previous year in the ease of doing business index, but still ranked low at 100 out of 155 countries (Table II.1). Notwithstanding comparable performance with countries in the region in starting a business and registering property, it took almost 100 days longer to deal with licenses in Georgia than in Armenia, and almost 200 days longer to enforce contracts (Table II.2). The Baltic unweighted average (Estonia, Latvia, and Lithuania) shows a reference framework as exists in more advanced transition countries.
Table II.1. Rankings of Selected Countries, 2005
Ease of Doing Business
Armenia 46Azerbaijan 98Georgia 100
Estonia 16Latvia 26Lithuania 15Ukraine 124
Source: Doing Business , World Bank
- 24 -
Table II.2. Georgia in a Comparative Perspective: Selected Indicators of Doing BusinessStarting a Business Dealing with Licenses Registering Property Enforcing ContractsProcedures
(number)Duration
(days)Procedures
(number)Time
(days)Procedures
(number)Time
(days)Cost (% of
property value)
Procedures (number)
Time (days)
Cost (% of debt)
Armenia 10.0 25.0 20.0 176.0 4.0 6.0 0.5 24.0 185.0 17.8Azerbaijan 14.0 115.0 28.0 212.0 7.0 61.0 0.4 25.0 267.0 19.8Georgia 8.0 21.0 29.0 282.0 6.0 9.0 0.6 18.0 375.0 31.7Baltics 6.3 25.7 15.7 142.3 5.3 40.7 1.1 20.7 163.3 10.0
Source: World Bank Doing Business database.
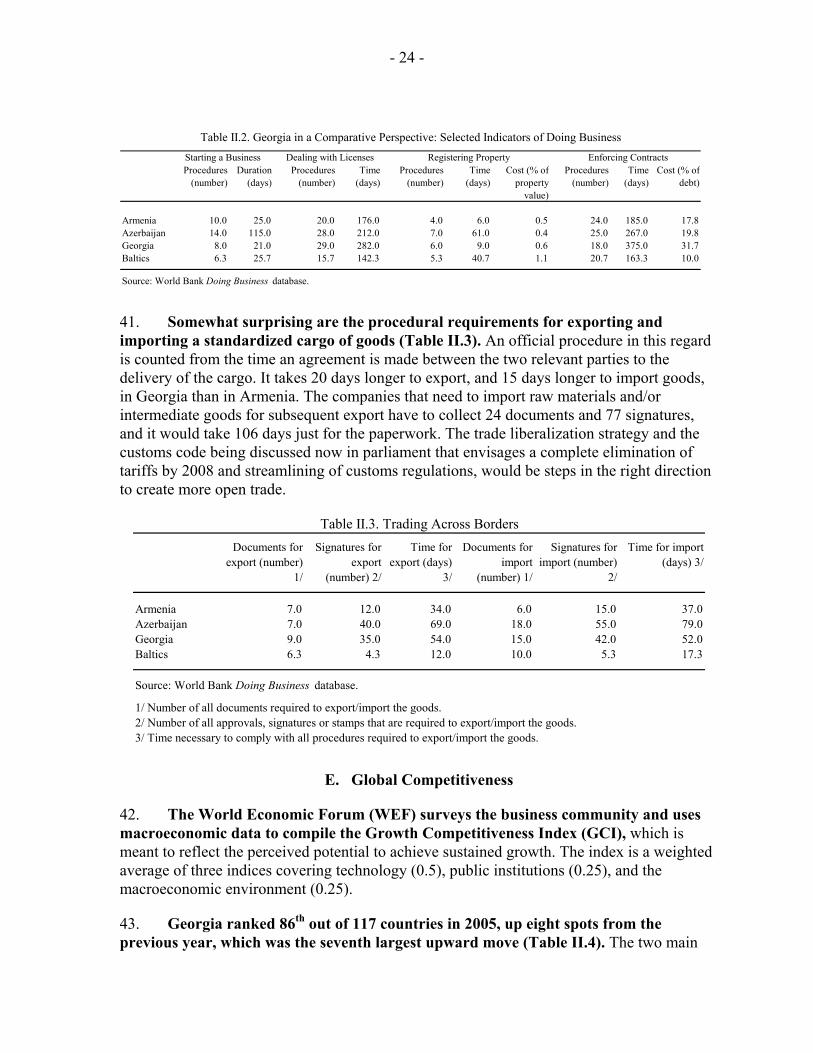
41. Somewhat surprising are the procedural requirements for exporting and importing a standardized cargo of goods (Table II.3). An official procedure in this regard is counted from the time an agreement is made between the two relevant parties to the delivery of the cargo. It takes 20 days longer to export, and 15 days longer to import goods, in Georgia than in Armenia. The companies that need to import raw materials and/or intermediate goods for subsequent export have to collect 24 documents and 77 signatures, and it would take 106 days just for the paperwork. The trade liberalization strategy and the customs code being discussed now in parliament that envisages a complete elimination of tariffs by 2008 and streamlining of customs regulations, would be steps in the right direction to create more open trade.
Table II.3. Trading Across BordersDocuments for
export (number) 1/
Signatures for export
(number) 2/
Time for export (days)
3/
Documents for import
(number) 1/
Signatures for import (number)
2/
Time for import (days) 3/
Armenia 7.0 12.0 34.0 6.0 15.0 37.0Azerbaijan 7.0 40.0 69.0 18.0 55.0 79.0Georgia 9.0 35.0 54.0 15.0 42.0 52.0Baltics 6.3 4.3 12.0 10.0 5.3 17.3
Source: World Bank Doing Business database.
1/ Number of all documents required to export/import the goods.2/ Number of all approvals, signatures or stamps that are required to export/import the goods.3/ Time necessary to comply with all procedures required to export/import the goods.
E. Global Competitiveness
42. The World Economic Forum (WEF) surveys the business community and uses macroeconomic data to compile the Growth Competitiveness Index (GCI), which is meant to reflect the perceived potential to achieve sustained growth. The index is a weighted average of three indices covering technology (0.5), public institutions (0.25), and the macroeconomic environment (0.25).
43. Georgia ranked 86th out of 117 countries in 2005, up eight spots from the previous year, which was the seventh largest upward move (Table II.4). The two main

- 25 -
areas of improvement were macroeconomic stability and the quality of public institutions. The former, according to respondents, was due to an improved fiscal setting and somewhat easier access to credit. The latter saw striking improvement in that the government used criteria that were more objective to make policies and decide on contracts. While organized crime was less of a problem, and there was slightly less corruption in general, the business community noted that corruption remains a serious problem in Georgia.
Table II.4. Growth Competitiveness Index Rankings 1/; 2005 and 2004 Comparisons
2005 Rank 2005 Score 2004 Rank Changes 2004-2005
Armenia 79 3.4 n.a. n.a.Azerbaijan 69 3.6 n.a. n.a.Georgia 86 3.3 94 8Baltics 2/ ... 4.5 ... ...
Source: World Economic Forum.
1/ Finland ranks the highest with a GCI score of 5.94, while Chad (117) ranks the lowest with a GCI score of 2.37.2/ GCI 2005 ranking for Estonia is 20, for Latvia 44, and for Lithuania 43.
F. Nations in Transit
44. Freedom House (FH) ranks transition countries on the development of democratic institutions. The ratings are based on a democracy score calculated by ratings in areas including the electoral process (EP), civil society involvement (CS), independent media (IM), judiciary (JFI), and corruption (CO). While Georgia ranks relatively favorably in the region, its score went from 4.83 in 2003 to 4.96 in 2005, losing ground in the areas of media independence, and the judicial framework and its independence (Table II.5).
Table II.5. Selected Democracy Scores, 2005 1/
EP CS IM JFI CODemocracy
Score
Armenia 5.75 3.50 5.50 5.25 5.75 5.18Azerbaijan 6.25 4.75 6.00 5.75 6.25 5.86Georgia 4.75 3.50 4.25 5.00 5.75 4.96
Source: Freedom House.1/ Ratings are based on a scale of 1 to 7, 1 is the most and 7 the least level of democratic development.
G. Economic Freedom
45. Heritage Foundation’s Index of Economic Freedom rates each country by looking at 50 independent economic variables that fall into 10 broad categories that are

- 26 -
equally weighted: trade policy; fiscal burden of government; government intervention in the economy; monetary policy, capital flows and foreign investment, banking and finance, wages and prices, property rights, regulation, informal market activity. Georgia jumped from 100th place in 2005 to 68th place in 2006, with its score improving from “mostly unfree” last year to “mostly free” this year (Table II.6). Areas of improvement were concentrated in monetary policy, the financial sector, and foreign investment, while property rights, regulation, and the informal market scores remained poor.
Table II.6. Economic Freedom Category 1/
2005 2006Score Rankings Score Rankings
Armenia 2.58 42 2.26 27Azerbaijan 3.38 103 3.51 123Georgia 3.34 100 2.98 68
Source: Index of Economic Freedom, Heritage orgnaization.
1/ Score of 1-1.99 indicates free; score of 2-2.99 indicates mostly free; score of 3-3.99 means mostly unfree; and score of 4-5 indicates repressed.
H. Corruption Perception
46. Transparency International (TI) combines many surveys to construct a composite Corruption Perceptions Index (CPI) that reflects corruption as it is perceived to exist in the public sector. Businesspersons and analysts including local experts are surveyed. The Georgian index used six surveys including WEF and FH surveys mentioned in previous sections. Although Georgia showed modest improvement in 2005 over 2004—from 2.0 to 2.3—it ranks in the lowest quintile of countries (Table II.7).
Table II.7. Corruption Perception Index (CPI), 2005 1/
Country RankRegional
Rank2005 CPI
ScoreConfidence
range Surveys Used
Armenia 88 5 2.9 2.5-3.2 4Azerbaijan 137 18 2.2 1.9-2.5 6Georgia 130 16 2.3 2.0-2.6 6Baltics ... ... 5.1 ... ...
Source: Transparency International.
1/ An increase in the score indicates an improvement.
- 27 -
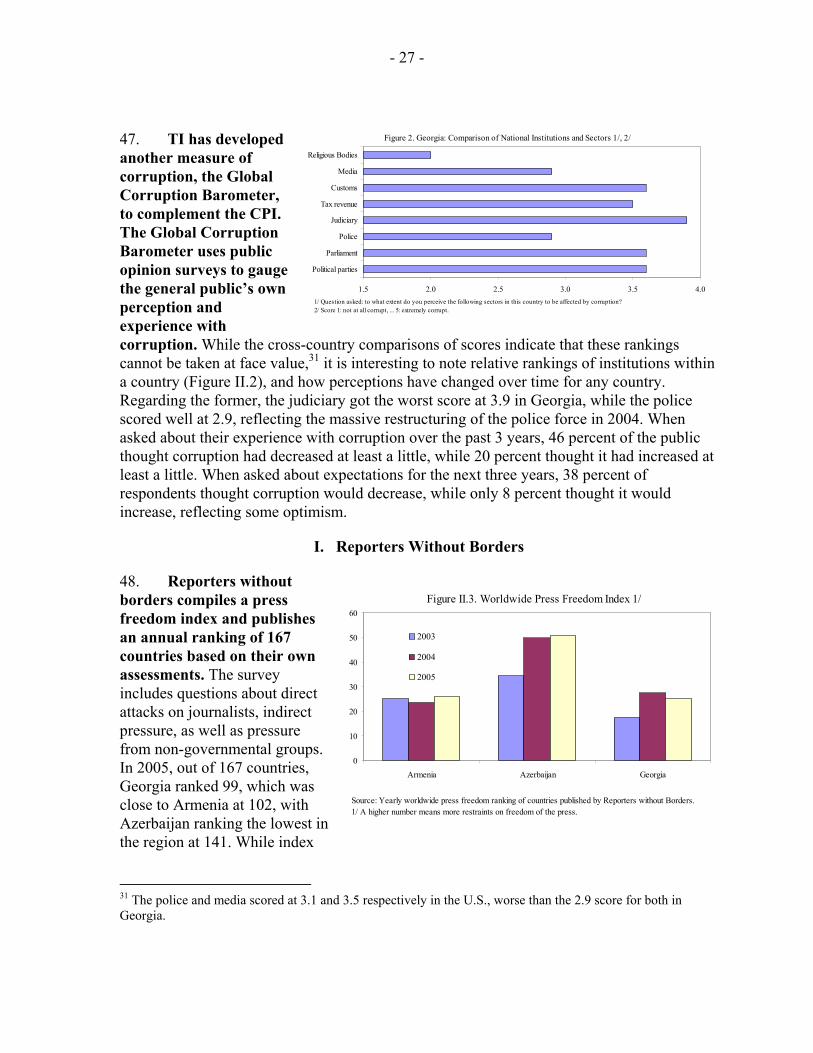
47. TI has developed another measure of corruption, the Global Corruption Barometer, to complement the CPI. The Global Corruption Barometer uses public opinion surveys to gauge the general public’s own perception and experience with corruption. While the cross-country comparisons of scores indicate that these rankings cannot be taken at face value,31 it is interesting to note relative rankings of institutions within a country (Figure II.2), and how perceptions have changed over time for any country. Regarding the former, the judiciary got the worst score at 3.9 in Georgia, while the police scored well at 2.9, reflecting the massive restructuring of the police force in 2004. When asked about their experience with corruption over the past 3 years, 46 percent of the public thought corruption had decreased at least a little, while 20 percent thought it had increased at least a little. When asked about expectations for the next three years, 38 percent of respondents thought corruption would decrease, while only 8 percent thought it would increase, reflecting some optimism.
I. Reporters Without Borders
48. Reporters without borders compiles a press freedom index and publishes an annual ranking of 167 countries based on their own assessments. The survey includes questions about direct attacks on journalists, indirect pressure, as well as pressure from non-governmental groups. In 2005, out of 167 countries, Georgia ranked 99, which was close to Armenia at 102, with Azerbaijan ranking the lowest in the region at 141. While index
31 The police and media scored at 3.1 and 3.5 respectively in the U.S., worse than the 2.9 score for both in Georgia.
0
10
20
30
40
50
60
Armenia Azerbaijan Georgia
2003
2004
2005
Figure II.3. Worldwide Press Freedom Index 1/
Source: Yearly worldwide press freedom ranking of countries published by Reporters without Borders.1/ A higher number means more restraints on freedom of the press.
1.5 2.0 2.5 3.0 3.5 4.0
Political parties
Parliament
Police
Judiciary
Tax revenue
Customs
Media
Religious Bodies
Figure 2. Georgia: Comparison of National Institutions and Sectors 1/, 2/
1/ Question asked: to what extent do you perceive the following sectors in this country to be affected by corruption?2/ Score 1: not at all corrupt, ... 5: extremely corrupt.

- 28 -
levels seem comparable to Armenia, there appears to have been some deterioration in Georgia over the last two years (Figure II.3).
J. Conclusion
49. One of the main missions of the current administration has been to reduce corruption. By doing so, they have created a tax base that is on more solid footing and a business environment that is much improved. Their philosophy—that a major way to reduce corruption is by narrowing the scope of government and reducing the opportunities for rent seeking behavior—is evident in many spheres. There are various strategies being discussed, including trade liberalization, the customs code and the banking sector strategy, that reflect streamlining and a more liberal approach.
50. Much progress has been made in a short time, and the surveys already reflect improvement. It should be noted, however, that the data reported on were based on surveys conducted in late 2004 early 2005, quite a short time after the change in government. Most likely, the next round of survey results will show even greater gains. That said there are clear indications that some areas need greater attention.
51. The authorities are building on the first stage of reforms to create sustainable growth in Georgia. It remains important to continue improving policies and their effective implementation, as well as creating appropriate incentives to reduce corruption even further. There is a need to strengthen legal institutions to allow for the proper enforcement of property rights and contracts, which are essential features of a well-functioning market economy. Also important is a free press, which is an important way for corrupt acts or just bad policy to become exposed, changed, and rooted out. Finally, development of the various political branches will ensure that checks and balances are effectively created.
- 29 -
References
Becker, Gary, and Richard Posner, The Becker-Posner Blog, http://www.becker-posner-blog.com
EBRD and World Bank, 2002 and 2005, Business Environment and Enterprise Performance
Survey, http://info.worldbank.org/governance/beeps/ Freedom House, 2005, Nations in Transit, http://www.freedomhouse.org/ Heritage Foundation, 2006, Index of Economic Freedom,
http://www.heritage.org/research/features/index/index.cfm Murphy, Kevin M., Andrei Shleifer, and Robert W. Vishny, 1993, “Why is Rent Seeking So
Costly to Growth,” American Economic Review, Vol. 83(2), pp 409–414. Reporter Without Borders, Worldwide Press Freedom, http://www.rsf.org Transparency International, 2005, Corruption Perception Index; Global Corruption
Barometer, http://www.transparency.org/ World Bank, 2005, Doing Business, http://www.doingbusiness.org/ World Economic Forum, 2005 Global Competitiveness Report, http://www.weforum.org/

- 30 -
III. MEASURING THE SHADOW ECONOMY: THE IMPACT OF THE GEORGIAN ANTI-CORRUPTION DRIVE32
A. Introduction
52. The purpose of this chapter is to evaluate the impact of the Georgian government’s strategy to combat corruption on the size of the shadow economy. To estimate the size of the shadow economy in Georgia and to evaluate existing official estimates, this chapter applies the demand-for-cash approach to test the hypothesis that the size of the underground economy in Georgia decreased in the wake of the political changes (Rose Revolution) in late-2003. Gauging the size of the shadow economy is important for policy-making for a number of reasons. First, the shadow sector does not pay taxes, thereby undermining public revenue. Second, official statistics becomes less reliable the larger the shadow economy. Third, developments in the shadow economy are informative about society’s perception of the tax and administrative burdens, as well as of the quality of governance. In this chapter, the notion of “shadow” or “informal” economy comprises all economic activity that contributes to GDP but is currently unregistered (Schneider and Enste, 2000).
53. Understanding trends in the shadow economy is particularly important for gauging the current developments in Georgia. In January 2004, President Saakashvili won the presidential elections on an anti-corruption and legalization platform, and the 2005 tax reform was devised with that strategy in mind. Both anecdotal evidence and official estimates carried out by the State Department for Statistics (SDS)—part of the Georgian Ministry of Economic Development (MED)—suggest that reported economic growth in 2004 was driven, to a considerable extent, by economic activities moving from the underground to the official sector. A detailed assessment of these estimates—together with possible refinements of the methodology and complemented by alternative approaches—can contribute to a better understanding of economic dynamics in Georgia.
54. This chapter compares the SDS estimates of the shadow economy with an alternative measure obtained using the demand-for-cash approach. The two sets of estimates are qualitatively consistent with each other, as both suggest that the share of the shadow economy in the overall GDP dropped following the political changes at end-2003 and the subsequent anti-corruption campaign. More recently, however, the degree of shadow activity started to rise again—at least in some sectors in the economy.
55. Choosing the demand-for-cash approach to verify the SDS estimates is motivated by the ready availability of monetary data. Some other popular approaches to measure the shadow economy—such as those based on voluntary or involuntary replies of economic agents about legal aspects of their activities (e.g., tax auditing) or those based on 32 Prepared by Andreas Billmeier and Konstantin Fedorov.

- 31 -
information regarding the consumption of physical inputs (in particular, electricity)—cannot be applied in Georgia due to limited data availability.33 Another reason for not using the method based on electricity (or gas) consumption is that in Georgia, especially outside Tbilisi, blackouts are frequent and consumption is rationed. Hence, developments in the consumption of utilities has been dominated by fluctuations in supply rather than demand.
56. The chapter starts with a brief account of the policies that were implemented by the new Georgian leadership in order to combat corruption and bring hidden economic activity in the open (Section B). Section C provides a description of the SDS’ survey-based estimates. Section D, which is devoted to the results from the demand-for-cash model, demonstrates that a structural break in the demand for cash, which can be interpreted as evidence of a decrease in the size of the shadow economy, took place in 2004. Section E concludes.
B. Background: Driving Out Endemic Corruption
57. Georgia’s experience since its independence in 1991 has been daunting. The country lived through a two-thirds decline in real GDP, two civil wars ending with de-facto secession of two provinces, and a virtual collapse of its infrastructure. Under President Shevardnadze’s administration, the government had been perceived as inefficient, highly corrupt, and unable to bring about a rapid change in the country’s grave situation. Public frustration eventually led to a political upheaval known as the “Rose Revolution” in November 2003.
58. The new leadership under President Saakashvili was determined to quickly address public concerns about poor governance. It prosecuted a large number of corrupt officials from the former administration and major state-owned enterprises. Moreover, it signaled a clear break with the past by appointing a new generation of policymakers—mostly unrelated to the Shevardnadze government—to key government positions that are particularly vulnerable to corruption (including in the tax and customs departments of the ministry of finance and the ministry of interior).
59. Public sector reforms and reintegration of a breakaway region improved the efficiency of public institutions and reduced the scope for tax evasion. The Georgian authorities reduced the number of civil servants in order to improve remuneration, quality, and impartiality of the remaining staff. To realize efficiency gains, the number of ministries was reduced from 18 to 14, and some redundant government entities were abolished. Moreover, many government bodies—including the law-enforcement agencies and tax and customs services—significantly reduced the number of employees and increased the
33 See Kaufmann and Kaliberda (1996), and Johnson, Kaufmann, Schleifer, Goldman, and Weitzman (1997).
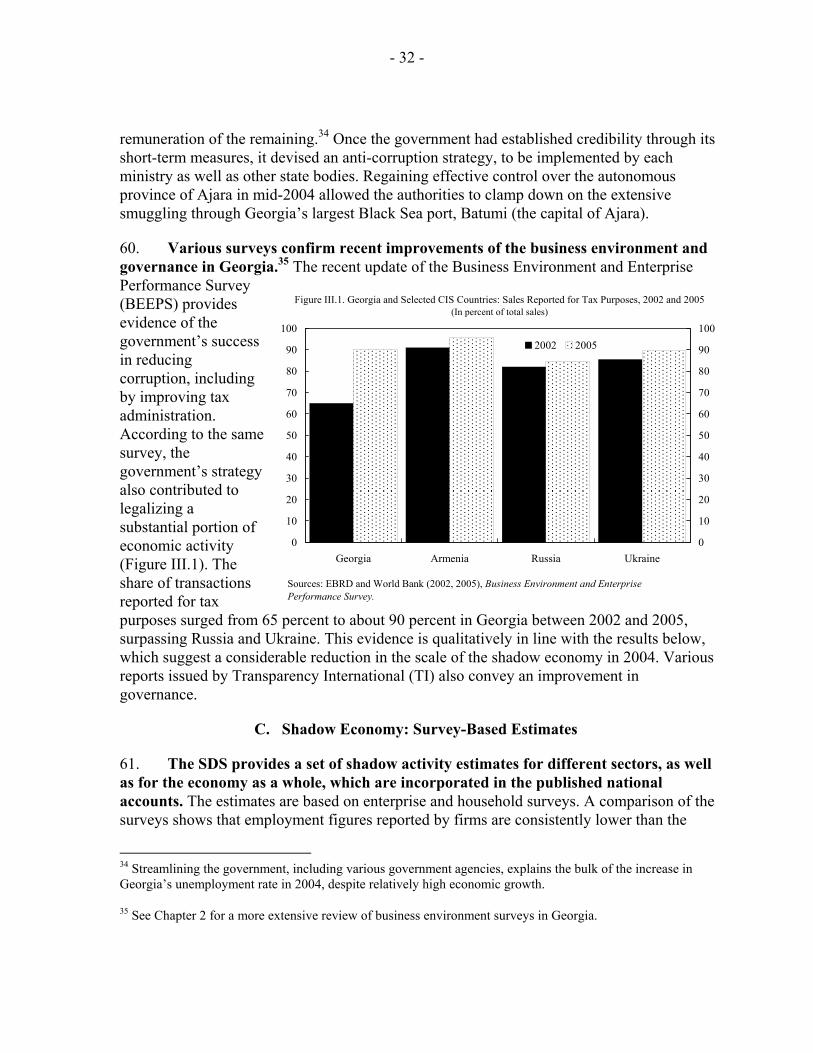
- 32 -
remuneration of the remaining.34 Once the government had established credibility through its short-term measures, it devised an anti-corruption strategy, to be implemented by each ministry as well as other state bodies. Regaining effective control over the autonomous province of Ajara in mid-2004 allowed the authorities to clamp down on the extensive smuggling through Georgia’s largest Black Sea port, Batumi (the capital of Ajara).
60. Various surveys confirm recent improvements of the business environment and governance in Georgia.35 The recent update of the Business Environment and Enterprise Performance Survey (BEEPS) provides evidence of the government’s success in reducing corruption, including by improving tax administration. According to the same survey, the government’s strategy also contributed to legalizing a substantial portion of economic activity (Figure III.1). The share of transactions reported for tax purposes surged from 65 percent to about 90 percent in Georgia between 2002 and 2005, surpassing Russia and Ukraine. This evidence is qualitatively in line with the results below, which suggest a considerable reduction in the scale of the shadow economy in 2004. Various reports issued by Transparency International (TI) also convey an improvement in governance.
C. Shadow Economy: Survey-Based Estimates
61. The SDS provides a set of shadow activity estimates for different sectors, as well as for the economy as a whole, which are incorporated in the published national accounts. The estimates are based on enterprise and household surveys. A comparison of the surveys shows that employment figures reported by firms are consistently lower than the
34 Streamlining the government, including various government agencies, explains the bulk of the increase in Georgia’s unemployment rate in 2004, despite relatively high economic growth.
35 See Chapter 2 for a more extensive review of business environment surveys in Georgia.
Figure III.1. Georgia and Selected CIS Countries: Sales Reported for Tax Purposes, 2002 and 2005(In percent of total sales)
Sources: EBRD and World Bank (2002, 2005), Business Environment and Enterprise Performance Survey.
0
10
20
30
40
50
60
70
80
90
100
Georgia Armenia Russia Ukraine0
10
20
30
40
50
60
70
80
90
1002002 2005

- 33 -
figures obtained from the labor force survey. The difference is used as a proxy for informal employment. The estimates of shadow economy output are based on the assumption that output is proportional to employment and that the employment-output relation is uniform across industries.
62. The official estimates suggest that the efforts by Georgia’s new leadership have resulted in a tangible decrease in the scale of shadow activities (Figure III.2). The share of shadow activity in the overall economy drops noticeably from 33.6 percent on average in 2003 to 29.2 percent in 2004 (top-left panel). The other panels decompose this effect into the shadow activity shares in selected sectors. The sectors displayed in Figure 2 (electricity, gas, and water supply; construction; trade and repair services; health care and social services; and mining and quarrying) are the ones with the largest contribution to the overall decrease in the shadow economy share between the first quarter of 2003 and the first quarter of 2004 (i.e., between the first quarter of the last year before and the first quarter after the revolution).
63. Although the size of the shadow economy shrunk through the fourth quarter of 2004, some sectors show recent signs of a rebound in underground activities. In some sectors, this could be related to seasonal effects that were already present before the Rose revolution (construction and, to a lesser extent, mining and quarrying). In other sectors, such as the utility sector, the revival of shadow activities could have been triggered by a perception that the government’s enforcement effort has slowed somewhat.
64. Notwithstanding the intuitive results, the method used by the SDS hinges on a number of crucial assumptions that may bias the estimates. First, the method assumes that answers by survey participants were not affected by the political regime change itself rather than by a change in their economic behavior. Such drastic changes in the political environment could, however, tip respondents’ willingness to disclose employment in a shadow economy business. Second, the method assumes that each sector’s output is proportional to the number of employees. Not distinguishing between capital-intensive and labor-intensive sectors may bias the results toward the changes in labor-intensive sectors. Finally, the SDS uses some ad-hoc information and, sometimes, makes adjustments that are purely judgmental and difficult to control. Hence, although the results obtained with the SDS approach are interesting, it would be desirable to corroborate these results by comparing them with estimates based on an alternative approach, such as the demand-for-cash method.
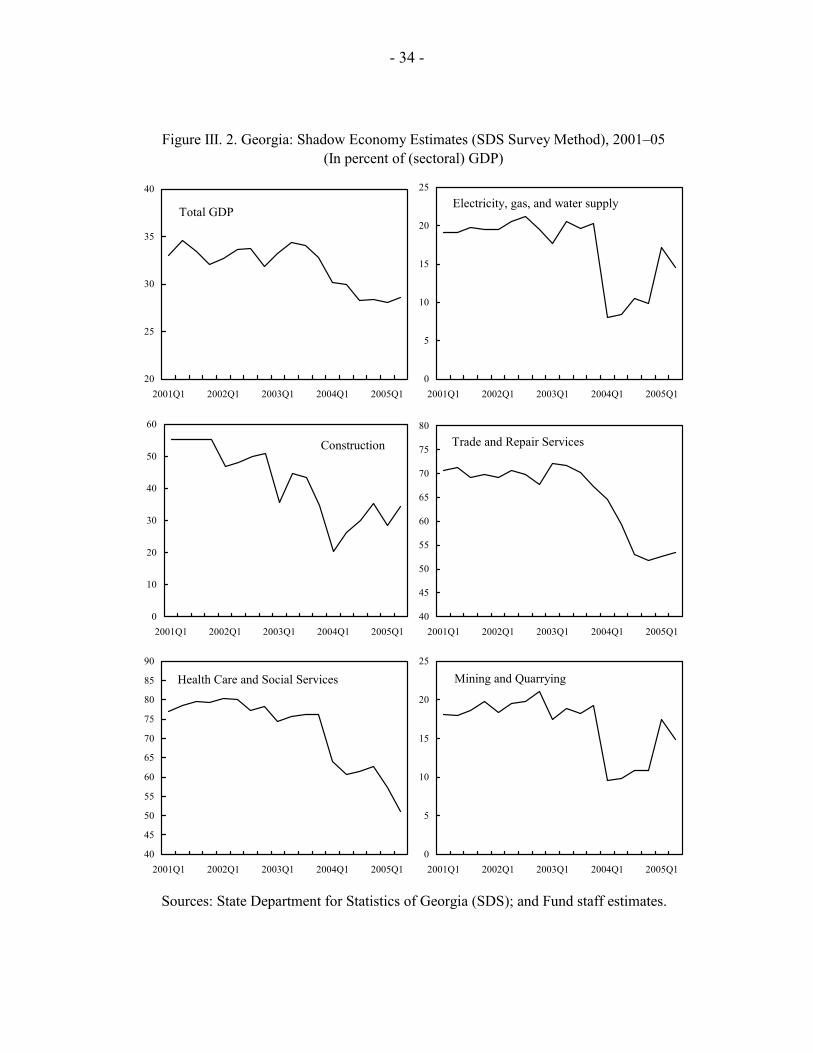
- 34 -
Figure III. 2. Georgia: Shadow Economy Estimates (SDS Survey Method), 2001–05(In percent of (sectoral) GDP)
Sources: State Department for Statistics of Georgia (SDS); and Fund staff estimates.
Total GDP
20
25
30
35
40
2001Q1 2002Q1 2003Q1 2004Q1 2005Q1
Electricity, gas, and water supply
0
5
10
15
20
25
2001Q1 2002Q1 2003Q1 2004Q1 2005Q1
Construction
0
10
20
30
40
50
60
2001Q1 2002Q1 2003Q1 2004Q1 2005Q1
Trade and Repair Services
40
45
50
55
60
65
70
75
80
2001Q1 2002Q1 2003Q1 2004Q1 2005Q1
Health Care and Social Services
40
45
50
55
60
65
70
75
80
85
90
2001Q1 2002Q1 2003Q1 2004Q1 2005Q1
Mining and Quarrying
0
5
10
15
20
25
2001Q1 2002Q1 2003Q1 2004Q1 2005Q1
- 35 -
D. Shadow Economy: The Demand for Cash
65. An alternative approach to estimating the share of the shadow economy is based on the demand for cash. Originally introduced by Cagan (1958) and Gutmann (1977), this approach analyzes changes in the demand for currency, assuming that the shadow economy uses mainly cash for its transactions. Hence, changes in the demand for cash may provide information about changes in the size of shadow economy. Lower demand for cash would signal a decrease of the shadow economy. This approach has been implemented recently for a number of countries—see Faal (2003) for evidence on Guyana; Hill and Kabir (2000) on Canada; and Zaman (1998) and Shabsigh (1995) on Pakistan.36
66. To verify whether the demand for cash dropped contemporaneously with the new government’s crackdown on corruption, the time series is tested for a structural break. Demand for cash is proxied by the ratio of cash in circulation to deposits and is modeled as a function of the real interest rate on deposits. In a cointegrated model of these two variables, the test for a break is applied for the first quarter of 2004, as indicated by the evidence in the preceding sections (especially Figure III.2).37
67. The structural break in the demand for cash appears statistically significant—and coincides with the new government’s effort to combat corruption. It results in a sharp decrease in the demand for cash in the first quarter of 2004. The drop is mainly due to a faster accumulation of lari deposits relative to the amount of cash in circulation (Figure III.3, top panel).
36 A modification proposed by Tanzi (1980, 1983) has often been applied in the more recent related literature. Hinging on the assumption that high tax rates drive economic activity in the underground, Tanzi’s version includes changes in taxation as a regressor. While this approach has been successfully applied to countries where the tax burden changed, it is not easily applicable to Georgia because the Georgian (nominal) tax rates have been largely stable until the 2005 tax reform. Effective tax rates, instead, rose because of stronger enforcement. From Tanzi’s perspective, this should have contributed to an increase in the size of the shadow economy—not a decrease. In other words, this approach involves an identification problem with regard to the dual role of the tax burden: at the same time, a higher effective tax burden drives economic agents underground, but it also acts as a sign of better enforcement, providing incentives to legalize economic activity that otherwise would remain informal. Tanzi’s approach presumes that the first effect prevails—an assumption that is not backed by anecdotal nor the SDS evidence. Hence, this chapter estimates the demand for cash as a function of the real interest rate on deposits only and tests it for a break in the first quarter of 2004. Thus, our approach is closer to the one by Cagan (1958) and Gutmann (1977).
37 Technical details are available upon request. The breakpoint choice is corroborated by statistical testing. Although the break would also be statistically significant for some other quarters, the statistical fit is optimized with a break in the first quarter of 2004. Seasonal dummies are used to account for intra-year fluctuations. Inflation is an implicit regressor as the specification uses the real interest rate (as opposed to the nominal interest rate).
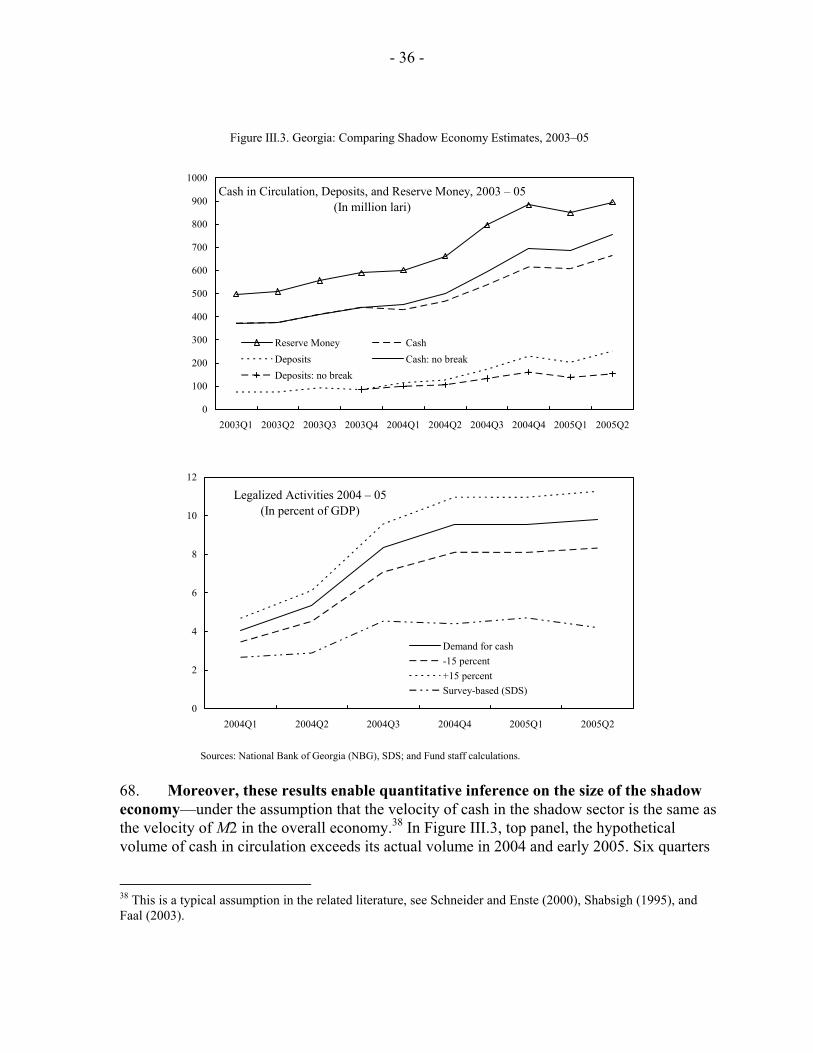
- 36 -
Figure III.3. Georgia: Comparing Shadow Economy Estimates, 2003–05
Sources: National Bank of Georgia (NBG), SDS; and Fund staff calculations.
Cash in Circulation, Deposits, and Reserve Money, 2003 – 05(In million lari)
0
100
200
300
400
500
600
700
800
900
1000
2003Q1 2003Q2 2003Q3 2003Q4 2004Q1 2004Q2 2004Q3 2004Q4 2005Q1 2005Q2
Reserve Money CashDeposits Cash: no breakDeposits: no break
Legalized Activities 2004 – 05(In percent of GDP)
0
2
4
6
8
10
12
2004Q1 2004Q2 2004Q3 2004Q4 2005Q1 2005Q2
Demand for cash-15 percent+15 percentSurvey-based (SDS)
68. Moreover, these results enable quantitative inference on the size of the shadow economy—under the assumption that the velocity of cash in the shadow sector is the same as the velocity of M2 in the overall economy.38 In Figure III.3, top panel, the hypothetical volume of cash in circulation exceeds its actual volume in 2004 and early 2005. Six quarters
38 This is a typical assumption in the related literature, see Schneider and Enste (2000), Shabsigh (1995), and Faal (2003).
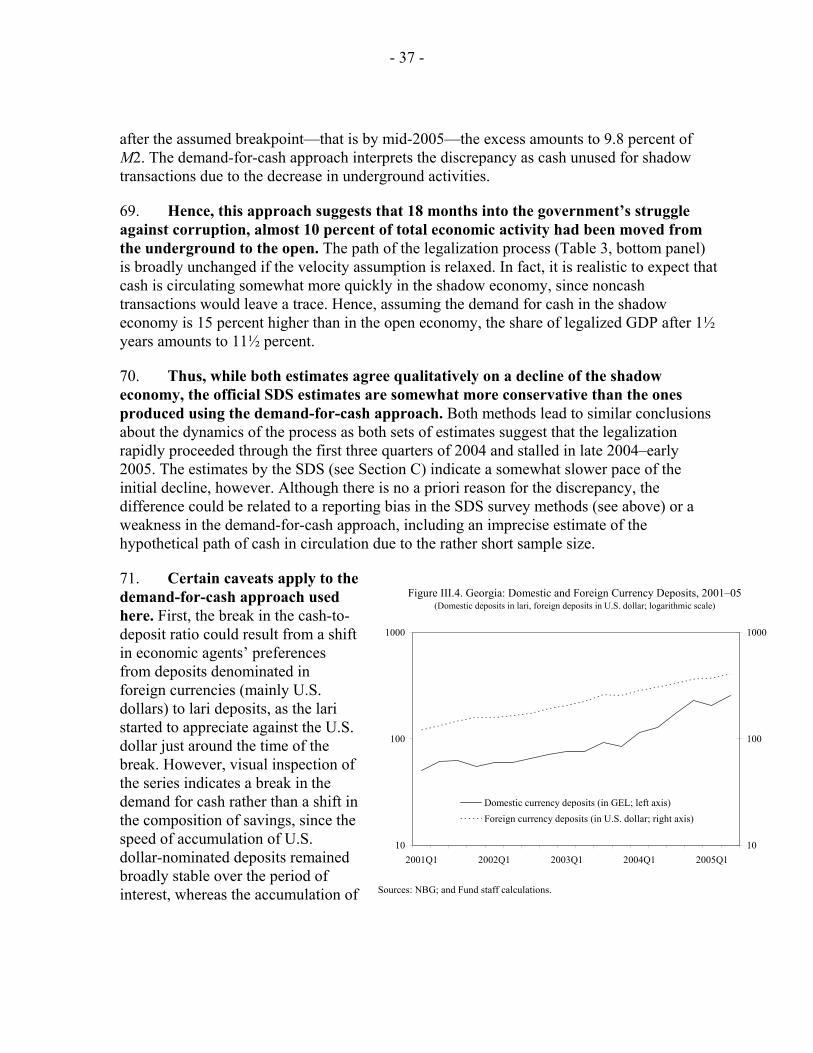
- 37 -
after the assumed breakpoint—that is by mid-2005—the excess amounts to 9.8 percent of M2. The demand-for-cash approach interprets the discrepancy as cash unused for shadow transactions due to the decrease in underground activities.
69. Hence, this approach suggests that 18 months into the government’s struggle against corruption, almost 10 percent of total economic activity had been moved from the underground to the open. The path of the legalization process (Table 3, bottom panel) is broadly unchanged if the velocity assumption is relaxed. In fact, it is realistic to expect that cash is circulating somewhat more quickly in the shadow economy, since noncash transactions would leave a trace. Hence, assuming the demand for cash in the shadow economy is 15 percent higher than in the open economy, the share of legalized GDP after 1½ years amounts to 11½ percent.
70. Thus, while both estimates agree qualitatively on a decline of the shadow economy, the official SDS estimates are somewhat more conservative than the ones produced using the demand-for-cash approach. Both methods lead to similar conclusions about the dynamics of the process as both sets of estimates suggest that the legalization rapidly proceeded through the first three quarters of 2004 and stalled in late 2004–early 2005. The estimates by the SDS (see Section C) indicate a somewhat slower pace of the initial decline, however. Although there is no a priori reason for the discrepancy, the difference could be related to a reporting bias in the SDS survey methods (see above) or a weakness in the demand-for-cash approach, including an imprecise estimate of the hypothetical path of cash in circulation due to the rather short sample size.
71. Certain caveats apply to the demand-for-cash approach used here. First, the break in the cash-to-deposit ratio could result from a shift in economic agents’ preferences from deposits denominated in foreign currencies (mainly U.S. dollars) to lari deposits, as the lari started to appreciate against the U.S. dollar just around the time of the break. However, visual inspection of the series indicates a break in the demand for cash rather than a shift in the composition of savings, since the speed of accumulation of U.S. dollar-nominated deposits remained broadly stable over the period of interest, whereas the accumulation of
Figure III.4. Georgia: Domestic and Foreign Currency Deposits, 2001–05(Domestic deposits in lari, foreign deposits in U.S. dollar; logarithmic scale)
Sources: NBG; and Fund staff calculations.
10
100
1000
2001Q1 2002Q1 2003Q1 2004Q1 2005Q110
100
1000
Domestic currency deposits (in GEL; left axis)Foreign currency deposits (in U.S. dollar; right axis)

- 38 -
lari deposits accelerated sharply in 2004 (Figure III.4).39 Second, increased trust in the banking system could also have contributed to higher deposits, thereby overstating the break in the cash-deposit ratio and, implicitly, the legalization effect. This argument is, however, inconsistent with the fact that lari deposits increased much more than U.S. dollar deposits. Unless depositors rationally expected an appreciation of the Georgian currency, increased trust in the banking system should have resulted in higher deposits independently of the denomination, as there was little change in relative remuneration. Third, the results could be biased due to omitted explanatory variables, such as the exchange rate, the degree of dollarization, and financial development.40
E. Conclusions
72. This chapter uses the demand-for-cash approach to confirm evidence of a contraction in the shadow economy in Georgia following the political changes in late-2003. It finds that the demand for cash decreased at the time of the political regime change, which could be interpreted as a reduction in underground economic activity. Thus, the analysis qualitatively confirms the official estimates of shadow economy developments. Quantitatively, however, the demand-for-cash approach indicates that the degree of legalization may have been twice as high as recorded by the survey-based SDS estimates.
73. Underestimating the degree of legalization could lead to a biased assessment of actual and potential economic growth going forward. If the share of the shadow economy in total GDP is, in fact, lower than indicated by the SDS, a larger part of reported GDP growth is due to legalized activity, not to actual growth. In fact, a rough calculation shows that true 2004 economic growth might be only about 2 percent, assuming that the SDS estimate of a decrease in the shadow economy share by about 4½ percentage points from end-2003 to end-2004 is correct. If, instead, the degree of legalization was even higher, along the lines of the demand-for-cash results, true real growth in 2004 could have been negative. For 2005, real and reported GDP growth are likely to be more similar, given that both approaches indicate a slowdown in the legalization process. Moreover, if the shadow economy is in fact smaller than officially assumed, high economic growth in the medium term will have to come from different sources. This bias will have to be kept in mind when assessing growth estimates in countries with a significant shadow economy such as Georgia.
74. The accomplishments of the Saakashvili administration in combating corruption remain remarkable, although the demand-for-cash estimate may overstate the 39 A more formal argument is available upon request. In brief, a statistically significant break occurs in the growth rate of lari deposits, but not in U.S. dollar-denominated deposits. Moreover, testing a hypothesis of equal but opposite changes in the growth rates results in a rejection.
40 While this in principle true, none of these variables displays a pattern that could help explain the variations in the demand for money without affecting demand for foreign currency (see previous footnote). Dollarization is not included as a regressor due to possible endogeneity issues.

- 39 -
legalization success somewhat—including due to a possible omitted-variable bias. Most countries around the world have been far less successful in reigning in corruption, and when successful, the process often took much longer. Some of the key factors in Georgia include (i) the extremely high degree of perceived corruption before the regime change; (ii) the fact that the change in government came at the right moment—that is, the population showed discontent in general, but the high level of corruption appeared especially onerous to many; and (iii) the fact that the change in administration was so significant—many officials of the new government were very young and came from an NGO background. In other words, the quick and substantial success in legalizing parts of the economy is state-contingent, reflecting excessive corruption compared to Georgia’s peers and a virtually complete turnover of government officials. To replicate these results, other countries will have to be in a similar starting position and dispose of a similar determination—both among the population and at a political level.
75. Both the demand-for-cash approach applied in this chapter and the survey-based estimates by the SDS suggest that the share of the shadow economy in overall GDP stabilized by end-2004 after steadily decreasing through the first three quarters of the year. Thus, the anti-corruption measures that were applied by the new Georgian government immediately after coming to power have probably run their course by now. Further progress may require either stepping up enforcement measures to their high post-revolution levels or intensifying efforts to improve governance and the business climate, including further civil service reforms; a reduction of red tape and further streamlining of regulations and procedures (without putting the regulatory framework as such at risk); and privatization of the remaining state-owned enterprises.

- 40 -
References
Cagan, Phillip, 1958, “The Demand for Currency Relative to the Total Money Supply,” Journal of Political Economy, 66(3), pp. 302–328.
EBRD and World Bank, 2002 and 2005, Business Environment and Enterprise Performance Survey (London and Washington, DC).
Faal, Ebrima A., 2003, “Currency Demand, the Underground Economy, and Tax Evasion: The Case of Guyana,” IMF Working Paper 03/7.
Gutmann, Peter M., 1977, “The Subterranean Economy,” Financial Analyst Journal, 34(1), pp. 24–27.
Hill, Roderick, and Muhammed Kabir, 2000, “Currency Demand and the Growth of the Underground Economy in Canada, 1991–1995,” Applied Economics, 32(2), February, pp. 183–192.
Johnson, Simon, Daniel Kaufmann, Andrei Scleifer, Marshall I. Goldman, and Martin L. Weitzman, 1997, “The Unofficial Economy in Transition,” Brookings Papers on Economic Activity, Vol. 1997(2), pp. 159 – 239.
Kaufmann, Daniel, and Aleksander Kaliberda, 1996, “Integrating the Unofficial Economy into the Dynamics of Post-Socialist Economies,” World Bank Policy Research Paper 1691.
Shabsigh, Ghiath, 1995, “The Underground Economy: Estimation, and Economic and Policy Implications–The Case of Pakistan,” IMF Working Paper 95/101.
Schneider, Friedrich, and Dominik H. Enste, 2000, “Shadow Economies: Size, Causes, and Consequences,” Journal of Economic Literature, 38(1), March, pp. 77–114.
Tanzi, Vito, 1980. “The Underground Economy in the United States: Estimates and Implications,” Banca Nazionale del Lavoro Quarterly Review, 135(4), pp. 427–453.
———, 1983, “The Underground Economy in the United States: Annual Estimates, 1930–1980,” IMF Staff Papers, 33(4), pp. 283–305.
Aslam, Salman, 1998, “The Underground Economy and Tax Evasion in Pakistan: Annual Estimates (1960–1998) and the Impact of Dollarization on the Economy,” Pakistan Development Review, 37(4), pp. 621–631.
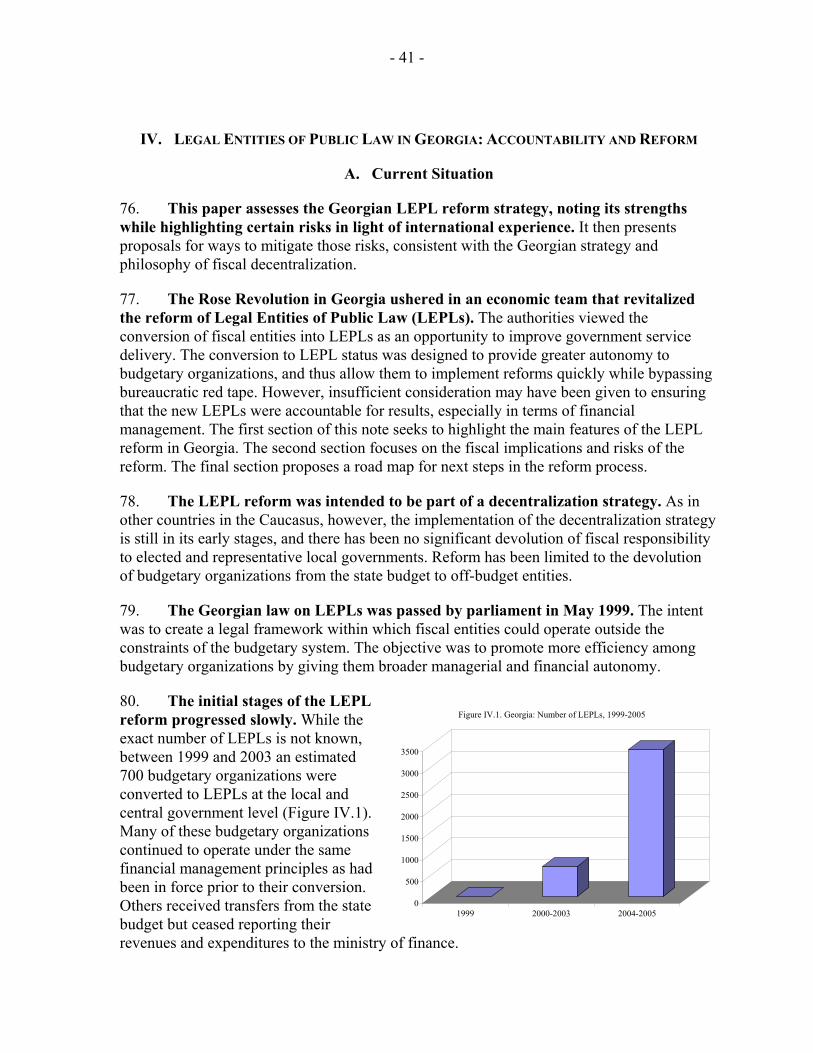
- 41 -
IV. LEGAL ENTITIES OF PUBLIC LAW IN GEORGIA: ACCOUNTABILITY AND REFORM
A. Current Situation
76. This paper assesses the Georgian LEPL reform strategy, noting its strengths while highlighting certain risks in light of international experience. It then presents proposals for ways to mitigate those risks, consistent with the Georgian strategy and philosophy of fiscal decentralization.
77. The Rose Revolution in Georgia ushered in an economic team that revitalized the reform of Legal Entities of Public Law (LEPLs). The authorities viewed the conversion of fiscal entities into LEPLs as an opportunity to improve government service delivery. The conversion to LEPL status was designed to provide greater autonomy to budgetary organizations, and thus allow them to implement reforms quickly while bypassing bureaucratic red tape. However, insufficient consideration may have been given to ensuring that the new LEPLs were accountable for results, especially in terms of financial management. The first section of this note seeks to highlight the main features of the LEPL reform in Georgia. The second section focuses on the fiscal implications and risks of the reform. The final section proposes a road map for next steps in the reform process.
78. The LEPL reform was intended to be part of a decentralization strategy. As in other countries in the Caucasus, however, the implementation of the decentralization strategy is still in its early stages, and there has been no significant devolution of fiscal responsibility to elected and representative local governments. Reform has been limited to the devolution of budgetary organizations from the state budget to off-budget entities.
79. The Georgian law on LEPLs was passed by parliament in May 1999. The intent was to create a legal framework within which fiscal entities could operate outside the constraints of the budgetary system. The objective was to promote more efficiency among budgetary organizations by giving them broader managerial and financial autonomy.
80. The initial stages of the LEPL reform progressed slowly. While the exact number of LEPLs is not known, between 1999 and 2003 an estimated 700 budgetary organizations were converted to LEPLs at the local and central government level (Figure IV.1). Many of these budgetary organizations continued to operate under the same financial management principles as had been in force prior to their conversion. Others received transfers from the state budget but ceased reporting their revenues and expenditures to the ministry of finance.
0
500
1000
1500
2000
2500
3000
3500
1999 2000-2003 2004-2005
Figure IV.1. Georgia: Number of LEPLs, 1999-2005
- 42 -
81. The Rose Revolution accelerated the pace of reform beginning in 2004 and by December 2005 the authorities had converted about 2,700 individual schools into LEPLs, bringing the estimated number of LEPLs to more than 3,400. While schools had previously been local government budget organizations, they were converted to central government LEPLs. The conversion of schools to LEPLs is part of a broader education reform strategy designed to substantially improve educational attainment, which had been in decline since the early 1990s.
B. Fiscal Implications and Risks
82. The objectives of the Georgian LEPL reform are similar to the objectives of successful fiscal decentralization strategies in other countries. The logic underpinning most fiscal decentralizations is to increase the independence of local governments with regard to certain fiscal institutions and public services, while simultaneously ensuring greater accountability through direct local elections. By giving elected local authorities the power to set their own priorities and reform agenda, decentralization can provide an institutional framework that allows increased accountability and an accelerated pace of reform.
83. In Georgia, the LEPL reform has not been undertaken in the context of a broader strategy of fiscal decentralization. The Georgian LEPL reform is premised on the idea that granting operational autonomy to the management teams of budgetary organizations turned LEPLs empowers each organization to set its own goals and priorities and to implement them swiftly. However, unlike a representative local government, the management team of the LEPL is not directly subject to the scrutiny of an electorate that will hold it accountable for delivering results. Thus, while one objective of decentralization is to increase accountability to the recipients of government services at the local level, the way the LEPL strategy has been implemented in Georgia may have actually reduced accountability. As a result, additional safeguards must be put in place to ensure the accountability of those in charge of LEPLs.
84. Given its unique characteristics, the LEPL system in Georgia must be carefully designed so as not to undermine sound fiscal management or create additional fiscal pressures. In its current state, some features of the LEPL reform could exacerbate or give rise to significant fiscal risks. This section outlines the key fiscal issues and risks that should be addressed in order to ensure the success of the LEPL reform in Georgia.
85. The larger the number and size of LEPLs, the more significant the fiscal risks that must be addressed and mitigated. While there is no comprehensive database of all LEPLs and their charter information, the authorities are in the process of preparing such a database. Without this database, economic policymakers cannot assess the size or sectoral composition of LEPLs, and do not have reliable and timely access to basic information. An assessment of fiscal risk for the LEPL sector at a minimum requires policymakers to have knowledge of the names of all LEPLs and how they are governed.
- 43 -
86. While the creation of this database is an important step in strengthening the LEPL process, a number of other significant problems also need to be addressed. These problems relate to the monitoring and reporting of fiscal activities in Georgia, the capacity to execute comprehensive fiscal policy, the quality of spending, potential debt developments, and a possible loss of revenues.
87. The LEPL reform in its present state weakens the monitoring and reporting of the fiscal accounts of the general government. Once they have opened commercial bank accounts, LEPLs do not present information to the ministry of finance about their revenues or expenditures. Even when an LEPL has received a subsidy or transfer from the state budget, it is not required to report if or how those funds are spent. This means that, where previously the general government of Georgia accounted for virtually all its revenues and expenditures, an increasingly large portion of those revenues and expenditures will no longer be reflected in the fiscal accounts. As LEPLs grow in number and importance, the size of the general government as well as its fiscal position will become increasingly difficult to assess.
88. The current requirements on reporting of revenues and expenditures will result in a deterioration of the economic classification in the budget and decrease budget transparency. By recording state budget transfers to LEPLs as lump sums, and not recording the corresponding expenditures, the composition of central government expenditures will change significantly over time. The most obvious impact is on the reported composition of expenditures, which will bear increasingly little resemblance to the actual composition of expenditures. For example, what were previously recorded as wage and salary payments by the central government on behalf of budgetary organizations will now be reported as subsidies and transfers or expenditure on goods and services, although the actual level of wages and salaries has not changed. In the case of LEPLs that do not require transfers from the state budget, revenues and expenditures may not be recorded at all. This erosion in transparency will also undermine the government’s ability to set expenditures priorities, since it will lack a comprehensive picture of expenditures across categories.
89. The capacity to execute fiscal policy may also be undermined by the government’s inability to manage the cash balances of LEPLs. A macroeconomic shock, such as a sharp drop in economic activity related to a pandemic or a surge in energy prices, could necessitate a decisive fiscal response. If the central government lacks the ability to effectively manage total revenues and expenditures in a time of crisis, a change in the fiscal policy stance might become unattainable, as LEPLs—acting in line with their own interests—may offset the macroeconomic impact of actions taken by the central government. In addition, as each LEPL can have its own commercial bank account, and thus the cash balances of the general government could be held in several thousand accounts, it may be impossible for the ministry of finance to assess the level or change in net credit to government. A change in the fiscal stance could require close and simultaneous cooperation from thousands of LEPLs and their financial managers.
90. The revenues and expenditures of LEPLs are not reported to the ministry of finance, resulting in little or no control over the quality of those expenditures. Some

- 44 -
LEPLs are required to report to line ministries, but sectoral experts in line ministries may lack the expertise in public financial management to assess and audit the information they receive. Moreover, there is no consistent set of guidelines in place to ensure timely, comprehensive, and consistent reporting of financial information across line ministries. The devolution of expenditure authority, without a clear set of guidelines for control, accountability and reporting, poses a clear risk that resources will be mismanaged. Potentially more worrisome for a government that has established its credibility by paying its bills is the inability to prevent the accumulation of arrears.
91. There is a significant fiscal risk associated with LEPL debt and borrowing. Georgia’s LEPL law requires that ministry of finance authorization be sought before LEPLs incur debt. However, experience in other countries41 has shown that in practice LEPLs and commercial banks can enter into debt contracts in the absence of explicit authorization from the ministry of finance.42 Most commercial banks view LEPLs as part of the general government, and they might lend to an LEPL that lacks authorization under the assumption that the central government will act as a guarantor in cases where the LEPL cannot pay its debts.43 Thus, guidelines on financial management of LEPLs should be issued and should include explicit provisions on the bank arrangements of LEPLs, including a prohibition on any commercial bank borrowing by LEPLs, as well as clear requirements for the reporting of financial information to ensure that no arrears are being incurred.
92. Finally, there is a potential loss of revenue associated with the LEPL reform as it is being implemented. Georgia continues to build upon its strong revenue performance since 2004. However, revenue performance at the local government level deteriorated in 2005 and the reliance of local governments on central government transfers increased steadily between 2003 and 2005. Granting LEPLs revenue raising responsibility over their own non-tax revenue sources could create positive incentives for better expenditure management. However, a lack of technical capacity at the LEPL level may also lead to a significant drop in revenues collected, increase the vertical fiscal imbalance44 even further, and undermine the expected gains in expenditure efficiency (Figures IV.2 and IV.3).
41 Ter-Minassian (1997).
42 Shah (2005).
43 Recent examples include Argentina and Bolivia during the 1990s, both of which experienced widespread cases of local government borrowing from commercial banks without the legal authorization required from the ministry of finance.
44 The vertical fiscal imbalance is defined as the ratio of central government transfers and grants to local governments’ own revenues.
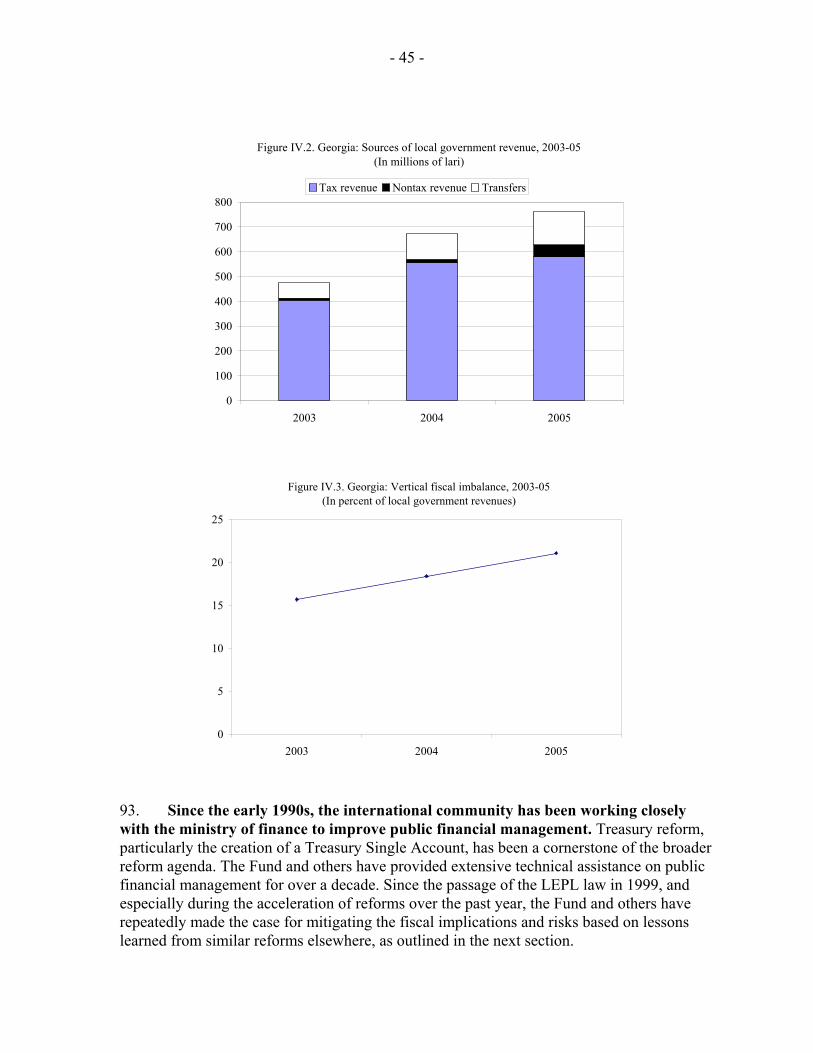
- 45 -
Figure IV.2. Georgia: Sources of local government revenue, 2003-05(In millions of lari)
0
100
200
300
400
500
600
700
800
2003 2004 2005
Tax revenue Nontax revenue Transfers
Figure IV.3. Georgia: Vertical fiscal imbalance, 2003-05(In percent of local government revenues)
0
5
10
15
20
25
2003 2004 2005
93. Since the early 1990s, the international community has been working closely with the ministry of finance to improve public financial management. Treasury reform, particularly the creation of a Treasury Single Account, has been a cornerstone of the broader reform agenda. The Fund and others have provided extensive technical assistance on public financial management for over a decade. Since the passage of the LEPL law in 1999, and especially during the acceleration of reforms over the past year, the Fund and others have repeatedly made the case for mitigating the fiscal implications and risks based on lessons learned from similar reforms elsewhere, as outlined in the next section.
- 46 -
C. International Experiences
94. The implications of inadequate monitoring and reporting on both fiscal accounts and budget transparency were evident in the case of Armenia. The conversion of thousands of public entities to noncommercial organizations (NCOs) without adequate monitoring and reporting provisions resulted in the loss of ability to produce consolidated government accounts. The lack of an adequate reporting framework also had negative consequences for budget transparency, because transfers to NCOs were recorded as purchases on goods and services, thus leading to underestimation of other expenditure categories such as public sector wages and salaries. In 2003, Armenia began working toward a framework for NCOs, the credibility of which is still in doubt six years later.
95. The cases of Bolivia and Argentina illustrate the difficulties of macroeconomic coordination in the absence of effective monitoring and control mechanisms. Following several years of economic and political crisis, the Bolivian government was forced to adjust its fiscal stance in 2004. Fiscal monitoring and reporting mechanisms were extremely weak, and local governments lacked incentives to engage in the coordination of macroeconomic policy. As a result, the fiscal effort had to be concentrated at the central government level.45 As in the case of Bolivia, macroeconomic coordination in Argentina during the mid-1990s was impaired by a lack of full and reliable information on the fiscal stance of local governments and by the inability to effectively control subnational borrowing.46
96. The experience of countries like Canada has shown that market discipline alone is often not enough to mitigate the fiscal risks of local government borrowing.47 In Canada, the provincial governments could borrow overseas or domestically without limit, subject only to market discipline. As borrowing increased, several provincial ratings were downgraded, but not before provincial debt rose from 4.9 percent of GDP in 1980 to 22.7 percent of GDP in 1994.48
97. In Colombia, the sequencing of fiscal reforms played an important role in promoting enhanced fiscal transparency and the subsequent improvement of public service delivery. Important financial resources were transferred from the center of the local governments in the mid-1990s, while the assignment of expenditure responsibilities lagged behind. A series of fiscal responsibility laws managed to tackle most of these problems. Fiscal rules were established that brought down local debt and put local public finances on a sustainable footing. Some mechanisms to improve macroeconomic coordination among 45 IMF Fiscal Affairs Department (forthcoming).
46 IMF Fiscal Affairs Department (forthcoming).
47 Ter-Minassian and Craig (1997).
48 Krelove, Stotsky and Vehorn (1997).

- 47 -
layers of government were set up. However, there remains scope to further clarify expenditure responsibilities and coordinate budgets and fiscal targets across levels of government further. Moreover, the government has recently taken steps to further improve the reporting and monitoring of subnational governments.
98. In some emerging market countries, the devolution of revenue raising responsibility led to declining revenues and increased vertical fiscal imbalances. For example, in the cases of Russia and the Czech Republic, the vertical fiscal imbalance grew significantly during the mid-1990s.49
99. Vertical fiscal imbalances can also deteriorate when increasing expenditure mandates are not matched by increased funding. In China, the government recentralized most revenue in the mid-1990s and in principle implemented a more rule-based and transparent transfer system; however, local governments were left to foot the bill of increased mandates in social sectors—such as pension, health, and education—which traditionally had been carried out by public enterprises. As these were reformed, such responsibilities were transferred to local governments, but without commensurate increase in their funding. As a result, reliance on extrabudgetary revenues, although declining, is still present; there is also anecdotal evidence about accumulation of arrears and indirect borrowing at the local government level, possibly creating future liabilities and fiscal risks for the government as a whole.
D. Next Steps
100. Future reforms should build on the past ten years of progress in public financial management. In order to address weaknesses in expenditure policy and execution in the past, Georgia undertook a series of reforms, including treasury reform to improve the commitment control system and a move toward a single treasury account. The move toward the single treasury account, in line with current international best practices, aimed at increasing fiscal transparency and improving public financial management. With a single treasury account, the government will be able to implement proper cash management procedures.
101. The first step toward enhancing fiscal transparency and ensuring accountability involves the creation of a database of all registered legal entities of public law. This step is underway and should be completed by end-March 2006. Such a database will give the authorities an opportunity to define the number and size of organizations currently operating under this status. The database should be built in the first instance to ensure that all organizations operating as LEPLs are identified and properly registered, and that all legal requirements at the time of their establishment have been met. This includes, but is not limited to, the following: name, legal status, governance framework, provisions for financial
49 Bryson and Cornia (2000).
- 48 -
reporting, and procedures for accountability and internal control. The database will be an important step toward assessing the size and importance of the LEPL sector, and will guide further measures.
102. The next step in addressing the fiscal issues and risks outlined above is through the issuance of guidelines that better define the mechanisms of control for LEPLs. The issuance of these guidelines is important in addressing the specific issues related to fiscal monitoring and reporting outlined above. For example, the supervisory boards of LEPLs are subject to oversight by state agencies of control. However, since those state agencies are also represented on the boards, an inherent conflict of interest in embedded in the control mechanism. Those LEPLs that receive funds from the state budget should in theory be subject to audit by the chamber of control; but the scope of the auditing provision and its implementation remains to be defined. In addition, it is not clear if the chamber has the technical expertise and manpower to evaluate the balance sheets of thousands of individual LEPLs. The treasury, on the other hand, has the needed technical expertise and can acquire the capacity. The guidelines should define an appropriate monitoring framework for LEPLs, including what information they are required to report and to whom. The guidelines should be targeted at those classified in the database as nonmarket LEPLs.
103. The third step in addressing the fiscal issues and risks is the operationalization of an effective monitoring framework for LEPLs. A first best option for the monitoring framework would be in the form of an adapted treasury regime, into which all central government nonmarket LEPLs are integrated. This regime would be distinct from the regime that applies to other budget organizations, and its objective would be to ensure that LEPLs are given full autonomy over their financial transactions, without sacrificing fiscal transparency. In essence, the treasury would serve as the bank for each LEPL. Transition to an adapted treasury regime would require the authorities to (i) forgo commitment controls on LEPL accounts with the treasury; (ii) ensure that the other decentralized systems of control defined in the guidelines are firmly established in order to compensate for the lack of commitment controls; (iii) establish a treasury ledger account in lieu of a commercial bank account for each central government LEPL that is a nonmarket and nonprofit institution; (iv) implement a zero ceiling on borrowing by LEPLs; (v) provide regular planning and execution reports on the financial performance of nonmarket nonprofit LEPLs in the context of general government fiscal reporting; (vi) ensure verification of consolidated execution reports of central government LEPLs by the treasury; and (vii) further enhance technical capacity at the treasury.
104. Other countries have sought to implement second best options based on a reporting framework outside of the treasury system. This has been true especially in cases where treasury reforms have been less successful than in Georgia and where there is less confidence in the ministry of finance. In some such cases, LEPLs have retained access to their commercial bank accounts and reported their financial information and commercial banks statements directly to line ministries, who in turn relay that information to the ministry of finance responsible for assessing the general government’s fiscal stance. However, this
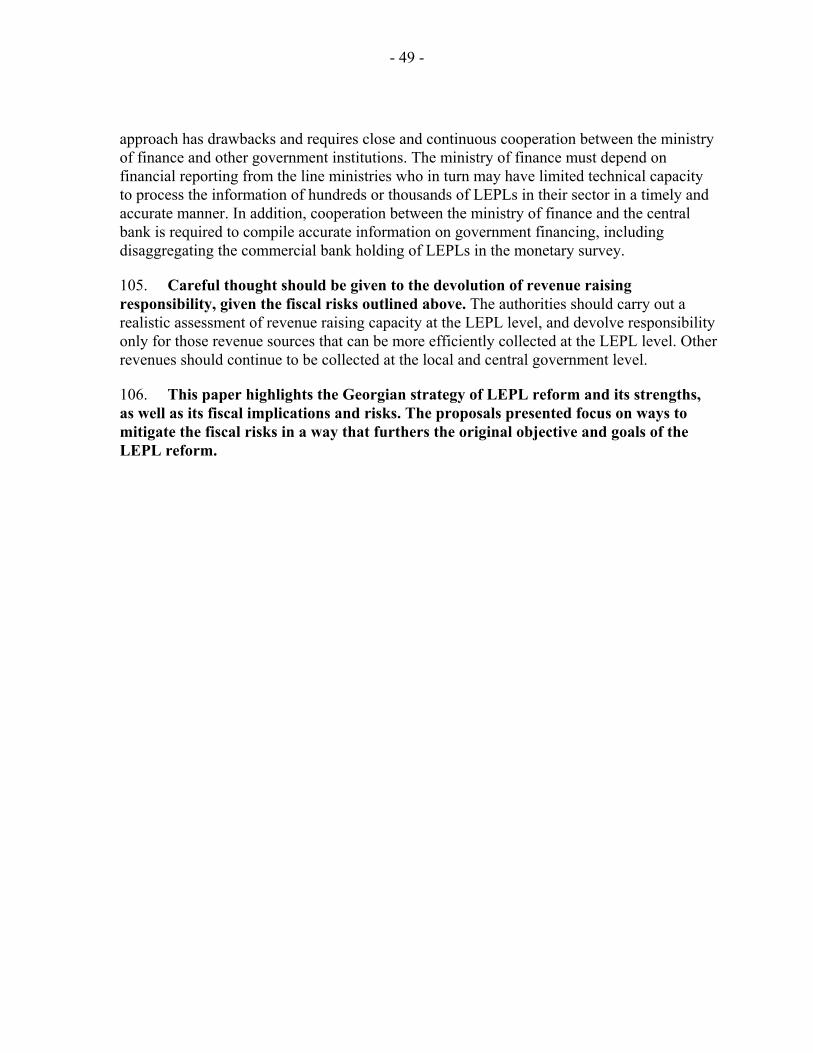
- 49 -
approach has drawbacks and requires close and continuous cooperation between the ministry of finance and other government institutions. The ministry of finance must depend on financial reporting from the line ministries who in turn may have limited technical capacity to process the information of hundreds or thousands of LEPLs in their sector in a timely and accurate manner. In addition, cooperation between the ministry of finance and the central bank is required to compile accurate information on government financing, including disaggregating the commercial bank holding of LEPLs in the monetary survey.
105. Careful thought should be given to the devolution of revenue raising responsibility, given the fiscal risks outlined above. The authorities should carry out a realistic assessment of revenue raising capacity at the LEPL level, and devolve responsibility only for those revenue sources that can be more efficiently collected at the LEPL level. Other revenues should continue to be collected at the local and central government level.
106. This paper highlights the Georgian strategy of LEPL reform and its strengths, as well as its fiscal implications and risks. The proposals presented focus on ways to mitigate the fiscal risks in a way that furthers the original objective and goals of the LEPL reform.

- 50 -
References
Bryson, Phillip and Gary Cornia, 2000, “Fiscal Decentralization in Economic Transformation: The Czech and Slovak Cases,” Europe-Asia Studies, Vol. 52(3), pp. 507–522.
Dabla-Norris, Era, 2005, “Issues in Intergovernmental Fiscal Relations in China,” IMF Working Paper No. 05/30 (Washington: International Monetary Fund).
Krelove, Russell, Janet G. Stotsky and Charles L. Vehorn, 1997, “Canada” in Fiscal
Federalism in Theory and in Practice, ed. by Teresa Ter-Minassian (Washington: International Monetary Fund).
Shah, Anwar, 2005, “Fiscal Decentralization and Fiscal Performance,” World Bank Policy
Research Working Paper No. 3786 (Washington: The World Bank). Ter-Minassian, Teresa, 1997, Fiscal Federalism in Theory and in Practice (Washington:
International Monetary Fund). ———, and Jon Craig, 1997, “Control of Subnational Government Borrowing”. Fiscal
Federalism in Theory and in Practice, ed. by Teresa Ter-Minassian (Washington: International Monetary Fund).
IMF Fiscal Affairs Department (forthcoming). Fund Advice on Fiscal Decentralization
(Washington: International Monetary Fund).
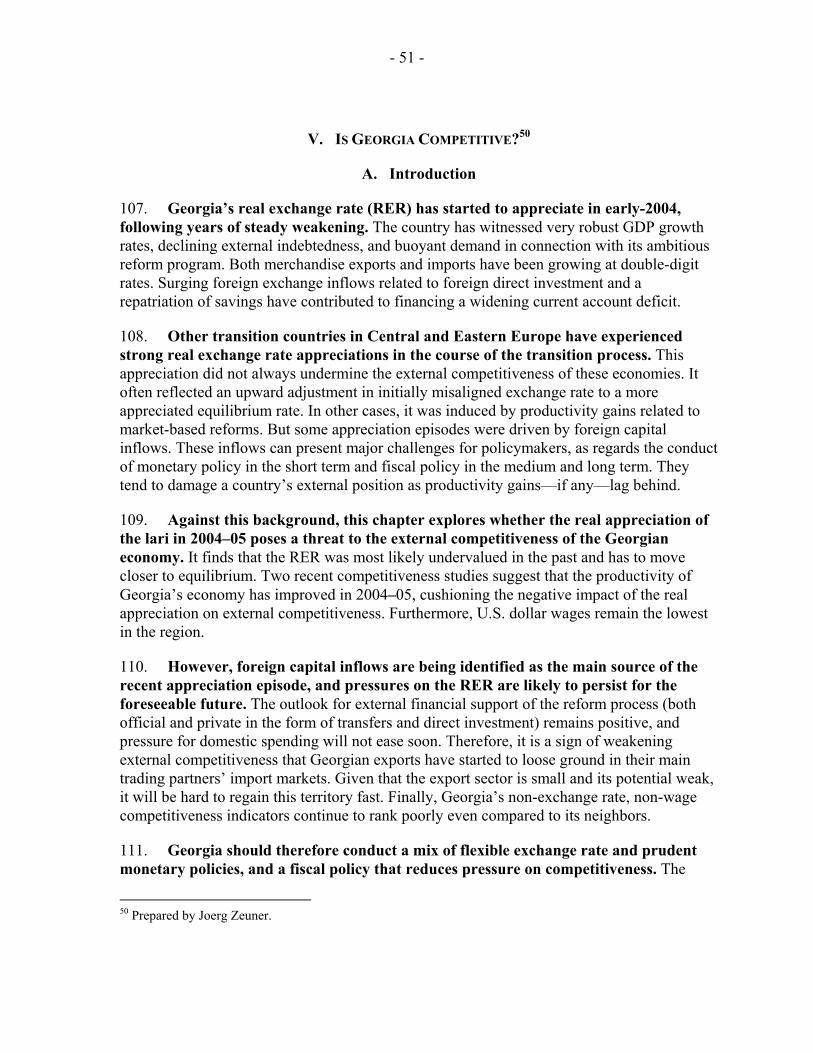
- 51 -
V. IS GEORGIA COMPETITIVE?50
A. Introduction
107. Georgia’s real exchange rate (RER) has started to appreciate in early-2004, following years of steady weakening. The country has witnessed very robust GDP growth rates, declining external indebtedness, and buoyant demand in connection with its ambitious reform program. Both merchandise exports and imports have been growing at double-digit rates. Surging foreign exchange inflows related to foreign direct investment and a repatriation of savings have contributed to financing a widening current account deficit.
108. Other transition countries in Central and Eastern Europe have experienced strong real exchange rate appreciations in the course of the transition process. This appreciation did not always undermine the external competitiveness of these economies. It often reflected an upward adjustment in initially misaligned exchange rate to a more appreciated equilibrium rate. In other cases, it was induced by productivity gains related to market-based reforms. But some appreciation episodes were driven by foreign capital inflows. These inflows can present major challenges for policymakers, as regards the conduct of monetary policy in the short term and fiscal policy in the medium and long term. They tend to damage a country’s external position as productivity gains—if any—lag behind.
109. Against this background, this chapter explores whether the real appreciation of the lari in 2004–05 poses a threat to the external competitiveness of the Georgian economy. It finds that the RER was most likely undervalued in the past and has to move closer to equilibrium. Two recent competitiveness studies suggest that the productivity of Georgia’s economy has improved in 2004–05, cushioning the negative impact of the real appreciation on external competitiveness. Furthermore, U.S. dollar wages remain the lowest in the region.
110. However, foreign capital inflows are being identified as the main source of the recent appreciation episode, and pressures on the RER are likely to persist for the foreseeable future. The outlook for external financial support of the reform process (both official and private in the form of transfers and direct investment) remains positive, and pressure for domestic spending will not ease soon. Therefore, it is a sign of weakening external competitiveness that Georgian exports have started to loose ground in their main trading partners’ import markets. Given that the export sector is small and its potential weak, it will be hard to regain this territory fast. Finally, Georgia’s non-exchange rate, non-wage competitiveness indicators continue to rank poorly even compared to its neighbors.
111. Georgia should therefore conduct a mix of flexible exchange rate and prudent monetary policies, and a fiscal policy that reduces pressure on competitiveness. The
50 Prepared by Joerg Zeuner.
- 52 -
nominal exchange rate should be allowed to adjust freely to external inflows, and monetary policy should target low single-digit inflation. The costs of inflation are higher and real appreciation cannot be avoided through exchange rate management. Fiscal policy needs to respond to the overall macroeconomic position to limit the real appreciation of the exchange rate. A fiscal program that is well-targeted on improving productivity (e.g., through infrastructure investments) will increase room for spending in this context. The authorities should also ensure that productivity continues to improve through market-based reforms that reduce paperwork and red tape. Transparency reforms will reduce the high cost of corruption. Finally, Georgia should simplify the administration of international trade, following the most recent moves towards further trade liberalization.
B. Recent Trends in Key Competitiveness Indicators
Real exchange rate trends
112. Recent movements in the real effective exchange rate (REER) indicate an erosion of Georgia’s external competitiveness in 2004–05 (Figure V.1). The REER bottomed out in late-2003 and began to rise gradually in early-2004. Between January 2004 and April 2005, it appreciated by 17 percent. Bilateral real exchange rates (BRERs) with the U.S. dollar and with the Russian ruble have moved in opposite directions. The U.S. dollar BRER shows a clear appreciation since 2001, while the ruble BRER depreciated steadily between 1999–2003 before stabilizing in 2004.51
113. The impact of these movements in the REER on the competitiveness of Georgia’s tradable sector is even more apparent when compared to the evolution of the real exchange rate of neighboring countries. Despite the 2004–05 appreciation episode, Georgia’s REER has remained below its 2001 level. However, in the past decade, Georgia is the only CIS country in the region (except Russia) for which the REER has tended to appreciate—together with the REERs of the much stronger economies of the three prospective EU member countries in the region (Bulgaria, Romania, and Turkey), after adjusting for actual trade weights. In contrast, neighboring CIS countries have maintained their RER levels (Figure V.2). 51 Inflation in Georgia was higher than in the United States and lower than in Russia over this period.
Figure V.1. Georgia: Real Effective Exchange Rates, 2001-05(Index, 1995=100)
100
120
140
160
Jan-01 Jul-01 Jan-02 Jul-02 Jan-03 Jul-03 Jan-04 Jul-04 Jan-05
REER
Bilateral ruble real exchange rate
Bilateral dollar real exchange rate
Source: IMF, INS database.

- 53 -
Armenia
Azerbaijan
Bulgaria
Georgia
Kazakhstan
Romania
Russia
Turkey
Ukraine
70
80
90
100
110
120
130
140
150
160
170
1995 1996 1997 1998 1999 2000 2001 2002 2003 2004 2005(H1)
Sources: IMF, INS ;and Fund staff estimates.
Figure V.2. Georgia: Real Effective Exchange Rates for the Region,1995-2005 (H1)
114. At the same time, the behavior of a CPI-based REER may not signal change in the external competitiveness of a country. The country may be a price taker for tradables. In this case, the CPI-based REER would stay flat even if production costs were rising. Alternatively, CPI inflation could signal an adjustment of the relative prices of (formerly) non-tradables to tradables which would not affect external competitiveness. It is therefore useful to examine additional, cost-based indicators for assessing Georgia’s external competitiveness.
Trends in selected cost-based indicators
115. Lack of data does not allow a cross-country comparison of ULC-based measures of the REER and 2005 U.S. dollar wage data is also not available to fully assess recent trends. However, while remaining lowest, the average monthly U.S. dollar wage in Georgia rose relative to the wages in every country in the sample in 2004, after four years of falling (Table V.1)
- 54 -
Table V.1. Georgia: Average Monthly U.S. Dollar Wages for the Region, 1999–2004
1999 2000 2001 2002 2003 2004
Georgia 38 42 44 47 49 71
Armenia 35 39 42 46 58 80Azerbaijan 1/ 45 50 56 65 79 91Bulgaria 108 105 114 124 160 186Romania 95 100 105 117 147 184Russia 64 80 113 141 179 237Ukraine 43 42 58 71 87 111
Wages in Georgia relative to wages in: (In percent)
Armenia 110 107 104 103 85 89Azerbaijan 85 85 79 73 62 78Bulgaria 35 40 39 38 31 38Romania 40 42 42 40 33 39Russia 59 52 39 33 27 30Ukraine 88 99 76 67 56 64
Sources: Georgian authorities; and Fund staff estimates.1/ January-June for 2004.
116. While providing only a snapshot, 2005 transportation cost data indicate that Georgia currently has a competitive disadvantage even compared to neighboring landlocked Armenia (Figure V.3). While the cost differential may have narrowed in recent years, sea shipment today of a 40-foot container from Norfolk, U.S., to Tbilisi is almost 50 percent more expensive than to the Baltic capitals and, more surprisingly, 10 percent more expensive than to Yerevan. Both shipments to Tbilisi and Yerevan arrive at the same Georgian port (Poti).
Figure V.3. Georgia: Transportation Cost for a 40 ft. Container(from Norfolk, U.S., in U.S. dollars)
0
500
1000
1500
2000
2500
3000
Armenia Estonia Lithuania Georgia
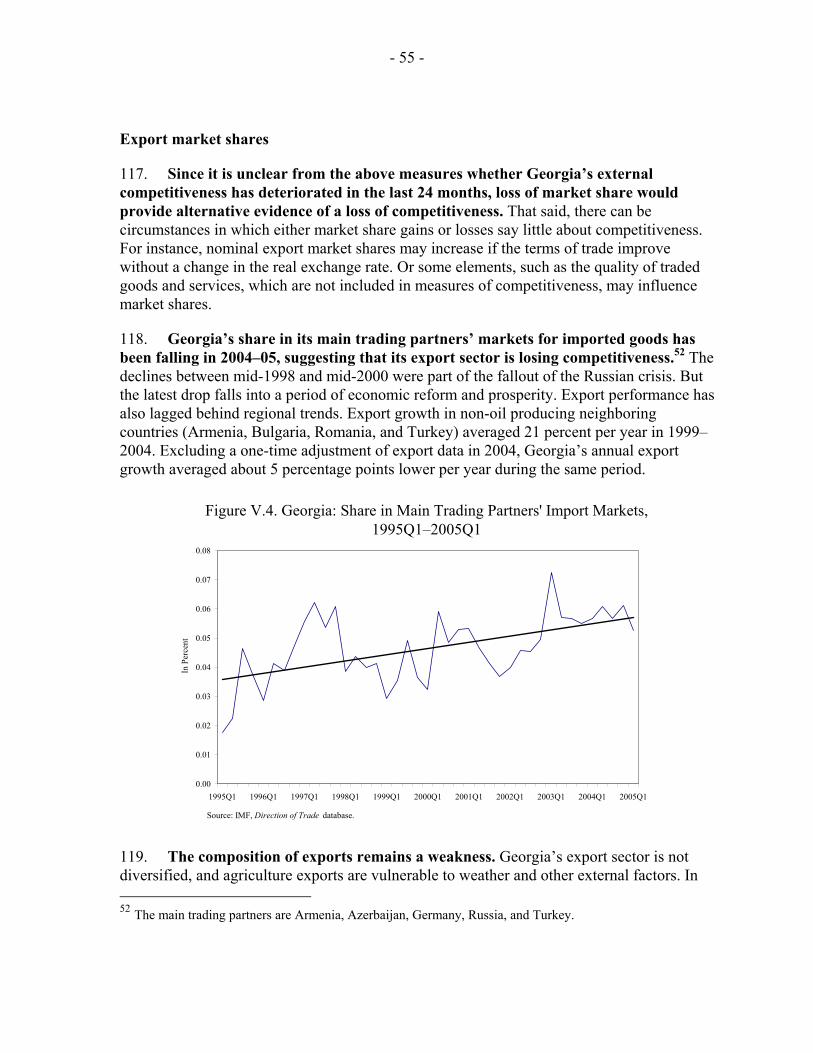
- 55 -
Export market shares
117. Since it is unclear from the above measures whether Georgia’s external competitiveness has deteriorated in the last 24 months, loss of market share would provide alternative evidence of a loss of competitiveness. That said, there can be circumstances in which either market share gains or losses say little about competitiveness. For instance, nominal export market shares may increase if the terms of trade improve without a change in the real exchange rate. Or some elements, such as the quality of traded goods and services, which are not included in measures of competitiveness, may influence market shares.
118. Georgia’s share in its main trading partners’ markets for imported goods has been falling in 2004–05, suggesting that its export sector is losing competitiveness.52 The declines between mid-1998 and mid-2000 were part of the fallout of the Russian crisis. But the latest drop falls into a period of economic reform and prosperity. Export performance has also lagged behind regional trends. Export growth in non-oil producing neighboring countries (Armenia, Bulgaria, Romania, and Turkey) averaged 21 percent per year in 1999–2004. Excluding a one-time adjustment of export data in 2004, Georgia’s annual export growth averaged about 5 percentage points lower per year during the same period.
0.00
0.01
0.02
0.03
0.04
0.05
0.06
0.07
0.08
1995Q1 1996Q1 1997Q1 1998Q1 1999Q1 2000Q1 2001Q1 2002Q1 2003Q1 2004Q1 2005Q1
Figure V.4. Georgia: Share in Main Trading Partners' Import Markets,1995Q1–2005Q1
Source: IMF, Direction of Trade database.
In P
erce
nt
119. The composition of exports remains a weakness. Georgia’s export sector is not diversified, and agriculture exports are vulnerable to weather and other external factors. In 52 The main trading partners are Armenia, Azerbaijan, Germany, Russia, and Turkey.

- 56 -
addition, one-third of total exports—which were also the fastest growing in 2004, i.e., scrap metal and aircraft repair services—cannot be sustained. The supply of scrap metal is limited and its export does not contribute to economic growth. The future of aircraft repair is uncertain. Turkmenistan, the only client, accepts Georgia’s services on its fleet of aircrafts as in-kind payment for old energy-related debt. This debt is expected to be paid off by 2008 (Figure V.5)
13%
8%
7%
5%
5%
4%
43%15%
Scrap MetalsAircrafts, otherWineFerrous MetalsSugarCopper Ores and ConcentratesFertilizersOther
Sources: IMF, Direction of Trade Statistics ; and Fund staff estimates.
Figure V.5. Georgia: Composition of Exports, 2004
C. Further Considerations
120. There is thus evidence of a weakening of Georgia’s external competitiveness in recent years. Georgia’s RER has been on an upward trend, especially since the beginning of 2004. As a result, market shares have started to shrink and the export base is too narrow to regain markets quickly. The impact of the appreciation has been cushioned somewhat by the fact that Georgia has the lowest U.S. dollar wage costs in the region.
121. This reflects the sources of the recent appreciation episode. The RER in Georgia is experiencing pressure from short-term fluctuations caused by factors not directly associated with productivity differentials, such as external inflows and strong domestic demand. Foreign exchange inflows increased significantly since 2003, including as a result of rapidly growing official and private transfers and FDI related to the construction of oil and gas pipelines as well as privatization in other sectors. International reserves started rising in connection with these strong external inflows. Substitution out of dollar assets into domestic currency also contributed to reserve growth (Table V.2).
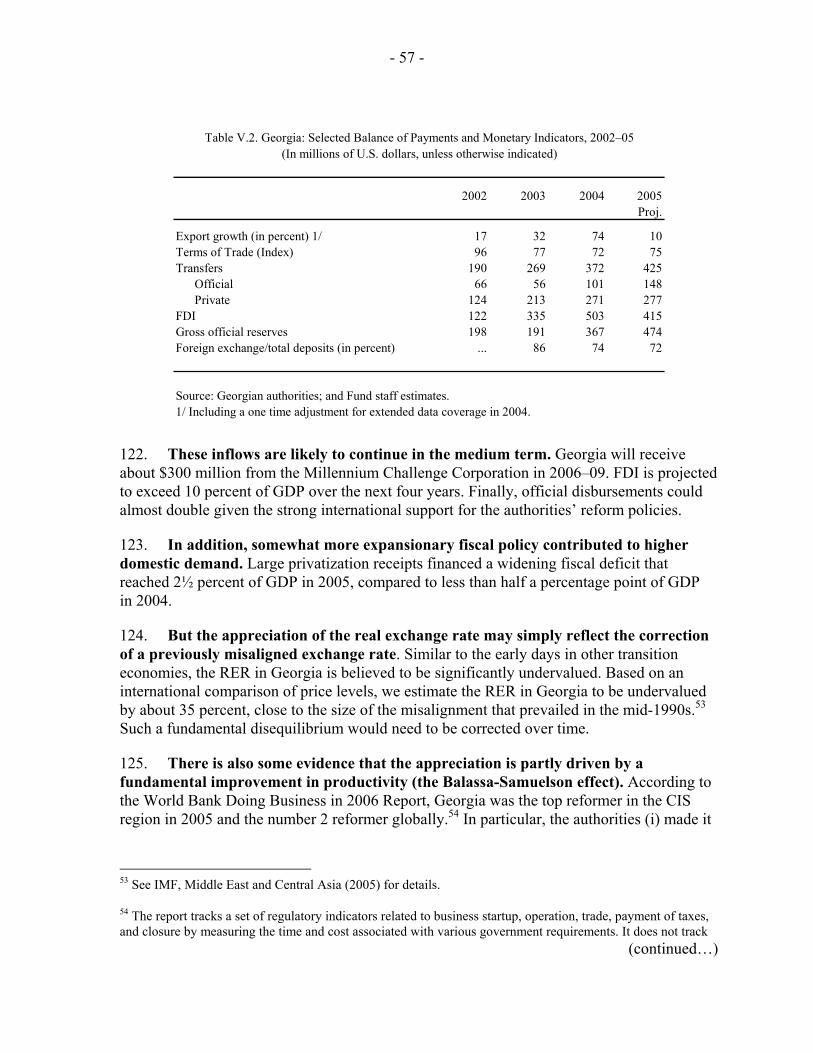
- 57 -
Table V.2. Georgia: Selected Balance of Payments and Monetary Indicators, 2002–05(In millions of U.S. dollars, unless otherwise indicated)
2002 2003 2004 2005Proj.
Export growth (in percent) 1/ 17 32 74 10Terms of Trade (Index) 96 77 72 75Transfers 190 269 372 425
Official 66 56 101 148Private 124 213 271 277
FDI 122 335 503 415Gross official reserves 198 191 367 474Foreign exchange/total deposits (in percent) ... 86 74 72
Source: Georgian authorities; and Fund staff estimates.1/ Including a one time adjustment for extended data coverage in 2004.
122. These inflows are likely to continue in the medium term. Georgia will receive about $300 million from the Millennium Challenge Corporation in 2006–09. FDI is projected to exceed 10 percent of GDP over the next four years. Finally, official disbursements could almost double given the strong international support for the authorities’ reform policies.
123. In addition, somewhat more expansionary fiscal policy contributed to higher domestic demand. Large privatization receipts financed a widening fiscal deficit that reached 2½ percent of GDP in 2005, compared to less than half a percentage point of GDP in 2004.
124. But the appreciation of the real exchange rate may simply reflect the correction of a previously misaligned exchange rate. Similar to the early days in other transition economies, the RER in Georgia is believed to be significantly undervalued. Based on an international comparison of price levels, we estimate the RER in Georgia to be undervalued by about 35 percent, close to the size of the misalignment that prevailed in the mid-1990s.53 Such a fundamental disequilibrium would need to be corrected over time.
125. There is also some evidence that the appreciation is partly driven by a fundamental improvement in productivity (the Balassa-Samuelson effect). According to the World Bank Doing Business in 2006 Report, Georgia was the top reformer in the CIS region in 2005 and the number 2 reformer globally.54 In particular, the authorities (i) made it
53 See IMF, Middle East and Central Asia (2005) for details.
54 The report tracks a set of regulatory indicators related to business startup, operation, trade, payment of taxes, and closure by measuring the time and cost associated with various government requirements. It does not track
(continued…)

- 58 -
easier to start a business, cutting the number of activities that require licensing from 909 to 159; (ii) made it less costly to fire redundant workers; (iii) cut the time and cost to register property; and (iv) introduced a new tax law with fewer and simplified taxes.55
D. Policy Recommendations
126. It would be unwise to resist the nominal exchange rate appreciation associated with pressure on the RER from short-term sources. The authorities should allow the nominal exchange rate to appreciate. If not, the real appreciation will occur in the form of higher inflation, and the long-term damage caused by higher inflation on resource allocation, investment incentives, financial intermediation, trade, and ultimately economic growth, is much more costly than the short-term repercussions related to nominal exchange rate adjustments.56
127. Appreciation of the RER can only be avoided through implementing prudent fiscal policy to contain domestic demand. This is best illustrated by the recent policy experience. Earlier in 2005, inflation in Georgia rose gradually as a result of large fiscal spending and unsterilized intervention, exceeding 10 percent in May. While the government targeted an annual fiscal deficit of more than 3 percent of GDP, monetary policy in the first half of the year was guided mainly by efforts to stem upward pressures on the nominal exchange rate. The inflationary impact was only partially offset by a steady increase in monetization. As a result, real appreciation in fact accelerated.
128. Besides prudent macroeconomic and flexible exchange rate policies to eliminate the short-term sources of upward pressure on the RER, continued structural reforms will help the economy adjust more easily to underlying trends in the RER. While the pace of reform has picked up, reformers in the CIS region, including Georgia, continue to lag behind their Eastern European neighbors. Georgia ranks at 100 in the Doing Business Report. Georgia also scores lowest among the countries in the region in the Global Competitiveness Report 2005-2006 by the World Economic Forum (WEF).57
variables such as macroeconomic policy, quality of infrastructure, currency volatility, investor perceptions, or crime rates. For more details on the Doing Business Survey, see Chapter II.
55 See www.doingbusiness.org for details.
56 See Valdivieso (1998) for details.
57 This WEF annual study is one of the leading monitors of the competitive condition of economies worldwide. Produced in collaboration with leading academics and a global network of 122 partner institutes, the Global Competitiveness Report has expanded its geographic coverage over the years and now assesses 117 economies. The report combines publicly available data with survey data that captures the perceptions and observations of business leaders in a given country. Georgia and its neighbors rank as follows in the latest report: Bulgaria (58), Kazakhstan (61), Turkey (66), Romania (67), Azerbaijan (69), Russia (75), Armenia (79), Ukraine (84), and Georgia (86). See Chapter II and www.weforum.org for more details on the WEF survey.
- 59 -
129. Therefore, there is ample scope for further improvements in business environment indicators. In particular, heavy legal burdens on business remain, and Georgia should simplify tax collection, further reduce licensing requirements, and improve the protection of investors. The country ranks lowest in the Doing Business Report in these areas. Reducing excess paperwork should be at the forefront of these efforts. While OECD countries require 16 annual tax payments on average, Georgia requires 49, and companies spend more than twice as many hours paying their taxes in Georgia than in OECD countries. The transparency of business transactions, director liability, and a shareholder’s ability to sue officers and directors for misconduct remain limited compared to international standards.
130. And governance matters for external competitiveness–corruption is a major tax on investors. Unfortunately, Georgia ranks in the bottom quartile in the World Bank’s governance database for most governance indicators, including the control of corruption, the rule of law, the regulatory quality, and government effectiveness.58 Performance has not much improved since 1996 for most of these indicators. While most countries in the region rank in the same range as Georgia, they all rank significantly below most other lower middle income countries. Georgia also stands low in the Transparency International’s 2005 Corruption Perceptions Index (at 130 out of 160 countries).59
131. Therefore, efforts to fight corruption should continue to move ahead of the region and attract more investment. The government’s anti-corruption strategy plan for 2005–06 aims at increasing efficiency of anti-corruption activities and strengthening the mechanisms for fighting corruption. Furthermore, the authorities could focus on transparency reforms.
132. Most of these recommended policies will help strengthen Georgia’s export potential. Reducing the administrative cost of trading will remove significant additional obstacles to international trade. Contrary to popular belief, customs paperwork and other red tape (often called ‘soft infrastructure’) cause the most delays for exporting and importing firms. Less than a quarter of the delays are caused by problems with ‘hard infrastructure’ such as poor ports or roads.60 In Georgia, an entrepreneur has to submit 9 (15) documents and obtain 35 (42) signatures to export (import) goods. It takes the same company 54 days on average before an export shipment can leave the country, compared to 31 days in the region and 12 days in OECD countries. Therefore, the administrative burdens of trading poses large costs and should be reduced. The new Customs Code, which is expected to further modernize
58 See World Bank (2005a) for details.
59 See Chapter II and www.transparency.org for details.
60 See World Bank (2005b) for details.
- 60 -
customs administration is a welcome step in this regard. The high costs of making international transactions very likely explain the high transportation costs as well.
133. Finally, the complete abolition of import tariffs in two years will help remove key obstacles to growth and provide reasonable assurance for sustained growth over the medium term. The gradual government-proposed elimination of all tariffs by 2008 will reduce pressure on domestic prices and strengthen enterprise profitability. Furthermore, it will leave few opportunities for rent-seeking in customs administration and help integrate Georgia further into the global economy.
- 61 -
References
IMF Middle East and Central Asia Department, 2005, Regional Economic Outlook, September (Washington: International Monetary Fund).
Transparency International, 2005, Corruption Perception Index, Global Corruption
Barometer, http://www.transparency.org/ Valdivieso, Luis M., 1998, Macroeconomic Developments in the Baltics, Russia, and Other
Countries of the Former Soviet Union, 1992-1997, IMF Occasional Paper No. 175 (Washington: International Monetary Fund).
World Bank, 2005a, Worldwide Governance Indicators,
http://www.worldbank.org/wbi/governance/pubs/govmatters4.html/ World Bank, 2005b, Doing Business, http://www.doingbusiness.org/ World Economic Forum, 2005, Global Competitiveness Report, http://www.weforum.org/