george hove - unisa
TRANSCRIPT

a
PERCEPTIONS OF SMALL BUSINESS EXECUTIVES ON DETERMINANTS OF
PERFORMANCE IN THE CONSTRUCTION INDUSTRY IN GAUTENG, SOUTH
AFRICA
George Hove

a
PERCEPTIONS OF SMALL BUSINESS EXECUTIVES ON DETERMINANTS OF
PERFORMANCE IN THE CONSTRUCTION INDUSTRY IN GAUTENG, SOUTH
AFRICA
by
GEORGE HOVE
submitted in accordance with the requirements
for the degree of
DOCTOR OF BUSINESS LEADERSHIP
at the
UNIVERSITY OF SOUTH AFRICA
SUPERVISOR: DR O. A. BANJO
JANUARY 2015
i
DECLARATION
Student Number: 71759956
I declare that “Perceptions of Small Business Executives on Determinants of
Performance in the Construction Industry in Gauteng, South Africa” is my own work,
that has not been submitted for any degree or examination in any other university and that
all the sources that I have used or quoted have been indicated and acknowledged by means
of complete references.
…………………… 12 January 2015
George Hove Date

ii
DEDICATION
This thesis is dedicated to:
My late mother Mushake Chigwire Marozva
and
My late mother in-law Gladys Gwasira

iii
ABSTRACT
Small businesses growth and profitability is a national problem in South Africa (SA) and
the Emerging Contractors (ECs) in the construction industry in Gauteng Province are no
exception. The SA government expect ECs to become the main players in economic
transformation and growth, job creation and income generation. However, ECs fail to live
up to the expectations as some are characterised by low performance levels and are at risk
of business closure. The purpose of this research is to examine the perceptions of Small
Business Executives (SBEs) on determinants of business performance so that a
performance model that could guide ECs within the construction business is developed.
The researcher used a mixed approach to examine the perceptions of SBEs on
determinants of ECs’ performance by applying both qualitative and quantitative research
approaches. The population from which the sample was drawn comprised of 1890 urban
based ECs registered with CIDB in the construction industry in Gauteng. Systematic
random sampling was utilized and a sample size of 501 ECs was used. A structured
questionnaire and interview guide were administered as the data collection instruments. A
pilot survey was conducted where 2 key informants (SBEs) and 15 respondents (SBEs)
were interviewed as representatives of ECs. A survey was used to assess the four
hypotheses in the study.
Content analysis was used to identify themes that emerged from qualitative data. The
analysis of qualitative data demonstrated the perceptions of SBEs that financial factors,
manpower, materials, machinery and equipment, project implementation, quality of work,
legal and environmental and strategic planning were the main determinants that should be
addressed when setting up and running construction businesses to reduce the negative
impact on business performance. Based on the perceptions of SBEs, in quantitative, the
univariate and multivariate statistical methods were performed to measure the level of
significance between and among the performance determinants were tested at 5%
confidence interval. Multiple linear regressions carried out based on the perceptions of
SBEs identified strategic planning, project implementation and project performance as the
most statistically significant factors in predicting the performance of ECs in Gauteng
Province. The results from both qualitative and quantitative methods were synthesised and
analysed through data transformation, typological development and case study analysis

iv
and the perceptions of respondents indicated a strong agreement between the qualitative
and quantitative results.
Based on multivariate results which were a result of the perceptions of SBEs, a
performance prediction model was developed which is the core contribution of the study.
The structure of the model, how it is used, its advantages and disadvantages were
presented. The model provides a platform upon which ECs could predict performance and
this would benefit ECs, clients, community and policymakers.
In conclusion, the study established three significant determinants that include strategic
planning, project implementation and project performance as highly relevant variables to
improve construction business performance. Based on the perceptions of the respondents,
the study recommends ECs to acquire and develop financial management skills that would
enable them to understand and manage financial requirements that stakeholders such as
financial institutions need in the areas of budgeting and cash flow management,
bookkeeping knowledge, financial policies and controls and project pricing strategy. On
the shortage of skills, the study recommends SBEs to take an initiative role in training
employees, motivating and retaining competent workforce. The government need to
establish technical colleges for training workers (apprenticeship) in order to equip them
with appropriate industry knowledge, skills and experience. Lack of collateral security was
widely reported by most SBEs and the study recommends the formation of a sector bank
that would support emerging contractor businesses.
Key terms: Business Performance, Conceptual Performance Prediction Model,
Construction industry, Critical Incidents, Determinants, Emerging Contractor, Perception,
Small Business Executive (SBE), Gauteng Province, South Africa.

v
ACKNOWLEDGEMENTS
The research and writing of this thesis was demanding but finally completed because of
the support and encouragement from a large number of people. In this regard, I wish to
acknowledge the following people:
Dr A. O. Banjo promoted this thesis; I wish to extend my deep and sincere
gratitude for his guidance and support throughout the whole process of completing
this research.
Professor P. D. Rwelamila and Professor P. Serumaga-Zake, thank you for your
high level contribution. The support and the yielding environment were really
intriguing.
Professor Simbarashe Rusakaniko of the University of Zimbabwe, my deepest
gratitude extends to him and his family for their unequivocal support to make this
project a success. I am thankful for your confidence in me and incisive guidance.
The UNISA SBL staff Ms T. Seopa (programme administrator), Ms L. Ncongwane
and Ms M. Scheepers who assisted with all library material, your assistance was
much appreciated. Thank you ladies!
E. Hove, S. Makumbirofa, S. Zimucha, N. Magandi and M. Magocha for your
integral role in the structure of this thesis. Thank you!
My wife Agnes, my children Blessed, Hazvinei (daughter in-law), Kudzai, Tendai
and Tawanda Hove, thank you for all the understanding and support that you have
given during the long hours that I expensed on this study. This work would never
have been completed without your patience. Thank You!
My brothers N. Hove, T. Hove (the late), T. Hove, my sisters in-law R. Hove and
M. Hove, thank you for bringing me up based on the values of honest, resilience
and the ethic of hard work.
vi
TABLE OF CONTENTS
DECLARATION ................................................................................................. i
DEDICATION .................................................................................................... ii
ABSTRACT ....................................................................................................... iii
ACKNOWLEDGEMENTS ................................................................................v
LIST OF FIGURES ......................................................................................... xii
LIST OF TABLES .......................................................................................... xiii
LIST OF ACRONYMS AND ABBREVIATIONS ....................................... xv
CHAPTER ONE ..................................................................................................1
INTRODUCTION ...............................................................................................1
1.1 Background to the Study ............................................................................................. 1
1.2 Theoretical foundation and Literature Review ......................................................... 10
1.3 The Problem Statement ............................................................................................. 14
1.3.1 Rationale of the Study .............................................................................................. 15
1.3.2 Research questions ................................................................................................... 17
1.3.3 Research aim ............................................................................................................ 17
1.3.5 Hypotheses ............................................................................................................... 18
1.4 Brief Research Design ............................................................................................. 18
1.4.1 Population and sampling .......................................................................................... 19
1.4.2 Data analysis and interpretation ............................................................................... 19
1.5 The Scope of the Study ............................................................................................. 19
1.6 Perceived Contribution to Knowledge ...................................................................... 20
1.7 Brief description of the Chapters in this Thesis ........................................................ 22
1.8 Summary ................................................................................................................... 23
CHAPTER TWO .............................................................................................. 24
THEORETICAL ANALYSIS AND LITERAUTURE REVIEW ............... 24
2.1 Chapter Introduction ................................................................................................. 24
2.1.1 The Concepts of Study .............................................................................................. 25
2.2 Theoretical Foundation of the Study ........................................................................ 28
vii
2.2.1 The European Foundation for Quality Management Model (EFQM) ...................... 28
2.2.2 Key performance indicators model ........................................................................... 30
2.2.3 The Balanced Scorecard and performance ............................................................... 32
2.2.4 The South African construction engineering model (SACEM) ................................ 35
2.3 Defining performance ............................................................................................... 36
2.4 Measuring performance ............................................................................................ 39
2.4.1 Project performance .................................................................................................. 40
2.4.2 Business performance ............................................................................................... 41
2.4.3 Stakeholder performance .......................................................................................... 42
2.5 The Determinants of ECS’ performance................................................................... 48
2.5.1 Financial factors ........................................................................................................ 49
2.5.2 Manpower factors ..................................................................................................... 54
2.5.3 Materials, equipment and machinery factors ............................................................ 58
2.5.4 Project implementation ............................................................................................. 60
2.5.5 Quality factors ........................................................................................................... 67
2.5.6 Legal and regulatory factors ..................................................................................... 73
2.5.7 Strategic planning ..................................................................................................... 76
2.5.8 Performance improvement ........................................................................................ 78
2.6 Clarification of Concepts .......................................................................................... 79
2.6.1 Conceptual Framework of the Study ........................................................................ 81
2.7 Summary and identification of the Gap .................................................................... 82
CHAPTER THREE ......................................................................................... 86
RESEARCH METHODOLOGY ................................................................... 86
3.1 Chapter Introduction ................................................................................................. 86
3.2 The Research Design ................................................................................................ 86
3.2.1 Qualitative approach ................................................................................................. 87
3.2.3 Integration of the Research Designs ......................................................................... 88
3.3 Population of the Study ............................................................................................. 88
3.3.1 Sampling for qualitative data .................................................................................... 90
3.3.2 Sampling for quantitative data .................................................................................. 90
3.4 Phase one: Measuring qualitative data ...................................................................... 92
3.4.1 Development of the in-depth interview guide .......................................................... 92
viii
3.4.2 Qualitative data collection procedure ....................................................................... 94
3.4.3 Qualitative content analysis ...................................................................................... 94
3.4.4 Incident theme formulation ....................................................................................... 95
3.5 Phase two: Measuring quantitative data ................................................................... 95
3.5.1 Demographics ........................................................................................................... 97
3.5.2 Financial determinant scale ...................................................................................... 98
3.5.3 Manpower determinant scale .................................................................................... 99
3.5.4 Materials, equipment and machinery scale ............................................................. 100
3.5.5 Project implementation ........................................................................................... 100
3.5.6 Quality determinants scale ...................................................................................... 101
3.5.7 Legal and regulatory scale ...................................................................................... 102
3.5.8 Strategic planning ................................................................................................... 103
3.5.9 Business performance scale .................................................................................... 104
3.5.10 Project performance scale ...................................................................................... 104
3.6 Pilot Study ............................................................................................................... 105
3.7 Data collection procedure (Quantitative data) ........................................................ 107
3.8 Analytical techniques of quantitative data analysis ................................................ 108
3.8.1 Descriptive statistics ............................................................................................... 108
3.8.2 Reliability ................................................................................................................ 108
3.8.4 Content validity of the instrument .......................................................................... 109
3.8.5 Construct validity of the instrument ....................................................................... 110
3.8.6 Regression analysis ................................................................................................. 110
3.9 Control of bias ........................................................................................................ 110
3.10 Ethical considerations of the study ......................................................................... 111
3.11 Chapter Conclusion ................................................................................................. 112
CHAPTER FOUR .......................................................................................... 113
PRESENTATION OF EMPIRICAL FINDINGS ....................................... 113
4.1 Chapter Introduction ............................................................................................... 113
4.2 PART A - QUALITATIVE RESULTS .................................................................. 113
4.2.1 Profile of key informants ........................................................................................ 113
4.2.2 Analysis of the findings .......................................................................................... 114
4.2.2.1 Finance ................................................................................................................. 115

ix
4.2.2.2 People management .............................................................................................. 119
4.2.2.3 Material, machinery and equipment ..................................................................... 125
4.2.2.4 Project implementation ......................................................................................... 129
4.2.2.5 Quality of work ..................................................................................................... 133
4.2.2.6 Legal and regulatory Incidents ............................................................................. 135
4.2.2.7 Strategic planning ................................................................................................. 137
4.2.3 Critical incidents identified ..................................................................................... 140
4.2.4 Impact of the critical incidents on business performance ....................................... 142
4.2.5 Overall business and stakeholder performance....................................................... 148
4.2.6 Business interview experiences: managerial perspective ....................................... 152
4.3 PART B – QUANTITATIVE RESULTS .............................................................. 156
4.3.1 Response rate .......................................................................................................... 157
4.3.2 Demographic characteristics of the respondents..................................................... 157
4.3.3 Reliability and validity Analysis ............................................................................. 163
4.3.4 Confirmatory factor analysis .................................................................................. 165
4.3.5 Determinants of ECs’ performance ........................................................................ 165
4.3.6 Hypothesis testing ................................................................................................... 172
4.3.6.1 Diagnostic graphs ................................................................................................. 175
4.3.6.2 Summary of quantitative data ............................................................................... 182
4.4 Chapter Conclusion ................................................................................................. 183
CHAPTER FIVE ............................................................................................ 184
SYNTHESIS AND ANALYSIS OF RESULTS .......................................... 184
5.1 Chapter Introduction ............................................................................................... 184
5.2 Data Transformation ............................................................................................... 184
5.3 Case Analysis: Determinants of business performance .......................................... 185
5.3.1 Financial challenges ................................................................................................ 185
5.3.2 Manpower challenges ............................................................................................. 188
5.3.3 Materials and machinery ......................................................................................... 190
5.3.4 Project implementation ........................................................................................... 192
5.3.5 Quality challenges ................................................................................................... 193
5.3.6 Legal and regulatory factors ................................................................................... 194
5.3.7 Strategic planning ................................................................................................... 195

x
5.3.8 Summary of analysis ............................................................................................... 196
5.4 Typological Development ....................................................................................... 196
5.5 Chapter Conclusion ................................................................................................. 198
CHAPTER SIX ............................................................................................... 199
CONCEPTUAL PERFORMANCE PREDICTION MODEL:
CONTRIBUTION OF THE STUDY ........................................................... 199
6.1 Chapter Introduction ............................................................................................... 199
6.2 The Structure of Conceptual Performance Prediction Model ................................. 199
6.2.2 The Determinants of performance .......................................................................... 200
6.2.2.1 Strategic planning ................................................................................................. 200
6.2.2.2 Project implementation and resource management ............................................. 203
6.2.2.3 Project performance ............................................................................................. 205
6.3 Summary of The Conceptual Performance Prediction Model ................................ 208
6.3.1 Benefits and Limitations of the model .................................................................... 208
6.4 Chapter Conclusion ................................................................................................. 209
CHAPTER SEVEN ........................................................................................ 210
CONCLUSIONS AND RECOMMENDATIONS ....................................... 210
7.1 Chapter Introduction ............................................................................................... 210
7.3 Conclusions ............................................................................................................. 213
7.4 Recommendations ................................................................................................... 218
7.4.1 Recommendation for ECs in CIDB Grade 2........................................................... 219
7.4.2 Recommendation for the CIDB .............................................................................. 220
7.4.3 Recommendation for the South African government ............................................. 221
7.4.4 Recommendation for construction clients / main contractors................................. 223
7.5 Implications of the Study ........................................................................................ 223
7.6 Limitation of the Study ........................................................................................... 225
7.7 Conclusion .............................................................................................................. 226
7.7.1 Recommendation for further research .................................................................... 227
REFERENCES ................................................................................................................. 228

xi
APPENDICES .................................................................................................................. 258
Appendix A: Introductory Letter (sample) ...................................................................... 258
Appendix B: Interview Guide (Sample) .......................................................................... 259
Appendix C: Research Questionnaire (sample) ............................................................... 260
Appendix D: Email requesting to use CIDB Database .................................................... 268
Appendix E: Approval letter to use CIDB Database ....................................................... 269
Appendix F: Sample Size Determination ........................................................................ 273
Appendix G: UNISA SBL Letter of identification .......................................................... 274
Appendix H: Sample Interview Guide ............................................................................. 275
xii
LIST OF FIGURES
Figure 1.1 Sector Classification of SEDA’s Existing Clients 2
Figure 2.1 Map of Gauteng Province 27
Figure 2.2 The EFQM Excellence Model 30
Figure 2:3 The Balanced Scorecard 33
Figure 2.4 Causal Relationship to Organizational Success 41
Figure 2.5 Conceptual Framework of the Study 81
Figure 3.1 Mixed Method Design (Exploratory Design) 86
Figure 3.2 Incident Reflective Cycle 94
Figure 4.1 Industrial Action 121
Figure 4.2 Abandoned Mall as a Result of Liquidation 131
Figure 4.3 Distribution of Respondents by their Functional Role 158
Figure 4.4 Business Experience 159
Figure 4.5 Representation of Business Ownership 162
Figure 4.6 Plot of Residuals against Strategic Planning Total Score 176
Figure 4.7 Plot of Residuals against Project Implementation Total Score 176
Figure 4.8 Plot of Residuals against Project Performance Total Score 177
Figure 4.9 Normality Plot of EC Performance Total 178
Figure 4.10 Normality Plots of Strategic Planning Total 178
Figure 4.11 Normality Plot of Project Implementation Total 179
Figure 4.12 Normality Plot of Project Performance 180
Figure 5.1 Integration of Results 184
Figure 6.1 Structure of the Performance Prediction Model 199
Figure 6.2 Strategic Planning Process 201

xiii
LIST OF TABLES
Table 1.1 Employment, Construction by Province 2012 2
Table 1.2 Number of Enterprises and Class of Works 3
Table 1.3 Combined Models 6
Table 1.4 Contractor Grading Systems and Tender Range Values 7
Table 1.5 Start-up, new firm and established business entrepreneurial activity 11
Table 2.1 Gauteng District and Local Municipalities 27
Table 2.2 Current Set of UK KPIs Being Measured and Reported 31
Table 2.3 The Paterson Grading System 80
Table 3.1 Number of ECs in CIDB Database Grade 2 in Year 2013 89
Table 3.2 Instruments Used in Previous Investigations 92
Table 3.3 Demographic Characteristics 97
Table 3.4 Financial Determinant Scale 98
Table 3.5 Manpower Determinant Scale 99
Table 3.6 Materials, Equipment and Machinery Determinant Scale 100
Table 3.7 Project Implementation Scale 101
Table 3.8 Quality Determinant Scale 102
Table 3.9 Legal and Regulatory Determinant Scale 103
Table 3.10 Strategic Planning Scale 104
Table 3.11 Business Performance Scale 104
Table 3.12 Project Performance Scale 105
Table 4.1 Profile of key informants 114
Table 4.2 Summary of Results on Finance 116
Table 4.3 Summary of Results on Manpower 122
Table 4.4 Summary of Results on Material, Machinery and
Equipment Results 126
Table 4.5 Summary of Results on Project Implementation Results 130
Table 4.6 Summary of Results on Quality Results 134
Table 4.7 Summary of Results on Legal and Environmental Results 135
Table 4.8 Summary of Results on Strategic Planning Results 139
Table 4.9 Summary of Critical Incidents Identified 140
Table 4.10 Distribution of Respondents by their Demographic Characteristics 157

xiv
Table 4.11 CIDB Grading 160
Table 4.12 Representation of Skilled Manpower 160
Table 4.13 Representation of Unskilled Manpower 161
Table 4.14 Representation of Skilled and Unskilled 161
Table 4.15 Representation of Civil Engineering Businesses 162
Table 4.16 Representation of those who do Government Projects 163
Table 4.17 Reliability Statistics of Questionnaire 163
Table 4.18 Correlation Analysis 165
Table 4.19 Financial Challenges 166
Table 4.20 Manpower Issues 167
Table 4.21 Supply of Materials, Equipment and Machinery 168
Table 4.22 Project Implementation 169
Table 4.23 Quality Matters 169
Table 4.24 Legal and Regulatory Issues 170
Table 4.25 Strategic Planning 171
Table 4.26 Overall Ranking 172
Table 4.27 Results of Univariate Analysis 173
Table 4.28 Results of Multiple Linear Regression Analysis 174
Table 4.29 Summary of Hypotheses Results 182
Table 5.1 Summary of Results 197
Table 6.1 Prediction of Emerging Contractor Performance 207
Table 7.1 Summary of identified Critical Incidents 214
xv
LIST OF ACRONYMS AND ABBREVIATIONS
BEE Black Economic Empowerment
BBBEE Broad Based Black Economic Empowerment
BCA Building and Construction Authority
BSC Balanced Scorecard
CBPP Construction Best Practice Programme
CCMA Commission for Conciliation, Mediation and Arbitration
CE Civil Engineering
CETA Construction Education and Training Authority
CIDB Construction Industry Development Board
CII Construction Industry Indicators
CIP Contractor Incubation Programme
CIT Critical Incident Technique
CONQUAS Construction Quality Assessment System
CPM Critical Path Method
DPW Department of Public Works
EC Emerging Contractor
ECDM Emerging Contractor Development Model
ECDC Eastern Cape Development Corporation
ECDP Emerging Contractor Development Programme
EFQM European Foundation for Quality Management
EPWP Extended Public Works Programme
FIDIC International Federation of Consulting Engineers
GB General Building
GDP Gross Domestic Product
JBCC Joint Building Contracts Committee
LWCIR Lost Workday Case Incident Rate
KPI Key Performance Indicators
MBASA Master Builders Association of South Africa
NBR National Building Regulations
NCICM National Construction Industry Council of Malawi
NHBRC National Home Builder Registration Council
NQF National Qualification Framework
PASS Performance Assessment Scoring System

xvi
PFI Private Finance Initiative
PICC The Presidential Infrastructure Co-ordinating Commission
PPE Personal Protective Equipment
PPI People Performance Indicators
QMS Quality Management Systems
RDP Reconstruction and Development Program
RIR Recordable incident rate
R & D Research and Development
RSA Republic of South Africa
SABS South African Bureau of Standards
SBE Small Business Executive
SACEM South African Construction Engineering Model
SEDA Small Enterprising Development Agency
SME Small and Medium Enterprises
SMME Small Micro and Medium sized Enterprise
TQM Total Quality Management
UK The United Kingdom
PICC Presidential Infrastructure Co-ordinating Commission
1
CHAPTER ONE
INTRODUCTION
1.1 BACKGROUND TO THE STUDY
The role of Emerging Contractors (ECs) in the economic development of a nation is a
controversy (Ofori, 1990). In the Republic of South Africa (RSA), contractors are expected
to become the main players in economic transformation and growth, job creation and
income generation. Against this, the government put forward measures to create an
enabling environment for new entrants into the construction industry after 1994
(Hauptfleisch et al., 2007). However, ECs have failed to live up to expectations as some
are characterised by low performance levels and are at risk of business failure (Atkinson,
2012; Greyling, 2012; Buys & Ludwaba, 2012; Baloyi and Bekker, 2011).
The construction industry is one of the main economic engine sectors, supporting the
national economy (Dlungwana et al., 2002), providing the physical infrastructure and
engaging in projects that generate new buildings and refurbish existing ones for a variety
of clients (Marx, 2012; CIDB 2010). The industry provides the buildings used in the
production of goods in the economy (Ofori, 2012: 4), including general contractors who
build residential buildings and non-residential such as industrial, commercial and other
buildings. The civil engineering contractors construct roads, highways, bridges, tunnels
and other projects related to national infrastructure. Accordingly, the public sector is a
major contributor to infrastructural development, accounting for around R150 billion in
civil engineering projects and R25 billion in residential and non-residential building works
annually (CIDB 2012).
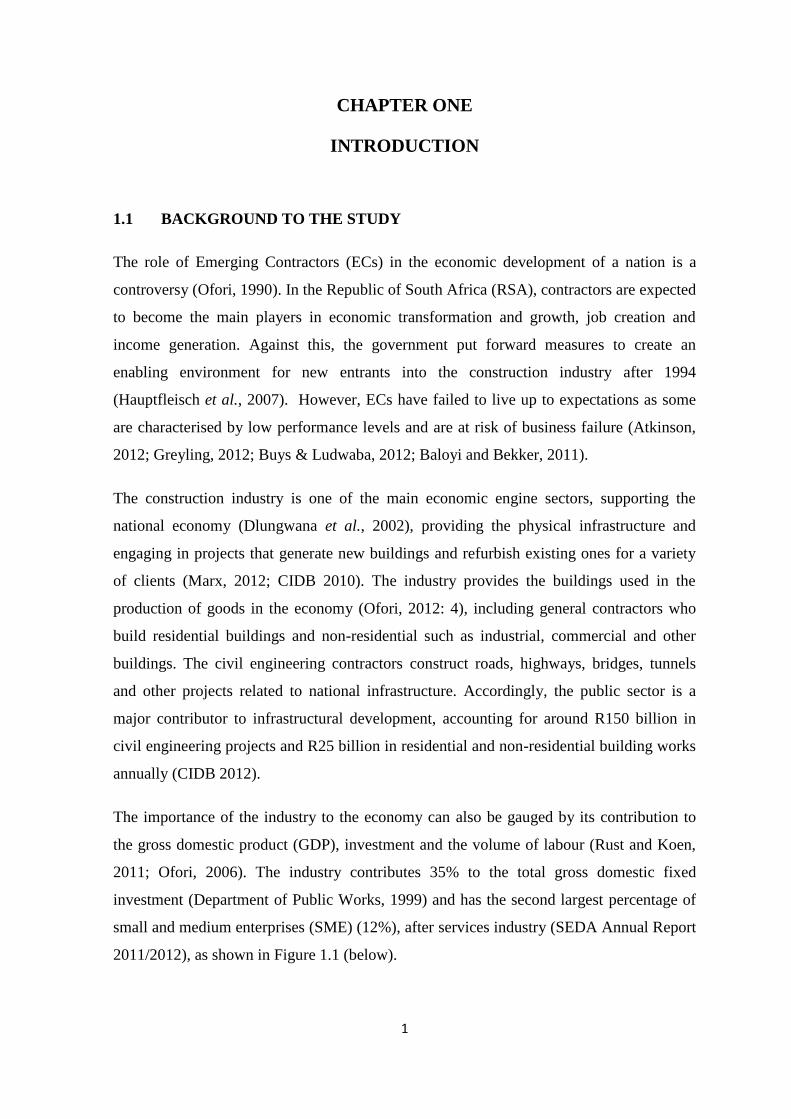
The importance of the industry to the economy can also be gauged by its contribution to
the gross domestic product (GDP), investment and the volume of labour (Rust and Koen,
2011; Ofori, 2006). The industry contributes 35% to the total gross domestic fixed
investment (Department of Public Works, 1999) and has the second largest percentage of
small and medium enterprises (SME) (12%), after services industry (SEDA Annual Report
2011/2012), as shown in Figure 1.1 (below).
2
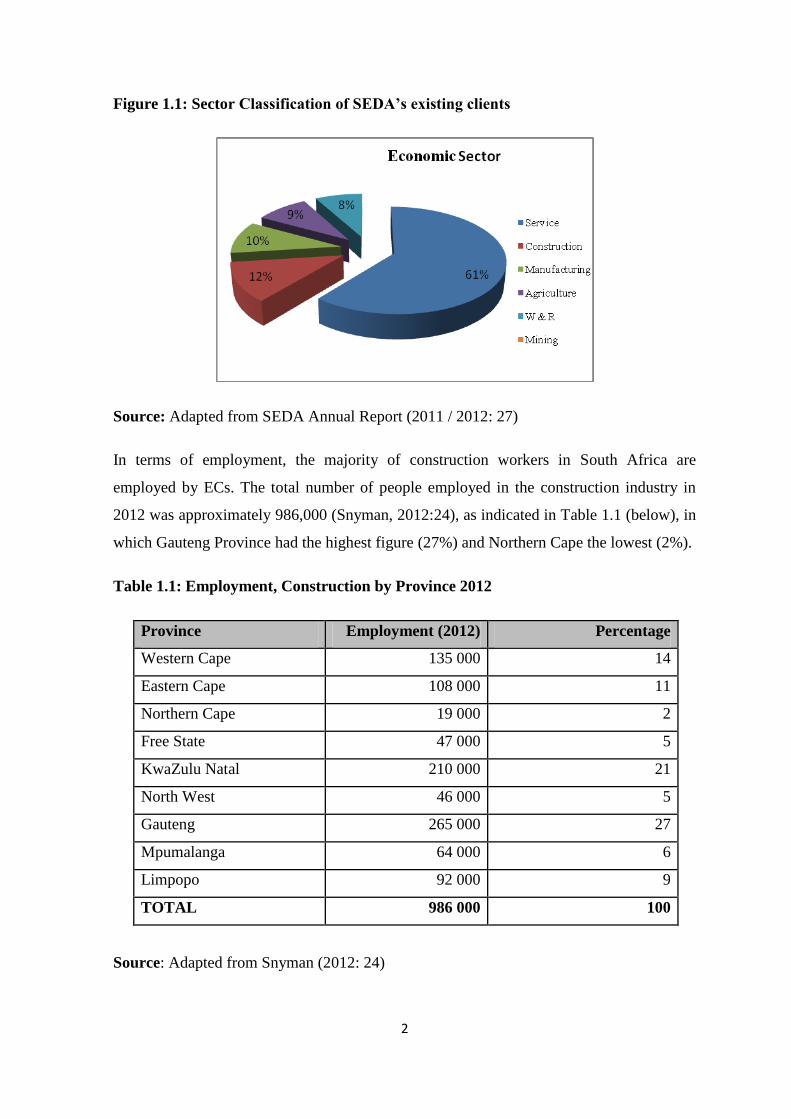
Figure 1.1: Sector Classification of SEDA’s existing clients
Source: Adapted from SEDA Annual Report (2011 / 2012: 27)
In terms of employment, the majority of construction workers in South Africa are
employed by ECs. The total number of people employed in the construction industry in
2012 was approximately 986,000 (Snyman, 2012:24), as indicated in Table 1.1 (below), in
which Gauteng Province had the highest figure (27%) and Northern Cape the lowest (2%).
Table 1.1: Employment, Construction by Province 2012
Province Employment (2012) Percentage
Western Cape 135 000 14
Eastern Cape 108 000 11
Northern Cape 19 000 2
Free State 47 000 5
KwaZulu Natal 210 000 21
North West 46 000 5
Gauteng 265 000 27
Mpumalanga 64 000 6
Limpopo 92 000 9
TOTAL 986 000 100
Source: Adapted from Snyman (2012: 24)

3
When compared to large companies which rely on automation in their operations, ECs
remain a sustainable source of employment creation as they have the potential to build
viable construction companies and develop skills. Since 1994, South Africa government
and construction sector have engaged in processes that redirected the industry’s growth
and performance as a way of supporting the country’s social and economic transformation
agenda (CIDB, 2004). The ECs comprise the largest percentage of contractors that employ
few permanent staff, usually less than 10 employees (Thwala and Phaladi, 2009). These
contractors operate at local and metro level, on which severe competition undermines
sustainability and consolidation (CIDB, 2014). However, through the CIDB grading
system, ECs cannot tender for large projects as these cannot be subdivided to
accommodate ECs. Such projects require a high level of management, financial solvency
and technical capability (Greyling, 2012; Windapo and Cattell, 2011). This defines the
qualities and skills frequently found amongst Grades 7 to 9 contractors (Windapo and
Cattell, 2011). As a result, these undertake large projects while ECs find it more difficult
to meet the requirements of the financial institutions necessary for the award of tenders.
Table 1.2 (below) shows class of works and number of enterprises per grade.
Table 1.2: Number of enterprises and class of works
Designation CE EE EP GB ME SW TOTAL
1 23 268 1 313 4 051 50 998 4 227 15 389 99 246
2 1 499 113 119 2 032 217 497 4 477
3 639 82 86 597 92 135 1 631
4 788 132 201 811 151 154 2 237
5 681 133 265 636 212 255 2 182
6 738 41 79 614 85 73 1 630
7 234 29 47 223 44 36 613
8 86 7 15 86 18 14 226
9 47 2 21 31 21 19 141
TOTAL 27 980 1 852 4 884 56 028 5 067 16 572 112 383
Source: Adapted from CIDB (2010)
Key: GB: General Building, CE: Civil Engineering, ME: Mechanical Engineering, EE:
Electrical Engineering, EP: Plumbing Engineering, SW: Specialist Works.

4
It is in the interest of South Africa government to see a stronger presence of ECs to Grades
7 to 9, in order to reverse historical economic imbalances in income distribution and
employment, but the absence of such a presence is a concern for the CIDB, the
government agency charged with ensuring construction industry development (Windapo
and Cattell, 2011). Many ECs are newcomers to the industry, with very little working
capital and limited track record (Thwala and Phaladi, 2009). The contractors do not have
adequate technical training, business culture, capacity or maturity (Greyling, 2012;
Windapo and Cattell, 2011), and so are not able to provide acceptable quality of work.
Much customer dissatisfaction has thus been attributed to their performance (CIDB, 2004).
The contribution of ECs to South Africa’s economic development has been a focus of
discourse for a number of years (Atkinson, et al. 2012). At policy level, the national,
provincial and municipal policies and strategies relating to the construction industry are in
favour of ECs (Greyling, 2012), however, the development and performance of ECs in
terms of growth and profitability has remained a concern to the policymakers and business
executives (Greyling, 2012; Buys and Ludwaba, 2012; Thwala and Mvubu, 2009).
There are reports in literature confirming ECs’ relative weak performance due to
constraints in the construction industry that lead to the alleged failure of contractor
companies (Greyling, 2012). For instance, a study conducted in the Free State Province
show 50% of construction projects failed to complete work as required (Greyling, 2012),
indicating a need to periodically measure performance and compare past performance in
order to find out what should be improved (Thwala and Mvubu, 2009). Otherwise, the
construction industry may become riskier for ECs, given the RSA’s dynamic marketplace.
According to literature, contractors often fail to complete work within the contract or
extension period (Thwala and Phaladi, 2009), thus work is stopped, abandoned or
suspended before completion. ECs have been accused of failing to comply with the terms
and conditions of the contracts they enter into and their performance has been dominated
by clients dissatisfied with the quality of work delivered, high levels of defects which are
regarded as inappropriate and delayed project delivery (CIDB, 2012). This indicates weak
performance and becomes a binding constraint to contractor growth and profitability.
Construction clients in the industry award contracts to ECs based on past performance
(CIDB, 2007), suggesting that ECs need to offer satisfactory performance on current

5
projects as a means of securing future projects. ECs that are able to complete projects
within less time, at less cost and higher quality, whilst adding value for money to clients
and higher profits would be considered in future construction projects (Alinaitwe, 2008;
Faridi and El- Sayegh (2006). This can be achieved through contractors’ continuous
improvement on construction operations.
Although ECs wish to expand, there are challenges that hinder growth and profitability
(Snyman (2012). A support for this perception is evident in a subcontracting survey
conducted by CIDB (2013), which shows that contractors at times terminate relationships
with subcontractors due to poor track record in managing cash flows, inability to complete
the apportioned work, overpricing work, failure to pay labour, disputes about payment and
poor performance on site health and safety. The clause of ‘pay when paid’ applied in the
industry is a challenge to ECs.
Amongst development programmes that have been initiated by South Africa government
to encourage a wider participation of ECs in the construction industry (Gasa 2012), are
emerging contractor development models (ECDMs) and emerging contractor development
programmes (ECDPs) (Buys and Ludwaba, 2012). The former refers to a structured
methodology that comprises measures designed to help ECs develop the technical and
management skills required to grow businesses (Dlungwana and Rwelamila, 2005).
However, a review of literature shows that no single model for contractor development fits
all grades of contractors and all levels of business stages (Greyling, 2012). Different
models are more appropriate to different levels of development and can be broadly
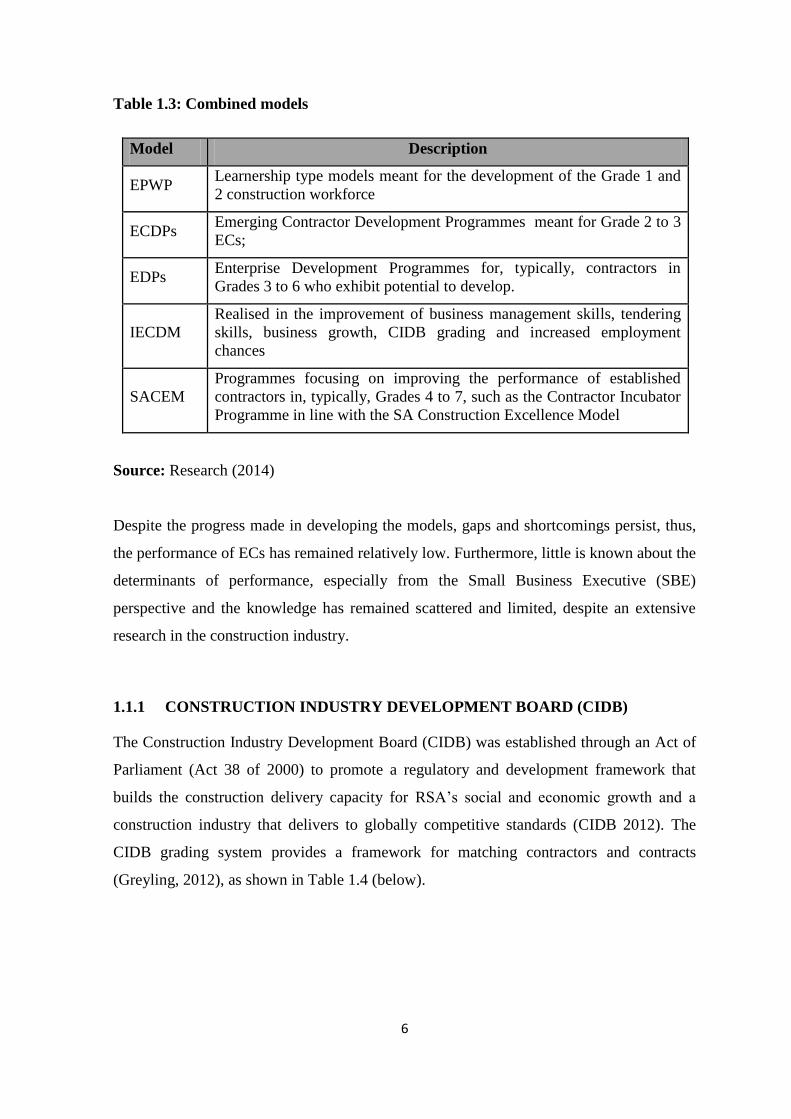
grouped as shown in Table 1.3 (below).
6
Table 1.3: Combined models
Model Description
EPWP Learnership type models meant for the development of the Grade 1 and
2 construction workforce
ECDPs Emerging Contractor Development Programmes meant for Grade 2 to 3
ECs;
EDPs Enterprise Development Programmes for, typically, contractors in
Grades 3 to 6 who exhibit potential to develop.
IECDM
Realised in the improvement of business management skills, tendering
skills, business growth, CIDB grading and increased employment
chances
SACEM
Programmes focusing on improving the performance of established
contractors in, typically, Grades 4 to 7, such as the Contractor Incubator
Programme in line with the SA Construction Excellence Model
Source: Research (2014)
Despite the progress made in developing the models, gaps and shortcomings persist, thus,
the performance of ECs has remained relatively low. Furthermore, little is known about the
determinants of performance, especially from the Small Business Executive (SBE)
perspective and the knowledge has remained scattered and limited, despite an extensive
research in the construction industry.
1.1.1 CONSTRUCTION INDUSTRY DEVELOPMENT BOARD (CIDB)
The Construction Industry Development Board (CIDB) was established through an Act of
Parliament (Act 38 of 2000) to promote a regulatory and development framework that
builds the construction delivery capacity for RSA’s social and economic growth and a
construction industry that delivers to globally competitive standards (CIDB 2012). The
CIDB grading system provides a framework for matching contractors and contracts
(Greyling, 2012), as shown in Table 1.4 (below).
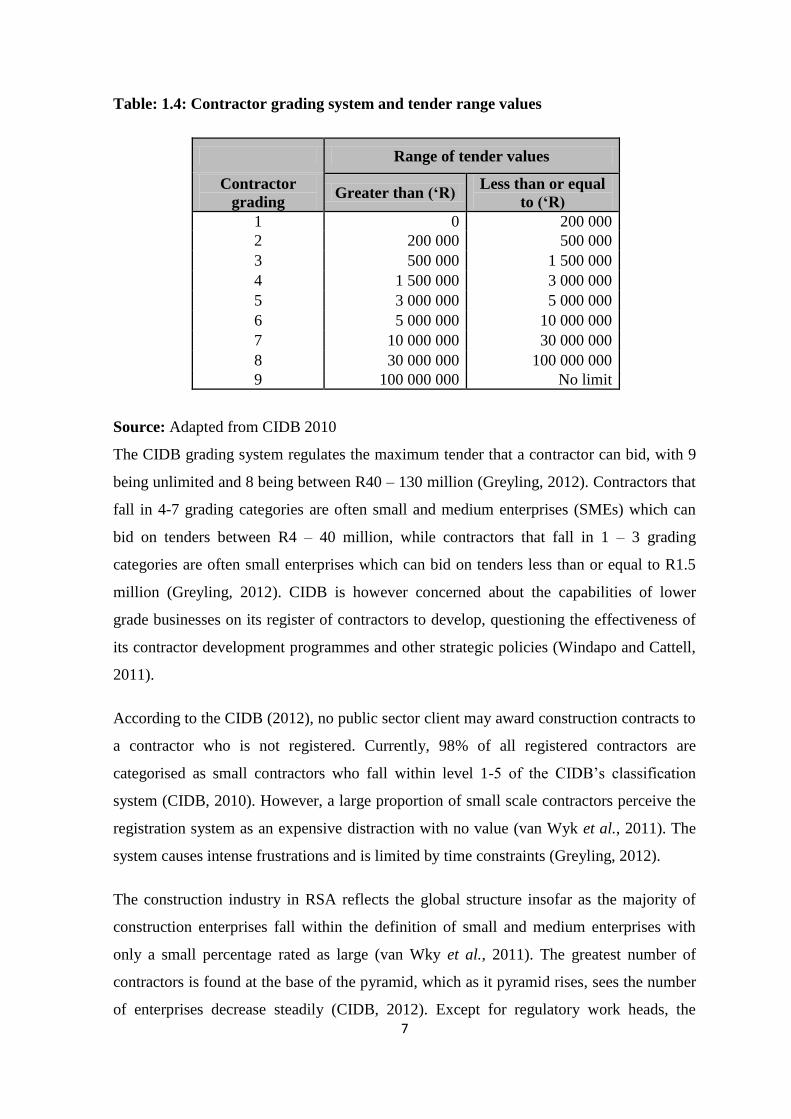
7
Table: 1.4: Contractor grading system and tender range values
Range of tender values
Contractor
grading Greater than (‘R)
Less than or equal
to (‘R)
1 0 200 000
2 200 000 500 000
3 500 000 1 500 000
4 1 500 000 3 000 000
5 3 000 000 5 000 000
6 5 000 000 10 000 000
7 10 000 000 30 000 000
8 30 000 000 100 000 000
9 100 000 000 No limit
Source: Adapted from CIDB 2010
The CIDB grading system regulates the maximum tender that a contractor can bid, with 9
being unlimited and 8 being between R40 – 130 million (Greyling, 2012). Contractors that
fall in 4-7 grading categories are often small and medium enterprises (SMEs) which can
bid on tenders between R4 – 40 million, while contractors that fall in 1 – 3 grading
categories are often small enterprises which can bid on tenders less than or equal to R1.5
million (Greyling, 2012). CIDB is however concerned about the capabilities of lower
grade businesses on its register of contractors to develop, questioning the effectiveness of
its contractor development programmes and other strategic policies (Windapo and Cattell,
2011).
According to the CIDB (2012), no public sector client may award construction contracts to
a contractor who is not registered. Currently, 98% of all registered contractors are
categorised as small contractors who fall within level 1-5 of the CIDB’s classification
system (CIDB, 2010). However, a large proportion of small scale contractors perceive the
registration system as an expensive distraction with no value (van Wyk et al., 2011). The
system causes intense frustrations and is limited by time constraints (Greyling, 2012).
The construction industry in RSA reflects the global structure insofar as the majority of
construction enterprises fall within the definition of small and medium enterprises with
only a small percentage rated as large (van Wky et al., 2011). The greatest number of
contractors is found at the base of the pyramid, which as it pyramid rises, sees the number
of enterprises decrease steadily (CIDB, 2012). Except for regulatory work heads, the

8
registry functions as an administrative body only for the public sector procurement. In
Singapore, contractors who are not registered with BCA are precluded from conducting
business as contractors or suppliers outside the public sector (Economics Research
Department, 2011:4).
1.1.2 CURRENT TRENDS IN SOUTH AFRICAN CONSTRUCTION INDUSTRY
The Department of Public Works, the Construction Industry Development Board and
Construction Education and Training Authority are currently three public entities in RSA
that implement construction industry development initiatives. The trends in the industry
are largely shaped through these departments. The numerous construction projects which
were carried, for example, in preparation for the country’s hosting of the 2010 FIFA World
Cup, cushioned the local construction industry against the 2008 global building slump
(Creamer Media, 2013). In spite of a boom, activities in the industry declined after the
event and companies faced adverse trading conditions. After a few years, some industry
participants expected market conditions to improve in 2012, but as the year unfolded, they
continued to report a slow flow of contracts (Creamer Media, 2013).
There is some optimism, however, that the construction industry may recover, a key factor
being the rate at which the government intends to roll out its planned R827 billion
infrastructure expenditure over the next three years (CIDB 2012). The turnover in the
construction industry is highly sensitive to government spending as the government is the
industry’s largest client (Windapo and Cattell, 2011). As at the beginning of year 2013, the
tenders relating to government’s infrastructure plans were slowly coming to the market.
However, infrastructure planning has been channelled through the Presidential
Infrastructure Co-ordinating Commission (PICC) and it is hoped this would unblock
project delays.
Various indicators have been employed as the basis of analysis in examining the current
drivers of South Africa construction industry, including economic outputs such as GDP,
state of the infrastructure, construction businesses and employment. As highlighted by
Pearce (2003), each of these reveals part of the story that is relevant to understanding the
state of the construction industry. The current drivers in the construction industry relate to
the state of the infrastructure and for the purpose of this study are defined as forces

9
external to the industry that influence its behaviour and current situation (Rust and Koen,
2011). These include the housing backlog, which has led to urban shanty houses and
poverty. These houses lack adequate access to water, sanitation, security of tenure,
structural quality of housing and living space (Rust and Koen, 2011). Demand for housing
is constantly growing as the population increases and more people move into cities, such
as Johannesburg. However, the government has aimed to eradicate informal settlements by
2014 (Rust and Koen, 2011). Another driver relates to the infrastructure as the government
intends to improve on aging national infrastructure. Many types of infrastructure are
needed in Gauteng Province to support the growing population and to achieve national
development objectives. The government policies tend to keep the construction industry
busy as it spends on infrastructure as a way of protecting jobs and boosting the economy.
As a result, the existence of ECs in these developments is vital.
The performance and delivery of the SA construction industry has remained highly
variable and inconsistent across a broad range of issues and policies such as the
Government Preferential Procurement Policy Framework Act (Atkinson, et al. 2012).
There is fierce competition and low margins in the industry which generate loss of
knowledge and concomitant enterprise failure, predominantly in the R5 million and lower
range (CIDB, 2013). A lack of knowledge and deterioration in capability remain
problematic, resulting in an “average” customer satisfaction rating of industry products
(CIDB, 2013; Atkinson, et al. 2012). The shortage of skilled labour force has been cited as
one challenge within the industry (CIDB, 2013), implying that skills are not being
developed and employment conditions show no respect for people being applied
(Atkinson, et al. 2012). The employment of casual labour in the industry has been the daily
norm coupled with reduced wages, poor working conditions and remuneration, low formal
skills development or training, and thus reduced quality of life (Atkinson, et al. 2012).
However, with the establishment of the CIDB, CETA, Broad Based Black Economic
Empowerment (BBBEE), Preferential Procurement Policy Framework, some of these
issues in the industry may change and stimulate ECs’ growth and profitability.
10
1.2 THEORETICAL FOUNDATION AND LITERATURE REVIEW
The theories that have a bearing on this thesis are the Balanced Scorecard (Kaplan and
Norton (1992) and The SA Construction Excellence Model (SACEM) (Dlungwana et al.,
2002).
1.2.1 Balanced scorecard theory
One influential model to guide ECs in the construction industry to enhance business
performance is the balanced scorecard model (BSC), developed by Kaplan and Norton in
the 1990s. With it, balancing the measurement system is required so that all essential
perspectives affecting company success are brought into focus (Kaplan and Norton, 1996).
Although the BSC has gained popularity in research and industry it still has its
shortcomings (Bassioni et al., 2004):
The majority of BSC implementation initiatives in firms fail and the perspectives
of the BSC have been considered insufficient (Neely and Bourne 2000).
Even though the model does not tell what the strategy should be, or what should be
measured, it gives a general framework for measurements and for the process of
implementing a strategy in practice. As an advantage, the model further suggests
that its perspectives should be considered as cornerstones of the measurement
system (Salminen, 2005).
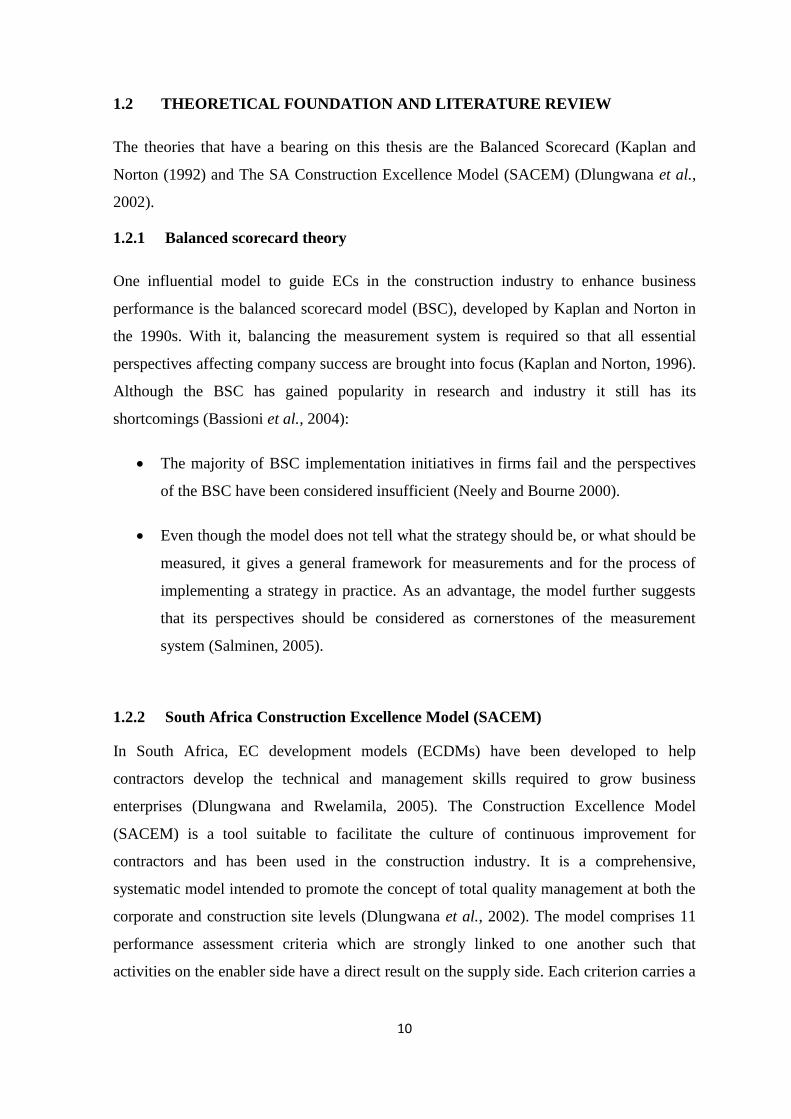
1.2.2 South Africa Construction Excellence Model (SACEM)
In South Africa, EC development models (ECDMs) have been developed to help
contractors develop the technical and management skills required to grow business
enterprises (Dlungwana and Rwelamila, 2005). The Construction Excellence Model
(SACEM) is a tool suitable to facilitate the culture of continuous improvement for
contractors and has been used in the construction industry. It is a comprehensive,
systematic model intended to promote the concept of total quality management at both the
corporate and construction site levels (Dlungwana et al., 2002). The model comprises 11
performance assessment criteria which are strongly linked to one another such that
activities on the enabler side have a direct result on the supply side. Each criterion carries a
11
score weighted according to its importance in helping a contractor achieve superior
performance.
1.2.3 Challenges faced by ECs
An examination of literature indicates that construction industries around the world face
many difficulties and challenges (Ofori, 1991), however, they become more significant
and complex in developing countries such as South Africa, where ECs face challenges
such as lack of skills, financial instability, chronic resource shortages and general failure
by contractors to deal with key issues (Buys and Daluxolo, 2012; Rust and Koen, 2011).
These challenges make some businesses unable to sustain operational performance beyond
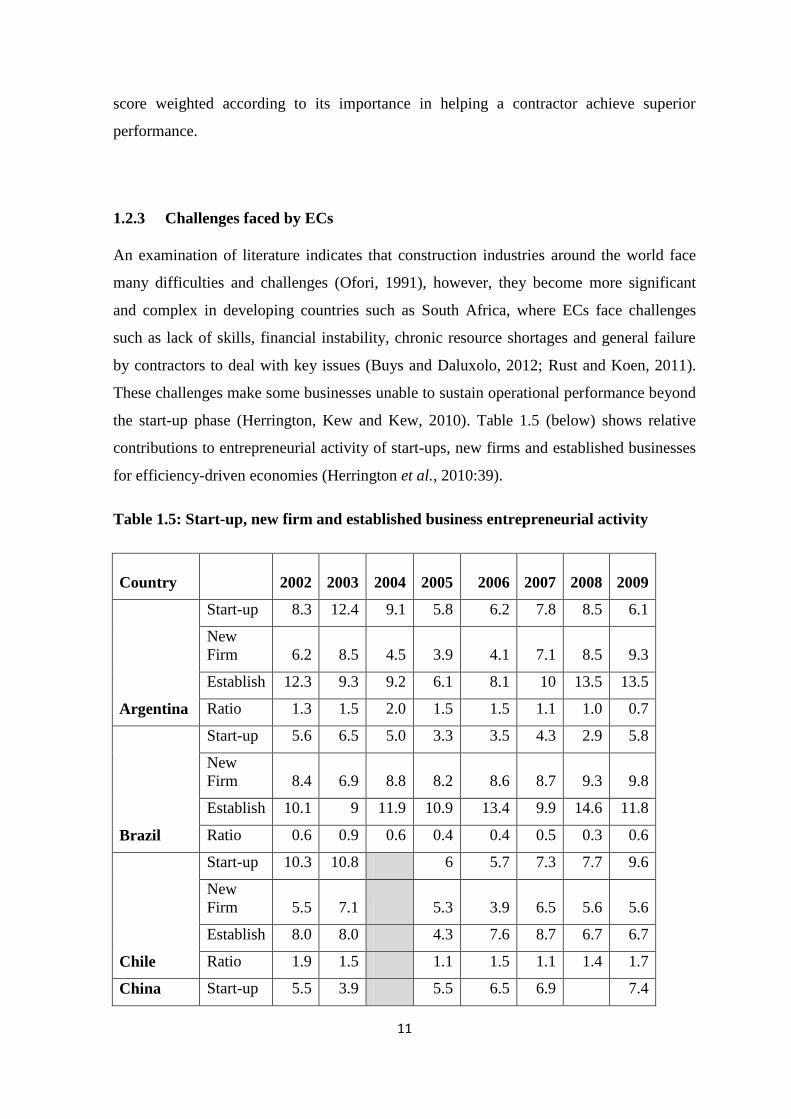
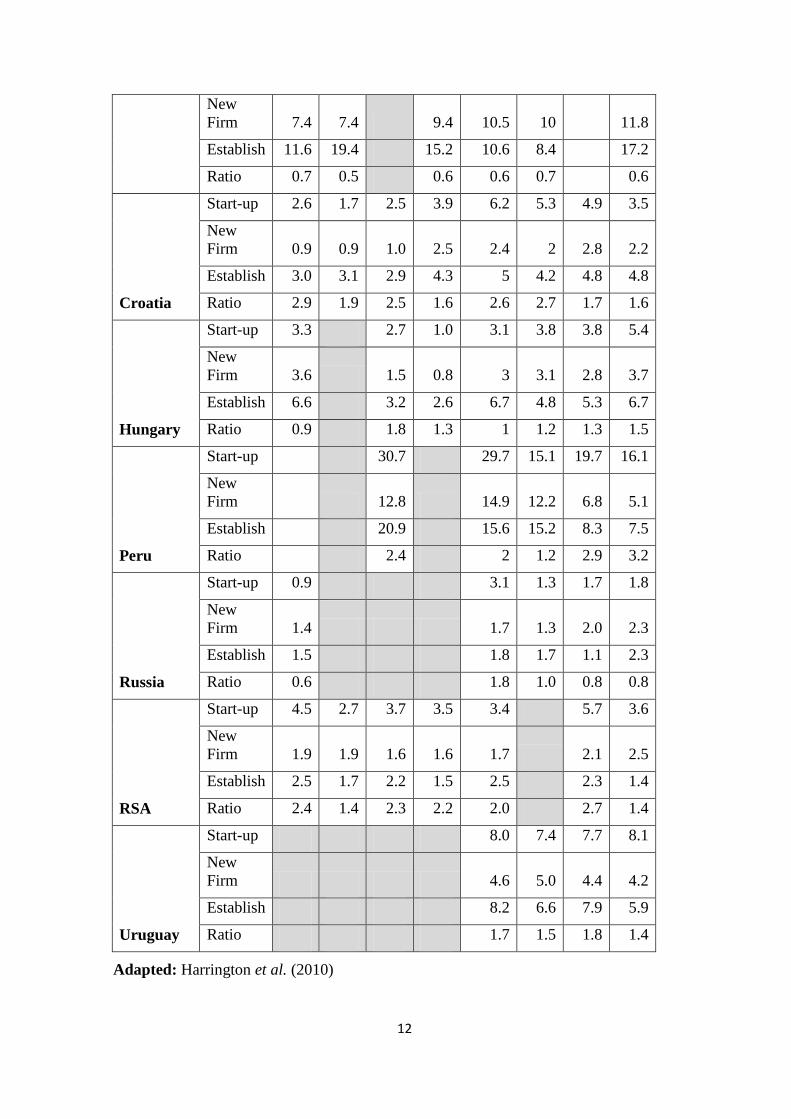
the start-up phase (Herrington, Kew and Kew, 2010). Table 1.5 (below) shows relative
contributions to entrepreneurial activity of start-ups, new firms and established businesses
for efficiency-driven economies (Herrington et al., 2010:39).
Table 1.5: Start-up, new firm and established business entrepreneurial activity
Country 2002 2003 2004 2005 2006 2007 2008 2009
Argentina
Start-up 8.3 12.4 9.1 5.8 6.2 7.8 8.5 6.1
New
Firm 6.2 8.5 4.5 3.9 4.1 7.1 8.5 9.3
Establish 12.3 9.3 9.2 6.1 8.1 10 13.5 13.5
Ratio 1.3 1.5 2.0 1.5 1.5 1.1 1.0 0.7
Brazil
Start-up 5.6 6.5 5.0 3.3 3.5 4.3 2.9 5.8
New
Firm 8.4 6.9 8.8 8.2 8.6 8.7 9.3 9.8
Establish 10.1 9 11.9 10.9 13.4 9.9 14.6 11.8
Ratio 0.6 0.9 0.6 0.4 0.4 0.5 0.3 0.6
Chile
Start-up 10.3 10.8 6 5.7 7.3 7.7 9.6
New
Firm 5.5 7.1 5.3 3.9 6.5 5.6 5.6
Establish 8.0 8.0 4.3 7.6 8.7 6.7 6.7
Ratio 1.9 1.5 1.1 1.5 1.1 1.4 1.7
China Start-up 5.5 3.9 5.5 6.5 6.9 7.4
12
New
Firm 7.4 7.4 9.4 10.5 10 11.8
Establish 11.6 19.4 15.2 10.6 8.4 17.2
Ratio 0.7 0.5 0.6 0.6 0.7 0.6
Croatia
Start-up 2.6 1.7 2.5 3.9 6.2 5.3 4.9 3.5
New
Firm 0.9 0.9 1.0 2.5 2.4 2 2.8 2.2
Establish 3.0 3.1 2.9 4.3 5 4.2 4.8 4.8
Ratio 2.9 1.9 2.5 1.6 2.6 2.7 1.7 1.6
Hungary
Start-up 3.3 2.7 1.0 3.1 3.8 3.8 5.4
New
Firm 3.6 1.5 0.8 3 3.1 2.8 3.7
Establish 6.6 3.2 2.6 6.7 4.8 5.3 6.7
Ratio 0.9 1.8 1.3 1 1.2 1.3 1.5
Peru
Start-up 30.7 29.7 15.1 19.7 16.1
New
Firm 12.8 14.9 12.2 6.8 5.1
Establish 20.9 15.6 15.2 8.3 7.5
Ratio 2.4 2 1.2 2.9 3.2
Russia
Start-up 0.9 3.1 1.3 1.7 1.8
New
Firm 1.4 1.7 1.3 2.0 2.3
Establish 1.5 1.8 1.7 1.1 2.3
Ratio 0.6 1.8 1.0 0.8 0.8
RSA
Start-up 4.5 2.7 3.7 3.5 3.4 5.7 3.6
New
Firm 1.9 1.9 1.6 1.6 1.7 2.1 2.5
Establish 2.5 1.7 2.2 1.5 2.5 2.3 1.4
Ratio 2.4 1.4 2.3 2.2 2.0 2.7 1.4
Uruguay
Start-up 8.0 7.4 7.7 8.1
New
Firm 4.6 5.0 4.4 4.2
Establish 8.2 6.6 7.9 5.9
Ratio 1.7 1.5 1.8 1.4
Adapted: Harrington et al. (2010)
13
The table shows a high ratio for South Africa between start-ups and new businesses. In
other countries this ratio is lower, suggesting that in South Africa many businesses such as
ECs that are at the bottom of CIDB grading either never progress beyond the start-up
phase or close.
The main contributory factors to the growth of ECs that are noticeable and which have
adverse implications for performance include:
The low level of bargaining power of the ECs in view of the way in which demand
is put;
The project-based nature of work, which implies discontinuity and leaves ECs
without construction work;
The use of aged technology by ECs in the construction industry which does not
match with large construction companies;
The way in which projects are financed in many countries (with the client only
paying for work which has been done);
The high level of regulations governing construction activities which means ECs
must seek many administrative approvals.
These factors involve cost and time for the ECs and cause delays in project delivery,
resulting in penalties that are significant to the proportion of ECs’ turnover. Accordingly,
South Africa government has made several attempts to improve the performance of ECs in
the industry by providing support schemes that include:
Through CIDB grading system, a floor limit on project values has been placed
which makes it difficult for larger businesses to tender for, thereby reserving some
projects for ECs (CIDB, 2012).
South Africa government has accepted the role of emerging ECs for job creation
(Dlungwana and Rwelamila, 2003) and so has made considerable progress in
creating an enabling environment for new entrants to the construction industry
(Buys and Daluxolo, 2012).

14
Through SEDA and CIDB, ECs are provided with financial assistance and training
or mentorship.
The Extended Public Works Programme, the Emerging Contractor Development
Programme and the Contractor Incubation Programme (CIDB, 2009).
The Preferential Procurement Policy Framework Act of 2000.
Broad Based Black Economic Empowerment Act (53 of 2003).
Provision of guidance in the form of management and financial administration in
the execution of projects.
Some financial institutions have seen business opportunities in the construction
industry through ECs and have set up assistance schemes for them (Greyling,
2012).
Although the government has provided support to the ECs there are views that are upheld
in literature which show that weak performance is still found within the EC industry. Thus,
the intended performance outcomes have remained elusive for ECs (Buys and Daluxolo,
2012). The results of the business conditions survey conducted by the CIDB (2009) show
that contractors are reporting worsening business conditions, showing that ECs have failed
to take the important role as their performance has remained relatively low (Thwala and
Phaladi, 2009).
1.3 THE PROBLEM STATEMENT
There is weak performance and lack of growth of ECs, despite implementation of
government policies to improve their performance (Buys and Ludwaba, 2012; CIDB,
2012; Greyling, 2012; Marx, 2012). The business performance of ECs is still lagging
behind, as evidenced by lower levels of profitability and sustainability (Greyling, 2012;
Buys and Ludwaba, 2012; Thwala and Phaladi, 2009).
The following question therefore summarises the statement of the problem:

15
What are the perceptions of SBEs on the determinants of business
performance in Gauteng that affect sustainable growth, profitability and
enhancement?
1.3.1 Rationale of the study
The reviewed literature demonstrates that the performance of the ECs in the construction
industry is relatively weak (CIDB 2011, 2012; Marx 2013; Atkinson, 2012; Buys and
Ludwaba, 2012; Gasa, 2012; Greyling, 2012; Windapo and Oladapo, 2012; Mbachu, 2012)
despite government intervention in the form of CIDB, ECDP, EPWP and CETA. Thus, the
failure in the industry to systematically explain the determinants of ECs’ performance has
led the issue of performance to remain a subject of discussion among academics, business
executives and policymakers. A review of literature has shown that perceptions are critical
to explain and solve problems of this nature. For example, Umar et al., (2012) used
perceptions of regional stakeholders on benefits of the private finance initiative (PFI) for
infrastructure provision in Malaysia. The study found that the value for money that was
being emphasised as the most important benefit of the initiative did not exist from the
viewpoint of the respondents, and the government had to reappraise the reasons for
adopting the PFI procurement strategy. Odusami (2002:61) used perceptions of
construction professionals concerning important skills of effective project leaders in
Nigeria. The study found that the most important skill among three groups (clients, the
consultants and the contractors) was decision-making. However, in the overall analysis,
the study established no significant difference in the perceptions of the three significant
actors regarding the ranking of the skills. Another study, by Akinsiku and Akinsulire
(2012:25), assessed construction stakeholders’ perceptions of the causes of delays and its
effects on project delivery in a bid to offer solution in minimising the occurrences of
delays. Based on stakeholders’ perceptions, client’s cash flow related problems were found
as the main causes of delays while time and cost overruns were the major effects of delays
in construction delays.
In order to reach the core of the ECs problem in South Africa, a different perspective is
looked at, that of determining the perceptions of SBEs in the construction industry on
determinants of business performance. The approach may give policymakers and SBEs a
starting point since there are few studies if any that looked at the perceptions of SBEs
registered with CIDB. SBEs’ experiences, perceptions and incidents may trigger

16
businesses in the construction industry either to survive or collapse as well as improving
business performance. Therefore, any attempt to influence ECs’ performance should
engage SBEs and gauge a thorough understanding of their perceptions. Otherwise, the
issue of ECs’ performance would be perpetuated unless research were undertaken that
examines the business assistance realities of SBEs to better understand those experiences
from the perspective of their understanding and abilities. Against this background, SBEs
being the business custodians with substantial experience which has not been accessed or
harnessed, the essence of the study is to establish their perceptions on the determinants of
ECs’ performance within Gauteng Province so that a performance enhancement model
could be developed.
In terms of the methodologies used before in EC performance studies, the critical incident
technique (CIT) (Flanagan, 1954) has not been utilised to gauge the perceptions of SBEs,
yet, the CIT allows respondents to give verbatim stories about SBE experiences (Keaveney
1995). Respondents answer questions in their own words and this reveals more about what
they think in relation to the critical incidents encountered. CIT is a useful technique with
which the researcher looks for insight into how SBEs think rather than measuring how
many business owners think in a certain way. Researchers and policymakers have moved
ahead of SBEs in terms of explaining the determinants of ECs’ performance. The solution
to the problem is nowhere near, which may suggest that SBEs have been deprived of their
voice in the performance of business operations.
In order to close this gap, this study looked back and engaged SBEs’ experiences in the
body of knowledge and policy formulation, using the critical incident technique (CIT)
(Gremler 2004; Keaveney 1995; Flanagan 1954) to facilitate investigation of significant
occurrences (incidents) identified by SBEs to gain a better understanding of the
determinants of construction business performance from the perspective of the business
executives, taking into account cognitive, affective and behavioural elements.
The above discussion has pointed out the gap in literature and how researchers have
omitted the perceptions of SBEs and the utilisation of the CIT. If SBEs are given an
opportunity to express their opinions highlighting the incidents encountered, this may
contribute towards the desired goal of enhancing the ECs’ performance.
17
1.3.2 Research questions
To gain a better understanding of ECs’ performance in South Africa and to determine
which factors SBEs believe are important for high business performance, the proposed
exploratory descriptive study sought to answer the following research questions:
What critical incidents have been encountered and perceived by SBEs in the
construction industry to have impacted on business performance?
What are the determinants of ECs business performance in Gauteng Province?
What relationship exists between project performance and corporate performance
as perceived by SBEs?
What are the perceptions of SBEs on the determinants of business performance
among the ECs in Gauteng Province?
What relationship exists between the profiles of ECs and their performance in the
industry?
What are the perceived measures that can be put in place to promote high
performance among ECs?
1.3.3 Research aim
The aim of the study is to examine the perceptions of SBEs on determinants of business
performance with reference to the CIDB Grade 2 registered ECs in Gauteng Province.
1.3.4 Objectives
The objectives of this research are as follows:
To assess the critical incidents that have been encountered by SBEs in the
construction industry and their effect on business performance.
To assess the determinants of EC business performance in Gauteng Province.

18
To assess the relationship between EC project performance and EC business
performance?
To assess the perceptions of SBEs on determinants of business performance in
Gauteng Province.
To establish the relationship between the profiles of ECs and their performance in
the industry.
To characterise the perceived measures that could assist in promoting high
performance among ECs.
1.3.5 Hypothesis of the study
Based on the research questions, the four hypotheses for this study regarding ECs
registered with CIDB in Gauteng Province are outlined below:
H1: Financial factors, manpower factors, supply of materials, equipment and
machinery, project implementation, quality factors; legal and regulatory factors,
strategic planning affect EC performance.
H2: Project performance positively affects the overall corporate performance.
H3: Perceptions of SBEs can affect positively or negatively their business
performance.
H4: There is a relationship between company profiles and Business performance.
1.4 BRIEF RESEARCH DESIGN
A cross-sectional study design was used to collect the data that was needed to test the
research questions of this study. This design was most convenient as the questionnaire was
only sent out once to a single population element. The study employed a mixed approach
to examine the perceptions of SBEs on determinants of ECs’ performance by applying
both qualitative and quantitative research approaches. This was done to provide a better
understanding of the perceptions of SBEs on determinants of business performance.

19
1.4.1 Population and sampling
The population from which the sample was drawn comprised 1890 urban based ECs
(Grades 2) registered with CIDB in the construction industry in Gauteng, the Province
selected based on the level of business confidence (CIDB 2013) recorded during the
financial year 2011 /2012, and the most prosperous. Random sampling of 501 ECs was
used, to which a largely structured questionnaire and interview guide were administered as
the data collection instruments. The unit analysed comprised the SBEs as representatives
of ECs.
1.4.2 Data analysis and interpretation
The first phase involved qualitative results which were content analysed, measuring the
semantic content or the aspect of a message (Cooper and Schindler, 2011). The results
obtained from this phase informed the quantitative research through data transformation.
The second phase involved quantitative findings which were analysed using descriptive
and inferential statistics, the former including measures of central tendency and dispersion.
The results were presented as bar charts and tables, the latter to draw inferences from a
sample to a population. The univariate and multivariate statistical methods were performed
to measure the level of significance between and among the performance determinants
tested at a desired confidence level. The results from both qualitative and quantitative
methods were integrated to establish areas of convergence and divergence.
1.5 THE SCOPE OF THE STUDY
The study covered ECs registered with CIDB in Grade 2 and was conducted in Gauteng
Province, one of nine in South Africa, namely, Gauteng, Western Cape, Mpumalanga,
KwaZulu-Natal, Free state, Eastern Cape, Northern Cape and North West Provinces. The
construction industry depends heavily on government orders in sectors such as electricity
power plants, petroleum and infrastructure projects. The national and provincial
governments are the major customers for large projects, such as Medupe Power Station
and other infrastructure construction, which require high technology. Such orders are given
to construction companies in Grades 7 to 9 contractors as they are considered strong in
financial terms. Contractors in Grade 1 to 6 are perceived to lack capital and technology

20
which act as barrier against their performance. Private orders are notable in other segments
such as industrial and commercial buildings. Public infrastructural projects are associated
with considerable risks, the complexity involved is huge, and involve many public and
private stakeholders with conflicting interests. Such projects have an impact on the public
during execution and many changes are usually encountered compared to other types of
construction projects.
The data required from SBEs in the construction industry related to perceptions on the
determinants of business performance and impact on the performance of ECs. The
respondents were limited to SBEs as representatives of ECs, an acknowledgement of their
increasing role in business decisions, particularly in the construction industry. Government
departments and private developers were classified as clients of the construction projects.
There are three types of project considered in this study: a government project, that is a
public one initiated from a government department such as the Housing Authority; a public
/ private utility project, which is usually an infrastructure project, for example, one
initiated by a mass transportation services provider such as railway system; and a private
development project, such as residential development.
1.6 PERCEIVED CONTRIBUTION TO KNOWLEDGE
Literature covers many factors affecting construction performance in South Africa and its
impact on business performance, however, many of these studies have focussed on the
relatively large organisations which often undertake large projects in the major cities of the
economy (Windapo and Cattell, 2011; Thwala and Mvubu, 2009). ECs that constitute over
80% of the job market have been left out of the sampling frame, giving CIDB Grades 1
and 2 an impression that they are unimportant. However, although these businesses are
classified as small, collectively they contribute substantially to overall construction GDP,
especially in the municipal, provincial and local government activities. These ECs account
for over 50% of all building materials production and nearly 80% of all short-term
employment in many deprived communities in Gauteng (Windapo and Cattell, 2011).
Furthermore, it is in the country’s interest for there to be strong growth of ECs towards
higher grades on the CIDB Register of Contractors (Windapo and Cattell, 2011).

21
Given that the ECs provide a basic foundation to the economy and also determine the
productivity of investment and the rate of development in local townships of the Province,
the research in the EC sector is driven by a need to emulate larger business’s activities and
establish a set of desirable management activities that ECs could implement. The view is
supported by Gibson and Casser (2005), who argued that when these activities are passed
onto small business management through appropriate knowledge dissemination processes
there is an expectation of a more efficient and effective small business sector. Hence, the
concern by CIDB about the capabilities of lower grade businesses on its register of
contractors to develop would be reduced.
Specifically, there are no studies that effectively or clearly highlight the perceptions of
SBEs as representatives of ECs on determinants of business performance. It therefore
becomes imperative to further explore the determinants of ECs’ performance by assessing
the perceptions of SBEs in the construction industry as a different approach such that
performance frameworks could be developed based on the perceptions generated. This
study is a contribution towards achieving that. It is also an attempt to support the
development of the ECs to build much-needed capacity which would enable them to seize
more business opportunities, attain sustainable growth, and create better employment
opportunities. This study provides evidence to policymakers, ECs’ owners and other
stakeholders on key variables that need closer attention to improve the success of ECs.
Those significant variables that are controllable could be properly managed to increase the
chances of ECs growth and profitability. More importantly, the results would facilitate
performance prediction and explain the performance determinants of ECs, while serving as
a source of reference for policymakers when formulating medium- to long-term
development strategies for promoting the development of ECs.
Specifically, the impetus, importance and contribution for this study can be divided into
three main areas:
1. Building small construction businesses capability to implement high performance
strategic practices
2. Application of Critical Incident Technique (CIT) by small construction business
leaders in South Africa to predict performance.
3. The use of SBEs’ perceptions in determining business performance.

22
1.7 BRIEF DESCRIPTION OF THE CHAPTERS IN THIS THESIS
The thesis is presented in seven chapters as follows:
Chapter 1: Introduction
This chapter has outlined the background to the study, providing a theoretical foundation
and the preliminary literature review that shape it. A problem statement and its rationale
have been discussed, with the research questions, objectives and hypothesis have been
presented. The chapter concluded by discussing the scope, perceived contribution to
knowledge and the study environment.
Chapter 2: Theoretical analysis and Literature review
This chapter gives a theoretical analysis of performance and reviews the literature relevant
to the study. It provides a summary of the literature review in relation to the research
questions and objectives. The literature examines the performance definition in
construction industry, measurement of performance in the industry and the determinants of
performance as they relate to the ECs registered with CIDB. A comprehensive review of
the existing literature on ECs’ performance is presented.
Chapter 3: Research methodology
This chapter focuses on the research design and methodology of the study. Issues relating
to research design, research philosophy, research strategy, population and sampling, data
collection instruments, data analysis and pilot study are presented.
Chapter 4: Presentation of results
This chapter presents the research results, in two parts, Part A the qualitative results and
Part B the quantitative.
23
Chapter 5: Synthesis and analysis of the research results
The qualitative and quantitative results are synthesised and analysed in this chapter. In
addition, it ties together the information gathered during the literature review with the
integrated results.
Chapter 6: Conceptual performance prediction model: Contribution to
knowledge
In this chapter, the conceptual performance prediction model developed is discussed as the
contribution of the study. The discussion focuses on the structure of the model, how it is
used, the advantages and disadvantages associated with it.
Chapter 7: Conclusion and Recommendations
This chapter presents the conclusions and recommendations of the study. The implications
and limitations of the study are also presented.
1.8 SUMMARY OF THE CHAPTER
The scene for the study has been set in this chapter, the problem statement; the research
questions, the objectives and the hypothesis have been defined. The background to the
RSA construction industry as it relates to ECs has been given. The scope and the perceived
contribution of the study to the body of knowledge have also been discussed.
The next chapter provides a theoretical analysis of performance and reviews the literature
relevant to the study.

24
CHAPTER TWO
THEORETICAL ANALYSIS AND LITERAUTURE REVIEW
2.1 CHAPTER INTRODUCTION
This chapter forms the foundation on which this research is built. The purpose of the
review was to help develop an understanding and provide insight into relevant previous
research and the trends that have emerged. As such, a critical review of literature provided
different theoretical perspectives, controversies and limitations on theories and
methodologies used before. The literature sources used in this study include professional
journals, books, newspapers, conference proceedings, government reports and thesis.
The chapter is divided into five sections based on issues of performance construct:
The first section deals with the theoretical foundation of the study (Yang et al.
2010, Beatham et al. 2004, Bassioni et al. 2004, Dlungwana et al. 2002, Kaplan
and Norton, 1992).
The second section examines business performance domain focusing on the
conceptualization of performance (Idrus and Sodangi 2010, Mbachu and Nkado
2006, Tangen 2005, Ling 2004, Kagioglou 2001, Murphy et al. 1996, Keats and
Bracker 1988, Venkatraman and Ramanujam 1986, Peters and Waterman 1982).
The third section focusses on the measurement of performance in business
(Langston 2012, Tsolas 2011, Sillars 2010, Rwelamila and Asalan 2010, Yang et
al. 2010, Lam and Wong 2009, Zwikael 2008, Jin et al. 2007, Bassioni et al. 2005,
Cox et al. 2003, Neely et al. 2002, Kagioglou et al. 2001, Yu et al. 2007, Pheng
and Chuan 2006, Cheung et al. 2004, Pfeffer 1978).
The fourth section looks at the facilitators and impediments of construction
business performance (Gasa, 2012, Greyling 2012, Ladzani et al. 2012, Baloyi and
Bekker 2011, Emuze 2011, Dlungwana, Kandie and Ngassam 2009, Enshassi,
Mohamed and Abushaban 2009, Thwala and Mvubu 2009, Mbachu and Nkado
2007, Faridi and El-Sayegh 2006, Chan and Chan 2004), and
The last section points out the gap in knowledge that is addressed by this study.
25
2.1.1 The concepts of study
The study environment takes account of the small construction industry in Gauteng, in
particular the changing trends and economic indicators. The existence of infrastructure and
location of future infrastructure exert substantial influence on the performance of the
economy and therefore the construction industry. Currently, the provincial government is
investing billions of rand in multi-pronged infrastructure development projects in a bid to
stimulate economic growth and create jobs (City of Johannesburg Website, accessed 15
August 2014).
Gauteng Province is the economic powerhouse of the RSA and makes the largest
contribution to GDP (37.73% compared to second-placed KZN at 14.9%) (Van Wyk et al.,
2011). The continuing deterioration of infrastructure is cause for concern, for example, the
national government considered giving the city of Johannesburg an R800 million capital
injection to boost the city’s run-down electricity infrastructure (Engineering News, 2005).
An information communication technology hub in Nasrec in Soweto, Smart City and
continuing provision of housing are some major projects for the Province.
The construction industry is large, diverse and complex, playing an important role within
the built environment industry (Ladzani et al., 2010:45), which in turn is indispensable to
the national economy as it provides the physical infrastructure necessary for development
(Marx, 2012:2). The construction industry is responsible for about 12% of the gross
domestic product (GDP) and in 2008, construction investments accounted for up to 60% of
all investments in SA (Marx, 2012).
The focus of the study is on both building and civil projects, the latter consisting mainly of
investment in economic infrastructure such as transport, housing, water and sanitation
services, energy and mining, investment funded primarily by government and state-owned
enterprises including Eskom, Transnet and ACSA.

26
2.1.1.1 Gauteng Province - A brief profile
Gauteng is the smallest of the nine Provinces in South Africa, with a land area of 18,178
square kilometres (Census, 2011:9). Landlocked and surrounded by Limpopo,
Mpumalanga, North West and Free State Provinces, it is divided into three metro
municipalities, and two district municipalities, which are further sub-divided into eight
local municipalities (see Table 2.1 and Figure 2.1 below). While being the smallest
Province it the most highly populated, being home to 12.2 million people (Census,
2011:18), almost 25%% of the national total. The fastest growing Province, it experienced
a population growth of over 33% between the 1996 and 2011 censuses, and as with the
others it continues to experience challenges of high levels of unemployment, chronic
poverty and unemployment. It requires job creation, provision of infrastructure,
development of small businesses education and skill development (GautengOnline,
2014:3).
The development of ECs in Gauteng Province is one aspect of SMME that is critical to the
Province, in terms of employment creation and poverty alleviation. In line with the
national policies towards the development of SMMEs, the Province has made significant
and innovative advances in supporting the development of SMMEs, for example, the
establishment of an SMME Agency which is meant to provide financial and non-financial
support to SMME’s and information on services of SMME’s, facilitate partnerships
between big business and the SMME sector, and create procurement opportunities for the
SMME sector and networking with other sectors of society (Gauteng online, 2005: 19).
The types of construction projects common in Gauteng that are the focus of this study are
found in the following areas:
Construction of provincial and government buildings
Industrial facilities and commercial buildings
Public housing, hospitals and schools
Power station plants
Roads and transportation
Water purification plants

27
Table 2.1: Gauteng district and local municipalities
Johannesburg
Metropolitan
Tshwane
District
Ekurhuleni
Metropolitan
Metsweding
District West Rand
Sedibeng
District
Midrand Pretoria JHB Int.
Airport Cullinan Magaliesburg Heidelberg
Sandston Centurion Bedfordview Bronkhorstsp
ruit Muldersdrift Vereeniging
Randburg Benoni Krugersdorp Vanderbijlpark
Johannesburg Boksburg Carletonville
Soweto Springs
Source: Own Compilation
Figure 2.1: Map of Gauteng province
Source: www.sleeping-out.co.za/Gauteng-Map.asp

28
2.2 THEORETICAL FOUNDATION OF THE STUDY
Over recent years, companies in Europe and the USA, as a result of the success of
Japanese counterparts, have begun to take a wider view of performance measurement, with
various quality awards and theories being introduced during the 1980s (Beatham, Anumba
and Thorpe, 2004:99). A number of frameworks have subsequently been developed that
have a bearing on this thesis, however, theoretical consideration is focussed on the
European Foundation for Quality Management (EFQM) Excellence Model in Europe, the
KPI model, the Balanced Scorecard (Kaplan and Norton (1992) and the South African
construction Excellence Model (SACEM) (Dlungwana et al., 2002). Whilst these
frameworks are different in the way they address the issue of performance, they can
however coexist simultaneously (Bassioni, Price and Hassan, 2004:44).
2.2.1 The European Foundation for Quality Management Model (EFQM)
The EFQM excellence model was developed in Western Europe in 1989 (Yang, Yeung,
Chan, Chiang and Chan, 2010:273) to allow companies to assess their positions on the
path to excellence (Bassioni et al., 2005; Beatham et al., 2004). The model is regarded as a
self-assessment tool, which enables a comprehensive, systematic and regular review of an
organisation’s activities and results (Beatham et al., 2004:100). It is based on key
fundamental concepts of excellence that include enabling and results criteria (Bassioni et
al., 2004 & 2005). The enabling criteria include: leadership; customers and stakeholder
focus; strategic management; information and analysis; people; partnerships; suppliers;
physical resources; intellectual capital; risk; work culture; and process management (Yang
et al., 2010; Beatham et al., 2004). The results criteria include: internal stakeholder;
project; external stakeholder and organisational business results (Yang et al., 2010;
Beatham et al., 2004).
According to Bassioni, Hassan and Price (2008:24), leadership should guide the focus of
the organisation on customers, people and other relevant stakeholders who in turn should
guide the development of strategic processes for implementation plans. The strategic plans
are detailed into functional or programmatic business plans that are translated into
processes for implementation (Bassioni, Hassan and Price, 2008:24). Once implemented
for projects and throughout the organisation, improved internal stakeholder results should

29
start to appear. Consequently, this would reflect on project results that affect customer and
external stakeholder results not under the direct managerial influence of the organisation.
The outcome would be reflected in the organisational level results. Work culture is driven
by leadership and affecting other enabling criteria while information and analysis is driven
by leadership and supports all other criteria throughout the model (Bassioni, Hassan and
Price, 2008:24).
The model has been widely used and examined by many construction companies in recent
years (Yang et al., 2010; Bassioni and Price, 2008), its main advantage being that it
provides a perspective to integrate result areas (lagging indicators) and organisation areas
(leading indicators) in one model (Lin and Shen, 2007:6). Bassioni, at el. (2008:22),
Robinson et al., (2005) reported that construction firms considered the EFQM model as
less difficult than the Balanced Scorecard (BSC) (Kaplan and Norton, 1992, 1993, 1996)
in terms of determining and monitoring indicators. They attribute this to the presence of
enabling criteria in the EFQM, which are not clear or comprehensive in the BSC (Bassioni
et al., 2008:22). The EFQM excellence model is applied at the organisational and project
level (Yang et al., 2010:274), as well-defined and easier for construction companies to
understand and implement (Robinson et al., 2005:18). However, implementation
problems, as reported by Watson and Seng (2001), cited in Robinson et al., (2005:14),
include resistance to change, inexperience of organisations with the model, documentation
difficulties and insufficient time and fund allocation. Furthermore, there is no evidence
that suggests the model could fit in a competitive environment such as South Africa since
it was developed in a Western environment. The structure of the EFQM excellence model
is shown in Figure 2.2 (below).

30
Figure 2.2: The EFQM Excellence Model
Source: Adapted from Bassioni et al., (2004)
2.2.2 Key performance indicators model
The Latham report advocated improvement in the efficiency and competitiveness of the
industry through reforms in contracting, tendering, design process, quality management,
productivity, training, education and other issues (Egan, 1998:4). In his report to the
government, Egan (1998) described how the U.K. construction industry, at its best,
displays excellence, but there were deep concerns that the industry was underachieving
and that substantial improvements in quality and efficiency were possible (p.6). Egan
(1998:6-7) reported that the industry was low on profitability and invested too little in
capital, research, development and training, with too many clients dissatisfied with its
overall performance. Egan (1998:10) identified specific targets for improvements in terms
of productivity, profits, quality, safety and project performance and, most importantly, the
ambitious targets and the role of performance measurement in delivering improvement.
The purpose of the KPI framework was to enable measurement of both project and
organisational performance throughout the construction industry (The KPI Working
Group, 2000:7). The KPIs were designed as a benchmark for the whole industry, where
companies could measure themselves against national performance and identify areas for

31
improvement (Haponava and Al-Jibouri, 2010:141). However, they do not give insight
into the means of improving performance and are limited for internal management
decision-making (Kagioglou et al., 2001:89). The UK system of KPI assessment as
reflected in Table 2.2 (below) shows that the number of KPIs measured and reported in the
UK has increased over time, which could be attributed to the involvement of multiple
stakeholders in the process.
Table 2.2: Current set of UK KPIs being measured and reported
ECONOMIC KPIs SOCIAL KPIs ENVIRONMENT
KPIs
Client satisfaction-Product Employee satisfaction Environmental impact
Client satisfaction- service Staff turnover Energy use-product
Defects Sickness absence Energy use-process
Predictability-Cost Safety Water use-product
Predictability-Time Working hours Water use-process
Safety Qualifications and skills Waste removed from
site
Productivity Equality and diversity Commercial vehicle
movements
Profitability Training impact on biodiversity
Construction cost Pay Area of habitat created /
retained
Construction time Investors in people Whole of life
performance – product
Source: Furneaux, et al. (2010)
Similar to the KPIs are the construction industry indicators (CIIs) in South Africa (Marx,
2013:2). However, they were benchmarked within the construction industry and have been
successful in introducing many companies to the subject of performance measurement
(Beatham, et al. 2004:102-104). CIIs were developed to play a useful role in developing a
sustainable industry and to be adopted as a tool for improving performance in the
construction industry, however, they now measure the performance of the construction
32
industry at individual project level (Marx 2013:2-3). The measures include employer
satisfaction, contractor’s performance, and quality of materials used, profitability, the
performance of the employers and their agents, the quality of the contract documentation,
the management of variation orders and claims, payment delays and the performance of
materials suppliers (Marx 2013:3).
2.2.3 The Balanced Scorecard and performance
Kaplan and Norton (1992) introduced the Balanced Scorecard (BSC) as a management
system that enables organisations to clarify their vision and strategy and translate them into
action. The BSC can help in reaching the organisation’s objectives, formulation of
strategy, generation of plans and budgets, and the setting up of an information system for
performance monitoring and management (Beatham, et al. 2004:101). It provides a
balance between economic and operating performance, financial and customer outcomes,
short- and longer objectives of an organisation (Luu, et al. 2008:375). The BSC framework
allows organisations to look at performance from four perspectives (Yang, et al. 2010:274;
Beatham, at el. 2004:101; Punniyamoorty and Murali, 2008:426):
Financial: How do we look to our shareholders?
Customers: How do our customers see us?
Innovation and improvement: How can we continue to improve our processes?
Internal process: What must we excel at?

33
Figure 2.3: The Balanced Scorecard
Source: Adapted from Bassioni et al., (2004)
The BSC leads to a cascading set of indicators which enable the units within the
organisation to coordinate targets and behaviour with its overall strategy (Beatham, et al.
2004:101). It provides leading and lagging indicators to evaluate congruence between the
performance of an organisation and its strategic goals (Kagioglou, et al. 2001:87) and
results in a better indication of an organisation’s performance than merely financial
measures (Hepworth, 1998:561, cited in Luu, et al. 2008:375).
The BSC framework is the most actively used worldwide measure and is frequently
applied as a powerful communication tool for performance measurement (Yang, et al.
2010:274). However, it has major limitations in target-setting and can provide a
consolidated metric of performance only when combined with other methods (Tsolas,
2011). It is difficult and time-consuming to implement and requires a high-ranking
champion and adequate funding to meet the challenges of change in order to implement
the framework. However, it does ignore the market perspective, and its absence of any
34
mention of suppliers and disregard for the human element are its major weakness (Luu, et
al. 2008:375).
According to Neely and Bourne (2000:1-6), the majority of BSC implementation
initiatives in firms fail because of difficulties during the implementation phase which
include frameworks that are poorly designed and difficult to implement. This applies to the
four perspectives of the BSC that have been considered insufficient, such as competition
and employees, as well as application of specific perspectives, such as project and supplier
for construction. The BSC is considered to be simpler, clearer and more comprehensive
than the EFQM excellence models, and as Robinson, et al. (2005:18) argue, the BSC is
less a structured or holistic tool and the framework is more widely applied in larger
organisations. Although BSC is superior to the EFQM excellence model in assessing
strategic measures, both models have a major limitation in target-setting. In particular, in
the BSC, targets are not addressed, whereas in the EFQM excellence model, targets are not
specific (Tsolas, 2011).
Kagioglou et al. (2001) proposed the Performance Measurement Process Framework
(PMPF) as an extension of the BSC model of Kaplan and Norton (1992), but with the
addition of project and supplier perspectives that can be tailored to construction industry
needs. The framework comprises three components:
1. The inputs, which details that any performance management system need to have
strategy as the main input so that any results coming out of the system can be used
to evaluate the extent to which the organisation has met its strategic goals
(Kagioglou, et al. 2001:90).
2. The process, which takes the strategy as an input, deploys it so that it can derive a
number of organizational goals or objectives, develop measures which are
effectively activities and are directly related to strategy, add value to the strategy
by examining its validity and implementation and deliver the performance results
to the organisation or its shareholders and customers (Kagioglou, et al. 2001:90)
3. The output, the results give an indication of the extent to which an organisation has
achieved its goals (Kagioglou, et al. 2001:91).
35
The PMPF model integrates the main themes of performance management in a simple
performance measurement relationship matrix such as arrangement (Kagioglou, et al.
2001:85).
2.2.4 The South African construction engineering model (SACEM)
The SA Construction Model (SACEM) is a business performance assessment tool
developed to evaluate the overall performance of contractors in addressing many
challenges faced by the contractors (Dlungwana and Rwelamila 2005:2-3). It embraces the
principles of strong leadership, a long-term approach, continuous improvement, client
focus, people management and results orientation. The model uses a questionnaire-based
scoring technique to evaluate the contractor’s level of development and the extent to which
best practices are embraced (Dlungwana and Rwelamila 2005:2-3).
SACEM provides an objective assessment of the contractor’s strengths and areas for
improvement. More than just an assessment tool, it contributes to the national strategy for
developing the construction industry by facilitating the rapid adoption of the best practice
that ensures improvement in contractors’ productivity, competitiveness and strategic
management of social and environmental issues. The management of socio-environmental
performance should be achieved in parallel to profitability and growth performance
(Dlungwana and Rwelamila, 2005:3).
The key benefits of SACEM as identified by (Dlungwana, et al. 2002:7) include:
Standard, structured tool to assist contractors assess and improve performance
through higher productivity, quality and effectiveness.
A useful performance benchmarking tool for contractors.
Risk management tool for the construction clients. Contractors’ risk profiles will be
easily identifiable and managed appropriately.
Tendering costs can be reduced for both the clients and contractors if SACEM is
used as a prequalification system.

36
Results from using SACEM can add value for money to projects and therefore
satisfaction for clients, taxpayers and end-users.
Other than the SACEM, there are many models that have been developed in South Africa,
as a combination of the Expanded Public Works Programmes (EPWP) and ECDP models,
but they are being applied across all grades and so undermine the objectives of contractor
development and job creation (Greyling, 2012:23). Rather, programmes should be clearly
designed to achieve a clear objective, whether it is workforce development, job creation,
development of emerging contractors, enterprise development or improving the
performance of established contractors (Greyling, 2012:23; Gasa, 2012:58). Against this
argument it would be inappropriate to apply the SACEM model to CIDB Grade 2
contractors without some modification.
Having discussed the theories that have a bearing on this study the next section presents
the literature review.
2.3 DEFINING PERFORMANCE
Despite studies that have reviewed the performance construct of construction businesses
(e.g. Windapo and Oladapo, 2012; Ladzani, Smith and Pretorius, 2012), the subject of
performance has continued to challenge management commentators and practitioners for
many years (Gibson and Casser, 2005:208). Performance has been used in some cases to
describe concepts such as efficiency, effectiveness, improvement, growth and success and
the terms have been used interchangeably (Akbaba, 2012:180; Reijonen and Komppula,
2007:690). According to Venkatraman and Ramanujam (1986:801), the treatment of
performance in research settings is perhaps one of the most problematic issues confronting
the academic researcher, because what performance means or what are appropriate
operational definitions are not always clear (Gibson and Casser, 2005:208). As a result of
varying perceptions on performance, the concept varies amongst organisations and thus
leads to disagreements about whether an organisation is performing or not.
As suggested by Murphy, et al. (1996:15), definitions of successful performance and the
variables used to measure performance vary widely. Performance may have a different set
of meanings for small as opposed to large businesses and consequently it may be
37
inappropriate to apply similar measures to its assessment (Keats and Bracker, 1988:53).
Performance can therefore take on different meaning depending on the context in which it
is being used (Idrus and Sodangi, 2010:34), but a general understanding in the construction
studies is that it is a multifaceted phenomenon and includes unit cost, construction and
delivery speeds, and the level of client satisfaction (Ling, 2004:129). The importance of
identifying ECs’ performance has been apparent in South Africa over recent years, and
could be communicated to the wider market, i.e., to be understood and interpreted by
policymakers, community, potential investors, employees and customers (Kagioglou,
2001:86).
This section pays attention to business performance and project performance since the
effectiveness of the construction business is based on the two. It is important to show that
one is either measuring business performance or project performance, especially in a study
involving performance measurement (Tangen, 2005:40). However, both tend to achieve
the same objective (Tangen, 2005; Venkatraman and Ramanujam, 1986), and seek
information on effectiveness (doing the right thing) and efficiency (doing the right thing
right) (Idrus and Sodangi, 2010:34). According to Peters and Waterman (1982), an
organisation is effective if it is able to manage ambiguity, is flexible, customer-oriented,
productive, value-driven and structurally lean in form, and if it knows its major area of
business and greatly empowers its people. As support for this alternative, SBEs’ function
is primarily focused on overall business success, which is a combination of retention of
markets in the long term and with obtaining income, through project execution to fuel the
operations and growth of the business (Sillars, 2010:10).
Kagioglou (2001:88) and Ward, et al. (1991) describe how when assessing the success or
failure of construction projects a common approach is to evaluate performance on the
extent to which client objectives like cost, time and quality were achieved. These three
indicators of performance used in the UK construction industry provide an indication as to
the success or failure of a project but do not, in isolation, provide a balanced view of the
business’s performance, as usually they are implemented at the end of the project and are
classified as lagging rather than leading indicators (Kagioglou, 2001:88).
As indicated above, performance is difficult to define, describe or measure systematically
(Akbaba, 2012:180), particularly whether an EC is successfully performing or failing as
the definition and the concept of success remain vague among stakeholders. However, for
38
those involved in the construction business, performance may be thought of as the
achievement of some predetermined goals while the general public may have different
views of performance, which are commonly based on user satisfaction. There are a
multitude of definitions in literature, however, the following performance definitions
guided this study:
A subset of organisational effectiveness that covers operational and financial
outcomes (Santos and Brito, 2012:98).
Performance is a measure that reveals the operational efficiency and growth of the
business (Alarape, 2007).
The act of performing, of doing something successfully, using knowledge as
distinguished from merely possessing it (Herrington and Wood, 2004).
The ability of an object to produce results in a dimension determined a priori, in
relation to a target. This performance has traditionally been measured in financial
terms (Laitinen, 2002).
The ability of small businesses to contribute to job and wealth creation through
business start-up, survival and growth (Sandberg, et al. 2002).
In construction traditionally, performance is approached in two ways (Kagioglou,
2001): In relation to the product as a facility (prime assessment of construction
projects in terms of success or failure), and in relation to the creation of the product
as a process.
Liu and Walker (1998) note that, in construction, performance is evaluated by
stakeholders’ value judgments and is thus framed by their values, experience, and
expectations rather than performance factor targets alone.
The three specific areas of business outcomes: (a) financial performance (profits,
returns on assets, return on investment etc.); (b) product market performance (sales,
market share); and (c) shareholder return (total), economic value added
(Venkatraman and Ramanujam 1986).
39
According to de Wit (1998), the project is considered an overall success if it attains
the technical performance specifications and/or mission to be performed, and if
there is a high level of satisfaction concerning the project outcome among: key
people in the parent organisation, key people in the project team and key users or
clientele of the project effort.
While the above definitions are important in guiding this study, they lack unique
characteristics of the underlying domain upon which performance construct could be
understood within the EC environment. Based on the above definitions, in this study,
where the focus under consideration is on ECs, performance is regarded as a measurement
or indicator that reveals the overall business goals, that is, what the business wants to
achieve or the goals it has set. This definition incorporates both quantitative and qualitative
capacity of ECs, including meeting schedule requirements of the project, meeting
functional requirements of the project, meeting client satisfaction, building quality and
meeting health and safety standards.
2.4 MEASURING PERFORMANCE IN CONSTRUCTION BUSINESS
Based on the variety of definitions of performance construct discussed in the previous
section, there is no common understanding upon which performance is measured. Within
South Africa context there is no common scale that has been developed to measure the
performance of ECs, yet the measurement of performance of ECs is fundamental to
business executives planning and control. It has however received considerable attention
from both academicians and practitioners (Tsolas, 2011), albeit complicated by lack of
obvious measures ECs and other parties adopt and that would be most relevant to the
business as they change over time (Lam and Wong, 2009; Jin, et al. 2007; Bassioni, et al.
2005; Cox, et al. 2003).
To guide this study, the performance measurement definitions of Yang, et al. (2010) and
Neely and Adams (2002) are adopted. The former define performance measurement as the
process whereby an organisation establishes the parameters within which programmes,
investments and acquisitions are reaching the desired results, while the latter regard
performance measurement as the process of quantifying the efficiency and effectiveness of
past actions as a parameter used to quantify their efficiency and effectiveness.

40
The most commonly accepted performance measures are those that can be physically
measured in monetary terms (quantitative measures), units, or work hours (Cox, et al.
2003:143; Kagioglou, et al. 2001). These are important as contractors look first to the
areas which show a change in the amount of revenue generated. In construction,
performance measurement has been predominantly focused on project performance in
form of time, cost and quality (Pheng and Chuan 2006:25; Bassioni, et al. 2005), however,
in recent years, indicators have extended to include client satisfaction, business
performance, health, safety, government and environment (Langston 2012; Yang, et al.
2010; Yu, et al. 2007; Cheung, et al. 2004; Kagioglou, et al. 2001:89).
The advantages of quantitative measures include simplicity, being easy to gather and apply
while not placing a heavy burden on field personnel. On the other hand, qualitative
performance indicators are not commonly accepted as reliable tools due to their perceived
difficulty and inability to be measured (Cox, et al. 2003:144). Unlike quantitative
indicators, qualitative indicators do not appear in the estimating or costing system utilised
by the majority of construction businesses. In this study qualitative measurements were
considered more suitable than quantitative measurements because it focuses on SBEs’
perceptions of performance determinants. Yang, et al. (2010) undertook a critical literature
review of performance measurement in the construction industry and classified
performance measurement into three levels: project, business, and stakeholder.
2.4.1 Project performance
Project management provides services to a client’s projects and in return acquires income
which fuels the growth of the business and its assets. The project receives direction and
support from executive management and acquires resources from the asset management
portion of the organisation (Sillars, 2010:10). Traditionally, the success of a project hinges
on the performance of project managers, with emphasis on the achievement of time, cost
and quality targets (Pheng and Chuan, 2006:25). According to Rwelamila and Asalan
(2010:1190), the common causes of project failure include lack of clear links between its
and the business’s key strategic priorities, such as agreed measures of success; lack of
clear senior management and leadership; lack of effective engagement with stakeholders;
lack of skills and proven approach to project management and risk management; too little
attention to breaking development and implementation into manageable steps; evaluation

41
of proposals driven by initial price rather than long term value for money; lack of
understanding of, and contact with the supply industry at senior levels in the business; and
lack of effective project team integration between clients, the supplier team and the supply
chain. As a result, the active involvement of senior managers of a performing organisation
can help project managers to successfully complete the project (Zwikael, 2008:498).
2.4.2 Business performance
The goal of any business and its ownership is to be successful at survival. In order to
achieve business goals the objectives of profitability, growth (in terms of market share)
and survival must be achieved. The exchange framework is important in modelling the
interaction between the business and its clients as the exchange relates to primacy of
successfully meeting the business’s goal (Pfeffer and Gerald 1978). According to
exchange theory, the source of the exchange for an organisation is its immediate clients,
from which it derives return and the market from which it obtains future clients. Business
success is defined from an individual enterprise’s point of view by reward (business
income) and the maintenance or gain of market position of the business to ensure
continued viability (retained market position). These relationships are shown in Figure 2.4
(below). Business success is connected to the relationship between the enterprise and its
clients. Markets are assemblies of clients and income is derived from clients through the
provision of project management services to clients (Sillars, 2010:10).
Figure 2.4: Causal relationship to business Success
Source: Adapted from Sillars (2010)
Organizational
Income
Organizational Success
Retained Market
Position

42
In the relationship in Figure 2.4, SBEs’ function is primarily focused on overall business
success, which is a combination of retention of markets in the long term and with
obtaining income through project execution to fuel the operations and growth of the
business (Sillars, 2010). Accordingly, SBEs provide strategic and management direction to
both business income and retained market position (Sillars, 2010).
2.4.3 Stakeholder performance
While time, cost and quality have been noted as three dominant performance evaluation
dimensions, Pheng and Chuan (2006) identified performance indicators related to the
owner, users, stakeholders and the general public, the groups of people who look at the
business performance from the macro viewpoint (Wang and Huang, 2006). In China,
public feedback helps to instil environmental awareness in the project team and this is
necessary to establish channels for the public to lodge their complaints. During project
delivery, the ability to control environmental disturbances and site safety effectively would
lead to higher public satisfaction for the project, which shows that when public satisfaction
is achieved, there would be reduced complaints and increased public recognition for the
project, thereby increasing owner’s satisfaction (Ling, et al. 2009).
However, in this thesis performance measurements used in construction business have
been discussed under the following headings.
Measuring cost / Budget performance
Cost performance is judged relative to an agreed budget (Langston 2012). For example,
project cost involves monitoring performance by comparing current costs accrued to the
budgeted costs in rand allocated for the work in place completed to date. The cost
reporting may be used to predict the success or failure of the overall construction effort
(Enshassi, Mohamed and Abushaban, 2009; Cox, et al. 2003). Completion close to budget
is usually preferable, and in some cases being well below budget is seen as an advantage,
although often not. Clients tend not to like surprises, so the final project cost should be the
result of prudent cost management processes and therefore, by definition, deliver an end-
result close to the agreed budget (Langston, 2012). Construction cost is measured in

43
financial terms and focus on the building rather than the land. The costs are determined on
common date which is undertaken using building price indices that reflect inflationary
change appropriate to the current level of construction intensity. The pricing takes into
account related construction items such as labour, material and plant.
Measuring time
Time performance refers to the duration for completing a project (Chan and Chan, 2004;
Cox, et al. 2003). On-Time completion serves as a holistic measurement of performance
according to scheduled duration (Cox, et al. 2003). Time on construction projects can be
measured in days, weeks or months, however, large projects take more time to construct
than small projects, and a reasonable KPI might be square metres of gross floor area
completed per month. This is an output measure describing production (Langston, 2012).
On-time milestone completion determines if construction is proceeding according to
schedule.
Measuring quality
Ling, et al. (2009) define quality as the output quality of the service rendered or work done
to technical and workmanship standards. It is the degree to which general conditions
promote meeting the project’s established requirements for materials and workmanship. In
other words, the contractor must ensure the project satisfies the needs for which it was
undertaken (Enshassi, et al. 2009; Mbachu and Nkado, 2007; Faridi and El-Sayegh, 2006).
The expectation is to receive what is specified, no more and no less, and often this is
judged in the detail of the finish and the workmanship applied.
Quality performance involves collection of issues such as identification of defects and
craftsmanship. The improvement of quality can reduce the resources and costs that must be
devoted to reworking, which when reduced increases profitability (Ling, et al. 2009). In
construction, it is important not only to control the quality of the product but also to
measure and control the various processes involved in the project if one is to satisfactorily
achieve the end project goals (Haponava and Al-Jibouri, 2010). Quality measures
44
identified in literature include: meeting quality standards, conformance to specifications,
customer satisfaction, and community satisfaction.
Measuring profitability
The contractor’s satisfaction is measured by their profitability (CIDB, 2013). The
individual indicators underlying the performance of construction business are characterised
by company financial soundness, which is related to profitability, financial autonomy,
liquidity and value added (Horta, et al. 2012). Business profitability is one performance
dimension that has frequently recurred in literature. Profit is a basic goal for running a
business and it is derived from the performance of the project. Some of the commonly
used profitability measures include:
Return on Sales = Net Marketing contribution / Sales Revenues x 100%
Return on investment = Net Marketing Contribution / by Expenses x 100%
Return on assets = the profit margin and the asset turnover.
Measuring sales growth
There is a general belief amongst marketing and sales executives, as well as general
managers and SBEs, that if more volume of products could be sold to the customer more
market share and more sales revenues would be achieved, and the business would increase
profits (Best, 2005). In many instances this has been the case, however, firms need to be
careful when using price to achieve this objective (Best, 2005). The objective of a pricing
strategy should be to improve profits, to determine what price produces a combination of
volume and margin that increases the business’s total contribution. When the total
contribution produced by a pricing strategy is lower, overall profits would also be lower
because fixed costs are deducted from the total contribution. There is too much focus on
low prices at the tender stage by ECs in South Africa (CIDB, 2102).
Total contribution = volume (units) x margin (per unit)
Of all the financial indicators, sales growth is likely to be free of most potential bias.
45
Measuring market share
Market share is the most common marketing strategy to grow revenue and profits and is
the percentage of current market demand obtained by a business (Best, 2005). According
to Kotler and Keller (2006), a useful way to analyse market share movements is in terms of
four components indicated below:
Overall market share = Customer penetration x customer loyalty x customer
selectivity x price selectivity.
Where:
Customer penetration: percentage of all customers who buy from the company.
Customer loyalty: purchases from the company by its customers expressed as a
percentage of their total purchases from all suppliers of the same products.
Customer selectivity: size of the average customer purchase from the company
expressed as a percentage of the size of the average customer purchase from an
average company.
Price selectivity: average price charged by the company expressed as a percentage
of the average price charged by all companies.
Measuring productivity
Productivity enables an organisation to be competitive, achieve set goals, meet stakeholder
value propositions and maintain strategic and financial health (Mbachu and Durdyev,
2011). According to Cox, et al. (2003), a typical way to measure productivity includes
units per man hour, rand per unit, resource management (the amount of materials, tools
and equipment expended during the construction operational activities), quality control,
rework and% complete.

46
Measuring client satisfaction
Construction clients demand the timely completion of projects without delay or additional
cost (Greyling, 2012, Akinsiku and Akinsulire, 2012; Mbachu and Nkado, 2007). The
level of satisfaction of a client with a contractor’s performance on a project is an important
indicator (or measure) of its ability to execute and complete within the required
expectations of the client (Akinsiku and Akinsulire, 2012; Mbachu and Nkado, 2007; Jin,
et al. 2007; Cox, et al. 2003). According to Bassioni, et al. (2004), what remains in the
mind of participants after project completion is not so much financial success or early
completion, but memories of harmony, goodwill and trust, or, conversely, arguments,
distrust and conflict. Motete, et al. (2003) examined the causes of client dissatisfaction in
South Africa building industry and found that conflict, poor workmanship and
incompetence of contractors were among the factors that negatively impacted on project
performance. If clients’ stated needs or developmental requirements could sufficiently
address the real needs and objectives for investment, delivering the project within time,
quality and cost targets could translate to satisfaction (Mbachu and Nkado, 2001).
Measuring community satisfaction
Another way of evaluating performance relates to the general public, the groups of people,
who look at project performance from the macro viewpoint (Enshassi, et al. 2009; Pheng
and Chuan, 2006). In South Africa it is important for the public to give feedback as this
helps to instil environmental awareness in the project and provide channels for them to
lodge complaints.
Measuring contractual disputes
Construction delays result in cost overruns and poor quality, which in turn lead to
contractual disputes. In South Africa, most claims are related to the time of the project
delivery. The ability to manage change without unnecessary claims is critical in the routine
assessment of subcontractors’ performance (Mbachu, 2008). The absence of claims or
contractual disputes is a fair indicator of project success (Chan and Chan, 2004).
47
Measuring employee job satisfaction
While job satisfaction is regarded as a soft measure it has been benchmarked with a
company’s performance (Thwala, et al. 2012; Beatham, et al. 2004). Job satisfaction
measures include the extent to which employees in construction gain enjoyment of
satisfaction from their efforts at work (Lai and Lam, 2010). In a way, the satisfaction of
interpersonal relations among team members comes into play to determine project
performance. Happy employees are productive while unhappy ones are not, hence, success
of a construction business depends on the level of satisfaction of workforce (Lisa and
Judge, 2004).
Measuring health and safety
Safety may be used for performance reporting by measuring the change in the number of
accidents or safety-related problems on the job site (Jin, et al. 2007), recordable incident
rate (RIR), and lost workday case incident rate (LWCIR) (Costa and Formoso, 2003).
Measuring environmental factors
The issue of environmental performance measure was highlighted by Chan and Chan
(2004) and it relates to waste management and public nuisance.
Measuring critical incidents
Critical incident technique (CIT) is a qualitative interview procedure which facilitates the
investigation of significant occurrences (events, incidents, processes or issues) identified
by the respondent, the way they are managed and the outcomes in terms of perceived
effects (Chell, 1998). The objective is to gain understanding of the incident from the
perspective of the respondent, taking into account cognitive, affective and behavioural
elements. The key criterion for CIT inclusion is that, from the executive’s perspective, the
incidents that led to high (or low) business performance are presented. The CIT is
frequently used to collect data on observations previously made which are reported from

48
memory. This is usually satisfactory when the incidents reported are recent and the
observers were motivated to make detailed observations and evaluations at the time they
occurred (Flanagan, 1954).
CIT has been deemed appropriate by Keaveney (1995) in a study of customers switching
behaviour in the service industries and the technique is supported in the service research
literature (Matos, et al. 2009; Zeithaml, et al. 2006; Gremler, 2004; Holloway and Beatty,
2003; Bansal and Voyer, 2000). The technique has been applied successfully in hotels and
restaurants (Bitner, et al. 1994), airlines (Edvardsson, 1992), retailing (Bell, Gilbert and
Lockwood, 1997; Kelly, Hoffman and Davis, 1993), banking (Mattsson and Helmersson,
2005), and travel and tourism (Serenko and Stach, 2009). It has also been successfully
applied in marketing to analyse the content of advertising and retail store image
(Kassarjian, 1977; Bitner, et al. 1994). Both the reliability and validity of the technique
have been demonstrated (White and Locke, 1981).
In this study, the CIT was utilised when collecting qualitative data relating to incidents
encountered by SBEs. These would be financial issues, manpower factors, material,
machinery and equipment, quality issues, project delay factors, legal and environmental
factors and strategic planning. The CIT developed by Flanagan (1954) has been identified
as a qualitative technique that could be appropriate to assess the perceptions of SBEs on
the determinants of ECs’ performance. Relying on the executive’s experience is
appropriate because the content of enquiry is such that complete information cannot be
expected from representative survey respondents. Business executives who have
succeeded (or failed) speak of their attitudes and behaviours time and again. They provide
many factual incidents that could be used as a basis for planning research on small
contractors’ success (Gremler, 2004).
2.5 THE DETERMINANTS OF ECS’ PERFORMANCE
In this section, the perceived factors that determine the performance of ECs are examined.
Although there is an abundance of literature examining EC performance in South Africa
construction industry (e.g., Gasa, 2012; Greyling, 2012; Ladzani, et al. 2012; Baloyi and
Bekker, 2011; Emuze, 2011; Dlungwana, Kandie and Ngassam, 2009; Thwala and Mvubu,
2009) there is no study that has looked at perceptions of SBEs on the determinants of ECs’
49
performance specifically registered with CIDB in Grade 2. Hence, there is no common
understanding on the performance factors of these contractors. Based on the survey of
literature, a combination of performance determinants for this study has been classified as
follows:
2.5.1 Financial factors
Access to finance has been cited frequently in literature as a critical constraint for small
construction business performance (e.g., Ali et al, 2010; Boyeens 2011; Nurbani, et al.
2011; Otim et al., 2011). Funding and guarantees are not easily available from South
Africa banks (Booyens 2011 ), and as Thwala and Mvubu, (2009) claim, lack of access to
finance both during pre-construction disqualifies ECs from meeting guarantee and
performance bond requirements, and during construction leads to cash flow problems,
incomplete work and liquidation. Banks are reluctant to deal with ECs unless exorbitant
interest rates are paid and through compulsory business management services (Thwala and
Mvubu, 2009).
Small businesses do not have a record of accomplishment or any form of guarantee
(Ligthelm, 2011; Olawale and Garwe, 2010; CIDB 2010) and ECs are no exception. This
is supported by a study by the FinMark Trust (2006) in South Africa, which found only
2% of ECs were able to access bank loans. Foxcroft, et al. (2002) confirmed that 75% of
applications for bank credit by new ECs in South Africa were rejected, which suggests
ECs face collateral discrimination from financial institutions, and without finance ECs
may not survive or grow (Olawale and Garwe, 2010).
The CIDB (2013) shows 30% of the respondents cited the inadequacy of business’s access
to credit as a financial constraint to performance. However, a study of the construction
industry conducted by the Bureau for Economic Research at the University of Stellenbosch
(2012) found that the percentage of respondents reporting inadequate access to credit as a
constraint to their success had declined moderately from 34% to 32% in 2012.
The effects of credit on enterprise performance, including ECs, are contradictory and
remains unclear (Okpara and Wynn, 2007; Masakure, et al. 2009). Despite the theoretical
case for access to finance as a barrier to business performance, and many survey’s

50
respondents reporting access to finance as a constraint, there are mixed reports in
literature. Additional capital may not be necessary and may be overcome through
creativity and initiative. Kallon (1990) supports the view, confirming that the amount of
capital needed to start a business is significantly negative when related to the rate of
growth for the business, concluding that access to commercial credit did not contribute to
small business performance in any way, and if it did the relationship would be negative.
Credit can negatively affect small business profitability and survival if businesses are
captive borrowers or operate under poor economic conditions and high interest rates
(Masakure, et al. 2009; Atieno, 2006). Similarly, Estrin and Mickiewicz (2010:5-6) doubt
whether financial constraints are binding on start-ups, and regard it as more important in
expansion of existing businesses than in the creation of new ones. Start-up requirements
are relatively small in developing countries (Lingelbach, et al. 2005:3-5) and informal
sources of funding (such as own savings and family sources) have been identified as
important in the literature. Formal bank finance for start-ups seems to be largely limited to
low-risk cases and where collateral is provided (Naude, et al. 2008). The discussion
suggests that formal credit has no clear impact on ECs’ performance relative to cheaper
informal credit (Akoten, et al. 2006). Therefore, if credit is accessible and reasonably
priced, businesses can address their liquidity constraints, in turn aiding profitability
(Babajide and Joseph, 2011).
2.5.1.1 Cash flow management
Cash flow management is one critical issue linked to ECs’ performance as it creates
inadequate cash situation for the business. Poor cash flow management results in
inadequate working capital and undermines the sustainability of the construction business.
If there is lack of cash to support a business’s day-to-day activities this could lead to
contractors’ failure. According to Greyling (2012), weak financial and cash flow
management have been observed amongst ECs, affecting business ability to work
successfully. Poor cash flow management has been cited in other studies as one of the
major causes of failure in small businesses (Greyling, 2012). There is an agreement with
Truong-Van Luu (2008), whose study of the construction industry in Vietnam found better
management of receivable accounts and careful evaluation of the financial capacity of
51
owners were meaningful factors for measuring strategic performance. This indicates the
importance of developing a cash flow forecast that indicates the estimated money flowing
into and out of the business over a period of time.
2.5.1.2 Cost management
Financial and accounting skills help the contractor to make sound economic and financial
decisions that result in better project outcomes, including best use of financial and tax
advantages. However, there is a misperception in general that a contractor does not need
such skills as accountants and financial advisers could do the job, helping the contractors
make the best financial and commercial decisions (Chaplin, 2010). However, a study
conducted by Coolidge and Ilic (2009) in South Africa indicate that professional
bookkeepers or accountants are too expensive to hire, which indicates that contractors need
to acquire the basic skills and knowledge to guide them in financial and commercial
decisions and initiatives (Mbachu 2012).
Kaming, et al. (1997) studied the factors influencing construction time and cost overruns
on high rise projects in Indonesia and found that cost overruns were mainly caused by
inaccuracy of material take-off, increase in material costs and cost increase due to
environmental restrictions. In Ghana, Frimpong, et al. (2003) found that the most
important cost and time delay factors for the contractors were late monthly payments from
clients, while in Nigeria, Dlakwa and Culpin (1990) found that cost overruns were a result
of fluctuations in material, labour and plant cost, construction delays and inadequate pre-
planning.
2.5.1.3 Security of payment
According to literature, payment problems experienced by ECs are a result of rework
relative to the faults in project design errors, formwork errors; service errors, mechanical
work faults, electrical works faults, finishing works faults, and insufficient documentation
prohibitive to ECs profitability and growth (Emuze, 2011). During construction,
contractors often engage in rework due to unacceptable quality (Alinaitwe, 2008), which
would lead to late payments. The costs associated with rework are as high as 12% of the
52
total project costs and require as much as 11% of the total project working hours (Love, et
al. 1999). Late payment of completed work, however, results in contractors halting work
unless payment for completed work had been processed after the agreed date (Baloyi and
Bekker, 2011).
In South Africa, the enormous scale of the payment problem was documented by a series
of media stories during early 2009. As a result, recent requirements from the SA National
Treasury were for all government departments to make payment to suppliers within 30
days of the receipt of all correct documentation. The Gauteng Provincial Government
(GPG) policy incorporates this 30-day provision and further stipulates shorter payment
timeframes for ECs (Marx, 2012). When clients delay or withhold payments this improves
their own financial position, while that of the ECs and project performance are affected.
The issue of ECs suffering from payment delays is common to many countries (UK-
Odeyinka and Kaka, 2005; China – Wu, et al. 2011; Australia – Carmichael and Balatbat,
2010). However, Australia, New Zealand, Singapore and the UK have introduced
legislation to protect the rights of subcontractors and suppliers to receive payments,
irrespective of whether the main contractor has been paid (CIDB, 2013; MBSA Annual
Report 2013). In the USA a regulation requires general contractors to pay subcontractors
after completion of the project, even if they have not been paid by their clients (Touran, et
al. 2004). Such legislation allows subcontractors and suppliers to claim interest on late
payments, suspend work, claim a right of lien and render invalid any pay if paid clauses
are in construction contracts (CIDB, 2013, Ofori 2009).
2.5.1.4 Performance guarantee
Performance guarantees are issued by financial institutions such as a bank, and provide for
payment of money by the financial institution to the employer should the contractor fail to
complete the contract, for example, if in breach of contract, the contract is cancelled or the
contractor becomes bankrupt. Most construction work contracts require performance
guarantees that pay the employer in such cases (CIDB 2013). A performance guarantee is a
method of protecting the employer from the risks of overpayment, defective work and
contractor insolvency, and as an incentive for contractor performance. In other cases,
employers retain a percentage of each progress payment to contractors who in turn

53
withhold a similar amount from subcontractors until certified completion of the project.
The retention amount typically ranges from 5% to 10% of the value of the work done
(CIDB 2013).
2.5.1.5 Tender pricing and competition
The high competition in the Gauteng construction industry results in many contractors
pricing tenders low to win work then seeking ways to make profits from continuing
projects by squeezing subcontractors and employees to the lowest possible bid price
(CIDB, 2012; Ofori, 2009). As a result of intensive tendering competition during year
2010, profit margins remained under pressure and a net 67% of surveyed respondents
indicated that the growth in the profitability of their businesses worsened during that year
(CIDB, 2010). The low margins resulted in poor quality work, delays, disputes and losses
on projects. CIDB (2011) state that between 2007 and 2009, more than 1,400 construction
enterprises failed because of increased competition in contracting business, resulting in
lower profit margins and poorer quality (CIDB 2013).
2.5.1.6 Record keeping
Poor record keeping has been cited in literature as an obstacle to ECs’ performance, often
a result of lack of basic business management skills (Thwala and Phaladi, 2009). Where a
business has poor record keeping the business loses track of its daily transactions and
cannot account for its expenses or profits at the end of the trading period. On the other
hand, good recordkeeping provides a business with accurate information on which to base
decisions, for example projecting sales and purchases and determining break even points.
In many cases, poor record keeping has led to the closure of some ECs, thereby making it a
significant issue for small business performance. ECs tend to rely on hired accountants,
legislative and regulatory non-compliance with deadlines and submissions (VAT) and poor
financial planning (ABC). The effect is that the SBEs remain uninformed on financial
position of the business, hence problems with VAT collection and tax, poor performance,
penalties compromised UIF, PAYE, Skills Development Levy, and RSC not being paid,
resulting in business closure.

54
2.5.1.7 The case of Hong Kong
Most of the Hong Kong EC businesses lack the resources and financial capacity to
compete with the main Chinese contractors, who have stronger organisational resources
and often government backing. There is no intervention and minimal assistance or
protection measures by the government, which is not proactively offering direct support to
domestic contractors. As a result, indigenous industry stakeholders have pleaded for
government’s leadership and assistance for ECs (Baldwin and Chack-Fan 2008). The
reasoning behind this is that if the small contractors could gain direct support from the
government that would revive the local industry. Without government support, small
contractors would have to try harder to survive in the industry (Baldwin and Chack-Fan,
2008).
2.5.2 Manpower factors
The key factors that have been widely reported in literature having an impact on the
performance of ECs include shortages of skills and knowledge among construction
workers, lack of training in the industry, low productivity and poor team relationships.
2.5.2.1 Skills and knowledge availability
Egbu (1999) submits that there is a distinction between skills and knowledge, with skills
being the practical ability or competencies a worker gains from applying the knowledge
over time in a hands-on work setting (Egbu, 1999). On the other hand, Mbachu (2012)
noted that knowledge consists of the ideas, wisdom and information workers acquire
through experience, theory and practice, the acquisition of which gives them an ability to
understand. Accordingly, a skills shortage could relate to contractors’ experience and
supervision which have a great impact on project delivery (Mbachu, 2012; Otim, et al.
2011). Experience can be a source of sustainable competitive advantage and lead to better
performance for the business. According to Mbachu (2012), though emphasis is on the
skills and knowledge that ensure successful project delivery, such skills and knowledge
could enable the contractor run a successful business, remain competitive and achieve
55
sustained growth. There is a shortage of the demanded skills in the construction industry,
not only at artisan but also at specialised levels (van Wyk, et al. 2011).
The most important skills required in construction business include technical competency
to ensure quality and effectiveness of project delivery (Eom, et al. 2008). However,
Chaplin (2010) argues that the most technically qualified contractors do not necessarily
win the most work, excel in project delivery or run successful businesses. ECs need a
balanced range of competencies that include marketing, sales, negotiation and business
skills. Negotiation skills are important because contracts have terms and conditions that
could pose risks and cash flow problems to the contractor’s overall ability to deliver a
project successfully and profitably (Mbachu, 2012). According to Chaplin (2010),
negotiation skills enable the contractor to achieve favourable bargains that reduce risks and
imminent cash flow problems on a project. Through negotiations, a contractor could avoid
conflicts and disputes which are costly and time-consuming, adjudications, arbitrations and
litigations (Mbachu, 2012).
ECs require skilled and stable labour force to sustain growth (Atkinson, et al. 2012).
Relevant skills ensure that contractors are able to meet clients’ expectations, whilst
improving the quality of work and opportunity to win more contracts (CIDB, 2009). In
South Africa it is difficult and expensive to hire skilled labour (Mahadea, 2008), with
labour only able to be hired at a cost and within the confines of the labour regulations,
such as employment and minimum wage regulations. There is a mismatch between skills
supplied through the higher education system and those required by the construction
industry (Amaratunga, et al. 2011:37), consequently, the demands on human capital, in
terms of education, training and experience, act as barriers to EC performance.
In South Africa, contractors having a CIDB contractor grading designation of 5 or higher
only engage supervisory and management staff in labour-intensive works that have
completed the skills programme. However, contractors having a CIDB contractor grading
designation of 1 to 4 have personally completed the skills programme for the NQF level 2
unit standards. All other site supervisory staff in the employ of ECs must have completed
the skills programme for the NQF level unit standard.

56
2.5.2.2 Construction education and training authority (CETA)
The Construction Education and Training Authority (CETA) was established in terms of
the Skills Development Act (No. 97 of 1998), the functions and objectives of which
include determining the education and training needs of the construction industry within
the framework of the National Skills Development Strategy. It achieves these primarily
through the development and maintenance of Industry Skills Plan with the active
participation of all industry stakeholders. It influences the course of training and skills
development by ensuring that all training reflects current sectorial needs and requirements
of the construction sector. Thus, the Department of Public Works, the CIDB and CETA
have very important roles to play in creating an enabling environment for reconstruction,
growth and development in the construction industry (van Wyk, et al. 2011). However,
CETA does not carry out training but rather accredits and monitors training provided by
private accredited training providers.
2.5.2.3 Competency assessment scheme
The objective of Competency Assessment is to enable contractors in Grades 1 to 5 to seek
recognition for their skills and prove a measure of assurance to clients that they can
successfully undertake their work (CIDB, 2009). Competency assessments are an
important tool to encourage businesses to have the diversity of skills that are required to
succeed, whether technical, entrepreneurial or managerial (CIDB, 2009). The board
proposed minimal competency levels, starting with some basic required skills for
contractors, which with competency would reflect on the CIDB Register of contractors as
a resource to clients. Contractors registered in Grades 7 and upwards are required by the
Register of Contractors to have a certain number and types of professionals in their
employment to ensure competency and quality. This requirement does not exist in the
lower Grades, 5 to 1 (CIDB, 2012).
2.5.2.4 Labour productivity
Labour productivity enables a business to be competitive, achieve set goals, meet
stakeholder value propositions and maintain strategic and financial health (Mbachu and

57
Durdyev, 2011). In South Africa, labour productivity has been disappointing and is
limiting the ECs ability to optimal performance. A study by van Wyk (2011) argues that
productivity is low because skills are not developed in the construction industry, nor
employment conditions that show respect for people applied (Atkinson, et al. 2012). The
employment of casual labour has become the norm in the industry, along with reduced
wages, working conditions, remuneration, formal skills development or training and poor
quality of life. However, the establishment of the CIDB, CETA, BBBEE, Preferential
Procurement Policy Framework and other bodies may bring changes to the construction
industry.
One aspect that emerged from the Egan Report was the ‘People Performance Indicators’
(PPI), developed by the Rethinking Construction’s Respect for People Working Group as a
direct response to the realisation that to achieve the targets set out in the Egan Report,
improvements were required in how the industry treated its people. These indicators could
be considered leading ones and cover employee satisfaction, staff turnover, sickness
absence, safety, investors in people, working hours, pay, training, diversity and travelling
time (Beatham et al., 2004). These can be used to benchmark ECs’ performance within the
construction industry and across different industries.
A study by Enshassis, et al. (2007) in the Gaza Strip indicated five important factors that
impact negatively on labour productivity as material shortages, lack of experience of
labour, lack of labour surveillance and alteration of drawings or specification during
execution. This agrees with Ameh and Odusami (2002), who identified low wages, lack of
materials and unfriendly working atmosphere as having a major impact on productivity in
Nigeria. Yates and Guhathakurta (1993) looked at international labour productivity
differences and concluded that labour quality, motivation and management were the main
issues. Labour quality, for example, may include union agreements, restrictive work
practises, absenteeism, turnover, delays, availability, level of skilled artisans, use of
equipment and weather (Langston, 2012). Using quantitative analysis, Ahadzie, et al.
(2011) reported evidence of low morale and motivation of craftsmen, poor planning and
supervision as some of the important factors that affect construction performance in
Ghana. Disruption is also correlated with poor management and leads to low productivity
(Enshassi, et al. 2007).

58
2.5.2.5 Project team relationship
The construction industry involves team relationships that form and disband on a regular
basis (Langston, 2012). A project team is a group whose members are concerned primarily
with using the parent business’s resources to create its result (Greenberg and Baron, 2000).
In a large project, with group dynamics and organisation learning, project teams often get
stuck in defensive routines that inhibit effective learning and remain so unless these
dysfunctional behaviours are changed (Pheng and Chuan, 2006). For this reason,
successful project completion depends to a large extent upon members being able to work
together effectively as a project team. When group dysfunctional behaviours prevail,
schedules slip, costs overrun, output quality diminishes, and in extreme cases the projects
fail (Pheng and Chuan, 2006).
Hanson, et al. (2003) examined causes of client dissatisfaction in South Africa
construction industry and found that conflict, poor workmanship and incompetence of
contractors were among the factors which negatively impact on project performance. A
study by Larson (1992) indicates that adversarial relationships between clients and
contractors create a climate that puts success of the ECs at risk. Once adversarial relations
exist between the main contractors and subcontractors this undermines onsite productivity
and ultimately jeopardises the realisation of project objectives (Mbachu and Nkado, 2007;
Dlungwana, et al. 2002). If primary stakeholders do not work together effectively as a
project team the profitability and growth of ECs are affected.
2.5.3 Materials, equipment and machinery factors
A study by CIDB (2012) confirmed critical shortages and quality of materials in the
construction industry as a major factor in cost overruns. Marshalling tools, materials, plant
and equipment is a necessary operation that occupies a large amount of productive
working time, very broadly of the order of one third or more. Material management factors
have a significant impact on labour productivity and construction efficiency, and worker
time can be rendered idle or non-productive due to a lack of materials and tools at the right
time (Pheng and Chuan, 2006). In many cases, materials are not stored close enough to the
work area, leading to double handling.
59
Availability and reliability of materials and machinery affect the project at each stage of
construction in terms of time and cost overrun (Sambasivan and Soon, 2007). The three
most important resources for any construction project are manpower, materials and
machines (Enshassi, et al. 2009), so contractors need to ensure all these resources are
available throughout the project, whenever needed. Excessive waste of material during the
application process (e.g., unnecessarily thick plastering) should be avoided as this
translates into high production costs that hinder the profitability and growth of ECs.
ECs do not have good relationships with suppliers (Thwala and Mvubu, 2009). In a
functioning relationship, the material supplier provides credit to the contractor (30-90 day
term) and the contractor would pay on time. However in South Africa, ECs are required by
suppliers to pay cash upfront before taking delivery of the material. This kind of
relationship exists because ECs often fail to pay on time due to capacity or performance
constraints. Suppliers are reluctant to extent credit facility to ECs because of perceived
risks, for example:
Poor history of ECs’ failure to complete projects.
Systematic contractor payment processing delays, especially for construction works
commissioned by the public sector.
The potential for material losses due to theft, lack of appropriate storage and
mismanagement by ECs.
In the US, construction members formed a partnership or strategic alliance so as to share
each other’s resources, such that productivity could be improved and an adversarial
construction environment avoided (Yates and Guhathakurta, 1993). ECs formed direct
partnerships with financial institutions in order to face the competition from builders of
large houses with a strong financial background (Baldwin, et al. 2008).
2.5.3.1 Waste of material in construction
Rework is a quality failure attribute that contributes to waste and value losses in building
design and construction. Waste of material can be attributed to variation of order which
results in rework, wastages, defects, claims and disputes. Substantial waste in public

60
building construction is believed to be widespread and manifests in part through rework
(Oyewobi et al., 2011, Schraven, et al. 2011). It occurs during the operation and
maintenance stages and is undertaken by clients or end users following handover of the
facility at the expiry of the defects liability period (Alinaitwe, et al. 2013).
2.5.4 Project implementation
A review of literature indicates that project delay is a determinant of ECs’ performance
(Kikwasi, 2012; Lo, Fung and Tung, 2006; Pickavance, 2005). The demand of
construction clients for the timely delivery of construction projects and the susceptibility
of projects delays and cost overruns has attracted the attention of researchers around the
world to try and identify the immediate root cause of project delay (Akinsiku and
Akinsulire, 2012). According to Faridi and El-Sayegh’s (2006) research, project delays in
the United Arab Emirates were caused by preparation and approval of drawings,
inadequate early planning of the project and slowness of owner’s decision making
processes. In Saudi Arabia, Assaf and Al-Hejji (2006) discovered that only 30% of
construction projects were completed within the scheduled completion dates and the
average time overrun was between 10% and 30%.
All the parties involved in a construction project are responsible for their respective roles
at different stages, from the conceptual to the finish (Akinsiku and Akinsulire, 2012; Lam
and Wong 2009; Faridi and El-Sayegh, 2006). Delay takes place at a particular period
especially in the completion of an activity or project (Akinsiku and Akinsulire, 2012;
Faridi and El-Sayegh, 2006), and in order to minimise delays it is important to know the
causes.
In spite of efforts exerted on ECs’ performance in SA, many suffer from time delays and
cost overruns as well as dissatisfied clients (CIDB, 2012), hence ECs are criticised for
poor performance and ineffective delivery of desired goals (Mbachu and Nkado, 2007;
CIDB, 2012). The constraints and challenges that lead to such performance are attributed
to the complex and unique nature of projects awarded to ECs (Thwala and Phaladi, 2009).
Such projects are dynamic, iterative and involve continuous change throughout
development and execution (Haponava and Al-Jibouri, 2010). The effects of project delay
include loss of revenue due to slackened production and rentable space (Mukuka,
61
Aigbavboa and Thwala, 2013). To a consultant, delay means either the failure of progress
monitoring of contractors or faulty design, or both, and to a contractor it leads to penalties
and higher overhead costs (Faridi and El-Sayegh, 2006).
An examination of literature has shown major types of delay (Akinsiku and Akinsulire,
2012; Ali, et al. 2010; Ameh and Osegbo, 2011; Faridi and El-Sayegh 2006), namely: the
client’s responsible delay; contractors’ responsible delay, the consultants’ responsible
delay and the causes within the national or local government regulations. Any of these can
delay a construction project if not incorporated in the project planning, scheduling and
controlling programme. The delays from either category have been summed up by (Faridi
and El-Sayegy, 2006) to include availability of resources, manpower, materials and
machinery, as well as supervision and experience.
2.5.4.1 Delays within contractor’s category
The contractor makes decisions regarding resources, general management and
administrative set-up of the project and is in a position to make the project a success
(Otim, et al. 2011). Contractors execute most of the construction works and most
aggravating delays are caused by their poor performance (Chitkara, 2004). A survey by
Marx (2013) in South Africa indicates that employers caused delays at 20% of projects
while public corporations were responsible for delays in 18% of the projects. These were
related to planning issues such as budget restraints, final approvals and registration of
property in the employer’s name. This is in line with Akinsiku and Akinsulire (2012),
Otim, et al. (2011), Sambasivan and Soon (2007), who concluded that contractors’
responsible delays are caused by inability to proceed with the project diligently and
efficiently as a result of shortage of labour, failure to identify critical activities, unplanned
increase in the scope of work from the client, ignorance of appropriate planning techniques
and lack of understanding of operating procedures. Sambasivan and Soon, (2007) concur
that delays within this category relate to contractors’ poor site management and
supervision, operational problems by subcontractors, errors and omissions during
construction stages and inadequate contractor experience.

62
2.5.4.2 Delays within consultants’ category
These delays are related to contract management, preparation and approval of drawings,
quality assurance and waiting time for approval of test and inspection (Sambasivan and
Soon, 2007; Faridi and El-Sayegh, 2006). Owing to the nature of a construction project, in
South Africa, many changes in drawings, specifications and materials are experienced. A
change or variation to the drawings is given in a written instruction by the architect
requiring the contractor to alter the works in any of the instructed situations (Oladapo,
2007), and site instructions must be issued should there be any variation in the drawings.
However, Ssegawa, et al. (2002) argue that all the project participants cause variations as
they respond to changes in the financial, aesthetic, statutory and technological
requirements, meteorological, geological, geotechnical and other conditions. In the
Nigerian construction industry, common causes of variations have been identified as
change in specifications and scope, errors and omissions in contract documents,
discrepancies in contract documents, changes in government policies and legislation, and
natural occurrence (Oladapo, 2007). Thus, when changes occur, whoever initiates them
should be held responsible, otherwise this would reflect in the performance of contractors.
Incomplete and unclear design documents lead to mistakes in execution and inevitably
cause delays due to misunderstanding of the designs by the contractor (Sunday 2010;
Otim, et al. 2011). It is unusual to complete a project without experiencing changes to the
plans or the construction process itself (Sunday, 2010; Oladapo, 2007; Ssegawa, et al.
2002), and as Oladapo (2007) concurs, there would be changes to the scope, time, cost
and/or quality on most, if not all, construction projects. Thus, if teams involved in a project
do not gather sufficient data, or use competent personnel with knowledge and experience
to ensure complete designs, this would impact on the growth and profitability of
construction contractors.
2.5.4.3 Delays within the client’s involvement
The owner’s involvement in the construction project varies significantly, depending on the
project and contract type (Faridi and El-Sayegh, 2006). The client’s responsible delay
relates to those that result in variation and failure to provide site information. Otim, et al.
(2011) indicates that the client’s first task should be to analyse and collect all the relevant

63
information available in order to give the designer the clearest and broadest picture of the
requirements. Failure to provide appropriate information by the client would cause delays
and prevent contractors from starting on site after they have provided guarantees.
Other delays that emanate from the client are founded in the extension to time and
escalation of costs due to inflation, delay in the payment of interim certificates and
completed work, owner interference, changed orders and mistakes or discrepancies in
contract documents, inability of the client or representative to make quick decisions, late
handing over of site, delays in the supply of materials and inadequate planning and
unrealistic contract duration imposed by owner (Akinsiku and Akinsulire, 2012;
Sambasivan and Soon, 2007; Faridi and El-Sayegh, 2006).
2.5.4.4 Delays within local government regulations
The planning and scheduling of any construction project depends heavily on the local
government regulations (Faridi and El-Sayegh, 2006). On many occasions contractors,
consultants and owners need to study various services (underground / overground), such as
telecommunication cables, water / electricity / gas lines and others before they start the
construction (Faridi and El-Sayegh, 2006), depending on the location of the project. Local
governments issue permits and give approval in most cases, therefore, all construction
participants must be aware of these regulations and estimate the requirement of time and
effort required.
Apart from local authority regulations, there are important macro–level political and
economic factors that have been associated with poor performance of ECs. As a result of
legal requirement in South Africa, construction clients require contractors to meet
environmental management issues, which put significant pressure on ECs (Greyling,
2012). For example, Eskom and Transnet have very stringent environmental management
requirements, because they are held responsible and rather than risk penalties the main
contractors pass on their skills and systems to subcontractors. Main contractors
subsequently take an active role in implementing environmental management practices and
ensuring that subcontractors have the necessary skills to implement such practices. The
ECs that fail to adapt and respond to the complexity of the new environment in South
Africa tend to experience survival problems (Mbachu, 2008).
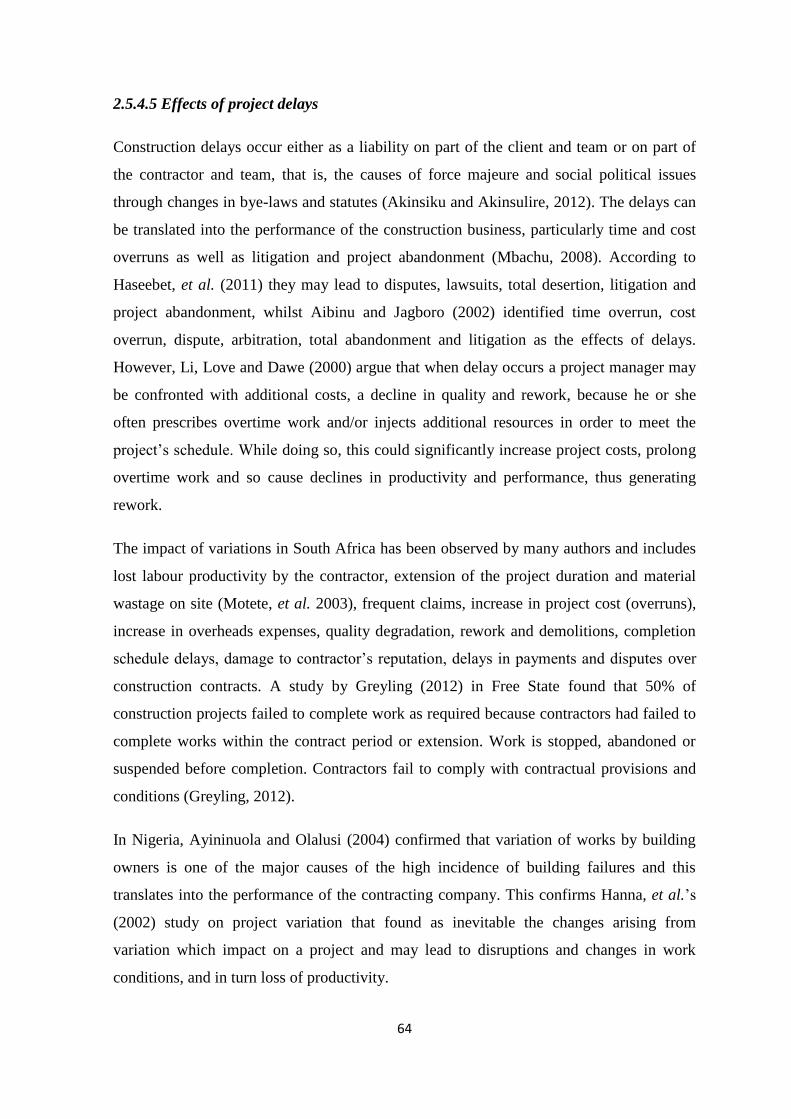
64
2.5.4.5 Effects of project delays
Construction delays occur either as a liability on part of the client and team or on part of
the contractor and team, that is, the causes of force majeure and social political issues
through changes in bye-laws and statutes (Akinsiku and Akinsulire, 2012). The delays can
be translated into the performance of the construction business, particularly time and cost
overruns as well as litigation and project abandonment (Mbachu, 2008). According to
Haseebet, et al. (2011) they may lead to disputes, lawsuits, total desertion, litigation and
project abandonment, whilst Aibinu and Jagboro (2002) identified time overrun, cost
overrun, dispute, arbitration, total abandonment and litigation as the effects of delays.
However, Li, Love and Dawe (2000) argue that when delay occurs a project manager may
be confronted with additional costs, a decline in quality and rework, because he or she
often prescribes overtime work and/or injects additional resources in order to meet the
project’s schedule. While doing so, this could significantly increase project costs, prolong
overtime work and so cause declines in productivity and performance, thus generating
rework.
The impact of variations in South Africa has been observed by many authors and includes
lost labour productivity by the contractor, extension of the project duration and material
wastage on site (Motete, et al. 2003), frequent claims, increase in project cost (overruns),
increase in overheads expenses, quality degradation, rework and demolitions, completion
schedule delays, damage to contractor’s reputation, delays in payments and disputes over
construction contracts. A study by Greyling (2012) in Free State found that 50% of
construction projects failed to complete work as required because contractors had failed to
complete works within the contract period or extension. Work is stopped, abandoned or
suspended before completion. Contractors fail to comply with contractual provisions and
conditions (Greyling, 2012).
In Nigeria, Ayininuola and Olalusi (2004) confirmed that variation of works by building
owners is one of the major causes of the high incidence of building failures and this
translates into the performance of the contracting company. This confirms Hanna, et al.’s
(2002) study on project variation that found as inevitable the changes arising from
variation which impact on a project and may lead to disruptions and changes in work
conditions, and in turn loss of productivity.

65
Sunday (2010) studied the impact of variation orders on public construction projects in the
Seychelles construction industry and found the effect to be increase in project cost, delay
in payment, hiring new professionals to take care of complex technological projects,
increase in overhead expenses, quality degradation, logistics delays, productivity
degradation, interruption, delays and redirection of work associated with variation orders
that have a negative impact on labour productivity, procurement delays, rework and
demolition, damage to business’s reputation, poor safety conditions, poor professional
relations and completion schedule delay.
Similarly, Faridi and El-Sayegh (2006) studied project delays in the United Arab Emirates
and found that preparation and approval of drawings, inadequate early planning of the
project and slowness of owner’s decision making processes were the main causes of
construction delays in that country. However, shortages, skills and the productivity of
manpower also played a vital role in construction delays. Other major causes of concern
from the contractors’ point of view included conflict between contractors and consultants.
Also, lack of communication and coordination between the parties involved in
construction (contactor – subcontractor-consultant-client) had an effect.
Another study, by Baloyi and Bekker (2011), focusing on the causes of construction cost
and time overruns in South Africa, found that the increase in material cost was the single
largest contributor to cost overruns for both global and stadia projects. With respect to time
delays, the study indicated that the most significant contributory factor in global projects
was late delay in payments, while for stadia projects it was design. A study by Sambasivan
and Soon (2007) categorised their findings as poor site management, inadequate contractor
experience and poor subcontractors, whilst Frimpong, et al. (2003) found that financing,
natural conditions and materials-related factors contributed mainly to the delay of
groundwater projects in Ghana.
The examples given in this section demonstrate that there are many factors with the
potential to affect the different dimensions of project delays. While the effects of
construction delay were drawn from different countries whose local conditions and
prevailing problems differ from South Africa, this demonstrates that construction delay is
one of the most recurring problems in the construction industry and has adverse impact on
project success in terms of time, cost, quality and safety. The effects of delays influence
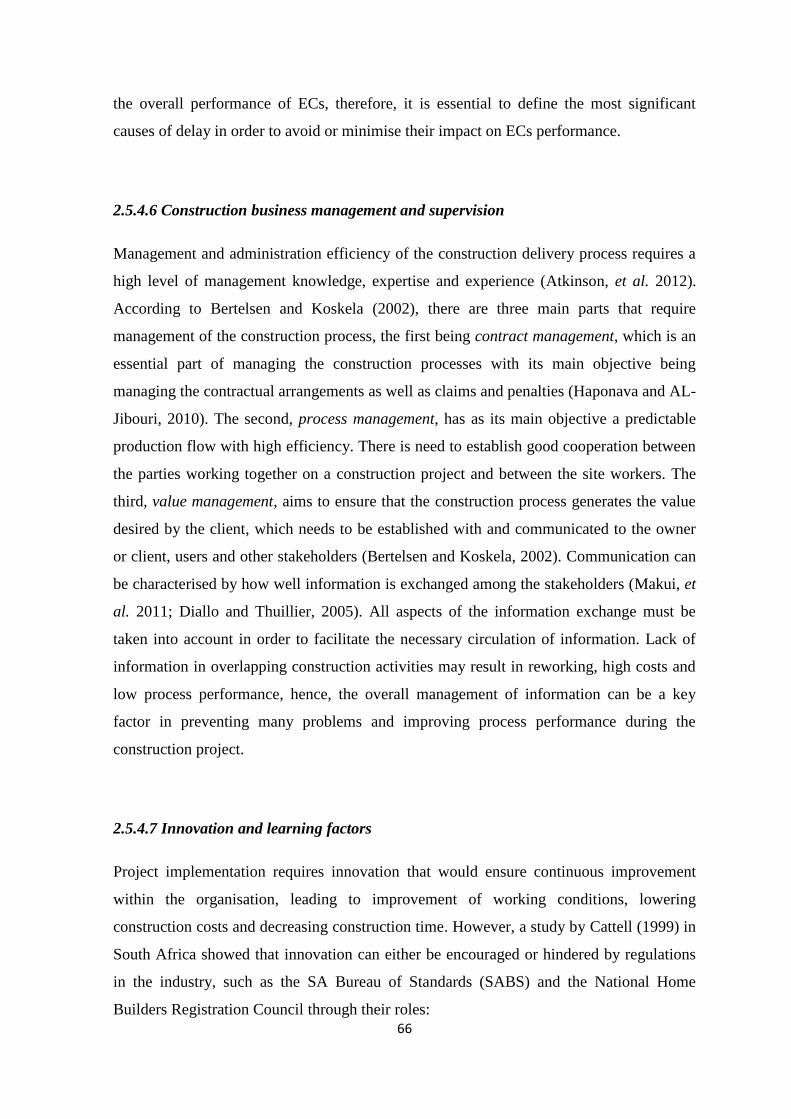
66
the overall performance of ECs, therefore, it is essential to define the most significant
causes of delay in order to avoid or minimise their impact on ECs performance.
2.5.4.6 Construction business management and supervision
Management and administration efficiency of the construction delivery process requires a
high level of management knowledge, expertise and experience (Atkinson, et al. 2012).
According to Bertelsen and Koskela (2002), there are three main parts that require
management of the construction process, the first being contract management, which is an
essential part of managing the construction processes with its main objective being
managing the contractual arrangements as well as claims and penalties (Haponava and AL-
Jibouri, 2010). The second, process management, has as its main objective a predictable
production flow with high efficiency. There is need to establish good cooperation between
the parties working together on a construction project and between the site workers. The
third, value management, aims to ensure that the construction process generates the value
desired by the client, which needs to be established with and communicated to the owner
or client, users and other stakeholders (Bertelsen and Koskela, 2002). Communication can
be characterised by how well information is exchanged among the stakeholders (Makui, et
al. 2011; Diallo and Thuillier, 2005). All aspects of the information exchange must be
taken into account in order to facilitate the necessary circulation of information. Lack of
information in overlapping construction activities may result in reworking, high costs and
low process performance, hence, the overall management of information can be a key
factor in preventing many problems and improving process performance during the
construction project.
2.5.4.7 Innovation and learning factors
Project implementation requires innovation that would ensure continuous improvement
within the organisation, leading to improvement of working conditions, lowering
construction costs and decreasing construction time. However, a study by Cattell (1999) in
South Africa showed that innovation can either be encouraged or hindered by regulations
in the industry, such as the SA Bureau of Standards (SABS) and the National Home
Builders Registration Council through their roles:
67
Ensuring that buildings and products meet minimum safety standards through
the National Building Regulations;
Setting standards for public good such as those related to indoor air quality
and the environment,
Setting standards related to building performance, such as utility, quality,
long-term durability of costs and protection of assets
Innovation is enhanced through product assessment and certification, which is a
mechanism designed to encourage market acceptance and use of innovative technologies.
SABS deals with standards and codes of practice which relate to conventional products
while Agreement SA assesses innovative, non-standardised building materials, products
and systems. Facilitating the acceptance and use of innovative technologies through
product assessment and certification are closely linked to the regulatory environment. All
building in SA must comply with the National Building Regulations (NBRs). Application
for building plan approval of must be made to the local authority which then applies the
NBRs when considering such applications. Although the regulatory process sets minimum
standards, in practice, few builders and contractors construct buildings to more than the
minimum required, in which case the regulations can be seen as hindering the introduction
of innovation and promoting new technologies (Cattell, 1999). Therefore, successful
innovation is a complex task for an EC that does not have the means and knowhow to
invest in R and D activities (Avermaete, et al. 2003) or cannot always convert research and
development into effective innovation.
2.5.5 Quality factors
Lack of quality in construction is manifested in poor or non-sustainable workmanship and
unsafe structures or delays, cost overruns and disputes in construction contracts (CIDB
2011). As a result, the preference of giving ECs in the award of contracts has become a
subject of concern and controversy to the South African public in general. The concerns
and controversy are based on public perception of the quality of work produced by ECs.
There are negative reports that most of the infrastructure contracts awarded to ECs were
abandoned and the frequent incidences of collapsed Reconstruction and Development

68
Program (RDP) houses have cast serious doubt on the ability and integrity of ECs. This
view is supported by Brandon (2014), who noted complaints about ECs in general and
personal accounts of unhappy relations with EC as too common. Clients of many types
often recount stories of how their various building projects have been fraught with
difficulty and have ultimately caused financial and emotional hardship. Brandon further
states that within one industry the standards to which various participants operate are
extremely varied. On one hand, there are sustainable and successful enterprise, regardless
of the magnitude of projects undertaken which are skilled, professional and conduct
themselves in such a manner that leads to satisfaction on the part of clients and agents
alike. On the other hand, there are innumerable unscrupulous, unskilled and opportunistic
operators whose conduct is unacceptable (Brandon, 2014). This shows the state of EC
performance level in the industry as perceived by the public.
Although reports of poor quality appear dominant in the low-cost public housing sector,
poor quality is regularly observed in the private residential housing sector. The
dissatisfaction with quality in the low-income residential housing sector has been widely
publicised, as illustrated by the following reports and investigations into subsidy of
housing in the public sector (adapted from CIDB, 2011):
Investigations and audits by the Department of Human Settlements have shown
that it would cost SA R1.3 billion or 10% of its 2009 / 10 year’s budget to rectify
badly built Reconstruction and Development Programme (RDP) houses,
An NHBRC forensic investigation estimated the rectification costs to be around
R400 million to reinstate structural integrity and with NHBRC minimum technical
requirements and the NBRs on around 41,000 houses investigated,
A report by the Department of Housing of the Province of the Eastern Cape noted
that of around 20,000 houses assessed, the rectification costs were put at around
R360 million,
According to FIDIC, failure to achieve appropriate quality of construction is a problem
worldwide. Ironically, quality is an important feature of construction because the safety of
every structure and more importantly the satisfaction of stakeholders with the structure
depend on its quality (Idoro, 2010). As a result, when main contractors solicit for
69
quotations they consider the subcontractors’ performance based on previous work,
financial stability and level of experience, processes for ensuring quality and safety, health
and safety record and even BEE credentials (Greyling, 2012; CIDB 2013).
A study by Zau (2006) in the Chinese construction industry found that quality was
negatively affected by corruption, some forms of which were traced to consultants, clients,
government officers’ administrative interference, illegal award of contract or subcontracts,
disclosure of project baseline prices prior to tendering and demand for bribes in cash or
kind from contractors. Within the contractors’ category, corruption was traced to offering
bribes in cash or kind, collusion in tendering prices among contractors, use of substandard
materials or workmanship and non-compliance with contracts. These activities negatively
affected quality in construction works in that country. This confirms media reports in
South Africa of incidences of collapse of buildings and shopping malls as a persistent
major problem to the government, professional bodies, clients, contractors and
subcontractors.
Based on the importance of quality, various quality performance initiatives have been
considered by both clients and contractors, for example, balanced scorecard, business
excellence model, ISO9000, ISO 14000, OHSAS18001, six sigma, and total quality
management systems (TQMs). Haupt and Whiteman (2003) perceive TQM as an
important tool on how quality can be improved in construction, whilst ISO9000
certifications related to construction are popular in several countries such as Hong Kong,
and the application of IS09000 based Quality Management Systems (QMS) in the
construction industry has been studied by several researchers (Palaneeswaran, et al. 2006;
Dissanayaka, et al. 2001). A study by Love and LI (2000) of the problems associated with
quality certification in Australia, by Riberio and Curado (2000) of how ISO9000 standards
are being used by construction companies in Portugal, and by Ofori (2009) of ISO9000
certification in Singapore construction enterprises, the costs, disclosed benefits and role in
the development of the industry. Using quantitative analysis, Ahadzie, et al. (2011)
reported evidence of design changes and/or variations, poor planning, supervision and low
mechanisation as some of the important factors that could be affecting construction
performance in Ghana. These studies confirmed that quality standards are essential to
improving quality in construction.

70
Poor quality is not unique to South Africa as similar trends are observed in many
developed and newly industrialised countries. Mbachu and Nkando (2007) found that
quality and attitude to service were key factors constraining successful project delivery in
South Africa. Similarly, Zulu and Chileshe (2008) found that the performance of
contractors in Zambia was below expectation, resulting in incomplete or significantly
delayed projects. The poor performance by contractors may have implications for business
competitiveness in that country as the construction industry is driven mainly by projects,
the success of which is linked to companies (Barry and Sebone, 2009). It follows that if
ECs consistently deliver poor quality on projects they may fail and this in turn may lead to
the low success rate of ECs (Adendorff, Appels and Botha, 2011). Poor quality is costly to
the client in terms of waste and value losses in building design, as supported by Hwang, et
al. (2009), who found that an estimated $US75 billion was wasted as a result of
construction related rework in the USA, and Love, et al. (1999) and Kazaz, et al. (2005),
who estimated the magnitude as ranging from 2 to 25% of construction contract value.
2.5.5.1 China
The majority of contractors in China are led into ISO9000 based quality management
systems mainly by clients who initiated mandatory requirements for contractor selection
by the Hong Kong Housing Authority and the Works Departments Bureau. This is a
similar board to the SA Master Builders Association (MBA) and CIDB in South Africa.
The Hong Kong Housing Authority uses the performance assessment scoring system
(PASS), introduced in 1990 as an objective means to measure contractors’ performance
against a set of defined standards and to provide a consistent means for comparing the
performance of individual contractors on individual projects (Favie, 2010:29). The
measures include end product quality such as structural work, architectural work and
process quality including safety, environment and other obligations, management input
assessment, programme and progress assessment, maintenance period assessment. The
system serves as the major vehicle to drive continuous improvements performance
achievement in the long run (Fung, 2006:8.7). By doing so, outstanding performers with
higher scores in PASS have a better chance of winning future bids (Fung, 2006:8.7).
71
2.5.5.2 The United Kingdom
The issue of raising construction quality has received attention worldwide and was integral
to a Rethinking Construction initiative in the UK that flowed from the Egan Report (1998)
on the scope for improving the quality and efficiency of construction. Specifically, the
Egan Report noted that under-achievement could be found in the growing dissatisfaction
with construction among both private and public sector clients. Projects were widely seen
as unpredictable in terms of delivery on time, within budget and to the standards of quality
expected. Specifically, key performance indicators (KPIs) are used in the United Kingdom
to measure construction performance (Construction Excellence 2003), the purpose being to
facilitate project and business performance measurement throughout a large number of
projects and hence give an indication of construction industry performance. KPIs measure
client satisfaction, product, service, construction cost, construction time, defects and
predictability time, profitability, productivity and safety.
2.5.5.3 Singapore
CONQUAS was introduced in Singapore in 1989 and served as a standard assessment
system on the quality of building projects (Building and Construction Authority, 2012).
CONQUAS became a national yardstick for the industry in that country, though it has been
fine-tuned periodically to keep pace with changes in technology and quality demands of a
more sophisticated population. Thus, CONQUAS has been widely recognised and
accepted internationally as a benchmarking tool for quality. Countries such as the UK and
China have successfully adapted CONQUAS to their construction industries. CONQUAS
is now a registered trademark in Singapore, Malaysia, China, the UK, Australia and India.
2.5.5.4 South African Bureau of Standards (SABS)
The South African Bureau of Standards (SABS) deals with standards and codes of practice
which relate to conventional products, while Agreement SA assesses innovative, non-
standardised building materials, products and systems. Therefore, facilitating the
acceptance and use of innovative technologies through product assessment and
certification are closely linked to the regulatory environment. All building in SA must
72
comply with the National Building Regulations (NBRs). Application for building plan
approval must be made to the local authority which then applies the NBRs when
considering such applications.
However, although the regulatory process sets minimum standards, in practice few
builders and contractors construct buildings to more than the minimum required, in which
case the regulations can be seen as hindering the introduction of innovation and promoting
new technologies (Cattell, 1999). Therefore, successful innovation is a complex task for
ECs that do not have the means or knowhow to invest in R and D activities (Avermaete, et
al. 2003) or cannot always convert research and development into effective innovation.
2.5.5.5 The Joint Building Contracts Committee (JBCC)
The JBCC is a difficult contract and not well understood by contractors. This is a major
problem as few of the ECs have in-depth knowledge on their responsibilities, liabilities
and procedural clauses (Greyling, 2012). The industry is too technical and ECs are
intimidated by the conditional clauses and the knowledge of the professionals. Some
contractors are ignorant about the contract clauses, such as on labour, contractual and
risks. Although JBCC is a good contract, however, at least 80% of contractors have very
little knowledge of it (Greyling, 2012), and it should be well work-shopped (if the contract
is signed) to empower the contractors on knowing what they are signing. Contractors need
to understand the terms and conditions. Currently, contractors perceive clients as more
protected than the contractor (Greyling, 2012).
2.5.5.6 International Federation of Consulting Engineers (FIDIC)
As discussed above, construction quality is at the core of various initiatives in Singapore,
Hong Kong, Malaysia, and other countries. Along similar lines, the International
Federation of Consulting Engineers (FIDIC) confirmed that failure to achieve appropriate
quality standards in the industry is a problem worldwide, and is evident in both developed
and developing countries. In response to the need for improving quality, the FIDIC
established a Quality of Construction Task Force, which has resulted in a range of quality
management guides.
73
2.5.6 Legal and regulatory factors
There are legal and regulatory compliances that ECs are required to observe which have
impact on construction business performance. These include excessive bureaucracy, health
and safety factors and environmental factors.
2.5.6.1 Excessive bureaucracy
In the South African construction industry, ECs are required to be registered with the
CIDB, a board that manages the development of ECs. However, ECs in the construction
industry seem to be trapped in the registration process in which most of them (Grades 1 –
6) do not have financial means to be registered to the higher financial grades (7 – 9).
Approximately 8,300 enterprises (approximately 76% of which are black-owned) are
currently registered with the organisation in Grades 1-6 and above in general building
(GB) and civil engineering (CE). Currently, registration is not compulsory, hence ECs
perceive the system of grading as an expensive inconvenience with no value (Greyling,
2012). Small businesses in the construction industry’s track record is relevant in the
industry as they strive to become main contractors and need to improve CIDB grading.
Building a track record is prevalent during periods of industry downturn, when there is
increased competition for prime contracting and companies need to sustain overheads and
track record to maintain grading on the CIDB Register of Contractors (Greyling, 2012).
2.5.6.2 Health and safety factors
The Health and Safety Act, as amended by the Occupational Health and Safety
Amendment Act (181 of 1993), provides for the health and safety of persons at work in
connection with the use of plant and machinery and the protection of persons, and against
hazards to health and safety. The objective of a safety programme is to eliminate losses
due to poor working practices that could impact workforce wellbeing (Windapo and
Oladapo, 2012). Accidents during a project can be detrimental to the project in terms of
time, costs, and the reputation of the company (Sidumedi, 2009; Chan and Chan, 2004),
and may lead to poor time and cost performance. In the case of accidents, work may stop
in one area of the job, worker morale may drop and productivity may decline.

74
Health and safety compliance issues negatively impact on the main contractors if they are
legally responsible and many have to carry the compliance costs of subcontractors who
have neither the technical expertise nor the resource to invest in these legislative
requirements (CIDB 2013). According to the CIDB (2013), some main contractors
reported that their sites had been closed down because of poor compliance by the
subcontractors, a situation that negatively impacts on schedules and the overall
profitability of a project. The number of people who are get injured or die in the South
African construction industry has remained high (Windapo and Oladapo, 2012). These
accidents and fatalities have been attributed to non-compliance by contractors with health
and safety regulations on construction sites (Warwick, 2011; CIDB, 2009). The reasons
cited in literature are that some individuals are ignorant of the law or in other cases the
contractors take chances (Windapo and Oladapo, 2012). On the other hand, Smallwood
and Venter (2002) have attributed this to lack of knowledge and inadequate training of site
workers and contractors regarding the cost of complying with regulations as an
unnecessary financial burden (Windapo and Oladapo, 2012).
The impact of health and safety non-compliance is demonstrated by the following quote
extracted from the Department of Labour (online: 2014):
Construction worker dies in horrific accident (2007): A 45 year old male worker
was killed whilst driving a construction vehicle at Okahlamba District, Bergville. The
worker seemed to have lost control of the vehicle whilst approaching a gravel road and
was flung out of the cab, crushing his skull. His left leg and hand were also severed in
the accident. A document audit in terms of Occupational Health and Safety
requirements has revealed that:
No Health and Safety plans were in place
No proof of Health and Safety induction for the deceased was available.
When the incident occurred there was no construction supervisor on site.
The construction company had not conducted a risk assessment prior to
commencing work.

75
Smallwood, et al. (2002) attest that workers are not consulted about health and safety by
management; workers are seldom provided with personal protective equipment (PPE);
programme, policy and rules are non-existent; there is no appointment of health and safety
representatives; inspections and meetings are not conducted; and the workers perceive the
supervisors do not prioritise health and safety. Literature has shown lack of training as a
major cause of non-compliance by workers with health and safety legislation on sites
(Smallwood and Venter 2002; CIDB, 2009).
According to Windapo and Oladapo (2012), contractors perceive health and safety
regulations as an additional burden, giving rise to unnecessary costs. In view of the
perceived additional costs, Smallwood (2004) estimated cost of implementing health and
safety systems within a company as between 0.5% and 3% of total project costs, relative to
safety training, safety induction, medical requirements, personal protection requirements
and expensive first aid requirements. A study by Baxendale and Owain (2000) established
that the costs of implementing health and safety by ECs on sites are higher than those on
larger sites.
2.5.6.3 Environmental factors
The issue of environmental performance measure was pointed out by Chan and Chan
(2004). In South Africa, considerable attention has been directed towards finding out how
to minimise construction waste and restrict environmental nuisance. As a result, companies
invest in the improvement of environmental protection because of cost factors (Yao, et al.
2006). Owing to stringent legal and contractual requirements there are increasing demands,
expectations and emphasis on safety, quality and environmental protection (Lai and Lam,
2010).
2.5.6.4 Singapore
The Building and Construction Association (BCA) Green Mark Scheme was launched in
2005 as an initiative to drive Singapore’s construction industry towards more
environmental friendly buildings (Building and Construction Authority, 2013). The
scheme was intended to promote sustainability in the built environment and raise
environmental awareness among developers, designers and builders when they began
76
project conceptualisation and design, as well as during construction. BCA Green Mark
provides a meaningful differentiation of buildings in the real estate market, as a
benchmarking scheme that incorporates internationally recognised best practices in
environmental design and performance. This has had a positive effect on corporate image,
leasing and resale value of buildings. In this country, the Green Building Masterplan has
encouraged, enabled and engaged industry stakeholders to step up efforts in environmental
sustainability (Building and Construction Authority, 2013). The BCA has continued
championing a proactive and holistic approach of tackling challenges, such as greening of
the existing building stock and the building of industry capabilities.
2.5.7 Strategic planning
Strategic thinking has engaged the brains of business leaders for centuries (Skaik, 2009).
Due to inherent characteristics in the construction industry, businesses ought to adopt
dynamic and effective strategic management to secure proper growth and to remain
competitive. Strategic management is necessary to any business working in construction
because there is a rapidly changing environment with adverse competition and surprises
which act as serious threats to organisation stability. Strategy acts as a guiding map for the
business to achieve its clear intention for development and growth. According to
Mintzberg (1994), there is very little evidence of strategic management implementation
and effectiveness in organisations, which may explain why ECs in the construction
industry perform below required standard. This could be a result of poor management
awareness, lack of clarity about decision-making, inadequate communication and
collaboration and low levels of accountability. Most of strategic plans fail because they are
exported without being generated from the heart of the local dynamic environment and the
business’s culture (Skaik, 2009).
Strategic planning involves the setting of long-term organisational goals, the development
and implementation of plans and the allocation or diversion of resources necessary for
realising them (O’Regan and Ghobadian 2002). The purpose of strategic planning is to
enable a business to gain as efficiently as possible a sustainable edge over its competitors
(O’Regan and Ghobadian 2002). ECs that engage in strategic planning, compared to those
that do not, are more likely to achieve higher sales growth, returns on assets, margins on
77
profit and employee growth (Carland and Carland, 2003; Gibson and Cassar, 2005).
Conversely, failure to adequately plan often leads to business stagnation and failure
(Chawla, Khan and Pahls, 2012). An examination of literature show that general
management, financial planning and control are the most commonly cited contributors to
business mortality (Thwala and Phaladi, 2009). Earlier, Rue and Ibrahim (1998:27) had
investigated the planning process in small businesses and the relationship between
planning sophistication and performance, finding that about 60% of the small businesses
had some form of written plan and there was a moderately significant relationship between
planning sophistication and self-reported performance relative to industry standard. It
found no significant relationship between planning sophistication and return on investment
(ROI) but a significant relationship between planning sophistication and sales growth rate.
As a result, small businesses that do not prepare business plans have a greater chance of
failure than those that do (Lussier and Corman, 1995). In spite of this, empirical evidence
supporting a significant relationship between small business planning sophistication and
performance appears limited and mixed.
Despite the importance of strategic planning, ECs have been accused of being
‘strategically myopic’ and lacking the long-term vision as to where their company is
headed (Thwala and Phaladi, 2009). The concern is that by neglecting strategic planning,
ECs may not achieve full performance and growth potentials and survival could be placed
at risk (Kazaz and Ulubeyli, 2009). Strategic plans are often formulated on the basis of
changes that can be foreseen (Ruerket and Walker, 1987), which involves selecting
business mission and goals, analysing business’s external competitive environment to
identify opportunities and threats, analysing the internal environment to select strategies
that build on the identified strengths and correct weakness in order to take advantage of
external opportunities and counter external threats (Hill and Jones, 2009). ECs tend to
operate in environments that are difficult to foresee or influence because of limited market
power (Alpkan, et al. 2007:157), hence the strategies of ECs involve an iterative process of
trial and error in response to market changes. This means the planning activity in many
ECs is in the form of frequent adaptations of simple operational procedures to changes in
the environment.
A study by Adendorff, Appels and Botha (2011) focusing on strategic management in the
Eastern Cape Province construction industry indicates that ECs that practise strategic
78
management perform better. There were many advantages for ECs to adopt strategic
management principles at the business level, and results showed an EC that had grown
from a small enterprise into an established medium-sized one both in terms of annual
turnover and number of employees. Currently, the business is capable of successfully
completing multimillion rand projects in both general building and civil engineering
construction works (Adendorff, Appels and Botha, 2011). The study attributed the success
of the enterprise to the strategic objectives set by the enterprise and the corporate strategies
that were pursued by enterprise.
The success of the construction business in the Eastern Cape is attributed to the use of joint
venture, partnerships, acquisition, and subcontracting, vertical integration and
diversification strategies employed by the SBE. Business level strategies that included cost
leadership and focus strategy were also used (Adendorff, Appels and Botha, 2011). Other
strategies used by the business included competitor analysis, business capabilities in terms
of resource allocation. The business conducted a SWOT analysis to keep abreast of its
strengths and weaknesses and to identify threats and opportunities in its environment
(Adendorff, Appels and Botha, 2011).
2.5.8 Performance improvement
Sustainable construction is one example that has received growing interest in both the
private and public sectors. The U.K. government published a strategy for sustainable
development, “A Better Quality of Life,” with researchers as well as companies looking
for ways to improve construction sustainability and subsequently to measure it. Another
example of performance improvement trends is social responsibility, of increasing interest
to companies worldwide and across industries. Quality assurance standards, such as the
ISO14000 family and business excellence models, such as EFQM, have addressed
performance standards in economies such as Japan’s. Other trends include knowledge
management, lean construction, and concurrent construction. Improving efficiency and
quality learned, including benchmarking, value management, team working, Just-In-Time,
concurrent engineering, and TQM (Egan 1998), have been used to improve efficiency in
various industry, such as manufacturing.
79
Through TQM, quality becomes the responsibility of all departments and sections in the
organization. It places the customer at the forefront of decision-making and this supports
the market orientation concept (Narver and Slatter, 1990; Kohli and Jaworski 1990) that
argues that a firm must become the best at satisfying the needs and wants of customers in
the markets it chooses to serve with the purpose of building long-term, mutually satisfying
relationships and co-prosperity among key stakeholders (Kotler and Keller, 2006). TQM
requires a process of continuous improvement that embraces people, suppliers, material,
equipment and procedures. The process of improvement is popularly known in Japan as
the kaizen, a philosophy by which every aspect of an operation can be improved, with an
end product being perfection, sought but seldom achieved, particularly in the construction
industry. Other quality concepts that should be considered when implementing TQM,
according to Heizer and Render (2006), include employee empowerment, benchmarking
and the Just in Time (JIT) system.
2.6 CLARIFICATION OF CONCEPTS
The key operational terms used in the study are defined in this section.
In this study, the critical incident technique (CIT) definition is guided by Chell (1998),
as a qualitative interview procedure which facilitates the investigation of significant
occurrences (events, incidents, processes or issues) identified by the respondent, the way
they are managed, and the outcomes in terms of perceived effects.
The construction industry is defined as an economic entity which plans, designs,
constructs, alters, maintains, repairs and eventually demolishes buildings of various kinds,
including architectural, structural and civil engineering works, mechanical and electrical
engineering structures and other similar works (Ofori, 1990). The construction industry is
a project-based sector within which individual projects are usually custom built to client
specification (Akiner and Akiner, 2009).
In this study a contractor is a person or body of persons who undertake/s to execute and
complete construction works (Act of Parliament, 38 of 2000).
The CIDB Act defines emerging enterprise as one which is owned (at least 50%),
managed and controlled by previously disadvantaged persons and which is overcoming

80
business impediments arising from the legacy of apartheid. This refers to small-scale
construction enterprises in CIDB graded 2 – 3 (CIDB 2010), however, for the purpose of
this study, emerging contractors refers to CIDB graded 2 construction businesses.
Small business executives are appointed and given the responsibility to manage the affairs
of an organisation and the authority to make decisions within special boundaries. In this
study, executives are defined using the Paterson Grading System, which is used in South
Africa as an analytical method of job evaluation. The Paterson system analyses decision-
making components of work and sorts jobs into six major groups (Jordan, et al. 1992), as
shown in Table 2.3 (below):
Table 2.3: The Paterson Grading System
GRADE DECISION MAKING
A Prescribed decisions
B Co-ordinating Automatic decisions
C Co-ordinating Routine decisions
D Co-ordinating Interpretative
decisions
E Co-ordinating Programming
decisions
F Co-ordinating Policy decisions
Source: Own Compilation from literature
Using the Paterson’s Grading System, in this study small business executives (SBEs) are
those employees on levels E and F based on the decisions they make with the ECS
organizational structures. This included the top team members of each emerging
construction enterprise registered with CIDB in Grade 2 and included Chief Executive
Officer, Chief Financial Officer, Contract Director and Marketing Director.
Determinants are factors that promote or impede small construction business
performance.
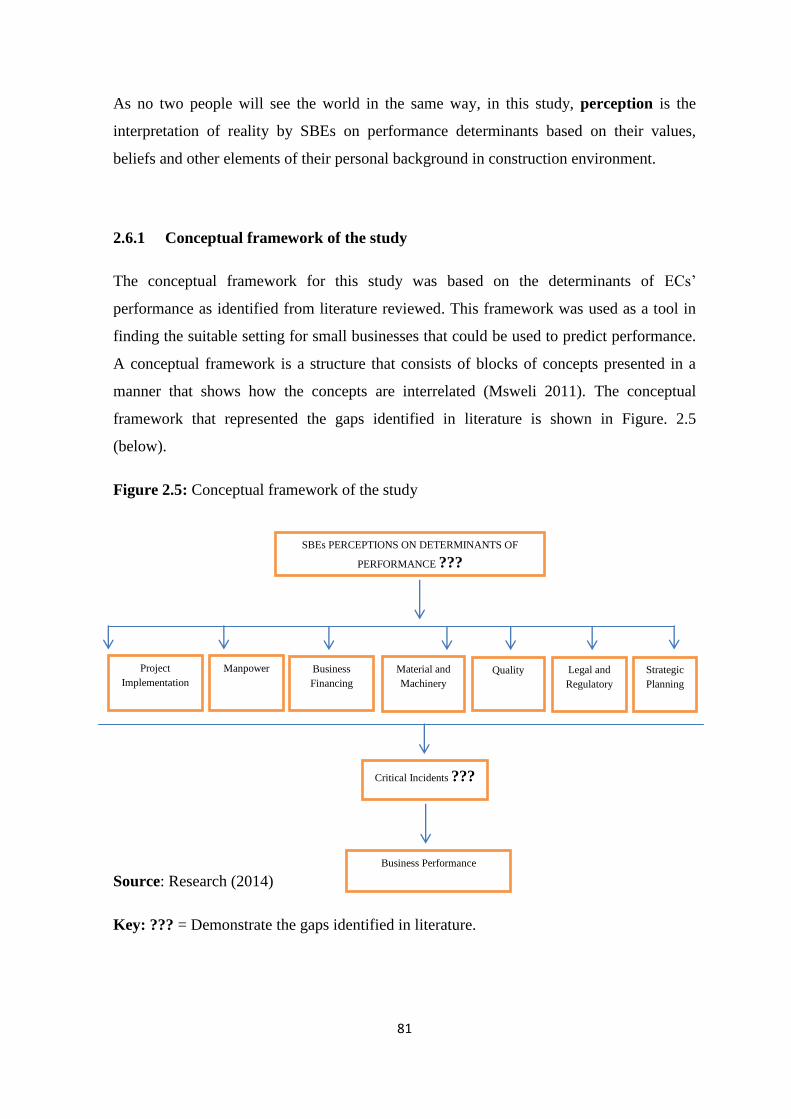
81
As no two people will see the world in the same way, in this study, perception is the
interpretation of reality by SBEs on performance determinants based on their values,
beliefs and other elements of their personal background in construction environment.
2.6.1 Conceptual framework of the study
The conceptual framework for this study was based on the determinants of ECs’
performance as identified from literature reviewed. This framework was used as a tool in
finding the suitable setting for small businesses that could be used to predict performance.
A conceptual framework is a structure that consists of blocks of concepts presented in a
manner that shows how the concepts are interrelated (Msweli 2011). The conceptual
framework that represented the gaps identified in literature is shown in Figure. 2.5
(below).
Figure 2.5: Conceptual framework of the study
Source: Research (2014)
Key: ??? = Demonstrate the gaps identified in literature.
Business Performance
SBEs PERCEPTIONS ON DETERMINANTS OF
PERFORMANCE ???
Project
Implementation
Critical Incidents ???
Manpower Business
Financing
Material and
Machinery
Quality Legal and
Regulatory
Strategic
Planning
82
2.7 SUMMARY AND IDENTIFICATION OF THE GAP
The theoretical and empirical literature on the concepts of EC business performance and
the determinants were reviewed in this chapter. The frameworks that have a bearing on this
study have been discussed, namely the BSC model, the EFQM excellence model, the
PMPF model and the SACEM. The frameworks have been noted as important as they
embrace the concept of total quality management (TQM) and are becoming increasingly
recognised as vital to the continued success of businesses (Beatham, et al. 2004). While
there are other frameworks for performance measurement implemented within the
construction industry, the EFQM excellence model, the BSC model and the KPIs model
are those most frequently used for performance measurement in construction (Yang, et al.
2010). However, Robinson, et al. (2005) have argued that these three models play
important roles in the performance measurement of the UK construction businesses. Neely,
et al. (2001) found that performance is multi-faceted and that each framework holds its
advantages and limitations. These frameworks for performance measurement are effective
and practical because they help to evaluate the performance levels in a more quantitative
and objective manner.
While these frameworks have guided the analysis of contractors in other parts of the world,
the performance problem, especially of ECs in South Africa, has remained a cause of
concern as little has changed. Although these models have been studied and applied in
other parts of the world, most of the studies in this area have to date been conducted in the
developed countries of the West, with relatively little research conducted on these
frameworks to confirm their effectiveness in the South African context. Against this
background, there is no common understanding that can be relied upon to explain the
determinants of ECs’ performance in South Africa as the frameworks have not provided a
systematic explanation towards these determinants.
Drawbacks identified by different authors with the implementation of the KPIs in various
countries include:
Subjective assessment of some of the key measures such as satisfaction of
customer (Chan and Chan 2004),
Some of the measures are crude and open to interpretation (Fernie et al., 2006).

83
Lack of involvement with top-level coordinating agencies (Fernie, et al. 2006).
There are many KPIs underway at the same time, which leads to fragmentation and
frustration in the industry (Kagioglou, et al. 2001).
Large investment (cash and in-kind) is required to implement, measure and report
on the data (Robinson, et al. 2005).
Similarly, the frameworks that have been developed in South Africa, for example, the
SACEM and the ECDP, have generally failed to empower ECs because these are
implemented without well-defined skills transfer frameworks (Lazarus, et al. 2007). Thus,
ECs have failed to take the strategic role through high performance and have remained
plagued by lower performance levels and higher risks of business failure estimated
between 70% and 80% (Olawale and Garwe 2010; Kunene, 2008; Santelli and Vivarelli,
2007; Von Broembsen, et al. 2005; Cant and Brink 2003). Based on the apparent
underperformance of ECs in South Africa, the development of more performance
enhancement frameworks is necessary. According to Yang, et al. (2010), there is no single
framework or approach that fits all situations, however, each framework has its advantages
and disadvantages, and it is an important task to develop a more comprehensive
performance measurement framework in construction in the future.
Overall, there are four major contributions that have emerged from the theoretical
foundation. Firstly, the major frameworks for performance measurement in the
construction industry have been discussed: EFQM excellence model, BSC model, KPIs
model and SACEM. Secondly, the frameworks discussed agree that performance
measurement studies in construction can be divided into three levels, project,
organisational and stakeholder. Thirdly, the discussion has shown that EFQM excellence
model and the BSC model are the most frequently applied to the organisational level,
except that the project excellence model, which is developed from the EFQM excellence
model, is applied to the project level. Fourthly, the KPI model can be used at project,
organisational and stakeholder level. The advantages and disadvantages of each framework
have been discussed, showing that no single framework fits all situations.
From the review of literature, a few gaps in knowledge emerged as researchers have
constantly omitted to identify and examine the role played by the perceptions of SBEs,
particularly those registered with CIDB Grade 2 in the construction industry. Instead, the

84
studies concentrated on one or selected areas of ECs’ performance. Mbachu and Nkado
(2007) looked at the factors constraining successful building project implementation in
South Africa, but the study was limited to the views of the Association Construction
Project Managers and the Master Builders Association. On the basis of the views of the
managers, the results indicated that a set of consultants’ and contractors’ acts of omission
or commission were the most influential and most frequently occurring factor constraining
successful project delivery in the South African building industry (Mbachu and Nkado,
2007). The findings of the study were based on a convenience sampling method.
Ncwadi and Dangalazana (2005) conducted an exploratory study into the challenges facing
the ECs involved in the construction of low cost housing in South Africa. Among other
issues, their study looked at business leadership, business strategy and planning, customer
and market focus, people management, resource and information management, business
processes, customer satisfaction, supplier and partnership performance, business results as
well as health and safety issues. The sampling frame was limited to a database of ECs
obtained from the Nelson Mandela Housing Department and Progress Project Management
Services in Port Elizabeth, using a purposive sampling method.
Windapo and Oladapo (2012) limited their study to the determinants of construction
compliance with health and safety regulations in South Africa, based on a combination of
convenience and snowball sampling methods to obtain data from 53 contractors who
agreed to participate in the survey. Fugar and Agakwah-Baah (2010) investigated the
causes of delay of building construction projects in Ghana to determine the most important
factors, but used convenience sampling based upon who was available and willing to
participate and fast and convenient, which has potential for bias (Frey, et al. 1991) so the
results of this study cannot be relied upon. This method could be probably the most
common sampling strategy and the least desirable. The challenge of using this method is
that researchers tend to pick respondents and cases that are easy to access and inexpensive
to study. While convenience and cost are real considerations, they should be the last
factors to be taken into account after strategically deliberating on how to obtain the most
information of greatest utility from the limited number of cases sampled (Patton, 2002).
Many studies have concentrated on selected aspects of construction businesses when trying
to determine what factors affect performance. Ladzani, et al. (2012) concentrated on the
use of leadership and strategic planning functions in improving the management

85
performance of ECs in the Province of Gauteng. Baloyi and Bekker (2011) looked at the
causes of construction cost and time overruns, focusing on the 2010 FIFA World Cup
stadia in South Africa. Thwala and Mvubu (2009) looked at the challenges and problems
facing small and medium size contractors in Swaziland. The results were based on a
judgemental sampling method.
In reality, SBEs play an important role in construction business success. SBEs encounter
incidents that either enable or hinder the performance of ECs operations. Against the
background that SBEs being the business custodian of the substantial experience which
has not been accessed or harnessed, it is therefore imperative to engage SBEs in the
construction industry and tape their experiences on the determinants of small business
growth and their implications in South Africa. Any business practise is driven under the
direction of executives whose perceptions on business policies and practices can build or
destroy business performance. By highlighting SBEs’ perceptions on determinants of ECs’
performance and working towards a more positive engagement with SBEs, one could
encourage understanding among SBEs, policymakers and other interested parties.
The next chapter describes the research methodology, data gathering method and data
analyses.

86
CHAPTER THREE
RESEARCH METHODOLOGY
3.1 CHAPTER INTRODUCTION
This chapter is organised around the appropriateness of the research design, the population
sampling and detailed description of the data collection instruments. The method used for
data analysis is explained with a brief description of how validity and reliability were
ensured. According to Webb and Auriacombe (2006), it is important in a research project
to select those methods and techniques that are appropriate to the research goal. This
research looked at proper methods of investigating and exploring a phenomenon and
survey.
3.2 THE RESEARCH DESIGN
Flick (2006) defines a research design as a plan for collecting and analysing evidence that
will make it possible for the investigator to answer questions posed to the target
population. This study employed a mixed-method approach to explore the determinants of
ECs business performance by applying both qualitative and quantitative research to
provide a better understanding of the research problem than either form itself. According
to Creswell, (2008) a mixed-method study presents the researcher with an opportunity to
make a more convincing argument through triangulation, used to check if there was
convergence, corroboration and correspondence of results. The first phase of the design
was qualitative, with which in-depth interviews were conducted to define the various
thematic areas that led to the development of the quantitative assessment part of the study
(phase two) as shown in Figure 3.1 (below).
Figure 3.1: Mixed method design (Exploratory design)
Modified from: Creswell and Clark, (2011)
Qualitative Data
Collection & Results
Integration/Interpretation Quantitative Data
Collection & Results + =

87
The researcher used a cross-sectional study design carried out in the Gauteng Province,
which allowed for the determination of the prevalence of certain perceptions of SBEs,
hence establishing the important determinants which helped set the strategy for
performance improvement. Because there has been no similar study on the perceptions of
SBEs on determinants of performance in the construction industry the design was
considered appropriate, the nature of the information required making the adoption of the
mixed-method approach most appealing. This was in line with Denzin and Lincoln (2008),
who note that, epistemologically, a multi-methodological approach enables far richer
insights to be gained on the phenomenon under consideration. Abowitz and Toole, (2009)
also note possible improvements in validity and reliability of data as a result of the use of
the approach.
3.2.1 Qualitative approach
The knowledge on SBEs’ perceptions was augmented by interviewing ECs’ chief
executive officers, chief financial officers, contract directors and marketing directors as
representatives. This means detailed descriptions of situations, events, interactions and
observed behaviour from respondents about their experiences, attitudes, beliefs and
thoughts, correspondences, records and case histories were collected and investigated, in
line with Flanagan (1954). By using a qualitative technique, the findings had greater
validity as the process revealed in-depth understanding and richness of the situation
(Cooper and Schindler, 2011). However, the technique was undermined by the subjectivity
and susceptible to human error and bias in data collection and interpretation. The results
could not be generalised to a larger population, considered a fundamental weakness for the
approach. Measuring perceptions which are subjective norms needed to be quantified,
hence a quantitative component was added to explain the quantifiable perceptions as
measured on a Likert scale.
3.2.2 Quantitative approach
A quantitative research approach is grounded on the positivist social sciences paradigm,
which primarily reflects the scientific methods of the natural sciences. In line with
Creswell (1994), a quantitative research approach was used in this study because it is an
88
effective design for research questions related to measuring how much the perceptions
were determinants of ECs’ performance. Quantitative method involves the use of
numerical and statistical analyses of measurements to examine social phenomena (Cooper
and Schindler, 2011). Numerical data was gathered on variables in establishing how
dependent or independent variables were through the lens of statistical tools. The
advantages that were considered for using this method included its great premium on
objectivity and reliability of findings. The method was triggered by large amounts of data
obtained from the survey, but whilst the researcher’s influence on the research was
significantly reduced, thereby minimizing bias (Saunders, et al. 2003), quantitative
research may not always be appropriate as it cannot accurately or reliably measure
phenomenological issues such as perceptions, thus reducing the validity of the findings.
3.2.3 Integration of the research designs
The results received from both qualitative and quantitative data were subject to integration,
defined by Creswell, (2003) as a combination of both forms of research within a given
stage of enquiry. It occurred within data analysis whereby transformation of qualitative
themes into quantitative items was carried out and interpretation of both forms was
assessed for convergence and divergence.
3.3 POPULATION OF THE STUDY
The research population was limited to the ECs in Grade 2, registered with CIDB in
Gauteng. The ECs that engage in General Building (GB) and Civil Engineering (CE)
became the target population, however, it was noted that CIDB would not include every
potential contractor of the same size in the province and such contractors were thus
excluded. The registration database reflected 1,890 urban based ECs in Grade 2 registered
with the provincial board. Grade 2 contractors are typically established and developing
contractors that operate at a local level (Windapo Oladapo, 2012; CIDB, 2013). The details
of the distribution of the total number of registrations in terms of class of work in Gauteng
Province are shown in Table 3.1 (below).
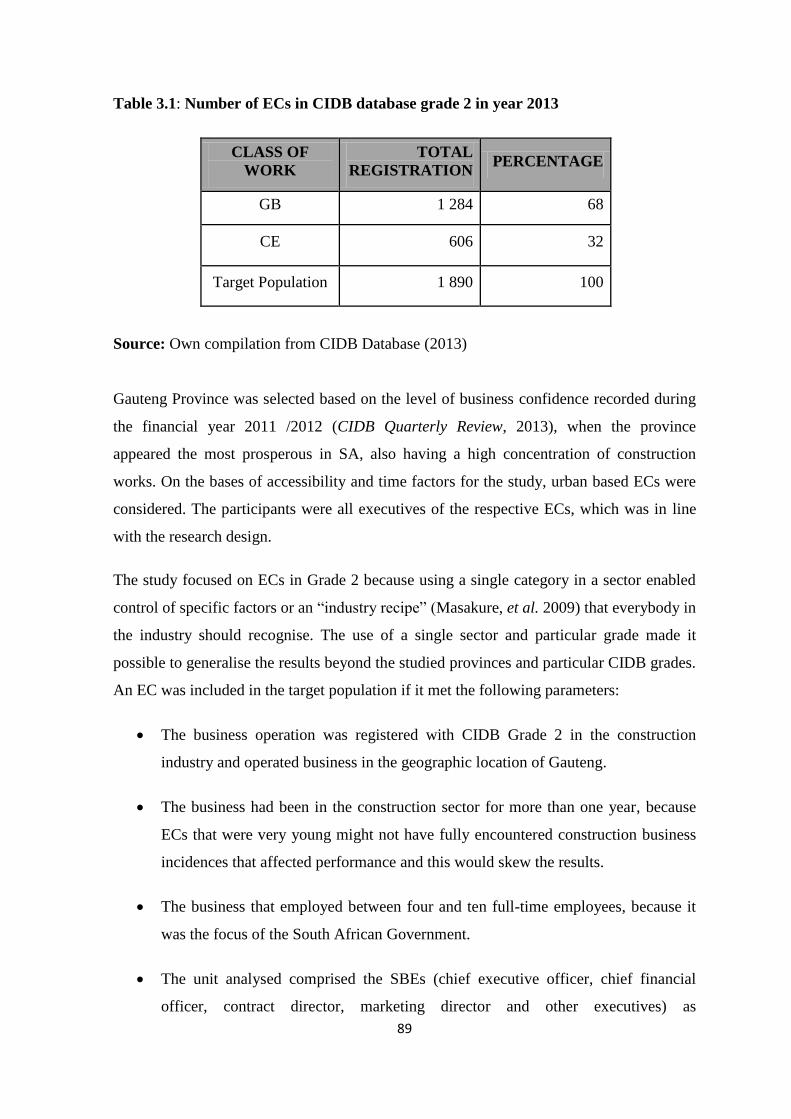
89
Table 3.1: Number of ECs in CIDB database grade 2 in year 2013
CLASS OF
WORK
TOTAL
REGISTRATION PERCENTAGE
GB 1 284 68
CE 606 32
Target Population 1 890 100
Source: Own compilation from CIDB Database (2013)
Gauteng Province was selected based on the level of business confidence recorded during
the financial year 2011 /2012 (CIDB Quarterly Review, 2013), when the province
appeared the most prosperous in SA, also having a high concentration of construction
works. On the bases of accessibility and time factors for the study, urban based ECs were
considered. The participants were all executives of the respective ECs, which was in line
with the research design.
The study focused on ECs in Grade 2 because using a single category in a sector enabled
control of specific factors or an “industry recipe” (Masakure, et al. 2009) that everybody in
the industry should recognise. The use of a single sector and particular grade made it
possible to generalise the results beyond the studied provinces and particular CIDB grades.
An EC was included in the target population if it met the following parameters:
The business operation was registered with CIDB Grade 2 in the construction
industry and operated business in the geographic location of Gauteng.
The business had been in the construction sector for more than one year, because
ECs that were very young might not have fully encountered construction business
incidences that affected performance and this would skew the results.
The business that employed between four and ten full-time employees, because it
was the focus of the South African Government.
The unit analysed comprised the SBEs (chief executive officer, chief financial
officer, contract director, marketing director and other executives) as

90
representatives of ECs in the sample set. The unit of analysis is the entity being
analysed, for example individual people, groups and/or organisations. It describes
the level at which the research is performed and which objects are researched
(Serumaga-Zake, 2011). By virtue of their seniority within the enterprise, SBEs
were in an ideal position to give valuable information on the determinants of ECs’
performance. The reasons for selecting this unit of analysis were that SBEs have
high degree of encounters which are significant for the performance of the business
and play a more active role in decision-making, strategy formulation,
implementation and reporting within an organisation. SBEs are also directly
responsible for making strategies and encounter incidences that facilitate or impede
such business decisions.
3.3.1 Sampling for qualitative data
The qualitative research phase selected ECs who had been involved in the construction
work within the Gauteng Province, and the sample size was determined according to
Flanagan’s (1954) recommendations that adequate coverage has been achieved when the
addition of 100 critical incidents to the sample adds only two or three critical behaviours.
Based on this recommendation, six ECs were purposefully selected from the target
population as all were available. There are no rules for sample size in qualitative inquiry,
rather it depends on what the researcher wants to know, the purpose of the inquiry, what is
at stake, what would be useful, what would have credibility and what could be done with
available time and resources (Paton, 2002). Interviews were conducted with one SBE as
representative of each EC.
3.3.2 Sampling for quantitative data
The sampling frame used for this study was constructed from a CIDB database, this being
less costly than custom-made lists, and the register was current with new establishments.
However, the researcher was aware that government organisations such as the CIDB are
slow in dropping establishments that have gone out of business.
91
A probability sampling method was used to ensure that each member of the EC population
was given a known non-zero chance of selection. Probability sampling guaranteed every
member in the CIDB database a known and equal chance of being selected for the sample
(Cooper and Schindler, 2011; Zikmund, et al. 2010), so the resulting sample was a valid
representation of the EC population registered in Grade 2 with CIDB in the province.
Specifically, the systematic sampling method was used to ensure adequate representation
of all its ECs.
3.3.2.1 Sample size determination (quantitative data)
Sample size determination is crucial to any empirical research, as too small a sample size
undermines the power of the statistical tests of significance while a larger one has less
chance of producing results that are uncharacteristic of the population as a whole (Cooper
and Schindler, 2011). The sample size determination for this study was based on the
perception of small business executives in the construction industry, thus, the estimate was
given by formulae adapted from Donner, Birkett and Buck (1981):
n = (Z )2(p (1-p)/(δ)
2, Where
Z = 1.96 (corresponding to 5% significance level)
n = number of companies in the study
δ = the detectable difference or design effect.
P= Proportion of companies with positive perception towards business (assumed to
be 0.50 since the researcher had no idea of perceptions in this population).
Using this information the sample size required was 385 ECs, but since not all would
respond to the questionnaire this necessitated adjustments for attrition rates. It was
anticipated that 30% would not respond to the questionnaires, hence an adjustment for
these gave a required minimum sample size of 501 ECs in Gauteng.
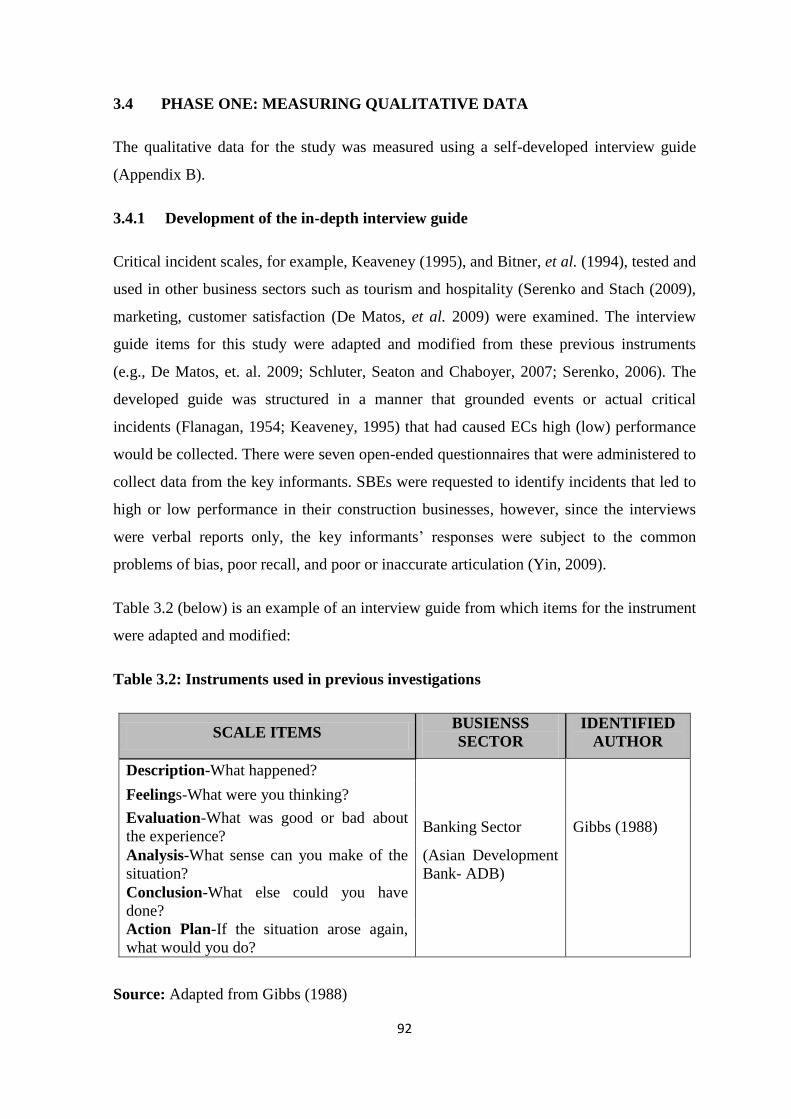
92
3.4 PHASE ONE: MEASURING QUALITATIVE DATA
The qualitative data for the study was measured using a self-developed interview guide
(Appendix B).
3.4.1 Development of the in-depth interview guide
Critical incident scales, for example, Keaveney (1995), and Bitner, et al. (1994), tested and
used in other business sectors such as tourism and hospitality (Serenko and Stach (2009),
marketing, customer satisfaction (De Matos, et al. 2009) were examined. The interview
guide items for this study were adapted and modified from these previous instruments
(e.g., De Matos, et. al. 2009; Schluter, Seaton and Chaboyer, 2007; Serenko, 2006). The
developed guide was structured in a manner that grounded events or actual critical
incidents (Flanagan, 1954; Keaveney, 1995) that had caused ECs high (low) performance
would be collected. There were seven open-ended questionnaires that were administered to
collect data from the key informants. SBEs were requested to identify incidents that led to
high or low performance in their construction businesses, however, since the interviews
were verbal reports only, the key informants’ responses were subject to the common
problems of bias, poor recall, and poor or inaccurate articulation (Yin, 2009).
Table 3.2 (below) is an example of an interview guide from which items for the instrument
were adapted and modified:
Table 3.2: Instruments used in previous investigations
SCALE ITEMS BUSIENSS
SECTOR
IDENTIFIED
AUTHOR
Description-What happened?
Feelings-What were you thinking?
Evaluation-What was good or bad about
the experience? Banking Sector Gibbs (1988)
Analysis-What sense can you make of the
situation?
(Asian Development
Bank- ADB)
Conclusion-What else could you have
done?
Action Plan-If the situation arose again,
what would you do?
Source: Adapted from Gibbs (1988)

93
Since the study focused on emerging contractors in South Africa, it was not appropriate to
replicate the previous instruments to the ECs in South Africa without adjusting them. The
guide was adjusted because the majority of the previous instruments were developed in
other countries, such as the USA, and could not fit the South African environment. Rather,
an adjusted instrument was developed to suit the context, and specifically the Gauteng
construction sector. The measurement items were all aimed at identifying the incident,
showing its influence on business performance or identifying the appropriate action. The
interview guide required data on the incidents encountered by the SBEs, so in these
questions, respondents had the opportunity to explain the critical incidents that influenced
their construction business performance. The items were checked to ensure questions were
relevant to the study.
The measures used in this study were consistent with those used by Serenko (2006),
Keaveney (1995), Bitner, et al. (1994), Kelly, Hoffman and Davis (1993), Bitner (1990),
and Flanagan (1954), which had been considered reliable in those studies. The
development of the instrument was also guided by a reflective cycle adapted from Gibbs
(1988) as indicated in Figure 3.2 (below). The reflective cycle highlighted six stages of the
process and included description of the incident, feelings that left the emerging contractor
happy or dissatisfied with the incident, evaluation, analysis, and conclusion. Finally, the
appropriate action to be taken if a similar incident recurred was considered.
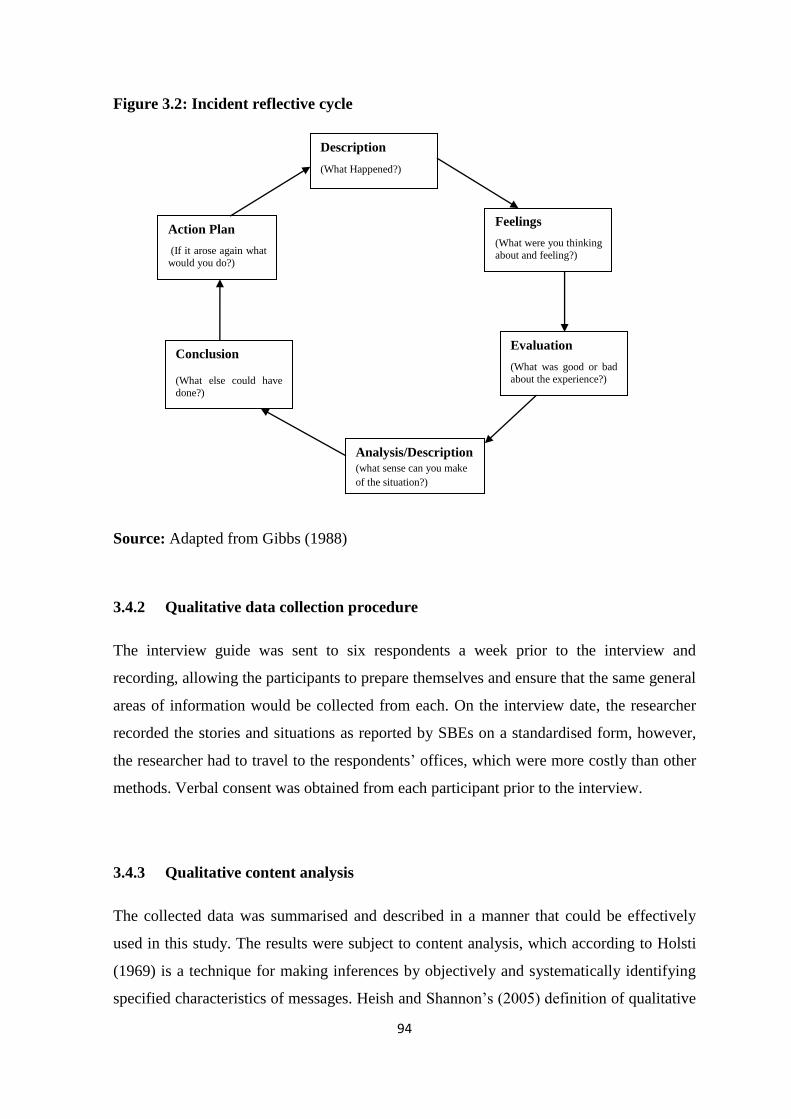
94
Figure 3.2: Incident reflective cycle
Source: Adapted from Gibbs (1988)
3.4.2 Qualitative data collection procedure
The interview guide was sent to six respondents a week prior to the interview and
recording, allowing the participants to prepare themselves and ensure that the same general
areas of information would be collected from each. On the interview date, the researcher
recorded the stories and situations as reported by SBEs on a standardised form, however,
the researcher had to travel to the respondents’ offices, which were more costly than other
methods. Verbal consent was obtained from each participant prior to the interview.
3.4.3 Qualitative content analysis
The collected data was summarised and described in a manner that could be effectively
used in this study. The results were subject to content analysis, which according to Holsti
(1969) is a technique for making inferences by objectively and systematically identifying
specified characteristics of messages. Heish and Shannon’s (2005) definition of qualitative
Description
(What Happened?)
Evaluation
(What was good or bad
about the experience?)
Feelings
(What were you thinking
about and feeling?)
Analysis/Description (what sense can you make
of the situation?)
Conclusion
(What else could have
done?)
Action Plan
(If it arose again what
would you do?)
95
content analysis as the subjective interpretation of the content of text data through the
systematic classification process of coding and identifying themes or patterns was adopted,
in order to understand meanings, themes and patterns in the particular text and knowledge
of the phenomenon under study.
3.4.4 Incident theme formulation
The analysis of data began with careful scrutiny of the accounts of the critical incidents,
which revealed certain patterns in the material that made it possible to classify the
incidents into themes. Data analysis was conducted on the basis of cognitive interest,
forming themes that emerged from the data and determining the specificity of the
categories. There were no simple rules available for theme formulation (Bitner, et al.
1994), and the quality and usability of the final product depended largely on the skill and
sophistication of the researcher (Flanagan, 1954).
3.5 PHASE TWO: MEASURING QUANTITATIVE DATA
Based on the findings obtained from the qualitative interview guide, a questionnaire survey
was developed to evaluate the perceptions of SBEs, whilst in order to highlight their
perceptions of the determinants and their impact on ECs’ performance, primary data for
the study was collected from the chief executive officers, chief financial officers,
managing directors, contract directors and marketing directors through face-to-face and
telephone interviews and self-constructed questionnaire.
A questionnaire is a widely used approach for descriptive and analytical survey to find out
the opinions and views of respondents (Enshassi, et al. 2010: 47). In section A of the
questionnaire, the demographic characteristics of respondents were requested and the
information gathered consisted of gender, age group, ethnicity, construction experience,
disability status and level of education. In section B, data on the business profile, including
location, age of business, CIDB grading, manpower size, business ownership, service
provided and construction project undertaken, was collected. The information in the first
two sections helped the researcher interpret the results of the survey, important as
statistical significance variance could be checked for all variables (demographic and
96
business profiles) that had an impact on business performance (Cooper and Schindler,
2011). The variables were measured using closed multiple choice single response and scale
questions. Scale questions were linked to a Likert scale from 1 to 5 (by which responses of
1 indicated strongly agree and 5 strongly disagree). The Likert scale is the most frequently
used variation of the summated rating scale (Cooper and Schindler, 2011), here chosen
because it is easy and quick to construct, reliable, and has a greater volume of data
collection than many other scales. The SBEs were asked to agree or disagree with each
statement and each response was given a numerical score to reflect its degree of attitudinal
favourableness. The scores were summed to measure the SBEs’ overall perception.
Specifically, the study measured the perceptions from a large number of statements, each
of which was considered relevant to the perception being measured and was believed to
reflect an agreement or disagreement with that attitude.
Section C requested data about SBE perceptions on determinants of business performance
in the construction industry. The determinants were categorised into seven major groups,
including the financial factors, manpower, materials, equipment and machinery, project
implementation, quality factors, strategic planning, legal and regulatory as identified from
key informants in the first phase of the research and literature. Respondents were asked the
extent to which they agreed or disagreed with the variables on the role variables had on the
performance on ECs. Section D requested information about the perception regarding
overall business performance over the previous three years, while section E measured the
perception on project performance. The last section, F, asked the respondents to highlight
their perceptions on how to improve the performance of South African ECs.
An examination of literature did not show any acceptable instrument (questionnaire) that
could be adopted in this study to assess the perceptions of SBEs on the determinants of
performance in the construction industry, thus the researcher constructed an instrument
based on the variables and constructs from the insight of key informants and the reviewed
literature. As far as possible, valid and reliable items were sourced from key informants
and previous studies, then contextualised for the present study. A construct is an image or
abstract idea specifically invented for given research, while a variable is used as a
synonym for construct or the property being studied (Cooper and Schindler, 2011).

97
3.5.1 Demographics
The demographic characteristics used in this study comprised gender, age, ethnicity,
disability status, business profile, and educational level, age of business, business location,
functional role and nature of service provided. This data was collected in order to compile
a respondent profile which conforms to the specific parameters of the study. These items
were measured using closed multiple choice single response questions. This section
incorporated nominal, ordinal and interval data type, as show in Table 3.3 (below):
Table 3.3 Demographic characteristics
Level of
measurement
Demographic
characteristics Category
Dummy
Variables
Gender
Female 1
Nominal Male 2
Disability
Disabled 1
Not disabled 2
Age
Less than 20
years 1
21 – 29
years 2
30 – 39
years 3
40 – 49
years 4
+ 50 years 5
Ordinal
Education
No Formal 1
Pre-Matric 2
Matric 3
Post Matric 4
Degree
Level and
above
5
Source: Own compilation
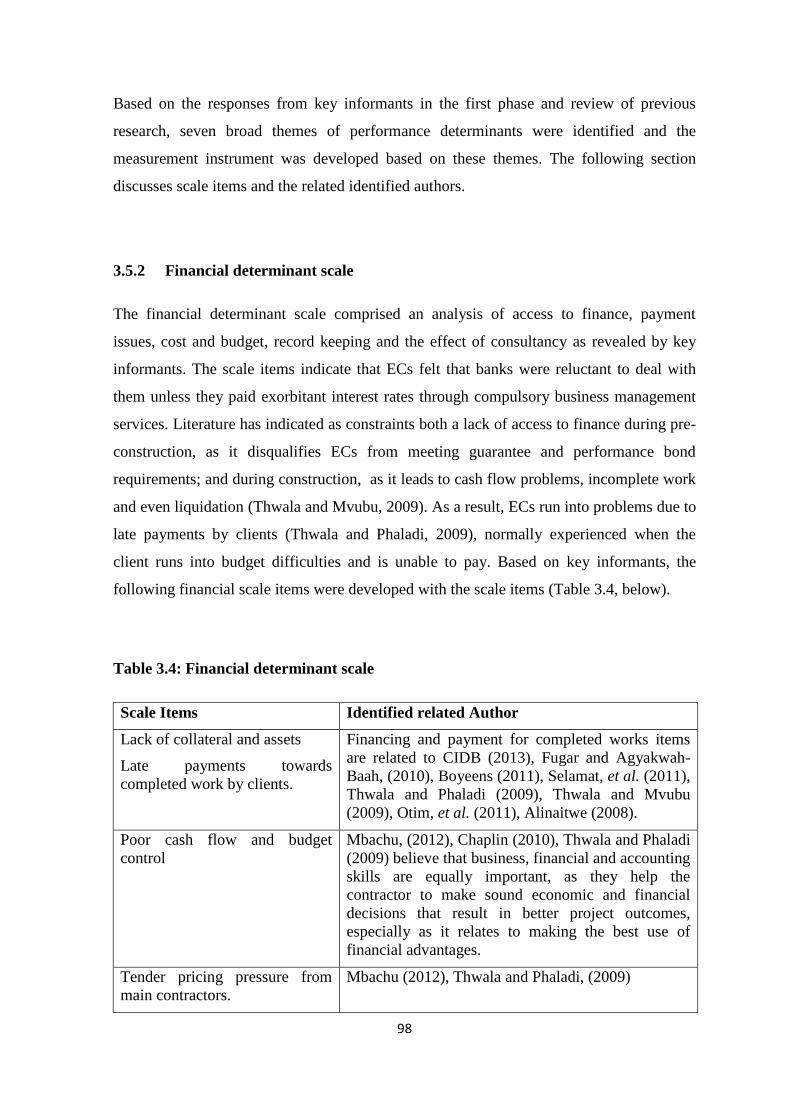
98
Based on the responses from key informants in the first phase and review of previous
research, seven broad themes of performance determinants were identified and the
measurement instrument was developed based on these themes. The following section
discusses scale items and the related identified authors.
3.5.2 Financial determinant scale
The financial determinant scale comprised an analysis of access to finance, payment
issues, cost and budget, record keeping and the effect of consultancy as revealed by key
informants. The scale items indicate that ECs felt that banks were reluctant to deal with
them unless they paid exorbitant interest rates through compulsory business management
services. Literature has indicated as constraints both a lack of access to finance during pre-
construction, as it disqualifies ECs from meeting guarantee and performance bond
requirements; and during construction, as it leads to cash flow problems, incomplete work
and even liquidation (Thwala and Mvubu, 2009). As a result, ECs run into problems due to
late payments by clients (Thwala and Phaladi, 2009), normally experienced when the
client runs into budget difficulties and is unable to pay. Based on key informants, the
following financial scale items were developed with the scale items (Table 3.4, below).
Table 3.4: Financial determinant scale
Scale Items Identified related Author
Lack of collateral and assets
Late payments towards
completed work by clients.
Financing and payment for completed works items
are related to CIDB (2013), Fugar and Agyakwah-
Baah, (2010), Boyeens (2011), Selamat, et al. (2011),
Thwala and Phaladi (2009), Thwala and Mvubu
(2009), Otim, et al. (2011), Alinaitwe (2008).
Poor cash flow and budget
control
Mbachu, (2012), Chaplin (2010), Thwala and Phaladi
(2009) believe that business, financial and accounting
skills are equally important, as they help the
contractor to make sound economic and financial
decisions that result in better project outcomes,
especially as it relates to making the best use of
financial advantages.
Tender pricing pressure from
main contractors.
Mbachu (2012), Thwala and Phaladi, (2009)
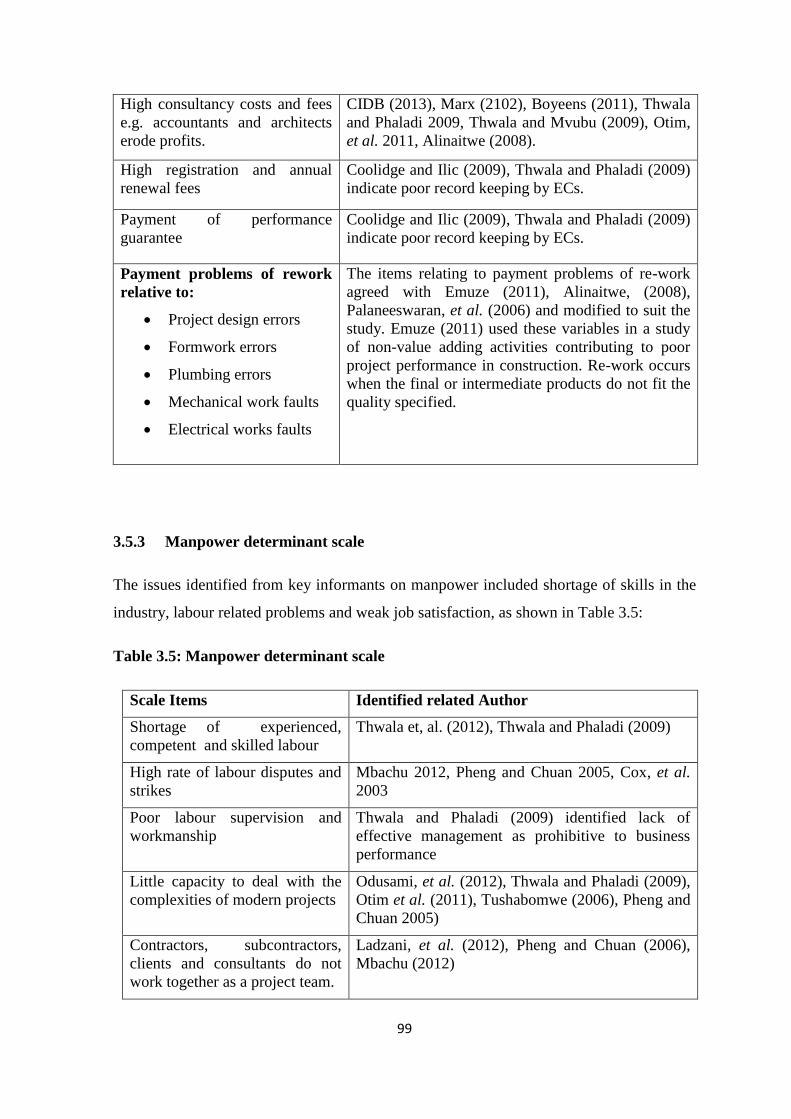
99
High consultancy costs and fees
e.g. accountants and architects
erode profits.
CIDB (2013), Marx (2102), Boyeens (2011), Thwala
and Phaladi 2009, Thwala and Mvubu (2009), Otim,
et al. 2011, Alinaitwe (2008).
High registration and annual
renewal fees
Coolidge and Ilic (2009), Thwala and Phaladi (2009)
indicate poor record keeping by ECs.
Payment of performance
guarantee
Coolidge and Ilic (2009), Thwala and Phaladi (2009)
indicate poor record keeping by ECs.
Payment problems of rework
relative to:
Project design errors
Formwork errors
Plumbing errors
Mechanical work faults
Electrical works faults
The items relating to payment problems of re-work
agreed with Emuze (2011), Alinaitwe, (2008),
Palaneeswaran, et al. (2006) and modified to suit the
study. Emuze (2011) used these variables in a study
of non-value adding activities contributing to poor
project performance in construction. Re-work occurs
when the final or intermediate products do not fit the
quality specified.
3.5.3 Manpower determinant scale
The issues identified from key informants on manpower included shortage of skills in the
industry, labour related problems and weak job satisfaction, as shown in Table 3.5:
Table 3.5: Manpower determinant scale
Scale Items Identified related Author
Shortage of experienced,
competent and skilled labour
Thwala et, al. (2012), Thwala and Phaladi (2009)
High rate of labour disputes and
strikes
Mbachu 2012, Pheng and Chuan 2005, Cox, et al.
2003
Poor labour supervision and
workmanship
Thwala and Phaladi (2009) identified lack of
effective management as prohibitive to business
performance
Little capacity to deal with the
complexities of modern projects
Odusami, et al. (2012), Thwala and Phaladi (2009),
Otim et al. (2011), Tushabomwe (2006), Pheng and
Chuan 2005)
Contractors, subcontractors,
clients and consultants do not
work together as a project team.
Ladzani, et al. (2012), Pheng and Chuan (2006),
Mbachu (2012)
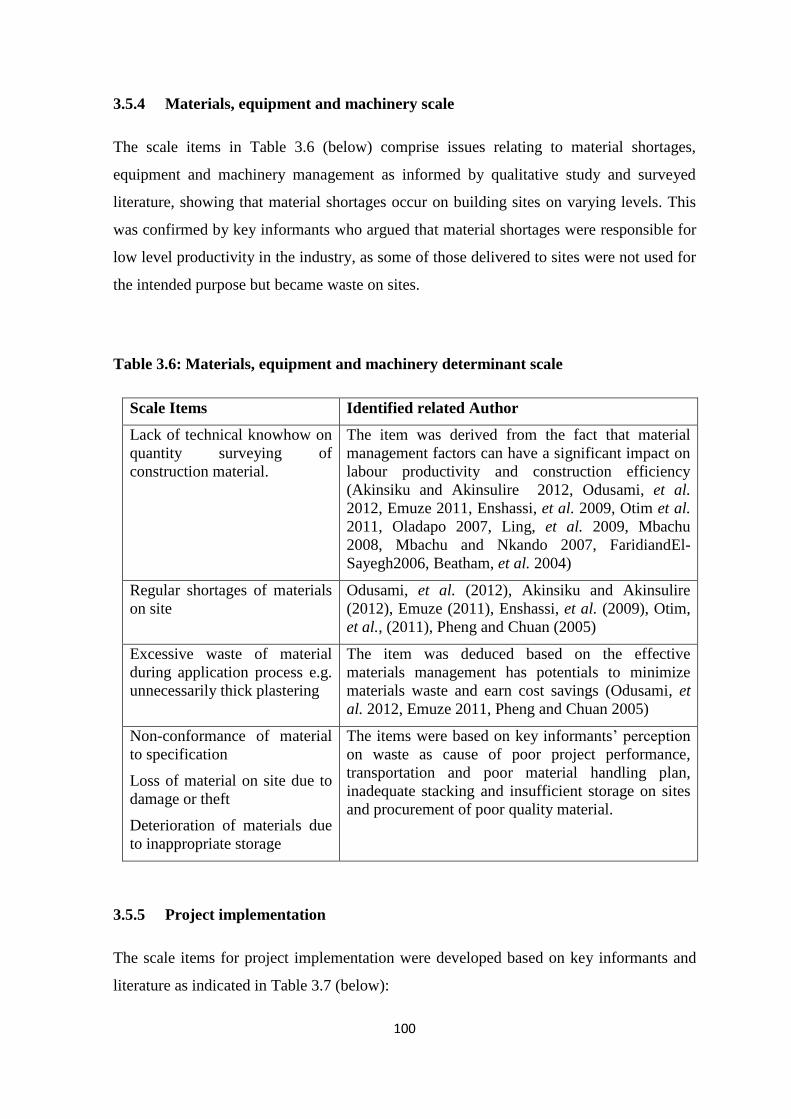
100
3.5.4 Materials, equipment and machinery scale
The scale items in Table 3.6 (below) comprise issues relating to material shortages,
equipment and machinery management as informed by qualitative study and surveyed
literature, showing that material shortages occur on building sites on varying levels. This
was confirmed by key informants who argued that material shortages were responsible for
low level productivity in the industry, as some of those delivered to sites were not used for
the intended purpose but became waste on sites.
Table 3.6: Materials, equipment and machinery determinant scale
Scale Items Identified related Author
Lack of technical knowhow on
quantity surveying of
construction material.
The item was derived from the fact that material
management factors can have a significant impact on
labour productivity and construction efficiency
(Akinsiku and Akinsulire 2012, Odusami, et al.
2012, Emuze 2011, Enshassi, et al. 2009, Otim et al.
2011, Oladapo 2007, Ling, et al. 2009, Mbachu
2008, Mbachu and Nkando 2007, FaridiandEl-
Sayegh2006, Beatham, et al. 2004)
Regular shortages of materials
on site
Odusami, et al. (2012), Akinsiku and Akinsulire
(2012), Emuze (2011), Enshassi, et al. (2009), Otim,
et al., (2011), Pheng and Chuan (2005)
Excessive waste of material
during application process e.g.
unnecessarily thick plastering
The item was deduced based on the effective
materials management has potentials to minimize
materials waste and earn cost savings (Odusami, et
al. 2012, Emuze 2011, Pheng and Chuan 2005)
Non-conformance of material
to specification
Loss of material on site due to
damage or theft
Deterioration of materials due
to inappropriate storage
The items were based on key informants’ perception
on waste as cause of poor project performance,
transportation and poor material handling plan,
inadequate stacking and insufficient storage on sites
and procurement of poor quality material.
3.5.5 Project implementation
The scale items for project implementation were developed based on key informants and
literature as indicated in Table 3.7 (below):

101
Table 3.7: Project implementation scale
Scale Items Identified related Author
Poor planning techniques and
failure to identify critical
activities
Otim, et al. (2011), Oladapo (2007), Chitkara
(2004), Pheng and Chuan, (2005)
Lack of project coordination
among parties
Otim, et al. (2011), Oladapo (2007), Chitkara
(2004), Pheng and Chuan (2005)
Unplanned increase in the scope
of work from the client
Marx (2012), Otim, et al. (2011), Oladapo (2007),
Chitkara (2004), Pheng and Chuan (2005)
Unrealistic construction planned
time by clients
Marx (2012), Ameh (2011), Otim, et al. (2011),
Oladapo (2007), Chitkara (2004), Pheng and Chuan
(2005)
Failure to commence project on
time due to main contractor
delays
Marx (2012), Otim, et al. (2011), Oladapo (2007),
Chitkara (2004), Pheng and Chuan, (2005)
Omissions in the construction
plans
Sunday (2010), Otim, et al. (2011), Chitkara
(2004), Ssegawa, et al. (2002), Hanna, et al. (2002)
Time spent waiting for samples,
materials approval, site
inspection, approval of quality
control tests and results
Otim, et al. (2011), Oladapo (2007), Chitkara
(2004), Pheng and Chuan (2005) noted that idle
time in construction caused by the lack of
synchronisation, materials approval and material
flow.
3.5.6 Quality determinants scale
The items for quality scale were based on key informants’ perceptions which indicate
change of scope, dissatisfaction by client which result from poor quality works and delays
to commission some stages of work, low productivity, delayed approvals by the authorities
and failure to procure materials and labour on time. These were some of the causes of
project failure which translates into poor business performance, as indicated in Table 3.8
(below).
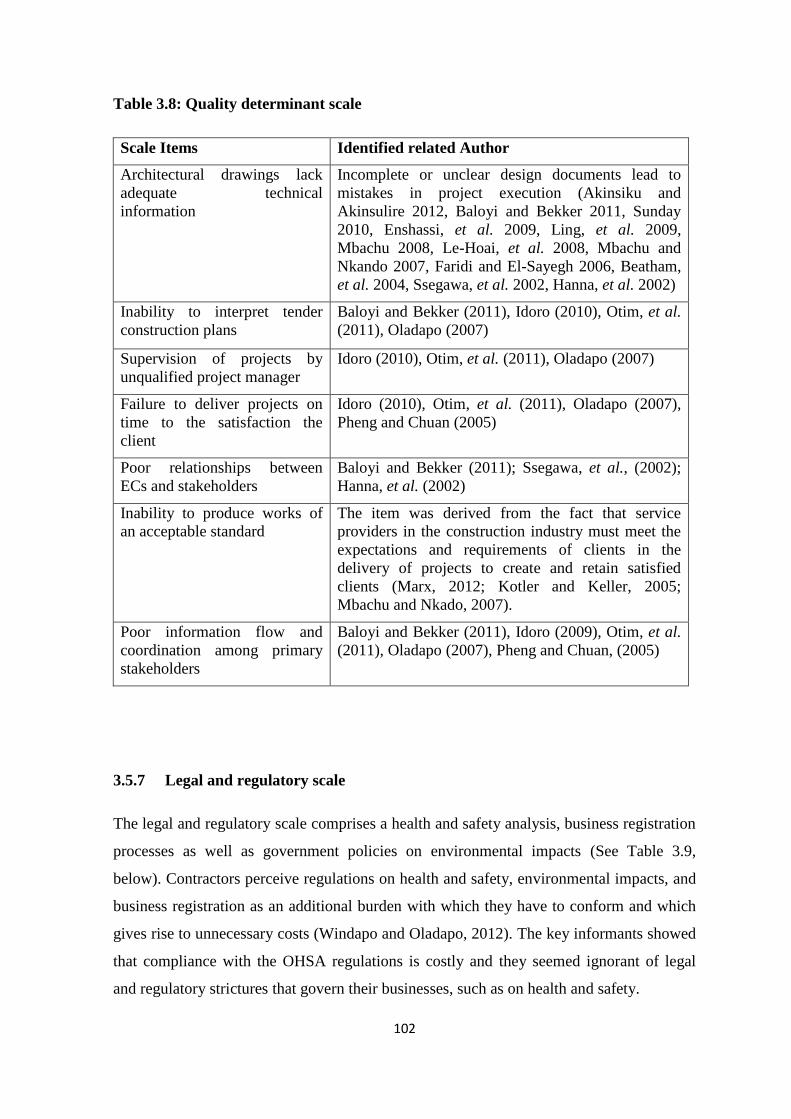
102
Table 3.8: Quality determinant scale
Scale Items Identified related Author
Architectural drawings lack
adequate technical
information
Incomplete or unclear design documents lead to
mistakes in project execution (Akinsiku and
Akinsulire 2012, Baloyi and Bekker 2011, Sunday
2010, Enshassi, et al. 2009, Ling, et al. 2009,
Mbachu 2008, Le-Hoai, et al. 2008, Mbachu and
Nkando 2007, Faridi and El-Sayegh 2006, Beatham,
et al. 2004, Ssegawa, et al. 2002, Hanna, et al. 2002)
Inability to interpret tender
construction plans
Baloyi and Bekker (2011), Idoro (2010), Otim, et al.
(2011), Oladapo (2007)
Supervision of projects by
unqualified project manager
Idoro (2010), Otim, et al. (2011), Oladapo (2007)
Failure to deliver projects on
time to the satisfaction the
client
Idoro (2010), Otim, et al. (2011), Oladapo (2007),
Pheng and Chuan (2005)
Poor relationships between
ECs and stakeholders
Baloyi and Bekker (2011); Ssegawa, et al., (2002);
Hanna, et al. (2002)
Inability to produce works of
an acceptable standard
The item was derived from the fact that service
providers in the construction industry must meet the
expectations and requirements of clients in the
delivery of projects to create and retain satisfied
clients (Marx, 2012; Kotler and Keller, 2005;
Mbachu and Nkado, 2007).
Poor information flow and
coordination among primary
stakeholders
Baloyi and Bekker (2011), Idoro (2009), Otim, et al.
(2011), Oladapo (2007), Pheng and Chuan, (2005)
3.5.7 Legal and regulatory scale
The legal and regulatory scale comprises a health and safety analysis, business registration
processes as well as government policies on environmental impacts (See Table 3.9,
below). Contractors perceive regulations on health and safety, environmental impacts, and
business registration as an additional burden with which they have to conform and which
gives rise to unnecessary costs (Windapo and Oladapo, 2012). The key informants showed
that compliance with the OHSA regulations is costly and they seemed ignorant of legal
and regulatory strictures that govern their businesses, such as on health and safety.

103
Table 3.9: Legal and regulatory determinant scale
Scale Items Identified related Author
High safety training costs Windapo and Oladapo (2012), Emuze (2011),
Kheni, et al. (2010)
High safety induction costs Sidumedi (2009), Emuze (2011), Windapo (2011)
High costs on medical
requirements
Hapanova, et al. (2006), Windapo and Oladapo
(2012), Kheni, et al. (2010)
High costs on personal
protection requirements
Windapo and Oladapo (2012), Emuze (2011),
Windapo (2011), Kheni, et al. (2010)
Expensive first aid
requirements
Emuze, (2011) Windapo (2011), Kheni, et al. (2010)
Attitudes of public officials
adversely affect business
performance.
Hapanova, et al., (2006), Sidumedi (2009), Greyling
(2012), Coolidge and Ilic (2009)
Cumbersome registration
requirements and stringent
government procedures.
Greyling (2012), Coolidge and Ilic (2009), Emuze
(2011), Windapo (2011), Windapo and Oladapo
(2012)
Government policies in the
construction industry do not
promote ECs.
This item was based on government policies that ECs
are required to comply with Greyling (2012)
The grading policies in the
construction industry are
prohibitive for business
growth and access to market
This item was adapted from Greying (2012) who
noted that concerns were raised regarding the grading
system, which many feel excludes emerging
contractor from participating in larger tenders.
3.5.8 Strategic planning
The key informants indicated that ECs did not engage in systematic business planning,
which in a small business is often done on an ad hoc, problem-solving basis and frequently
on the owner’s mental activity. He or she usually relies on advice from family members
and friends who may also lack skill and experience. Against this background,
measurement items for this section were made as indicated in Table 3.10 (below):

104
Table 3.10: Strategic planning scale
Scale Items Identified related Author
Attention given to long term vision
Warszawski (1996); Thompson and
Strickland (2005), Adendorff, Appels and
Botha, (2011); Porter (1990); O’Regan
and Ghobadian (2004); Robinson, (1982).
Attention given to business objectives
Attention given to management
practices
Attention given to strategic planning
Attention given to stakeholders’ interest
3.5.9 Business performance scale
Subjective performance measures were used in this study in order to gauge the personal
evaluation of SBEs on their personal judgements of how their businesses were performing.
Performance was measured by the following items as shown in Table 3.11 (below):
Table 3.11: Project performance scale
Scale Items Identified author
Comparing recent and previous sales
Yang, et al., (2010); Sillars, (2010);
CIDB register
Sales stability over the last three years
Profitability
Sales growth compared to competitors
Owner satisfaction
Market share growth
3.5.10 Project performance scale
Qualitative performance indicators were used to assess project performance because it was
assumed SBEs would not be keen to disclose their projects’ performance quantitatively.
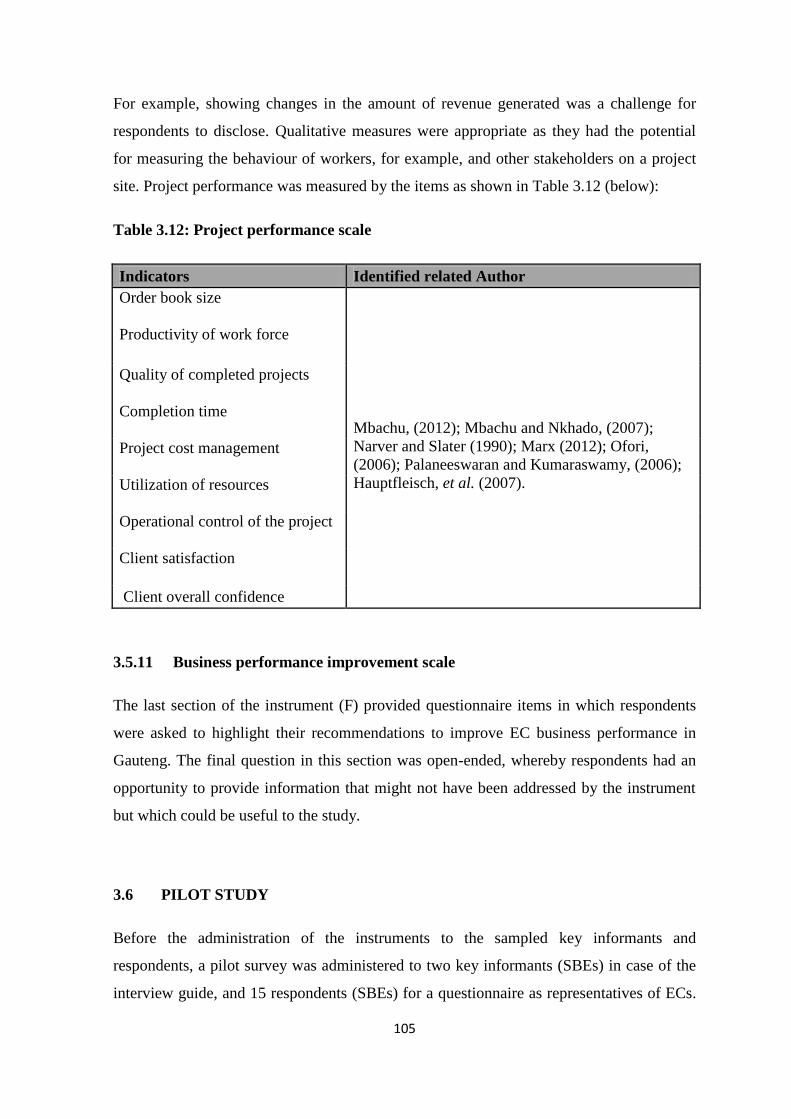
105
For example, showing changes in the amount of revenue generated was a challenge for
respondents to disclose. Qualitative measures were appropriate as they had the potential
for measuring the behaviour of workers, for example, and other stakeholders on a project
site. Project performance was measured by the items as shown in Table 3.12 (below):
Table 3.12: Project performance scale
Indicators Identified related Author
Order book size
Productivity of work force
Mbachu, (2012); Mbachu and Nkhado, (2007);
Narver and Slater (1990); Marx (2012); Ofori,
(2006); Palaneeswaran and Kumaraswamy, (2006);
Hauptfleisch, et al. (2007).
Quality of completed projects
Completion time
Project cost management
Utilization of resources
Operational control of the project
Client satisfaction
Client overall confidence
3.5.11 Business performance improvement scale
The last section of the instrument (F) provided questionnaire items in which respondents
were asked to highlight their recommendations to improve EC business performance in
Gauteng. The final question in this section was open-ended, whereby respondents had an
opportunity to provide information that might not have been addressed by the instrument
but which could be useful to the study.
3.6 PILOT STUDY
Before the administration of the instruments to the sampled key informants and
respondents, a pilot survey was administered to two key informants (SBEs) in case of the
interview guide, and 15 respondents (SBEs) for a questionnaire as representatives of ECs.

106
This was done to check the instruments to ensure the face and content validity in terms of
assessing the degree to which a construct had been accurately translated into an
operationalisation (Hua et al., 2007).
SBEs representing ECs in the sample were contacted through email addresses as provided
in the database. The questionnaire was accompanied by a covering letter (Appendix A)
that explained the purpose of the study to the SBEs. General instructions on completing the
questionnaire and the importance of completing all questions were included.
Confidentiality of responses was assured. Contact details were provided on the covering
letter, offering the business owner the opportunity to contact the researcher in the event of
any queries or problems that might arise. The covering letter requested the SBE return the
completed questionnaire via email. Two weeks after the initial email, a follow-up email
was sent, reminding the respondents of the study. However, irrespective of the motivation
letter, the response rate achieved from the email strategy was very low since
communication was restricted to the questionnaire and the covering letter. This indicated
that executives did not answer such a long questionnaire on an email, hence, the strategy
was dropped.
Structured telephonic interviews were conducted with the sampled respondents, considered
appropriate since a detailed contact list of all respondents had been provided by CIDB with
correct telephone numbers. However, the statements and performance indicators were too
numerous to obtain a good response. After at least 20 questions of that kind, some
respondents shut down and did not want to cooperate any further. Comments such as,
“Sorry I don’t have time to go through your formal questionnaire but the above may find
more relevance” were received. The response rate was low, indicating that the telephonic
strategy alone would not be effective for this study and the face-to-face strategy was then
introduced to augment the telephonic strategy.
Respondents were able to ask the interviewer questions for clarity, and their valuable
comments were used to revise the research instruments. The second pilot test was then
resent to the respondents, and based on the feedback minor amendments were made to the
instruments to remove any ambiguities and discrepancies. The comments received were
positive and no major changes were made. This was carried out to ensure the clarity and
relevance of the instruments.
107
3.7 DATA COLLECTION PROCEDURE (QUANTITATIVE DATA)
The CIDB management provided contact information, including email addresses,
telephone numbers and physical addresses for the Grade 2 ECs in Gauteng. The contact
person whose name appeared on the CIDB database was telephoned to make an
appointment to interview the chief executive of the business. A letter explaining the
purpose of the study (Appendix A) was forwarded to the contact person by way of
electronic mail and tele-fax. Follow up was made to confirm the receipt of the letter and
also to establish when the interview would be obtained. Also, a letter of identification was
obtained from the Graduate School of Business Leadership of Unisa (Appendix G) and the
CIDB, which served to confirm to the respondents that the study was for academic
purposes. An approval letter to use the CIDB database was received to conduct the study
on registered contractors (Appendix E).
After the approval was obtained, the researcher and assistant researchers visited the
business. Some executives preferred to be interviewed by telephone and interviews were
conducted as such. The purpose of the study and the statement of voluntary participation
were explained to the executive and verbal informed consent obtained from each
interviewee prior to conducting the interviews. However, it was not simple as the chief
executive in some cases was very busy or not available. In such cases, other executives in
the population under study, such as financial executives, marketing executives and contract
executives, were interviewed. The data was collected using both telephonic and face-to-
face interviews as a way of optimising the response rate. According to Bowling (2005:
286), face-to-face interviews are under certain circumstances a more suitable method of
data collection than the alternatives, such as electronic and self-completed questionnaires.
However, face-to-face interviews placed a large burden on the budget as the researcher and
research assistants had to drive around Gauteng conducting interviews.
Four interviewers were recruited, trained, briefed and assigned to the City of Tshwane,
City of Johannesburg, Ekurhuleni, West Rand and Sedibeng metropolitan Cities as
individuals. The interviewers were unemployed graduates who carried out the interviews
during the months of August to December 2013. Interviews were conducted in the
respondent’s workplaces to ensure each participant’s comfort. All interviews were
conducted under the consistent supervision of the researcher. A minimum of 25% back-
checking on each interviewer’s work was conducted to ensure accuracy and consistency, to

108
prevent falsification of information and to verify sampling accuracy. Interviewers clarified
the questions for respondents if they were requested to do so.
3.8 ANALYTICAL TECHNIQUES OF QUANTITATIVE DATA ANALYSIS
A number of techniques were employed in quantitative data analysis.
3.8.1 Descriptive statistics
Descriptive statistics were used to tabulate the demographic profile of the respondents and
business profile. The data analysis was conducted using STATA version 12. To assess and
validate the questionnaire as a tool to measure ECs’ performance, Item Analysis of
Questionnaire was done using Cronbach alpha.
3.8.2 Reliability
The questionnaire had subscales designed to measure the various factors that were
hypothesised as affecting EC performance. As the responses of different SBEs would be
used to draw conclusions about their businesses’ performance, the subscales were to have
good reliability and validity. Reliability in this case was assessed through internal
consistency of the subscales. Coefficient alpha (Cronbach’s Alpha) gave an estimate of the
reliability of the scale, i.e., the proportion of the total variance in the scale scores that was
not the result of random errors in measurement (Bryman and Bell, 2007). The subscales
were also tested for validity, thus the extent to which they successfully measured the
construct. Item analysis was used to clean up the subscales, item by item, in order to
maximise reliability and validity. The process in STATA version 12 involved four steps:
1. Descriptive analysis to establish how evenly distributed were subjects’ responses
among the response choices;
2. Inter-correlation and item-total correlation analysis to check how well an item was
correlated with other items in the subscale and with the total score of the subscale
excluding the item itself;
109
3. Cronbach’s alpha calculation, which assessed whether an item contributed to subscale
internal consistency, such that Cronbach’s alpha decreased when the item was
omitted, and its removal did not increase Cronbach’s alpha;
4. The last two steps were repeated without the item which met the criteria to be
dropped.
After item analysis only the good items were retained in each subscale for further analysis.
3.8.3 Validity of the measuring instrument
It was important to ensure the instruments used in this study were valid, that is an
instrument measures what it is intended to measure, while reliability is concerned with the
ability of an instrument to measure consistently (Bassioni et al. 2008: 29). Although the
reliability of an instrument is closely associated with its validity an instrument cannot be
valid unless it is also reliable.
3.8.4 Content validity of the instrument
Content validity of the construct was established by developing scale items that depicted
the hypothesised seven components of performance determinants based on the perceptions
of the six key informants. After the development of the instrument, the scale items were
given to the key informants who rated the scale for consistency with ECs business
performance, and additional items were recommended for inclusion. The items that were
considered to have high consistency with EC business performance were included in the
instrument. Content validity was also demonstrated by reviewing previous studies in the
subject area and examining the phenomenon from different theoretical perspectives and
disciplines. The evaluation of the instruments in the pilot study also ensured that the
instrument provided adequate coverage of the topic by pilot testing the instruments.
110
3.8.5 Construct validity of the instrument
Construct validity was ensured by using confirmatory factor analysis to explore individual
survey items that contributed to an overall construct measurement. Some of the
questionnaire items were adapted from existing instruments used in similar studies.
Criterion-related validity which measures whether the instrument accurately predicts
(predictive validity - the degree to which scores or test predict later behaviour) or
diagnoses (concurrent validity-refers to the correlation between scores on a scale and
scores on another scale or measure of established validity given at about the same time).
Concurrent and predictive validity are often referred together as ‘criterion related validity’.
3.8.6 Regression analysis
To assess the perceived determinants of EC performance (Project and business) in
Gauteng, STATA version 12 was used to carry out univariate analysis and multiple
regression analysis, the benefits of which included its ability to provide descriptive
statistics, cross-tabulation, frequencies, prediction for numerical outcomes and prediction
for identifying groups, and factor analysis. Univariate analysis was conducted to identify
the perceived factors that significantly affect EC performance. Also, Multiple linear
regressions of the various hypothesised predictors against the outcome variable, EC
performance was carried out in order to control for any potential confounders and to come
up with a linear model that related all the significant factors to the outcome, EC
performance. This was in line with Hair et al. (2006), who state that before conducting a
multiple regression analysis to assess the relationships between the variables the number of
factors and items loading onto each must be known. Post-estimation diagnostic tests were
also carried out after the model was fitted. Where appropriate, correlation analysis and the
chi-square test of association were used to investigate relationships between variables.
3.9 CONTROL OF BIAS
Triangulation was used in both collection and analyses of data in order to come up with
synthesised results. Most information in this thesis is drawn from archival data, that is,
materials from government publications (CIDB quarterly and annual reviews), journals
111
and articles, press reports and online documents. Primary data from structured
questionnaire with construction SBEs complemented these sources. The rationale behind
triangulation was that it helped overcome deficiencies inherent in one method (Denzin and
Lincoln, 2008), serving as a strategy for increasing the validity of research findings
(Mathison, 1988:13). This made it possible to check results from more than one viewpoint
and to view situations from a different angle. Patton (2002) advocates the use of
triangulation as it strengthens a study by combining methods. The four forms of
triangulation proposed by Denzin (2008) were used:
1. Data Triangulation: In this study the SBEs and archival data were utilised to
gather data primary and secondary data respectively. This enabled different data
sets to be collected at different times.
2. Investigator triangulation: The researcher and research assistance were
participants in data collection for the study.
3. Theoretical triangulation: Many theoretical frameworks from strategic
management, construction management and project management were used in
interpreting data.
4. Methodological triangulation: The study incorporated more than one method
whereby both quantitative and qualitative approaches were used. Specifically, face-
to-face interviews were conducted, with a critical incident technique also used.
3.10 ETHICAL CONSIDERATIONS OF THE STUDY
Ethical issues relating to the validity of the research, harms and benefits, confidentiality
and anonymity were considered. In order to ensure that respondents were not harmed or
suffered adverse consequences from the research activities, all gave verbal consent to
participate in this study. No individuals became a subject of this research unless he or she
had given informed consent to participate. There was no pressure or inducement of any
kind applied to encourage participation in this research. Verbal consent was obtained from
all respondents and written consent avoided because in some situations it frightened the
respondents. They were informed about the purpose of the research, the length of
participation, potential benefits and harms and communication of the results of the study.
112
Participation in this study did not expose participants to an invasion of their privacy and
their anonymity was and shall be maintained. Everything that was learnt about participants
during their involvement in the study was maintained in the strictest confidence.
Participants were not placed in any danger as they were protected from physical harm,
discomfort, pain, embarrassment and work-related harm. This was ensured by keeping
strictly confidential the identity of SBEs from whom information was obtained. At the end
of the research, any information that revealed the identity of the respondents was
destroyed, unless the individual concerned had consented in writing to its inclusion
beforehand. No information revealing the identity of any individual was included in the
final report or in any other communication prepared in the course of the research.
3.11 CHAPTER CONCLUSION
This chapter has provided a perspective on the research design, the mixed method
approach, population, sample size and its selection, research instruments and how they
were constructed. The pilot study as well as data collection method were described,
including procedures followed in data analysis. Validity and reliability as well as
elimination of bias and ethical considerations were dealt with in this chapter.
The next chapter presents the empirical findings of the study.

113
CHAPTER FOUR
PRESENTATION OF EMPIRICAL FINDINGS
4.1 CHAPTER INTRODUCTION
This chapter presents the empirical findings from the interviews conducted with the Small
Business Executives (SBEs) in the construction industry and the results are presented in
two Parts (A to B). The critical incident technique (CIT) was used to identify various
incidents encountered by SBEs in the industry, which were then analysed to reveal broader
patterns. The advantage of using CIT was that it helped to identify new factors that could
have been potentially missed by other inquiry methods. Based on the in-depth interviews
conducted, the research questions were addressed.
4.2 PART A - QUALITATIVE RESULTS
Qualitative data were obtained from the open-ended questions as reflected in the interview
guide (Appendix B). The responses recorded are presented in this section.
4.2.1 Profile of key informants
In order to understand the incidents that were encountered by the SBEs in the construction
industry, a total of six SBEs were interviewed. However, it should be stated that some of
the respondents were reluctant to disclose full information for fear of victimisation. The
profile of the key informants was assessed and the results indicated 17% of the
respondents were female, participants had an average age of 44 years, and 83% were
blacks. No disability status was reported. The highest level of formal education ranged
from no matrix 33%, matrix 50% to diploma level 17%. They were builders, concrete
reinforcers and general contractors. The profile of the key informants are summarised in
Table 4.1 (below):
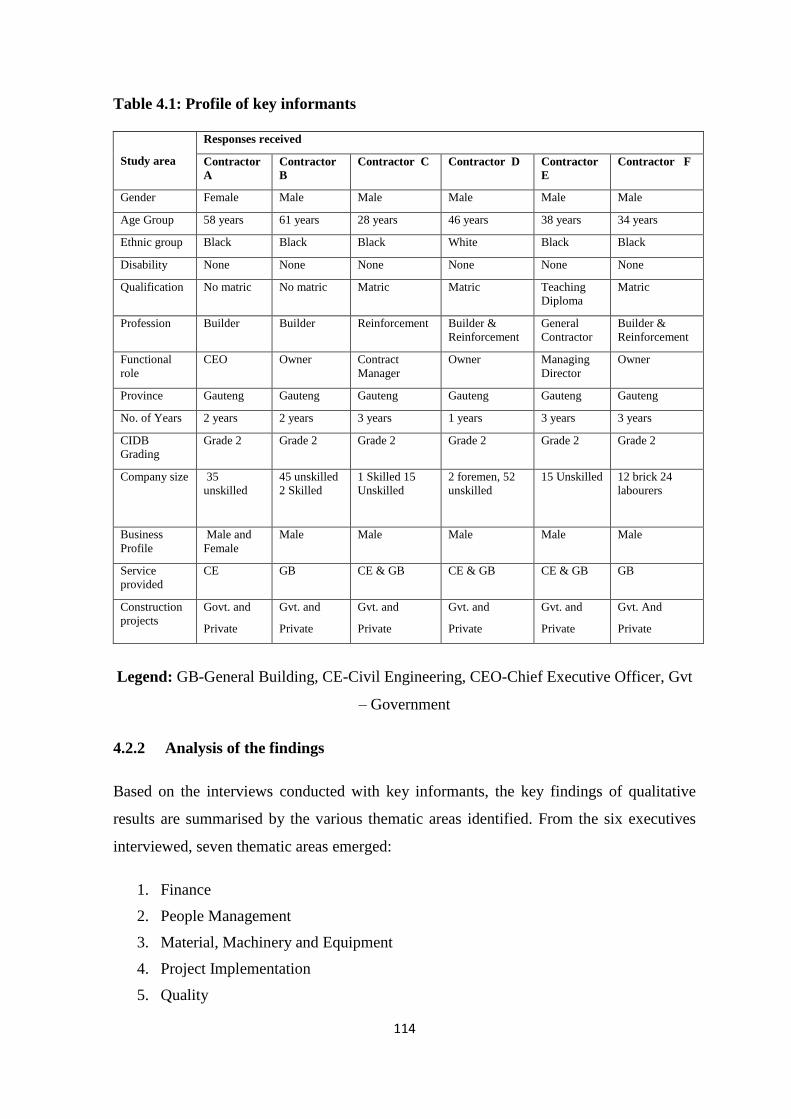
114
Table 4.1: Profile of key informants
Study area
Responses received
Contractor
A
Contractor
B
Contractor C Contractor D Contractor
E
Contractor F
Gender Female Male Male Male Male Male
Age Group 58 years 61 years 28 years 46 years 38 years 34 years
Ethnic group Black Black Black White Black Black
Disability None None None None None None
Qualification No matric No matric Matric Matric Teaching
Diploma
Matric
Profession Builder Builder Reinforcement Builder &
Reinforcement
General
Contractor
Builder &
Reinforcement
Functional
role
CEO Owner Contract
Manager
Owner Managing
Director
Owner
Province Gauteng Gauteng Gauteng Gauteng Gauteng Gauteng
No. of Years 2 years 2 years 3 years 1 years 3 years 3 years
CIDB
Grading
Grade 2 Grade 2 Grade 2 Grade 2 Grade 2 Grade 2
Company size 35
unskilled
45 unskilled
2 Skilled
1 Skilled 15
Unskilled
2 foremen, 52
unskilled
15 Unskilled 12 brick 24
labourers
Business
Profile
Male and
Female
Male Male Male Male Male
Service
provided
CE GB CE & GB CE & GB CE & GB GB
Construction
projects
Govt. and
Private
Gvt. and
Private
Gvt. and
Private
Gvt. and
Private
Gvt. and
Private
Gvt. And
Private
Legend: GB-General Building, CE-Civil Engineering, CEO-Chief Executive Officer, Gvt
– Government
4.2.2 Analysis of the findings
Based on the interviews conducted with key informants, the key findings of qualitative
results are summarised by the various thematic areas identified. From the six executives
interviewed, seven thematic areas emerged:
1. Finance
2. People Management
3. Material, Machinery and Equipment
4. Project Implementation
5. Quality

115
6. Legal and Regulatory
7. Strategic Planning
Tables 4.2 to 4.8 summarise the recorded incidents and determinants in tabular format.
They helped to identify common incidents that had impacted on ECs’ performance.
Column 1 represents the determinant category while columns 2 to 7 represent the incidents
recorded as extracted from interview scripts of Contractors A, B, C, D, E and F.
4.2.2.1 Finance
The first theme that emerged from the respondents related to financial incidents (see Table
4.2). The incidents and determinants identified by the respondents related to the following.
4.2.2.1.1 Lack of access to finance from financial institutions
There were concerns raised by the respondents regarding access to finance from financial
institutions. All SBEs felt excluded from participating in the construction sector as they
could not bid for projects without adequate financial support. The perception by the
respondents was that banks were reluctant to deal with ECs due to their poor credit rating
(Contractor A, B, C, D, E and F) and that they charged exorbitant interest rates. Contractor
A could not raise capital through the bank: “When I presented my problem of borrowing
money to the bank, my credit history was required. My collateral position was required; I
did not have any collateral and had no credit history and the bank could not extend a loan
to me.”
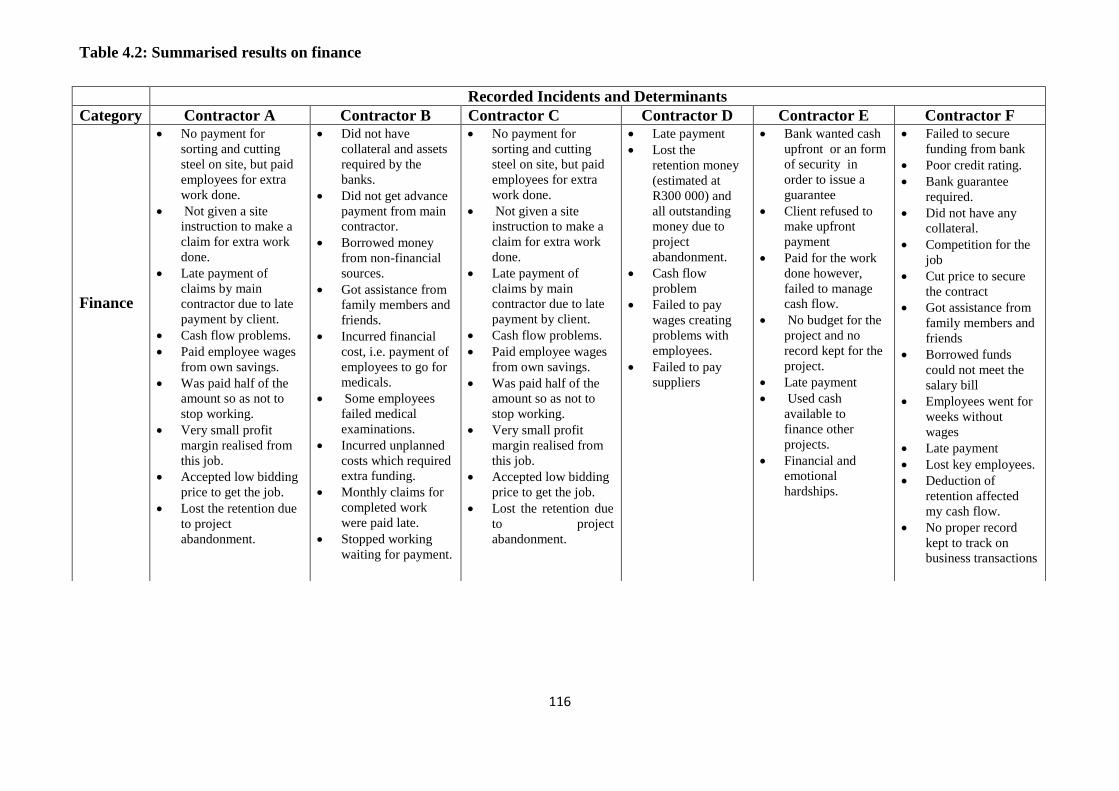
116
Table 4.2: Summarised results on finance
Recorded Incidents and Determinants
Category Contractor A Contractor B Contractor C Contractor D Contractor E Contractor F
Finance
No payment for
sorting and cutting
steel on site, but paid
employees for extra
work done.
Not given a site
instruction to make a
claim for extra work
done.
Late payment of
claims by main
contractor due to late
payment by client.
Cash flow problems.
Paid employee wages
from own savings.
Was paid half of the
amount so as not to
stop working.
Very small profit
margin realised from
this job.
Accepted low bidding
price to get the job.
Lost the retention due
to project
abandonment.
Did not have
collateral and assets
required by the
banks.
Did not get advance
payment from main
contractor.
Borrowed money
from non-financial
sources.
Got assistance from
family members and
friends.
Incurred financial
cost, i.e. payment of
employees to go for
medicals.
Some employees
failed medical
examinations.
Incurred unplanned
costs which required
extra funding.
Monthly claims for
completed work
were paid late.
Stopped working
waiting for payment.
No payment for
sorting and cutting
steel on site, but paid
employees for extra
work done.
Not given a site
instruction to make a
claim for extra work
done.
Late payment of
claims by main
contractor due to late
payment by client.
Cash flow problems.
Paid employee wages
from own savings.
Was paid half of the
amount so as not to
stop working.
Very small profit
margin realised from
this job.
Accepted low bidding
price to get the job.
Lost the retention due
to project
abandonment.
Late payment
Lost the
retention money
(estimated at
R300 000) and
all outstanding
money due to
project
abandonment.
Cash flow
problem
Failed to pay
wages creating
problems with
employees.
Failed to pay
suppliers
Bank wanted cash
upfront or an form
of security in
order to issue a
guarantee
Client refused to
make upfront
payment
Paid for the work
done however,
failed to manage
cash flow.
No budget for the
project and no
record kept for the
project.
Late payment
Used cash
available to
finance other
projects.
Financial and
emotional
hardships.
Failed to secure
funding from bank
Poor credit rating.
Bank guarantee
required.
Did not have any
collateral.
Competition for the
job
Cut price to secure
the contract
Got assistance from
family members and
friends
Borrowed funds
could not meet the
salary bill
Employees went for
weeks without
wages
Late payment
Lost key employees.
Deduction of
retention affected
my cash flow.
No proper record
kept to track on
business transactions
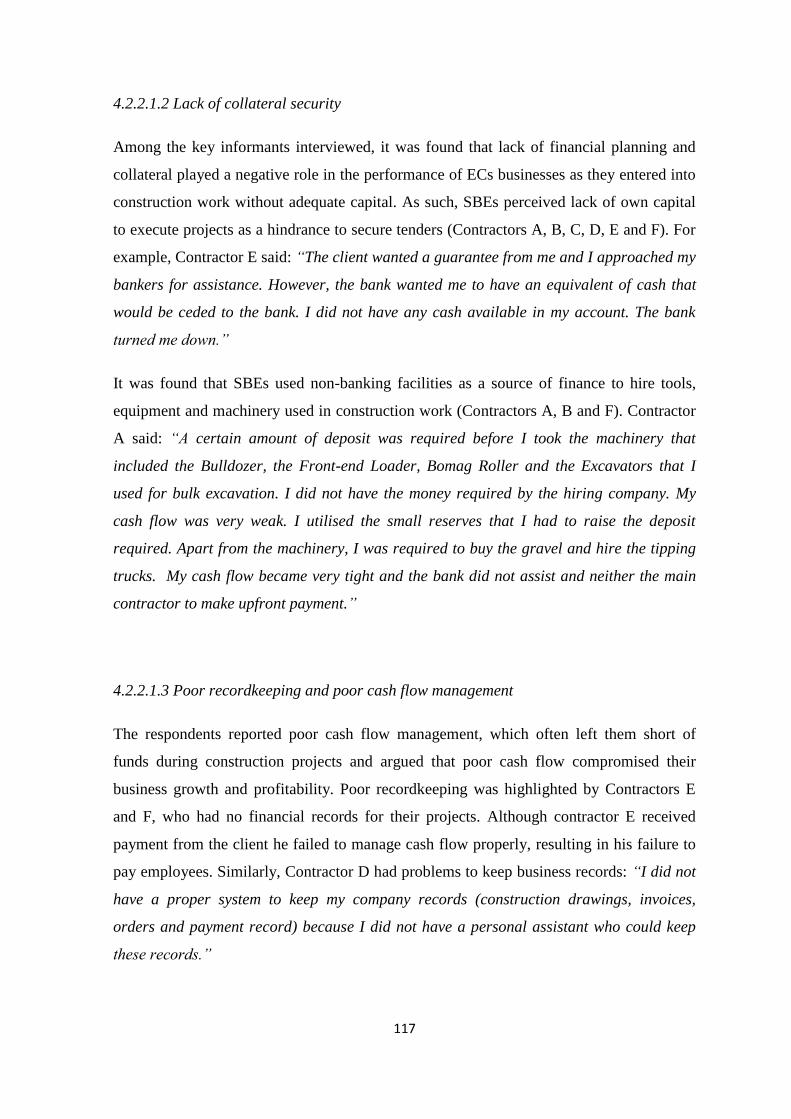
117
4.2.2.1.2 Lack of collateral security
Among the key informants interviewed, it was found that lack of financial planning and
collateral played a negative role in the performance of ECs businesses as they entered into
construction work without adequate capital. As such, SBEs perceived lack of own capital
to execute projects as a hindrance to secure tenders (Contractors A, B, C, D, E and F). For
example, Contractor E said: “The client wanted a guarantee from me and I approached my
bankers for assistance. However, the bank wanted me to have an equivalent of cash that
would be ceded to the bank. I did not have any cash available in my account. The bank
turned me down.”
It was found that SBEs used non-banking facilities as a source of finance to hire tools,
equipment and machinery used in construction work (Contractors A, B and F). Contractor
A said: “A certain amount of deposit was required before I took the machinery that
included the Bulldozer, the Front-end Loader, Bomag Roller and the Excavators that I
used for bulk excavation. I did not have the money required by the hiring company. My
cash flow was very weak. I utilised the small reserves that I had to raise the deposit
required. Apart from the machinery, I was required to buy the gravel and hire the tipping
trucks. My cash flow became very tight and the bank did not assist and neither the main
contractor to make upfront payment.”
4.2.2.1.3 Poor recordkeeping and poor cash flow management
The respondents reported poor cash flow management, which often left them short of
funds during construction projects and argued that poor cash flow compromised their
business growth and profitability. Poor recordkeeping was highlighted by Contractors E
and F, who had no financial records for their projects. Although contractor E received
payment from the client he failed to manage cash flow properly, resulting in his failure to
pay employees. Similarly, Contractor D had problems to keep business records: “I did not
have a proper system to keep my company records (construction drawings, invoices,
orders and payment record) because I did not have a personal assistant who could keep
these records.”

118
On the other hand, Contractor F indicated that he did not have a budget for the project but
was expected to comply with health and safety requirements: “I did not have money to pay
for employees’ medical examinations and had to incur unplanned extra costs for health
and safety requirements.”
4.2.2.1.4 Late payments of completed work, non-payment of rework and no advance
payment
All respondents, Contractors A, B, C, D, E and F reported incidents of late payments by
their clients. It was found that ECs were paid beyond the time stipulated in the conditions
of their contracts and perceived late payment as a major factor in the relatively weak
performance of their businesses. There were diverse reasons given for the late payments,
with some key informants citing deliberate late payment by clients, unfair withholding of
payment, and/or a ‘pay when paid’ attitude in the industry. For example, Contractor D
said: “I submitted my claims at the end of every month as agreed. Unfortunately, my
claims were not paid on time. I had to stop my employees working so that the main
contractor could feel the effect of his actions and this created misunderstandings on site.”
In the case of Contractor D, the main contractor had cash flow and financial difficulties
from the beginning, which were not known to subcontractors as this site was eventually
abandoned.
The study found that at times SBEs were paid on time, however, funds from particular
projects were diverted towards non-business related activities, resulting in failure to pay
wages and salaries. Contractor E reported: “When I got my first payment from the client, I
used the money for other things which were critical in my life as well as consumables for
other projects. I did not do cost analysis properly. After a fortnight, I failed to pay my
employees and had problems with them.” This resulted in the project being halted while
Contractor E was resolving wages and salaries with employees. Contractor E further
confirmed that his relations with the main contractor were negatively affected as a result of
this incident.

119
4.2.2.1.5 Payment of performance guarantee / retention
The study found that payment of performance guarantees or deduction of retention is
commonly practiced in the industry, despite affecting the cash flow of ECs. Contractor D
said: “Whenever, I received payment from the main contractor, an amount equivalent to
ten percent had been deducted as retention. At the time we negotiated the contract, I tried
without success to lower the retention amount to a more reasonable percentage as this has
a serious impact on my cash flows.” This shows that clients retained 5% to 10% (CIDB,
2013) of each progress payment until certified completion of the project, which had a
negative impact on cash flows of ECs. Contractor D worked for a large construction
company building a mall in Pretoria, with deductions of retention made on the
understanding that retention would be paid out when the project was completed. After a
year, there were claims between the client and the main contractor which resulted in the
project being abandoned and Contractor D lost a large amount as a result. Contractor C
reported misunderstandings with the main contractor that led him to abandon the project
and lost retention money, while Contractor F failed to recover retention money due to non-
compliance with health and safety requirements.
4.2.2.1.6 Low bidding price / unrealistic tender price
The study found that low prices were used when bidding for projects, in order to secure
tenders. SBEs reported that this was the case when demand of work was large and small
contractors were chasing the same work. All SBEs agreed that pricing a project too low
affected the survival of the businesses and resulted in insufficient profits to the company.
For example, Contractor C reported: “The profit margin for this job a police station was
very small. The price that I accepted on that tender was very low and this was due to
competition and had to go for low prices in order to secure the job.”
4.2.2.2 People management
The other theme that emerged from the interviews was around human resources
management. Respondents were asked about people management in project
implementation and it was found that projects were affected by labour issues relating to

120
shortage of skilled manpower, strikes and industrial action, cumbersome labour processes,
failure to award increments and pay wages on time, requirement to employ locals due to
community demands and lack of cooperation from main contractor. The results of this
theme are summarised in Table 4.3 (below).
The key informants reported lack of skills and knowledgeable labour force in the
construction industry as affecting project implementation. Contractor E reported an
incident in which he needed to work on a special foundation which had steel
specifications. The foundation did not pass as he did not have skills to fix reinforcing steel.
All his employees were unskilled labourers with little formal education or an inability to
read the construction drawings, hence the contractor required assistance from skilled
people. The same sentiments that employees lacked formal qualifications, appropriate
skills and competencies were echoed by Contractor B and F. If employees lack
qualifications it becomes difficult to train them to read construction drawings as required
in the industry. It was found that ECs instead hired immigrant labour to assist (Contractors
B, E and F).
The key informants (Contractors A, B, C, D, E and F) perceived industrial action, such as
striking, as having a negative impact on project implementation as it causes delays on
construction sites. The perception is that labour unrest and too many meetings with unions
result in delays and low labour productivity. Due to labour unrest, all SBEs confirmed that
industrial action erupted while their construction projects were in progress, affecting
businesses as the construction sites had to be closed for some weeks while employees were
engaged in industrial action and demonstrations. However, Contractor D confirmed that a
‘no work no pay’ principle was applied when employees embarked on industrial action.
The demands for workers related to decent work, living wage, quality jobs, improved basic
conditions of work and calling for a ban on the practice of labour broking. Figure 4.1
(below) shows a group of employees who participated in an industrial action in 2011, as
described by contractors A to F.

121
Figure 4.1: Industrial action
Source:http://africanarguements.org/2011/12/02/industrial-action-south-africa-in-2012
There is a perception among key informants that stringent labour laws have an impact on
people management and employee productivity. Contractor B reported an incident in
which an employee who had stolen a generator and a grinder on site could not be
dismissed instantly due to a lengthy hearing process.

122
Table 4.3: Summary of results on manpower
Category
Recorded incidents and determinants
Contractor A Contractor B Contractor C Contractor D Contractor E Contractor F
Manpower
Employees not
motivated
Poor payment of
wages
Employees
worried about
employment
security
Low labour
productivity
Low employee
morale
Skills shortages
in the industry
Underpayment of
wages and
salaries
Failed to give
employees wage
increments
Labour
misunderstanding
and unrest.
Lost many
production days due
to industrial strike
Employed foreigners
Skills shortages in
the industry
Xenophobic
violence.
Demand for
minimum wages
Standardized pay
rates, training
program for local
employees.
No budget allocation
for new demands.
Employee unrests
Employees accused
of low productivity
by main contractor.
Employees worked
under fear of
victimisation.
Accused bringing
few people to site
Shortage of
formwork material
Failed to complete
decks due to
formwork problems
Poor production
Unrealistic scope of
work
Failure to meet
concrete pour dates.
No site instruction
Employees not paid
wages and salaries when
they participated in
strikes because of the
no-work-no-pay-
principle.
No record of wages kept
showing the impact of
strike.
Employee low morale
Non-payment from the
main contractor.
None payment of
employees’ wages and
salaries
Lack of employee trust
and poor working
relationships.
Employees demanded
higher wages
Employee
dissatisfaction
Non-payment of
wages and salaries
Lacked
commitment on
the project.
Employment
potential of fifteen
jobs
Low productivity.
Poor Supervision
Shortage of skilled
supervisors
Employees lacked
appropriate skills
and competence.
Use of foreign
labour
Skilled and
competent
supervisor not
successful on
medical grounds.
New supervisor
not productive.
Non-payment of
wages and salaries
Paid employee
medical
certificates,
training, and safety
file.
Employee morale
went down
poor performance,
Low productivity;
high absenteeism,
bad time keeping,
high labour
turnover

123
and remobilization
on site.
Management and
supervision of
employees
Meetings with the
employees and
unions to resolve the
stalemate on site.
received
Non-payment from
the client
Had to pay
employees wages
and salaries
Project abandoned
Non-payment of
employees and creditors
Poor reputation
Employees lost
employment.
Reputation
suffered.
Used cheap labour.
labour courts for
failing to pay
wages and salaries.
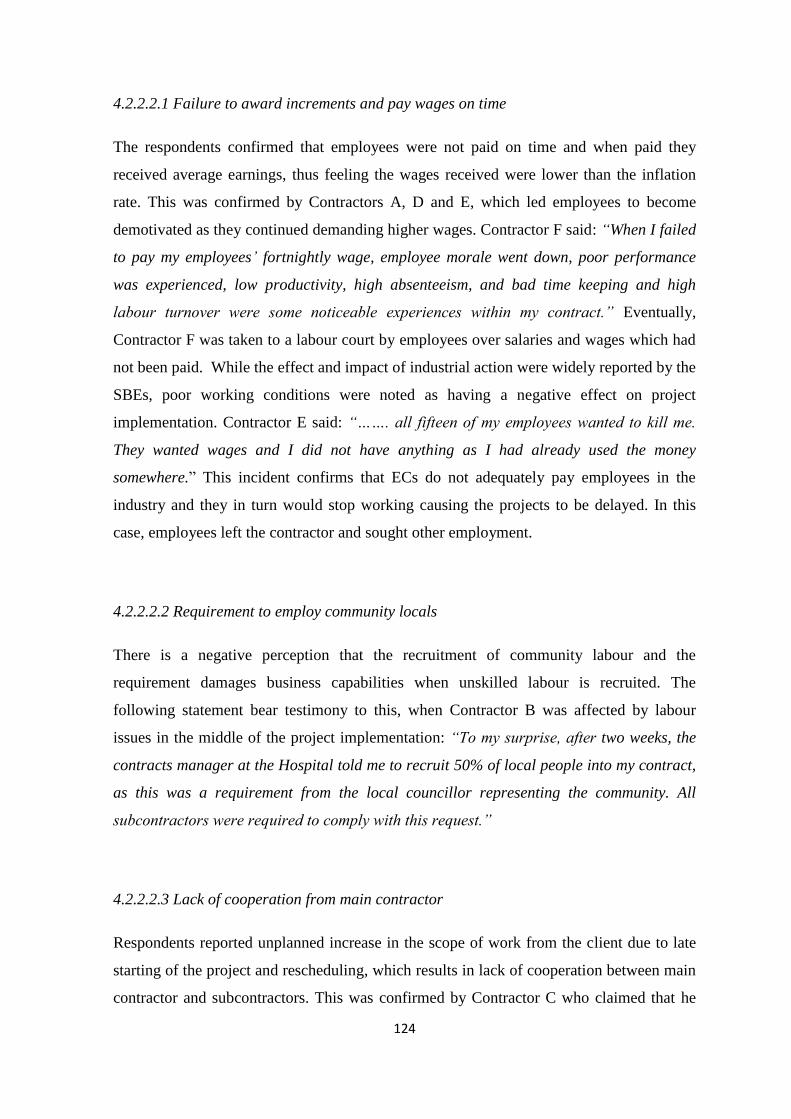
124
4.2.2.2.1 Failure to award increments and pay wages on time
The respondents confirmed that employees were not paid on time and when paid they
received average earnings, thus feeling the wages received were lower than the inflation
rate. This was confirmed by Contractors A, D and E, which led employees to become
demotivated as they continued demanding higher wages. Contractor F said: “When I failed
to pay my employees’ fortnightly wage, employee morale went down, poor performance
was experienced, low productivity, high absenteeism, and bad time keeping and high
labour turnover were some noticeable experiences within my contract.” Eventually,
Contractor F was taken to a labour court by employees over salaries and wages which had
not been paid. While the effect and impact of industrial action were widely reported by the
SBEs, poor working conditions were noted as having a negative effect on project
implementation. Contractor E said: “……. all fifteen of my employees wanted to kill me.
They wanted wages and I did not have anything as I had already used the money
somewhere.” This incident confirms that ECs do not adequately pay employees in the
industry and they in turn would stop working causing the projects to be delayed. In this
case, employees left the contractor and sought other employment.
4.2.2.2.2 Requirement to employ community locals
There is a negative perception that the recruitment of community labour and the
requirement damages business capabilities when unskilled labour is recruited. The
following statement bear testimony to this, when Contractor B was affected by labour
issues in the middle of the project implementation: “To my surprise, after two weeks, the
contracts manager at the Hospital told me to recruit 50% of local people into my contract,
as this was a requirement from the local councillor representing the community. All
subcontractors were required to comply with this request.”
4.2.2.2.3 Lack of cooperation from main contractor
Respondents reported unplanned increase in the scope of work from the client due to late
starting of the project and rescheduling, which results in lack of cooperation between main
contractor and subcontractors. This was confirmed by Contractor C who claimed that he

125
was victimised by the contract manager that his steel fixers delayed the project, yet his
team could not proceed without appropriate scaffolding being erected. This incident shows
that at times projects are not started on time, resulting in undue pressure being exacted on
subcontractors. In this case, Contractor C had to wait for other subcontractors to complete
their areas, whilst the main contractor felt it was delaying the project therefore it perceived
unrealistic demands and poor supervision by contract management as an impediment
towards the growth and profitability of ECs.
4.2.2.3 Material, machinery and equipment
Respondents confirmed that ECs are affected by material supply, excessive waste of
material during the application process, loss of material on site due to damage or theft,
deterioration of materials due to inappropriate storage, non-conformance of material to
specification, poor quality equipment and breakdowns (see Table 4.4, below).
4.2.2.3.1 Oversupply of material not required on site
It emerged from Contractor C that main contractors put pressure on subcontractors to
request unnecessary material due to poor material planning. Out of fear of victimisation,
Contractor C ordered reinforcing steel that was not required on the construction site at the
initial stage of the project, “I was summoned to the manager’s office in Tembisa and
forced to place orders for ground floor slab with the supplier and the columns to first
floor. My argument was simple, I wanted to order steel in stages so that the steel would
not get mixed and retain production tags. There was very limited space on the construction
site in Tembisa and ordering unnecessary material would result in wastage.” This incident
shows lack of planning on the procurement and usage of material on site, thus, failure in
effective planning of material by the main contractor caused material over supply.
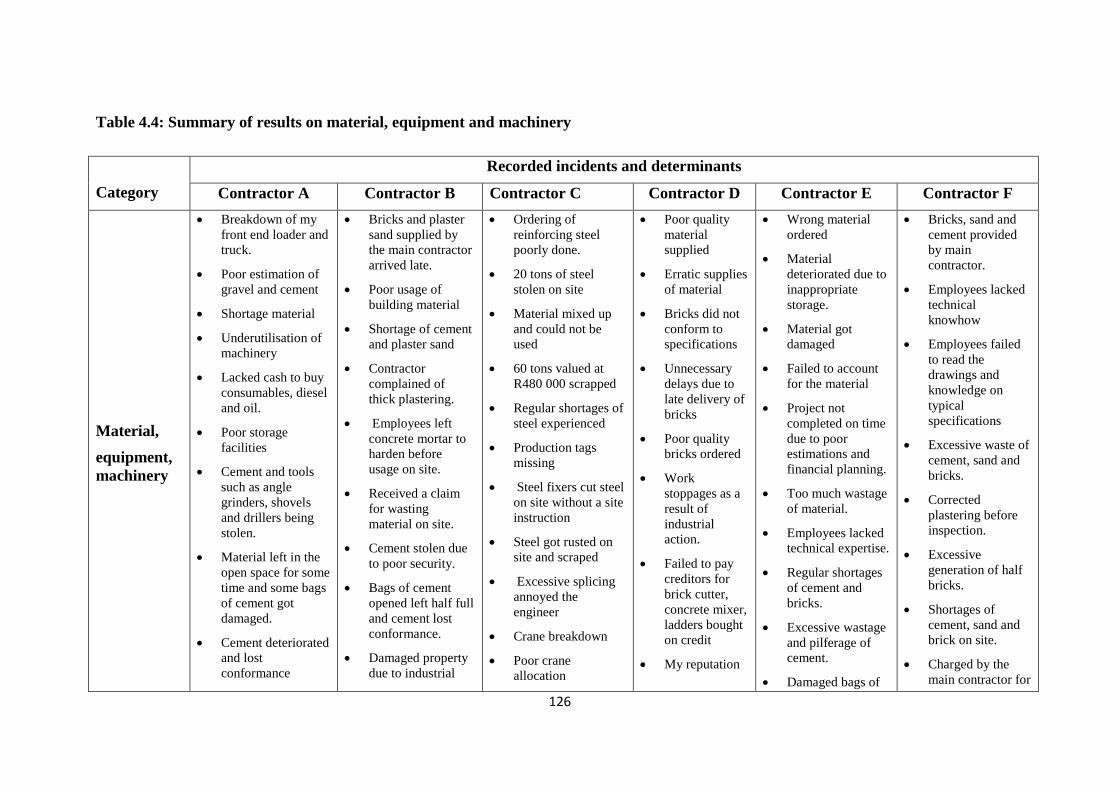
126
Table 4.4: Summary of results on material, equipment and machinery
Category
Recorded incidents and determinants
Contractor A Contractor B Contractor C Contractor D Contractor E Contractor F
Material,
equipment,
machinery
Breakdown of my
front end loader and
truck.
Poor estimation of
gravel and cement
Shortage material
Underutilisation of
machinery
Lacked cash to buy
consumables, diesel
and oil.
Poor storage
facilities
Cement and tools
such as angle
grinders, shovels
and drillers being
stolen.
Material left in the
open space for some
time and some bags
of cement got
damaged.
Cement deteriorated
and lost
conformance
Bricks and plaster
sand supplied by
the main contractor
arrived late.
Poor usage of
building material
Shortage of cement
and plaster sand
Contractor
complained of
thick plastering.
Employees left
concrete mortar to
harden before
usage on site.
Received a claim
for wasting
material on site.
Cement stolen due
to poor security.
Bags of cement
opened left half full
and cement lost
conformance.
Damaged property
due to industrial
Ordering of
reinforcing steel
poorly done.
20 tons of steel
stolen on site
Material mixed up
and could not be
used
60 tons valued at
R480 000 scrapped
Regular shortages of
steel experienced
Production tags
missing
Steel fixers cut steel
on site without a site
instruction
Steel got rusted on
site and scraped
Excessive splicing
annoyed the
engineer
Crane breakdown
Poor crane
allocation
Poor quality
material
supplied
Erratic supplies
of material
Bricks did not
conform to
specifications
Unnecessary
delays due to
late delivery of
bricks
Poor quality
bricks ordered
Work
stoppages as a
result of
industrial
action.
Failed to pay
creditors for
brick cutter,
concrete mixer,
ladders bought
on credit
My reputation
Wrong material
ordered
Material
deteriorated due to
inappropriate
storage.
Material got
damaged
Failed to account
for the material
Project not
completed on time
due to poor
estimations and
financial planning.
Too much wastage
of material.
Employees lacked
technical expertise.
Regular shortages
of cement and
bricks.
Excessive wastage
and pilferage of
cement.
Damaged bags of
Bricks, sand and
cement provided
by main
contractor.
Employees lacked
technical
knowhow
Employees failed
to read the
drawings and
knowledge on
typical
specifications
Excessive waste of
cement, sand and
bricks.
Corrected
plastering before
inspection.
Excessive
generation of half
bricks.
Shortages of
cement, sand and
brick on site.
Charged by the
main contractor for
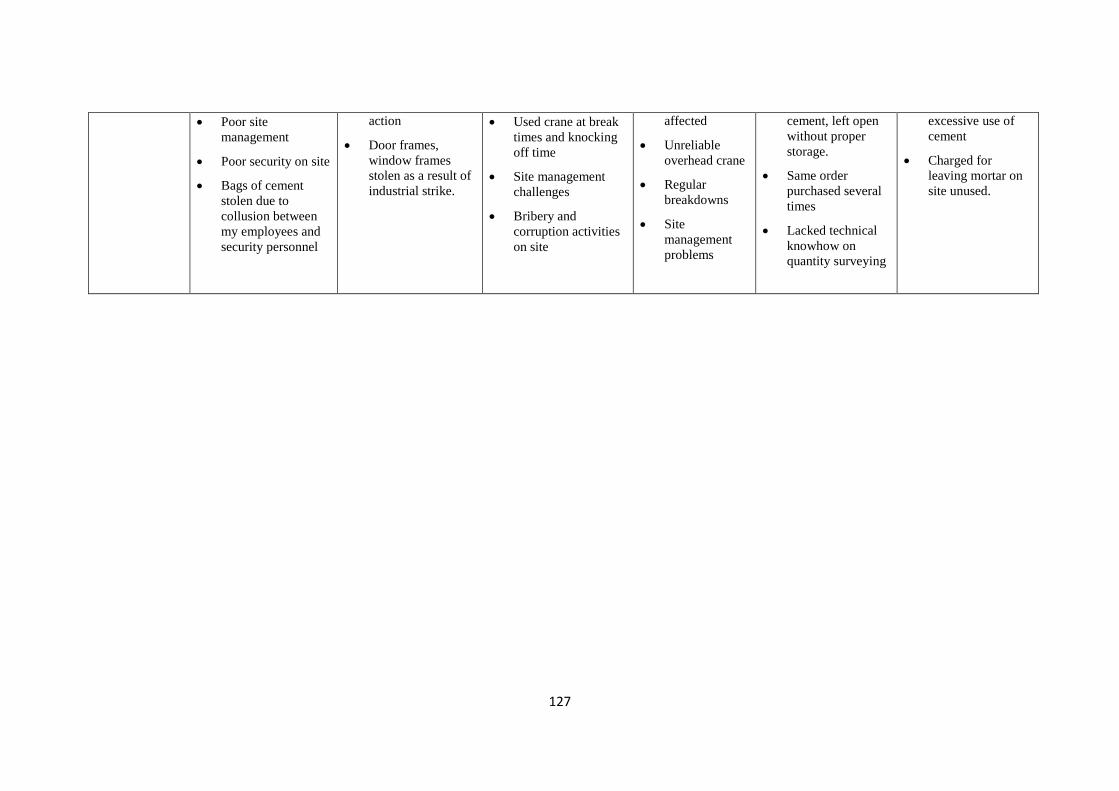
127
Poor site
management
Poor security on site
Bags of cement
stolen due to
collusion between
my employees and
security personnel
action
Door frames,
window frames
stolen as a result of
industrial strike.
Used crane at break
times and knocking
off time
Site management
challenges
Bribery and
corruption activities
on site
affected
Unreliable
overhead crane
Regular
breakdowns
Site
management
problems
cement, left open
without proper
storage.
Same order
purchased several
times
Lacked technical
knowhow on
quantity surveying
excessive use of
cement
Charged for
leaving mortar on
site unused.

128
Evidence of the wrong material being ordered and delivered on construction sites was
common among key informants. The structures were not passed in the case of contractor B
and resulted in unnecessary costly rework. Contractor E failed to properly reinforce the
house and the foundation was not passed by the municipality. Contractor D reported that:
“When I started using the bricks, the engineer came and inspected the work. He noted that
the bricks that I used were ordinary bricks instead of load bearing bricks. All the bricks
were condemned. The main contractor had to re-order the bricks. I lost a couple of days
waiting for the correct bricks to arrive.” The issue of excess bags of cement and material
non-conformance was echoed by Contractors A, C, E and F, demonstrating poor
procurement system of material by main contractors, and this has an impact on the
performance of ECs. Consequently, loss of material on site due to damage and theft was
widely reported by the respondents, citing amongst other factors poor security on
construction sites, material being stolen due to collusion by employees and security
guards, and deterioration of materials due to inappropriate storage (A and E). On the same
project, Contractor D reported shortages of cement on site and problems relating to the
supply and fixing of reinforcing steel, which support evidence by Contractor C who
abandoned a project before its completion as a result of misunderstandings on site. ECs
perceive poor site management and planning as having an impact on the growth and
profitability of businesses.
It was noted that if the company did not have a certified scaffolding team, outsourcing of
such service was important if the hired supplier provided services according to the main
contractor’s specifications and needs. Failure to comply resulted in delays and health and
safety related problems. This is evidenced by contractor D, who reported that “On several
occasions, the main contractor failed to provide scaffolding on time because the employees
were not competent and not certified to do scaffolding. The scaffolding team failed to
provide access to my employees on time. The effect was that I had to stop my employees
working waiting for the access to be provided. Such delays cost my company money and I
paid employees who were not productive.”
The above incidents are evidence of poor site management which was attributed to lack of
necessary experience, skill and knowledge in managing a project and material planning by
the respondents.
129
Another issue raised by key informants related to breakdown of equipment and machinery,
which impedes the progress of work. Contractor A was affected by the breakdown of
tipping trucks and front-end loaders which were obsolete, as it did not have funds to
adequately maintain the machinery. The contractor found it difficult to procure materials
such as gravel and cement to carry out work, so eventually it hired machinery in order to
execute the project. As the credit record was weak, the contractor battled to secure
adequate funds to hire machinery. The same sentiments about breakdowns of equipment
were expressed by Contractors C and D, who were affected by crane availability due to
breakdowns.
4.2.2.4 Project implementation
Apart from financial and manpower factors, a number of factors related to project
implementation emerged, notably weather conditions, liquidation of the main contractor,
project delay, and lack of detailed information on construction drawings. Table 4.5 (below)
summarises results obtained from project implementation.
4.2.2.4.1 Weather conditions
Almost all the respondents confirmed that weather conditions affected the performance of
their businesses. It was reported that heavy rains caused delays in project implementation
and deliveries of material as construction sites became waterlogged and too wet for
delivery trucks. For example, Contractor A was seriously affected by major rain for two
weeks, leading to major delays on the civil work he was doing.

130
Table 4.5: Summary of results on project implementation
Category
Recorded incidents and determinants
Contractor A Contractor B Contractor C Contractor D Contractor E Contractor F
Project
implementation
Worked under
pressure to catch
up with the
programme.
Delays, non-
payment of bills
gravel, cement,
tipping trucks.
Suppliers
requested cash
up front.
Heavy rain
caused major
delays to the
project.
Dewatering
problems
Delays due to
labour problems
Disruptions due to
Labour unions
Delayed project
Poor management
of labour relations
on site
Employees’
demands disrupted
the programme.
Absenteeism
Low productivity
of employees.
Incurred extra
costs for overtime,
transport and paid
unplanned meals.
Formwork team did
not have sufficient
material for the deck
Insufficient time
given to work on a
deck
Threatened with
claim for cancelling
concrete
Received a claim of
R30 000 for failing
to meet the targets.
Unrealistic scope of
work
Confusion and
misunderstanding
among
subcontractor.
Delays as a result
of health and
safety issues
Delays as a result
of poor supply of
material
Delays as a result
of scaffolding
erection
Delays as a result
of drawing change
Delays as a result
of weather
conditions
Delays as a result
of late payments
Delays as a result
of industrial strikes
Project abandoned
Arbitrations and
Litigations
Project delayed
for three months.
Delays due to
lack of
commitment.
Poor supply of
labour
Failed to pay
employees.
Low productivity
and employees
left site
Poor project
management and
supervision
No control of
material and
labour.
Contract
manager failed to
identify critical
areas of the
project.
Failed to bring
sufficient
employees to site
Poor employee
working
conditions
Employees
always late,
absent from
work and low
productivity
Complaints from
the main
contractor
regarding delays.
Received claims
as a result of
delays.
Employees
worked over
time to complete
the deck

131
4.2.2.4.2 Liquidation of main contractor
Contractor D reported an incident in which the main contractor experienced financial
difficulties with the client, a problem not disclosed to subcontractors. As a result,
Contractor D and other subcontractors continued working on a project not knowing what
was happening between the main contractor and the client. The construction site was
closed without prior warning to subcontractors. Figure 4.2 (below) shows the mall in
which Contractor D allegedly lost large sums of money in the form of completed work that
had not been paid for, as well as the retention money of the main contractor. Construction
of the mall was abandoned as a result of disputes and litigation between the main
contractor and the client.
Figure 4.2: Abandoned mall as a result of liquidation
Source: www.preform.co.za/hire_contracting
4.2.2.4.3 Project delay
Key informants perceived project delays as having a negative effect on business
performance, and the following delays were reported:
- Late payments and non-payment of material (A; B, C, D, E and F)

132
- Delays due to weather (A, D)
- Delays due to industrial strikes (A, B, D, F)
- Poor supply of labour and non-payment of wages (E, F)
- Low productivity resulting in claims (B, C, E, F)
- Delays due to poor supply of material e.g. cement, formwork (A, B, C, D,
E, F)
- Delays due to poor implementation of health and safety requirements (A, B,
C, D)
- Delays due to changes in construction drawings (B and D)
- Unplanned increase in the scope of work from the client due to late starting
of the project and rescheduling.
- Delays due to lack of commitment (E)
- Failure to identify critical project activities (E)
Owing to delays, ECs failed to execute projects within the set quality, time and budgets.
The key informants argued that ECs thus failed to complete work within the contract
period, resulting in claims being levelled against them by main contractor.
4.2.2.4.4 Lack of detailed information on construction drawings
The key informants reported the use of wrong construction drawings as well as drawings
that contained errors and omissions that affected performance on project execution. This
resulted in rework due to wrong drawings being used and created payment problems with
main contractors as a result of re-work (B; D; E). Respondents confirmed that they worked
on the basis of the information provided in the construction and architectural drawings and
any change to these after work had been done caused delays and rework, which became
costly to the client. Contractor D said: “I picked many errors and omissions involving
measurements and quantities of bricks from the drawing that I brought to the attention of
the main contractor. The construction drawings were changed as a result of these
omissions. The main contractor forwarded the queries to the engineer and this took a
couple of days before a new revision was issued. My employees stopped working and this
affected my productivity and profitability.” The use of wrong drawings was echoed by
Contractors (E and F) who argued that there was a lack of technical knowledge on the
quality of construction drawings.
133
4.2.2.5 Quality of work
The perceptions of the respondents were checked on the quality of work and respondents
argued that the use of non-conforming material, use of wrong drawings from main
contractor, inability to produce work of an acceptable standard and employment of
community labour had an impact on quality of structures. The results of this theme are
summarised in Table 4.6 (below). On employment of community labour, for example,
respondents argued that it contributed to poor quality as they took shortcuts which
disrupted quality standards. The shortcuts taken by community labour as found in this
study included wrong measurements taken, insufficient amount of cement and sand used,
which contributed to poor quality of construction performance and disrupted quality
standards. Contractor B said, “There is inconsistent quality owing to prioritisation of
employing community labour.” Another issue that affected quality, as highlighted by
Contractors B, D and E, related to the use of wrong bricks as ordered by the main
contractor and poor planning of reinforcing material on site.
There was a perception about carelessness, shortcuts and poor workmanship which key
informants believed affected the quality of structures in the industry. Contractor E said: “I
fixed the problem but already the quality had been affected as I had to demolish the
foundation and fix the stirrups and extra bars that had been excluded as well as correcting
the fixing centres.” Contractor B reported that: “…. Engineers noticed some defects which
were attributed to the use of non-load bearing bricks instead of load bearing bricks
specified on the construction drawing.”
The other response received was that at times authorities did check on project progress late
and that affected the quality of structures. The late inspection of a project could be
attributed to the shortage of skills in the country, as South Africa has been noted to
experience shortage of skilled and competent labour force.

134
Table 4.6: Summarised results on quality of work
Category
Recorded incidents and determinants
Contractor A Contractor B Contractor C Contractor D Contractor E Contractor F
Quality
Quality
compromised
Challenges to meet
deadlines
Poor workmanship
Reputation suffered
Required to employ
local people
Aware that high
quality achieved
would ensure my
future marketability
and enhances the
confidence of
clients on my work.
Quality systems
disrupted resulting
in poor quality
work.
Forced to employ
local employees
who lacked skills
and knowledge
about construction
Visible Defects
emerged
Employees taking
short corners
Employment of
community people
created problems.
Lacked
supervision on
steel fixing
No one checked
on the quality of
work.
Steel was cut on
site.
Too much
splicing of
reinforcing steel.
Used wrong
drawing
Did not charge
him for using
wrong drawing.
Rework done
and no payment
received.
Project abandoned
Demolitions.
Reinforcing steel
rusted.
Cut steel on site
and this created
shortages.
Breaking the slab
to allow splicing of
reinforcing steel.
Lots of wastage of
material
experienced
Reinforcing steel
not properly fixed
Lacked technical
knowledge on
construction
drawings and
bending schedules.
Too many errors
that annoyed the
engineer and the
client.
Too much splicing.
Unnecessary
demolishing
because of non-
conformance.
Rework and
Foundation
cracking
Client not happy
with the quality of
my work
Employees not
competent on
bricklaying.
Checked and
corrected many
mistakes.
Too much rework
and no payment
received
Demolished the
structure and take
corrective active
before inspection.
Wastage of bricks,
sand and cement.

135
4.2.2.6 Legal and regulatory Incidents
Table 4.7 (below) summarises the results from legal and regulatory theme.
Table 4.7: Summarised results on legal and regulatory
Category
Recorded incidents and determinants
Contractor A Contractor B Contractor C Contractor D Contractor E Contractor F
Legal And
Regulatory
Failed to understand
the terms and
conditions of
contract.
Lacked in-depth of
the contract
Employees did not
have PPE.
Failed to comply
with health and
safety requirements
Resolved disputes
between unions and
employees at
CCMA
Poor
communication of
health and safety
requirements.
Health and safety
problems had an
impact on
profitability of the
business
Health and safety
requirements not
adhered to on
site
No safety
meetings held on
site
Received a claim
for failing to
meet targets.
Threatened with
legal action.
Lost retention
money
Failed to take
legal battles with
large companies
Could not afford to
pursue the case
with the main
contractor
Did not keep a
record of the
agreement
Taken to labour
court by the
employees
demanding wages
Sold assets in
order to settle
debts
Taken to labour
court by
employees
Client took me to
his lawyers
Did not comply
with safety
requirements.
Employees did not
have safety PPE
No safety meeting
held on site
R100 000 required
to address safety
requirements.
Safety budget not
incorporated in the
initial quote
Unaware of safety
requirements
No chance given to
resolve health and
safety issues
Taken to labour
court by employee

136
When respondents were asked about legal and regulatory factors, almost all key informants
confirmed poor interpretation of contract terms in line with JBCC and conditions which
resulted in them failing to comply with contractual provisions and conditions. Contractors
A, D and E confirmed their failure to understand the terms and conditions of contracts
signed. Contractors C, D and E received claims for failing to meet targets and quality
standards. SBEs entered into construction contracts without full knowledge of their rights
and obligations, not being familiar with the conditions of contracting and thus causing
breaches and result in project delays. In some cases, SBEs did not keep a record of the
contracts signed and when problems arose they panicked and claimed ignorance of events.
The following quotable statement testifies: “I received the tender documents from the
client that I signed. Unfortunately, I never kept the documents and never studied the terms
and conditions of the contract.” (Contractor D).
Another statement by Contractor A with similar sentiments was: “The other condition that
I accepted without a clear idea about the implication was to accept dry rates which were
cheaper (where I would buy diesel and oil for the machinery to operate); the rates for wet
rates were high however I would not buy diesel and oil. I did not think about the
implication of the difference”. These statements show that SBEs had limited in-depth
knowledge on their responsibilities, liabilities and procedural clauses on contractual
contracts. According to CIDB, FIDIC and JBCC, contractors were expected to enter into
contracts that they fully understood.
4.2.2.6.1 Health and safety requirements
In almost all projects it was established that clients had a list of health and safety
requirements that were given to the main contractor to comply with, including: Mandatory
Appointment / Agreement Ac 37.2, Principal Contractor appoints Contractor, Contractor
Chief Executive Officer (16.1) appoints Company Assignee responsible for Health and
Safety on Site, Assignee appoints Competent Construction Supervisor, Assignee appoints
Assistant Competent Construction Supervisor, Assignee appoints Construction Safety
Officer, Assignee appoints Risk Assessor, Assignee appoints Fall Protection Planner,
Assignee appoints First Aider (+ 10 people). It was found, however, that the health and
safety standards on sites were not encouraging as SBEs were not fully aware as to what it
137
took to comply with them. Whilst this may not be important for small projects, such as
building a house, it does however become important when ECs engage in large projects.
Contractor F said: “The health and safety compliance at a construction site was regularly
checked and it was always noted that there was no compliance on site. It was further
observed that housekeeping rarely done on this site. The site was declared disastrous and
was always asked to clean the site.” Similar sentiments were echoed by Contractor F, who
showed ignorance of health and safety requirements when he was awarded a tender to
construct office blocks in Midrand: “All subcontractors on this site were given a week to
comply with health and safety requirements. I did not know how to handle these issues;
this was something very new to me.”
The above incidents show that even though emerging contractors eventually made
significant effort to comply, the action was taken without full knowledge of the costs
involved or the time it takes to comply with health and safety requirements. While these
should not be compromised, the cost of compliance is unaffordable to the ECs.
4.2.2.7 Strategic planning
One of the main themes that emerged from the interviews was the strategies used to
acquire construction projects and the owner’s ability to market their businesses.
Acquisition of construction projects was neither planned nor defined, and without a
strategic acquisition plan the methods used might be ineffective (see Table 4.8, below).
For example, the following statements bear testimony to the way SBEs secure a
construction project without proper strategic planning: “In year 2011, I was sub-
contracted by one big company that was building a hospital based on my talking to the
boss of the main contractor. My work involved bricklaying and plastering.” (Contractor
B). “I was awarded a contract by a major company in Midrand based on referral from a
friend to build office blocks as a subcontractor. This was my first contract to work for big
construction companies. Prior to this contract, I used to build residential houses in the
Township of Voslorus, Tsakane and KwaTema.” (Contractor F). None of the key
informants interviewed had a clearly defined strategic acquisition plan in place on how to
find customers, strategies on how to get to know them or how to grow and retain them in
the most efficient and effective way. This demonstrates weaknesses in leadership support

138
and strategic planning which are essential for the success and improvement of any
business.
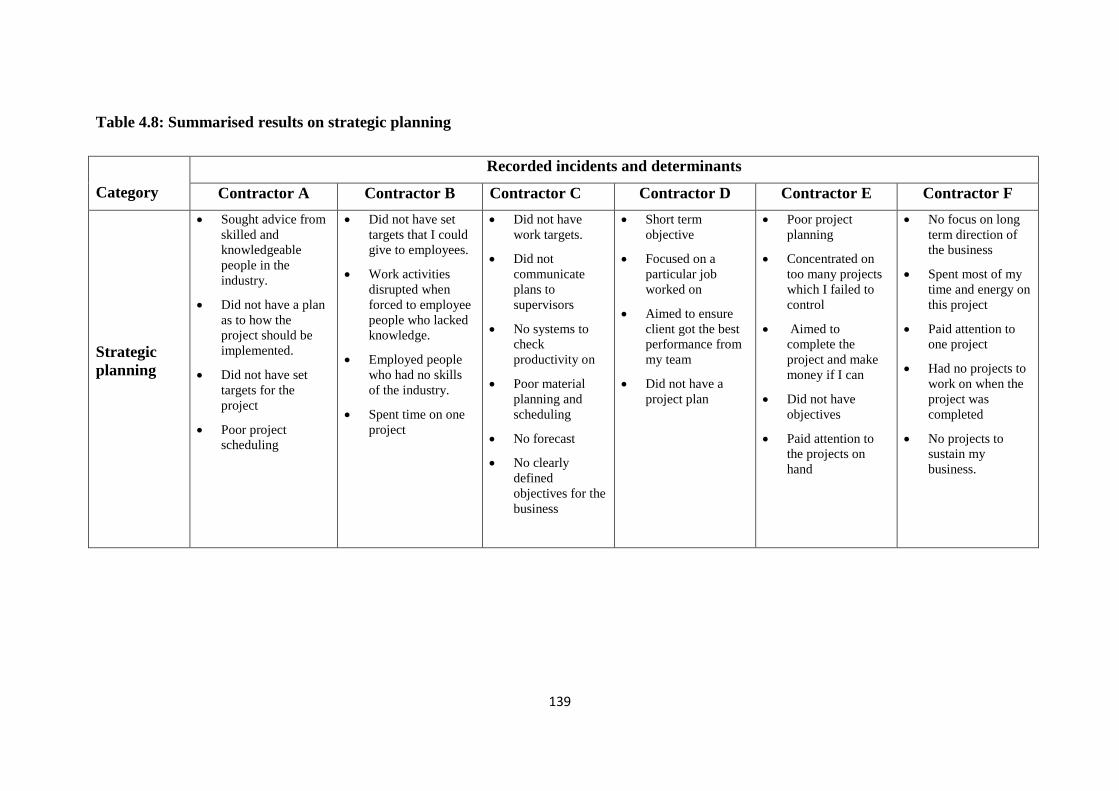
139
Table 4.8: Summarised results on strategic planning
Category
Recorded incidents and determinants
Contractor A Contractor B Contractor C Contractor D Contractor E Contractor F
Strategic
planning
Sought advice from
skilled and
knowledgeable
people in the
industry.
Did not have a plan
as to how the
project should be
implemented.
Did not have set
targets for the
project
Poor project
scheduling
Did not have set
targets that I could
give to employees.
Work activities
disrupted when
forced to employee
people who lacked
knowledge.
Employed people
who had no skills
of the industry.
Spent time on one
project
Did not have
work targets.
Did not
communicate
plans to
supervisors
No systems to
check
productivity on
Poor material
planning and
scheduling
No forecast
No clearly
defined
objectives for the
business
Short term
objective
Focused on a
particular job
worked on
Aimed to ensure
client got the best
performance from
my team
Did not have a
project plan
Poor project
planning
Concentrated on
too many projects
which I failed to
control
Aimed to
complete the
project and make
money if I can
Did not have
objectives
Paid attention to
the projects on
hand
No focus on long
term direction of
the business
Spent most of my
time and energy on
this project
Paid attention to
one project
Had no projects to
work on when the
project was
completed
No projects to
sustain my
business.

140
4.2.3 Critical incidents identified
From the thematic areas discussed above, the following determinants and critical incidents
that had an impact on the performance of ECs are summarised in Table 4.9 (below). The
analyses has demonstrated that financial factors, manpower, materials, machinery and
equipment, project implementation, quality of work, legal and environmental and strategic
planning are the main determinants that should be addressed when setting up and running
construction businesses, so as to reduce the negative impact on business performance. The
results show that the performance of ECs is based on the actions of various constituents,
including the client, consultant, contractor organisation and government agencies. Again,
the performance of ECs relies on the capabilities of SBEs in planning and management of
bottlenecks in the construction processes. The following are key issues found from the
qualitative results that should be addressed when deciding on ECs’ performance base as
they will affect negatively on business performance.
Table 4.9: Summary of critical incidents identified
Financial Category Manpower Category
Lack of collateral and assets due to poor
credit ratings
Shortage of experienced and competent labour
force
Late payments towards completed work
by clients High rate of labour disputes and strikes
Poor cash flow management and budget
control
Cumbersome administrative tasks, such as UIF,
workmen’s compensation, skills development
levy.
Tender pricing pressure from main
contractor
Low labour productivity due to employee
dissatisfaction and absenteeism
High consultancy costs and fees e.g.
,accountants and architects erode profits
The skills obtained from higher education and
the skills required in the construction industry
do not match
High registration and annual renewal
fees Poor labour supervision and workmanship
Payment of performance guarantee /
retention
Little capacity to deal with the complexities of
modern projects

141
Payment problems experienced as a
result of rework relating to faults (e.g.,
project design errors, formwork errors,
plumbing errors, mechanical and
electrical works faults).
Contractors, subcontractors, clients and
consultants do not work together as a project
team
Materials / Equipment Category Project Implementation Category
Lack of technical knowhow on quantity
surveying of construction material
Poor planning techniques and failure to identify
critical activities
Regular shortages of materials on site
Lack of project coordination among
contractors, subcontractors, clients and
consultants
Excessive waste of material during the
application process (e.g. unnecessarily
thick plastering)
Unplanned increase in the scope of work from
the client
Non-conformance of material to
specification Unrealistic construction planned time by clients
Loss of material on site due to damage
or theft.
Failure to commence project on time due to
main contractor delays
Deterioration of materials due to
inappropriate storage Omissions in the construction plans
Loss of material on site due to damage
or theft
Time spent waiting for samples, materials
approval, site inspection; approval of quality
control tests and results
Poor quality of equipment
Quality Category Legal and Environmental Category
Architectural drawings lack adequate
technical information
Compliance with health and safety regulations
is a hindrance to small scale construction
enterprises performance relative to:
Inability to interpret construction tender
plans High costs on medical requirements
Supervision of projects by unqualified
project managers High costs on personal protection requirements
Failure to deliver projects on time to the
satisfaction of the client Expensive first aid requirements
Poor relationships between Small
businesses and stakeholders
Cumbersome registration requirements and
stringent government and private support
systems
Inability to produce works of an
acceptable standard
Government policies in the construction
industry do not promote small scale
construction enterprises
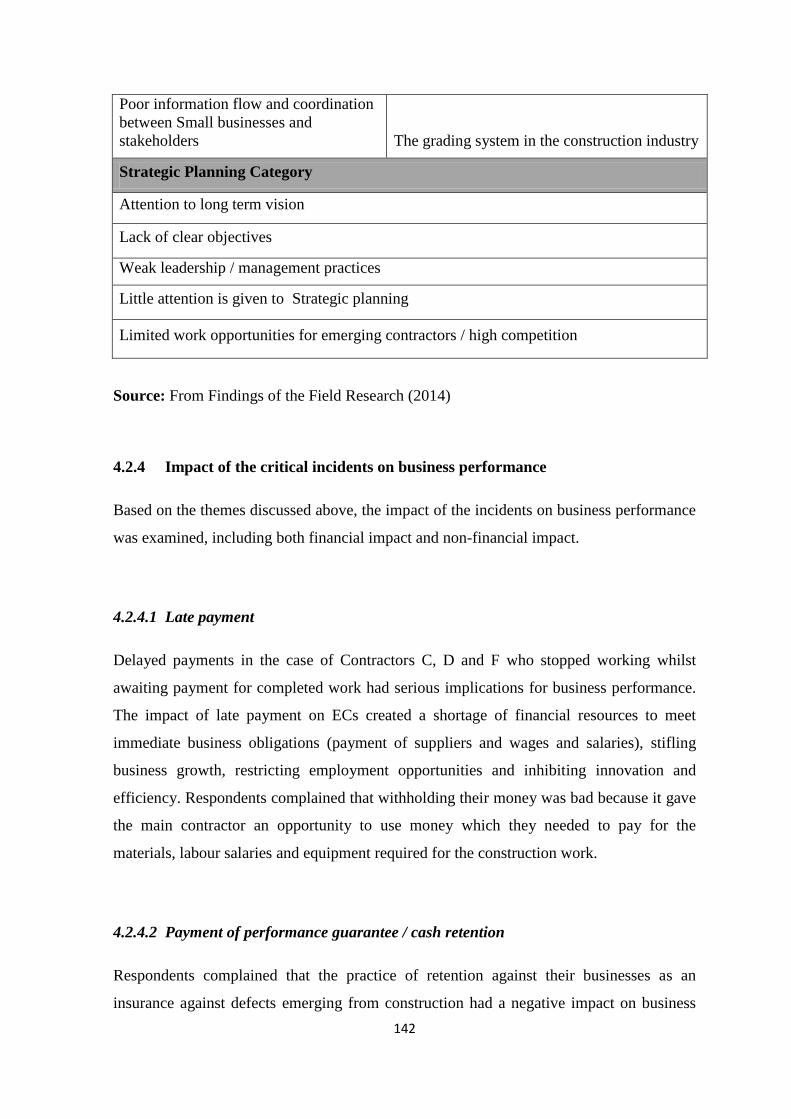
142
Poor information flow and coordination
between Small businesses and
stakeholders The grading system in the construction industry
Strategic Planning Category
Attention to long term vision
Lack of clear objectives
Weak leadership / management practices
Little attention is given to Strategic planning
Limited work opportunities for emerging contractors / high competition
Source: From Findings of the Field Research (2014)
4.2.4 Impact of the critical incidents on business performance
Based on the themes discussed above, the impact of the incidents on business performance
was examined, including both financial impact and non-financial impact.
4.2.4.1 Late payment
Delayed payments in the case of Contractors C, D and F who stopped working whilst
awaiting payment for completed work had serious implications for business performance.
The impact of late payment on ECs created a shortage of financial resources to meet
immediate business obligations (payment of suppliers and wages and salaries), stifling
business growth, restricting employment opportunities and inhibiting innovation and
efficiency. Respondents complained that withholding their money was bad because it gave
the main contractor an opportunity to use money which they needed to pay for the
materials, labour salaries and equipment required for the construction work.
4.2.4.2 Payment of performance guarantee / cash retention
Respondents complained that the practice of retention against their businesses as an
insurance against defects emerging from construction had a negative impact on business

143
cash flow. Retention damaged cash flow and reduced the chances of investing that money,
prohibiting them from employing competent people.
4.2.4.3 Poor workmanship
The effect of poor workmanship was noted as unnecessary demolitions in the case of
Contractor E. The contractor had to repeat the work, which resulted in unnecessary cost
overruns, including the foundation or which appropriate reinforcing steel had to be
provided.
4.2.4.4 Reckless project bidding
The practice by SBEs of bidding for projects at very low prices in order to secure contracts
was counter-productive as pricing too low results in poor margins and jeopardises the
growth of the business. In other studies, insufficient profits have contributed to financial
difficulties of the emerging contractors (Ali, et al. 2010). It is appropriate, therefore, for
any business to attain accepted mark-ups that would make the business profitable and
enable its survival in the construction industry.
4.2.4.5 High rate of labour disputes and strikes
Most employees working for different contractors A, B, C, D, E and F were dissatisfied
with the working conditions. Poor people management and working conditions, including
low wages and salaries, long working hours, poor relationship and compromised decent
working conditions were noted. The level of employee dissatisfaction in the construction
industry is high, as evidenced by high rate of labour disputes and strikes. When employees
were not happy with work this contributed to low morale in a work environment and
labour disputes, strikes, low labour productivity, and financial loss. Contractor B reported:
“I lost many productive days attending to labour issues; there were many stoppages on
site as a result of misunderstandings among employees which I had to attend to. The
demonstrations and strikes lasted for almost two weeks. This became a heavy expense to
my small construction company.”
144
A similar incident that resulted in a costly dispute was reported by Contractor C, who
reported that: “Due to the fact that profit margins were very low, I could not increase the
wages of my employees and this created misunderstandings with employees as they
demanded a decent wage.” Furthermore, failure by ECs to pay wages and salaries on time
contributed to labour disputes and employee dissatisfaction. Contractor B reported labour-
related disputes that were resolved at CCMA level: “This was the best way to resolve
labour disputes between contractors, unions and employees.”
On another incident, Contractor D reported an incident in which the main contractor ran
into cash flow problems while the project was in progress. It was taken to a labour court by
employees who demanded wages and to resolve the problem, and sold personal property.
As a small business, Contractor D could not afford to take the main contractor to court and
had no record of the contract entered into with the main contractor. Disputes which were
not resolved amicably on site were resolved through arbitration processes that involved
CCMA in some cases. The lengthy labour processes affected employee productivity,
profitability and reputation of the business. Weak communication among primary
stakeholders, contractors, subcontractors, clients and consultants meant they could not
work together as a project team.
4.2.4.6 Shortage of experienced and competent labour force
There is poor training of employees in the construction industry, particularly within the
emerging contractors in CIDB Grade 2, and low level of skills and experiences, as
evidenced by Contractor E, who worked with unskilled employees at a project. Lack of
skilled labour may result in poor labour supervision, poor workmanship, little capacity to
deal complex modern projects and high training costs. Contractor C reported these
problems as he lost large sums of money having to pay employees for unnecessary
overtime, standing time, cutting steel on site and sorting reinforcing steel that had been
mixed up. The above discussion shows manpower challenges that should be addressed
when setting up and running a business to reduce the negative impact on business
performance.

145
4.2.4.7 Supply of material, equipment and machinery
Poor materials management in project implementation was noted, which led into material
shortages in the case of brick supply and oversupply of reinforcing steel. Shortages
resulted in project delays, while oversupply led to wastage of resources, as in the case of
Contractor C who received large tonnages of reinforcing steel on site. There were cases of
reinforcing steel that was stolen on site and steel that was wasted through cutting and
unnecessary processing on site.
SBEs do not have adequate tools and equipment to use in the construction site as most of
the equipment is old and some acquired through leasing. There were cases of equipment
and machinery breakdown and some remaining idle on sites, which indicated lack of
planning. The impact of this was causing delays in the case of Contractor D, who
complained about the breakdown of the overhead crane and in the process lost a week’s
work. This shows that servicing of equipment was not carried out on time but only when
there was a problem.
4.2.4.8 Project implementation
Project performance is key to the organisation’s performance. The positive and negative
effects of incidents experienced by SBEs in project execution affect the overall
performance of business. The observed effects related to time overrun, cost overrun,
quality, disputes, arbitration, project abandonment, project delay, employment creation,
and business planning.
4.2.4.9 Time overrun
The majority of respondents reported delayed projects, caused by contractors,
subcontractors and other parties, resulting in time overruns. Some delays were
inexcusable, such as inadequate scheduling, project mismanagement and underestimation
of scope of work. There were identified weaknesses in project and material planning,
improper site management, and failure to delegate construction activities to subordinates
and to appoint subcontractors. There was inadequate project handling experience in the
146
case of Contractor E, who eventually failed to complete the construction of a house in a
suburb. The projects were not delivered according to scheduled programme and in the case
of Contractor D, “The community did not receive delivery of the project as planned and
this created anger within community residents.” These incidents directly affected
completion of the project.
4.2.4.10 Cost overrun
According to Contractor C, “My company incurred financial losses as a result of poor site
management from the main contractor, my employees lost many hours of productive time
sorting out reinforcing steel and I was forced to bring many people on site which I paid for
coming to site and do nothing”. Such incidents of wrong material ordered, late deliveries,
material theft, poor workmanship (mistakes and carelessness), errors and omissions in
construction drawings, and misunderstanding among parties, resulted in cost overrun
which in turn had a negative impact on the growth and profitability of the business. Poor
storage of material, such as cement that lost its conformity on site, was noted and this
contributed to cost overrun. Health and safety requirements were identified, causing cost
overrun (Contractor C and E). The requirements became costly to small contractors as
SBEs did not include the cost in the bidding price.
4.2.4.11 Project abandonment
The site was closed without prior warning or payment for completed work, hence
Contractor D abandoned the project before it was completed. Similarly, Contractor C
abandoned the construction of a police station before it was completed because of poor
relationships and misunderstandings on sites which remained unresolved. Contractor E
abandoned the construction of a house because the quality of work was poor, which
resulted in unnecessary demolition and reworking. This was a result of poor project and
material planning, poor labour management, poor financial management and overall
failure to perform.
The above incidents reveal project implementation issues that should be addressed when
setting up a business to reduce the negative impact on performance. The issues raised are

147
key when deciding on project implementation base as they will impact negatively on
overall business performance.
4.2.4.12 Quality
Incidents reported by SBEs have shown poor workmanship, unnecessary demolitions and
defective works which require rectification. This was demonstrated by most SBEs who
reported that poor quality of structures damaged their reputation in the industry. Poor
control over staff on site and poor site management by the main contractors were noted as
major causes of poor quality of structures. Contractor B said: “My quality control systems
were affected due to the employment of local employees resulting in remedial work
produced and unnecessary demolishing and redoing of work.” Rework affected Contractor
B’s financial capabilities. Poor quality had an impact on profitability and growth of
Contractor B’s business performance. SBEs interpret the drawings based on limited
information and this led them into a situation in which their work was redone because in
some cases measurements had been incorrectly taken. In some cases SBEs were not paid
for rework, which spilt into business profitability.
4.2.4.13 Legal and regulatory impact
While literature has shown that health and safety is currently receiving growing attention
in the construction industry (e.g., Windapo and Oladapo, 2012; Small and Haupt, 2007),
non-compliance still poses a risk to employees. SBEs perceive the requirements as
unnecessary project costs which are not sufficiently priced in the bills of quantity, and are
frustrating and cumbersome. They were also a hindrance to ECs’ performance, owing to
high safety training costs; high safety induction costs; high costs on medical requirements;
high costs on personal protection requirements and expensive first aid requirements.
4.2.4.14 Strategic management in emerging contractor companies
It was found that most of the ECs engage in short-term operational planning as opposed to
long-term strategic issues. The respondents did not demonstrate the extent of their strategic
148
planning and strategic choices had benefited an organisation, which shows no sign of
strategic direction on the part of SBEs. There were no incidents of strategies such as
acquisitions, partnerships, joint ventures and diversification from contracting to
maintenance, indicating lack of strategic thinking and leadership that could not turn around
emerging contractors into viable businesses. Respondents were concerned about
immediate projects and lacked business-specific forward planning. There was lack of long-
term vision among ECs surveyed for the strategic direction of their operations. The impact
lack of strategic planning has on the businesses of ECs is evident in acquisition of projects,
reckless bidding, lack of understanding of business conditions, poor project planning and
implementation, poor quality and poor people management.
The above results display lack of vision within ECs and strategic planning should be
addressed when setting up and running a construction business to reduce the negative
impact on business performance. There is lack of leadership, forecasting and planning
among the ECs, and these are the most important skills and knowledge for success in
delivering general construction work. The critical success factors of a business are based
on its mission and the support derived from top management and the awareness of client
needs. The following key strategic issues become important when deciding on strategic
planning base as they will impact negatively on business performance.
Attention to long term vision
Lack of clear objectives
Weak management practices
Little attention given to Strategic planning
Little attention given to stakeholders’ interest.
4.2.5 Overall business and stakeholder performance
The overall effect of the incidents on business performance was assessed and the
respondents reported performances relating to business profitability, business planning and
order book size.
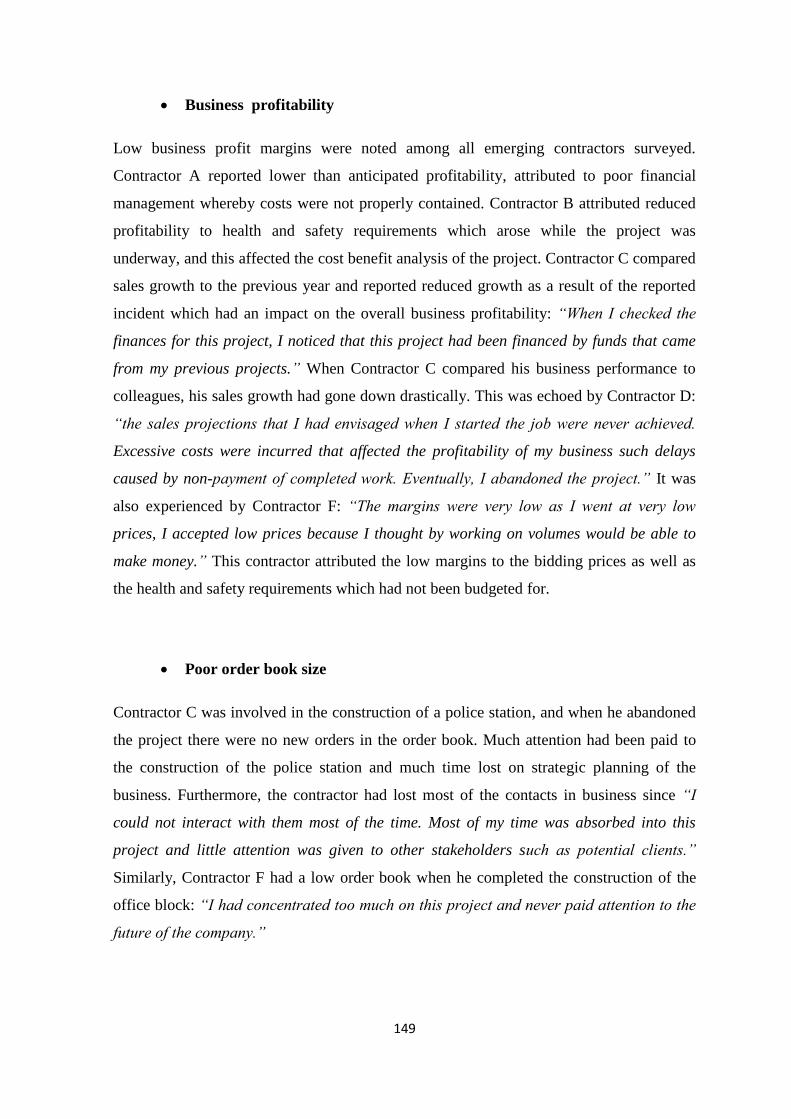
149
Business profitability
Low business profit margins were noted among all emerging contractors surveyed.
Contractor A reported lower than anticipated profitability, attributed to poor financial
management whereby costs were not properly contained. Contractor B attributed reduced
profitability to health and safety requirements which arose while the project was
underway, and this affected the cost benefit analysis of the project. Contractor C compared
sales growth to the previous year and reported reduced growth as a result of the reported
incident which had an impact on the overall business profitability: “When I checked the
finances for this project, I noticed that this project had been financed by funds that came
from my previous projects.” When Contractor C compared his business performance to
colleagues, his sales growth had gone down drastically. This was echoed by Contractor D:
“the sales projections that I had envisaged when I started the job were never achieved.
Excessive costs were incurred that affected the profitability of my business such delays
caused by non-payment of completed work. Eventually, I abandoned the project.” It was
also experienced by Contractor F: “The margins were very low as I went at very low
prices, I accepted low prices because I thought by working on volumes would be able to
make money.” This contractor attributed the low margins to the bidding prices as well as
the health and safety requirements which had not been budgeted for.
Poor order book size
Contractor C was involved in the construction of a police station, and when he abandoned
the project there were no new orders in the order book. Much attention had been paid to
the construction of the police station and much time lost on strategic planning of the
business. Furthermore, the contractor had lost most of the contacts in business since “I
could not interact with them most of the time. Most of my time was absorbed into this
project and little attention was given to other stakeholders such as potential clients.”
Similarly, Contractor F had a low order book when he completed the construction of the
office block: “I had concentrated too much on this project and never paid attention to the
future of the company.”

150
The stakeholder
Despite being key to the business success, the results of this study suggest that ECs do not
value the stakeholders who support and promote their business. From the perspective of
the SBEs, central to their performance are key result areas highlighted below.
Employment creation performance
Whilst ECs are regarded as instrumental in employment creation and the contractors have
the potential to employ more people it remains stagnant. Contractor D reported an incident
of 54 employees losing their jobs because the contractor was not paid for the completed
work and eventually the site was closed. This shows how emerging contractors failed to
contribute to the government objective about employment creation. Contractor F reported
an incident in which skilled and competent employees were lost due to labour disputes
relating to non-payment of wages, while Contractor F could not find assistance from the
banks or the main contractor and had to retrench employees. Contactor E reported
problems in producing quality structures and could not complete the projects in which he
was involved. Thus, all employees working for this contractor lost employment because of
the SBE’s poor project planning, lack of commitment and focus. Thus, community
expectation that employment would be generated was not realised. Also, the government
objective that small contractors generated employment was not achieved.
Business owner Satisfaction
The success of a business is considered when, apart from the business making profit, the
owner is happy. Regarding business owner satisfaction, Contractor F reported that: “As the
main member of the company I never enjoyed the fruits of owning a company. Instead, my
reserves were drained into this project and there were no returns received.” The comment
made by Contractor F demonstrates lack of business owner satisfaction, attributable to lack
of planning and business focus. Generally, the owner of the business prefers to see success
of the business in terms of both financial and non-financial outcomes. A business that does
not make profits would not bring any financial support to the owner and that business
151
would not provide employment for the owner or the community at large. Further, the
owner would be concerned about the long-term continuity of the business.
Client satisfaction
SBEs do not understand their customers’ needs and lack the capacity and capabilities to
meet them. Contractor E was involved in the construction of houses and the clients were
not satisfied with the quality of his work, and eventually this business closed and the
contractor left the industry to pursue other professions. This demonstrates that if clients are
dissatisfied with the services of a supplier they do not support that business and as a result
it is likely to break down. Therefore, customer management among ECs should focus on
finding the right customers, knowing the customers’ needs, growing their value and
retaining their business in the most efficient and effective way.
Community satisfaction
There is negative social impact caused by delays in the delivery of construction projects.
Contractor C was involved in the construction of a police station and failed to deliver the
project on time, eventually abandoning it due to misunderstanding relating to material
planning. The company therefore did not deliver excellent work from the community
perception because the project was abandoned before completion. The community was
despondent as this project formed part of service delivery requirement.
Regulatory and compliance performance
Contractor F, who engaged in the construction of office blocks, had challenges to meet
health and safety requirements as required by OHSAS 18001: “Throughout the duration of
the project, the safety officer was checking on our safety files and complains were always
raised that I was not meeting the requirements.” This shows how SBEs venture into the
construction business without the minimum requirements of the business ethos, therefore
emerging contractors need a shift in mind-set to become more health and safety conscious
and comply with the requirements.
152
CIDB grading
Business contracting in the construction industry is based on CIDB grading as there is a
strong requirement from the government for ECs to grow towards higher grades on the
CIDB register of contractors. This helps contractors to acquire jobs that can be manageable
within their capacity, failure in which results in underperformance. This aspect has been
demonstrated by Contractor D, who was involved in the construction of a shopping mall in
Pretoria before the project was abandoned prior to completion. The reputation of the
business suffered as he failed to pay employees and suppliers. The contractor lost assets in
form of equipment, thus instead of improving his CIDB ratings the company was rated
down. Furthermore, this incident demonstrates that emerging contractors work on projects
that are too large for their capacity and capabilities, and so cannot fight large companies
when involved in legal battles.
4.2.6 Business interview experiences: managerial perspective
There are significant lessons that have been learnt from SBEs’ business experiences,
related to the following themes.
4.2.6.1 Managerial perspective on financial management
SBEs who perceive access and cost of financing a project and having negative experience
in finance usually put in place strict systems to ensure financial controls, while those with
positive experience tend to relax in their financial management systems. As a result they
face a similar predicament. Those that consistently use low prices to secure tenders than
their competitors would produce poor quality projects, resulting in them battling to cover
labour, material and plant costs, while those who use correct tender prices settle all project
costs, make a profit and subsequently grow their businesses. SBEs who become aware of
proper cost benefit analysis and control budgets during the implementation of a project
would produce better results while SBEs who do not analyse costs in terms of labour or
material purchasing would fail to complete projects and abandon before completion.

153
4.2.6.2 Managerial perspective on manpower challenges
SBEs that lack skills and business knowledge have high staff turnover as a result of low
employee morale and cases of rework that were costly to the client. Thus, skilled and
knowledgeable SBEs would ensure successful delivery of projects and would be able to
run successful businesses, remain competitive and achieve a sustained growth. Those who
perceive motivation of employees as unnecessary have low productivity in the construction
industry, which results in delays in project delivery, while those who treat their employees
with respect and dignity become successful. The people behind organisations are therefore
the most important assets. People need to be treated with respect, including paying them
salaries and wages that are related to market conditions. Failure to do so create anger and
hatred.
SBEs who send their employees for refresher courses (up skilling) cope with new changing
technology in the industry while those who do not consider up skilling lack in skills and
knowledge. SBEs that have negative experience with manpower put in place strict
manpower systems, including hiring labour experts which ensure strict controls, while
those with positive experience tend to relax their systems and not be strict in their labour
management systems. As a result they face a similar predicament.
4.2.6.3 Managerial perspective on supply of materials, equipment and machinery
SBEs that enter into joint ventures with large contractors when they win tenders as they do
not have financial resources, machinery and equipment required for implementing the
projects, tend to succeed in their businesses, while those who have no strategies falter.
Those citing the engagement of professionals, for example, quantity surveyors and
accountants, as unnecessary cost have low chances of succeeding in the construction
business, and others who engage professional services survive and create a good reputation
in the industry.
SBEs who are not aware of project and material planning would fail to coordinate their
work activities, resulting in material shortage on site, hence material needed for
construction would not be available within the required timeframe. In the absence of a
proper and comprehensive construction plan and schedule, construction parties cannot be

154
informed of or subsequently held accountable for the timing and duration of their planned
activities.
4.2.6.4 Managerial perspective on project implementation
SBEs engaging in tenders that have various sections over different disciplines that require
particular skill, such as electrical and mechanical engineering, and outsource that part of
the contract to a subcontractor who specialises in the skill, would succeed in business
while those who perform all activities without proper skills and knowledge will fail to
deliver quality in that discipline. Skills and knowledge are critical in construction due to
their high impact on productivity and performance. Those that do not follow cost
leadership strategy and focus strategy in project implementation would battle to meet
project cost and produce low quality work, while those who are focused and follow a cost
leadership strategy would survive in a competitive environment.
SBEs that become aware of misunderstandings with their main contractors when problems
arise will fail to resolve those misunderstandings and have difficulties in delivering
projects on time, while those who manage misunderstandings on construction sites would
develop appropriate relationships with their stakeholders that would enable them to deliver
projects on time and within budgets. The SBEs that are poor in site management and slow
in decision making cause delays that affect the whole team and the progress of works.
4.2.6.5 Managerial perspective on quality
SBEs that have quality management systems in construction are able to forecast project
activities, including analysis of construction methods, coordination of resource
requirements, and sequencing of work activities. They monitor and update project plans
and reflect on work status, while those without quality management systems deliver
structures of low quality. Those that use poor quality materials produce structures that
collapse while others who use quality material as per construction drawings produce
structures of good quality.

155
4.2.6.6 Managerial perspective on legal and regulatory
Incompetent SBEs who secure tenders on an opportunistic basis encounter problems that
include schedule delays, budget overruns, and non-achievement of quality standards. They
become involved in a number of claims and litigation while those who follow tender
procedures produce quality structures and observe the terms and conditions of the contract.
SBEs who do not understand health and safety requirements incur unplanned expenses as
they would be required to comply with health and safety requirements and that would
drain their limited resources, while those who understand health and safety requirements
would comply at the commencement of the project.
4.2.6.7 Managerial perspective on strategic planning
SBEs who lack long-term planning and strategic thinking have failing businesses, while
conversely, those with long-term plans work towards making their businesses achieve the
set goals through appropriate formulation and implementation of strategies. SBEs who
lack effective planning of projects will fail to identify critical activities for the project.
Almost all SBEs indicated incidents showing their failure to coordinate the stakeholders,
which created misunderstanding and poor relationships among stakeholders on site.
In concluding the first phase of the results, the analysis of the qualitative results revealed
thematic areas that were most likely to determine the performance of ECs business in
CIDB Grade 2 in Gauteng Province:
Financial Theme
Manpower Theme
Material, Machinery and Equipment Theme
Project implementation
Quality Theme
Legal and Regulatory Theme
Strategic Planning Theme

156
The impact of the incidents on business performance was assessed and generally all key
informants agreed on the following impact: cost overruns, time overruns, project
abandonment, disputes, arbitrations, low business profitability, poor business order book
size. Overall impact on business and stakeholder performance was assessed and the results
revealed low level of employment creation, low business owner satisfaction, dissatisfied
clients and community.
4.3 PART B – PRESENTATION OF QUANTITATIVE RESULTS
The previous section presented the qualitative research findings, with the critical incidents
encountered by SBEs in the construction industry identified. Based on the results achieved,
seven broad categories of performance determinants were identified and structured into a
detailed survey questionnaire which was used to inform the quantitative aspect of the
study. This section presents the statement of the findings and the analysis of quantitative
data, beginning by presenting the demographic statistics of the research sample and going
on to present the findings for each item on the questionnaire. Specifically, Part B addresses
the following research questions as articulated in the first chapter:
What are the perceptions of SBEs on the determinants of performance among the
ECs in Gauteng Province of South Africa?
What relationship exists between project performance and corporate performance?
What relationship exists between the profiles of ECs and their performance in the
industry?
What are the perceived measures that can be put in place to sustain high
performance among ECs?
The correlation between the study variables and business performance is reviewed in this
section, with the results of the hypotheses testing for the study.
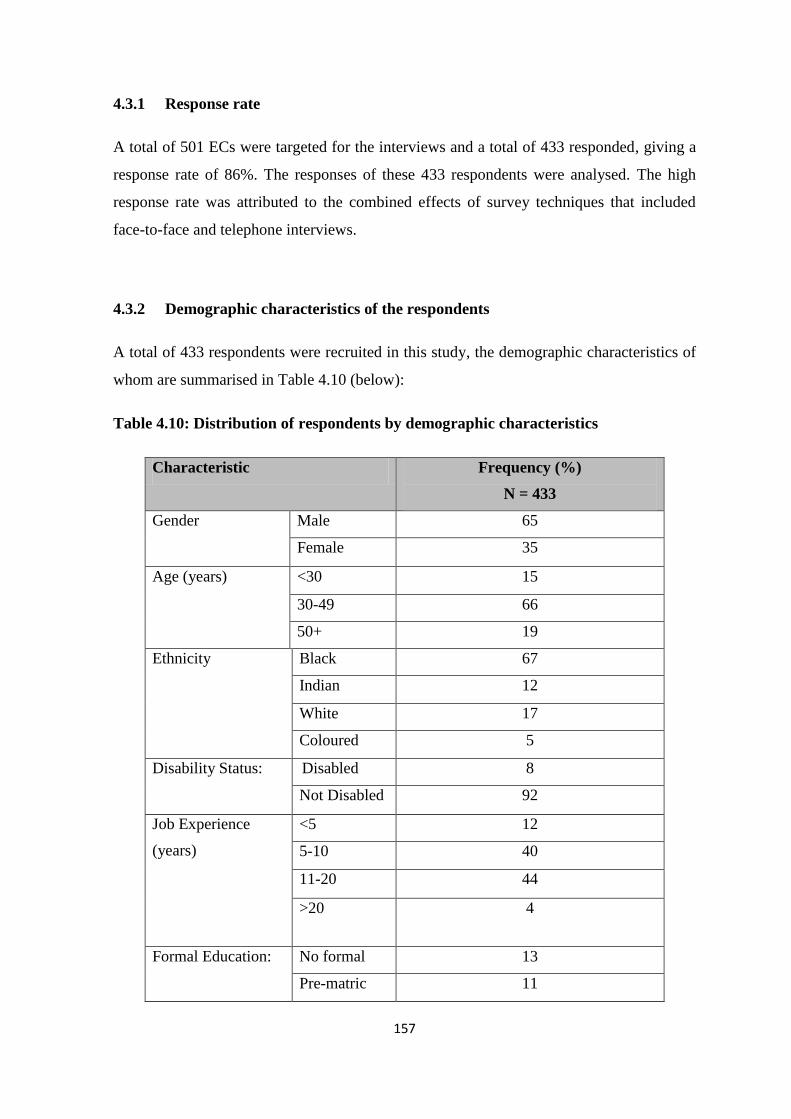
157
4.3.1 Response rate
A total of 501 ECs were targeted for the interviews and a total of 433 responded, giving a
response rate of 86%. The responses of these 433 respondents were analysed. The high
response rate was attributed to the combined effects of survey techniques that included
face-to-face and telephone interviews.
4.3.2 Demographic characteristics of the respondents
A total of 433 respondents were recruited in this study, the demographic characteristics of
whom are summarised in Table 4.10 (below):
Table 4.10: Distribution of respondents by demographic characteristics
Characteristic Frequency (%)
N = 433
Gender
Male 65
Female 35
Age (years)
<30 15
30-49 66
50+ 19
Ethnicity
Black 67
Indian 12
White 17
Coloured 5
Disability Status:
Disabled 8
Not Disabled 92
Job Experience
(years)
<5 12
5-10 40
11-20 44
>20 4
Formal Education:
No formal 13
Pre-matric 11
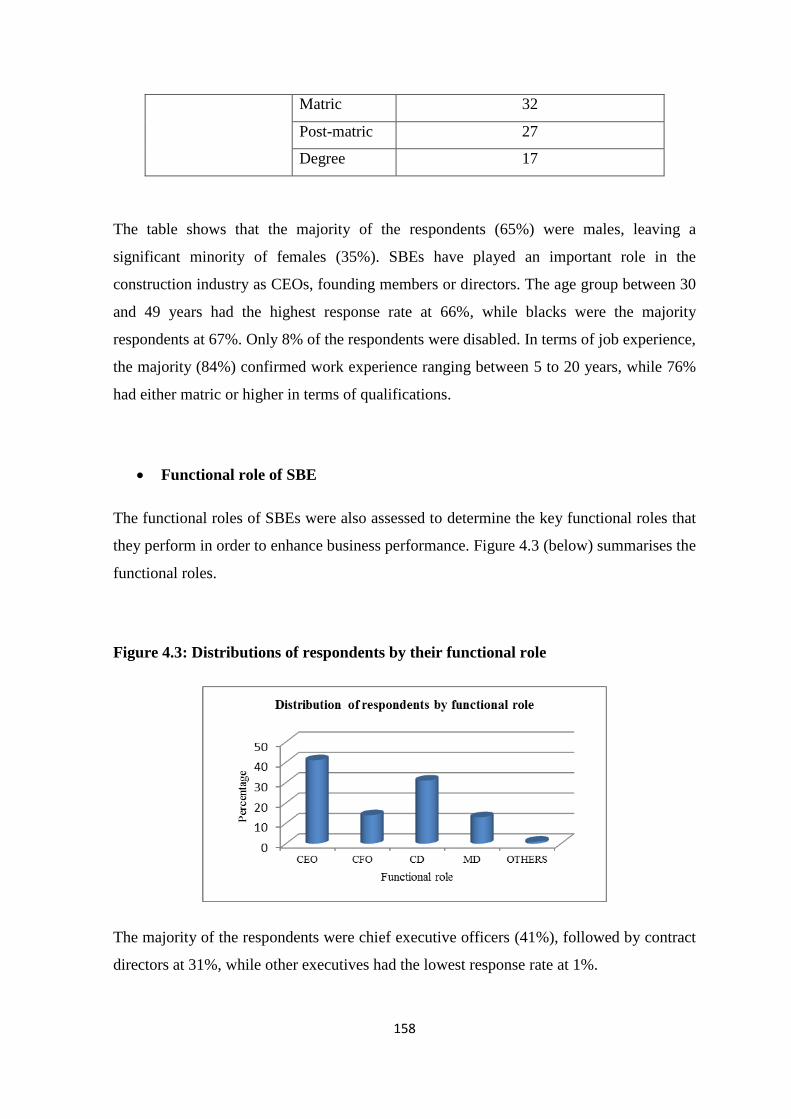
158
Matric 32
Post-matric 27
Degree 17
The table shows that the majority of the respondents (65%) were males, leaving a
significant minority of females (35%). SBEs have played an important role in the
construction industry as CEOs, founding members or directors. The age group between 30
and 49 years had the highest response rate at 66%, while blacks were the majority
respondents at 67%. Only 8% of the respondents were disabled. In terms of job experience,
the majority (84%) confirmed work experience ranging between 5 to 20 years, while 76%
had either matric or higher in terms of qualifications.
Functional role of SBE
The functional roles of SBEs were also assessed to determine the key functional roles that
they perform in order to enhance business performance. Figure 4.3 (below) summarises the
functional roles.
Figure 4.3: Distributions of respondents by their functional role
The majority of the respondents were chief executive officers (41%), followed by contract
directors at 31%, while other executives had the lowest response rate at 1%.

159
Business profile
Profile information on the businesses that participated in this study was assessed and
reported in this section. The information that emerged from the profile helped in
interpreting the results of this study.
Business location
All 433 SBEs were from Gauteng, and their location verified as such.
Number of years in construction industry
Respondents were asked the number of years their businesses had operated in the
construction industry. Figure 4.4 (below) shows that 80% of businesses had 2 to 4 years in
construction business and had not developed into higher grades. Of significance is 1% of
businesses that had been in the industry for 7 years, yet registration with CIDB are still in
grade 2 indicating weak growth among some ECs surveyed. This suggests that some ECs
do not take advantage of several attempts made by South African government to improve
the performance of ECs in the industry. The attempts by the government have been
discussed in section 1.2.3 of chapter one.
Figure 4.4: Years in Construction Industry

160
CIDB registration grading
All the emerging contractors that took part in this study were registered with the CIDB in
Grade 2, based in Gauteng. Table 4.11 (below) shows representation of respondents who
participated:
Table 4.11: CIDB grading
Grade Frequency Percentage Cum.
CIDB Grade 2 433 100 100
Total 433 100
Manpower size
The contractor sizes in terms of manpower by professional skills were assessed and the
results are reflected in Tables 4.12; 4.13 and 4.14. A majority, 94% of the respondents
indicated that they employed 2 or fewer skilled employees and 90% confirmed that they
employed 5 to 22 unskilled employees, while 1% employed 29 unskilled employees. Only
10% confirmed that they employed 23 or more employees. The results in table 4.12 show
lack of skilled personnel in the industry suggesting need to train existing employees to
attain high skills qualifications and recruitment of personnel with a higher profile of skills.
This may also suggest that ECs lack appropriate resources to attract necessary
competencies and skills from local labour market.
Table 4.12: Representation of skilled manpower
Number of skilled Frequency Percentage Cum.
1 170 39 39
2 239 55 94
3 23 5 99
4 1 1 100
Total 433 100
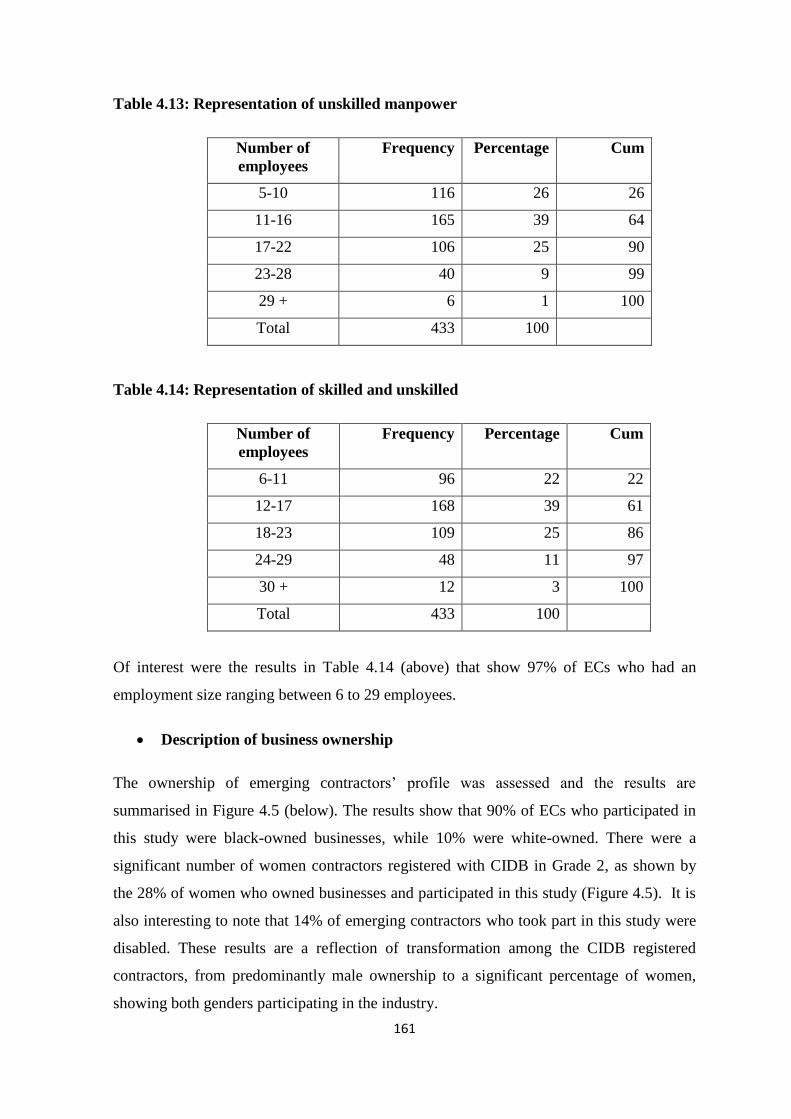
161
Table 4.13: Representation of unskilled manpower
Number of
employees
Frequency Percentage Cum
5-10 116 26 26
11-16 165 39 64
17-22 106 25 90
23-28 40 9 99
29 + 6 1 100
Total 433 100
Table 4.14: Representation of skilled and unskilled
Number of
employees
Frequency Percentage Cum
6-11 96 22 22
12-17 168 39 61
18-23 109 25 86
24-29 48 11 97
30 + 12 3 100
Total 433 100
Of interest were the results in Table 4.14 (above) that show 97% of ECs who had an
employment size ranging between 6 to 29 employees.
Description of business ownership
The ownership of emerging contractors’ profile was assessed and the results are
summarised in Figure 4.5 (below). The results show that 90% of ECs who participated in
this study were black-owned businesses, while 10% were white-owned. There were a
significant number of women contractors registered with CIDB in Grade 2, as shown by
the 28% of women who owned businesses and participated in this study (Figure 4.5). It is
also interesting to note that 14% of emerging contractors who took part in this study were
disabled. These results are a reflection of transformation among the CIDB registered
contractors, from predominantly male ownership to a significant percentage of women,
showing both genders participating in the industry.
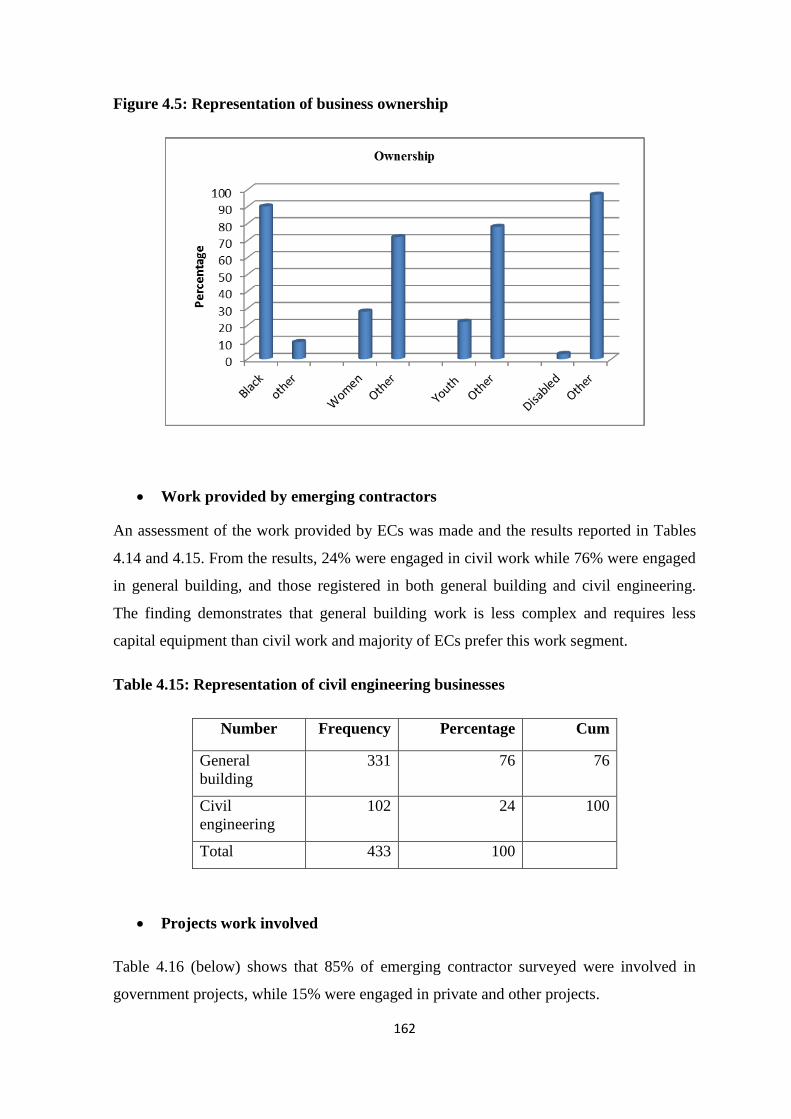
162
Figure 4.5: Representation of business ownership
Work provided by emerging contractors
An assessment of the work provided by ECs was made and the results reported in Tables
4.14 and 4.15. From the results, 24% were engaged in civil work while 76% were engaged
in general building, and those registered in both general building and civil engineering.
The finding demonstrates that general building work is less complex and requires less
capital equipment than civil work and majority of ECs prefer this work segment.
Table 4.15: Representation of civil engineering businesses
Number Frequency Percentage Cum
General
building
331 76 76
Civil
engineering
102 24 100
Total 433 100
Projects work involved
Table 4.16 (below) shows that 85% of emerging contractor surveyed were involved in
government projects, while 15% were engaged in private and other projects.

163
Table 4.16: Representation of those who do government projects
Number Frequency Percentage Cum
1 369 85 85
2 64 15 100
Total 433 100
4.3.3 Reliability and validity Analysis
A Likert scale was used to measure number of attitudes issues towards performance, whilst
the validity and reliability of the questionnaires were assessed using the Cronbach alpha
and items which were not contributing were dropped. The results of the validity and
reliability of the instruments used are depicted in Table 4.17 (below).
Table 4.17: Reliability and Validity Analysis
Construct Cronbach's
Alpha
Number of
Items
Items
Dropped
Financial Factors 0.869 8
None
Manpower Factors 0.828 6 (C4.5& C4.8)
Supply of Materials,
etc.
0.896 6
None
Project
Implementation
0.881 5 C6.6 & C6.7
Quality Factors 0.848 7 None
Legal & Regulatory
Issues
0.934 8
None
Strategic Planning 0.926 5 None
Project Performance 0.927 9
None
Organization
Performance
0.944 8
None
Performance
Improvement
0.943 8
F12.1
164
The questionnaire was tested for internal consistency and reliability by calculating the
Cronbach’s Alpha value for the items on the scale. The above indicated Cronbach’s
coefficients were obtained and are all sufficiently large (> 0.80), suggesting consistency of
responses for all the subscales after dropping the identified items, the manpower factors
(C4.5 and C4.8), project implementation (C6.6 and C6.7) and performance improvement
(F12.1).
4.3.3.1 Construct validity
Evidence of construct validity is present when the pattern of correlations among variables
conforms to what is predicted by theory (Cronbach, 1970:143; Zikmund et al., 2010:308).
In this study, the simple correlation and factor analysis of the relationships among
variables were examined. Specifically, the seven determinants of EC performance,
financial factors, manpower factors, material, equipment and machinery, project
implementation, quality, legal and environmental, strategic planning and project
performance were examined and linked to the performance of ECs. The reliability values
and item to total correlations for these variables were reported in Table 4.17 (above).
Construct validity consists of face validity, content validity, criterion validity, convergent
validity and discriminant validity. Two suggestions about the relationships among the
variables were advanced and these relate to convergent validity and discriminant validity.
Each suggestion is considered in the following discussion based on results as indicated in
Table 4.18 (below).
4.3.3.2 Convergent validity
Convergent validity ensures that concepts that should be related are indeed related
(Zikmund et al., 2010: 308). In this study a strong correlation among the three
determinants (strategic planning, project implementation and project performance) of EC
performance was established, suggesting that they are converging on a common construct
as well as providing evidence of convergent validity. All of the correlations exceeded .7
and are all significant at p < .001. Convergent validity is also suggested by the high
Cronbach alpha (.88) attained when all the scale items are combined into one scale.

165
4.3.4 Confirmatory factor analysis
Table 4.18 (below) shows the correlation coefficients among the variables that were used
in the factor analysis. They indicate good convergence and discriminant validity of the
factor analysis, which demonstrates that the variables loaded on particular factors do
correlate significantly. The highest correlation is between EC performance and project
performance 0.4866, followed by the correlation between strategic planning and project
implementation 0.3944. The lowest correlation of 0.0386 between project implementation
and project performance shows a weak correlation between the two performance items.
Table 4.18: Correlation analysis: EC performance, strategic planning, project
implementation and project performance
EC
Performance
Strategic
Planning
Project
Implementation
Project
Performance
EC performance 1
Strategic Planning 0.2106 1
Project
Implementation 0.2668 0.3944 1
Project Performance 0.4866 0.0438 0.0386 1
Correlation analysis was conducted based on the perceptions of the respondents to explore
the relationships between variables and to check the presence of multi-linearity.
4.3.5 Determinants of ECs’ performance
The data presented in this section is based on the perceptions of SBEs from qualitative
results that indicated the following factors as the most important performance determinants
of emerging contractors: Financial challenges, manpower factors, supply of materials,
equipment and machinery, project implementation, quality factors, legal and regulatory
factors, and strategic planning. The items in each category were analysed using the ranking
method, implying that the top ranked item was perceived to have the most negative effect

166
on the performance of emerging contractors. Tables 4.18 to 4.24 present the perceptions of
the respondents relative to statements pertaining to each research item.
Financial challenges that have negative effects on business performance
On assessing financial challenges that impact negatively on business performance, the
following table summarises the key results:
Table 4.19: Financial Challenges
Statement SA/A
(%)
N
(%)
DA/SD
(%) Rank
Late payments towards completed work by
clients.
89 8 3 1
Lack of collateral and assets. 88 9 3 2
Payment problems as a result of rework 83 10 7 3
Payment of performance guarantee 77 14 9 4
Poor cash flow management and budget
control.
76 16 9 5
High registration and annual renewal fees. 69 18 13 6
Tender pricing pressure from main
contractors.
67 23 9 7
High consultancy costs and fees 64 21 15 8
Average score 77 15 9 5
*All percentages from table 4.19 to table 4.25 are based on 433 as the denominator for each item. The
average score on each table was determined as a basis for overall ranking analysis.
From Table 4.19 (above), it was found that late payments towards completed work and
lack of collateral and assets were ranked highest by SBEs in the financial category, while
high consultancy costs and fees was given the lowest ranking. This suggests that SBEs did
not perceive consultancy as a major challenge that affected ECs businesses. However, late
payments affected SBEs’ cash flow, particularly project budget and cost performance.
Cash flow is used to evaluate cost performance of the project at any construction stage.
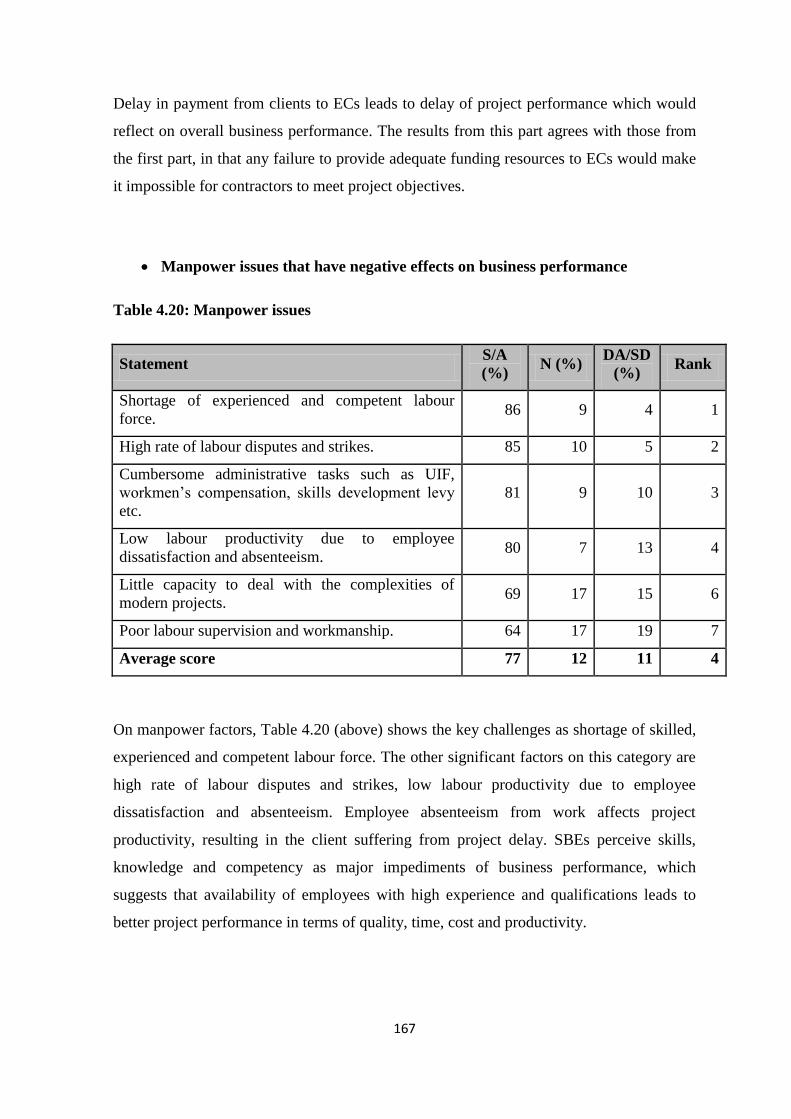
167
Delay in payment from clients to ECs leads to delay of project performance which would
reflect on overall business performance. The results from this part agrees with those from
the first part, in that any failure to provide adequate funding resources to ECs would make
it impossible for contractors to meet project objectives.
Manpower issues that have negative effects on business performance
Table 4.20: Manpower issues
Statement S/A
(%) N (%)
DA/SD
(%) Rank
Shortage of experienced and competent labour
force. 86 9 4 1
High rate of labour disputes and strikes. 85 10 5 2
Cumbersome administrative tasks such as UIF,
workmen’s compensation, skills development levy
etc.
81 9 10 3
Low labour productivity due to employee
dissatisfaction and absenteeism. 80 7 13 4
Little capacity to deal with the complexities of
modern projects. 69 17 15 6
Poor labour supervision and workmanship. 64 17 19 7
Average score 77 12 11 4
On manpower factors, Table 4.20 (above) shows the key challenges as shortage of skilled,
experienced and competent labour force. The other significant factors on this category are
high rate of labour disputes and strikes, low labour productivity due to employee
dissatisfaction and absenteeism. Employee absenteeism from work affects project
productivity, resulting in the client suffering from project delay. SBEs perceive skills,
knowledge and competency as major impediments of business performance, which
suggests that availability of employees with high experience and qualifications leads to
better project performance in terms of quality, time, cost and productivity.
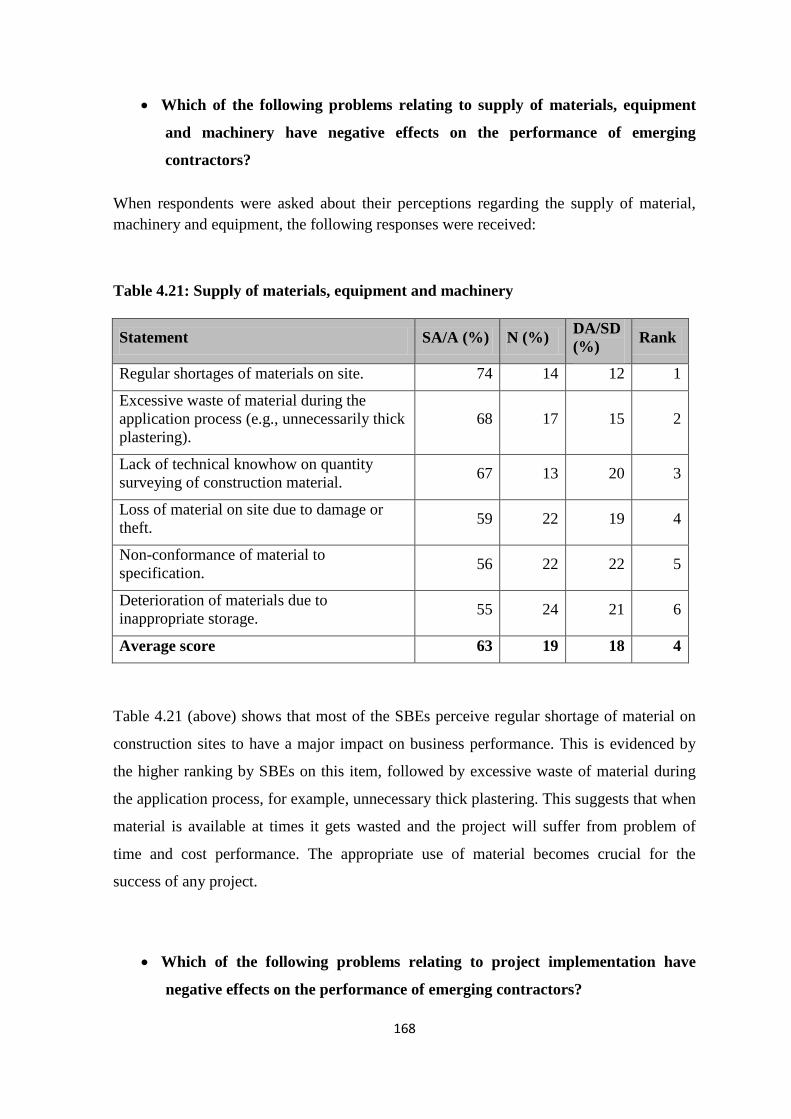
168
Which of the following problems relating to supply of materials, equipment
and machinery have negative effects on the performance of emerging
contractors?
When respondents were asked about their perceptions regarding the supply of material,
machinery and equipment, the following responses were received:
Table 4.21: Supply of materials, equipment and machinery
Statement SA/A (%) N (%) DA/SD
(%) Rank
Regular shortages of materials on site. 74 14 12 1
Excessive waste of material during the
application process (e.g., unnecessarily thick
plastering).
68 17 15 2
Lack of technical knowhow on quantity
surveying of construction material. 67 13 20 3
Loss of material on site due to damage or
theft. 59 22 19 4
Non-conformance of material to
specification. 56 22 22 5
Deterioration of materials due to
inappropriate storage. 55 24 21 6
Average score 63 19 18 4
Table 4.21 (above) shows that most of the SBEs perceive regular shortage of material on
construction sites to have a major impact on business performance. This is evidenced by
the higher ranking by SBEs on this item, followed by excessive waste of material during
the application process, for example, unnecessary thick plastering. This suggests that when
material is available at times it gets wasted and the project will suffer from problem of
time and cost performance. The appropriate use of material becomes crucial for the
success of any project.
Which of the following problems relating to project implementation have
negative effects on the performance of emerging contractors?
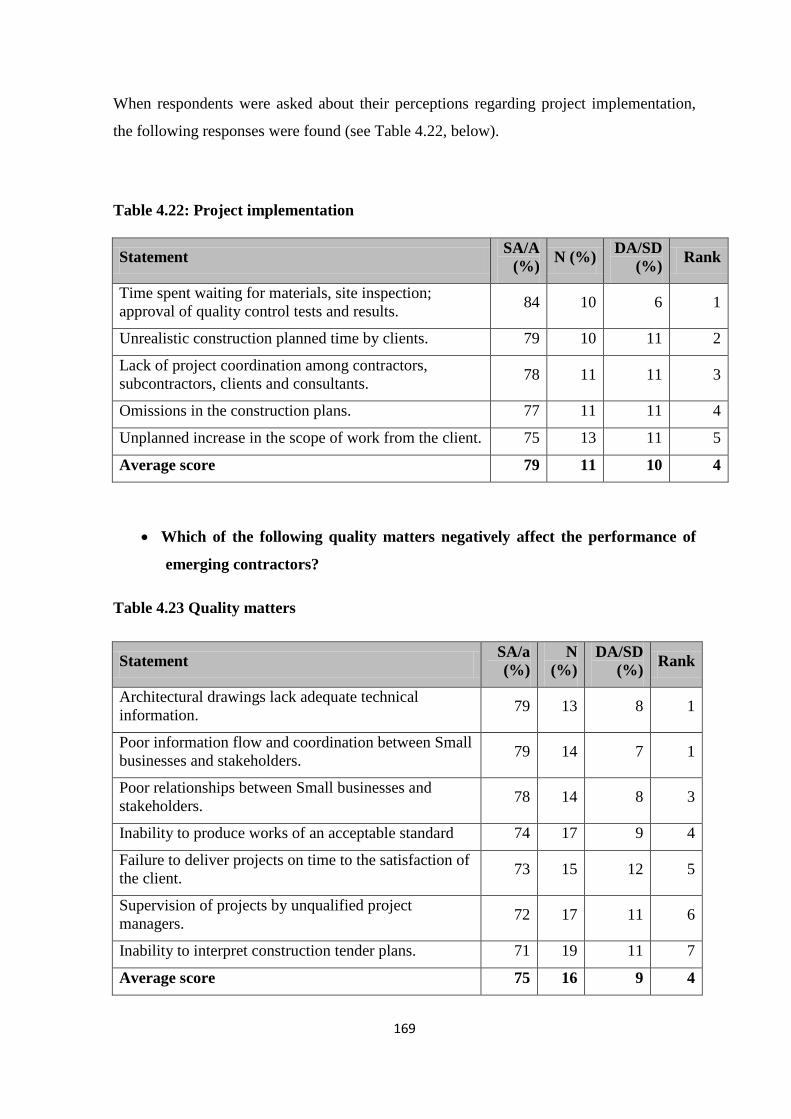
169
When respondents were asked about their perceptions regarding project implementation,
the following responses were found (see Table 4.22, below).
Table 4.22: Project implementation
Statement SA/A
(%) N (%)
DA/SD
(%) Rank
Time spent waiting for materials, site inspection;
approval of quality control tests and results. 84 10 6 1
Unrealistic construction planned time by clients. 79 10 11 2
Lack of project coordination among contractors,
subcontractors, clients and consultants. 78 11 11 3
Omissions in the construction plans. 77 11 11 4
Unplanned increase in the scope of work from the client. 75 13 11 5
Average score 79 11 10 4
Which of the following quality matters negatively affect the performance of
emerging contractors?
Table 4.23 Quality matters
Statement SA/a
(%)
N
(%)
DA/SD
(%) Rank
Architectural drawings lack adequate technical
information. 79 13 8 1
Poor information flow and coordination between Small
businesses and stakeholders. 79 14 7 1
Poor relationships between Small businesses and
stakeholders. 78 14 8 3
Inability to produce works of an acceptable standard 74 17 9 4
Failure to deliver projects on time to the satisfaction of
the client. 73 15 12 5
Supervision of projects by unqualified project
managers. 72 17 11 6
Inability to interpret construction tender plans. 71 19 11 7
Average score 75 16 9 4

170
The analysis of quality factors in Table 4.23 (above) shows that construction drawings
lacked adequate technical information, as this was ranked the highest on the category. This
is followed by poor information flow and coordination between contractors and primary
stakeholders. The lowest ranked on this category was the inability of SBEs to interpret
construction tender plans, suggesting that SBEs did not see this factor as a challenge in
business performance. However, if construction drawings lack detailed information,
quality will be compromised and may lead to client dissatisfaction and affect the
implementation of project to specifications.
The following legal and regulatory issues have a negative effect on the
performance of emerging contractors.
Legal and regulatory factors (see Table 4.24, below) were analysed and the results showed
that high health and safety costs had a negative impact on EC businesses. This was
confirmed by 81% on safety training costs and 78% induction costs, who either strongly
agreed or agreed to the negative impact of these variables.
Table 4.24: Legal and regulatory issues
Statement SA/A (%) N (%) DA/SD
(%) Rank
High safety training costs. 81 9 10 1
High safety induction costs. 78 9 14 2
Government policies in the construction industry
do not promote small scale construction
enterprises.
77 12 11 3
Cumbersome registration requirements and
stringent government and private support
systems.
76 13 11 4
High costs on medical requirements. 76 12 12 5
Expensive first aid requirements. 70 13 17 6
High costs on personal protection requirements. 70 15 15 7
The grading system in the construction industry 69 16 15 8
Average score 75 12 13 5

171
These results are in line with Cheung et al. (2004) and Ugwu and Haupt (2007), who
argued that health and safety requirements affect strongly the performance of construction
projects. This was followed by government policies in the construction industry, which
SBEs perceive as not promoting small-scale construction enterprises represented by 77%.
This may be construed to imply that the government procurement system is not doing
enough to promote the development of ECs.
The following statements relating to strategic planning have negative effect on
the performance of emerging contractors.
Table 4.25: Strategic planning
Statement SA/A (%) N (%) DA/SD
(%) Rank
Lack of clear objectives 82 6 12 1
Little attention is given to Strategic planning 82 9 9 2
Weak management practices 82 9 9 3
Little attention is given to stakeholders’ interest 81 8 11 4
Lack of long term vision 74 8 18 5
Average score 80 8 12 3
Strategic planning variables were analysed, and as Table 4.25 (above) shows, SBEs do not
have clearly defined objectives in their businesses. Little attention is paid to strategic
planning, weak management practices, stakeholder’s interest or long-term vision. This
category could be the most significant performance category that has a negative impact on
emerging contractor business as the factors cause business to collapse. Furthermore,
emerging contractors require a strong leadership that can plan and monitor, control and
manage projects with high quality performance.
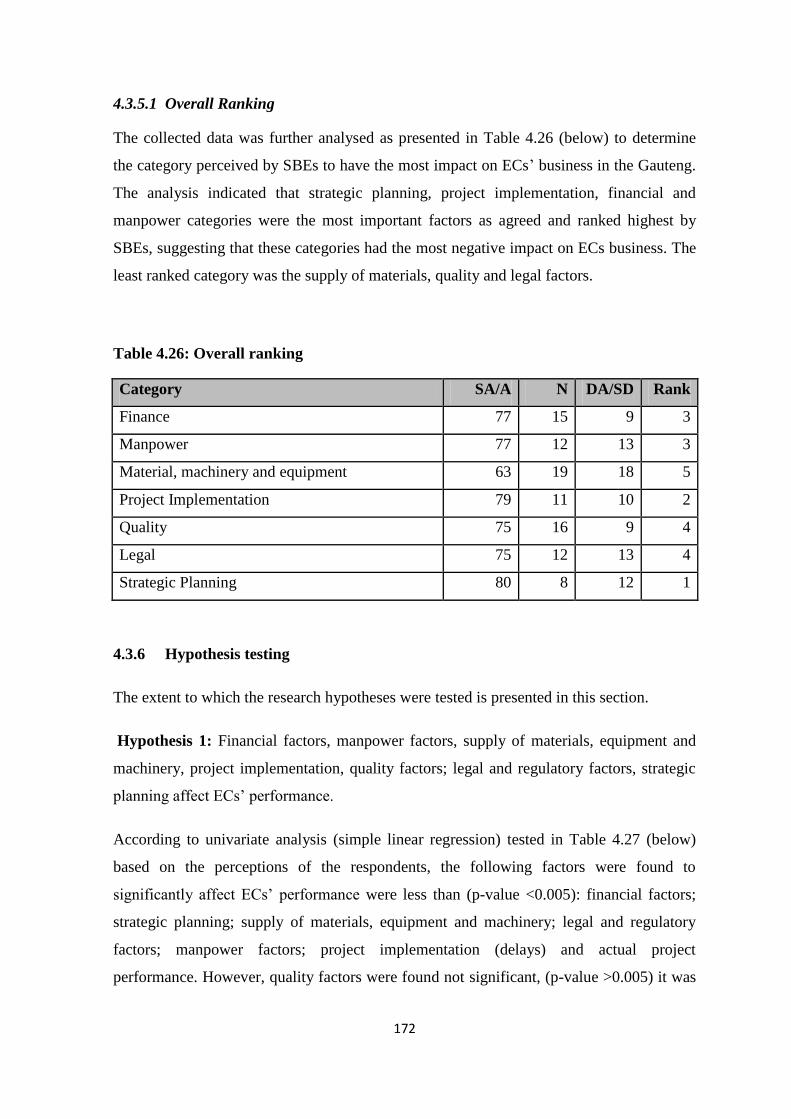
172
4.3.5.1 Overall Ranking
The collected data was further analysed as presented in Table 4.26 (below) to determine
the category perceived by SBEs to have the most impact on ECs’ business in the Gauteng.
The analysis indicated that strategic planning, project implementation, financial and
manpower categories were the most important factors as agreed and ranked highest by
SBEs, suggesting that these categories had the most negative impact on ECs business. The
least ranked category was the supply of materials, quality and legal factors.
Table 4.26: Overall ranking
Category SA/A N DA/SD Rank
Finance 77 15 9 3
Manpower 77 12 13 3
Material, machinery and equipment 63 19 18 5
Project Implementation 79 11 10 2
Quality 75 16 9 4
Legal 75 12 13 4
Strategic Planning 80 8 12 1
4.3.6 Hypothesis testing
The extent to which the research hypotheses were tested is presented in this section.
Hypothesis 1: Financial factors, manpower factors, supply of materials, equipment and
machinery, project implementation, quality factors; legal and regulatory factors, strategic
planning affect ECs’ performance.
According to univariate analysis (simple linear regression) tested in Table 4.27 (below)
based on the perceptions of the respondents, the following factors were found to
significantly affect ECs’ performance were less than (p-value <0.005): financial factors;
strategic planning; supply of materials, equipment and machinery; legal and regulatory
factors; manpower factors; project implementation (delays) and actual project
performance. However, quality factors were found not significant, (p-value >0.005) it was
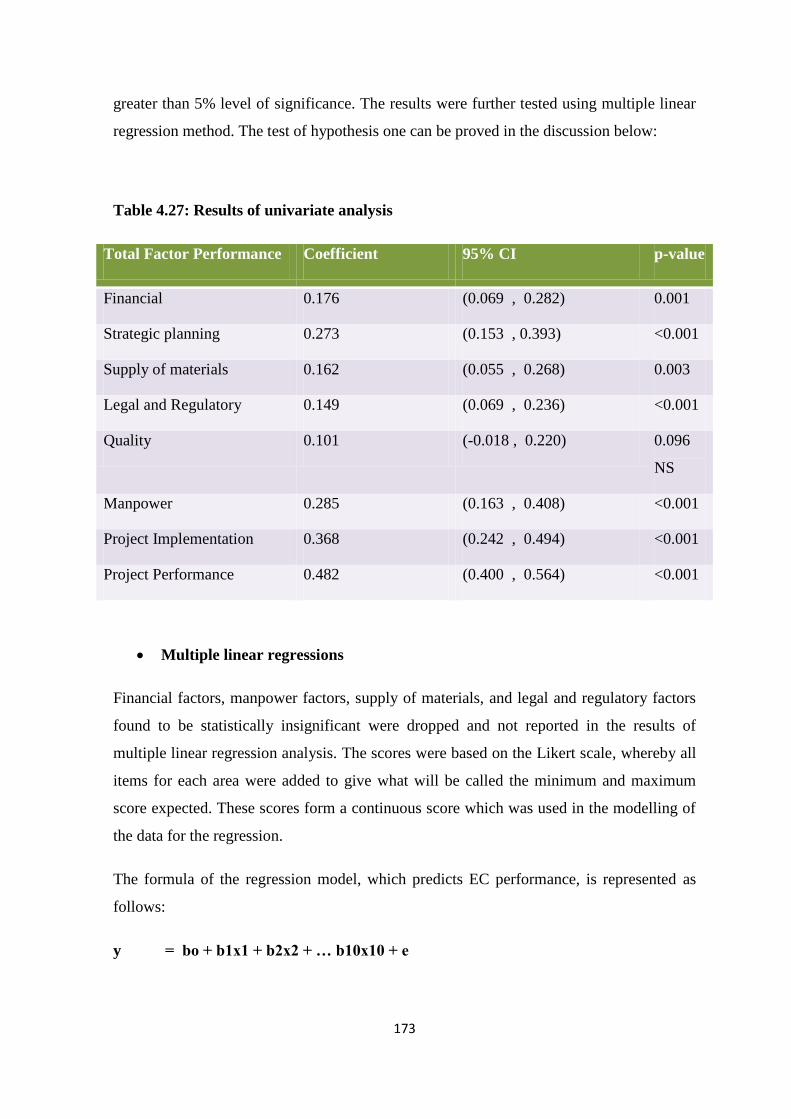
173
greater than 5% level of significance. The results were further tested using multiple linear
regression method. The test of hypothesis one can be proved in the discussion below:
Table 4.27: Results of univariate analysis
Total Factor Performance Coefficient 95% CI p-value
Financial 0.176 (0.069 , 0.282) 0.001
Strategic planning 0.273 (0.153 , 0.393) <0.001
Supply of materials 0.162 (0.055 , 0.268) 0.003
Legal and Regulatory 0.149 (0.069 , 0.236) <0.001
Quality 0.101 (-0.018 , 0.220) 0.096
NS
Manpower 0.285 (0.163 , 0.408) <0.001
Project Implementation 0.368 (0.242 , 0.494) <0.001
Project Performance 0.482 (0.400 , 0.564) <0.001
Multiple linear regressions
Financial factors, manpower factors, supply of materials, and legal and regulatory factors
found to be statistically insignificant were dropped and not reported in the results of
multiple linear regression analysis. The scores were based on the Likert scale, whereby all
items for each area were added to give what will be called the minimum and maximum
score expected. These scores form a continuous score which was used in the modelling of
the data for the regression.
The formula of the regression model, which predicts EC performance, is represented as
follows:
y = bo + b1x1 + b2x2 + … b10x10 + e

174
Where:
y is the total factor performance (TFP) or predicted EC performance, and is the key
variable of interest this research wants to predict.
bo is the predicted value of TFP without any factors being accounted for. It is the
estimated value of y when all the Xi = 0.
b1, b2, b3 …… b10 is the change in the EC performance of TFP associated with a unit
change in the variable x1, x2, x3 …. X10.
E is the error term associated with the measurement error of the variables put in this
model.
Table 4.28 (below) indicates summary of the regression analysis for statistically significant
factors only:
Table 4.28: Results of multiple linear regression analysis
Total Factor Performance Coefficient 95% CI p-value
Strategic Planning 0.117 0.007 0.227 0.037
Project Implementation 0.345 0.228 0.462 <0.001
Project Performance 0.488 0.410 0.565 <0.001
The multiple linear regression models below indicate the remaining significant factors
based on the calculation STATA version 12. The estimated total factor of performance or
predicted EC performance was 1.97.
Perceived Emerging Contractor Performance = 1.97 + 0.117 Strategic Planning +
0.345 Project Implementation + 0.488 Project Performance.

175
Where (model interpretation):
The value of “1.97” in the model represents the attainable performance (moderate) that
would be achieved by ECs when variables such as strategic planning, project
implementation and project performance are excluded.
The value of “0.117” indicates that a unit increase in strategic planning causes a 0.117 unit
increase in ECs’ performance.
The value “0.345” shows that a unit increase in project implementation results in a 0.345
unit increase in ECs’ performance.
The value “0.488” shows that a unit increase in project performance results in a 0.488 unit
increase in ECs’ performance.
Model diagnostic tests
Model diagnostic tests carried out through the use of hypothesis one established that all the
assumptions for fitting a linear regression model had been satisfied.
4.3.6.1 Diagnostic graphs
The graphs in Figure 4.6 to Figure 4.12 demonstrate that all the assumptions for fitting the
linear regression model were met. This is because the residual plots are fairly linear and
hence the fitted model is considered to be reliable and valid.

176
Figure 4.6: Plot of residuals against strategic planning total score
-20
-10
010
20
Re
sid
ua
ls
5 10 15 20 25sptot
The strategic planning score residuals as show in figure 4.6 (above) is much positive which
is a signal that strategic planning is an important variable determining the performance of
ECs. Strategic planning seems much more important in the beginning as shown by the
residuals.
Figure 4.7: Plot of residuals against project implementation total score
-20
-10
010
20
Re
sid
ua
ls
5 10 15 20 25ptottt
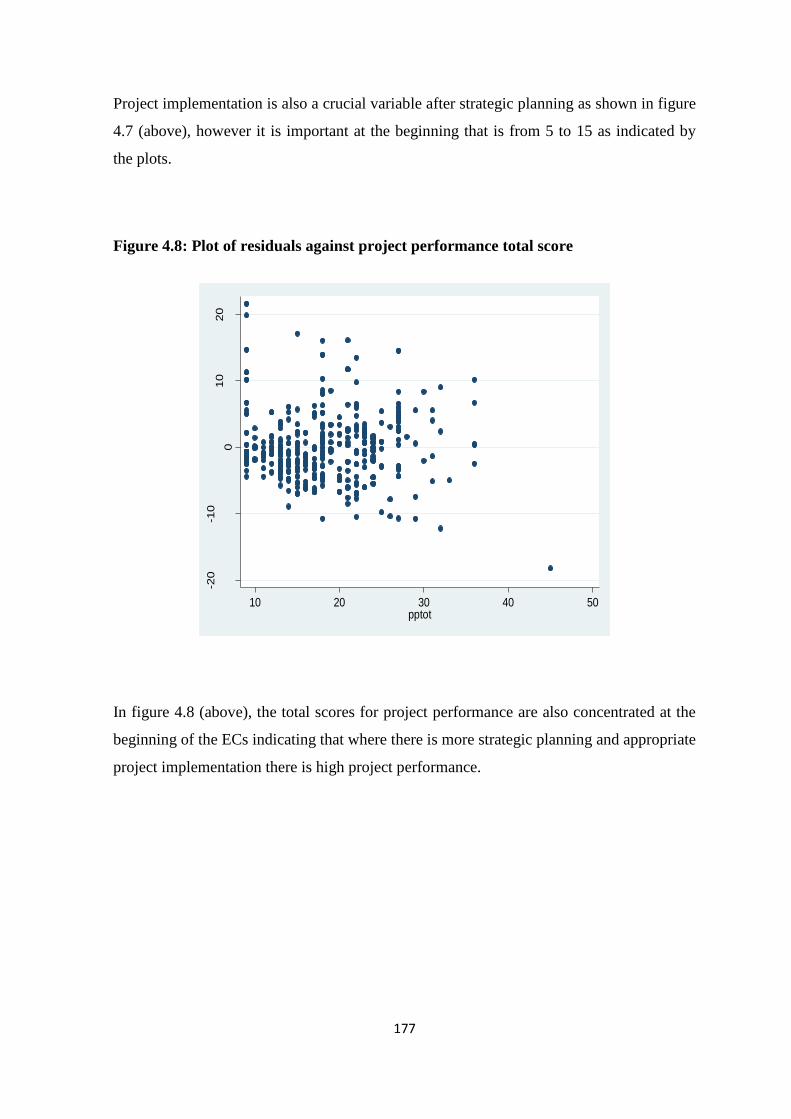
177
Project implementation is also a crucial variable after strategic planning as shown in figure
4.7 (above), however it is important at the beginning that is from 5 to 15 as indicated by
the plots.
Figure 4.8: Plot of residuals against project performance total score
-20
-10
010
20
Re
sid
ua
ls
10 20 30 40 50pptot
In figure 4.8 (above), the total scores for project performance are also concentrated at the
beginning of the ECs indicating that where there is more strategic planning and appropriate
project implementation there is high project performance.

178
Figure 4.9: Normality plot of EC performance total
0.0
00.2
50.5
00.7
51.0
0
No
rmal F
[(ito
t-m
)/s]
0.00 0.25 0.50 0.75 1.00Empirical P[i] = i/(N+1)
The graph shows that when the ECs are operating normal, the empirical are also increasing
demonstrating growth and normality.
Figure 4.10: Normality plot of strategic planning total
0.0
00.2
50.5
00.7
51.0
0
No
rmal F
[(sp
tot-
m)/
s]
0.00 0.25 0.50 0.75 1.00Empirical P[i] = i/(N+1)

179
The graph shows that the normality of strategic planning depends on the stage of ECs in its
growth.
Figure 4.11: Normality plot of project implementation total 0.0
00.2
50.5
00.7
51.0
0
No
rmal F
[(p
tottt-
m)/
s]
0.00 0.25 0.50 0.75 1.00Empirical P[i] = i/(N+1)
Normality of the project implementation is the same as the normality of strategic planning
also indicating that it changes and varies with the growth of the ECs.

180
Figure 4.12: Normality plot of project performance
0.0
00.2
50.5
00.7
51.0
0
No
rmal F
[(p
pto
t-m
)/s]
0.00 0.25 0.50 0.75 1.00Empirical P[i] = i/(N+1)
The normality of the project performance depends on the use of time, the more the time is
used efficiently the higher the performance of the project.
Based on the information above, the assumptions, namely linearity, linear independence of
predictors, normality and constant variance of residuals were satisfactory. Thus the model
is valid for the data.
Hypothesis 2: Project performance positively affects the overall corporate
performance.
According to the regression model established above project performance positively
affects emerging contractor performance (positive coefficient of 0.488). As indicated in the
model, project management receives direction and support from executive management
and also acquires resources from the asset management portion of the organisation. Thus,
the success of a project hinges on the performance of project management, with emphasis
on the achievement of time, cost and quality targets (and achievement of health and safety
requirements. The common causes of project failure include lack of clear links between
the project and the organisation’s key strategic priorities such as agreed measures of
181
success, lack of clear senior management and leadership; lack of effective engagement
with stakeholders; lack of skills and proven approach to project management and risk
management; too little attention to breaking development and implementation into
manageable steps; evaluation of proposals driven by initial price rather than long term
value for money; lack of understanding of, and contact with the supply industry at senior
levels in the organisation and lack of effective project team integration between clients, the
supplier team and the supply chain.
Hypothesis 3: Perceptions of SBEs can affect positively or negatively their
business performance.
The perceptions of SBEs were defined as the sum of all the responses from the section on
perceptions on determinants of emerging contractor performance. Investigating the
correlation of perceptions and emerging contractor performance indicated that perceptions
of SBEs positively affect (r = 0.254) their business performance. The hypothesis was
tested by calculating the correlation coefficient between SBEs perceptions and business
performance and the coefficient calculated using STATA version 12 showed a positive
coefficient r = .254
Hypothesis 4: There is a relationship between company profiles and Business
performance.
Regression analysis of emerging contractor performance against the number of years the
business has been operating indicates that there is no significant relationship (p-value =
0.126) between the two. Upon carrying out regression analysis, it is noted that there is no
significant relationship between company performance and size of the company in terms
of manpower (p-value = 0.1895) and in terms of skilled workforce insignificant (p-value =
0.625). This may possibly be explained by the observation that there is an insignificant
number of skilled workers in each company (> = 3).
The variable emerging contractor performance was converted to a categorical variable in
order to carry out tests of association. The chi-square tests of association carried out
indicated that there is no significant relationship between business performance and race

182
(p-value = 0.261), gender ownership (p-value = 0.804) and disability status (p-value =
0.255). However, there is a significant relationship between age of owner and business
performance (p-value = 0.000) and the correlation coefficient is -0.1899 indicating that as
age increases performance decreases.
There is no significant relationship between business performance and type of service
offered, civil engineering (p-value = 0.996) and general building (p-value = 0.560).
There is no significant relationship between business performance and type of project,
government (p-value = 0.777) and private development (p-value = 0.751).
4.3.6.2 Summary of quantitative data
Four hypotheses have been presented which confirm the key determinants of emerging
contractors and the effect of perceptions on performance. Table 4.29 (below) provides a
summary of the results for the study indicating that the first three hypotheses were
supported while the fourth hypothesis was rejected.
Table 4.29: Summary of hypotheses results
# Hypotheses Findings
H1
Financial factors, manpower factors, supply of materials, equipment
and machinery, project implementation, quality factors; legal and
regulatory factors, strategic planning affect emerging contractor
performance.
Supported
H2 Project performance positively affects the overall corporate
performance. Supported
H3 Perceptions of SBEs can affect positively or negatively their
business performance. Supported
H4 There is a relationship between SBEs profiles and business
performance.
Not
supported

183
4.4 CHAPTER CONCLUSION
The data which the research found in the field has been presented in this chapter. It was
collected from the interviewees as representatives of ECs and in response to the research
questions presented in the research instruments. The qualitative data was condensed and
presented into themes relevant to the research question as outlined in chapter 1 section
1.3.2. The data from qualitative research was further broken into sub-themes which were
tested in the field and have been presented in this chapter (Part B – Quantitative results). In
Part B of this chapter, the relationships among variables were examined. When the results
in this chapter are compared to the conceptual framework discussed in chapter two, the
concepts indicated in the conceptual framework have been confirmed by the results of this
research with exception of quality factor using univariate analysis. However, using
multivariate analysis, the following factors financial, manpower, material, machinery and
equipment, legal and regulatory were not found to be significant and were dropped. The
analysis found strategic planning, project implementation and project performance as the
most significant factors.
The next chapter synthesis and analyse the results of this study. This is to check if there are
any agreements and disagreements between qualitative, quantitative data and literature as
presented in chapter two.

184
CHAPTER FIVE
SYNTHESIS AND ANALYSIS OF RESULTS
5.1 CHAPTER INTRODUCTION
This chapter synthesises and analyses the results of the research findings that were
presented in the previous chapter. The research used mixed methodology, therefore it was
imperative to validate the results from diverse methods (qualitative and quantitative
approaches), data sources, theories and investigator tactics. This combination enhanced
validity and reliability of the results as well as extending the scope and depth of
understanding of the subject. The qualitative and quantitative results of this study were
integrated using data transformation, case analysis and typological development.
5.2 DATA TRANSFORMATION
The results presented in the previous chapter (Part A and Part B) have shown that a
sequential strategy is followed. The results from exploratory data collection are used in
quantitative data analysis, as illustrated below in Figure 5.1 (below).
Figure 5.1: Integration of results
The purpose of this strategy is to show that quantitatively data analysis assisted in
interpretation of qualitative results and enabled generalisation of qualitative findings to
different samples. Thus, the qualitative results were used to negotiate access to the
quantitative phase, though the results from quantitative complemented those achieved from
the qualitative research by providing an enriched understanding of perceived factors
affecting ECs business performance and served to redirect the prediction of their
Qualitative Data
Collection & Results
Integration/Interpretation Quantitative Data
Collection & Results
Builds
To
185
performance. Based on the insights generated from the themes and specific statements
made by key informants in the qualitative phase, an instrument was developed that was
used to collect information for quantitative data analysis.
5.3 CASE ANALYSIS: DETERMINANTS OF BUSINESS PERFORMANCE
Although there is a great focus on housing projects and large scale infrastructure projects
in South Africa that could act as an opportunity to ECs, this research has found that ECs
encounter many incidents that impede business performance. This section analyses cases
that emerged from the qualitative study that were also confirmed by quantitative results, in
order to determine the perceived determinants of business performance. The following
review presents the exceptional examples found in qualitative results and which were
confirmed via quantitative data analysis methods.
5.3.1 Financial challenges
There are agreements between the results obtained from the qualitative study and the
quantitative results over late payment problems and lack of collateral and assets. Most key
informants representing ECs reported late payment problems beyond 30 days (Table 4.2).
This demonstrates the inability of clients in Gauteng to honour payments on time to ECs
and resultant delays in building construction projects, as evidenced by Contractors A and
B who had to stop work waiting for payment. The respondents further expressed
dissatisfaction in the construction business as a result of payment problems and were not
keen to confront their clients on payments as they were afraid of losing future
opportunities. This suggests the source of emerging contractors’ financial difficulties and
challenges, and explains why ECs struggle as a result of insufficient funds to carry out the
construction work as stipulated. The culture that exists in the industry if a small contractor
presents a grievance to the main contractor may later lead to blacklisting by the client, thus
jeopardising the chances of future employment.
The incident of late payment was confirmed by 89% of respondents in a quantitative
survey who perceived that EC businesses are affected by cash flow problems which result
from late payments on both parties (Table 4.19). This implies that ECs find themselves

186
using owner’s equity to pay for wages and salaries due to late payments, as reported by
Contractor B, C, D and F. Furthermore, 83% of the respondents perceived non-payment of
rework of defective project units as an impediment, especially when the problem was
caused by the main contractor (Table 4.19). Contractor C indicated that he did not get paid
for processing reinforcing steel on site, but in spite of this he paid employees from his
pocket for extra work. However, in the construction industry, when such incidents happen,
the main contractor was required to issue a site instruction that would be used by the EC to
make a claim. Such practices have a knock-on effect on ECs’ performance as they would
be unable to recover such costs. Again, this demonstrates the long and bureaucratic
processes experienced by ECs towards receiving their payments.
Access to finance
The qualitative and quantitative results concur that access to finance is not easy. The key
informants (Contractor A – F) perceived lack of capital and access to finance as major
challenges to EC business performance. The quantitative results established 88% of the
respondents who perceived lack of collateral security in the form of assets as a challenge
towards EC business performance (Table 4.19). This result demonstrates lack of
appropriate mechanisms developed in the construction industry to take into account the
financial requirements of ECs. In the absence of appropriate financing mechanisms, ECs
are bound to lose construction opportunities as they would not be able to meet tender
criteria. As a result of cash flow problems, Contractor E could not complete the
construction of a housing project. The research further established that SBEs perceived
banks as reluctant to extend credit to ECs and when they did they charged exorbitant
interest rates. This is an indication that borrowing from established banks is perceived as
expensive for EC business. While this may be the case, SBEs representing EC businesses
can be educated about banking operations.
Banks require assurance that ECs’ projects would offer a reasonable return on investment
(ROI) which can only be demonstrated through sound business plans submitted to them.
SBEs require guidance on how to apply successfully for bank credits and to demonstrate
that their projects are viable investment opportunities. Thus, businesses that demonstrate
and submit sound business plans to banks would be successful in accessing finance. The

187
results of this research suggest that ECs are not in a position to acquaint themselves with
available credit opportunities.
Payment of performance guarantee
The other agreement that emerged between qualitative and quantitative results relates to
the payment of performance guarantee or deduction of retention. The emerging contractors
complained about the payment of performance guarantee. The respondents claimed that
they were unable to raise the required performance guarantee and would end up losing
contacts in the process. Contractors A and E experienced challenges when they could not
raise the performance guarantee and in some cases they lost the guarantee or retention at
the end of the projects due to alleged claims. When asked about payment of performance
guarantee, 77% of respondents confirmed the result arguing that payment of performance
guarantee affected ECs’ cash flow position (Table 4.19). However, it should be pointed out
that in reality no client in South Africa would accept making an upfront payment to
anybody without any form of performance assurance from ECs.
Bidding prices
Bidding prices were found to be unworkable, as they were too low. The informants
reported that the situation existed because there was low demand of work as a result of
large and small contractors chasing the same work and the profits attached to these
projects being low. The 67% of respondents perceived that the prices used by ECs to
secure construction jobs was low to sustain business success (Table 4.19), which
demonstrates that profits achieved by ECs were low if not negative and would not be
sufficient to cover all business expenses. In any business operation, lower than expected
profits are a major concern that should always be protected. This suggests lack of
experience and understanding of project costing among SBEs and needs to be addressed if
they are to make profits and grow.

188
5.3.2 Manpower challenges
On the aspect of manpower challenges, the key informants argued that availability of
employees with high experience and qualifications is a major challenge in the construction
industry (Contractors A – F, Table 4.3), and this has a negative impact on quality, time,
cost and productivity of ECs (Contractor E). The shortage of skilled manpower in the
industry was confirmed by 86% of respondents in the quantitative survey and in another
similar item 85% of the respondents perceived experienced and competent labour force as
a key issue affecting EC performance (Table 4.20).
While the shortage of skills was perceived by SBEs as a major factor affecting project
implementation, none of the respondents indicated any possibilities of what they were
doing to solve the problem of skills shortages in the industry, indicating that SBEs were
not complying with the requirements of the Skills Development Act of 1998, which states
that employees must be exposed to two days of training for every 22 days of work and that
a minimum of 2% of a project’s budget should be allocated towards training programme.
This implies that ECs are required to send their staff for further training or education to
improve skills and knowledge in the industry. However, ECs may lack the required
resources to facilitate such training, suggesting that the government must assist those ECs
who engage in training their workforce to equip them with new skills. This may also
suggest that ECs and main contractors need to form alliances to share skills and knowledge
in the industry as this would facilitate transfer of much needed skills.
This research established that real shortages exist among construction artisans and covers
the entire spectrum of building craftsmen, including bricklayers, carpenters, plumbers and
reinforcing steel fixers. Such qualifications can only be improved through apprenticeship
training facilities and this result suggests the South African government needs to consider
establishing such facilities as these skills form the backbone of any developing economy.
Labour productivity
Perceptions about labour productivity indicated that the quality of labour in the industry
was poor, resulting in low labour productivity (Contractors A – F, Table 4.3), causes of
which include low wages, union agreements, absenteeism and high level of turnover in the
189
industry. Poor working conditions in terms of low wages and salaries were highlighted by
key informants. Quantitatively, 80% of respondents confirmed low labour productivity in
the industry (Table 4.20), whilst both qualitative and quantitative results indicated poor
working conditions and low wages as having led to low morale and high levels of
employee absenteeism, in turn resulting in low labour productivity. This suggests that ECs
did not comply with relevant legislation requirements such as the Basic Conditions of
Employment Act (75 of 1997) and Labour Relations Act (66 of 1995). However, paying
employees low wages is not unique to the construction industry, and is prevalent in almost
all South African industries. As a result, key informants reported the employment of
unskilled foreign labourers because foreign labour was much cheaper than local labour
(Table 4.3). Again, this demonstrates that foreign labourers are a source of cheap labour in
the South African construction industry. It is, however, vital that SBEs as representatives
of ECs consider giving a living wage and decent work to employees if their businesses are
to succeed. Contractor A had said: “Employee morale was low throughout the duration of
the project, Employees were not properly remunerated and this had a negative impact on
productivity.” Given such a practice, ECs are bound to fail until the human resource factor
has been adequately addressed in the industry. It is vital for any business to invest in
human capital in order to succeed in the construction business.
Another finding on manpower related to late payments of wages and salaries, which
resulted in low morale and contributed towards low labour productivity. This result was
confirmed by 85% of respondents in a quantitative survey who confirmed a high rate of
labour disputes and strikes (Table 4.20). The result indicates that ECs either do not pay
employees market-related rates or pay them late. This was attributed to a number of
factors, chief among which respondents claimed non-payment of completed work by the
client and poor cash flow management. These results are in agreement with the perceptions
of the key informants who indicated that they use the money from one project to finance
other projects and use money to fund personal needs (Contractor E). This potrays
greediness among SBEs who do not pay employees and, given this practice, retaining
appropriately skilled employees would be a challenge and risk to EC business growth.
Industrial strikes
Key informants perceived industrial action and strike as having negative impact on project
implementation as these cause delays on construction projects (Contractor A – F, Table

190
4.3). It was confirmed that industrial action erupted while construction projects were in
progress, which affected project implementation as the construction sites remained closed
for weeks while employees were participating in industrial action and demonstrations. This
result was confirmed by 85% in a quantitative survey (Table 4.20), suggesting lapses in the
industry’s good practise in respect of working conditions, payment and rates of pay, as
outlined in the Basic Conditions of Employment Act 75 of 1997.
5.3.3 Materials and machinery
The key informants suggested that the availability of equipment and material on
construction site was crucial, however, Contractors A, B, C, D, E and F perceived that the
unavailability of overhead cranes and material, and breakdown of equipment and
machinery delayed the progress of their projects (Table 4.4). The key informants attributed
delays to poor planning, which resulted in material shortages, poor servicing of equipment
and machinery and resultant breakdowns. The research established that when material was
available it was often wasted (Contactor B and E), and projects suffered from a problem of
time and cost performance. Contractor A could not execute the excavation work because
he had no reliable machinery and experienced frequent breakdowns that affected project
delivery time. In a similar fashion, Contractor C wasted large quantities of reinforcing steel
on site due to poor material management. These results were confirmed by quantitative
results in which 74% of the respondents argued that regular shortages of material were a
contributory factor in business performance, whilst 68% argued that excessive wastage of
material during the application process was also a contributory factor (Table 4.21). This
result demonstrates poor planning on the part of project management, inefficient
communication among project team members and unreliable suppliers of material. The
effect is that when there is delay of supply of material, such as reinforcing steel,
breakdown of equipment such as overhead crane (Contractor A and B), the casting and
handing over of completed work would be delayed.
This research established effective material planning as a major problem in project
management, which translates into poor EC business performance. It demonstrates the
importance of effective material planning on construction sites and this should be carried
out according to the construction work during a particular period of time.

191
Another factor noted from the qualitative results related to marshalling tools, materials,
plant and equipment on site (Contractor A, B, C, D and F). The key informants argued that
the activity, though a necessary operation on the construction exercise, took a large amount
of productive working time. Contractor C reported that reinforcing steel was not stored
close enough to the work area, which led to double handling (Table 4.4). The movements
of these materials and supplies around the construction project had a negative impact on
the productivity and performance of this contractor.
The use of inappropriate material was widely reported by the key informants (Table 4.4)
and confirmed by 56% of respondents who participated in the quantitative survey (Table
4.21). This demonstrates lack of technical knowhow in the industry on quantity surveying
of construction material and possible cost overruns, thereby affecting the viability of ECs.
Again, this suggests lack of material planning leading to wastage of material on site. In the
material category, the quantitative results showed that lack of technical knowhow on
quantity surveying of construction material was a factor that affected business
performance, as confirmed by 67% of the respondents (Table 4.21).
Poor site management was widely perceived by key informants, indicating failure by main
contractors to properly manage construction sites (Table 4.4). The respondents perceived it
as a result of lack of experience, skill and knowledge in managing a construction project
and material planning. This result demonstrates the source of delays in construction
projects which impact on the performance of ECs and explains why ECs are not
succeeding as they fail to monitor progress of construction works or material planning and
could not manage all the administrative work in the project due to the influence of other
stakeholders.
The research further established that emerging contractors lacked financial planning, as
revealed in section 5.4.1, and at times entered into construction work without adequate
equipment or machinery (Contractor A and E) due to lack of capital or collateral that could
be used to secure loans through formal financial institutions. The result confirms the
importance of ECs making savings in every project, and procuring and owning tangible
resources that can be used in subsequent transactions as collateral security.

192
5.3.4 Project implementation
The analysis of project implementation results confirmed incidents that had an impact on
the performance of businesses, including weather conditions, liquidation of the main
contractor, low bidding price, project delay and lack of detailed information on
construction drawings (Table 4.5). With regards to weather conditions, SBEs needed to
know that these delays were excusable in the industry and no party had any control over
natural occurrences. These delays were caused by unforeseen factors beyond the control of
any contractor or other party and were not attributable to their fault or negligence.
The quantitative survey revealed that 84% of respondents spent much time waiting for
materials to arrive and for site inspections, while 79% confirmed that they had been given
unrealistic time to complete projects by clients. With 78% citing lack of project
coordination among contractors, subcontractors, clients and consultants (Table 4.22), this
demonstrates that ECs’ performance is affected by delays during the execution of projects,
some of which are caused by the client or the main contractor who at times underestimate
the completion time. This suggests lack of personnel in the industry with management and
estimating skills within the EC business.
An analysis of qualitative results on project implementation demonstrated that the success
rates is lower as a result of poor planning and coordination of activities by the main
contractors, and mistakes or defective work as a result of omissions in the construction
drawings (Table 4.5), as confirmed by 78% who participated in the quantitative survey and
who perceive that lack of project coordination among contractors, subcontractors and
consultants affected the performance of EC business (Table 4.22). This suggests that the
performance of ECs is not based solely on SBEs conduct but rather other stakeholders
have a role to play.
Respondents were asked about their perceptions on the effects of project delay in
construction, with results showing that at times projects were not started on time, were
delayed along the way, and were subject to catching up, with pressure exacted on
subcontractors (Table 4.22). Respondents perceived that main contractors created
problems by imposing unrealistic completion time which squeezed ECs profit margins.
However, as discussed in section 5.4.1, the contracts manager should issue a site
instruction to the contractor to factor in the costs incurred by the subcontractor in the event

193
that work has to be carried out to catch up on programme. This research established poor
site management, lack of communication and misunderstandings between ECs and main
contractor as reasons the site instructions were not issued, thus demonstrating lack of
contractual understanding among ECs and resultant unnecessary delays in project
implementation. Therefore, it is vital for SBEs to apply effective and efficient site
management control that would promote their business performance.
5.3.5 Quality challenges
Poor quality of work among ECs was established in this research as a major hindrance to
EC performance. For example, contractor E could not complete the construction of a house
in Boksburg, which left the client despondent and suggested that some ECs were not aware
that their future work depended on the relationships created with clients based on overall
performance from completed projects. The final structure had defects that included
cracking foundations as a result of improper installation of reinforcing steel for a special
foundation. If ECs consistently deliver poor quality on projects, as contractor E, this would
lower the success rate of their businesses. The results from the qualitative survey
corroborates those of the quantitative survey, with 74% of respondents perceiving inability
to produce works of acceptable standard as a challenge, although 79% attributed this to
architectural drawings that lacked adequate technical information (Table 4.23). On the
same theme, 79% argued that poor quality was a result of poor relationships on
construction sites between ECs and stakeholders, such as main contractors (Table 4.23).
The basic issue regarding quality is that SBEs as service providers must remain focused on
the issue of client satisfaction, on which the success of their project execution and business
performance is solely dependent. Contractors B and E demolished the structures after the
engineer had failed to approve their quality, demonstrating that poor quality is costly to the
client as it causes them financial and emotional hardship. Clients would recount stories of
poor structures due to correcting defective work. The quality of work established by this
research may be a reflection of quality levels in the South African construction industry,
particularly the ECs sector. Given such sentiments, SBEs therefore need to work towards
improving the quality standards of their workmanship if they are to restore the dignity of
ECs in the industry. However, this result may confirm that ECs do not have adequate

194
resources to address quality problems. In any case, substantial quality improvements and
efficiency are needed from ECs if they are to succeed and grow through the CIDB grading.
The results on quality demonstrate that ECs lack appropriate quality standards that could
be used to measure quality performance. An example of a quality measure standard that
could be adopted in South Africa is the practice in Singapore in which high quality
standards are achieved through the introduction of the Construction Quality Assessment
System (CONQUAS). This serves as a standard assessment method on the quality of
building projects. Contractors use scores to set targets to achieve and assess the quality of
finished building.
5.3.6 Legal and regulatory factors
The results received from both qualitative and quantitative approaches on health and safety
requirements are mutually corroborative. The key informants perceived lack of compliance
by ECs as existing on construction sites, and health and safety requirements not being
enforced when ECs worked on small projects, such as houses, though they become
important when engaging in large projects (Table 4.7). It is therefore on large projects that
ECs incur costs and lost time when they are forced to adhere to health and safety
requirements. This result was confirmed by 81% of respondents who participated in the
quantitative survey (Table 4.24). On the same table, respondents perceived health and
safety requirements as having a negative impact on ECs’ business performance, citing high
safety training costs (81%), high induction costs (78%), high costs on medical
requirements (76%), expensive first aid requirements (70%) and high costs on personal
protection requirements (70%).
The research established that SBEs representing ECs perceived health and safety
requirements as expensive for their businesses and felt that large businesses should carry
all costs when they were sub-contracted. However, despite SBEs’ displeasure on this
theme, it is important for ECs to understand and adhere to the Health and Safety Act, as
amended by the Occupational Health and Safety Amendment Act (181 of 1993). This is
the instrument that provides for the health and safety of persons at work in connection with
the use of plant and machinery and the protection of persons, other than those at work,
against hazards to their health and safety. Safety is a major concern for every construction

195
company, regardless of the type of work performed. Therefore, SBEs need to adhere to
Occupational Health and Safety requirements.
5.3.7 Strategic planning
From the findings pertaining to strategic planning, the quantitative results confirmed the
results that emerged from the qualitative study whereby most of the key informants had
indicated that most construction businesses were neither planned nor defined before
implementation (Table 4.8). The research established that SBEs learned from colleagues in
the field, whose businesses were either performing well or not performing at all. When
asked about formulation of long-term vision, 82% agreed that they had no clearly stated
vision statements or objectives, and when asked about strategic plans the same percentage
(82%) confirmed that there were no strategic plans for their businesses and no
management practices (Table 4.25). Through these results, it was observed that
management practice in EC business does not meet the recommendations of the strategic
planning literature, namely, that businesses should engage in planning for the future to
compete effectively and survive. Without appropriate strategic plans, ECs are bound to
make mistakes in project pricing and execution, as indicated in the financial category. As a
result of poor planning, some ECs, such as Contractor A, work on a project that is too
large for its own resources and thus fail to cope due to limited capacity. Consequently, ECs
without adequate strategic planning would not realise their performance potential in terms
of growth and may harm their survival prospects.
The results on strategic planning show that ECs need to have long-term vision whereby the
scope of business activities and objectives are defined. The scope of activities would
define the frameworks for strategic planning and addresses the type of projects in which
ECs wish to engage. This could encompass one or more sectors of construction, such as
building and civil work. ECs should be able to define the geographic location of business
activities and all this requires the preference of SBE based on the perception of the market.
Business objectives should be clearly determined, which would be used as criteria to
determine business success. In general, the long-term range goal of an organisation is to
increase the wealth of its owners or at least to maintain it at its original size.

196
5.3.8 Summary of analysis
The ranking of quantitative scores from the results (Table 4.26) indicated that the most
important determinants of EC performance are strategic planning and project
implementation. These factors were ranked as the factors that have most impact on ECs’
business performance, based on SBE perceptions on category items. Project
implementation comprises inadequate planning of projects before commencement,
inadequate tools and equipment, delay in delivery of materials and design changes during
project execution. The results of this research demonstrate that strategic planning and
project implementation are the main factors that need to be considered when engaging in
the construction business. Planning involves a number of aspects that were established in
this research, namely, financial planning, cash flow management, pricing, human resources
management, material planning and planning for health and safety requirements.
5.4 TYPOLOGICAL DEVELOPMENT
Typological development involves the use of conceptual categories emergent from the
analysis of one type of data to the analysis of a contrasting data type (Caracelli and
Greene, 1993). The results from qualitative and quantitative methods were integrated
based on the use of conceptual categories identified. In section 5.3 (above), the broad
categories perceived to have an effect on business performance were established from both
qualitative and quantitative approaches, namely, Finance, Manpower, Material, mechanical
and Equipment, Project Implementation, Quality, Legal and Regulatory and Strategic
Planning. The research established incidents that indeed shaped the performance of EC
businesses as indicated in Table 4.9 in chapter four. In that table, for instance, the finance
category included the identified critical incidents that have been encountered by ECs and
similarly with other categories. The key informants were in agreement in most of the
incidents that have impacted on business performance, including late payments, low
bidding prices, payment of performance guarantee or retention, shortage of skilled and
knowledgeable manpower, strike and industrial action, cumbersome labour processes, lack
of capital and collateral, equipment breakdown, shortage of material on sites, loss of
material on sites due to damage and theft, delayed projects, poor site management, changes
in construction drawings, late inspection, absence of health and safety controls, weak
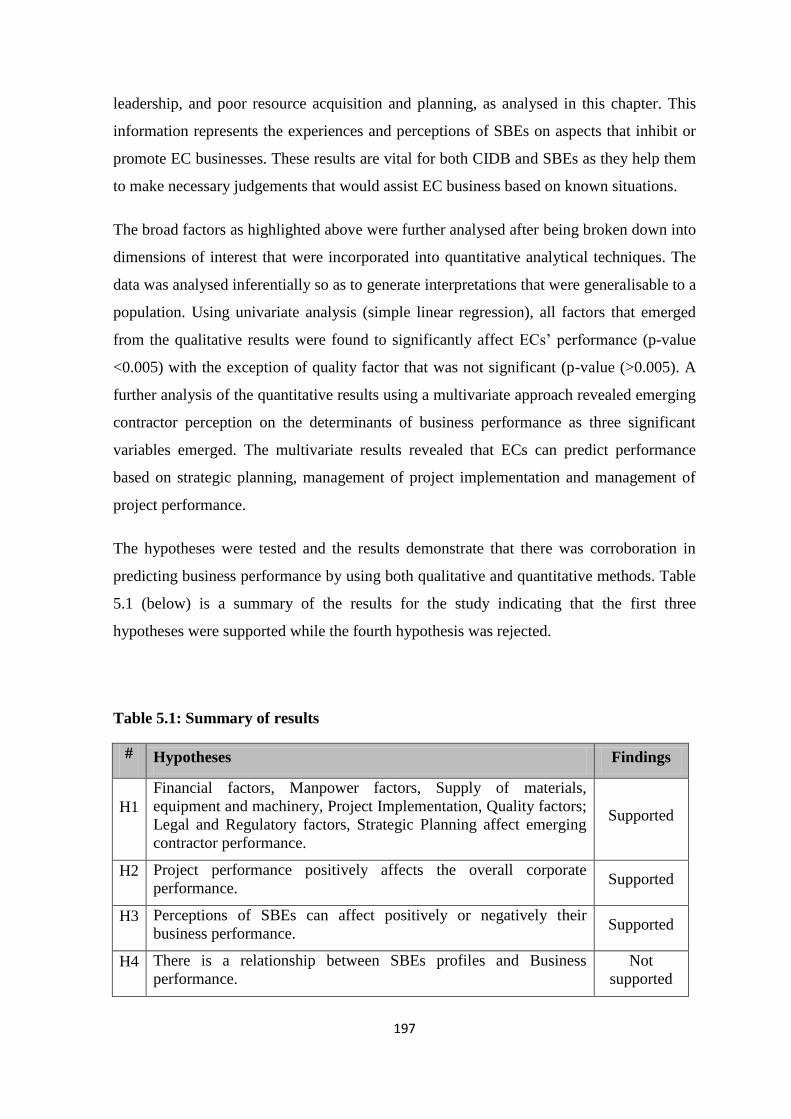
197
leadership, and poor resource acquisition and planning, as analysed in this chapter. This
information represents the experiences and perceptions of SBEs on aspects that inhibit or
promote EC businesses. These results are vital for both CIDB and SBEs as they help them
to make necessary judgements that would assist EC business based on known situations.
The broad factors as highlighted above were further analysed after being broken down into
dimensions of interest that were incorporated into quantitative analytical techniques. The
data was analysed inferentially so as to generate interpretations that were generalisable to a
population. Using univariate analysis (simple linear regression), all factors that emerged
from the qualitative results were found to significantly affect ECs’ performance (p-value
<0.005) with the exception of quality factor that was not significant (p-value (>0.005). A
further analysis of the quantitative results using a multivariate approach revealed emerging
contractor perception on the determinants of business performance as three significant
variables emerged. The multivariate results revealed that ECs can predict performance
based on strategic planning, management of project implementation and management of
project performance.
The hypotheses were tested and the results demonstrate that there was corroboration in
predicting business performance by using both qualitative and quantitative methods. Table
5.1 (below) is a summary of the results for the study indicating that the first three
hypotheses were supported while the fourth hypothesis was rejected.
Table 5.1: Summary of results
# Hypotheses Findings
H1
Financial factors, Manpower factors, Supply of materials,
equipment and machinery, Project Implementation, Quality factors;
Legal and Regulatory factors, Strategic Planning affect emerging
contractor performance.
Supported
H2 Project performance positively affects the overall corporate
performance. Supported
H3 Perceptions of SBEs can affect positively or negatively their
business performance. Supported
H4 There is a relationship between SBEs profiles and Business
performance.
Not
supported
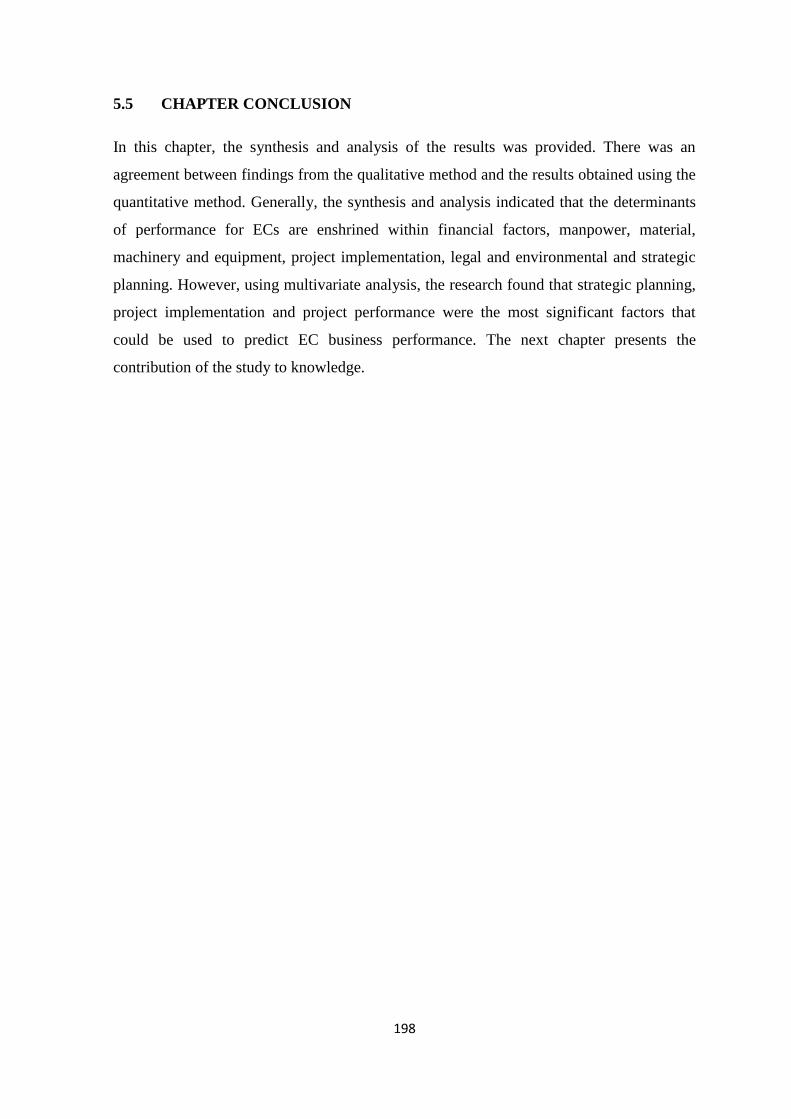
198
5.5 CHAPTER CONCLUSION
In this chapter, the synthesis and analysis of the results was provided. There was an
agreement between findings from the qualitative method and the results obtained using the
quantitative method. Generally, the synthesis and analysis indicated that the determinants
of performance for ECs are enshrined within financial factors, manpower, material,
machinery and equipment, project implementation, legal and environmental and strategic
planning. However, using multivariate analysis, the research found that strategic planning,
project implementation and project performance were the most significant factors that
could be used to predict EC business performance. The next chapter presents the
contribution of the study to knowledge.

199
CHAPTER SIX
CONCEPTUAL PERFORMANCE PREDICTION MODEL:
CONTRIBUTION OF THE STUDY
6.1 CHAPTER INTRODUCTION
This chapter reviews and highlights the contribution of the study to the body of knowledge
and to a better understanding of the key determinants of business performance through the
conceptual performance prediction model, which is elaborated next.
6.2 THE STRUCTURE OF CONCEPTUAL PERFORMANCE PREDICTION
MODEL
The proposed model was developed based on the data generated from the perceptions of
SBEs who participated in the study. The model is divided into four stages: stage 1 being
the strategic planning, stage 2 being project implementation, stage 3 being project
performance and stage 4 being performance prediction as illustrated in Figure 6.1 (below).
Figure 6.1: The Structure of the conceptual performance prediction model
Business culture
Feedback & Evaluation
The determinants highlight the facilitators of ECs’ business performance. The model
predicts that in order for ECs to become profitable and sustainable in the construction
STAGE 1
Strategic Planning
SBEs
Defining
construction
business to pursue
Provision of
Resources
Business systems
and procedures
Information and
analysis
STAGE 2
Project implementation
Project management
Resources management
Communication on site
Site management
Innovation
STAGE 3
Project performance
Project management
Cost Performance
Project Delivery time
Project quality performance
Stakeholder Performance
STAGE 4
Predicted
performance

200
business, SBEs must continually increase or put more effort on the three determinants
identified and this would result in desired business outcomes and stakeholder expectations
(community, government, customers and investors).
6.2.1 Business Culture
The foundation of the research model demonstrates that leadership should develop
business culture that supports continuous improvements and allows information sharing
among parties that include SBEs, project management and teams. Such a culture would
enable project management to receive regular support from SBE leadership in form of
resources and this would promote project success that would translate into business
performance. However, the research could not establish business culture of the executives
interviewed.
6.2.2 The determinants of performance
Based on the results of the study, three significant determinants of the performance of ECs
in Gauteng were identified, namely, strategic planning, project implementation and project
performance, as indicated in various stages of the model in Figure 6.1 (above). The model
predicts that an appropriate management of these determinants by SBEs would result in
superior construction business profitability, and business growth and satisfaction among
stakeholders such as customers, community, government agencies and business
employees.
6.2.2.1 Strategic planning
Strategic planning is stage 1 of the model. The results of this study (Tables 4.25 and 4.28)
have shown inadequate application of strategic management principles and project
planning by some executives studied, despite literature that highlights their relative
importance in the construction business (Adendorff et al., 2011; Hill and Jones, 2009). The
research model contributes by emphasising the importance of strategic planning in
construction business whereby leadership takes a key role as a facilitator for the business

201
to achieve competitive advantage. Based on the research model, leadership is expected to
be familiar with competitive processes that include formulation of business goals, mission
and strategies, scanning and analysis of the environment, implementation, evaluation and
control of operational plans, as indicated in Figure 6.2 (below).
Figure 6.2: Strategic planning process
SBEs Provide Leadership
The results of this study reflected weak leadership in construction business, based on key
informants’ sentiments, as a contributory factor in ECs’ poor performance. The model
contributes by highlighting SBEs’ function as the starting point to providing leadership
and management commitment on overall business success by making decisions and
providing enabling culture to the construction business. The model emphases SBEs as
being in the right position to provide the direction the business should pursue and support.
Executives should provide resources to management as well as defining business systems
and procedures.
Defining the construction business to pursue
The results of this study identified inadequate processes in defining the scope of the
construction project and budgeting processes as indicated by key informants (Tables 4.19
and 4.25). The research model contributes by highlighting that successful completion of
construction projects requires understanding of projects development, adequate project
estimates, appropriate tendering prices, meeting deadlines and budgets to the satisfaction
of clients. The successful achievement of these key indicators requires adequate business
Business
mission Internal
environmental
analysis
Goal
formulation
Strategy
formulation
Program
formulation
Implementation Feedback
and control
External
environmental
analysis

202
definition and planning process from leadership before execution of the projects. This
implies that leadership must understand the complexity of the business projects and
provide its focus on customer and stakeholder satisfaction.
Provision of resources to project management
Despite literature that advocates the provision of adequate construction resources to
projects (Sillars, 2010; Dess, et al. 2008), the results of this study found projects that were
delayed and abandoned due to poor provision of resources (Contractors B, C, D; (Tables
4.22 and 4.28). The model contributes by urging SBE leadership to make appropriate
decisions on how to strategically provide resources (financial, human resources material,
machinery and equipment) that are important for the execution of projects. This requires
appropriate resource planning whereby SBEs would be able to provide resources to
construction projects when required, in line with resource-based theory.
Business systems and procedures
According to literature (Marx, 2012; CIDB 2012; Emuze 2011 and Ofori 2009), late
payment and low prices are problems that affect the performance of EC businesses, as the
result of this study confirmed. The conceptual performance prediction model contributes
by highlighting the important role business systems and procedures play in a construction
business. Based on these, the terms of payment of a project would be defined in the
contractual agreement and the project pricing policies and procedures would be
determined. Through this model, construction businesses require a set of project
management procedures that should be followed when managing the project, and these
should include the scope of the project, material issues and management of risks,
communication and the work plan.
Management of information and analysis
Information is essential to conduct schedule and cost estimation, to determine the
profitability of the project and for business decision making purposes. The results of this

203
study demonstrate that SBEs are not well informed when they make decisions and this
research model urges SBEs leadership in construction business to acquire and analyse
market information for the benefit of the business.
6.2.2.2 Project implementation and resource management
Project implementation is stage 2 of the conceptual performance prediction model. The
results of this study demonstrated ECs weak management and planning of project
resources and this contributes towards reduced business profitability, poor quality of
structures and customer dissatisfaction, as reported in section 4.2.5. In literature, the
importance of setting budgets which dictate the outcome of the entire project is highlighted
(Maurer, 2007). The model contributes by encouraging project management to coordinate
resources provided by leadership (people, equipment, materials, money and schedules)
through appropriate project planning and in line with a contractual agreement. Once this is
achieved, project management must have construction methods in place to determine the
sequential order of the work to be completed and determine the duration of the project by
identifying the starting and finishing dates of the project.
The project activities can be managed through a detailed Critical Path Method (CPM), as it
that shows the interrelationships among activities in the project. The model suggests that
SBEs must hire management who understand the project and have adequate experience in
all construction phases up to competition. Thus, the model contributes by highlighting
project resource management and planning as an essential component that requires
attention as it involves effective use of resources acquired to perform projects.
Communication on site
Communication is important for the success of ECs, but the results of this study show
weak communication on construction sites. Some executives were found not to be linked
to the central project goal. The model contributes by highlighting communication on
construction site as essential and advocates that project management must establish a clear
chain of communication network with other primary stakeholders. This includes weekly
meetings on site that serve to update all stakeholders and discuss progress and potential

204
changes of scope of work. Through the communication procedure, requests for
information, changes in construction drawings, directives from and to the client among
other requirements would be communicated.
Site management
Site management was identified as a factor that has an impact on ECs’ performance
(Tables 4.19 to 4.25 and key informants’ sentiments). The conceptual performance
prediction model contributes by urging project management to oversee that all activities in
a construction project are coordinated. This involves coordinating and scheduling of all
activities, including subcontracting. This suggests that knowledge and understanding of the
South African construction industry, its nature and sensitivity, are crucial. The following
skills and knowledge are therefore reflected from the results:
- Basic and appropriate practical knowledge of business principles
- Project planning
- General contracting
- On-site supervision and relevant technical skills
- Quantity surveying and estimation
- Budget management and cash flow
- Scheduling
Innovation
The results did not confirm any form of innovation as being attempted by ECs. This weak
application of innovation led the researcher to add this variable to the model. Using this
variable, the research model contributes by encouraging to project management to strive to
be innovative in all aspects of project execution, including supervision, training and
managerial procedures so that their projects achieve and maintain the necessary excellence
and so gain a competitive advantage.

205
6.2.2.3 Project performance
Stage 3 of the model relates to project performance. The results of this study have
demonstrated that the success of a construction business is related to its project
performance. This research model incorporates project performance indicators as
identified from literature (section 2.4) and confirmed by the respondents (section 4.2.5),
hence the appropriateness of cost performance, project delivery time, project quality
performance and stakeholder performance measures as key project performance indicators.
Cost performance
The results have highlighted projects that are completed at high costs (section 4.2.4). The
model demonstrates that project management should analyse cost performance of a project
on a regular and timely basis with the prime objective of controlling costs so as to meet the
agreed budget, that is, the final project cost should be the result of careful cost
management processes. By so doing, they would ensure business planned profitability and
lead towards customer and other stakeholder satisfaction.
Project delivery time
In order to achieve business planned profitability and customer satisfaction, the model
demonstrates that project management need to manage delivery time and ensure the
project is completed on or before the agreed handover date. The analysis of results on
project implementation (section 4.2.2.4 and Table 4.21) highlight delays caused by the
owner or his or her representative, the contractors themselves, the client, the consultant
and the government organs, with some delays over which neither party to the contract has
any control as a major impediment towards ECs’ performance. Despite the cause of the
delays, the model urges ECs to manage them on site and as they occur, bearing in mind
that construction clients demand timely completion of projects without delay or additional
cost.

206
Project quality performance
Although multivariate results found quality not to be significant (Table 4.27), literature has
shown that structural quality is one of the most important requirements in construction
(Makui et al., 2011). This model has added and urges ECs to produce structures of high
quality in order to succeed in the construction business. ECs are expected to meet the
client’s quality specifications. The quality performance emphasises the ECs capability to
meet with conformance to quality standards as provided by the client or his/her appointed
representative through contract agreement. It is crucial for the ECs to fully understand as
this would remind them to achieve projects without defects, so resulting in client
satisfaction.
Stakeholder performance
A review of literature (Idrus and Sodangi, 2010; Kagioglou, 2001; Murphy et al., 1996)
showed that the term ‘performance’ has been used interchangeably to describe business
effectiveness, improvement, growth and success, so it is not clear what it means to
different people and organisations. The results of this study have confirmed this, as key
informants revealed many areas in which performance is required by different people and
stakeholders (section 4.2.5).
6.2.2.4 Feedback
The research model suggests that project management must have a feedback tool that
would be used to provide feedback on project performance to leadership, team members
and project stakeholders. The model is based on a premise that project management should
guide leadership and provide expertise from their past experiences. Feedback helps to
determine how successfully the project is progressing and identify to management areas
that require improvement. This would pave way for discussions between project
management and leadership so that the project manager would be assured of regular
support from leadership.

207
6.2.2 Performance prediction
Stage 4 of the research model is predicted performance, namely the results the EC as a
business intends to achieve based on its objectives, the needs and expectations of the
clients, the government, and other stakeholders.
Table 6.1: Prediction of emerging contractor performance
Economic Indicators Social Indicators
Client satisfaction – Product and service Stakeholder satisfaction
Elimination of Defects and Waste Employment creation – Government
and community
Construction cost Employee Job satisfaction: Wages and
salaries, working hours, training
Project Delivery Time Investment into employee qualifications
and skills
Health and Safety Employee Health and Safety
Productivity of employees Community satisfaction
Profitability and Growth Environmental factors
Contribution towards national GDP
Reduction in Contractual disputes
In order to characterise the perceived measures that could assist in sustaining outstanding
performance among ECs, they need to take into account expected performance from
various constituencies. The performance indicators of the research model have been
divided into economic indicators and social indicators, as shown in Table 6.1 (above). The
measures were informed by various incidents that were encountered by SBEs in the study.

208
6.3 SUMMARY OF THE CONCEPTUAL PERFORMANCE PREDICTION
MODEL
In order for EC business to become successful, SBEs must understand the different stages
of the construction business. The model starts with SBEs’ leadership as the main driver for
strategic planning and improvement in business through guiding on customers focus,
people and other relevant stakeholders. The strategic plans are detailed into functional
project implementation plans-the second stage. This entails efficient and effective
management of project delays and resources as well providing communication to all
primary stakeholders and professional site management. The effective project
implementation would be reflected in successful project results (project performance)
which would in turn translate into business results. This confirms the hypothesis in this
study that there is a positive relationship between project performance and business
performance.
The model predicts that holding other factors constant, every unit increase in project
performance score results in a 0.488 increase in EC performance score, whilst a unit
increase in project implementation without delays results in a 0.345 increase in EC
performance, and finally a unit increase in strategic planning causes a 0.117 increase in
SBE performance. Thus, the study found that strategic planning, project implementation
and project performance were the most relevant of all variables to improving business
performance. This is according to the formula.
6.3.1 Benefits and limitations of the model
Model diagnostic tests were carried out to establish whether all the assumptions for fitting
a linear regression had been satisfied. All the assumptions, namely linearity, linear
independence of predictors, normality and constant variance of residuals had been
satisfied, thus the model is valid for the data. The model provides a representation that
helps set a benchmark for predicting the performance of a construction business, and this
would certainly benefit ECs, clients, community as well as policymakers. Using this
model, SBEs can predict whether the project is on schedule, ahead of schedule or behind
schedule, based on the management and coordination of project implementation activities.
Based on that information, the project manager is expected to provide feedback to

209
leadership. The model expands our understanding of the theoretical principles in
explaining ECs’ business performance.
However, the model is a mere tool that can guide SBEs in running a construction business
and cannot be considered as the most appropriate guarantee of optimal success of ECs,
considering the perceived SBEs resistance and lack of ability to use it, and the resources
required to implement it. The model should be regarded as part of the solution to predict
EC business performance. The chances of improving the success and performance of the
organisation are high, should ECs adapt the model.
6.4 CHAPTER CONCLUSION
The study has contributed by generating three significant determinants of construction
business performance (strategic planning, project implementation and project
performance) upon which ECs’ performance can be predicted. Based on the analysis of the
results all constraints (including financial, manpower, quality, legal and environmental
challenges) require SBEs’ strategic planning if their businesses are to succeed.
Chapter seven will draw conclusions and make recommendations, based on the findings of
the study as presented above.

210
CHAPTER SEVEN
CONCLUSIONS AND RECOMMENDATIONS
7.1 CHAPTER INTRODUCTION
This chapter presents the conclusions and recommendations of the study arrived at on the
basis of the findings from both the literature reviewed and the research findings. The
conclusions are drawn and recommendations made, based on the objectives. The
researcher expects ECs executives, researchers and policymakers to realise sustainable
business growth and above break-even profits should they effectively implement the
contribution of this study. The chapter ends with the limitations and recommendations for
future research.
7.2 KEY FINDINGS FROM THE PRIMARY RESEARCH
In chapter four the results of the study were presented, while in chapter five a synthesis
and analysis of results was presented and in chapter six the contribution of the study was
discussed. The key informants and respondents provided necessary information regarding
the perceptions of SBEs registered with CIDB in Grade 2. Primary data was obtained by
administering an interview guide as well as questionnaire among a selection of SBEs in
Gauteng Province. The following is a summary of key findings from the primary research:
Financial challenges
The incidents relating to access to finance and late payment were widely reported and
deemed a major hindrance to business performance by most respondents. This harmed the
company’s cash flow and means that ECs rely on borrowing to pay suppliers and labour.
The results establish that the ability of emerging contractors to access the right type of
finance is vital if they are to become profitable and grow. The study found that emerging
contractors face more difficulties than larger contractors in accessing finance from banks,
and this was attributed to their smallness whereby they are regarded as high risk businesses

211
and have low levels of assets and collateral. As a result, ECs in some cases resort to non-
banking financial facilities to finance business activities.
People and skills challenges
Most respondents reported acute shortage of skills, knowledge and experience in the
construction industry, and this was found to be another factor that had an impact on the
performance and competitiveness of emerging contractors. The shortages were evident
mainly in skilled trades such as qualified bricklayers, steel-fixers, carpenters, plumbers,
painting and tillers. The results showed that emerging contractors have no adequate
training and development programmes in place, hence lack of appropriate industry
qualifications by employees. Furthermore, there are no established training programmes in
the industry designed to improve the required skills in the industry. The impact on
emerging contractors related to cost overrun, delays and inefficiencies.
Project implementation challenges
The study confirmed that many contracting businesses were not successful and this was
attributed mainly to poor project planning. It was found that projects were not adequately
defined or planned before implementation. The most important factors agreed by the SBEs
as the main factors affecting performance of emerging contractors were material shortages,
shortage of personnel with right skills, knowledge, experience and qualifications, lack of
construction equipment, and poor leadership skills in project management. These in turn
contributed to project delays. Lack of planning and poor definition of business
requirements before engaging in project work were prominent weaknesses within
emerging contractor business settings. The results confirmed that SBEs did not have
clearly stated vision statements or objectives. Furthermore, there was no proper definition
of the scope, risks, budget, timeline or overall business approach. The results showed
inadequate resources among emerging contractors which are an important factor in project
implementation. Yet, if resources are not available as planned, the projects will suffer from
problem of cost and time performance. There were no appropriate project management

212
procedures used to manage or execute projects in terms of communication and risk
management.
Quality factors challenges
The qualities of structures produced by emerging contractors were of low standard due to
the use of wrong materials and drawings that lacked adequate information, resulting in
customer dissatisfaction. As a result, failure to achieve appropriate qualities of
construction has affected the quality of structures, as evidenced by cracks in walls and the
foundations of many structures. These results confirm many arguments, including media
reports that have mentioned emerging contractors as the main victims in their
workmanship. This illustrates that the quality of work delivered by emerging contractors
affects their project performance, reputation, competitiveness and profitability, as well as
their future selection by the main contractor.
Based on the importance of quality, various quality performance initiatives should be
considered by emerging contractors, for example, ISO9000, ISO 14000, OHSAS18001,
six sigma, and total quality management systems (TQMs). ISO9000 certifications related
to construction are popular in several countries and the application of IS09000 based
Quality Management Systems (QMS) in the construction industry have been studied by
several researchers (Palaneeswaran et al., 2006); Love and Li (2000); Riberio and Curado
(2000); Dissanayaka and Kumaraswamy, (2001). The significance of ISO9000 based
QMSs would include improved quality system, improved customer satisfaction,
continuous improvements, standard processes, structured documentation procedures and
better control, reduced costs, reduced wastages, reduced rework, less conflicts, claims and
disputes, enhanced consistency and better image (Palaneeswaran, et al. 2006).
Legal and environmental management practices challenges
Most emerging contractors have not yet fully grasped the health and safety management
practices in the construction industry. The absence of controls and weak application of
safety related requirements through project implementation was found to be lacking, as
was safety training. This demonstrates that emerging contractors in CIDB Grade 2 seem

213
not to care about applying health and safety requirements especially when they secure
large projects, as they attribute that this requirement is an unnecessary cost to their
businesses. Thus, emerging contractors become vulnerable when engaging in business
with large companies as they would be required to comply and failure to comply lead
towards the termination of contracts.
Strategic management challenges
There are weaknesses in management skills that have impacted emerging contractor
performance in the construction industry. Thus, the role of capable and effective
management on the performance of contracting business becomes crucial. Management is
vital in supply chain management and coordination of project activities, therefore
capability of project teams is an important enabler of successful project and business
outcomes. Continuing investment in the development of the management skills is also
necessary to assure continuing improvement in industry performance.
7.3 CONCLUSIONS
The objectives the study set to achieve are discussed in this section, with conclusions
obtained and an assessment as to whether the research objectives have been met.
The first objective of this research was to assess the critical incidents that have been
encountered by SBEs in the construction industry and their effect on business
performance.
Based on the research results, incidents affect business performance. Those identified for
emerging contractors help them to manage their business. Incidents such as late payments,
shortage of skills and material on construction sites were found to have a serious effect on
ECs’ business operations. The first objective was achieved as the incidents that affect
business performance were identified (see Table 7.1). The table reflects seven broad
categories, showing the critical incidents that are encountered by SBEs in the construction
industry. The conclusion is that the situations under which ECs operate require

214
intervention by policymakers in areas that include payments and skills improvement in the
construction industry. The results demonstrate that the situation is not under control, and
leaving this to ECs alone would not resolve their performance problem.
Table 7.1: Summary of identified critical incidents
Financial Category Manpower Category
Lack of collateral and assets due to poor
credit ratings
Shortage of experienced and competent labour
force
Late payments towards completed work
by clients High rate of labour disputes and strikes
Poor cash flow management and budget
control
Cumbersome administrative tasks such as UIF,
workmen’s compensation, skills development
levy etc.
Tender pricing pressure from main
contractor
Low labour productivity due to employee
dissatisfaction and absenteeism
High consultancy costs and fees e.g.
accountants and architects erode profits
The skills obtained from higher education and
the skills required in the construction industry
do not match
High registration and annual renewal
fees Poor labour supervision and workmanship
Payment of performance guarantee /
retention
Little capacity to deal with the complexities of
modern projects
Payment problems experienced as a
result of rework relating to faults (e.g.,
project design errors, formwork errors,
plumbing errors, mechanical and
electrical works faults)
Contractors, subcontractors, clients and
consultants do not work together as a project
team
Materials / Equipment Category Project Implementation Category
Lack of technical knowhow on quantity
surveying of construction material
Poor planning techniques and failure to identify
critical activities
Regular shortages of materials on site
Lack of project coordination among
contractors, subcontractors, clients and
consultants
Excessive waste of material during the
application process (e.g., unnecessarily
thick plastering)
Unplanned increase in the scope of work from
the client
Non-conformance of material to Unrealistic construction planned time by clients
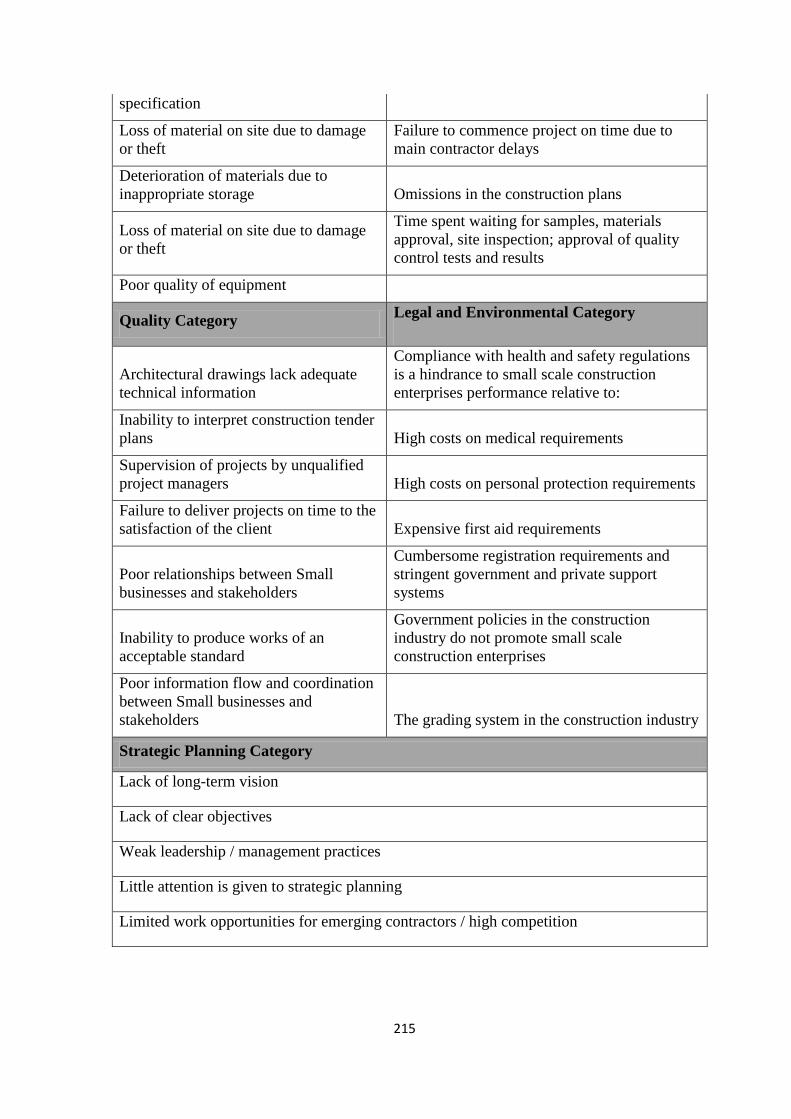
215
specification
Loss of material on site due to damage
or theft
Failure to commence project on time due to
main contractor delays
Deterioration of materials due to
inappropriate storage Omissions in the construction plans
Loss of material on site due to damage
or theft
Time spent waiting for samples, materials
approval, site inspection; approval of quality
control tests and results
Poor quality of equipment
Quality Category Legal and Environmental Category
Architectural drawings lack adequate
technical information
Compliance with health and safety regulations
is a hindrance to small scale construction
enterprises performance relative to:
Inability to interpret construction tender
plans High costs on medical requirements
Supervision of projects by unqualified
project managers High costs on personal protection requirements
Failure to deliver projects on time to the
satisfaction of the client Expensive first aid requirements
Poor relationships between Small
businesses and stakeholders
Cumbersome registration requirements and
stringent government and private support
systems
Inability to produce works of an
acceptable standard
Government policies in the construction
industry do not promote small scale
construction enterprises
Poor information flow and coordination
between Small businesses and
stakeholders The grading system in the construction industry
Strategic Planning Category
Lack of long-term vision
Lack of clear objectives
Weak leadership / management practices
Little attention is given to strategic planning
Limited work opportunities for emerging contractors / high competition

216
The second objective of this research was to assess the determinants of ECs’
performance in Gauteng Province of South Africa
The research model predicted that financial factors, manpower factors, supply of materials,
equipment and machinery, project implementation, quality factors; legal and regulatory
factors, strategic planning affect ECs’ performance. Based on the perceptions of the key
informants, the qualitative results were consistent with the research model where the above
determinants were found significant. The perceptions of the respondents were assessed
using a quantitative approach and the results achieved also confirmed the research model,
with the exception of quality factor that was found not significant. The results were based
on the univariate analysis, however, when multivariate analysis was performed, the study
concluded that there are three key determinants that are important on ECs business
performance in construction industry if profitability and growth are to be achieved. These
determinants include strategic planning factors, project implementation and project
performance and are relevant in the area of business management. Accordingly, the second
objective was achieved.
The third objective was to assess the relationship between ECs’ project performance
and ECs’ business performance
The study concluded that there is a statistically significant relationship between project
performance and business performance. This implies that effective project execution
would promote the growth and profitability of the construction business. Thus, if the
project meets the technical performance and if there is a high level of satisfaction
concerning the project outcome, the goal of an organisation to be successful at survival
would be achieved. Therefore, the success of a construction project is based on the
achievement of time, cost and quality targets, and health and safety targets, which would
translate into the overall performance of an organisation. For this to happen, project
management must receive direction and support from ECs’ leadership and with that
support project management is expected to acquire income from the project that would
stimulate the growth and profitability of the EC business. Based on this relationship, it can
be concluded that projects generate immediate income for the business and at business

217
level, leadership focus on the long term survival of the organisation. The third objective
was achieved.
The fourth objective of this research was to assess the perceptions of SBEs of the
determinants of performance among the ECs in Gauteng Province of South Africa
A structured questionnaire was used to assess the impact of various attitudes and factors
affecting emerging contractor performance. The questionnaire helped to elicit the
perceptions of SBEs towards key performance indicators in the industry. As highlighted in
objective 2, the study concluded that SBEs perceive weak performance of ECs to be
associated with strategic planning factors, project implementation and project performance
variables. Based on the quantitative results, the perceptions of SBEs were defined as the
sum of all the responses from the section on perceptions on determinants of emerging
contractor performance. Investigating the correlation of perceptions and emerging
contractor performance indicated that perceptions of SBEs positively affect (r=0.254) their
business performance.
The fifth objective of this research was to establish if there is a relationship between
the profiles of ECs and performance in the industry
The profiles of ECs were examined, focusing on business location and age, CIDB
registration grading, manpower size, description of business ownership, work provided by
ECs and types of projects executed. A regression analysis was performed and a conclusion
was drawn that there was no significant relationship between company performance and
size of the company in terms of manpower (p-value = 0.1895) and the skilled workforce
(p-value= 0.625). This may possibly be explained by the observation that there are
insignificant number of skilled workers in each company (>=3).
The variable emerging contractor performance was converted to a categorical variable in
order to carry out tests of association. The chi-square tests of association carried out
indicated that there is no significant relationship between business performance and race
(p-value = 0.261), gender ownership (p-value = 0.804) and disability status (p-value =
0.255). However, there is a significant relationship between age of owner and business
218
performance (p-value = 0.000) and the correlation coefficient is -0.1899 indicating that as
age increases performance decreases. There is no significant relationship between business
performance and type of service offered, civil engineering (p-value = 0.996) and general
building (p-value = 0.560). There is no significant relationship between business
performance and type of project, government (p-value=0.777) and private development (p-
value=0.751). The fifth objective was therefore achieved as the relationship between the
profiles of ECs and performance in the construction industry was established.
The sixth objective of this research was to characterize the perceived measures that
could assist in sustaining high performance among ECs
The sixth objective was achieved through the development of the conceptual performance
prediction model as indicated below.
Emerging Contractor Performance = 1.97 + 0.117 Strategic Planning + 0.345 Project
Implementation + 0.488 Project Performance
The structure of the model and how it works was discussed in chapter six. The conclusion
reached was that holding other factors constant, every unit increase in project performance
results in a 0.488 increase in emerging contractor performance. This means the negative
effects observed in chapter five including time overrun, cost overrun, disputes, arbitrations,
project abandonment and project delay should be avoided to enable appropriate
performance by emerging contractors. This demonstrates that the performance of a project
is based on its ability to meet the technical performance specifications as this would
translate into the overall performance of the organisation.
7.4 RECOMMENDATIONS
The following recommendations are made based on the results of this study. These could
be considered for future implementation at emerging contractor and policy making level.
219
7.4.1 Recommendation for ECs in CIDB Grade 2
Based on the findings made on the performance determinants, recommendations are made
on the following themes.
Finance
SBEs must acquire and develop financial management skills that would enable them to
understand and manage financial requirements that investors and other stakeholders need.
The financial areas that require SBEs to have serious skills development are budgeting and
cash flow management, bookkeeping knowledge, financial policies and controls, and
project pricing strategy. SBEs must ensure clients have guaranteed adequate funding of
projects before execution to avoid unnecessary time overrun, which has negative effect on
cost, and must sign a contract document that clearly shows appropriate terms of payment.
Manpower
There is a severe lack of artisans in the industry that contributes towards ECs’ poor
performance on construction projects, and this requires SBEs to take an initiative role in
terms of training employees, motivating and retaining competent workforce. Therefore,
SBEs are advised to respect the people who work for them, and this can be reflected
through people investment, among other aspects. The implication is to retain a stable
workforce which is critical to their business success. High employee turnover, as reflected
in the study, will result low employee morale and hence low productivity.
Material, machinery and equipment
ECs must ensure functional machinery and equipment are provided, checked for
conformance before application to enable timely completion of projects. SBEs must ensure
regular supply of the material in proper quantity to avoid late or irregular delivery or
wrong type of material delivery during construction stage. Furthermore, there should be a

220
staff dedicated for material management and storekeeping as this would ensure effective
and efficient management of construction material on site.
Project implementation
ECs are urged to strive for efficient project delivery, which requires maximum efficiency
in terms of cost, time, quality, health and safety, community and employee satisfaction.
Quality
SBEs must understand the expected quality standard of every project, strive to meet its
technical specifications, and ensure that they provide the functionality required by the
client. It is of paramount importance that the client is satisfied with the service provided
during project star-up, transfer and implementation phases.
SBEs must ensure their own inspection of work is carried out and this would help to point
towards and eliminate any defective work. The quality of construction project must be
checked on a regular basis to ensure consistency in standards, as failure to meet quality
levels would cost a construction business the customer’s future revenue stream.
Strategic planning
SBEs are required to provide clarity of purpose of their businesses, achievable through
identifying long-term business and project objectives. This must focus on providing value
to the clients and meeting profitability and growth of their businesses. In addition, SBEs’
must fully understand project risks and develop a realistic and affordable business plan and
budgets. It is recommended that SBEs develop themselves in terms of general management
and supervision of their businesses and construction projects they execute.
7.4.2 Recommendation for the CIDB
Based on the findings of this research are recommendations that are relevant to the CIDB:

221
The CIDB, being the board responsible for the registration and classification of
emerging contractors engaging in public projects, should insist on emerging
contractors having certain key technical staff as a condition of registration.
The awarding of contracts by clients does not take into account the performance
capabilities of the contractor, but rather gives more weight to prices than to the
capabilities and past performance of contractors. In this case, the introduction of
the COMPAS quality system used in Malaysia may be useful for the CIDB to
adopt.
The CIDB should enforce quality standards to be met in the industry and in order
for this to happen uniform industry performance measure standards for each grade
are necessary. This would include quality training, monitoring, recognising and
rewarding those emerging contractors who achieve high quality standards set for
the industry. The performance reward can be in the form of trophies for emerging
contractors who achieve outstanding performance.
There is pressure for the CIDB to grow emerging contractor into higher Grades, 3,
4 or greater, however, instead, it should place more emphasis on developing good
emerging contractors, not only to achieve a higher financial grade but in terms of
their capability to produce quality work and meet industry standards. That way,
small contractors could make as good a profit as their larger and higher graded
counterparts, providing they satisfy customer needs. The CIDB, therefore, needs to
identify ECs which have the potential to be developed into larger and technically
better businesses.
7.4.3 Recommendation for the South African government
Late payments have been widely reported as the main impediment of emerging
contractor success. In order to overcome the issue of meeting quality standards
needs to be addressed and linked to government regulations on payments. This
would ease access to finance by emerging contractors. Countries such as Australia,
New Zealand, Singapore and the United Kingdom have introduced legislation to

222
enforce the right of subcontractors and suppliers to receive payments irrespective
of whether the main contractor has been paid.
The current labour laws are perceived by SBEs as cumbersome, for example in the
perspective of SBEs as found in this research, disciplinary processes are a
hindrance towards ECs’ performance, hence, a collaborative effort by government
and industry stakeholders is crucial, particularly within the labour law
environment.
Lack of collateral and assets was widely reported by most SBEs, highlighting
major impediments to emerging contractors’ performance. In order to build a
strong construction sector, the development of a financing mechanism that takes
into account the specific needs of ECs is required. In this case, the study
recommends the formation of a sector bank that would support emerging
contractors’ business strategies and access to finance at reasonable rates. The bank
would be dedicated to address the specific needs of emerging contractors in the
building and construction industry.
The shortage of skilled labour can be addressed by the government through
development of technical colleges (apprenticeships) for industry-specific training
of workers in order to equip them with appropriate industry knowledge and
qualification. Training is fundamental to improving and developing overall
business performance.
ECs use low bidding prices in order to secure tenders and, given this scenario, ECs
would not be able to become profitably or grow. The recommendation to the
government is to create an environment that would grow the economy so that there
is enough work for all CIDB construction Grades 1 to 9. At the time of this study,
all CIDB grades were chasing the same jobs, irrespective of size and magnitude, in
order to survive.
223
7.4.4 Recommendation for construction clients / main contractors
Clients must know what kind of products they want and clearly define them to
guide emerging contractors. Thus, they should know what it costs to have
completed buildings through qualified estimators, be sure of their source of
finance, inform the planners and be prepared to meet obligations of timely
payments of dues in addition to carrying out timely approvals. Most importantly,
clients must ensure that funds are available or adequate arrangements have been
made for funds before projects are started, so that emerging contractors would not
struggle with cash flow.
Clients are recommended to desist from appointing subcontractors based on lowest
prices and should consider their ability to deliver appropriate quality structures on
time and within budget.
When main contractors engage ECs as subcontractors there is a need to fully
support and collaborate in training them during construction so that they execute
successful projects.
7.5 IMPLICATIONS OF THE STUDY
Based on the findings of this study, emerging contractors should pay close attention to
their particular business circumstance before embarking on the execution of construction
projects in order to better understand the implications of their actions. Particular attention
should be taken on the following implications.
Financial implication
The results of this study demonstrate that ECs’ access to finance is limited and the cost of
capital high. As long as access to finance remain a challenge to ECs their performance in
terms of growth, profitability, job creation and economic growth, among other
performance indicators, will remain weak and they would not be able to adequately plan.
224
Delayed interim payments were expressed by all respondents and place strain on ECs. The
implication is that projects would not be completed on time when late payments persist,
hence the efforts by government in promoting ECs would be a waste of time and energy.
Therefore, it is extremely important that clients guarantee adequate funding before
commencement of projects.
Manpower implication
The results show that lack of skills and restrictive labour regulations have a negative effect
on the performance of ECs in terms of productivity and job creation. This implies that if
skills are not improved labour productivity would remain low and if labour laws are not
relaxed there would be no job creation, but rather existing jobs would be lost.
Project implementation implication
The results demonstrated that SBEs place great emphasis on project implementation at the
expense of organisation. They put little effort into business planning, but much into project
implementation. The implication is that the growth and profitability of ECs would remain
low if there were no link between projects and business activities. ECs are concentrating
on project implementation because there is immediate project income to be realised. There
is a need for ECs to connect projects to business planning and through long-term business
planning the sustainability of the business would be realised.
Quality implication
There are quality challenges that emerged, especially in literature relating to the
performance of ECs. The contractors need to know the implications of poor performance
in quality for client, consultants and community satisfaction, and how it impacts on ECs’
reputation in the industry.
There is inadequate training and supervision of the workers on sites and need for SBEs to
provide training and supervision to improve the quality of work and reduce the chances of
rework. Supervisors should have adequate knowledge of work if they are to add value to
the completed work.

225
Legal and environmental implication
Despite the existence of the health and safety policy to guide contractors, ECs lack
commitment to a culture that would promote commitment to comply with requirements in
the construction industry. If this culture is not corrected, the implication is increased costs
to the economy in terms of rework, lost time, disruption, productivity loss and loss of
much needed skills to the economy.
Strategic planning implication
SBEs need to understand the practice of strategic planning in a manner that would lead to
higher EC performance. Planning has emerged in this study as the key determinant of
performance and the implication is that in the absence of a proper and comprehensive
construction plan, parties to the business cannot be informed or held accountable for the
timing and duration of their planned activities.
7.6 LIMITATION OF THE STUDY
There are limitations that emerged during the development of the interview guide, the
questionnaire and during the data collection and analysis phases. Thus, the following
limitations should be kept in mind when interpreting the results of this study:
The data generated in this study was limited to the perceptions of SBEs of
emerging contractors registered with CIDB in Grade 2 in Gauteng, South Africa.
As a result of lack of capacity in terms of available time and financial resources,
the results could not capture the perceptions of other players, such as the main
contractors, clients and consultants who have perceptions about the performance of
the emerging contractors.
The study relies on perceptions of SBEs, which might have been influenced by
perceptual biases and cognitive limitations.

226
The study employed a cross-sectional research survey strategy over a short period
of time. Thus, it did not fully explore the emerging contractor business to
determine performance trends over a long period. A longitudinal study is required
to provide further insights into the perceptions of SBEs on the performance of
emerging contractors.
The results of the study could be generalised to the sampled contractors only,
however, since the contractors operate in Gauteng the findings do not represent
contractors in other provinces, and exclude medium and large contractors.
7.7 CONCLUSION
This research was set to assess the critical incidents encountered by emerging contractors
and the determinants of business performance for emerging contractors registered with
CIDB in Grade 2 in Gauteng, as well as to assess relationships among variables. The main
findings of this study are summarised as follows:
Most business experiences and incidents define direction and help to realise
potential, challenges and lessons learnt, which in turn help to shape good or bad
business practices.
Most determinants that define the performance of ECs’ businesses are related to
project planning, project implementation and project performance.
There is a significant relationship between project performance and business
performance.
The quantitative results showed that the perceptions of SBEs were defined as the
sum of all the responses from the section on perceptions on determinants of
emerging contractor performance. Investigating the correlation of perceptions and
emerging contractor performance indicated that perceptions of SBEs positively
affect (r = 0.254) their business performance.
There is no significant relationship between company performance and size of the
company, or between business performance and race, gender ownership and
227
disability status. Nor was a significant relationship found between business
performance and type of service offered, civil engineering and general building, or
between business performance and type of project, government and private
development. However, there is a significant relationship between age of owner
and business performance.
7.7.1 Recommendation for further research
The study has raised a number of issues for further research:
Judged by the attention given to the emerging contractors by government, industry
practitioners, CIDB and academicians the performance of ECs is at a centre stage
of these entities, yet to date there has been no study that has developed or
established a valid measurement instrument for ECs’ business performance. As a
result, stakeholders seeking to measure the performance of ECs have no specific
guidance as to what precisely to consider. This study relied on varied performance
measurement indicators, thus future research should focus on developing common
performance measurement that could be used in the South African construction
industry.
Future research using similar techniques can be expanded to contractors of
different sizes and with different levels of analysis in other provinces, as well as in
other countries.
It must be highlighted that the results of this study are based on the perceptions of
SBEs of CIDB Grade 2 in Gauteng and may differ somehow from the perceptions
of other SBEs elsewhere in other provinces of the country There is an opportunity
for further research in order to gain a wider perspective on the determinants of
performance
The influence of business culture within the activity circumstances of emerging
contractor has not been fully investigated, empirically. Hence, this might be
another avenue for future studies.

228
REFERENCES
Abowitz, D. A. and Toole, T. M. 2009. ‘Mixed method research: Fundamental Issues of
Design, Validity and Reliability in Construction Research’, Journal of Construction
Engineering Management, 136 (1): 108 – 116.
Act of Parliament, 38 of 2000. Construction Industry Development Board Act, 2000 Act
No. 38 of 2000 (as amended for register services): Pretoria
Adendorff, C., Appels, G. and Botha, B. 2011. ‘Strategic Management: An Eastern Cape
construction SME case study’, ACTA Structilia, 18(2).
Ahadzie, D. K., Amoah, P. and Ayirebi, D. 2011. ‘The factors affecting construction
performance in Ghana: The perspective of small –scale building contractors’, The Ghana
Surveyor: 41 - 48
Aibinu, A. A., Jagboro, G. O. 2002. ‘The effects of construction delays on project delivery
in the Nigerian construction industry’, International Journal of Project Management, 20
(8): 593-599.
Akbaba, A. 2012. ‘Business performance of small tourism enterprises: a comparison
among three sub-sectors of the industry’, An International Journal of Tourism and
Hospitality Research, 23 (2): 177 – 195.
Akiner, I. M. and Akiner, E. 2009. ‘Evaluation of Turkish construction industry through
the challenges and globalization’, Organization, technology and management in
construction an international Journal, 1 (2): 64 – 71.
Akinsiku, O. E. and Akinsulire, A. 2012. ‘Stakeholders’ Perception of the Causes and
Effects of Construction Delays on Project Delivery’, Journal of Construction Engineering
and Project Management, 2 (4): 25 -31.
Akoten, J. E., Sawada, Y. and Otsuka, K. 2006. ‘The determinants of credit access and
impacts on micro and small enterprises: the case of garment producers in Kenya’,
Economic Development and cultural change, 54 (4): 927 – 944.
229
Alarape, A. A. 2007. ‘Entrepreneurship programs, operational efficiency and growth of
small businesses’, Journal of Enterprising Communities: People and Places in the Global
Economy, 1(3): 222-239.
Ali, A. S., Smith, A., Pitt, M. and Choon, C. H. 2010. ‘Contractors’ perception of factors
contributing to project delay: Case studies of commercial projects in Klang Valley,
Malaysia’, Journal of Design and Built Environment, 1:43-57.
Alinaitwe, H. M., 2008. ‘An Assessment of Clients’ Performance in Having an Efficient
Building Process in Uganda’, Journal of Civil Engineering and Management, 14(2): 73-
79.
Alinaitwe, H. M., Landin, A. and Kakitahi, J. M. 2013. ‘An Exploratory study of rework
causality in Uganda’, Construction Innovation, 13 (3): 266 – 280.
Alpkan, L., Yilmaz, C. and Kaya, N. 2007. ‘Market Orientation and Planning Flexibility in
SMEs, Performance Implications and an Empirical Investigation’, International Small
Business Journal, 25 (2): 152 -172.
Amaratunga, D., Pathirage, C., Keraminiyage, K. and Thayaparan, M. 2011.
‘Advancement of built environment higher education through lifelong learning’,
International research conference on sustainability in built environment. Available from:
usir.salford.ac.uk. Accessed: 21 November 2013.
Ameh, O. J. and Odusami, K. T. 2002. ‘Factors affecting labour productivity in Nigerian
Construction Industry: A case study of indigenous contracting organisations in Lagos’, The
Quantity Surveyor, 40 (3): 14 – 18.
Ameh, J. O. and Osegbo, E. E. 2011. ‘Study of relationship between time overrun and
productivity on construction sites’, International Journal of construction supply chain
management, 1 (1): 56 – 67.
Assaf, S. A. and Al-Hejji, S. 2006. ‘Causes of delay in large construction projects’,
International Journal of Project Management, 24 (7): 349 – 357.
Atieno, R. 2006. ‘Female participation in the labour market: the case of the informal sector
in Kenya’, AERC Research Paper 157, African Economic Research Consortium, Nairobi.

230
Atkinson, D., Ntema, L., Pappin, M., Gouveia, A. and Venter, A. 2012. ‘Review of the
efficiency and effectiveness of past and on-going SME development initiatives in the Free
State Province’, International Labour Organization. ISBN 978-92-2-126473-6.
Avermaete, T., Viaene, J., Morgan, E. J. and Crawford, N. 2003. ‘Determinants of
innovation in small food firms’, European Journal of Innovation Management, 6 (1): 8 –
17.
Ayininuola, G. M. and Olalusi, O. O. 2004. ‘Assessment of building failures in Nigeria:
Lagos and Ibadan case study’, African Journal of Science and Technology, Vol. 5 No. 1,
pp. 73-8.
Babajide, A. and Joseph, T. 2011. ‘Microcredit and business performance in Nigeria: The
case of MFI Finance Enterprises’, International Journal of Research in commerce and
management, 2(11).
Baldwin, A. N. and Chack-fan, L. 2008. Final Report of the Construction Industry
Institute, Hong Kong Research Project on Reinventing the Hong Kong Construction
Industry for its Sustainable Development. Hong Kong: The University of Hong Kong and
The Hong Kong Polytechnic University.
Baloyi, L. and Bekker, M. 2011. ‘Causes of construction cost and time overruns: The 2010
FIFA World Cup stadia in SA’, Acta Structilia, 18 (1): 51 – 67.
Bansal and Voyer, 2000. ‘Word of mouth processes within a services purchase decision
context’, Journal of service research, 3 (2): 166 – 177.
Barry, M. L. and Sebone, M. F. 2009. ‘Towards determining critical success factors for
SME electrical contractors in the construction industry in South Africa’, Southern African
Journal of Industrial Engineering, 20 (1): 185 -195.
Bassioni, H. A., Price, A. D. F. and Hassan, T. M. 2004. ‘Performance Measurement in
Construction’, Journal of Management in Engineering. 20 (2).
Bassioni, H. A., Price, A. D. F., and Hassan, T.M. 2005. ‘Building a conceptual
framework for measuring business performance in construction: an empirical evaluation’,
Construction Management and Economics, 23: 495 – 507.
231
Bassioni, H. A., Hassan, T. M. and Price, A. D. F. 2008. ‘Evaluation and analysis of
criteria and sub-criteria of a construction excellence model’, Engineering, construction
and architectural management, 15 (1): 21 – 41.
Baxendale, T. and Owain, J. 2000. ‘Construction design and management safety
regulations in practice-progress on implementation’, International Journal of Project
Management, 18 (1): 33-40.
Beatham, S., Anumba, C., Thorp, T. and Hedges, I. 2004. ‘KPIs: a critical appraisal of
their use in construction’, benchmarking: An International Journal, 11(1): 93–117.
Bell, J., Gilbert, D. and Lockwood, A. 1997. ‘Service quality in food retailing operations:
A critical incident analyses, The International Review of Retail, Distribution and
Consumer Research, 7 (4): 405 – 423.
Bertelsen, S. and Koskela, L. 2002. ‘Managing the three aspects of production in
construction’, A paper presented at the 10th
annual conference in the International Group
for Lean Construction, Gramado, Brazil.
Best, R. J. 2005. Marketing Based Management: Strategies for Growing Customer Value
and Profitability. 4th Edition. New Jersey: Prentice Hall.
Bitner, M. 1990. ‘Evaluating Service Encounters: The effects of Physical Surroundings
and Employee Responses’, Journal of Marketing, 54 (April): 69 – 82.
Bitner, M. J., Booms, B. H. and Mohr, L. A. 1994. ‘Critical Service Encounters: The
Employee’s Viewpoint’, Journal of Marketing, Vol. 58 (4): 95 – 106.
Booyens, I. 2011. ‘Are Small, Medium and Micro sized enterprises engines of innovation?
The reality in SA’, Science and Public Policy, 38(1): 67 – 78.
Bowling, A. 2005. ‘Mode of questionnaire administration can have serious effects on data
quality’, Journal of Public Health, 27 (3): 281 – 291.
Bureau for Economic Research at the University of Stellenbosch (2012).
Brandon A. 2014. ‘The master builder – Perceptions about our members’, Master Builders
KwaZulu – Natal. Available from:
232
http://www.masterbuilders.co.za/news/2009/july/rationale_for_best_practice_initiative.ht
m Accessed: 3 September 2014.
Broad Based Black Economic Empowerment Act (53 of 2003). Government Gazette:
Pretoria
Bryman, A. and Bell, E. 2007. Business Research Methods. 2nd Edition. New York:
Oxford University Press.
Building and construction authority, 2012. Conquas, The BCA construction quality
assessment system, Available from: www.bca.gov.sg. Accessed: 15 October 2014.
Building and construction authority, 2013. Singapore:- Leading the way for green building
in the tropics, Available from:
https://www.bca.gov.sg/greenmark/others/sg_green_buildings_tropics.pdf. Accessed: 3
December 2014.
Buys, F. and Ludwaba, D. 2012. ‘The potential of built environment professionals’
contribution towards emerging contractor development’, Acta Structilia, 19 (2).
Cant, M. and Brink, A. 2003. ‘Problems Experienced by Small Businesses in SA’, 16th
Annual Conference of Small Enterprise Association of Australia and New Zealand, 28
September – 1 October 2003.
Caracelli, V. and Green, J. 1993. ‘Data analysis strategies for mixed-method evaluation
designs’, Educational Evaluation and Policy Analysis, 15: 195 -207.
Carmichael. D. G. and Balatbat, M. C. A. 2010. ‘A contractor’s analysis of the likelihood
of payment of claims’, Journal of Financial Management of Property and Construction,
15 (2): 102 – 117.
Carland, J. C. and Carland, J. W. 2003. ‘A model of entrepreneurial Planning and its effect
on performance’, A paper presented at the ABSE annual conference - Building bridges to
the future, Houston, Texas.
Cattell, K. 1999. Innovation in the building and construction industry: guidelines for
SMMEs. Pretoria: Agreement South Africa.

233
Census, 2011. Census in brief, Report No. 03-01-41. Pretoria: Statistics South Africa.
Available from: http://www.statssa.gov.za/census2011/Products/Census_2011_Census_in
brief.pdf. Accessed: 15 August 2014.
Chaplin, D. 2010. ‘Effective contracting skills and experience keep contractors in well-
paid contracts’, London: Contractor Calculator. Accessed 15 January 2014
fromhttp://www.contractorcalculator.co.uk/effective_contracting_skills_experience.aspx.
Chan, A. P. C and Chan, A. P. L. 2004. ‘Key performance indicators for measuring
construction success’, Benchmarking: An International Journal, 11(2): 203 – 221.
Chawla, S. K., Khan, Z. U. and Pahls, M. B. 2012. ‘Small Business Performance, Planning
sophistication and Benchmarking: An Empirical Study’, Journal of the Academy of
Business and Economics, 12 (5): 5
Chell, E. (1998). Critical Incident Technique in Qualitative methods and analysis in
organisational research: A practical guide, Gillian Symon and Catherine Cassell, eds.
Thousand Oaks, CA: Sage, 51 – 72.
Cheung, S. O., Henry, S. and Cheung, K. W. 2004. ‘A Web-based construction Project
Performance Monitoring System’, Automation in Construction, 13: 361 – 376.
Chitkara, K, K. (2004). Construction Project Management: Planning, Scheduling, and
Controlling. New Delhi: Tata McGraw-Hill Publishing Company.
City of Johannesburg Website (2014). ‘Big projects for Gauteng’, Available from:
http://www.joburg.org.za/index.php?option=com_contnet&id=7783Itemid=299 Accessed:
15 August 2014.
Construction Excellence 2003
Construction Industry Development Board (CIDB), 2004. ‘Construction Industry Status
Report 2004: Synthesis Review on the South African Construction Industry and its
Development’, Pretoria: CIDB.
Construction Industry Development Board (CIDB), 2007. ‘The CIDB Construction
Industry Indicators Summary Results’, Pretoria: CIDB.

234
Construction Industry Development Board (CIDB), 2009. ‘SA Contractor Development
Programmes: Status Quo Report’, Pretoria. CIDB.
Construction Industry Development Board (CIDB), 2010. ‘National Register of
Contractors’, Pretoria: CIDB.
Construction Industry Development Board (CIDB), 2011. ‘Construction Quality in SA– A
Client Perspective’, Pretoria: CIDB.
Construction Industry Development Board (CIDB), 2011. ‘Financial Modelling Options
for Contractor Support and Development’, Pretoria: CIDB
Construction Industry Development Board (CIDB), 2012. ‘The Construction Industry as a
Vehicle for Contractor Development and Transformation’, Pretoria: CIDB (ISBN: 978-0-
621-40773-0).
Construction Industry Development Board (CIDB), 2013. ‘Subcontracting in the SA
Construction Industry; Opportunities for Development’, Pretoria: CIDB ISBN 978-0-620-
56039-9.
Construction Industry Development Board Database (CIDB), 2013. Construction online
reports: Register of Contractors. Available at:
http://registers.cidb.org.za/reports/contractinglisting (Accessed: 15 August 2013).
Construction Industry Development Board (CIDB), 2014. ‘Quarterly Monitor’, Pretoria:
CIDB.
Coolidge, J. and Ilic, D. (2009). ‘Tax Compliance Perceptions and Formalization of Small
Business in SA’, The World Bank Investment Climate Department Regulatory
Simplification Unit. Policy Research Working Paper WPS 4992.
Cooper, D. R. and Schindler, P. S., 2011. Business Research Methods. 11th Edition. New
York: McGraw-Hill International Edition.
Costa, D. B and Formoso, C. T. (2003). ‘Guidelines for conception, implementation and
use of performance measurement system in construction companies’, 11th International
Conference of the International Group for Lean Construction, Virginia Tech, Blacksburg,
Virginia, USA.

235
Cox, R. F., Issa, R. R., and Ahrens, D. 2003. ‘Management’s perception of Key
Performance Indicators for Construction’, Journal of construction engineering and
management’, 129 (2): 142 –151.
Creamer Media. ‘Construction 2013: A Review of South Africa’s construction sector’,
Available from: http://www.creamermedia.co.za/article/construction-2013-a-review-of-
south-afrcas-construction-sector-pdf-report-2013-02-28. (Accessed: 28/07/2014).
Cresswell, J. W. 1994. Research Design: Qualitative and Quantitative Approaches.
Thousand Oaks, CA: Sage.
Creswell, J. W. 2003. Research Design: Quantitative, Qualitative and Mixed methods
approaches. 2nd
Edition. Thousand Oaks, CA: Sage.
Creswell, J. W. 2008. Incomplete Research Design: Qualitative and Quantitative
Approaches. London: Sage.
Creswell, J. W and Clark, P. 2011. Designing and Conducting Mixed Methods Research.
2nd
Edition. Thousand Oaks, CA: Sage.
Cronbach, L. 1970. Essentials of Psychological Testing. 3rd
Edition. New York: Harper &
Row publishers, Inc.
DPW (Department of Public Works) 2006. Construction Charter. Available from:
http://www.publicworks.gov.za/PDFs/documents/Charters/Construction_Charter_Version
_6-Final%20-26-01-06.pdf. (Accessed: 26 May 2014)
De Matos C. A., Rossi, C. A. V., Veiga, R. T. and Vieira, V. A. 2009. ‘Consumer reaction
to service failure and recovery: the moderating role of attitude toward complaining’,
Journal of services Marketing, 23 (7): 462 – 475.
Denzin, N. K. and Lincoln, Y. S., 2008. The Landscape of Qulitative Research. 3rd
Edition. Sage Publications, Thousand Oaks.
Dess, G. G., Lumpkin, G. T. and Eisner, A. B., 2008. Strategic Management: Creating
Competitive Advantages, 4th
Edition. Boston: McGraw-Hill / Irwin.

236
De Wit, A. 1998. ‘Measurement of project success’, International Journal of Project
Management, 6 (3): 164 – 170.
Diallo, A. and Thuillier, D. 2005. ‘The success on international development projects, trust
and communication: an African perspective’, International Journal of Project
Management, 23: 237 – 252.
Dissanayaka, S. M. and Kumaraswamy, M. M. 2001. ‘Comparing contributors to time and
cost performance in building projects’, Building and Environment, 34: 31–42.
Dlakwa, M. M. and Culpin, M. F. 1990. ‘Reason for overrun in public sector construction
projects in Nigeria’, International Journal of Project Management, 8(4): 237 -241.
Dlungwana, S., Kandie, W. and Ngassam, E. K. (2009). ‘Enhancing the Quality of Service
Delivered by South Africa’s Small Contractors through e-Mentoring’, Conference ICL
2009, September 23 -25 Villach, Austria.
Dlungwana, S., Nxumalo, X., van Huysteen, S. and Rwelamila, P. D 2002. ‘Development
and Implementation of the SA Construction Excellence Model (SACEM)’, International
Conference on Construction in the 21st Century “challenges and opportunities in
Management and Technology” Miami, Florida, USA. (Online) Available from:
http://researchspace.csir.co.za/dspace/bitstream/10204/2976/1/Dlungwana_2002.pdf.
(Accessed: 14 August 2014).
Dlungwana, W.S. and Rwelamila, P.D. 2003. ‘The role of performance assessment tools in
improving contractor performance in developing countries’, Pretoria: CSIR.
Dlungwana, W.S. and Rwelamila, P.D. 2005. ‘Contractor development models for
promoting sustainable building – A case for developing management capabilities of
contractors’, In: Proceedings of the 2005 World Sustainable Building Conference, Tokyo,
Japan, 27-29 September, pp. 4208-15.
Donner, A., Birkett, N. and Buck, C (1981). Randomization by Cluster. Sample size
requirements and analysis. American Journal of Epidemiology.
Economics Research Department, 2011. ‘Building and Construction Industry Singapore’,
The 17th
Asia construct conference Singapore – Country Report. Available from:

237
http://www.asiaconst.com/past_conference/17th/Singapore.pdf. Available: 15 September
2015.
Edvardsson, B. 1992. ‘Service Breakdowns: A Study of Critical Incidents in an Airline’,
International Journal of Service Industry Management, 3 (4): 17 – 29.
EFQM 2007. ‘The EFQM Excellence Model, The European Foundation for Quality
Management’, Available at: www.efqm.org (accessed November 2013).
Egan, J. 1998. Rethinking Construction: Report of the Construction Task Force on the
Scope for Improving the Quality and Efficiency of the UK Construction Industry,
Department of the Environment, Transport and the Regions, HMSO, London.
Egbu, C. 1999. ‘Skills, knowledge and competencies for managing construction
refurbishment works’, Construction Management and Economics, 17 (1): 29 – 43.
Emuze, F. A. 2011. Performance improvement in SA construction. PhD Thesis, Nelson
Port Elizabeth: Mandela Metropolitan University.
Engineering News, 2005. ‘Johannesburg Plans big electricity network upgrade’,
htp://www.engineeringnews.co.za/article/joburg-plans-electricity-network-upgrade-2005-
01-20. Accessed 5/06/2014.
Enshassi, A., Mohamed, S. and Abushaban, S. 2009. ‘Factors affecting the performance of
construction projects in the Gaza Strip’, Journal of civil engineering and management, vol.
15 (3): 269 – 280.
Enshassi, A., Mohamed, S. and Karriri, A. 2010. ‘Factors affecting bid / no bid decision in
the Gaza Strip – Contractors’ perspectives’, Journal of Financial Management of Property
and Construction, Vol. 15 (2):118 -142.
Enshassi, A., Mohamed, S., Mayer, P. and Abed, K. 2007. ‘Benchmarking masonry labour
productivity’, International Journal of Productivity and performance management, 56 (4):
358 – 368.
Enshassi, A., Al-Najjar, J. and Kumaraswamy, M. 2009. ‘Delays and cost overruns in the
construction projects in the Gaza Strip’, Journal of Financial Management of Property and
Construction, 14 (2): 126-151.

238
Eom, C.S.J., Yun, S.H. and Peek, J.H. 2008. ‘Subcontractor evaluation and management
framework for strategic partnering’, Journal of Construction Engineering and
Management, 134 (11): 842-852.
Estrin, S. and Mickiewicz, T. 2010. ‘Entrepreneurship in Transition Economies: The role
of Institutions and Generational Change’, Institute for the study of labour. IZA DP NO.
4805. Available from http://ftp.iza.org/dp4805.pdf. Accessed: 21 August 2014.
Faridi, A.; El-Sayegh, S. 2006. ‘Significant factors causing delay in the UAE construction
industry’, Construction Management and Economics, 24(11): 1167–1176.
Favie, R. 2010. Quality monitoring in infrastructural Design Build projects: The analysis
of an audit based monitoring system. PhD Thesis, The Netherlands: Eindhoven University
of Technology.
Fernie, S., Leiringer, R. and Thorpe, T. 2006. ‘Rethinking change in construction: a critical
perspective’, Building Research and Information, 34 (2): 91 – 103.
FIDIC. ‘Quality of Construction: Policy International Federation of Consulting Engineers’,
Geneva. http://www1.fidic.org. Accessed: 19th November 2013.
FinMark Trust 2006. ‘FinScope small business survey report’, Available:
http://www.finmarktrust.org.za (accessed: 26 August, 2010).
Flanagan, J. C. 1954. ‘The Critical Incident Technique’, Psychological Bulletin, 51(4): 327
– 358.
Flick, U. 2006. An Introduction to Qualitative Research. 3rd Edition. London: Sage.
Foxcroft, M., Wood, W. K., Herrington, M. and Segal, N. 2002. Global Entrepreneurship
Monitor SA Report. Available:
http://www.gbs.nct.ac.za/gbswebb/userfiles/gemsouthafrica2000pdf (Accessed: 7 January
2010).
Frey, L. R., Botan, C. H., Friedman, P. G. and Kreps, G. L. 1991. Investigating
Communication: An Introduction to Research Methods. Engle Woods Cliffs: Prentice Hall.
239
Frimpong, Y., Oluwoye, J. and Crawford, L. 2003. ‘Causes of delay and cost overruns in
construction of groundwater projects in developing countries: Ghana as the case study’,
International Journal of project management, 21 (5): 321 – 326.
Fugar, F. D. K., and Agyakwah-Baah, A. B. 2010. ‘Delays in building construction
projects in Ghana’, Australasian Journal of Construction Economics and Building, 10
(1/2): 103 – 116.
Fung, A., 2006. ‘Caring for customers: Embracing change’ Project management –
Experience of the Hong Kong Housing Authority’, Proceedings of the One day seminar on
‘Recent Developments in project management in Hong Kong’, Available from:
www.civil.hku.hk/cicid/3_events/48/papers/8.pdf. Accessed: 21/08/2014.
Furneaux, C. W., Hampson, K., Scuderi, p., Kajewski, S. L., 2010. ‘Australian
construction industry KPIs’, CIB World Congress Proceedings – Building a better world,
10 – 13 May. The Lowry, Salford Quays, United Kingdom.
Gauteng Online (2005). ‘Growth and Development Strategy – Gauteng’, Available from:
www.gautengonline.gov.za/.../Growth%20and%20Development%20Strategy.pdf.
Accessed: 15 August 2014.
Gasa, Z. B. N. (2012). Measuring the competitiveness of small, medium and micro
enterprise contractors through the use of the register of contractors. PhD Thesis, Nelson
Port Elizabeth: Mandela Metropolitan University.
Herrington, M. and Wood E. (2004). Global Entrepreneurship Monitor: SA Report, Cape
Town: University of Cape Town.
Gibbs, G. (1988). Learning by doing: A guide to teaching and learning methods. Oxford:
Further Education Unit, Oxford Polytechnic,
Gibson, B. and Cassar, G. 2005. ‘Longitudinal analysis of relationships between planning
and performance in small firms’, Small Business Economics, 25 (3): 207 – 222.
Gremler, D. D. 2004. ‘The Critical Incident Technique in Service Research’, Journal of
service research, 7 (1): 65 – 89.
Greenberg J; Baron, R.A. 2000. Behaviour in organization. New York: Prentice Hall.

240
Greyling, E. (2012). Opportunities for Employment Creation through SME Development
in the construction sector, Free State. International Labour Organisation. ISBN 978-92-2-
127025-6.
Hair, J. F., Black, W. C., Babin, J. B., Anderson, R. E. and Tatham, R. L. 2006.
Multivariate Data Analysis. 6th Edition. Upper Saddle River, NJ: Pearson / Prentice Hall.
Hanna, A. S., Camlic, R., Peterson, P. A., and Nordheim, E. V. 2002. ‘Quantitative
definition of projects impacted by Change orders’, Journal of Construction Engineering
and Management. ASCE, 128 (1).
Hanson, D., Mbachu, J., Nkando, R. (2003). Causes of client dissatisfaction in the South
African building industry and ways of improvement: The contractors' perspectives, in
CIDB, South Africa.
Hapanova, T., Al-Jibouri, L. and Reymen, I. (2006). Process Performance Indicators in
Project Pre-design Stage. Online: http://doc.utwente.nl/58079/1/06_Haponava.pdf.
Accessed: 31/07/2014)
Haponava, T. and Al-Jibouri, S. 2010. ‘Influence of process performance during the
construction stage on achieving end-project goals’, Construction Management and
Economics, 28 (8): 69.
Haseebet, M., Xinhai-Lu, A., Bibi, Maloof-ud-Dyian, Rabbani, W. 2011. ‘Problem of
projects and effects of delays in the construction industry of Pakistan’, Australian Journal
of Business and Management Research, 1 (5): 41-50.
Haupt, T. C. and Whiteman, D. E. 2003. ‘Inhibiting factors of implementing total quality
management on construction sites’, The Total Magazine, 16 (3): 166 – 73.
Hauptfleisch, D., Lazarus S., Knoetze, T. and Liebenberg, S. 2007. ‘An integrated
emerging contractor development model for the construction industry: Practical
implementation and statistical quantification’, Available from:
http://researchspace.Csir.co.za/dspace/bitstream/10204/1850/1/Hauptfleisch_2007(Accesse
d: 20 October 2013).

241
Heish, H. F. and Shannon, S. E. 2005. ‘Three Approaches to Qualitative Content
Analysis’, Qualitative Health Research, 15 (9): 1277 – 1288.
Heizer, J. and Render, B. (2006). Operations Management. 8th Edition. New Jersey:
Pearson Prentice Hall.
Hepworth, P. 1998. ‘Weighing it up – a literature review for the balanced scorecard’,
Journal of Management, 17 (8): 559 -563.
Herrington, M., Kew, J. and Kew, P. 2010. Tracking entrepreneurship in South Africa: A
GEM perspective. SA GEM Report. Cape Town: Graduate School of Business.
Hill, C. W. L. and Jones, G. 2009. Strategic management theory: An integrated approach.
9th
Edition. Mason, Ohio: Cengage Learning.
Holloway, B. B. and Beatty, S. E. 2003. Service Failure in online retailing: A recovery
opportunity. Journal of Service Research, 6 (1): 92 – 105.
Holsti, O. R. 1969. Content Analysis for the Social Sciences and Humanities. Reading,
MA: Addison-Wesley.
Horta, I. M., Camanho, A. S. and Costa, M. J. 2012. ‘Performance assessment of
construction companies: A study of factors promoting financial soundness and innovation
in the industry’, International Journal of Production Economics, 137 (1): 84 – 93.
Hua J., Doloi, H. and Gao, S. 2007. ‘Relationship based determinants of building project
performance in China’, Construction Management and Economics, 25: 297 – 304.
Hwang, B. G., Thomas, S. R., Degezelle, D. and Caldas, C. H. 2008. ‘Development of a
benchmarking framework for pharmaceutical capital projects’, Construction Management
and Economics, 26 (2): 177 – 195.
Hwang, B. G., Thomas, S. R., Haas, C. T. and Caldas, C. H. 2009. ‘Measuring the impact
of rework on construction cost performance’, Journal of construction engineering and
management, 135: 187 – 198.

242
Idoro, G. I., 2010. ‘Influence of quality performance on clients’ patronage of indigenous
and expatriate construction contractors in Nigeria’, Journal of civil engineering and
management, 16 (1): 65 - 73.
Idrus, A. and M. Sodangi, 2010. ‘Framework for evaluating quality performance of
contractors in Nigeria’, International Journal of Civil and Environment Engineering,
10(1): 34-39.
Jin, X., Doloi H. and Gao, S., 2007. ‘Relationship based determinants of building project
performance in China’, Construction Management and Economics, 25: 297 – 304.
Jordan, J., Mills, C., Moyo, T., Keshav, C. and Ndoziya, J. 1992. ‘Classification of Jobs
into levels of work: Four Reliability Studies’, Zambizia, 19 (2):139 – 144.
Kagioglou, M., Cooper, R. and Aouad, G. 2001. ‘Performance management in
construction: a conceptual framework’, Construction Management and Economics, 19(1):
85–95.
Kallon, K. M. 1990. The Economics of Sierra Leonean Entrepreneurship, University Press
of American, Incorporated
Kaming, P., Olomolaiye, P., Holt, G., Harris, F. 1997. ‘Factors influencing construction
time and cost overruns on high-rise projects in Indonesia’, Construction Management and
Economics, 15 (1): 83-94.
Kaplan, R. S., and Norton, D. P. 1992. ‘The balanced scorecard measures that drive
performance’, Harvard Business Review, January – February: 71 – 79.
Kaplan, R. S. and Norton, D. P. 1996. The balanced scorecard. Harvard Business School
Press, Boston.
Kassarjian 1977. ‘Content Analysis in Consumer Research’. Journal of Consumer
Research, 4 (June): 8 – 18.
Kazaz, A., Talat, B. M. and Ulubeyli, S. 2005. ‘Cost-based analysis of quantity in
developing countries: A case study of building projects’, Building and Environment, 40:
1356 – 1365.

243
Kazaz, A. and Ulubeyli, S. 2009. ‘Strategic Management Practices in Turkish Construction
Firms’, Journal of Management in Engineering, 25 (4): 185 – 194.
Keats, B. W. and Bracker, J. S. (1988), ‘Toward a Theory of Small Firm Performance: A
Conceptual Model’, American Journal of Small Business. 12 (4): 41 – 58.
Keaveney, S. M. 1995. ‘Customer Switching Behaviour in Service Industries: An
Exploratory Study’, Journal of Marketing, 59 (April): 71 – 82.
Kelly, S. W., Hoffman, D. and Davis, M. A. 1993. ‘A typology of retail failures and
recoveries’, Journal of retailing, 69 (winter): 429 – 454.
Kheni, N. A., Gibb, G. F. and Andrew, R. J. 2010. ‘Health and Safety Management within
Small and Medium Sized Enterprises in Developing Countries: Study of Contextual
Influences’, Journal of Construction Engineering and Management, 136 (10): 1104 - 1115
Kikwasi, G. J. 2012. ‘Causes and effects of delays and disruptions in construction projects
in Tanzania’, Australasian Journal of construction economics and building, conference
series, 1 (2): 52 – 59.
Kohli, A.K. and Jaworski, B. 1990, ‘Market Orientation: The Construct, Research
Propositions, and Managerial Implications’, Journal of Marketing, 54 (2): 1-18.
Kotler, P. and Keller, k. L. 2006. Marketing Management. 12th Edition. New Jersey:
Pearson Prentice Hall, Upper Saddle River.
Kunene, T.R. (2008). A Critical Analysis of Entrepreneurial and Business Skills in SMEs
in the Textile and Clothing Industry in Johannesburg SA. PhD Thesis, Pretoria: University
of Pretoria.
Ladzani, W., Smith, N. and Pretorious, L. 2010. ‘Benchmarking SMMEs’ management
performance in the built environment of Gauteng Province’, SA. ACTA Structilia, 17(1).
Ladzani, L., Smith, N. and Pretorious, L. 2012. ‘Using leadership and strategic planning
functions to improve management performance: The progress made by small, medium and
micro enterprises (SMMEs) in the Province of Gauteng’, African Journal of Business
Management, 6 (11): 3988 – 3999.

244
Lai, I. K. W and Lam, R. K. S. 2010. ‘Perception of various performance criteria by
stakeholders in the construction sector in Hong Kong’, Construction Management
Economics, 28: 377 391.
Laitinen, E.K. 2002. ‘A dynamic performance measurement system: evidence from small
Finnish technology companies’, Scandinavian Journal of Management, 18 (2): 65-99.
Lam, P. T. I., and Wong, F. W. H., 2009. ‘Improving building project performance: How
buildability benchmarking can help’, Construction Management and Economics, 27: 41 –
52.
Langston, C. (2012). Comparing international construction performance.
http://epublications.bond.edu.au/sustainable_development.
Larson. E. 1992. ‘Partnering on construction projects: A study of the relationship between
activities and project success’, IEEE Transactions on engineering management, 44(2): 188
– 195.
Lazarus, S., Hauptfleisch, D. T. and Liebenberg, S. 2007. An integrated emerging
contractor development model for the construction industry: Practical implementation and
statistical quantification.
Le-Hoai, L., Lee, Y. D. and Lee, J. Y., 2008. ‘Delay and cost overruns in Vietnam Large
Construction Projects: A comparison with other selected countries’, KSCE Journal of Civil
Engineering, 12 (6): 367 – 377.
Ligthelm, A. 2011. ‘Survival Analysis of Small Informal Businesses in South Africa, 2007
– 2010’, Eurasian Business Review, 1 (2): 160 – 179.
Li, H., Love, P.E.D., Dawe, D.S. 2000. ‘Effects of overtime work and additional resources
on project cost and quality’, Engineering Construction and Architectural Management, 7
(3): 211-220.
Lin, G. and Shen, Q. 2007. ‘Measuring the Performance of Value Management Studies in
Construction: Critical Review’, Journal of Management in Engineering, 23 (1): 1 – 9.
Ling, Y. Y. F, 2004. ‘Key Determinants of Performance of Design-bid-build Projects in
Singapore’, Building Research and Information 32 (2):128 – 139.
245
Ling, F.Y.Y., Low, S.P., Wang, S.Q. and Lim, H.H. 2009. ‘Key project management
practices affecting Singaporean firms’ project performance in China’, International
Journal of Project Management, 27(1): 59–71.
Lingelbach, D., D LA Vina, L., Asel, P. 2005. ‘What’s distinctive about growth-oriented
entrepreneurship in developing countries?’, Working paper No.1, Center for Global
Entrepreneurship, UTSA College of Business, San Antonio, TX. 6. Available at SSRN:
http://ssrn.com/abstract=742605.
Liu, A. M. M. and Walker, A. 1998. ‘Evaluation of project outcomes’, Construction
management and Economics, 16 (2): 209 – 219.
Lisa, M. S., and Judge, A.T. 2004. ‘Employee attitudes and job satisfaction. Human
Resource Management’, Winter, 43(4): 395–407.
Lo, T. Y., Fung, I. W. H. and Tung, K. C. F. 2006. ‘Construction delays in Hong Kong
civil engineering projects’, Journal of Construction Engineering and Management, 132(6):
636-49.
Love, P. E. D., Mandal, P. and Li, H. 1999. ‘Determining the causal structure of rework
influences in construction’, Construction Management and Economics, 17: 505 – 517.
Love, P. E. D. and Li, H. 2000. ‘Quantifying the causes and costs of rework in
construction’, Construction Management and Economics, 18: 479 – 490.
Luu, T. V., Kim, S. Y., Cao, H. L. and Park, Y. M. 2008. ‘Performance measurement of
construction firms in developing countries’, Construction management and economics, 26
(4): 373 – 386.
Lussier, R. N. and Corman, J. 1995. A Business success versus failure prediction model
for entrepreneurs with 0 – 10 employees. Available:
file://C:\Windows\Desktop\1996\SBIDA\03.htm (Accessed: 31 July 2014).
Mahadea, D. 2008. The environmental context for SMME entrepreneurship in Kwazulu-
Natal: School of Economics: University of Cape Town.

246
Makui, A. Zahedi, M. and Shokouh-Abdi, M. 2011. ‘A System dynamic model for
measuring the construction quality of buildings’ structures’, Management Science Letters,
pp. 127 – 138. Available: www.growing science.com/msl. (Accessed; 24 April 2014).
Masakure, O., Henson, S. and Cranfield, J. 2009. ‘Performance of microenterprises in
Ghana: a resource – based view’, Journal of Small Business and Enterprise Development,
16 (3): 466 – 484.
Mathison, S. 1988. ‘Why Triangulate?’ American Educational Research Association, 17
(2): 13 – 17.
Matos, C. A., Rossi, V. R., Veiga, R. T. and Vieira, V. A. 2009. ‘Consumer reaction to
service failure and recovery: the moderating role of attitude toward complaining’, Journal
of service marketing, 23 (7): 462 – 475.
Mattsson, J. and Helmersson, H. 2005. ‘Internet banking: Modelling the e-competence of
customers with a text analytic CIT approach’, International journal of bank marketing, 23
(6): 470 – 483.
Marx H. J. 2012. ‘Construction Industry Indicators Affecting Contractors’, Journal for the
Advancement of Performance Information and Value, 4 (1).
Marx, H, J. 2013. Results of the 2012 survey of the CIDB construction industry indicators.
University of the Free State: Department of Quantity Surveying and Construction
Management.
Maurer, J. 2007. ‘Understanding Construction Budgets: - Establish a realistic
comprehensive budget that anticipates all cost, Smart Buildings: Church and Worship
Technology. Available: http://www.ruckpate.com/PDFs/Church/CWT_BudgetAricle.pdf.
Accessed: 31 July 2014.
Mbachu, J. 2012. Knowledge and skills required for contractors’ performance in
construction project delivery: An exploratory study of the up-skilling needs of the New
Zealand contractors.
Mbachu, J. and Nkado, R. 2007. ‘Factors constraining successful building project
implementation in SA’, Construction Management and Economics, 25 (1): 39 – 54.

247
Mbachu, J. 2008. ‘Conceptual framework for the assessment of subcontractors’ eligibility
and performance in the construction industry’, Construction Management & Economics,
26 (5): 471 – 484.
Mbachu, J. I. and Nkado, R. N. 2001. ‘Modelling client needs and satisfaction in the built
environment’, 17th
Annual ARCOM Conference, 5 – 7 September 2001, University of
Salford. Association of Researchers in Construction Management, 1: 917 -27.
Mbachu, J. and Nkado, R. 2006. ‘Conceptual framework for assessment of client needs
and satisfaction in the building development process’, Construction Management and
Economics, 24 (1): 31 – 44.
Mbachu, J. and Durdyev, S. 2011. ‘On site labour productivity of New Zealand
construction industry: Key Constraints and improvement measures’, Australasian Journal
of construction economics and building, 11 (3): 18 – 33.
Master Builders South Africa Annual Report (2013)
Mintzberg, H., 1994. ‘The Fall and Rise of Strategic Planning’, Harvard Business Review.
January – February.
Motete, L., Mbachu, J. and Nkado, R. (2003). ‘An investigation into material wastages on
building sites’, Proceedings of CIDB 1st Postgraduate Conference, Port Elizabeth, SA, pp.
288-95.
Msweli, P. (2011). Writing a Research Proposal: Practical Guidelines for Business
Students. Cape Town: Juta.
Mukuka, M. J., Aigbavboa, C. O. and Thwala, W. D. 2013. Construction professionals’
perception on the causes and effects of project delay in Lusaka, Zambia. Available from:
http://ujdigispace.uj.ac.za/handle, Access: 23 May 2014.
Murphy, G.B., Trailer, J.W. and Hill, R.C. 1996. ‘Measuring performance in
entrepreneurship research’, Journal of Business Research, 36 (1): 15-23.
Naude, W. Gries, T., Wood, E. and Meintjies, A. 2008. ‘Regional determinants of
entrepreneurial start-ups in a developing country’, Entrepreneurship and Regional
Development, 20: 111–124.
248
Narver, J.C. and Slater, S.F. 1990. ‘The Effects of a Market Orientation on Business
Profitability’, Journal of Marketing, 54 (4): 20 – 35.
Ncwadi, M. R. and Dangalazana, T., 2005. ‘An Exploratory study into the challenges
facing the emerging contractors involved in the construction of low cost housing in Wells
Estate and Ikamv’elihle Townships in the Nelson Mandela Metropole, South Africa’,
World Congress on Housing Transforming Environments through Design, September
2005, Pretoria.
Neely, A. and Bourne, M. 2000. ‘Why measurement initiatives fail’, Measuring Business
Excellence, 4 (4): 3 – 6.
Neely, A., Adams, C. and Crowe, P. 2001. ‘The performance prism in practice measuring
excellence’, Journal of business performance management, 5(2): 6-12.
Neely, A., and Adams, C. 2002. ‘The performance prism perspective’, Journal of Cost
Management, 15(1): 7–15.
Nurbani, H., Chin, S., Yeow, J. and Ashikin, N. 2011. Financial constraints and
opportunities of micro entrepreneurs: A theoretical framework. International Conference
on Business and economics research, 1, IACSIT Press, Kuala Lumpur, Malaysia.
Odeyinka, H. A. and Kaka, A. 2005. ‘An evaluation of contractors’ satisfaction with
payment terms influencing construction cash flow’, Journal of Financial Management of
Property and Construction, 10 (3): 171 – 180.
Odusami, K. T. 2002. ‘Perceptions of construction professionals concerning important
skills of effective project leaders’, Journal of management in engineering, 18 (2): 61 -67.
Odusami, K. T., Oladiran, O. J. and Ibrahim, S. A. 2012. ‘Evaluation of materials wastage
and control in some selected building sites in Nigeria’, Emirates Journal for Engineering
Research, 17 (2): 53 – 65.
Ofori, G. 1990. The construction industry: Aspects of its Economics and Management,
Singapore University press, Singapore.
249
Ofori, G. 1991. Programmes for improving the performance of contracting firms in
developing countries: A review of approaches and appropriate options. Construction
Management and Economics, Vol. 9 (1): 19 – 38.
Ofori, G. 2006. ‘Productivity of the construction industry’, Research Brief 2005/2003.
Singapore: Department of Building, School of Design and Environment, National
University of Singapore.
Ofori, G. 2009. ‘Construction SMME development’, Isiza. Issue 6. Available from:
http://www.isiza.co.za/features/cidb/982388.htm (Accessed: 23July 2014).
Ofori, G. 2012. Developing the Construction Industry in Ghana: The Case for a Central
Agency. Available from:
http://www.buildingcontractorsgh.com/Developing%20the%20Construction%20Industry%20in%2
0Ghana.pdf (Accessed: 15 January 2015).
Okpara, J. O. and Wynn, P. 2007. ‘Determinants of small business growth constraints in a
sub-saharan African economy’, SAM Advanced Management Journal, 72(2): 24-35.
Oladapo, A. A. 2007. ‘A quantitative assessment of the cost and time impact of variation
orders on construction projects’, Journal of Engineering Design and Technology, 5 (1): 35
– 48.
Olawale, F. and Garwe, D. 2010. ‘Obstacles to the growth of new SMEs in SA: A
principal component analysis approach’, African Journal of Business Management, 4 (5):
729 – 738.
Otim, G., Alinaitwe, H.M., Tindiwensi, D. and Kerali, A. G. 2011. ‘The causes and impact
of uncompleted buildings; studies in Kampala City’, Second International Conference on
Advances in Engineering and Technology. Available from:
http://news.mak.ac.ug/documents/Makfiles/aet2011/Otim.pdf, Accessed: 14 May 2014.
O’Regan, N. and Ghobadian, A. 2002. ‘Effective strategic planning in small and medium
sized firms’, Management decision, 40 (7): 663 – 671.

250
Oyewobi, L., Ibironke, O. Ganiyu, B. and Ola-Awo, A. 2011. ‘Evaluating rework cost – a
study of selected building projects in Niger State Nigeria’, Journal of Geography and
Regional Planning, 4: 147 – 151.
Palaneeswaran, E., NG, T. and Kumaraswamy, M. 2006. ‘Client satisfaction and quality
management systems in contractor organizations’, Building and Environment, 41: 1557-
1570.
Patton, M. 2002. Qualitative research and evaluation methods. 3rd
Edition. Thousand
Oaks, CA; Sage Publications.
Pearce, D. (2003). ‘The Social and Economic Value of Construction: The Construction
Industry’s Contribution to Sustainable Development’, Available from: www.ncrisp.org.uk
(Accessed: 23 July 2014).
Peters, T. J., and Waterman, R. H. (1982). In search of excellence: Lessons from
America’s best run companies, New York: Harper and Row.
Pfeffer, J. S. and Gerald, R. (1978). ‘The external control of organisations: A resource
dependence perspective’, New York, NY, Harper and Row Publishers, INc.
Pheng, L. S. and Chuan, Q. T. 2006. Environmental factors and work performance of
project managers in the construction industry’, International Journal of Project
Management, 24: 24 – 37.
Pickavance, K. (2005). Delay and disruption in construction contracts, 3rd edition. UK:
Informa Legal Publishing.
Porter, M. E. (1990). The Competitive Advantage of Nations. New York: Free Press.
Reijonen, H. and Komppula, R. 2011. ‘Perception of success and its effect on small firm
performance’, Journal of Small Business and Enterprise Development, 14 (4). X xxx
Robson, A., Prabhu, V. B. and Mitchell, E. 2002. ‘TQM enablers and business
sustainability: An empirical study of the service sector in the North East of England’,
International Journal of Quality and Reliability Management, 19 (5): 610 – 632.
251
Robinson, R. B. 1982. ‘The importance of Outsiders in Small Strategic Planning’,
Academy of Management Journal, 25(1): 80 – 93.
Robinson, H. S., Anumba, C. J., Carrillo, P. M. and Al-Ghassani, A. M. 2005. ‘Business
performance measurement practices in construction engineering organisations’, Measuring
Business Excellence, 9 (1): 13 – 22.
Ribeiro, F. L.; Curado, M. T. 2000. ‘How ISO 9000 standards are being used by
Construction Companies in Portugal’, in proceedings of the International Conference
‘Implementation of construction quality and related systems – A Global update’, pp. 73 –
84, CIB TG-36,IST, Lisbon.
Rue, L. W. and Ibrahim, N. A. 1998. ‘The relationship between planning sophistication
and performance in small business’, Journal of small business management, 36 (4): 24 –
32.
Ruekert, R. And Walker, O.C. 1987. ‘Marketing’s Interaction with other Functional Units:
A Conceptual Framework and Empirical Evidence’, Journal of Marketing, 51 (1): 1-19.
Rust, F. C. and Koen, R. 2011. ‘Positioning technology development in the SA
construction industry: a technology foresight study’, Journal of the SA Institution of civil
engineering, 53 (1): 2 – 8.
Rwelamila, P. D. and Asalan, R., 2010. ‘Understanding of project management good
practices by construction project managers: the case of ABCD’, Proceedings of 26th
Annual ARCOM Conference, 6 - 8 September 2010, Leeds, UK, Association of
Researchers in Construction Management, 1189 – 1198. Available from:
http://www.arcom.ac.uk/-docs/proceedings/ar2010-1189-1198_Rwelamila_and
Asalan.pdf.
Salminen, J. (2005). Measuring performance and determining success factors of
construction sites. PhD Thesis: Helsinki University of Technology, Finland.
Sambasivan, M.A and Soon, Y. W. 2007. ‘Causes and effects of delays in Malaysian
construction industry’, International Journal of Project Management, 25 (5): 517-526.
252
Sandberg, W. R, Robinson, R. B and Pearce, J. A. 2002. ‘Why Small Businesses Need a
Strategic Plan’, Business and Economic Review, 48 (1): 12-15.
Santalli, E. and Vivarelli, M. 2007. ‘Entrepreneurship and the process of firms’ entry,
survival and growth’, Industrial and corporate change, 16 (3): 455 – 488.
Santos, J. B. and Brito, L. A. 2012. ‘Towards a subjective measurement model for firm
performance’, Brazilian Administration Review, 9 (6): 95 – 117.
Saunders, M., Lewis, P. and Thornhill, A. 2003. Research Methods for Business Students.
3rd Edition. New York: Prentice Hall Financial Times.
Schluter, J., Seaton, P. and Chaboyer, W. 2008. ‘Critical incident technique: A user’s
guide for nurse researchers’, Journal of advanced nursing, 61(1): 107 – 114.
Schraven, D., Hartmann, A. and Dewulf, G. 2011. ‘Effectiveness of infrastructure asset
management: challenges for public agencies’, Built environment project and asset
management, 1: 61 – 74.
Small Enterprise Development Agency (SEDA), Annual Review of Small Business in SA,
2011 / 2012. SEDA: Pretoria.
Selamat, N., Razak, R. R. and Sanusi, Z. A. 2011. ‘Survival through Entrepreneurship:
Determinants successful Micro-enterprises in Balik Pulau, Penang Island, Malaysia’,
British Journal of Arts and Social Sciences, 3 (1): 23 – 37.
Serenko, A. 2006. ‘The use of interface agents for email notification in critical incidents’,
International Journal of Human - Computer Studies, 64 (1084 - 1098).
Serenko, S. and Stach, A. 2009. ‘The Impact of Expectation Disconfirmation on Customer
Loyalty and Recommendation Behaviour: Investigating online Travel and Tourism
Services’, Journal of Information Technology Management, 20 (3).
Serumaga-Zake, P. 2011. Business Research Methods. (Unpublished)
Sidumedi, K. S. 2009. ‘An investigation into the Relationship between the corporate
culture of SA construction firms and performance’, Available from:
http://wiredspace.wits.ac.za/handle/10539/7942, Accessed: (16 May 2014)
253
Sillars, D. 2010. A theoretical Approach to project based construction industry enterprises:
A structure for scientific inquiry. Working Paper proceedings. Engineering project
organisations conference. South Lake Tahoe, University of Colorado.
Skaik, S. H. (2009). ‘Implementing strategic management in construction’, Available
from: http://www.cmguide.org/archives/1375 Accessed: (23 July 2014).
Smallwood, J. J. 2002. ‘The Influence of health and safety (H & S) culture on H & S
performance. In:
Greenwood D (Ed.) Proc. Of the 18th
Annual ARCOM Conference, University of
Northumbria, 2 – 4 September 2002, 1, 217 – 226.
Smallwood, J. J. and Venter, D. 2002. ‘The Influence of project managers on construction
health and safety in South Africa’, The Australian Journal of Construction Economics and
Building, 2 (1): 57 – 69.
Smallwood, J. J. 2004. ‘The influence of engineering designers on health and safety during
construction’, Journal of the SA Institution of Civil Engineering, 46 (1): 2 – 8.
Snyman, E. 2012. ‘The State of the SA Construction Industry’, Available from:
www.industryinsight.co.za, Accessed: (17 March 2014).
Ssegawa, J. K., Mfolwe, K. M., Makuke, B. and Kutua, B. 2002. ‘Construction variations:
a scourge or a necessity’, Proceedings of the 1st CIB-W107 International Conference on
Creating a Sustainable Construction Industry in Developing Countries, Cape Town, SA,
Available from:www.odsf.co.za/cdcproc/docs/3rd/ssegawa_jk_mfolwe_km.pdf,
Accessed: (11November 2013).
Sunday, O. A. (2010). ‘Impact of variation orders on public construction projects’, In:
Egbu, C. Proceedings, 26th Annual ARCOM Conference, 6 – 8 September 2010, Leeds,
UK. Association of Researchers in Construction Management, pp. 101 – 110.
Tangen, S. 2005. ‘Professional Practice Demystifying productivity and performance’,
International Journal of Productivity and performance management, 54 (1): 34 – 46.
Tayebwa, B and Mugisha, B. (1998). Basic Economics. 3rd ed. Simplified Textbooks
agency (STA): Kampala. Uganda.

254
The Department of labour, (2014). Construction worker dies in horrific accident (2007).
Available from: http://www.labour.gov.za: Accessed, 23 May 2014.
The Health and Safety Act, as amended by the Occupational Health and Safety
Amendment Act (181 of 1993).
The KPI Working Group, 2000. KPI Report for the Minister for Construction. London:
Department of the Environment, Transport and the Regions. Available from:
https://www.gov.uk/government/uploads/system/uploads/attachment_data/file/16323/file1
6441.pdf. Accessed: 15 August 2014.
Thompson, A. A., Strickland, A. J. and Gamble, J. E. 2005. Crafting and Executing
Strategy, The Quest for Comparative Advantage Concepts and Cases. 14th
Edition. Boston:
McGraw-Hill International Edition.
Thwala, D. W., Akintunde, M., Imoudu, W. and Bilau, A. 2012. ‘Sudanese Small and
Medium Sized Construction Firms: An Empirical Survey of Job Turnover’, Journal of
Basic Applied Scientific Research, 2 (8): 7414 -7420
Thwala, W. D. and Mvubu, M., 2009. ‘Problems facing small and medium size contractors
in Swaziland’, Journal Service Science and Management, 2: 353 – 361.
Thwala, W. D. and Phaladi, M. J. 2009. ‘An exploratory study of problems facing small
contractors in the North West Province of SA’, African Journal of Business Management,
3 (10): 533-539.
Touran, A., Atgun, M. and Bhurisith, I., 2004. Analysis of the United States Department of
Transportation prompt pay provisions’, Journal of Construction Engineering and
Management, 130 (5): 719 – 725.
Truong-van, L., Kim, S., Cao, H. and Park, Y. 2008. ‘Performance measurement of
construction firms in developing countries’, Construction Management and Economics,
vol. 26, pp. 373 – 386.
Tushabomwe, K. 2006. ‘Causes of Small Business Failure in Uganda’, African Studies
Quarterly 8(4).
255
Tsolas, I. E., 2011. ‘Modelling profitability and effectiveness of Greek-listed construction
firms: and integrated DEA and ratio analysis’, Construction Management and Economics,
29 (8): 795 – 807.
Ugwu, O. O. and Haupt, T. C., 2007. ‘Key performance indicators and assessment
methods for infrastructure sustainability – a SA construction industry perspective’,
Building and Environment, 42: 665 – 680.
Umar, A. A., Zawawi, A. W., Khamidi, M. F. and Idrus, A. 2012. ‘Assessing the
perceptions of regional stakeholders on benefits of PFI for Infrastructure provision’,
International Journal of Civil Engineering and Building Materials, 3 (4): 207 – 215.
Van Wyk, L., Kolev, M., Osburn, L. de Villers and Kimmie, Z. 2011. The Employment
Aspects of Energy Related Improvements in Construction in South Africa. Swizerland:
International Labour Organisation.
Venkatraman, N. and Ramanujam, V., 1986. ‘Measurement of Business Performance in
Strategy Research: A Comparison of Approaches’, Academy of Management Review, 11:
801 – 814.
Von Broembsen, M., Wood, E., Herrington, M. (2005). Global Entrepreneurship Monitor:
SA Report 2005. Available from: http://www.gemconcortium.org/, Accessed (28 July
2013).
Wang, X. and Huang, J., 2006. ‘The relationships between key stakeholders’ project
performance and project success: performance of Chinese construction supervising
engineers’, International Journal of Project Management, 24 (3): 253 – 260.
Ward, S. C., Curtis, B. and Chapman, C. B. 1991. ‘Objectives and performance in
construction projects’, Construction management and economics, 9: 343 – 353.
Warszawski, A. 1996. ‘Strategic Planning in Construction Companies’, Journal of
Construction Engineering and Management. 122 (2): 11401.
Warwick, J. 2011, Building industry safety needs to be of stellar standard. Available from:
http://www.crown.co.za/new/2011/July/building_industry_safety_needsto_be-of
stellar_standard.htm. Accessed: 14 September 2014.

256
Watson, P. and Seng, L.T. (2001). ‘Implementing the European Foundation for Quality
Management Model in construction’, Construction Information Quarterly, Construction
paper130.
Webb, W. and Auriacombe, C. 2006. ‘Research Design in Public Administration: Critical
Considerations’, Journal of Public Administration, 41 (3).
White, F. and Locke, E. A. 1981. ‘Perceived determinants of high and low productivity in
three occupational groups: A critical incident study’, Journal of Management Studies, 18
(4): 375 – 386.
Windapo, A. 2011. ‘Investigation into the level of compliance to construction health and
safety requirements within the South African Construction Industry’, Proceedings of the
CIB W099 Conference, Washington D. C., 23 – 25 August.
Windapo, A. and Cattell, K. 2011. ‘Research Report: Mapping the Path to Becoming a
Grade 9 Contractor’, University of Cape Town: Department of Construction Economics
and Management.
Windapo, A. and Oladapo, A. 2012. ‘Determinants of construction compliance with health
and safety regulations in SA’, A paper presented at 28th Annual ARCOM Conference, 3 –
5 September 2012, Edinburgh, UK, Association of Researchers in Construction
Management, pp. 433 – 444.
Wu, J., Kumaraswamy, M. M. and Soo, G. K. L. 2011. Dubious benefits from future
exchange: an explanation of payment arrears from continuing clients in Mainland China’,
Construction Management and Economics, 29 (1): 15 – 23.
Yang, J. B. and Wei, P. R. 2010. ‘Causes of delay in the planning and design phases for
construction projects’, Journal of Architectural Engineering, 16 (2): 80-83.
Yang, H., Yeung, J. F. Y., Chan, A. P. C., Chiang, Y. H. and Chan, D. W. M. 2010. ‘A
Critical review of performance measurement in construction’, Journal of facilities
management, 8(4): 269 – 284.
Yao, H., Ou, X. and Shen, L.Y. 2006. ‘Review on environmental management
performance in construction business’, in Shen, L.Y. (ed.) Key Issues of Sustainable

257
Performance for Construction Projects, SDP Research Group, Department of Building and
Real Estate, The Hong Kong Polytechnic University, Hong Kong, pp. 55–72.
Yates, J. K. and Guhathakurta, S. 1993. ‘International labour productivity’, Cost
Engineering, 35(1): 15 -25.
Yin, R. K. 2009. Case Study Research, Design and Methods: Applied Social Research
Methods Series. 4th
Edition. London: Sage.
Yu, I., Kim, K., Jung, Y. and Chin, S. 2007. ‘Comparable performance measurement
system for construction companies’, Journal of Management in engineering, 23 (3): 131 –
9.
Zahra, S. A. and Covin, J. G. 1995. ‘Contextual influences on the corporate
entrepreneurship – performance relationship: A longitudinal analysis’, Journal of Business
Venturing, 10(1): 43 – 58.
Zau, P. X. W. 2006. ‘Strategies for minimising corruption in the construction industry in
China’, Journal of Construction in Developing Countries, 11(2): 15–29.
Zeithaml, V. A., Bitner, M. J. and Gremler, D. D. 2006. Service marketing: Integrating
customer focus across the firm. 4th Edition. New York: McGraw-Hill Irwin.
Zikmund, W. G., Babin, B. J., Carr, J. C. and Griffin, M. 2010. Business Research
Methods. 8th Edition. South – Western New York: Thomson.
Zulu, S., Chileshe, N. 2008. ‘The impact of service quality on project performance: a case
study of building maintenance services in Zambia’, in Proc. of the 3rd Built Environment
Conference, Association of Schools of Construction of Southern Africa, Cape Town, SA.
Zwikael, O. 2008. ‘Top management involvement in project management: Across country
study of the software industry’, International Journal of Managing Projects in Business, 1
(4): 498- 511.

258
APPENDICES
Appendix A: Introductory Letter (sample)
Date ………………..
Dear Business Executive
My name is George Hove, a registered student with (Unisa) Graduate School of Business
Leadership studying for my Doctor of Business Leadership degree. The topic of my
research is:
“PERCEPTIONS OF SMALL BUSINESS EXECUTIVES ON DETERMINANTS
OF PERFORMANCE IN THE CONSTRUCTION INDUSTRY IN GAUTENG,
SOUTH AFRICA”
This research is directed at Business Executives of SMEs. Your company has been
randomly selected to participate in the above mentioned study. It will be highly
appreciated if you as the executive member of the business answer the attached
questionnaire as honest as possible. Your response will help to define and determine the
perceptions of Small Business Executives (SBEs) on the determinants of business
performance. I hope your response will help us have a better understanding of what makes
construction SME sector perform or not perform. Kindly complete the attached
questionnaire and return same to [email protected] on or before 5th
November
2013.
All your responses will be confidential and no one will have access to the information
except the researcher. For further questions or clarifications, please contact the
undersigned.
Thank you sincerely for your cooperation.
Yours faithfully
George Hove
DBL Candidate
Tel.: 082 310 3567, Email: [email protected]
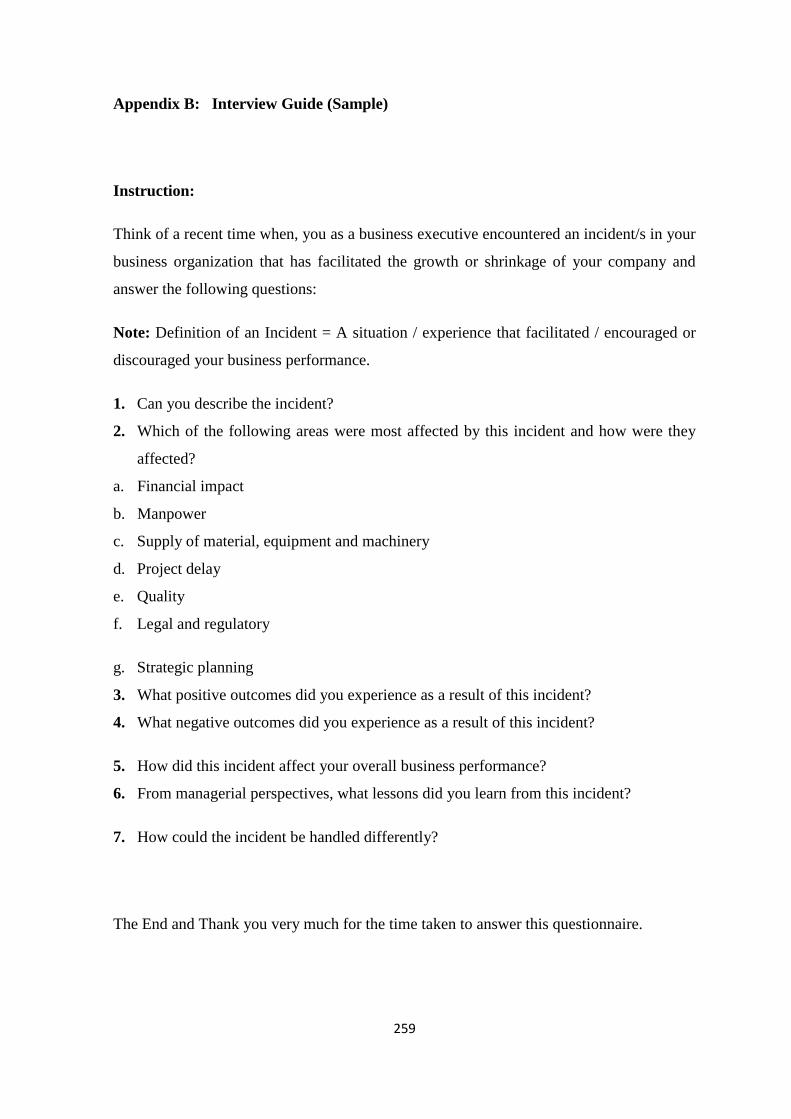
259
Appendix B: Interview Guide (Sample)
Instruction:
Think of a recent time when, you as a business executive encountered an incident/s in your
business organization that has facilitated the growth or shrinkage of your company and
answer the following questions:
Note: Definition of an Incident = A situation / experience that facilitated / encouraged or
discouraged your business performance.
1. Can you describe the incident?
2. Which of the following areas were most affected by this incident and how were they
affected?
a. Financial impact
b. Manpower
c. Supply of material, equipment and machinery
d. Project delay
e. Quality
f. Legal and regulatory
g. Strategic planning
3. What positive outcomes did you experience as a result of this incident?
4. What negative outcomes did you experience as a result of this incident?
5. How did this incident affect your overall business performance?
6. From managerial perspectives, what lessons did you learn from this incident?
7. How could the incident be handled differently?
The End and Thank you very much for the time taken to answer this questionnaire.

260
Appendix C: Research Questionnaire (sample)
SECTION A
DEMOGRAPHIC INFORMATION OF THE RESPONDENT
This section will require you to provide your personal profile as the key respondent that will help in interpreting the results of this
survey. Please answer the following questions to the best of your ability and by ticking (√) the relevant box.
1.1 Your Gender
Male 1
Female 2
1.2 Your Age Group
Less than 20 years 1
21 – 29 years 2
30 – 39 years 3
40 – 49 years 4
+ 50 years 5
1.3 What is your ethnic group?
Black 1
Indian 2
Whites 3
Coloured 4
Other 5
1.4 Your disability status
Disabled 1
Not disabled 2
1.5 Number of experience years of the respondent is ……………..years
1.6 Your highest formal qualification
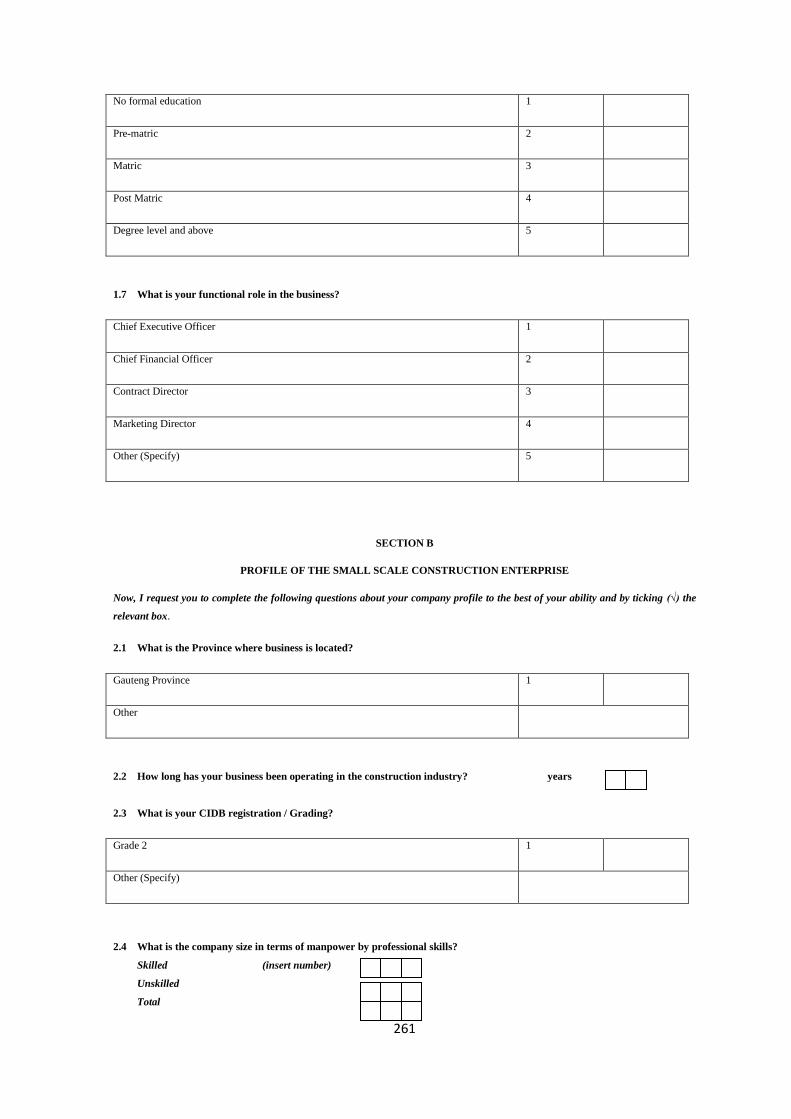
261
No formal education 1
Pre-matric 2
Matric 3
Post Matric 4
Degree level and above 5
1.7 What is your functional role in the business?
Chief Executive Officer 1
Chief Financial Officer 2
Contract Director 3
Marketing Director 4
Other (Specify) 5
SECTION B
PROFILE OF THE SMALL SCALE CONSTRUCTION ENTERPRISE
Now, I request you to complete the following questions about your company profile to the best of your ability and by ticking (√) the
relevant box.
2.1 What is the Province where business is located?
Gauteng Province 1
Other
2.2 How long has your business been operating in the construction industry? years
2.3 What is your CIDB registration / Grading?
Grade 2 1
Other (Specify)
2.4 What is the company size in terms of manpower by professional skills?
Skilled (insert number)
Unskilled
Total

262
2.5 Which of the following statements best describes your business profile? (Tick all that apply: where 1 apply and 2 do not
apply).
Black owned business 2.5.1 White owned business 2.5.2
Women owned business 2.5.3 Man owned business 2.5.4
Youth Owned business (<35yrs.) 2.5.5 Adult Owned business (>35 yrs.) 2.5.6
Disabled – owned business 2.5.7 Other (specify)
2.6 What is the service provided by your organization? (Tick all that apply: where 1 apply and 2 do not apply).
Civil Engineering (CE) 2.6.1
General Building (GB) 2.6.2
Other (specify)
2.7 Which construction projects are you involved in? (Tick all that apply: where 1 applies and 2 do not apply).
Government projects 2.7.1
Public / Private Partnership projects 2.7.2
Private development 2.7.3
Others (Specify)
SECTION C
PERCEPTIONS ON DETERMINANTS OF SMALL SCALE CONSTRUCTION ENTERPRISE PERFORMANCE
The following main categories have been identified as key challenges that affect the performance of small scale construction
enterprises. These include (a) Financial challenges, (b) Manpower issues, (c)Supply of materials, equipment and machinery,
(d)Project delays, (e)Quality challenges, (f)Legal and Regulatory factors, (g) Strategic Planning matters. Based on your experience, I
am going to ask your views on these challenges. To what extent do you agree or disagree with the following statements on the critical
role the challenges play on the performance of your business? From question 3 to 9, please tick (√) in the appropriate box using the
scale below:
Strongly agree (1) Agree (2) Neutral (3) Disagree (4) Strongly disagree (5)
Statement 1 2 3 4 5
3 The following financial challenges have negative effects on the performance of small scale construction enterprises.
3.1 Lack of collateral and assets.
3.2 Late payments towards completed work by clients.

263
3.3 Poor cash flow management and budget control.
3.4 Tender pricing pressure from main contractors.
3.5 High consultancy costs and fees e.g. accountants and architects erode profits.
3.6 High registration and annual renewal fees.
3.7 Payment of performance guarantee
3.8 Payment problems experienced as a result of rework relating to faults (e.g. project
design errors, formwork errors, plumbing errors, mechanical and electrical works
faults).
4 The following manpower issues have negative effects on the performance of small scale construction enterprises.
4.1 Shortage of experienced and competent labour force.
4.2 High rate of labour disputes and strikes.
4.3 Cumbersome administrative tasks such as UIF, workmen’s compensation, skills
development levy etc.
4.4 Low labour productivity due to employee dissatisfaction and absenteeism.
4.5 The skills obtained from higher education and the skills required in the construction
industry do not match.
4.6 Poor labour supervision and workmanship.
4.7 Little capacity to deal with the complexities of modern projects.
4.8 Contractors, subcontractors, clients and consultants do not work together as a project
team.
5 The following problems relating to supply of materials, equipment and machinery have negative effects on the performance of small scale
construction enterprises.
5.1 Lack of technical knowhow on quantity surveying of construction material.
5.2 Regular shortages of materials on site.
5.3 Excessive waste of material during the application process (e.g. unnecessarily thick
plastering).
5.4 Non-conformance of material to specification.
5.5 Loss of material on site due to damage or theft.
5.6 Deterioration of materials due to inappropriate storage.
6 The following problems relating to project implementation have negative effects on the performance of small scale construction
enterprises.

264
6.1 Poor planning techniques and failure to identify critical activities.
6.2 Lack of project coordination among contractors, subcontractors, clients and consultants.
6.3 Unplanned increase in the scope of work from the client.
6.4 Unrealistic construction planned time by clients.
6.5 Failure to commence project on time due to main contractor delays
6.6 Omissions in the construction plans.
6.7 Time spent waiting for samples, materials approval, site inspection; approval of quality
control tests and results.
7 The following quality matters negatively affect the performance of small scale construction enterprises
7.1 Architectural drawings lack adequate technical information.
7.2 Inability to interpret construction tender plans.
7.3 Supervision of projects by unqualified project managers.
7.4 Failure to deliver projects on time to the satisfaction of the client.
7.5 Poor relationships between Small businesses and stakeholders.
7.6 Inability to produce works of an acceptable standard
7.7 Poor information flow and coordination between Small businesses and stakeholders.
8 The following legal and regulatory issues have negative effect on the performance of small scale construction enterprises
8.1 Compliance with health and safety regulations is a hindrance to small scale construction enterprises performance relative to:
8.1.1 High safety training costs.
8.1.2 High safety induction costs.
8.1.3 High costs on medical requirements.
8.1.4 High costs on personal protection requirements.
8.1.5 Expensive first aid requirements.
8.2 Cumbersome registration requirements and stringent government and private support
systems.
8.3 Government policies in the construction industry do not promote small scale
construction enterprises.
8.4 The grading system in the construction industry
9 The following statements relating to strategic planning have negative effect on the performance of small scale construction enterprises

265
9.1 Attention to long term vision
9.2 Lack of clear objectives
9.3 Weak management practices
9.4 Little attention is given to Strategic planning
9.5 Little attention is given to stakeholders’ interest
SECTION D
ORGANIZATIONAL PERFORMANCE INDICATORS
Now I am going to ask you about your organizational performance indicators for the past 3 years. Please feel free to answer as many
questions as you can to the best of your ability.
10. Please indicate the level of performance on the following statements by ticking the appropriate number below:
1. Poor 2. Good 3. Very good 4. Excellent
OVERALL BUSINESS PERFORMANCE INDICATORS 1 2 3 4
10.1 Compared to last year, how do you rate your current sales?
10.2 How do you rate your sales stability in the last three years?
10.3 How do you rate your profitability over the past 3 years?
10.4 How do you rate your sales growth in the last three years?
10.5 How do you compare your sales growth to your competitors
generally?
10.6 How do you rate owner satisfaction in terms of business
performance?
10.7 How do you rate owner satisfaction in terms of ability to keep to
price quoted?
10.8 How do you rate the market share growth of the construction
industry in the last three years?
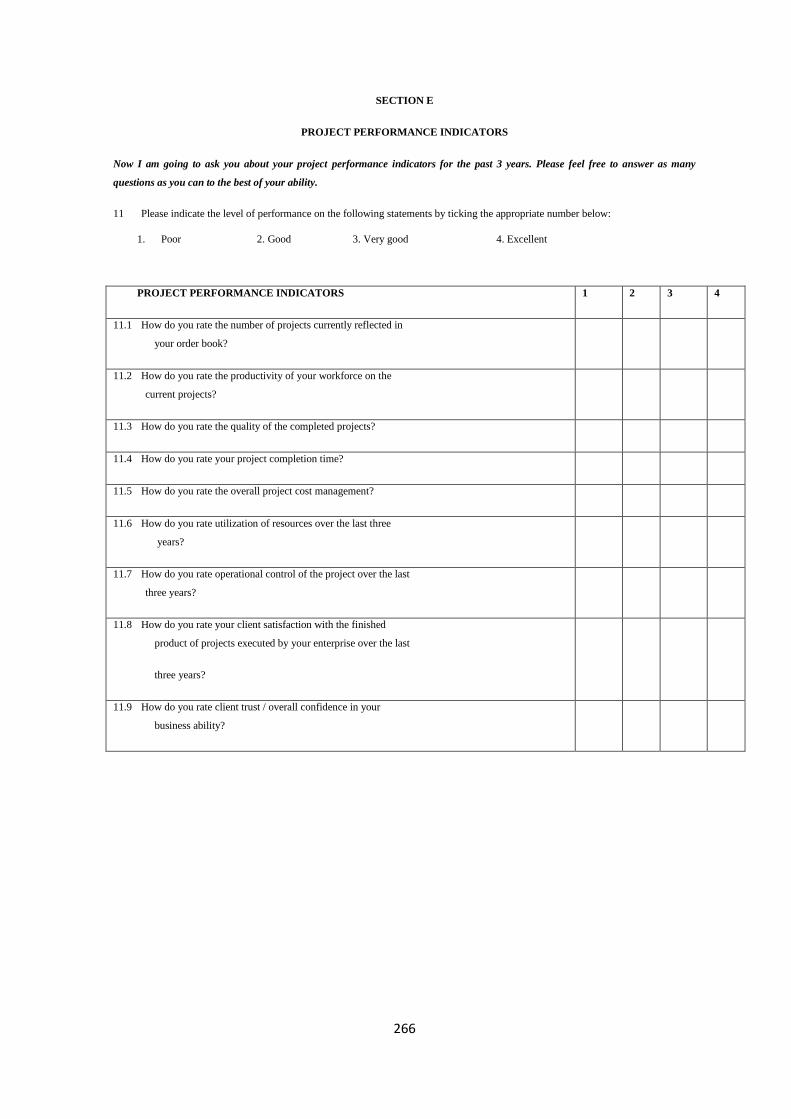
266
SECTION E
PROJECT PERFORMANCE INDICATORS
Now I am going to ask you about your project performance indicators for the past 3 years. Please feel free to answer as many
questions as you can to the best of your ability.
11 Please indicate the level of performance on the following statements by ticking the appropriate number below:
1. Poor 2. Good 3. Very good 4. Excellent
PROJECT PERFORMANCE INDICATORS 1 2 3 4
11.1 How do you rate the number of projects currently reflected in
your order book?
11.2 How do you rate the productivity of your workforce on the
current projects?
11.3 How do you rate the quality of the completed projects?
11.4 How do you rate your project completion time?
11.5 How do you rate the overall project cost management?
11.6 How do you rate utilization of resources over the last three
years?
11.7 How do you rate operational control of the project over the last
three years?
11.8 How do you rate your client satisfaction with the finished
product of projects executed by your enterprise over the last
three years?
11.9 How do you rate client trust / overall confidence in your
business ability?

267
SECTION F
PERFORMANCE IMPROVEMENT
12 Please rate the importance of the following performance factors in improving small construction enterprise performance
results. Please tick (√) in the appropriate box using the scale below:
Not important 1 2 moderately important 3 4 extremely important 5
PERFORMANCE FACTOR 1 2 3 4 5
12.1 Development and communication of strategic plans
12.2 Provision of upfront payment to small construction
enterprises
12.3 Development of management systems,
12.4 Total commitment from major clients, construction
industry board and government
12.5 Adherence to client needs
12.6 Improved Quality standards
12.7 Changing the culture around the process and the
team (designers, contractors and suppliers)
12.8 Commitment to training and development
12.9 Public and private sector need to consider and understand Small scale construction
enterprises as serious players
13. In the space provided below, please highlight other recommendations on what interventions may be needed to improve the
performance of Small Construction Enterprises:
………………………………………………………………………………………………………………………………………………
………………………………………………………………………………………………………………………………………………
………………………………………………………………………………………………………………………………………………
…………………………………………………………………………………………………………………
The End and Thank you very much for the time taken to answer this questionnaire.

268
Appendix D: Email requesting to use CIDB Database
From: George Hove [mailto:[email protected]]
Sent: 09 July 2013 08:11 AM
To: Rodney Milford
Cc: Segun Banjo
Subject: Request to conduct research on construction SMEs registered with CIDB
Dear Sir
I am a registered student at Unisa SBL studying for my Doctor of Business Leadership degree. My research
topic is “PERCEPTIONS OF SMALL BUSINESS EXECUTIVES ON DETERMINANTS OF
PERFORMANCE IN THE CONSTRUCTION INDUSTRY IN GAUTENG, SOUTH AFRICA”.
The aim of the study is to examine the determinants of construction SME performance registered with the
Construction Industry Development Board (CIDB) in SA. The research builds on the theoretical framework
presented and examines the variables identified in the literature. Primary data will be obtained by
administering a questionnaire and an instrument guide among a selection of Small Business Executives
(SBEs) in Gauteng. From the findings, performance enhancement frameworks would be developed. The
specific objectives of the research study are:
- To assess the critical incidents that have been encountered by SBEs in the construction industry and
their effect on business performance.
- To assess the perceptions of SBEs on determinants of business performance (Project and corporate)
in Gauteng Province of SA.
- To assess the relationship between ECs project performance and ECs organizational performance as
perceived by SBEs.
- To establish the relationship between the profiles of ECs’ and their performance in the industry.
- To characterize the perceived measures that could assist in promoting high performance among
ECs’.
By copy of this email, I kindly request for your permission to conduct my research, focusing on emerging
contractors registered with your organization.
I have attached my research proposal and Unisa letter of identification for your consideration.
Should you require any information regarding my research, please feel free to contact the writer or my
Supervisor (Prof. Banjo 0726298460).
Yours faithfully
George Hove (0823103567)

269
Appendix E: Approval letter to use CIDB Database
From: Rodney Milford [mailto:[email protected]]
Sent: 18 July 2013 05:40 PM
To: George Hove
Cc: Segun Banjo; Rodney Milford
Subject: RE: Request to conduct research at CIDB
Hi George
As requested, see attached contact details.
Please note:
The information is in fact available on the cidb website – and the cidb has merely provided you with a
download
Please treat the information as confidential and do not distribute to anyone else
Please only use the contacts provided as per your request for research information.
Regard
Rodney Milford
Construction Industry Development Board (cidb)
Programme Manager; Construction Industry Performance
Cell: +27 82 892 9353
Tel: +27 12 482 7238
Fax: +27 86 687 4936
Web: http://www.cidb.org.za
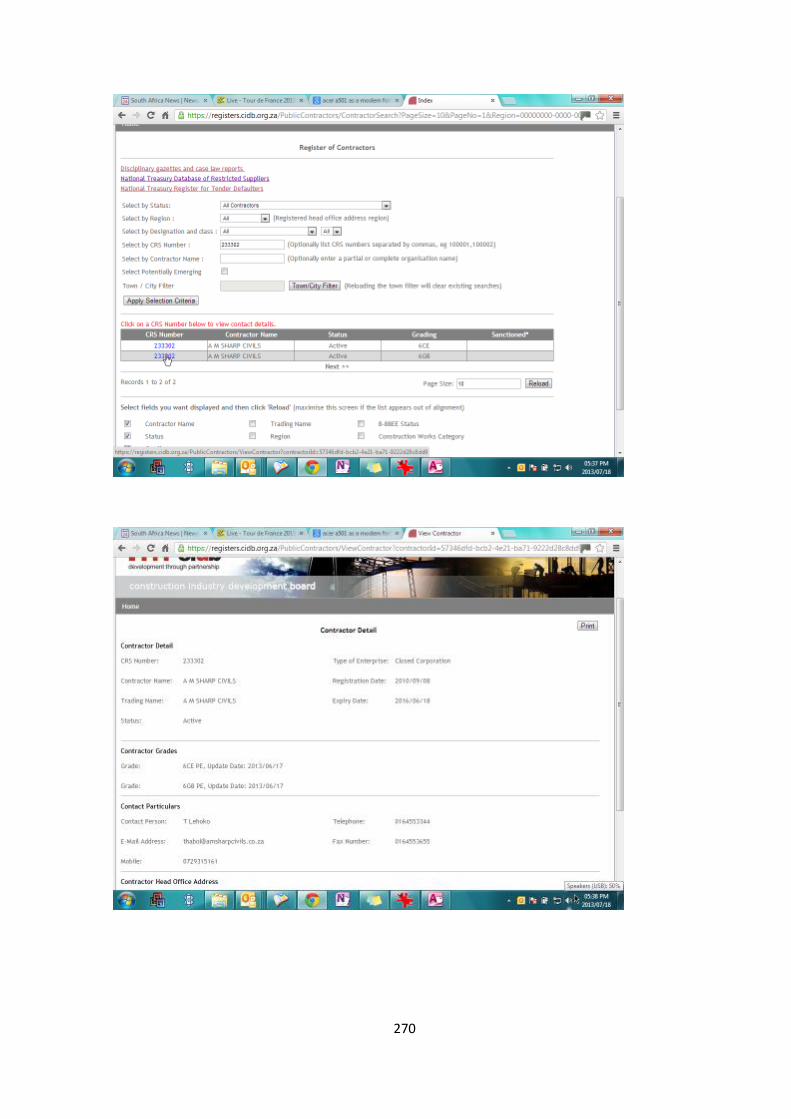
270

271
From: George Hove [mailto:[email protected]]
Sent: 02 October 2013 08:02 PM
To: Rodney Milford
Cc: Segun Banjo
Subject: FW: Request to conduct research on construction SMEs registered with CIDB
Dear Sir
Following a pilot study conducted recently using email strategy; the response rate was poor indicating that
the strategy is not effective. Based on that response, I have narrowed down my study to Gauteng Province
focusing on Grade 2 (GB and CE) contractors.
I tried CIDB Website to down load the contractor contact details but could not come right.
I will appreciate if you could help me to access the relevant information (telephone and physical addresses)
for the targeted contractors.
Thank you for your usual cooperation.
George Hove
0823103567

272
From: Rodney Milford [mailto:[email protected]]
Sent: 04 October 2013 10:39 AM
To: George Hove
Subject: RE: Request to conduct research on construction SMEs registered with CIDB
George – see attached data
As discussed, please note:
This information must not be distributed to any other party; use of this data must be restricted only for your
research purposes. Although this information is freely available and accessible on the cidb web, the
information must be treated as confidential
Regards
Rodney Milford
Programme Manager; Construction Industry Performance
SABS Campus, Blocks N and R,
2 Dr. Lategan Road, Groenkloof, Pretoria, South Africa
PO Box 2107, Brooklyn Square, 0075
Tel +27 12 482 7238
Fax +27 86 687 4936
Cell +27 82 892 9353
Anonymous Fraud Line 0800 11 24 32
E-mail [email protected]

273
Appendix F: Sample Size Determination
The sample size determination was based on the perception of small business executives in
the construction. Thus the sample size estimate was given by formulae adapted from
Donner, Birkett and Buck (1981) n = (Z)2(p(1-p)/(δ)
2
Where
Z = 1.96(corresponding to 5% significance level)
n = number of companies in the study
δ = the detectable difference or design effect.
P= Proportion of companies with positive perception towards business (assumed to
be 0.50 since we have no idea of perceptions in this population)
Using this information the sample size required is 385 companies. Since the contractors
would all not respond to the questionnaire, this necessitated adjustments for attrition rates.
We anticipate that 30% will not return the questionnaires. Adjusting for these gave a
required sample size of 501 contractors.

274
Appendix G: UNISA SBL Letter of identification
Graduate School of Leadership. University of South Africa. PO Box 392. Unisa. 0003. South Africa Cnr Janadel and Alexandra Avenue. Midrand. 1685.Tel: +27 11 652 0000.Fax: +27 11 652 0299
E-mail: [email protected] Website: www.sblunisa.ac.za
GRADUATE SCHOOL OF
BUSINESS LEADERSHIP
UNISA 26 June 2013 TO WHOM IT MAY CONCERN
This letter serves to confirm that Mr G Hove student number 71759956 is a
registered student with (Unisa) Graduate School of Business Leadership studying for
his Doctor of Business Leadership degree. The topic of his research is as follows:
"PERCEPTIONS OF SMALL BUSINESS EXECUTIVES ON DETERMINANTS OF
PERFORMANCE IN THE CONSTRUCTION INDUSTRY IN GAUTENG, SOUTH
AFRICA"
Mr Hove has fulfilled the initial requirement of the degree, however he is required
to collect his data from your organization in respect of the thesis. Please kindly assist
him with the necessary information he needs from your organization. All
information given to him will be treated with utmost confidentiality. For further enquiries please do not hesitate to contact the undersigned. Yours sincerely
Professor AA Okharedia
Academic Director
UNISA Graduate School of Business
Leadership Corner Janadel and
Alexandra Avenues, Midrand
1686
Tel: (011) 652 0255/0375

275
Appendix H: Sample Interview Guide
Contractor B’s interview script
DATE: 16 May 2013
TIME : 09H00
Legend: GH - Interviewer – George Hove
B – Interviewee – Contractor B
GH: Good morning Sir and thank you for accepting to participate in this survey. I am sure
you are aware of the purpose of this interview following the letter that I emailed you last
time.
B: Good morning, Okay. Yes.
GH: I have this table (Table given to Contractor B) and will appreciate if you could please
provide the information as indicated in the table.
B: Is it compulsory to provide you this information.
GH: No! no!, it isn’t but for my data analysis purpose, I suggest provide approximate
information only, you don’t have to give correct information if you are not comfortable.
B: Okay
Study area Responses received
Your Gender Male
Your Age Group About 61 years
What is your ethnic group? Black
Your disability status Non
Your highest formal qualification No matric
Your Profession / Area of Expertise Brick Laying and Plastering acquired

276
through experience
What is your functional role in the
business?
Chief Executive Officer
What is the Province where business is
located
Gauteng
How long has your business been
operating
2 years
What is your CIDB registration / Grading? Grade 2
What is the company size in terms of
manpower by professional skills
I have about 45 unskilled and 2 Skilled
What is your business profile? e.g. Black Owned (male)
What is the service provided by your
organisation (tick that apply)
General Building
Which construction projects are you
involved in? (Tick all that apply)
Government projects and
Private development
GH: Thank you for this information. Now, can you think of a recent time when, you as a
business executive encountered an incident/s in your business organization that has
facilitated the growth or shrinkage of your company and answer my questions:
GH: Definition of an Incident = A situation / experience that facilitated / encouraged or
discouraged your business performance.
B: Ok
GH: CAN YOU DESCRIBE THE INCIDENT?

277
B: In year 2011, I was sub-contracted by one big company that was building a hospital in
Brits based on my talking to the boss of the main contractor. My work involved
bricklaying and plastering. The hospital had 7 blocks and 4 floor levels on each block.
The terms and conditions of the contract were set in the contract that I signed. However, I
did not have the legal background to fully understand the terms and conditions of the
contract.
This was a big contract. I employed 2 foremen, 15 brick layers and 30 assistants. My
foremen were skilled and competent people from Mozambique and Zimbabwe. Most of
my bricklayers were form Mozambique and Zimbabwe. Some of the foremen had worked
at major projects such as the Gautrain and Stadiums in 2009 and 2010 and were well
experienced and skilled foremen.
The foreigners that worked for the contract had South African work permits valid for 5
years. These permits had been acquired when the South African government extended
work permits to foreigners who had technical skills.
My employees were oriented and inducted according to the main contractor’s policy and
regulations. To a certain extent, I complied with safety and health requirements of this site.
However, a substantial amount of money was spent preparing the safety file, buying
Personal Protective Equipment (PPE), taking employees for medical examinations,
transporting them, training safety representatives and buying first aid kit. Unfortunately, I
did not have a budget for some of these expenses as I was not well conversant about these
requirements when I got the contract.
I did not have systems in place for administrative tasks such as UIF, Workman’s
Compensation and Skills development levy. These systems would have helped me to
administer different levies on behalf of the MEIBC such as admin levy, sick fund levy,
provident fund levy, dispute levy, union membership levy, VAT and income tax and
company tax and dividend tax. My annually renewal membership of semi-compulsory
organizations such as CIDB were behind however, I tried to do my work legally.
Every day, there were many people at the gate looking for employment. Those
Subcontractors who needed general labour could recruit from the gate. I had enough

278
skilled and competent people that I had recruited for this contract and mostly I had worked
with them before.
To my surprise, after 2 weeks, the contracts manager told me to recruit 50% of local
people into my contract. The contracts manager did not want to listen to my excuse and
insisted that it was a requirement from the local councillor representing the community.
All sub-contractors were required to comply with this request. The councillor had
indicated that local people should benefit from any project generated from the area.
The implications of this requirement were that:
I was forced to employ people that I had no knowledge about their work
performance,
The people did not have any skills, they had no experience and their competency
was questionable,
This was a political challenge that I found myself facing,
Since I had no plan for this requirement, I had to incur extra costs of taking new
people through medical examination, buying PPE as required by law, induction and
training as per my contract.
I considered the cost implication of this requirement and the new relationship that I was
going to develop with the new employees, I deliberately ignored this requirement. After
all, it did not form part of my contract with the main contractor.
One day I found people demonstrating at the gate. They were demonstrating against sub-
contractors who had not recruited local people. I lost 2 days working days as my
employees could not enter the site. The contracts manager claimed that he had warned me
and other sub-contractors and there was nothing he could do.
I contacted their community leader officer (CLO) who happened to be the security guard at
the site. He did not want to talk to me. All he wanted was to know how many people from
the community I had employed. Ironically, the recruitment had to be done through him. He
knew very well that I had not complied.

279
I had no choice other than to drop some of my guys and employ local people. After a
week, the new employees refused to take instructions from my foremen who were
foreigners. My supervisors were from Mozambique and Zimbabwe. Most of the
bricklayers were also from these countries and had artisan building certificates. The
reporting structure became a challenge such that I had to be on site every day to see what
was going on; otherwise, I would have put the lives of foreign supervisors at risk
Local employees continued with their demands, refusal to take instructions from my
supervisors. The relationship among my employees deteriorated. Local employees accused
my supervisor of over working them; they claimed their wages were too low; they were
not given any benefits and all sorts of labour related claims. Eventually, these guys joined
a union. Union representatives visited the site one day. More demands were made.
Throughout the duration of the contract, labour related issues continued. Demonstration
and strikes eventually erupted that disrupted the programme. The main challenges that I
experienced with employees as a result included:
Employees coming to work late,
Absenteeism at work without proper approval,
Recurring sick leaves,
Travelling allowance, some contractors brought their employees to work and my
employees wanted the same benefit,
Leaving work earlier than required,
Refusal to work overtime when required,
Organised regular demands of wage increase,
Regular request for money for transport, and
Demonstrations and strikes had negative impact on my programme as well as the main
contractor. The main contractor did not intervene to find an amicable solution to this
problem.
One day, 4 of my employees were accused of being in possession of the main contractor’s
generator and an angle grinder. Even though there was enough evidence that the
280
employees had stolen these tools, to dismiss them from work was a problem as I had to go
through many labour relations procedures:
I had to do internal company procedure consisting of hearings and witnesses and a
finding report.
The employees appealed to the CCMA.
To attend hearings there, I had to lose many days’ work and if you are not on site,
no work could be carried as the employees did not want to take instructions from
the supervisors.
To my surprise, employees who could speak perfect English suddenly demanded
an interpreter. The case was postponed on several times because there was no
interpreter.
The interpreter was supposed to be independent but the process usually consisted
of a conversation between the two for some five minutes and the English
translation is usually no more than a sentence.
Eventually, the employees asked for a ridiculous sum of money as compensation.
Otherwise the case could have gone on and on. However, the commissioner told
me to make a reduced offer to speed things up.
GH: Which of the following areas were most affected by this incident and how were
they affected?
GH: FINANCIAL IMPACT
B: When I recruited local labour, I incurred financial cost that included payment of
these employees to go for medical examination. Some of them failed yet I had to pay the
service provider. Surely, the main contractor should have assisted in this regard by giving
me advance payment which I would have paid back in stages. The main contractor could
not assist.
I found myself in a very tight situation regarding unplanned costs which required
extra funding. I had to borrow money from non-financial sources because I did not
have the collateral and assets required by the banks. I did not have the borrowing
capacity that could be accepted by the banks. I found family and friends very
helpful in financing my contract activities.
281
When I made my monthly claims, there were challenges as the main contractor
could not release payment immediately as a result I had to wait for some days
before receipt of payment.
GH: MANPOWER
B: There were labour misunderstanding and unrest that I experienced at this project as a
result I lost many days of production due to labour related issues.
About 60 people streamed on site each day when the situation was normal.
However, during the violent strikes, work was halted for up to two weeks
I employed foreigners who had South African work permits because the country
did not have all the critical skills required, in my case, qualified bricklayers who
had the ability to read the drawings. I had to attract foreign skills that had been
regulated through government processes.
I employed local people because I was afraid to contribute to xenophobic violence
that had affected South Africa before. I thought of a statement from COSATU that
says “business ignoring labour and immigration laws in employing foreigners must
be reported” and I did not want my company to become the subject of discussion
in union circles.
The new employees made several demands that included provisions of a minimum
wage for all hourly paid employees, standardized pay rates within the company,
program that would facilitate training of local employees on site. The new labour
requirement on this site did not go well with me as a sub-contractor because I had
not budgeted for such demands. With this challenge, I said to myself the project
would not be delivered on time, on budget, safely and to the required quality
standards.
There were poor labour relationships that emerged and this did not set effective
partnership among stakeholders as there was no improved stability and
productivity on site. Employee unrests and remobilization became a daily problem
on site.
I did not want to put the lives of my supervisor at risk. As a result, I took the
responsibility to manage and supervise employees on site which should not be my
responsibility in most cases.

282
In order to improve relations on site, several meetings were held with the
employees and unions to try to resolve the stalemate on site.
There was an impression from workers on site that subcontractor management was
causing strikes as a result of poor labour management. The allegation was that
management were failing to manage their employees,
I introduced weekly meetings on-site between the employees and myself. The aim
of these meetings was to review progress and identify issues which each party
needed to resolve. Initiatives to resolve these issues were somehow agreed upon.
The new communication system improved to reduce bottlenecks between
employees and my supervisors.
Management and supervision of different sub-contractors at the site were affected
by this incident mainly because the employed local people were not competent
enough and caused much industrial unrest.
Even though I lost some of my good supervisors and foremen, I managed to retain
most of the team members who had shown dedication throughout.
GH: SUPPLY OF MATERIAL, EQUIPMENT AND MACHINERY
B: The material such as bricks and plaster sand were supplied by the main contractor.
However, as the sub-contractor responsible for this material, it was my responsibility to
ensure appropriate usage of the material. On several occasions, the main contractor
complained of thick plastering and this created serious shortage of cement and plaster sand
on site. One day, the main contractor visited my work area and saw mortar that had been
left unfinished by my employees the previous day. I was accused of this and was given me
a claim for wasting material on site.
There were cases of stolen bags of cement on site. However, I challenged the main
contractor that he must use professional security that would be able to secure the
site. Any form of pilferage on site was not my responsibility because the security
was provided by the main contractor.
The employees were reckless in the usage of material. Some cement bags were
opened were left half full. The cement lost its conformance after sometime. The
main contract charged me for the wastage.
283
Whenever industrial action took place, this resulted in damage to vehicles and
equipment, bricks, reinforcing steel, cement window and door frames being looted.
More than 10 employees were injured in the process.
GH: PROJECT IMPLEMENTATION
B: As a result of labour issues, I experienced several stoppages which were recorded on
site and these included:
Demonstrations and strikes on site which lead to more than a week’s work
stoppage. Labour unions caused many disruptions which delayed the project. The
management of labour relations was very poor on this site because employee
representatives had many demands that affected planning.
Absenteeism was recorded almost every day and this slowdown the programme,
When attending labour issues at CCMA, the productivity of employees got reduced
and this affected the programme.
The main contractor though he knew what was happening, and see the labour issue
as a major element in the problem. He wondered what fines and penalties could be
extended to the sub-contractors for the delays caused.
Even though, the main contractor did not claim against some of the sub-contractors
for the delay, the delay caused project costs to go up though I do not have the
figures of what the main contractor incurred. This also increased the owner’s
(Government) development costs to go up. However, organized labour activities at
the site were the main causes of delay in this project.
Salary and wage issues were never resolved as employees kept on demanding more
increase in wages.
Effectively, the project was almost 4 months behind schedule and community
demanded that the hospital should be completed soon.
Productivity on this site was poor and this was a result of the shortage of skills,
that’s why I had resorted to the employment of foreigners.
284
GH: QUALITY
B: My controls and systems were disrupted when I was forced to employ local
employees who did not have the skills and knowledge about construction.
In as much as I tried to control quality, there were many defects that emerged as a
result of the short corners that were taken by employees. I find out that working
with people that you do not know creates problem. I am being blamed as a small
contractor yet the damage was done through the employment on community
employees. Anyhow, some defects I fixed while some were not easy to fix.
Engineers noticed some defects which were attributed to the use of non-load
bearing bricks instead of load bearing bricks specified on the construction drawing.
I took full responsibility for the poor quality of the product. I communicated this
issue to the main contractor and we agreed to work together to fix most of the
defects.
GH: LEGAL AND REGULATORY
B: There were many issues at this site that I resolved at CCMA level. This was the
only way I could resolve a number of disputes between unions and employees.
It was easy for the authorities to demand employment for local employees. What
they missed was the appropriate communication where the issue should have been
articulated and stipulated in the tender document. There were implications as a
result of this incident, for example the safety and health compliance was
compromised. This incident had a negative effect on the profitability of my
business.
GH: STRATEGIC PLANNING
B: I never expected to face such a challenge on a construction site. In most cases,
when I get a contract, I leave my competent and skilled employees to do the job and all I
do is to make sure my targets are met. I always give my employees set forecasts which
they work to achieve.
285
In this incident, my plans were affected because I was forced to employee people
who lacked knowledge, people who had no skills of the industry; they could not
read the drawing and had to be taught on almost everything.
I was so committed to deliver the project on time as per programme. When I
tendered for the job that’s when I put my resource together to ensure my capacity
was sufficient for the job. That capacity building was somehow affected by the
circumstances that emerged on the site.
I spent most of my time on this project as a result I did not have much time to look
for other jobs. When we finished this job my order book had very reduced orders. It
clearly shows that I never had sufficient time to focus on the future of my business.
GH: What positive outcomes did you experience as a result of this incident?
B: The day I completed the project, I was excited that I had shown determination and
resilience in the challenges that I encountered. In future, I know how to deal with South
African labour issues.
Payment of employee’s competitive wages must always be the norm within every
company.
GH: What negative outcomes did you experience as a result of this incident?
B: I felt bad on this site with my ability to supervise and manage the labour issues. It
was extremely poor because there was no control of employees.
I faced many challenges and setbacks at this site as a result of labour unrest. The
labour problem was difficult to resolve and became a daily activity. What worried
me was that on a number of times labour would become violent.
The strikes and demonstrations that emerged from this incident appeared in most of
the media circles. As a result the perception created to potential investors about
labour relations in South Africa was critical to me. This need to be carefully
managed at all times. From a Small business perspective, most of my colleagues
are willing to make things work in a new space in other stakeholders show interest
thereof. The violent activities at this site were completely unacceptable.
GH: How did this incident affect your overall business performance?

286
B: My cost benefit analysis was affected. I had to incur extra health and safety
expenses that I incurred and this squeezed my profitability. I did not plan to recruit
employees that I would take for medical examination, training and procurement of PPE.
I lost many productive days attending to labour issues. There were many stoppages
on site as a result of misunderstandings among employees which I had to attend to.
The demonstrations and strikes lasted for almost two weeks. There was heavy cost
that eroded my profitability.
Many tools were vandalised and stolen and I had to replace them at a cost.
As a result of poor control over staff on site, this had serious effect on the quality
of work that I produced. My quality control systems were affected due to the
employment of local employees resulting in remedial work being done. This also
strained the financial resources of my company. This had a detrimental effect on
my business with low profit margins covering high costs.
GH: From managerial perspectives, what lessons did you learn from this incident?
B: As a result of this incident, I put management controls mechanisms in place that
included employment of labour experts in my company, up to date records where
the details of employees are recorded, sticking to labour laws.
Main contractor took responsibility of labour issues on site by employing CLO.
The relationship between employees and sub-contractors was poor and had a
significant effect on the main contractor’s performance. Unions were targeting sub-
contractors and made demands from us sub-contractors. It is important for the main
contractor to step in and seek to rebuild the relationship among all parties. I noticed
on this site that some of us (sub-contractors) had no enough capacity to manage
their employees. They really need back-up and this can only come from the CLO
main contractor.
It is important for the main contractor to ensure that all societal concerns have been
included in the contract so that as subcontractors you are aware of these issues.
As the business executive, I spent most of my time on this site in order to make
sure that things were running smoothly and to unlock all bottlenecks.

287
I condemned the violent nature of the strikes and demonstrations as this affect my
business. However, the problem is what can be done to avoid similar incidents in
future.
There are no skills required in the industry. In as much as I liked to employ local
people, I found them without the technical skills required in construction industry.
From management point of view, it would be ideal if the government invest money
within companies to train local people so that the pool of artisans could be
improved. Technical colleges could be set where the technicians can further their
skills.
GH: How could the incident be handled differently?
B: Surely, no one is against employment of local labour. What should have happened
from the beginning was to include the close in the tender document. This would have
allowed sub-contractors to plan accordingly. Local labour could have been employed from
the beginning. There was lack of communication and understanding as to the handling of
local community. An impression was created that sub-contractors do not want to employ
local people and this created bad impression.
All the skill and foreign qualified employees should not have been targeted as they
assisted to train and party skills to local people.
GH: The End, Thank you very much for the time taken to answer this interview
guide.