geophysical and hydrogeologic investigation of groundwater
TRANSCRIPT

LUND UNIVERSITY
PO Box 117221 00 Lund+46 46-222 00 00
Geophysical and hydrogeologic investigation of groundwater in the Karoostratigraphic sequence at Sawmills in northern Matabeleland, Zimbabwe: a casehistory
Danielsen, Jens E.; Dahlin, Torleif; Owen, Richard; Mangeya, Pride; Auken, Esben
Published in:Hydrogeology Journal
DOI:10.1007/s10040-007-0191-z
2007
Link to publication
Citation for published version (APA):Danielsen, J. E., Dahlin, T., Owen, R., Mangeya, P., & Auken, E. (2007). Geophysical and hydrogeologicinvestigation of groundwater in the Karoo stratigraphic sequence at Sawmills in northern Matabeleland,Zimbabwe: a case history. Hydrogeology Journal, 15(5), 945-960. https://doi.org/10.1007/s10040-007-0191-z
Total number of authors:5
General rightsUnless other specific re-use rights are stated the following general rights apply:Copyright and moral rights for the publications made accessible in the public portal are retained by the authorsand/or other copyright owners and it is a condition of accessing publications that users recognise and abide by thelegal requirements associated with these rights. • Users may download and print one copy of any publication from the public portal for the purpose of private studyor research. • You may not further distribute the material or use it for any profit-making activity or commercial gain • You may freely distribute the URL identifying the publication in the public portal
Read more about Creative commons licenses: https://creativecommons.org/licenses/Take down policyIf you believe that this document breaches copyright please contact us providing details, and we will removeaccess to the work immediately and investigate your claim.

Geophysical and hydrogeologic investigation of groundwaterin the Karoo stratigraphic sequence at Sawmills in northernMatabeleland, Zimbabwe: a case historyJens E. Danielsen & Torleif Dahlin & Richard Owen &
Pride Mangeya & Esben Auken
Abstract Geophysical and hydrogeological investigationshave been carried out around Sawmills in Zimbabwe,Africa. The investigations are components of a largerinvestigation to assess the groundwater potential of theKaroo sedimentary basin with regards to supplying waterto Bulawayo City. The Sawmills area was selected due tothe availability of borehole logs indicating favourablestratigraphy for groundwater availability and due to thehigh yields from the aquifers measured from theseboreholes. Data collected using two geophysical methodsare presented here: transient electromagnetic (TEM) andcontinuous vertical electrical sounding (CVES) data. Thedata have also been processed using laterally constrainedinversion (LCI). Because the CVES provides greater detailin the shallow subsurface, whereas TEM is more effectiveat depth, a more accurate image of the entire subsurfaceprofile is provided based on using both methods. Theresults suggest that LCI of CVES and TEM data, in thesubsurface at the required depths at Sawmills, is able toprovide a substantially more accurate image of thesubsurface than either method alone. The hydrogeologicalinterpretation of the geophysical data is valuable fordetermining the depth to and thickness of the potentialaquifer horizon(s) and for identifying the position ofpotential recharge zones.
Résumé Des investigations géophysiques et hydrogéolo-giques ont été menées aux alentours de Sawmills auZimbabwe en Afrique. Celles-ci font partie d’une cam-pagne d’investigation plus large concernant le bassinsédimentaire du Karoo, dans le cadre d’une évaluationdu potentiel des eaux souterraines de cette région afind’alimenter en eau la ville de Bulawayo. La zone deSawmills a été sélectionnée à cause des logs de foragesqui présentaient une stratigraphie favorable à la présenced’eau et des débits important mesurés lors de pompagesdans ces puits. Les deux méthodes géophysiques ayantpermis de collecter des données sont: la prospectionélectromagnétique en transitoire (TEM en anglais) et laprospection électrique verticale en continu (CVES enanglais). Les données ont également été traitées suivantl’inversion en contraintes latérales (LCI en anglais). Laméthode CVES fournit plus de détails en subsurfacetandis que la méthode TEM est plus efficace enprofondeur; ainsi, l’utilisation combinée des deux méth-odes permet une image plus précise sur tout le profilsouterrain. Les résultats suggèrent que faire une LCI desdonnées CVES et TEM, des surfaces souterraines auxprofondeurs requises dans la zone de Sawmills, permetd’obtenir une image considérablement plus précise de ceszones souterraines que l’utilisation d’une de ces méthodesseule. L’interprétation hydrogéologique des données géo-physiques est utile pour déterminer la profondeur etl’épaisseur du ou des horizons aquifères potentiels et pouridentifier la position des zones de recharge potentielles.
Resumen En los alrededores de Sawmills en Zimbabwe,Africa, se han llevado a cabo investigaciones geofísicas ehidrogeológicas. Estas investigaciones forman parte deuna investigación más amplia sobre la Cuenca Sedimen-taria de Karoo, para estudiar el potencial de aguassubterráneas de esta zona con vistas al suministro de aguaa Bulawayo City. El área de Sawmills fue seleccionadadebido a la disponibilidad de registros de sondeos queindicaban una estratigrafía favorable para la existencia deaguas subterráneas y a las altas productividades de losacuíferos medidos en estos sondeos. Se presenta aquí latoma de datos usando dos métodos geofísicos: SistemaElectromagnético Transitorio (TEM) y Sondeos EléctricosVerticales Continuos (CVES). Los datos han sido proc-esados mediante Inversión lateralmente constreñida (LCI).Debido a que CVES proporciona un mayor detalle en el
Received: 14 December 2004 /Accepted: 20 April 2007Published online: 27 June 2007
© Springer-Verlag 2007
J. E. Danielsen ())Huldervegen 11C, 7056, Ranheim, Norwaye-mail: [email protected].: +47-40-040301
T. DahlinEngineering Geology, Lund University,Box 118, S-221 00 Lund, Sweden
R. Owen : P. MangeyaDepartment of Geology, University of Zimbabwe,Mount Pleasant, Harare, Zimbabwe
E. AukenDepartment of Earth Sciences,University of Aarhus,Høegh-Gulbergs gade 2, DK-8000 Århus C, Denmark
Hydrogeology Journal (2007) 15: 945–960 DOI 10.1007/s10040-007-0191-z

subsuelo poco profundo mientras que TEM es másefectivo en profundidad, se obtiene una imagen másprecisa del total del subsuelo basada en el uso de los dosmétodos. Los resultados sugieren que LCI de los datos deCVES y TEM es capaz de proporcionar una imagen másprecisa del subsuelo en las profundidades necesarias enSawmills que el uso de cada método por separado. Lainterpretación hidrogeológica de los datos geofísicos esvaliosa para determinar la profundidad y el espesor de loshorizontes acuíferos potenciales y para identificar laposición de las potenciales zonas de recarga.
Keywords Groundwater exploration .Geophysical methods . Karoo aquifers .Joint inversion . Zimbabwe
Introduction
Zimbabwe is a landlocked country in the south-central partof Africa. Zimbabwe covers an area of 390,000 km2 and isbordered by South Africa, Botswana, Zambia, and Mozam-bique. The average annual rainfall is 675 mm, whereas theaverage annual potential evaporation is around 1,800 mm.The southern and western parts of the country areconsiderably drier than the northern and eastern parts, andlarge areas of Zimbabwe are considered to be semi-aridwhere water is sparse. Rain falls in a unimodal rainy seasonextending from November to March. In addition to thelimited amount of rainfall, annual rainfall variability is highand characterized by mid-season droughts.
During the 1991–1992 wet season, the most severedrought “in living memory” resulted throughout thecountry. In the most affected areas, 45% of the primarywater resources became dry and water quality degradedappreciably (Ohlsson 1995). From an economic basis,agricultural production was reduced by 40% during thedrought period; 600,000 cattle were put down or diedfrom starvation, and the gross national product decreasedby 12% from the previous year (Nilsson and Hammer1996).
The drought defined the fragility of the water supplythroughout Zimbabwe, especially for densely populatedurban centres such as Bulawayo (Fig. 1), the capital cityof the Matabeleland provinces. Stringent water rationingwas introduced in Bulawayo but this rationing was insuf-ficient to alleviate drought conditions. In order to provide asupplementary water supply for the estimated 1,000,000Bulawayo city residents, an emergency well field wasestablished during the height of the drought, when thesurface-water resources for Bulawayo had almost entirelydried up. The well field consists of approximately 60 deepboreholes drilled into the “Nyamandhlovu aquifer” aroundthe small farming town of Nyamandhlovu, approximately45 km northwest of the city. Artesian groundwater has beenknown for many years to be present in this area. Thisgroundwater source was developed for irrigation in the1960s.
The established capacity of the emergency well field is27,000 m3/day. This capacity represents about 20% ofBulawayo’s daily water demand (SWECO 1996), but thisresource has only been pumped during water-criticalperiods and is not part of Bulawayo’s regular daily watersupply. Anecdotal reports from farmers utilizing irrigationin the Nyamandhlovu area indicate declining groundwaterlevels and increasing water salinity during periods whenthe well field is operating. The well field is operated bythe Bulawayo City Council only during water-criticalperiods.
In an attempt to find a long-term solution to the water-supply problems in Bulawayo, the Swedish InternationalDevelopment Agency (SIDA) and the Government ofZimbabwe, represented by the Ministry of Local Govern-ment, financed an analysis of the established water supply,as well as the development of a water-resource plan tocover the next 25 years (SWECO 1996). The key focus ofthis plan was an investigation into the feasibility ofconstructing and maintaining a pipeline from Bulawayoto the Zambezi River. This pipeline has been sought formany years by the residents of Bulawayo. The pipelinewould be 330 km long to the planned Gwayi-ShanganiDam and then to the Zambezi River; an alternate pipelineroute would be 400 km long directly to the ZambeziRiver.
The SWECO study recommended a full investigationinto the feasibility of the possible incremental exploitationof groundwater resources along the planned pipelineroute. Earlier investigations of the sedimentary basin tothe northwest of Bulawayo had shown the possiblepresence of groundwater sources (Bond and MacDonald1962; Dennis and Hineson 1964; MacDonald 1970;Beasley 1987). Because of the controversy surroundingthe use of the Nyamandhlovu well field by Bulawayo, itwas decided to focus the investigations further to thenorthwest and avoid the problems of overpumping ofgroundwater from the Nyamandhlovu well field. TheSWECO study confirmed that substantial groundwaterpotential is present along the pipeline route and the initialoption of utilizing groundwater was expected to beconsiderably less expensive than the option of construct-ing and maintaining a pipeline, particularly concerning theinitial capital outlays (SWECO 1995; Mkandla 2003).
In order to further investigate the groundwater re-source, research funding was made available to carry out alimited geophysical/hydrogeological study to investigatethe nature, extent, and potential of utilizing groundwaterin the sedimentary basin for supply to the city ofBulawayo. For practical reasons, the groundwater sourcesclosest to the city of Bulawayo, excluding Nyamandhlovu,were to be investigated first.
The overall aims of the full geophysical study were asfollows:
– To create preliminary hydrogeological/geophysicalexpectation models for these pre-selected areas
– To use a variety of geophysical techniques to generatedata that could provide answers to the key hydro-
946
Hydrogeology Journal (2007) 15: 945–960 DOI 10.1007/s10040-007-0191-z

geological questions developed for each of the targetsites
– To establish the depth to, thickness and sequence ofgeological units at each of these sites
– To identify exploration drilling targets that can be usedto calibrate the geophysical data
– To integrate all the data and use the data to upgrade andre-interpret the hydrogeological expectation model
– To identify a limited number of high potentialgroundwater target areas based on available ground-water information, drilling data, and previous studies
The purpose of this report is to present the results ofthe survey at the Sawmills site. Specifically, the detailedgeophysical results will be interpreted with regards to theavailable data from the surface geological map and thesubsurface geological data obtained from borehole logs atthe Sawmills site. This interpretation can then be usedelsewhere to provide a control on the geological interpre-tation of other geophysical data obtained during thegeophysical study.
Geophysical surveying was carried out using severaldifferent methods including direct current (DC) continu-ous vertical electrical sounding (CVES), transient electro-magnetics (TEM), slingram, magnetics, gravity, andseismic refraction and reflection. Different geophysicalmethods were used in different areas extending along therailway line, including Nyamandhlovu, Igusi, Sawmills,Gwaai, Ngamo, and Intundlha (Fig. 1), depending on thelocal geology and on the type of information required.This report presents parts of the CVES and TEM resultsfrom this work from the area around the railway siding atSawmills. The preliminary SIDA groundwater study(SWECO 1995) identified the village of Sawmills as anarea with potential groundwater resources based onaquifer-test data obtained from two deep productionboreholes (G3/378-331 m and G3/463-413 m) and one
observation well (O3/117-284 m) drilled in the 1960s bythe National Railways of Zimbabwe.
During 1997–1999, geophysical measurements wereperformed to map the subsurface around Sawmills and torelate the data to the lithologies obtained from the deep drillholes, and, thereby, to gain information about the extent,depth, and thickness of the potential aquifers in the area. Thegeophysical methods used were primarily the CVES and theTEM methods. In total, 31 km of CVES profiling and 309TEM soundings were completed over two field seasons.
Area description
GeologyThe study area is in northwestern Zimbabwe, extendingfrom Bulawayo in the south to Victoria Falls in the north.A map is shown in Fig. 1. In the southern part of the area,granite and greenstone belt crystalline basement rocksoutcrop. To the northwest, overlying the basement, anextensional sedimentary basin has been developed byrifting along the Zambezi Valley. This basin has beenfilled by a thick sedimentary sequence, known as theKaroo Supergroup. The Karoo Supergroup hosts thevarious sandstone horizons that are the potential aquifersdiscussed in this report. Overlying the Karoo Supergroupis the Kalahari Group, a sequence of unconsolidatedaeolian and fluvial sands and silts.
In Zimbabwe, the Karoo Supergroup is depositeddirectly on the pre-existing crystalline basement, andconsists of two main groups, the Lower and the UpperKaroo Groups, separated by an angular unconformity.Initial deposition commenced into a developing tectonicbasin in the late Permian Period with the deposition ofglacial sediments such as varved clays and glacial tills inthe Lower Karoo Group. These glacial deposits aresucceeded by a number of pulses of fining-upwardsterrestrial-clastic sediments, ranging in composition fromcoarse grits and sandstones to coal measures and mud-stones. By the late Triassic Period, due to plate movement,the local climate had become warmer and more arid, andthe resulting Upper Karoo Group sediments are dominatedby terrigenous and aeolian sandstones.
The Karoo sedimentary basin in this area is known asthe mid-Zambezi Basin. The basin is a half graben, with themajor fault margin boundary located to the north along theZambezi Valley, whereas the southern boundary is a gentlelobate margin overstepping onto the basement. At itsmaximum, the Karoo Supergroup reaches a thickness of4 km near the northern margin of the middle Zambezi basin(Orpen et al. 1989), but because Sawmills is located closeto the southern margin of this sedimentary basin, thethickness of the sediments here does not exceed 400 m inthe study area. Karoo Era terrestrial sedimentary deposi-tion was terminated by onset of rifting and the separationof Africa and South America that initiated the widespreaderuption of flood basalts in the Lower Jurassic Period(Bond and MacDonald 1962). A sketch of the Karoosedimentary basin is shown in Fig. 2.
Bulawayo
Victoria Falls
ZambeziRive
r
BOTSWANA
ZAMBIA
MatabelelandNorth
Shangani River
Gwaai River
Gwaai-Shangani damsite
Khame RiverNyamandhlovu
Igusi
Sawmills(Study area, Figure 3)
GwaaiNgamo
Intundlha
N
Umguza RiverS e d im
e n tar y
B a s in
Railway line
Road
100 km0 50
Fig. 1 The western part of Zimbabwe. The study presented herefocuses on the Sawmills area
947
Hydrogeology Journal (2007) 15: 945–960 DOI 10.1007/s10040-007-0191-z

The Karoo Supergroup is overlain by the KalahariGroup, consisting of unconsolidated, structureless aeoliansands with subordinate fluvial sediments occupying44,000 km2 in western Zimbabwe. The Kalahari Groupis considered to extend from the Tertiary Period to thepresent (Stagman 1978). Because of their lack ofconsolidation, the sands have been remobilized andredeposited various times, and in some localities theyhave been found overlying gravel carrying artifacts fromStone Age cultures. These deposits are regarded as part ofthe Kalahari Group based on their similarity to otherdeposits that fill a depression extending from about 1°N tomore than 20°S. The deposits found in western partZimbabwe mostly belong to the main phase of theKalahari Group that occurred in the Tertiary Period(Stagman 1978).
The regional geology for the Sawmills area ispresented in Fig. 3. The Umguza River drains towardsthe northwest, and this has exposed Karoo basalt in thefloor of the river valley. Karoo sandstones are alsoexposed in the valley floor towards the northwest wherethey have been faulted up by a northeastern trending fault.Other smaller northeastern trending faults are mapped inthe exposed basalt. A small outcrop of pepperite isexposed on the southern side of the valley.
The valley flanks are mantled with unconsolidatedKalahari Sand, and the contact between the basalt and theKalahari Sand, particularly in the north, is marked by anextensive outcrop of ferricrete. To the south, the ferricreteis much less prominent. The exposure pattern of theferricrete at the Kalahari Sand/ basalt contact suggests thatthe groundwater drainage in the Kalahari Sand has been
towards the south. Where groundwater has seeped out ofthe Kalahari Sand and evaporated ferricrete has beenprecipitated, thus, producing the large ferricrete bodynorth of the river.
HydrogeologyThis report considers the groundwater resources locatedspecifically in the Karoo Supergroup found at Sawmills.The Karoo stratigraphy in Zimbabwe has been discussedin detail by Barber (2003), and although there arevariations both within individual Karoo basins and alsobetween different Karoo basins, there are a number ofunits that may be considered as potential aquifers.
From the base upwards, these aquifer units are listedbelow:
1. Lower and Upper Wankie Sandstones. These units areat the base of the Lower Karoo Group immediatelyabove the glacial sediments and are widely distributedthroughout all the Karoo basins in Zimbabwe. Theseunits are usually highly productive aquifers.
2. The Escarpment Grit. This normally very thin unit is atthe base of the Upper Karoo Group, and where present,this unit constitutes a productive aquifer.
3. The Forest Sandstone. The climate became drier duringthe deposition of the Upper Karoo Group, resulting inwidespread aeolian conditions. The Forest Sandstone isthe uppermost sedimentary unit in the Karoo Super-group and it consists of fine-grained aeolian sandstonesand silts interbedded with fluvial sediments. The ForestSandstone is considered to be an important regionalaquifer of moderate permeability (e.g. Beasley 1987),and it has been significantly developed for irrigationaround the town of Nyamandhlovu since the 1960s.Artesian and sub-artesian streamflow has been recordedin the Umgusa and Khame Rivers in this area since theearly 1900s and the Forest Sandstone has been referredto locally as the Nyamandhlovu aquifer. However, atSawmills, this aquifer appears to be a minor contributorto borehole yield.
At Sawmills, the Karoo Basalt and the Upper KarooGroup Sandstone (Forest Sandstone) are exposed in theriver valley. Borehole logs indicate that the Lower KarooGroup strata are also present at depth. The geologicalsurface mapping and SPOT image analysis have identifieda number of NE–SW trending fault zones that intersectand displace the Karoo strata (see Fig. 3). In addition totheir effect on the deposition of the Karoo strata, thesefault zones are also likely to be sites of enhancedsecondary permeability.
It is important to note that the Karoo Supergroupcovers large parts of southern Africa. The main Karoobasin in South Africa extends over 400,000 km2, and asecond major Karoo basin of similar size extends fromsouth-central Namibia, through central Botswana, acrossnorthern Zimbabwe and into north-central Mozambique.The extensive sandstone units present in both the Upper
Gwaai Sawmills Nyamandhlovu Bulawayo
NWSE
m.a.s.l
700
800
900
1000
1100
1200
1300
km 120 100 80 60 40 20 0
Lower Karoo sandstones and mudstones
~~ ~
~~~
~~ ~~~
Kalahari Sand~~~~~~~
v v v v v vv
v v
v
Basaltvvv tvv tvvv
¨¨v
¨¨¨¨̈¨ ¨¨¨¨ ¨¨̈̈¨¨̈̈
¨¨̈¨¨¨̈̈ ¨¨ ¨¨¨¨
¨̈
x
xx
x
xx
x
xx
xx
xxx x
x
x
x x
x
x
x
x
xx
x
x
x
x
x
Basement complexxx xxVertical scale greatly exaggerated
Upper Karoo sandstones and mudstones
Legend
Fig. 2 The cross section of the Karoo sedimentary basin asinterpolated from borehole data (after Bond and MacDonald 1962).The drill hole shown in Fig. 4 penetrates the Karoo Supergroup atSawmills
948
Hydrogeology Journal (2007) 15: 945–960 DOI 10.1007/s10040-007-0191-z

and Lower Karoo Groups are potentially importantregional aquifers that have been widely exploited partic-ularly in Botswana and South Africa. The Water ResearchCommission of South Africa (WRC) has identified theKaroo Supergroup as an important groundwater resourceand has recommended further research into the potentialfor aquifer development. Furthermore, the Karoo Sand-stone constitutes a major regional aquifer in Brazil. Hence,it is envisioned that the results presented here also may beapplicable to areas outside of Zimbabwe.
The Sawmills boreholesThe small hamlet of Sawmills lies in the Umguza RiverValley approximately 85 km northwest of the provincialcapital Bulawayo. Three boreholes, two production wells,and one observation well were drilled at Sawmills in thelate 1960s in order to find a water supply for the coal-firedsteam trains on this railway route. Groundwater underartesian pressure was encountered in these boreholes.
A composite lithological/geophysical/hydrologeologi-cal log of the deepest borehole (G3/463-413 m) drilled atSawmills shows that there is a complete sequence ofLower and Upper Karoo Group strata at this site,extending from the crystalline basement through to theoverlying Batoka Basalts (Fig. 4). The lithologic sequencein this borehole is almost identical to the lithologicsequence in the borehole for the other production well(G3/378-331 m), which is less than 1 km away.
The hydrologic log, based on a 28-hour aquifer testperformed by MacDonald (1970) shows that the firstsubartesian water was encountered in the sandstones ofthe Upper Karoo Group, and artesian water was encoun-tered at the contact between the Upper and Lower KarooGroups at an elevation of 850 m. Additional artesianinflow zones were encountered in the Lower Karoo Groupdown to an elevation of 760 m. MacDonald (1970)describes six major inflow zones in the borehole, wherethe lowermost zones had the largest flows. MacDonald(1970) gives no direct indication of the water flow directly
Fig. 3 Field and regionalgeology map of the Sawmillsarea, also showing the tran-sient electromagnetic (TEM)grid outline and CVES sound-ing profiles (lines 2 and 5).The tick marks delineate 1 km
949
Hydrogeology Journal (2007) 15: 945–960 DOI 10.1007/s10040-007-0191-z

from the Wankie Sandstone below 740 m at the base ofthe sedimentary pile. However, this borehole yielded50 m3/h during the pumping test and the borehole logshows discharges through the casing of approximately22 m3/h. The balance of 28 m3/h must, therefore, havecome from the underlying Wankie Sandstone. In 1995,SWECO, carried out a step drawdown test in the deepborehole at G3/463 using Atlas Copco Well Monitorsoftware and established a 5-year pumping discharge rateof 80 m3/h, or 52 m3/h with a calculated safety factordesigned to reduce the possibility of over-exploitation ofthe aquifer (SWECO 1995). The average calculated
transmissivity for all the pumping steps was 11 m2/dayand the specific capacity was 0.729 m3/h/m of drawdown.
The lithologic log for G3/463 indicates that the LowerKaroo Group consists of the coarse Wankie Sandstoneunits at the base, grading upwards into coal, shales andmudstones. The Upper Karoo Group is described byMacDonald (1970) as sandstone with some clay bands,and by Bond and MacDonald (1962) as interbeddedsandstone and mudstone. The Karoo Basalt cap the KarooSupergroup and consists of at least three flows that arecompact at the base and in the middle and vesicular, and,thus, probably more weathered at their upper surfaces.
Fig. 4 Conductivity and nat-ural gamma (Mangeya 2003)and summarized lithologiclogs (MacDonald 1970) atborehole G3/463. The verticalscale is elevation in metres. Tothe right, the measured inflowsfrom MacDonald (1970) arestated in litres per hour (lph).The location of the borehole isshown on Fig. 3
950
Hydrogeology Journal (2007) 15: 945–960 DOI 10.1007/s10040-007-0191-z

Two other deep boreholes at Sawmills were documentedby MacDonald (1970) showing a consistent stratigraphydown to their maximum depths of 285 m (O3/117) and322 m (G3/378). The thickness of the basalt varies in thethree Sawmills boreholes: 39 m (G3/378), 48 m (G3/463),and 85 m (O3/117), indicating faulting and verticalmovement between the two production wells and theobservation well.
The conductivity log shows fairly high values thatappear to be related to the groundwater conductivity ratherthan formation conductivity; formation conductivity isexpected to be lower. The conductivity of a mixed watersample from the borehole was measured in the laboratoryas 975 μS/cm (SWECO 1995). The conductivity logshows small but distinct changes at 975, 895, 850, 800,770, and 755 m above sea level (masl). Apart from thechanges at 895 m, all the other changes can be related toinflow zones identified in the hydrogeologic log. Thisresult indicates that the downhole conductivity log is auseful tool for identifying groundwater inflow zones. The850 m elevation is the interface between the Lower andthe Upper Karoo Groups.
The gamma log correlates very well with the lithologyand, to some extent, with the inflow zones. The gamma logshows a change to slightly higher counts between 900 and850 masl. These higher counts represent the depth intervalfrom the first inflow zone down to the inflow zone at theUpper/Lower Karoo Group boundary. Between 850 and750 m, the gamma signature is dramatic and appears tochange at water interflow zones. The lithology in this zonehas been logged as Lower Karoo Group grits, sandstones,shales, and coal stringers. Below 740 masl, the lithology isthe Wankie Sandstone and the gamma signature changesmarkedly to a lower more stable signature.
Geophysical data acquisition methods
Two geophysical methods proved especially useful forsurface geophysical mapping: continuous vertical electri-cal sounding (CVES) and transient electromagneticsounding (TEM). CVES was used to delineate the near-surface geological structures, whereas TEM was used todelineate the deeper structures.
The transient electromagnetic (TEM) soundingmethodThe TEM method has been used in hydrogeologic studiesover the last 15 years. The usage of the method isdescribed by e.g. Fitterman and Stewart (1986); Danielsenet al. (2003). The TEM method makes use of a directcurrent transmitted into the transmitter loop lying on theground. The current creates a primary, stationary magneticfield. The direct current is switched off which induces aneddy current system in the ground. Due to ohmicresistance of the subsurface, the current system will decayand further induce a secondary magnetic field that ismeasured in an induction coil (the receiver coil). The
decay rate of the electromagnetic field depends on theresistivity distribution of the subsurface. The field decaysslower in a conductive rather than in a resistive medium.Consequently, the TEM method has excellent resolutionof conductive layers at depth, whereas the resolution ofresistive layers is limited (Christensen and Sørensen 1998).
TEM soundings are usually made with spacing between150 and 250 m, depending on the exploration target. Thepenetration depth is dependent on the magnetic moment ofthe equipment (i.e. transmitter loop size and number ofturns and the transmitted current), the resistivity of theground, and the magnitude of electromagnetic backgroundnoise (Macnae et al. 1984; McCracken et al. 1986).
Advantages of the TEM method are its sensitivity toconductors at great depths and the lightweight equipmentcompared to CVES. Drawbacks of the TEM method arelow resolution of resistive layers, relatively low lateralresolution in general, high degree of coupling to man-made conductors (Danielsen et al. 2003), and that themethod is conceptually advanced.
The continuous vertical electrical sounding (CVES)methodThe CVES method has been extensively used forgroundwater investigations over the past decades(Olayinka and Weller 1997; Rühlow et al. 1999; Sørensenet al. 2001) and for various other purposes by e.g.Bernstone and Dahlin (1999); Beresnev et al. (2002),and Wisén et al. (2004). The popularity of the CVESmethod is closely connected to its wide applicability, itsrobustness, and the availability of numerous two-dimen-sional (2-D) and three-dimensional (3-D) inversion pro-grams, e.g. Loke and Barker (1996a, b); Oldenburg and Li(1994), and Li and Oldenburg (2000).
A number of electrodes secured into the ground andconnected by electrode cables are used with the method. Aswitching unit connected to a computer controls thetransmission of current into ground through two of theelectrodes, while potentials are measured over otherelectrode pairs. In this way, measurements are performedfor various electrode spacings along a profile line. The arrayconfiguration and the electrode spacings are dependent onthe target of a given exploration (Dahlin and Zhou 2004).
The CVES method provides high data density and ithas a superior near-surface, horizontal resolution incomparison to e.g. the TEM method. The data are robust,as they are not appreciably affected by coupling to man-made conductors and electromagnetic noise. The maindrawbacks of the method are the limited penetration depthand the dependency on galvanic contact to the ground.Galvanic contact is a problem particularly in dry areas.
Data acquisition, processing, and interpretation
Of the 31 km of CVES profiling and 309 TEM soundingscollected around Sawmills, data presentation is limitedhere to the TEM soundings and CVES profiles of
951
Hydrogeology Journal (2007) 15: 945–960 DOI 10.1007/s10040-007-0191-z

geophysical profile lines 2 and 5 (marked in Fig. 3), andthe area covered by TEM soundings inside the U-shapedbend of the railway.
TEMThe TEM soundings were collected using the GeonicsLimited PROTEM 57 and 47 systems for line 2 and line 5,respectively. A single turn, 80×80 m transmitter loop wasused to gain sufficient penetration depth. The receiver coilwas placed in the centre of the transmitter loop.
The PROTEM 57 system transmits 12.5 Ampere (A),yielding a magnetic moment of 80,000 Am2. Data aremeasured in the time range of 0.1 to 70 ms after turn-off.However, usable data were only measured until approx-imately 7 ms. This resolution lies within the capacity ofthe far more mobile PROTEM 47 system, which also hasa higher resolution of the near-surface formations. Thesystem measures in the range from 0.007 to 7 ms afterturn-off. The PROTEM 47 transmits a maximum of 3 A,yielding a magnetic moment of 19,200 Am2. In theapplication of the PROTEM 47 at Sawmills—hererepresented by line 5—the receiver coil of the PROTEM57 system was used. The PROTEM 57 system has anarrow bandwidth reducing the background noise, i.e. dataare usable to later times, but it also distorts the early timegates (Effersø et al. 1999). The mixed PROTEM 47system allowed the field crew to perform around 15soundings per day, corresponding from 2.5 to 3 profilekilometres. This number of soundings should be comparedto 10 soundings per day using the heavier PROTEM 57equipment. As opposed to the CVES method, the TEMmethod has the same production in the Kalahari Sand, asgalvanic contact to the ground is not a problem.
Outlying data points were removed with the SiTEMsoftware (HydroGeophysics Group 2007). Standard devi-ations on the individual data points have been estimatedfrom the noise measurements performed on the soundingsite. When the level of the induced response from theearth approaches the noise level, the standard deviationsof the data points are increased. In this way, the noisierdata points at late times are assigned less weight in theinversion. The low occurrence of man-made conductorsmakes the use of the TEM method favourable in thisapplication.
The inversion program SELMA (Christensen andAuken 1992) was used for the individual inversion of theTEM data. The program does one-dimensional inversionand model analysis of TEM data. The underlying model isone-dimensional, but may be a parameterized model or amulti-layer model. The TEM data were interpreted using amulti-layer model with 19 layers, where the layer thick-nesses increase with depth to reflect the resolution capacityof the method (Constable et al. 1987).
CVESThe CVES were mainly carried out in areas with a topcover of weathered basalt as this provided good electrode
contact compared to the high resistivity Kalahari sands.For the CVES data presented here, only the southern partof line 5 is measured in Kalahari sands.
Local workers were hired to cut the lines through thebush. The starting points of the lines were measured byDifferential Global Positioning System (DGPS) and fromthere directional bearings were taken using a compass andranging rods. The length along the profile (x-coordinate)was determined with a measuring tape and the stationswere marked with wooden pegs. The line topography wasobtained by levelling with a dummy level in reference tothe starting points.
The CVES surveying was carried out using an ABEMLund Imaging System (Dahlin 1996). A total layoutlength of 800 m was used with a 10-m minimum electrodeinterval. Line 5 was measured using Wenner protocolsproviding 16 different a-spacings from 10 to 240 m. Online 2, the Wenner protocols were complemented bySchlumberger protocols. Schlumberger protocols include ahigher data density at great depth, but these data aregenerally noisier than data collected with Wenner proto-cols (Dahlin and Zhou 2004).
The CVES data were measured transmitting currents inthe range 50–200 milliamperes (mA). However, theKalahari sands required considerable efforts in wateringand hammering the electrodes, and the current had to belowered to 20 mA in some cases. A mixture of salt andstarch based gel intended for rotary mud drilling withwater helped to improve contact in the highly permeablesand. The productivity during fieldwork ranged mostlybetween 800 and 1,000 m per day, depending on thegalvanic contact of the ground.
The CVES data are generally of good quality. The mostnoise affected profiles have a Kalahari sands top cover,e.g. from 0 to 1,000 m on line 5. The data were invertedusing the Res2dinv program, where approaches describedby Loke and Dahlin (2002) and Loke et al. (2003) areused. The underlying model is a two-dimensional finiteelement model that accounts for topography. The inver-sions were carried out using the L1-like minimization ofthe error function. Together with a horizontal flatnessfilter, these settings create models with sharper boundariesthan the default least squares approach. A sharp boundarymodel was considered to be a better representation of thelayered geology underlying the Sawmills area.
Mutually and laterally constrained inversionThe TEM and geoelectrical methods are complementaryin many ways making them ideal methods for jointinversion. Both methods measure the electrical resistivity(or conductivity) of the subsurface, but they have differentsampling volumes and sensitivities. Joint inversion of datasets resolving the ground resistivity has been presented bye.g. Gómez-Treviño and Edwards (1983); Raiche et al.(1985); Yang et al. (1999), and Albouy et al. (2001).
In this study, the mutually and laterally constrainedinversion (LCI) of Christiansen et al. (2007) for jointinversion of TEM and geoelectrical data is used. A
952
Hydrogeology Journal (2007) 15: 945–960 DOI 10.1007/s10040-007-0191-z

parameterized inversion of several one-dimensional mod-els on a profile is used minimizing the same objectivefunction. The model parameters of adjacent soundings arelaterally constrained to claim identity between the neigh-bouring models. The lateral constraints can be consideredas prior information of the geological variability as seenby the method along the profile. The resulting model hassharp layer boundaries, but a smooth lateral development.
It was expected that the consecutive basalt flows in thesurvey area can create electrical anisotropy (Christensen2000) because the flow surfaces are weathered before theyare overlain by a new flow. Also, the upper portion of theflows are enriched by fluids and volatiles derived frombasalt degassing due to pressure changes that occur afterextrusion. The benefit of joint inversion schemes in ananisotropic environment is exemplified by the modelanalysis shown in Fig. 5.
Synthetic TEM and DC geoelectrical data sets for themodel shown in Fig. 5a are generated by EMMA (Aukenet al. 2002). These synthetic data sets are invertedindividually, and the resulting models are shown inFig. 5b and c, respectively. The TEM model does notreproduce the first two layers correctly, but the depth toand resistivity of the bottom layer and the thickness of theanisotropic layer are correctly reproduced. The Schlumbergersounding recovers the upper part of the model, but thethickness of the anisotropic layer is exaggerated. How-ever, the joint inversion of both data sets shown inFig. 5d reproduces the true model, apart from the actualanisotropy that is beyond the resolution capabilities of anysurface-geophysical method.
Constraint set-upThe set-up of the constraints is crucial for the inversionresult. To evaluate different constraints, a test profile, from1,000 to 2,500 on profile line 2 (see Fig. 3), was set upwith different constraints.
The Res2dinv inversion result of CVES data for thetest profile is shown in Fig. 6a. The upper 30 m are lowresistive, but at profile coordinates 1,600 and 1,800 m,small resistive bodies are located close to the surface. Aresistive layer is encountered below a depth of 50 m.
Initially, reproduction of the two-dimensional inversionresult was sought by one-dimensional LCI of the CVESdata alone. This reproduction is shown in Fig. 6b. Theupper 50 m of both profiles are similar. The lateralconstraints are looser in the upper two layers of theunderlying four-layer model compared to the lower twolayers. Loosening the constraints corresponds to weightingthe data more in the upper part of the model than in thelower part. This approach is reasonable as the sensitivityof the method decreases with depth. A looser constraintfactor between neighbouring resistivities in the top layerallows the models to account for near-surface resistivityvariations caused by the so-called static shift problems(Li and Oldenburg 2000 and Spitzer 2001). The LCI showscontinuity in the 20–40-Ωm shallow layer stretchingthrough the entire profile, even if the LCI, occasionally,jumps between neighbouring layers. The shallow layer isgenerally thinner than in the two-dimensional inversion.This result is explained by the nature of the smoothinversion; the inversion has to incorporate a transitionfrom the shallow conductive structure to the resistive
Fig. 5 Model analyses: a thetrue model, b the TEMinverted model, c the DCinverted model, and d theconstrained inverted model.The anisotropy is modeled asthree 30Ωm layers, 1m thick,interbedded in a 1,000Ωmlayer. Data residuals from theinversion are stated below themodels. A residual of 1 corre-sponds to the data uncertainty.Hence, the synthetic data arewell-fitted for all threeinversions
953
Hydrogeology Journal (2007) 15: 945–960 DOI 10.1007/s10040-007-0191-z

structure below. At depths greater than 50 m, Res2dinvshows vertical variations in resistivity, where the LCIvaries laterally with similar variations to obtain the sameintegrated resistivity.
The TEM data are added to the LCI system in Fig. 6c.The conductive layer at great depth is severely constrainedfrom model to model. To ensure continuity from TEMmodel to TEM model, the constraint needs to be narrow,as 20 CVES models are present between two TEMmodels. The CVES models have a tendency to increasethe resistivity and push the layer down (not shown). Thisresult may be due to anisotropy as discussed above.
Based on the results shown in Fig. 6c, it was decided toconstrain the TEM models to the CVES models only bythe bottom layer boundary, as the CVES data have thehigher surface-near resolution. The resulting model is seenin Fig. 6d. This model has the near-surface resolution ofthe two-dimensional CVES interpretation, e.g. note theshallow resistive bodies at 1,600 and 1,800 m. The low-resistive bottom layer is necessary to explain the TEMdata and it confines the lower boundary of the anisotropicbasalts. The bottom layer prevents the overshoot ofthickness and undershoot of resistivity due to electricalanisotropy (Fig. 6a and b). It is believed that the LCI
provides a better estimate of the properties of the basaltand can be used for assessing the degree of fracturing andweathering that are important for recharging underlyingaquifers.
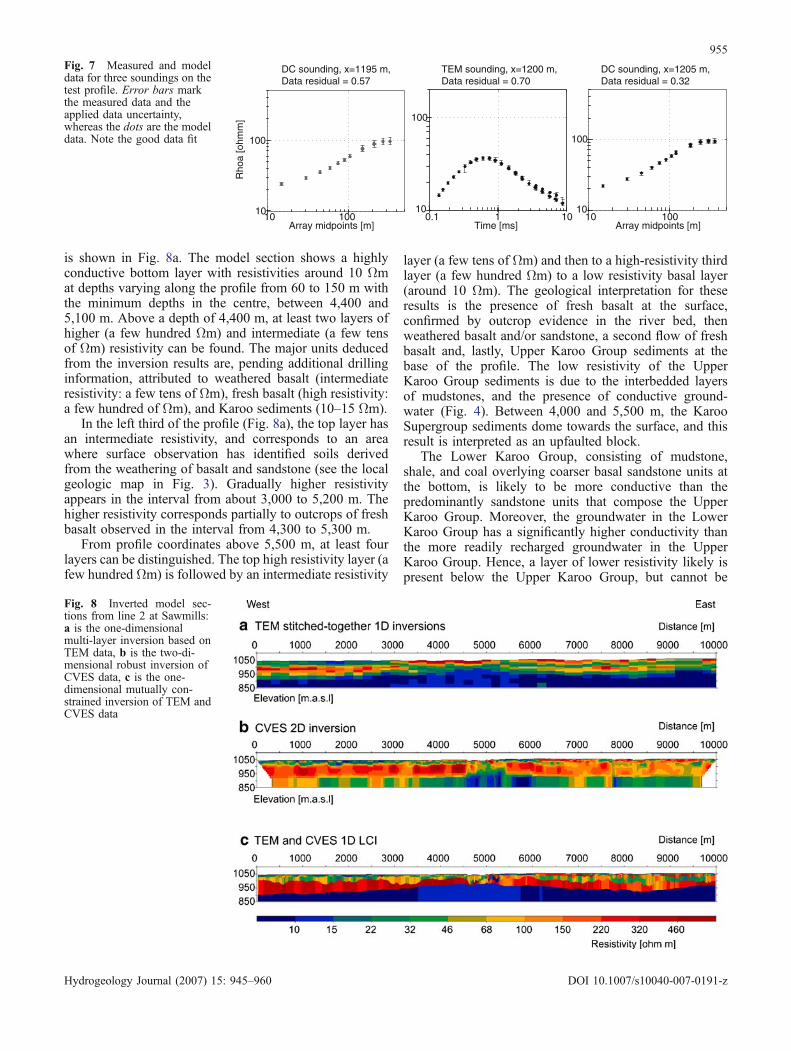
Measured and model data for three soundings along theprofile are shown in Fig. 7. Measured data are representedby error bars, whereas the model data are presented bydots. For large electrode spacing, two data points arepresent for the same electrode spacing. This result is dueto the presence of both Wenner and Schlumberger datawith the same array midpoint. Considering a one-dimensional earth, the two data points would coincide.Because the two data points do not coincide, theinadequacy of the one-dimensional model is realized.Generally the fit to data is acceptable for both DC and TEM.
Results and interpretation
Line 2The inversion results of line 2 are given in Fig. 8. Themodel sections are described below. A model section ofone-dimensional inversions of line 2 TEM data down toan approximate depth of 200 m using a multi-layer model
Fig. 6 Test profile used todetermine the set-up of con-straints. In a it is the two-dimensional inversion ofCVES data by Res2dinv isshown, in b it is the one-dimensional LCI of CVESdata, in c it is an abandonedattempt of LCI of TEM andCVES data, whereas d is theLCI with the model as chosen.A residual of 1 corresponds toa fit at the uncertainty appliedto the data. Hence, data arefitted within the datauncertainty
954
Hydrogeology Journal (2007) 15: 945–960 DOI 10.1007/s10040-007-0191-z
is shown in Fig. 8a. The model section shows a highlyconductive bottom layer with resistivities around 10 Ωmat depths varying along the profile from 60 to 150 m withthe minimum depths in the centre, between 4,400 and5,100 m. Above a depth of 4,400 m, at least two layers ofhigher (a few hundred Ωm) and intermediate (a few tensof Ωm) resistivity can be found. The major units deducedfrom the inversion results are, pending additional drillinginformation, attributed to weathered basalt (intermediateresistivity: a few tens of Ωm), fresh basalt (high resistivity:a few hundred of Ωm), and Karoo sediments (10–15 Ωm).
In the left third of the profile (Fig. 8a), the top layer hasan intermediate resistivity, and corresponds to an areawhere surface observation has identified soils derivedfrom the weathering of basalt and sandstone (see the localgeologic map in Fig. 3). Gradually higher resistivityappears in the interval from about 3,000 to 5,200 m. Thehigher resistivity corresponds partially to outcrops of freshbasalt observed in the interval from 4,300 to 5,300 m.
From profile coordinates above 5,500 m, at least fourlayers can be distinguished. The top high resistivity layer (afew hundred Ωm) is followed by an intermediate resistivity
layer (a few tens of Ωm) and then to a high-resistivity thirdlayer (a few hundred Ωm) to a low resistivity basal layer(around 10 Ωm). The geological interpretation for theseresults is the presence of fresh basalt at the surface,confirmed by outcrop evidence in the river bed, thenweathered basalt and/or sandstone, a second flow of freshbasalt and, lastly, Upper Karoo Group sediments at thebase of the profile. The low resistivity of the UpperKaroo Group sediments is due to the interbedded layersof mudstones, and the presence of conductive ground-water (Fig. 4). Between 4,000 and 5,500 m, the KarooSupergroup sediments dome towards the surface, and thisresult is interpreted as an upfaulted block.
The Lower Karoo Group, consisting of mudstone,shale, and coal overlying coarser basal sandstone units atthe bottom, is likely to be more conductive than thepredominantly sandstone units that compose the UpperKaroo Group. Moreover, the groundwater in the LowerKaroo Group has a significantly higher conductivity thanthe more readily recharged groundwater in the UpperKaroo Group. Hence, a layer of lower resistivity likely ispresent below the Upper Karoo Group, but cannot be
Array midpoints [m]
DC sounding, x=1205 m, Data residual = 0.32
10
100
10 10010
100
Time [ms]
TEM sounding, x=1200 m, Data residual = 0.70
10.110
Array midpoints [m]R
hoa
[ohm
m]
DC sounding, x=1195 m, Data residual = 0.57
10
100
10 100
Fig. 7 Measured and modeldata for three soundings on thetest profile. Error bars markthe measured data and theapplied data uncertainty,whereas the dots are the modeldata. Note the good data fit
Fig. 8 Inverted model sec-tions from line 2 at Sawmills:a is the one-dimensionalmulti-layer inversion based onTEM data, b is the two-di-mensional robust inversion ofCVES data, c is the one-dimensional mutually con-strained inversion of TEM andCVES data
955
Hydrogeology Journal (2007) 15: 945–960 DOI 10.1007/s10040-007-0191-z

clearly identified because of the great depth of burial. Inthe borehole log for G3/463, the depth to the upfaultedLower Karoo Group is 200 m, and it must lie deeperoutside this upfaulted block.
The CVES inversion result from line 2 is presented inFig. 8b. The first section of the line (from 0 to 4,600 m)shows essentially a three-layer structure. A 30-m-thickrelatively conductive top layer (a few tens of Ωm) overliesa 100-m-thick resistive layer (some hundred Ωm), whichin turn overlies a lower resistivity base (a few tens of Ωm).This interpretation agrees with the TEM model.
Supported by outcrop information and borehole data,the three layers are interpreted as conductive weatheredbasalts interbedded with sandstones, underlain by resistivefresh basalts, followed by the relatively conductive UpperKaroo Group sediments. The high resistivity basalt layervaries significantly in resistivity along this section of theprofile, indicating variations in electrical properties prob-ably due to variation in joint spacing and associatedweathering on joint surfaces. The thickness of the freshbasalt layer is expected to be exaggerated due to electricalanisotropy. There are small highly resistive spots in theshallow parts of the model, which may be explained bylocal deposits of coarse-grained alluvium.
From 3,500 to 4,600 m, there is a thin high resistivitysurface layer associated with exposures of fresh basalt.Between 4,600 and 5,400 m, the low resistivity bottomlayer, interpreted as Upper Karoo Group sediments, hasbeen vertically uplifted closer to the surface. The highresistivity layer has been largely displaced, and where itpersists, it is thinner and fragmented. Where this layerreaches the surface, it coincides with the exposed basalt.The thickness of the high resistivity layer in this interval alsoagrees with the thickness of the basalt recorded in boreholesG3/378 (48 m) and G3/463 (50 m; MacDonald 1970).
Similar interpretations as described above can be madefor the rest of the profile from 5,400 m eastwards to theend of the line. The basal layer has low resistivity and isoverlain by a high resistivity layer representing UpperKaroo Group sediments and fresh basalt, respectively. Thetop section indicates slightly greater complexity, and maybe either a single low-resistivity surface layer or a doublelayer with a thin high-resistivity surface layer followed bya low-resistivity layer. This result has been interpreted aseither weathered basalt or an upper flow of fresh basaltoverlying the weathered basalt.
Another distinctive feature of this end of the profile isthat the main zone of high-resistivity fresh basalts is morebroken by vertical zones of low resistivity, as compared tothe western section. The vertical breaks may be due toblock faulting or to variations in the spacing of the joints.This pattern can also be derived from the joint invertedprofile in shown in Fig. 8c. The joint inversion gives abetter estimate of the thickness and resistivity of the basaltlayer. This better estimate particularly applies to the westin the profile, where the basalt/Karoo Group boundarysupposedly is deep and well below the penetration depthdetermined with the CVES method. To the east, above9,000 m, the Upper Karoo Group comes closer to the
surface. The first yielding horizon in the borehole in Fig. 4correlates well with the conductive layer at the boreholesite at an elevation of 975 m in the joint invertedgeophysical profile. This horizon (below the basalt/KarooGroup interface) is apparently shallower in this part of theprofile and, presumably, less costly to drill. Optimizationof the depth to the water-yielding horizons is of majorimportance in such a geophysical survey. This horizon istoo deep to be consistently determined by the CVES methodalone, whereas the stand-alone interpretation of the TEMdata shown in Fig. 8a lacks the detail in the near-surface.
One limitation to the interpretation described above isthat the underlying model assumption is one-dimensional.In areas with clear two-dimensional (or even three-dimen-sional) structure, the two-dimensional inversion of CVES isbetter equipped to show the structure. This result happense.g. at the fault zone between 4,600 and 5,400 m. Luckily,the conductive layer in this area is closer to the surface andit is picked up on the CVES profile. In this particular region,more confidence should be placed in the structure shown bythe CVES model. All in all, it is convenient to have severalmodel displays and data representations, as no onerepresentation is best in all respects.
Line 5The inversion results of line 5, which strikes line 2 at rightangles at the fault zone, are shown in Fig. 9. The TEMinverted multi-layer model shown in Fig. 9a appears ableto differentiate between the Lower and Upper KarooGroups. Below the high-resistivity layer, interpreted asfresh basalt, a 50-m-thick layer with a conductivity of 15-20 Ωm is located above a 10-Ωm layer. The 15–20 Ωmlayer may be interpreted as the Lower Karoo Group. Thisinterpretation is not supported by the CVES in Fig. 9b,and the inclusion of the CVES data in the joint inversion(Fig. 9c) scheme subdues this feature. Also, the greatdepth of the Lower Karoo Group at borehole G3/463makes this interpretation uncertain.
The Kalahari Sand is clearly seen as the top high-resistivity layer in the CVES and the LCI profiles from 0to 1,000 m. The TEM one-dimensional profile givesevidence of the presence of the Kalahari Sand until itbecomes too thin at 800 m. It is well-known that thestrength of the method is the detection of buried,conductive layers. At greater depth, coordinates from 0to 1,000 m are the most resistive part on line 5, suggestingthat the basalt here is fresh and intact. This fresh and intactbasalt is likely to reduce recharge to the underlying KarooSupergroup sediments. Similarly, on line 2 (Fig. 8),resistivity values from coordinates from 0 to 1,000 alsoindicate fresh intact basalt.
In the interval from 1,300 to 2,700 m, the fault zone isrecognized. Line 5 strikes almost perpendicular to line 2;therefore, line 5 provides an image of the fault zone in theN–S direction. Again, the fault zone is most clearlyrecognized in the CVES two-dimensional profile. TheTEM one-dimensional profile contains a bad sounding at1,200 m that was skipped. Skipping this sounding lowered
956
Hydrogeology Journal (2007) 15: 945–960 DOI 10.1007/s10040-007-0191-z

the horizontal resolution. However, a clear decrease inresistivity compared to lower profile coordinates suggestsa change in the subsurface. In the LCI profile (Fig. 9c),this region shows fluctuations between extreme resistivi-ties. These fluctuations may be due to inadequacy of theone-dimensional model assumption because of the faultzone. From 2,700 m upward, it seems that the typicalscenario of weathered and fresh basalt underlain by theKaroo Supergroup sediments resumes, and it continuesthroughout the profile.
Depth slicesThe inverted models from all the available TEM soundingswere merged to form a quasi three-dimensional model,from which slices were differentiated with depth. Selectedmodel slices, with the position of the railway marked forreference, are shown in Fig. 10. The top depth slice showshigh resistivity in the central and eastern part. This highresistivity is interpreted to consist of mainly fresh basalt atan elevation from 1,040 to 1,060 and is shown in Fig. 10a.The northwestern corner shows intermediate to lowresistivity that is interpreted as Upper Karoo GroupSandstone. Sandstone has also been mapped here in theregional geologic field map (Fig. 3). The contact between thehigh and intermediate to low resistivity areas is sharp and isconsidered to be the fault zone trending approximately N–S.
Along the W–SW edge of the mapped area, there ishigher resistivity that probably corresponds to the Kala-hari Group. This result agrees with the regional geologicmap shown in Fig. 3. Distinct bands of lower resistivityare seen in the central high-resistivity regions, which areinterpreted as fault zones.
Fig. 9 Inverted model sections from line 5 at Sawmills: a is theone-dimensional multi-layer inversion based on TEM data, b is thetwo-dimensional robust inversion of CVES data, c is the one-dimensional mutually constrained inversion of TEM and CVES data
Fig. 10 Depth slices of merged multi-layer inverted TEM models.Depths in m.a.s.l.: a 1,060–1,040, b 1,020–1,000, c 980–960, d960–940, e 920–900
957
Hydrogeology Journal (2007) 15: 945–960 DOI 10.1007/s10040-007-0191-z

In the second depth slice in Fig. 10b, 1,020–1,000 melevation, intermediate to low resistivity is seen in thecentral and most of the eastern parts of the area. Based onthe drilling information and the interpretation for line 2described above, this result is interpreted as the lowerresistivity of the Upper Karoo Group sediments beingcloser to the surface in this area. The resistivity increasesin the northwestern part of the area, indicating thepresence of fresher basalt. In the W–SW corner, the lowerresistivity is interpreted as the weathered basalt and/orsandstone below the Kalahari Group above. The followingdepth slice in Fig. 10c, 980–960 m elevation, very clearlyshows a large intermediate to low- resistivity zone in thecentral part of the mapped area. This result is interpretedas a zone where the Karoo Supergroup sediments areupfaulted in relation to the surrounding basalts. It is at thislevel that the first yielding horizon is encountered at theborehole. The intermediate resistivity may be interpretedas the Upper Karoo Group. A similar interpretation can bedone for the eastern end of the model. The western part ofthe area has consistently high resistivity that can beinterpreted as fresh basalt, except along the southwesternedge of the area.
The low-resistivity central zone increases in size withincreasing depth, and the resistivity decreases, as shown in thenext depth slice in Fig. 10d, 960–940 m elevation. This resultis interpreted as an increasing effect from the low-resistivityLower Karoo Group sediments. The bottom depth slice inFig. 10e, 920–900 m elevation, is dominated by lowresistivity, and it is only in the northwestern corner wheresome intermediate resistivity is still seen. This low resistivityis interpreted as dominantly Karoo Supergroup sediments,with resistivity decreasing with increasing depth.
Conclusions and recommendations
ConclusionsConsidering the interpretations described above, thefollowing items are concluded concerning the hydro-geology at Sawmills, and the application of the TEMand CVES geophysical methods to investigations of theaquifers underlying the area:
– The Karoo Basalt consists of several flows with lesscompact and more weathered basalt horizons or
interbedded sandstone layers in between. These weath-ered/sandstone horizons have lower resistivity, and thislayering results in electric anisotropy that affects thegeophysical results.
– The Upper Karoo Group consists of sandstone with someclay bands that can result in anisotropy. Due to the claycontent and the alkaline groundwater, the Upper KarooGroup has a lower resistivity than the overlying basalts.
– The Lower Karoo Group is probably characterized byeven lower resistivity caused by layers of shales, coal,and mudstones and the abundance of alkaline andconductive groundwater. The interbedded layers areexpected to make the Lower Karoo Group anisotropic.This layer is probably too deep to be detected with themethods used in this study.
– The first productive aquifer is at the top of the UpperKaroo Group (yielding 0.16 m3/h), and higher yieldinghorizons are present at the transition to the Lower KarooGroup (2.4 m3/h) and within the Lower Karoo Group(four zones of almost 20 m3/h in total). Thus, the modelpresentations displaying the low-resistive Karoo Super-group sediments, as they were extrapolated from theborehole, are valuable tools for aquifer exploration. TheKaroo Supergroup sediments are highly faulted and, as aresult, the various aquifer units come closer to thesurface in some localities. Because the cost of drillingand well completion is dependent on the depth required,it is important for determining these depths for theeconomic aspects of aquifer development.
– The use of the geophysical methods presented hereprovided valuable information for understanding thegeological setting at and in the vicinity of the bore-holes. A similar approach was adapted for theNyamandhlovu area closer to Bulawayo.
– Plan maps, in the form of depth slices based on TEM,outline the major tectonic features. However, thesemaps are smeared out at deeper depths as a conse-quence of the one-dimensional assumption used in themodel analysis. Furthermore, the resistivity of theupper relatively resistive layers is determined with lessaccuracy than with CVES.
– CVES provides better images and more detail on thetectonic structure in the fault zone because of the densedata cover, the two-dimensional inversion methodused, and the shallow depth due to uplifted Karoosediments. However, the thickness of the basalt is
Fig. 11 Conceptual geologicmodel striking E–W alongline 2. Not to scale
958
Hydrogeology Journal (2007) 15: 945–960 DOI 10.1007/s10040-007-0191-z

overestimated and its resistivity underestimated due tothe electrical anisotropy.
– The combined interpretation of TEM and CVES datausing LCI accounts for the anisotropy and provides abetter estimation of the true resistivity and depth of thelayers. However, the horizontal definition is smeareddue to the one-dimensional assumption and the lateralbands used.
– TEM has the advantage of not requiring galvaniccontact with the ground in contrast to CVES. In CVES,the productivity and data quality can be affected in theparts of the area covered by high-resistivity KalahariGroup sands.
– Based on these items and the geologic interpretationsof the geophysical models described above, a concep-tual geologic model is shown in Fig. 11.
RecommendationsThe following are recommended for future work at thislocation:
– TEM is a highly suitable method for mapping theoverall structure and variations in depth to the KarooSupergroup sediments that are the target aquifers atSawmills. The TEM method can, thus, be expected toprovide valuable information for further investigationof these key horizons. TEM can be performed quicklyon the ground, and can also be performed from the airusing a helicopter or fixed wing aircraft. Large areascan be surveyed efficiently with only a minor loss inresolution. Because relatively little man-made sourcesof disturbance are present in the area, aircraft use canbe expected to give good results. An airborne surveycan be followed up by more detailed ground-basedTEM surveying in selected areas.
– CVES can be used to provide more detail on thetectonic structure and the layers overlying the aquifers,and should be carried out along lines selected on basisof the TEM results. This methodology allows for abetter interpretation of the TEM data, and provides amore detailed image of the local geologic variation anda basis for well positioning. In other parts of the regionwhere the Upper Karoo Group is closer to the surfaceor the Kalahari Group sands are target aquifers, theapplication of CVES is probably more important.
– In areas covered by Kalahari sands, the galvaniccontact can be a problem for galvanic resistivitysurveying. Even watering of the electrodes and theuse of several 0.5–1 m long electrodes at eachelectrode point may be insufficient in places duringthe dry period. In such cases, surveying in the rainyseason can be a way of securing reasonable surveyingefficiency and data quality.
Acknowledgements The authors thank the department for Re-search Co-operation (SAREC) within the Swedish International
Development Agency (SIDA) for funding the field work and mostof the analyses presented in this report. The fieldwork was largelycarried out by students from University of Zimbabwe, LundUniversity and University of Aarhus. These students are N. Dladla,D. Glatz, P. Gwaze, B. Lorentzsen, A. Maziti, B. Ngwenya, M.Olsson, A. Persson, and N. Persson. Furthermore, P. Gwaze didsome of the processing of the TEM models and N.B. Christensen isacknowledged for supervising the TEM field campaigns. Thegeophysical well-logging was carried out by E. Clausen of GEUS.
References
Albouy Y, Andrieux P, Rakotondrasoa G, Ritz M, Descloitres M,Join J-L, Rasolomanana E (2001) Mapping coastal aquifers byjoint inversion of DC and TEM soundings: three case histories.Ground Water 39:87–97
Auken E, Nebel L, Sørensen KI, Breiner M, Pellerin L, ChristensenNB (2002) EMMA: a geophysical training and education toolfor electromagnetic modeling and analysis. J Environ EngGeophys 7:57–68
Barber B (2003) A summary of the geology and coal potential ofthe Karoo supergroup and younger rocks in Zimbabwe. PhDThesis, University of Zimbabwe, Harare
Beasley AJ (1987) Hydrogeology of the area around Nyamandh-lovu, Zimbabwe. PhD Thesis, University of London, UK
Beresnev IA, Hruby CE, Davis CA (2002) The use of multi-electrode resistivity imaging in gravel prospecting. J ApplGeophys 49:245–254
Bernstone C, Dahlin T (1999) Assessment of two automatedelectrical resistivity data acquisition system for landfill locationsurveys: two case studies. J Environ Eng Geophys 4:113–122
Bond D, MacDonald D (1962) The Karoo succession at Sawmills,southern Rhodesia. Occasion Pap Nat Mus S Rhodesia26B:623–630
Christensen NB (2000) Difficulties in determining electrical anisot-ropy in subsurface investigations. Geophys Prospect 48:1–19
Christensen NB, Auken E (1992) SELMA-Simultaneous electro-magnetic layered modeling and analysis. In: Jacobsen BH (ed)Proceedings of interdisciplinary inversion workshop 1 Aarhus1992, Methodology and Applications within Geophysics,Astronomy, and Geodesy, GeoSkrifter Univ Aarhus 41:49–56
Christensen NB, Sørensen KI (1998) Surface and borehole electricand electromagnetic methods for hydrogeological investiga-tions. Euro J Environ Eng Geophy 3:75–90
Christiansen AV, Auken E, Foged N, Sørensen KI (2007) Inversionof CVES and TEM data with mutually and laterally constrained1D models: a case study. Near Surface Geophys 5:115–124
Constable SC, Parker RL, Constable CG (1987) Occam’s inversion:a practical algorithm for generating smooth models fromelectromagnetic sounding data. Geophysics 52:289–300
Dahlin T (1996) 2D resistivity surveying for environmental andengineering applications. First Break 14(7):275–283
Dahlin T, Zhou B (2004) A numerical comparison of 2D resistivityimaging with 10 electrode arrays. Geophys Prospect 52:379–398
Danielsen JE, Auken E, Jørgensen F, Søndergaard V, Sørensen KI(2003) The application of the transient electromagnetic methodin hydrogeophysical surveys. J Appl Geophys 53:181–198
Dennis PE, Hineson LL (1964) Groundwater provinces of southernRhodesia. US Geol Surv Water Suppl Pap 1757-D
Effersø F, Auken E, Sørensen KI (1999) Inversion of band-limitedTEM responses. Geophys Prospect 47:551–564
Fitterman DV, Stewart MT (1986) Transient electromagneticsounding for groundwater. Geophysics 51:995–1005
Gómez-Treviño E, Edwards RN (1983) Electromagnetic soundingsin the sedimentary basin of southern Ontario: a case history.Geophysics 48:311–330
HydroGeophysics Group (2007) Information available at http://www.skyware.dk/page74.aspx. Cited 11 April 2007
Li Y, Oldenburg DW (2000) 3D inversion of induced polarity data.Geophysics 65:1931–1945
959
Hydrogeology Journal (2007) 15: 945–960 DOI 10.1007/s10040-007-0191-z

Loke MH, Barker RD (1996a) Rapid least squares inversion ofapparent resistivity pseudosections by a quasi-Newton method.Geophys Prospect 44:131–152
Loke MH, Barker RD (1996b) Practical techniques for 3D resistivitysurveys and data inversion. Geophys Prospect 44:499–523
Loke MH, Dahlin T (2002) A comparison of the Gauss-Newton andquasi-Newton methods in resistivity imaging inversion. J ApplGeophys 49(3):149–162
Loke MH, Acworth I, Dahlin T (2003) A comparison of smooth andblocky inversion methods in 2-D electrical imaging surveys.Explor Geophys 34(3):182–187
MacDonald D (1970) The development of railway borehole watersupplies on the Bulawayo-Dett section since 1950. Rhod SciNews 4(12):398–405
Macnae JC, Lamontagne Y, West GF (1984) Noise processingtechniques for time-domain EM systems. Geophysics 49:934–948
Mangeya P (2003) Ground-water resource evaluation of theUmguza aquifer, Zimbabwe, PhD Thesis, University of Zim-babwe, Harare, 178 pp
McCracken KG, Oristaglio ML, Hohmann GW (1986) Minimization ofnoise in electromagnetic exploration systems.Geophysics 51:819–832
Mkandla N (2003) Bulawayo water supplies: Umgusa well field as asustainable alternative for the next decade. MSc Thesis, WaterResources Engineering and Management, Dept. Civil Engineer-ing, University of Zimbabwe, Harare
Nilsson Å, Hammer A (1996) Study of water resources inZimbabwe. SIDA, Stockholm, Sweden
Ohlsson L (1995) Water and security in southern Africa. Publicationof water resources no. 1. SIDA, Stockholm, Sweden
Olayinka AI, Weller A (1997) The inversion of geoelectrical datafor hydrogeological application in crystalline basement areasof Nigeria. J Appl Geophys 37:103–115
Oldenburg DW, Li Y (1994) Inversion of induced polarization data.Geophysics 59:1327–1341
Orpen JL, Swain CJ, Nugent C, Zhou PP (1989) Wrench fault andhalf-graben tectonics in the development of the PaleozoicZambezi Karoo basins in Zimbabwe the lower Zambezi andthe mid-Zambezi basins respectively and regional implica-tions. J Afr Earth Sci 8:215–229
Raiche AP, Jupp DLB, Rutter H, Vozoff K (1985) The joint use ofcoincident loop transient electromagnetic and Schlumbergersounding to resolve layered structures. Geophysics 50:1618–1627
Rühlow A, Tezkan B, Lima de Lima OA (1999) DC resistivity andtime-domain induced polarization survey for the study ofgroundwater contamination in Bahia, Brazil. Geophysics3:143–159
Sørensen KI, Effersø F, Auken E (2001) A hydrogeophysicalinvestigation of the island of Drejø. Eur J Environ Eng Geophys6:109–124
Spitzer K (2001) Magnetotelluric static shift and direct currentsensitivity. Geophys J Int 144:289–299
Stagman JG (1978) An outline of the geology of Rhodesia. RhodGeol Surv Bull no. 80
SWECO (1995) Groundwater as a source for Bulawayo. Technicalreport no. 12. Bulawayo-Matabeleland water supply feasibilitystudy, SWECO, Stockholm
SWECO (1996) Bulawayo-Matabeleland-Zambezi water supplyfeasibility study. Final Report. Government of Zimbabwe (Minis-try of Local Government), Matabeleland ZambeziWater Trust, andSIDA, Stockholm, Sweden
Wisén R, Auken E, Dahlin T (2004) Comparison of 1D laterallyconstrained inversion and 2D inversion of CVES resistivity datawith drilling data as prior information. Near Surf Geophys 3(2)71–78
Yang C-H, Tong L-T, Huang C-F (1999) Combined application ofdc and TEM to sea-water intrusion mapping. Geophysics64:417–425
960
Hydrogeology Journal (2007) 15: 945–960 DOI 10.1007/s10040-007-0191-z