geomorphology study of the middle mississippi · pdf filegeomorphology study of the middle...
TRANSCRIPT
Geomorphology Study of the Middle Mississippi River
By
Edward J. Brauer
David R. Busse
Mr. Claude Strauser
Robert D. Davinroy
David C. Gordon
Jasen L. Brown
Jared E. Myers
Aron M. Rhoads
Dawn Lamm
U.S ARMY CORPS OF ENGINEERS
ST. LOUIS DISTRICT
ENGINEERING DIVISION
HYDROLOGIC AND HYDRAULICS BRANCH
APPLIED RIVER ENGINEERING CENTER
FOOT OF ARSENAL STREET
ST. LOUIS, MO 63118
Prepared for:
U.S. Army Corps of Engineers, St. Louis District and Mississippi River Stakeholders
December 2005
i
INTRODUCTION
A geomorphology study of the Middle Mississippi River, from St. Louis, Missouri to
Cairo, Illinois, was conducted by the U.S. Army Corps of Engineers, St. Louis District.
The study was conducted between the period of 2000 and 2005 at the Applied River
Engineering Center by Mr. Edward J. Brauer, Mr. Robert D. Davinroy, Mr. David Busse,
Mr. David C. Gordon, Mr. Jasen L. Brown, Mr. Jared E. Myers, Mr. Aron M. Rhoads and
Mrs. Dawn Lamm. The study was originally initiated as an investigative study for the
Mississippi River Channel Improvement Project and later supported by the Biological
Opinion. Several people provided important input and resources for this effort including
Mr. Mike Flowers, Land Surveyor for the State of Missouri, Missouri Geological Survey
and his staff; Mr. Lou Gilbert, Registered Land Surveyor, Rolla, Missouri; Mr. Chuck
Calli, Illinois State Archives, Springfield, Illinois; Mr. Claude N. Strauser, Retired Chief,
Hydrologic and Hydraulic Branch, St. Louis District; Dr. Jerome Westphall, retired
professor, University of Missouri-Rolla; Dr. Daryl Simons, retired professor and
consultant, Fort Collins, Colorado; Dr. Stanley Schum, retired professor and consultant,
Fort Collins, Colorado; and Dr. Terry Norris, Archaeologist, St. Louis District.
The primary goals of this report were to give a qualitatively and quantitatively
chronology of the historical planform changes of the Middle Mississippi River and to
develop conclusions and formulate ideas for future environmental initiatives.

ii
TABLE OF CONTENTS
INTRODUCTION.............................................................................................................. i
TABLE OF CONTENTS ................................................................................................. ii
STUDY REACH................................................................................................................ 1
BASIN GEOLOGY....................................................................................................... 1
GENERAL RIVER CHARASTERISTICS................................................................ 2
CLIMATE ..................................................................................................................... 3
HISTORY .......................................................................................................................... 3
RIVER TRAINING STRUCTURES .......................................................................... 7
GEOMORPHOLOGY STUDY..................................................................................... 13
AVAILABLE MAPS AND DATA ............................................................................ 13
VICTOR COLLET MAP OF 1796 ........................................................................... 15
CREATING THE 1817-2003 PLANFORMS........................................................... 16
CADASTRAL SURVEY-QUALITY CONTROL ................................................... 17
DEFINITIONS ............................................................................................................ 19
PHYSICAL CHANGES ................................................................................................. 21
PAST GEOMORPHOLOGY STUDIES ...................................................................... 33
SUMMARY/CONCLUSIONS....................................................................................... 38
RESTORATION-FUTURE REACHES....................................................................... 40
REFERENCES................................................................................................................ 42
1
STUDY REACH
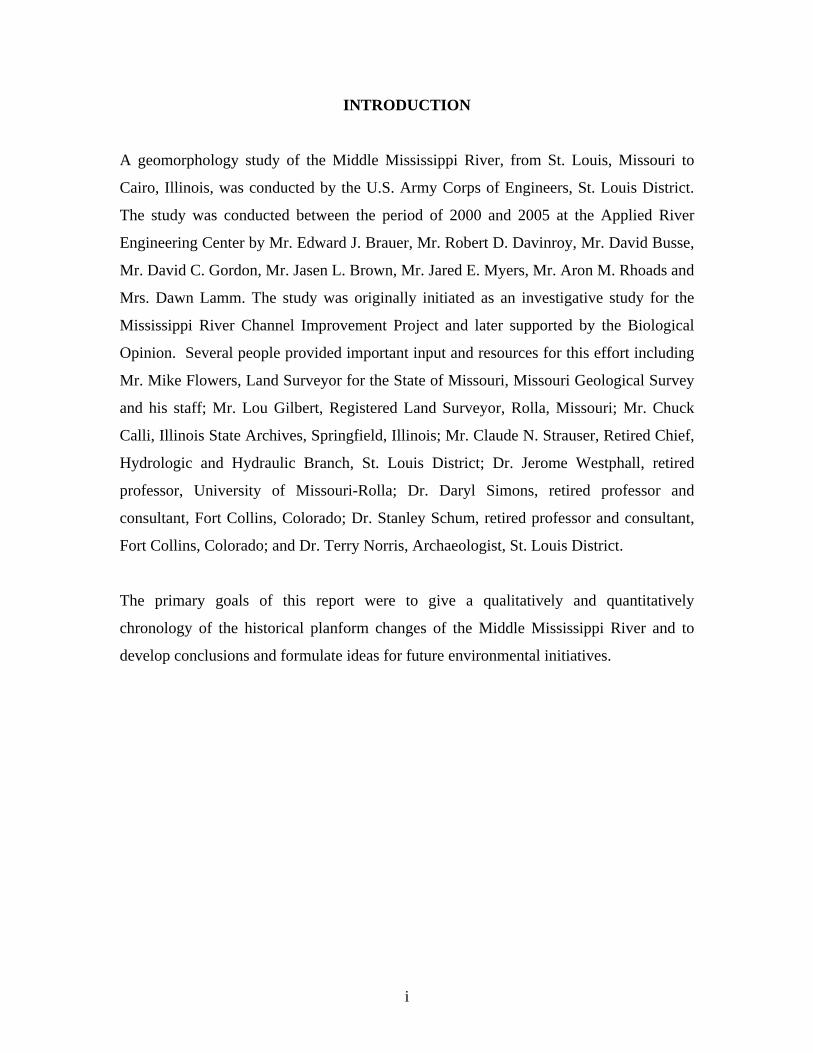
The geomorphology of approximately 180 miles of the Middle Mississippi River (MMR)
was analyzed in this study, from St. Louis, Missouri, Mile 180.0, to the confluence of the
Mississippi and Ohio Rivers, Mile 0.0. Figure 1 is a vicinity and location map of the
area. Primary tributaries between the mouth of the Ohio River and St. Louis, Missouri
include the Meramec, Kaskaskia and Big Muddy Rivers. The drainage area covers part
or all of twelve states including Montana, Wyoming, Colorado, North Dakota, South
Dakota, Nebraska, Kansas, Wisconsin, Iowa, Missouri, Michigan and Illinois.
BASIN GEOLOGY
Most scientists believe the geology of the Mississippi River basin was formed by the
advance and retreat of the continental glaciers. The glaciers were approximately 5,000 to
10,000 feet thick and covered hundreds of thousands of square miles. The advance and
retreat of the glaciers scoured the earth and created many lakes, most of which can be
found in the northern part of the basin (Davinroy, 2005).
Figure 1: Location of Study Reach
Study Reach
2
The retreat of the glaciers produced enormous flows along with massive chunks of ice
that worked to carve out the valleys. During the retreat of the glaciers, over five hundred
feet of glacial till were deposited in some areas of the basin. The glacial till consisted of
silts, clays, sands and gravels.
GENERAL RIVER CHARASTERISTICS
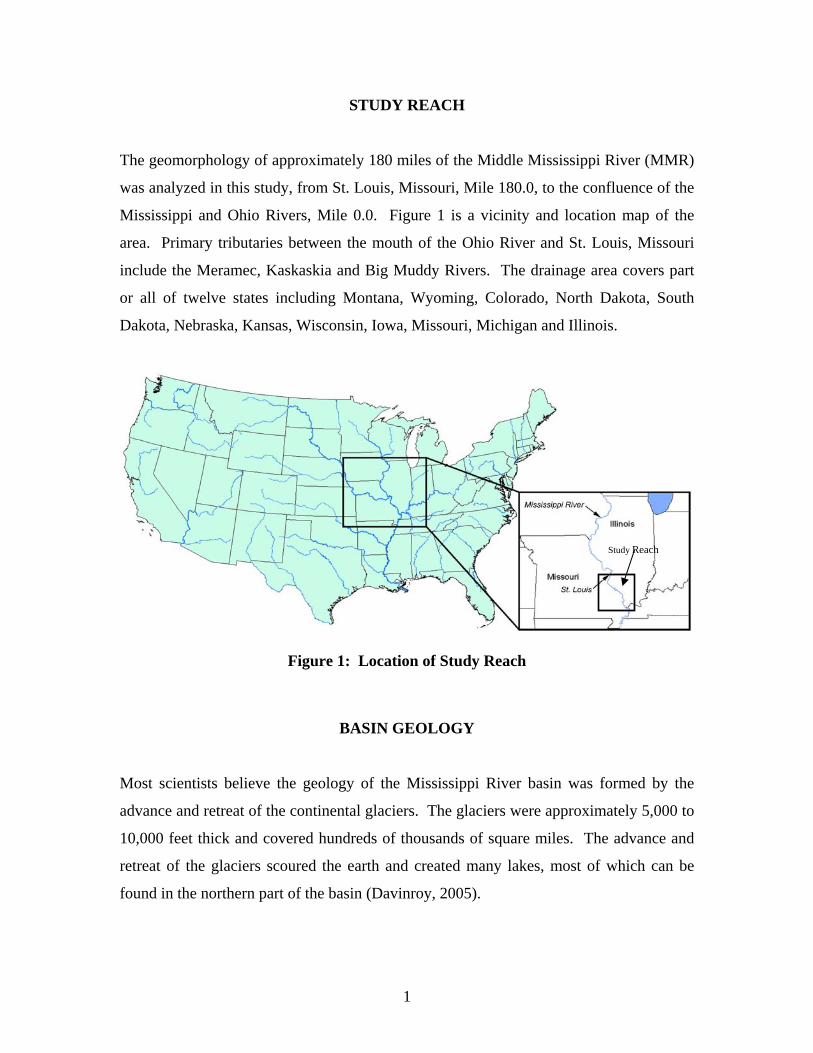
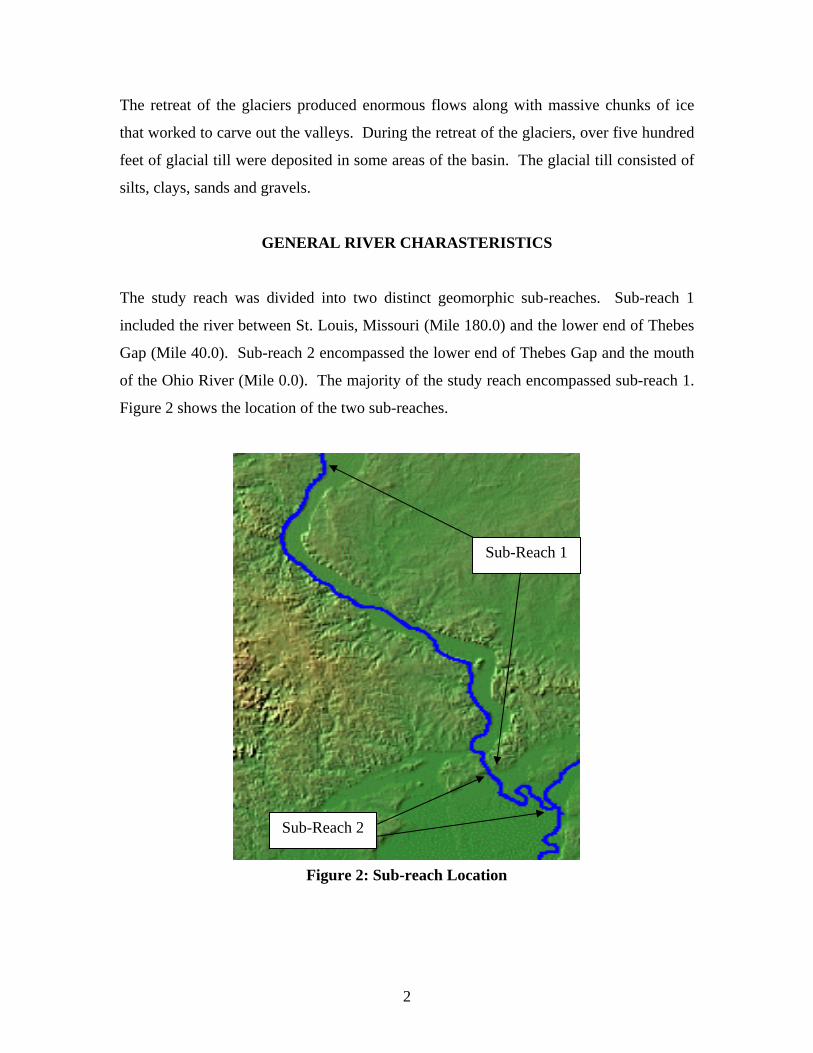
The study reach was divided into two distinct geomorphic sub-reaches. Sub-reach 1
included the river between St. Louis, Missouri (Mile 180.0) and the lower end of Thebes
Gap (Mile 40.0). Sub-reach 2 encompassed the lower end of Thebes Gap and the mouth
of the Ohio River (Mile 0.0). The majority of the study reach encompassed sub-reach 1.
Figure 2 shows the location of the two sub-reaches.
Figure 2: Sub-reach Location
Sub-Reach 1
Sub-Reach 2

3
In sub-reach 1 the floodplain width varies between 10,000 feet and 40,000 feet with an
average floodplain width of approximately 31,000 feet. The channel (bank to bank) in
this reach varies between 1400 feet and 3800 feet wide. The corresponding floodplain
width to channel width ratio varies between 7 and 10. The river in this reach may be
classified as a mildly sinuous canaliform, characterized by narrow crescent-shaped point
bars, a notably uniform width, a lack of braiding, and low to moderate sinuosity. The
material found in the floodplain is predominantly alluvium in the form of fine sands, silts
and clays. Rock outcroppings and clay plugs are also abundant.
The floodplain width in sub-reach 2 varies between 10,300 feet to over 500,000 feet with
an average floodplain width of approximately 333,000 feet. The channel (bank to bank)
in this reach varies between 1000 feet and 7000 feet wide with an average channel (bank
to bank) width of approximately 5,000 feet. The ratio of floodplain width to channel
width ranges between approximately 5 and 200. The river in this reach can be classified
as a highly sinuous point bar canaliform, characterized by prominent point bars and lower
bank erosion resistance as compared to the characteristics found in sub-reach 1. The
average slope of the river along both reaches is approximately 0.5 ft per mile.
CLIMATE
The surrounding bi-state region of Missouri and Illinois which is adjacent to the MMR
has a temperate, semi-humid climate characterized by a mean annual precipitation and
temperature of 37.5 inches and 56.2 degrees Fahrenheit, respectively (Degenhardt, 1973)
HISTORY
Most early settlements were located along a body of water. The water was a source of
food, transportation and fertile soil. The MMR Basin was no exception. Just south of the
confluence of the Missouri and Mississippi Rivers, was the home to one of the largest
prehistoric sites in North America. At its peak, Cahokia, Illinois covered nearly six
square miles and had a population of up to 20,000. “The discovery of prehistoric river
craft, such as the Ringler dugout, a wooden canoe, is evidence that Native Americans

4
used the river systems as highways of transportation and trade at least three thousand
years prior to the arrival of Europeans in North America”(Norris, 1997).
Beginning in the sixteenth century European empires sent explorers to America to stake
claims to the new land. The first European to discover the Mississippi River was the
Spanish explorer Hernando De Soto. De Soto and his expedition discovered the
Mississippi River in 1541 at a site near present day Memphis, Tennessee. Over one
hundred years later in 1673, French missionary Jaques Marquette lead the first European
exploration of the Upper Mississippi River.
Two of the most famous early river travelers were Captain Meriwether Lewis and
William Clark. Following the Louisiana Purchase in 1803, Thomas Jefferson selected
Lewis and Clark to find “the most direct and practicable water communication across this
continent for the purpose of commerce.” Prior to their famous Corps of Discovery
Expedition, Lewis and Clark traveled up the Mississippi River from the Ohio River to
Camp River Dubois where they began their westward journey. Along the journey up the
Mississippi to Camp River Dubois, Lewis and Clark stopped at the Illinois town of
Kaskaskia where they recruited twelve new soldiers, obtained a second pirogue and hired
French boatmen to assist in their expedition.
During the seventeenth and early eighteenth centuries French explorers established
settlements along the Mississippi River at the confluence of other large rivers such as the
Missouri, Illinois, Ohio and Arkansas in quest of minerals and furs. Cahokia, Illinois
founded in 1699, was the earliest French settlement still in existence. Next to be
established was Kaskaskia, Illinois which was followed by a series of east bank towns at
Prairie du Pont, Illinois Fort Chartres, Illinois, Fort Vincennes, Illinois on the Wabash.
Settlements by the French on the west bank of the Mississippi included Ste. Genevieve,
Missouri and New Madrid, Missouri, these were followed by St. Louis, Missouri, St.
Charles, Missouri, Carondelet, Missouri in 1767, St. Ferdinand, Missouri (now
Florissant) and Portage des Sioux (“Physical Growth”). Like their predecessors, the
French explorers used the Mississippi River to transport passengers and goods.
5
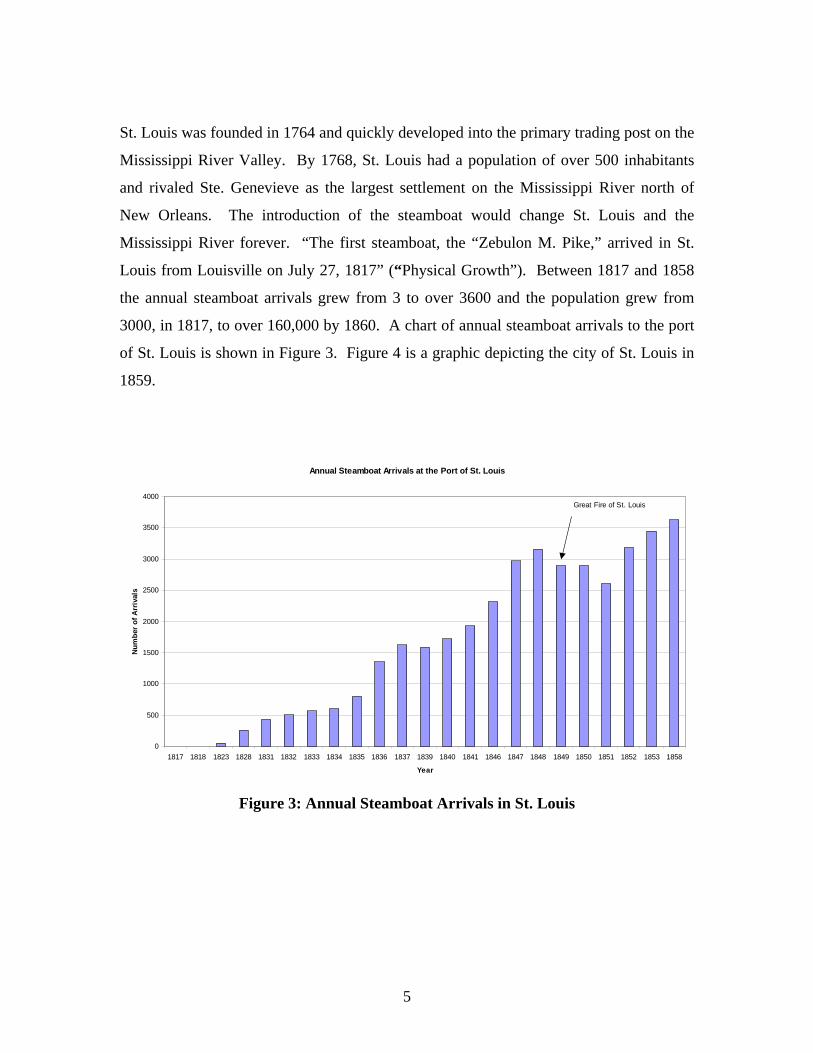
St. Louis was founded in 1764 and quickly developed into the primary trading post on the
Mississippi River Valley. By 1768, St. Louis had a population of over 500 inhabitants
and rivaled Ste. Genevieve as the largest settlement on the Mississippi River north of
New Orleans. The introduction of the steamboat would change St. Louis and the
Mississippi River forever. “The first steamboat, the “Zebulon M. Pike,” arrived in St.
Louis from Louisville on July 27, 1817” (“Physical Growth”). Between 1817 and 1858
the annual steamboat arrivals grew from 3 to over 3600 and the population grew from
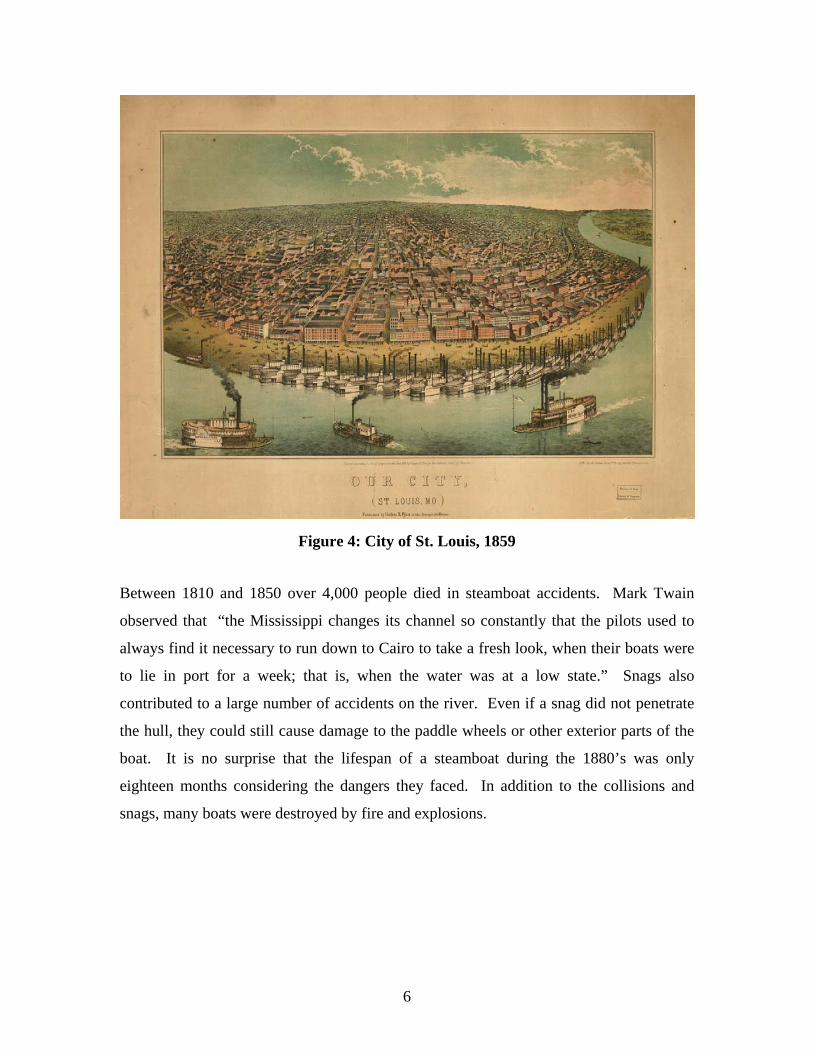
3000, in 1817, to over 160,000 by 1860. A chart of annual steamboat arrivals to the port
of St. Louis is shown in Figure 3. Figure 4 is a graphic depicting the city of St. Louis in
1859.
Annual Steamboat Arrivals at the Port of St. Louis
0
500
1000
1500
2000
2500
3000
3500
4000
1817 1818 1823 1828 1831 1832 1833 1834 1835 1836 1837 1839 1840 1841 1846 1847 1848 1849 1850 1851 1852 1853 1858
Year
Num
ber
of A
rriv
als
Great Fire of St. Louis
Figure 3: Annual Steamboat Arrivals in St. Louis
6
Between 1810 and 1850 over 4,000 people died in steamboat accidents. Mark Twain
observed that “the Mississippi changes its channel so constantly that the pilots used to
always find it necessary to run down to Cairo to take a fresh look, when their boats were
to lie in port for a week; that is, when the water was at a low state.” Snags also
contributed to a large number of accidents on the river. Even if a snag did not penetrate
the hull, they could still cause damage to the paddle wheels or other exterior parts of the
boat. It is no surprise that the lifespan of a steamboat during the 1880’s was only
eighteen months considering the dangers they faced. In addition to the collisions and
snags, many boats were destroyed by fire and explosions.
Figure 4: City of St. Louis, 1859

7
RIVER TRAINING STRUCTURES
The first river training structures constructed in the MMR were engineered by Lt. Robert
E. Lee in 1838 to move the navigation channel from the Illinois bank to the Missouri
bank. The structures were necessary because “the obvious tendency of the river is to
open itself a channel on the Illinois side, eventually to fill with alluvium and to desert the
Missouri channel, which constitutes the harbor,” as stated in House Document Number 2,
1843. Lee used a system of dikes to move the main channel back towards the Missouri
shore and incorporate Bloody Island, a large sandbar in St. Louis Harbor, into the Illinois
shore line. Figure 6 is an 1837 Map of St. Louis Harbor showing the proposed dike and
revetment locations.
Figure 5: Sunken Steamboat

8
Figure 6: Map of the Harbor of St. Louis, 1837
After the construction of the dikes in St. Louis Harbor by Lt. Robert E. Lee, the Federal
Government did not construct another river training structure in the river until 1872. The
main focus of work shifted to snagboat operations.
In 1879, the Federal Government began developing a coordinated plan for the Mississippi
River with the establishment of the Mississippi River Commission (MRC). The purpose
of the MRC was to “improve and give safety and ease to navigation” and to “prevent
destructive floods” on the Mississippi River. The MRC was a seven member advisory
board that consisted of three representatives from the U.S. Army Corps of Engineers, one
representative from the Coast and Geodetic Survey, and three civilians, at least two of
whom were required to be engineers. All members of the MRC were appointed by the
President of the United States and confirmed by the Senate. All MRC work was done
through the U.S. Army Corps of Engineers, which was also responsible for supplying
necessary plants and equipment (“Mississippi River”).
The master plan for the channel stabilization works along the MMR was to “to make the
improvement continuous, working downstream from St. Louis, by reclaiming land and
Proposed Dike
Proposed Revetment
9
building up new banks, thus reducing the width of the river to the uniform width of about
2500 feet” (Ernst, 1881). This plan was based on the idea, observed by Captain O.H.
Ernst, that "The shoals in the Mississippi are constantly shifting their position, and there
are very few spots now occupied by them where there has not been deep water within a
recent period. It is pretty well established that there was in former years a depth of water
throughout the navigable channel at the lowest stage at least equal to what we shall
endeavor to obtain by our works” (Ernst, 1880). All of the construction was intended
“simply to restore what once existed and to do it in such a way that the restoration shall
be permanent” (Ernst, 1881).
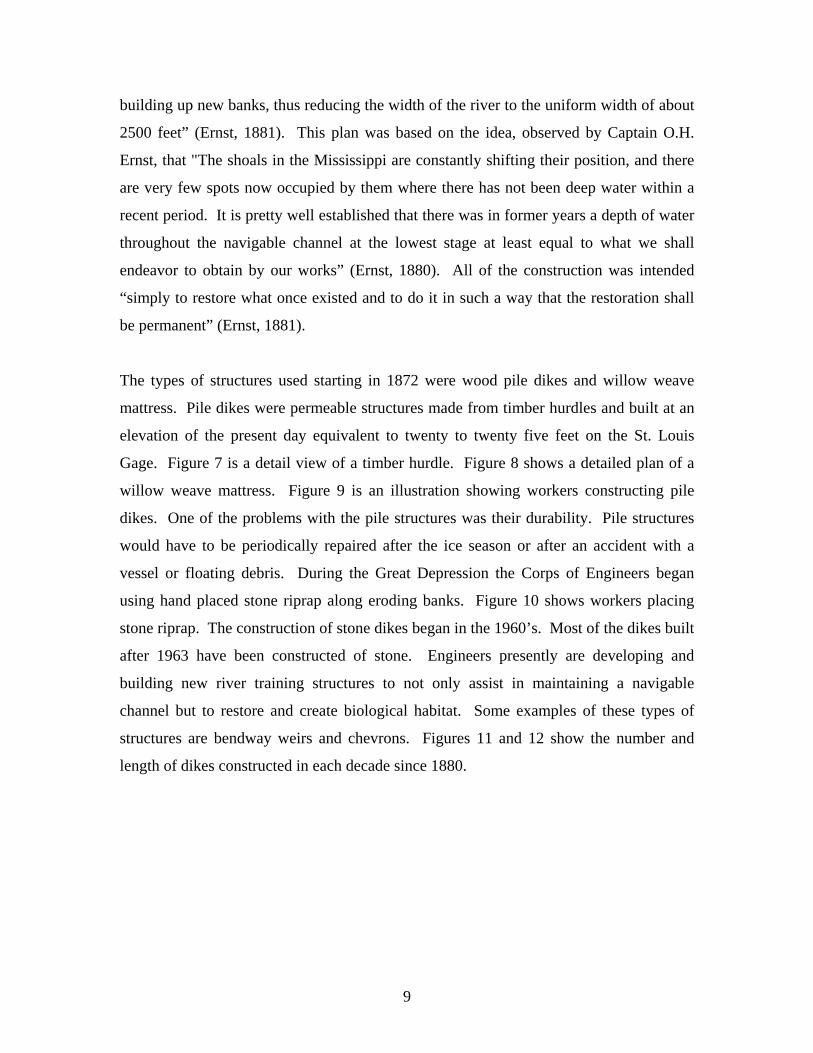
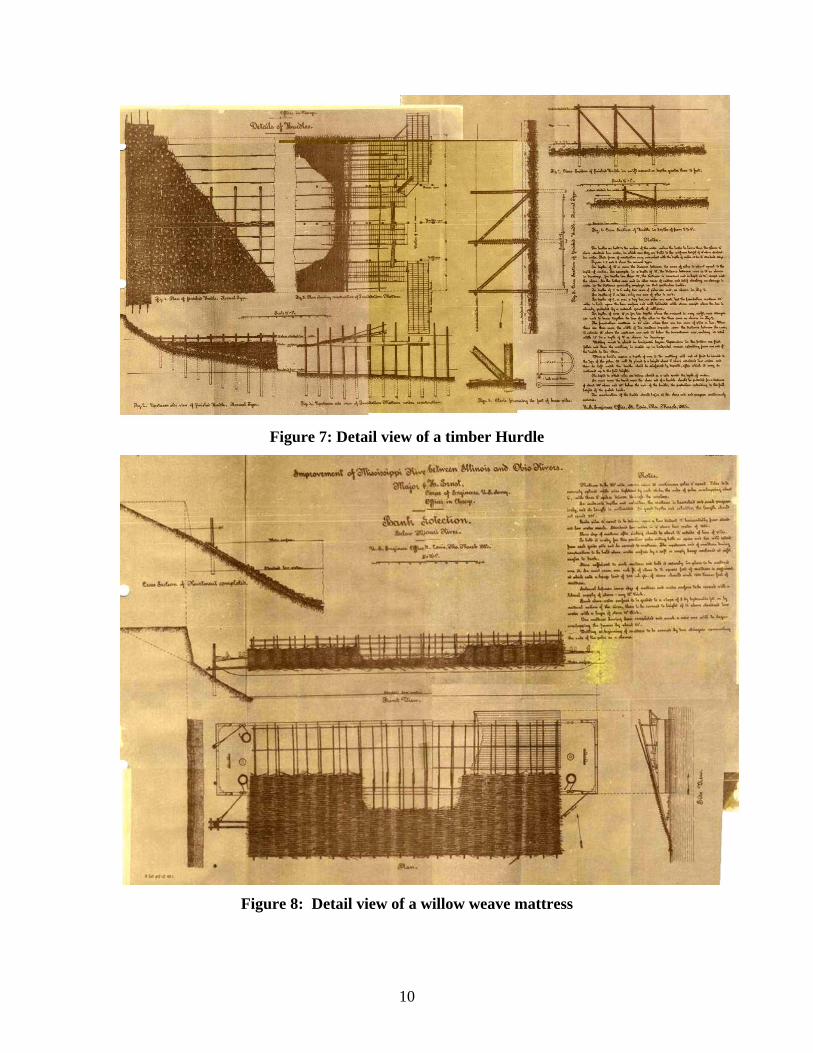
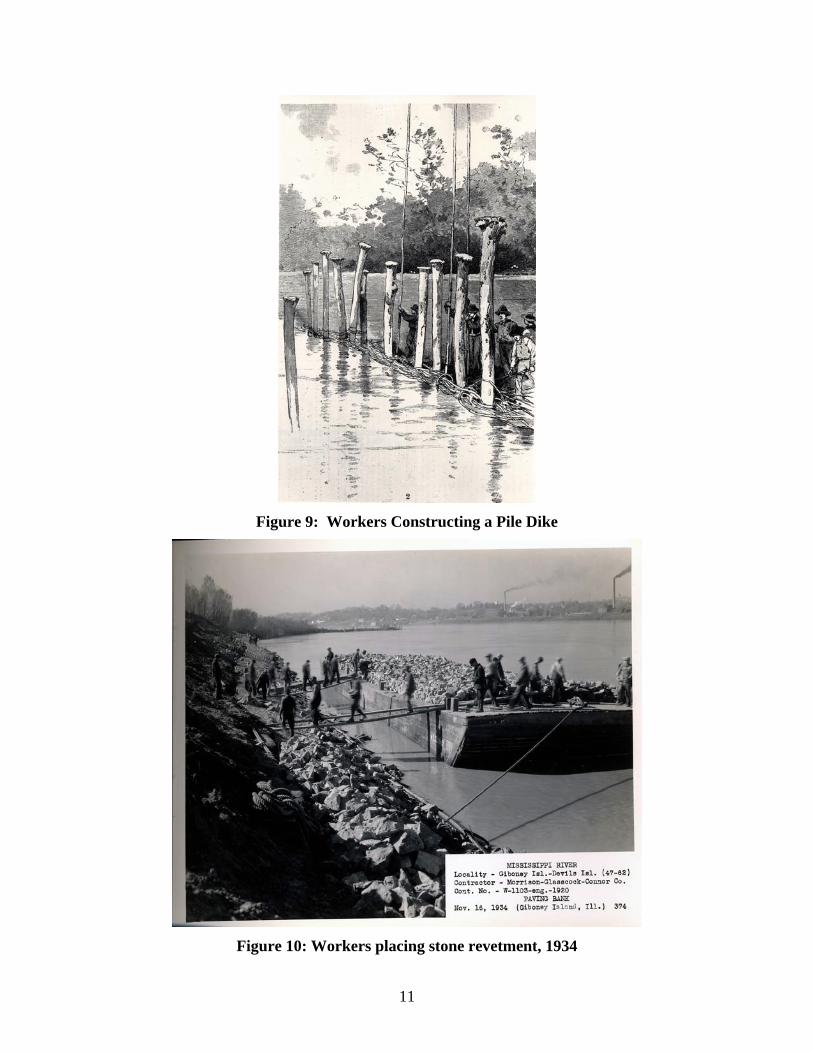
The types of structures used starting in 1872 were wood pile dikes and willow weave
mattress. Pile dikes were permeable structures made from timber hurdles and built at an
elevation of the present day equivalent to twenty to twenty five feet on the St. Louis
Gage. Figure 7 is a detail view of a timber hurdle. Figure 8 shows a detailed plan of a
willow weave mattress. Figure 9 is an illustration showing workers constructing pile
dikes. One of the problems with the pile structures was their durability. Pile structures
would have to be periodically repaired after the ice season or after an accident with a
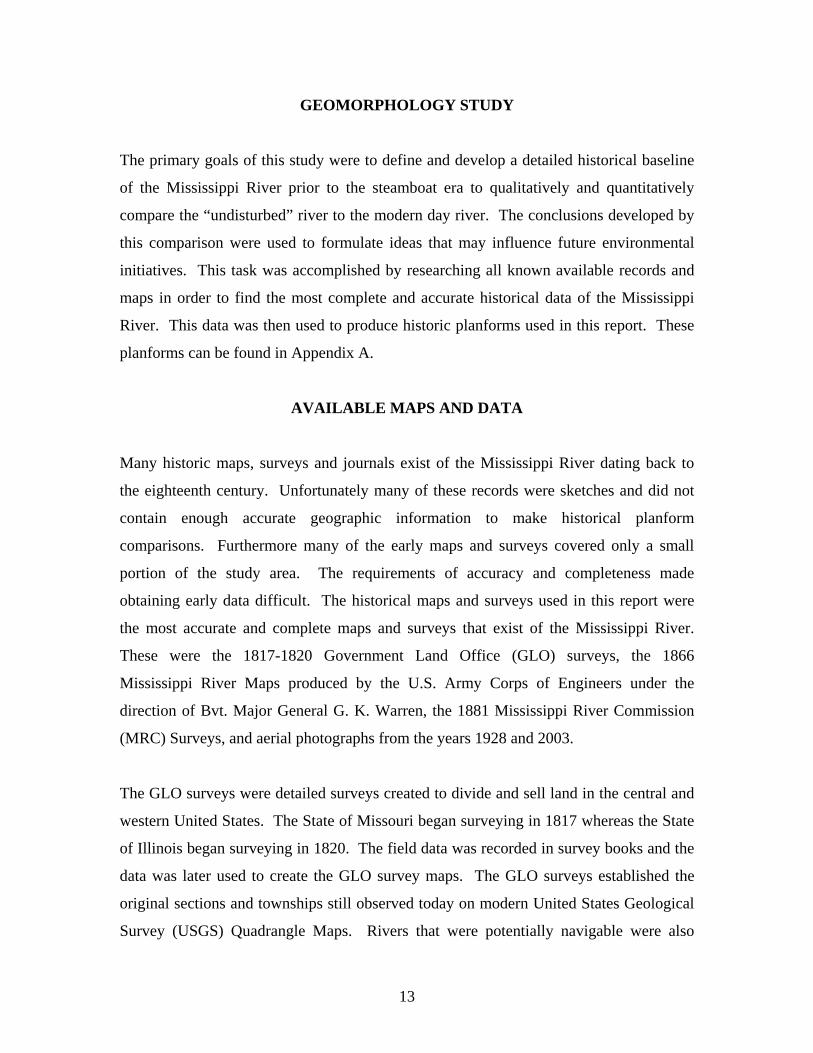
vessel or floating debris. During the Great Depression the Corps of Engineers began
using hand placed stone riprap along eroding banks. Figure 10 shows workers placing
stone riprap. The construction of stone dikes began in the 1960’s. Most of the dikes built
after 1963 have been constructed of stone. Engineers presently are developing and
building new river training structures to not only assist in maintaining a navigable
channel but to restore and create biological habitat. Some examples of these types of
structures are bendway weirs and chevrons. Figures 11 and 12 show the number and
length of dikes constructed in each decade since 1880.
10
Figure 7: Detail view of a timber Hurdle
Figure 8: Detail view of a willow weave mattress
11
Figure 9: Workers Constructing a Pile Dike
Figure 10: Workers placing stone revetment, 1934

12
Number of New Dikes Constructed
445
63
13
125
250
117
27
7754
72
5
40
0
50
100
150
200
250
300
350
400
450
500
1880-1900 1900-1910 1910-1920 1920-1930 1930-1940 1940-1950 1950-1960 1960-1965 1965-1970 1970-1980 1980-1990 1990-1997
Time Span
Figure 11: Number of Dikes Constructed
New Dike Construction Length (mi)
104.6
11.8
1.3
16.2
26.9
11.6
2.1
8.95.8
10.3
0.73.7
0.0
20.0
40.0
60.0
80.0
100.0
120.0
1880-1900 1900-1910 1910-1920 1920-1930 1930-1940 1940-1950 1950-1960 1960-1965 1965-1970 1970-1980 1980-1990 1990-1997
Time Span
Figure 12: Length of Dikes Constructed
13
GEOMORPHOLOGY STUDY
The primary goals of this study were to define and develop a detailed historical baseline
of the Mississippi River prior to the steamboat era to qualitatively and quantitatively
compare the “undisturbed” river to the modern day river. The conclusions developed by
this comparison were used to formulate ideas that may influence future environmental
initiatives. This task was accomplished by researching all known available records and
maps in order to find the most complete and accurate historical data of the Mississippi
River. This data was then used to produce historic planforms used in this report. These
planforms can be found in Appendix A.
AVAILABLE MAPS AND DATA
Many historic maps, surveys and journals exist of the Mississippi River dating back to
the eighteenth century. Unfortunately many of these records were sketches and did not
contain enough accurate geographic information to make historical planform
comparisons. Furthermore many of the early maps and surveys covered only a small
portion of the study area. The requirements of accuracy and completeness made
obtaining early data difficult. The historical maps and surveys used in this report were
the most accurate and complete maps and surveys that exist of the Mississippi River.
These were the 1817-1820 Government Land Office (GLO) surveys, the 1866
Mississippi River Maps produced by the U.S. Army Corps of Engineers under the
direction of Bvt. Major General G. K. Warren, the 1881 Mississippi River Commission
(MRC) Surveys, and aerial photographs from the years 1928 and 2003.
The GLO surveys were detailed surveys created to divide and sell land in the central and
western United States. The State of Missouri began surveying in 1817 whereas the State
of Illinois began surveying in 1820. The field data was recorded in survey books and the
data was later used to create the GLO survey maps. The GLO surveys established the
original sections and townships still observed today on modern United States Geological
Survey (USGS) Quadrangle Maps. Rivers that were potentially navigable were also
14
surveyed by the deputy surveyors. This was accomplished by establishing a baseline
parallel to the river and measuring perpendicular lines to strategic points or “meander
lines”.
The GLO surveys were surprisingly accurate considering the rough terrain encountered
by the surveyors and antiquated surveying equipment they used. With that said there was
much room for error, especially when surveying the river. At the time the surveys were
being conducted, the Government was in need of money and the surveyors were
instructed to get the land surveyed quickly so the divided land could be sold. It should be
noted that in some cases, features in the river such as islands too small to sell were not
included on the maps or were not surveyed accurately depending on the surveyor.
The “Maps of the Mississippi River from the Junction of the Minnesota to the Junction of
the Ohio River in 22 Sheets” produced under the direction of Bvt. Major General G. K.
Warren, U.S. Army Corps of Engineers, St. Louis District, 1869 were used as the source
of the 1866 planforms.
The source of the 1881 planform was detail maps of the Upper Mississippi River
published by the Mississippi River Commission. The sheets were projected and drawn
from actual surveys made under the direction of the MRC. The surveys were conduced
in the years 1880 to 1882, 1884, 1888, 1889, and 1891 to 1899. These maps were made
immediately following the creation of the MRC possibly as a baseline for the
construction of training structures.
An attempt was made to use “The Map of the Mississippi River Between the Mouth of
the Illinois and the Mouth of the Ohio Rivers” made from surveys under the direction of
Lt. Col. W.F. Raynolds and Col. Jas. H. Simpson between 1870 and 1878. These surveys
did not contain enough detailed control points to georeference to current land features
and therefore could not be used.
15
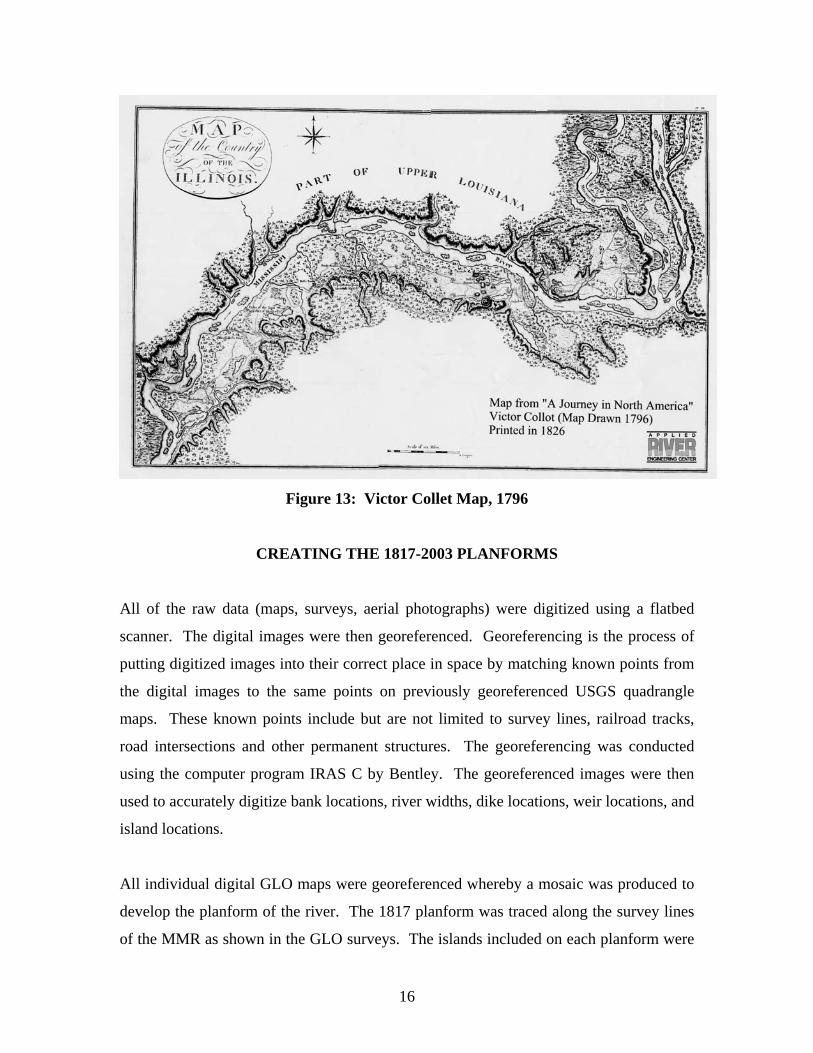
VICTOR COLLET MAP OF 1796
One of the earliest known charts is the Victor Collet map of the Middle Mississippi River
produced in 1796, shown in Figure 13. Some scientists consider this chart to be a good
example of the “natural state” of the river. After calculations were performed on this
chart, it was determined that the scale and features on the chart were distorted and could
not be considered as an accurate reference. By taking known geological point locations
that have remained constant over time some important observations were made of this
map: The representative river length on the Collet map was on the average thirty percent
shorter as compared to the actual river length. The representative lateral floodplain width
on the Collet Map, bluff to bluff, was on the average twenty six percent too wide as
compared to actual floodplain width. Furthermore, most of the river on the Missouri side
was not drawn properly in relation to the bluffs. It is known from the 1817, 1880 and
modern day maps that the planform of the river has been fixed mainly along the Missouri
bluffs. Collet’s chart shows the river being as much as twenty five hundred feet from
these bluffs. It is unlikely that the river could have moved twenty five hundred feet
towards the Missouri bluffs in the twenty one years between 1796 and 1817, therefore the
distance between the river and the Missouri Bluffs is a function of the distortion of the
drawing.
These problems resulted in a distorted drawing of the river. The distorted river length
and floodplain width make the river appear compressed on the map. These discrepancies
are evidence that the Victor Collet map is an artist’s rendering of the MMR and can not
be used for quantitative geomorphologic analysis.
16
Figure 13: Victor Collet Map, 1796
CREATING THE 1817-2003 PLANFORMS
All of the raw data (maps, surveys, aerial photographs) were digitized using a flatbed
scanner. The digital images were then georeferenced. Georeferencing is the process of
putting digitized images into their correct place in space by matching known points from
the digital images to the same points on previously georeferenced USGS quadrangle
maps. These known points include but are not limited to survey lines, railroad tracks,
road intersections and other permanent structures. The georeferencing was conducted
using the computer program IRAS C by Bentley. The georeferenced images were then
used to accurately digitize bank locations, river widths, dike locations, weir locations, and
island locations.
All individual digital GLO maps were georeferenced whereby a mosaic was produced to
develop the planform of the river. The 1817 planform was traced along the survey lines
of the MMR as shown in the GLO surveys. The islands included on each planform were
17
defined as the islands marked to contain vegetation. The 1866 planform was extracted
from the river boundaries defined by the “Mississippi Maps” created by the U.S. Army
Corps of Engineers under the direction of Bvt. Major General G. K. Warren. The 1880
planform was extracted from the river boundaries defined in the MRC hydrographic
surveys. The 1928 and 2003 planforms were defined by the first line of permanent
vegetation on the riverbanks in the aerial photographs. The 1928 aerial photographs were
flown on October 5, 1928. The Mississippi River gage at St. Louis, MO when the aerial
photographs were flown was 10.20.
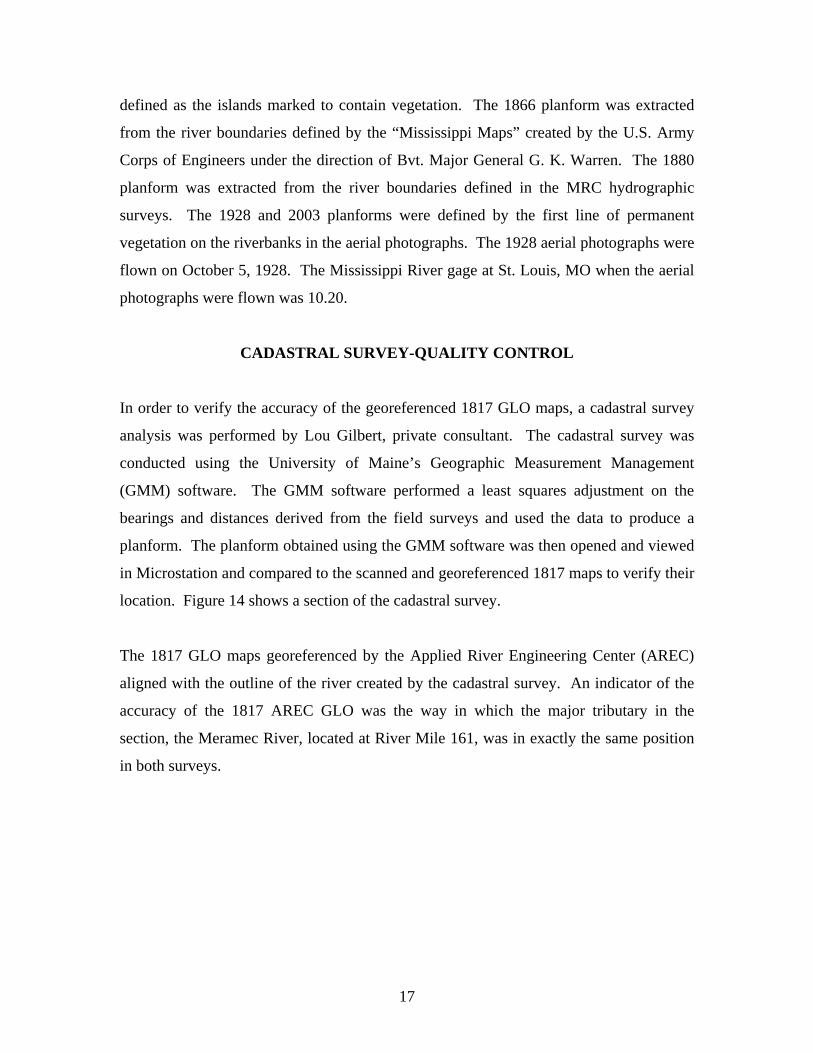
CADASTRAL SURVEY-QUALITY CONTROL
In order to verify the accuracy of the georeferenced 1817 GLO maps, a cadastral survey
analysis was performed by Lou Gilbert, private consultant. The cadastral survey was
conducted using the University of Maine’s Geographic Measurement Management
(GMM) software. The GMM software performed a least squares adjustment on the
bearings and distances derived from the field surveys and used the data to produce a
planform. The planform obtained using the GMM software was then opened and viewed
in Microstation and compared to the scanned and georeferenced 1817 maps to verify their
location. Figure 14 shows a section of the cadastral survey.
The 1817 GLO maps georeferenced by the Applied River Engineering Center (AREC)
aligned with the outline of the river created by the cadastral survey. An indicator of the
accuracy of the 1817 AREC GLO was the way in which the major tributary in the
section, the Meramec River, located at River Mile 161, was in exactly the same position
in both surveys.
18
To statistically verify acceptable accuracy between the cadastral survey and the planform
developed by AREC, an unpaired t-test was performed using the methods outlined in
Biostatistical Analysis (Zar, 1999). The data used to test the accuracy was the planform
width at one-half mile increments. Widths of the two planforms were taken along the
same line normal to the general direction of flow in the river. Twenty nine data points
were taken representing 14.5 miles of the planform. A box plot of the two data sets used
in the analysis is shown in Figure 15. The null hypothesis used in the analysis was that
the planform widths were the same. The analysis produced a t-value of 0.011907 and a p
value of 0.99. A p-value of 0.99 demonstrates that the probability of this result assuming
the null hypothesis (that the data is the same) is 99%, therefore the 1817 planform
developed by AREC is in substantial agreement with the cadastral survey.
Figure 14: Cadasteral survey Planform
Cadastral Survey Banklines
AREC Banklines

19
Figure 15: T-test Analysis Boxplot
DEFINITIONS
For this analysis, river width was defined as the distance between the vegetated banks
observed on all maps taken normal to the general direction of flow in the river. River
widths were measured at approximately half-mile increments along the centerline of the
planform.
River length was defined as the length of the river along the thalweg. The location of the
thalweg in the 1817 surveys required interpretation and judgment due to the insufficient
amount of data.
An island was defined as a body of land surrounded by water that contained vegetation.
Due to the insufficient amount of island data in the GLO, interpretation and judgment
were used. Islands with vegetation were clearly labeled on the 1881 surveys.
20
Sinuosity was defined as the ratio of thalweg channel length to the length of floodplain.
Wetted bank, or wetted perimeter, was defined as the length of all wetted edges including
banklines and island perimeters.
A side channel was defined as the smaller channel that resulted from a river being
divided into two or more channels by an island. In order to be considered a side channel,
the island must have vegetation.
Surface Area was defined as the total area submerged by the flow of the river at bankfull
stage.

21
PHYSICAL CHANGES
Average River Width of the Mississippi River From the Mouth of the Ohio River to St. Louis,MO
5026
6529
4380
2974
0
1000
2000
3000
4000
5000
6000
7000
1817 1881 1928 2003
Year
Ave
rage
Riv
er W
idth
(fee
t)
Figure 16: Average River Width
Planform widths for the years 1817, 1881, 1928 and 2003 are shown in Figure 16. The
planform width of the Mississippi River increased by approximately 1500 feet on the
average in the sixty four years between 1817 and 1881. The widespread construction of
river training structures began in the1880’s and lead to a decrease of over 2000 feet of
average planform width in the 47 years between 1881 and 1928. Between 1928 and
2003, the Corps began constructing the rock structures we see today. In the seventy five
years between 1928 and 2003, the planform width decreased by approximately 1400 feet.
The dramatic increase in planform width between 1817 and 1881, shown in Figure 16,
was in part the result of the capture of the Kaskaskia River at River Mile 118 in April
1881. This is shown in a map by Capt O.H. Ernst in Figure 17. This change in planform
created a large side channel between the new and old locations of the confluence of the
Mississippi and Kaskaskia Rivers. Over time, the flow into the original Mississippi River

22
channel decreased. With the construction of a levee, the north end of the original channel
has been cut off from the present river channel.
Figure 17: Map of the Mississippi River at Kaskaskia Bend Following the Capture of the Kaskaskia River
Capture of the Kaskaskia River
Approximate location of 2003 planform
23
Average River Width of the Mississippi River: Excluding the Kaskaskia Island Reach (RM 110-120)
From the Mouth of the Ohio River to St. Louis,MO
4957
5395
4415
2968
0
1000
2000
3000
4000
5000
6000
1817 1881 1928 2003
Year
Ave
rage
Riv
er W
idth
(fee
t)
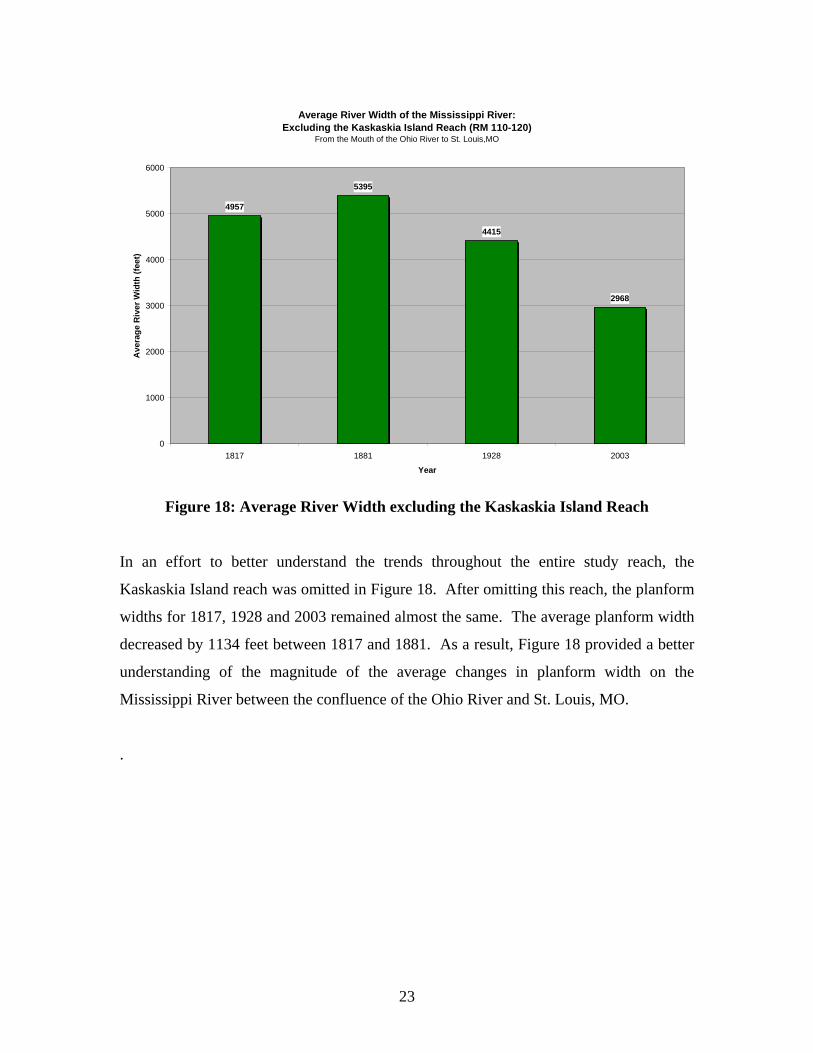
Figure 18: Average River Width excluding the Kaskaskia Island Reach
In an effort to better understand the trends throughout the entire study reach, the
Kaskaskia Island reach was omitted in Figure 18. After omitting this reach, the planform
widths for 1817, 1928 and 2003 remained almost the same. The average planform width
decreased by 1134 feet between 1817 and 1881. As a result, Figure 18 provided a better
understanding of the magnitude of the average changes in planform width on the
Mississippi River between the confluence of the Ohio River and St. Louis, MO.
.

24
Average Channel Width of the Mississippi River From the Mouth of the Ohio River to St. Louis,MO
34073676
3151
2348
14321164
743
553
0
1000
2000
3000
4000
5000
6000
1817 1881 1928 2003
Year
Ave
rage
Cha
nnel
Wid
th (f
eet)
Side ChannelMain Channel
Figure 19: Average Channel Width
Figure 19 shows the average channel width. Although the planform width increased by
1500 feet between 1817 and 1881, the total average channel width remained the same.
This is a result of the increased island area, which will be discussed later. After the
construction of river training structures began in 1881, both the main channel width and
side channel width began to decrease. The average side channel width also decreased
due to the construction of closure structures built to help maintain an adequate low water
navigation channel.
25
Channel Length of the Mississippi River From the Mouth of the Ohio River to St. Louis,MO
171 175 173 175
0
20
40
60
80
100
120
140
160
180
200
1817 1881 1928 2003
Year
Cha
nnel
Len
gth
(mi)
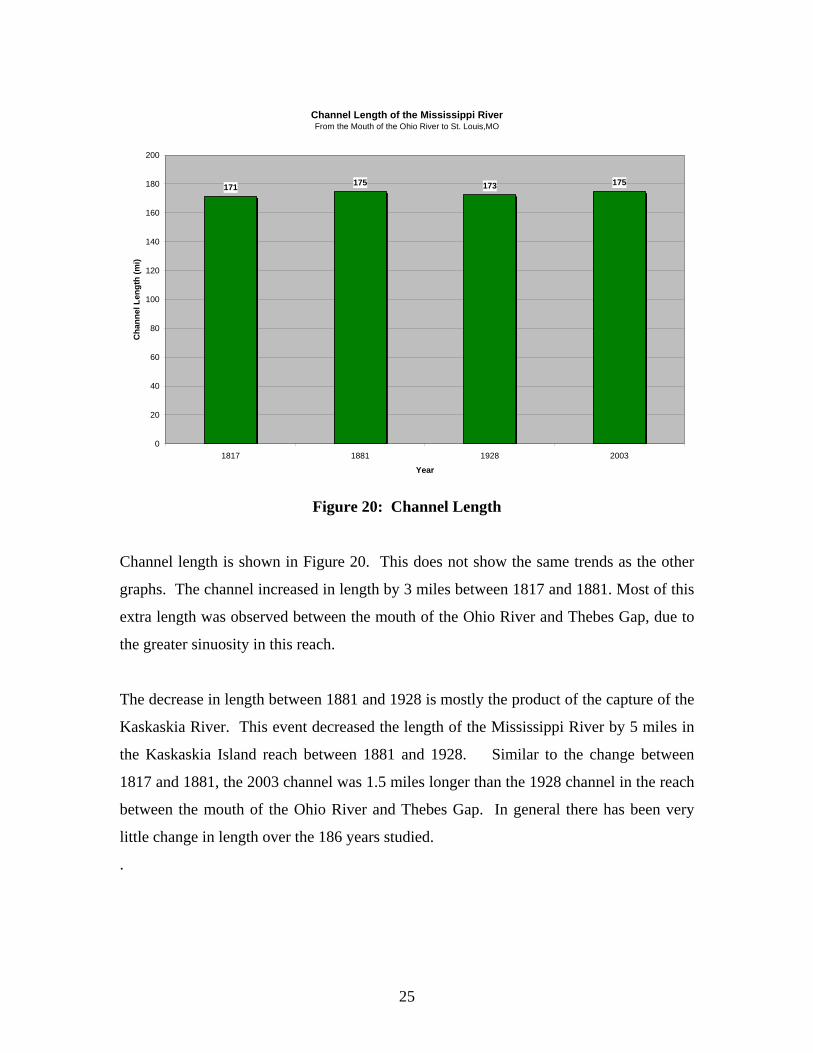
Figure 20: Channel Length
Channel length is shown in Figure 20. This does not show the same trends as the other
graphs. The channel increased in length by 3 miles between 1817 and 1881. Most of this
extra length was observed between the mouth of the Ohio River and Thebes Gap, due to
the greater sinuosity in this reach.
The decrease in length between 1881 and 1928 is mostly the product of the capture of the
Kaskaskia River. This event decreased the length of the Mississippi River by 5 miles in
the Kaskaskia Island reach between 1881 and 1928. Similar to the change between
1817 and 1881, the 2003 channel was 1.5 miles longer than the 1928 channel in the reach
between the mouth of the Ohio River and Thebes Gap. In general there has been very
little change in length over the 186 years studied.
.

26
Sinuosity of the Mississippi River From the Mouth of the Ohio River to St. Louis,MO
1.48
1.66 1.691.78
1.29 1.29 1.26 1.27
0.00
0.20
0.40
0.60
0.80
1.00
1.20
1.40
1.60
1.80
2.00
1817 1881 1928 2003
Year
Sinu
osity
Sub-Reach 2:From the Mouth of the Ohio to Thebes Gap
Sub-Reach 1:From Thebes Gap to St. Louis, MO
Figure 21: Sinuosity
The sinuosity of the Middle Mississippi River is shown in Figure 21. Since the study
reach includes two distinct reaches, sinuosity was broken down into the two-sub reaches.
From St. Louis, Missouri to Thebes Gap (sub-reach 1) the sinuosity has remained
relatively the same. The slight decrease in sinuosity between 1881 and 1928 in sub-reach
1 was the result of the capture of Kaskaskia River in 1881. Apart from the capture, the
overall length of sub-reach 1 has remained the same. The reach between Thebes Gap and
the mouth of the Ohio River (sub-reach 2) has been historically the most active reach in
the Middle Mississippi River. The sinuosity of sub-reach 2 has steadily increased over
the 186 years studied do to increased meandering.
27
Number of Islands in the Mississippi River From the Mouth of the Ohio River to St. Louis,MO
63
10097
58
0
20
40
60
80
100
120
1817 1881 1928 2003
Year
Num
ber o
f Isl
ands
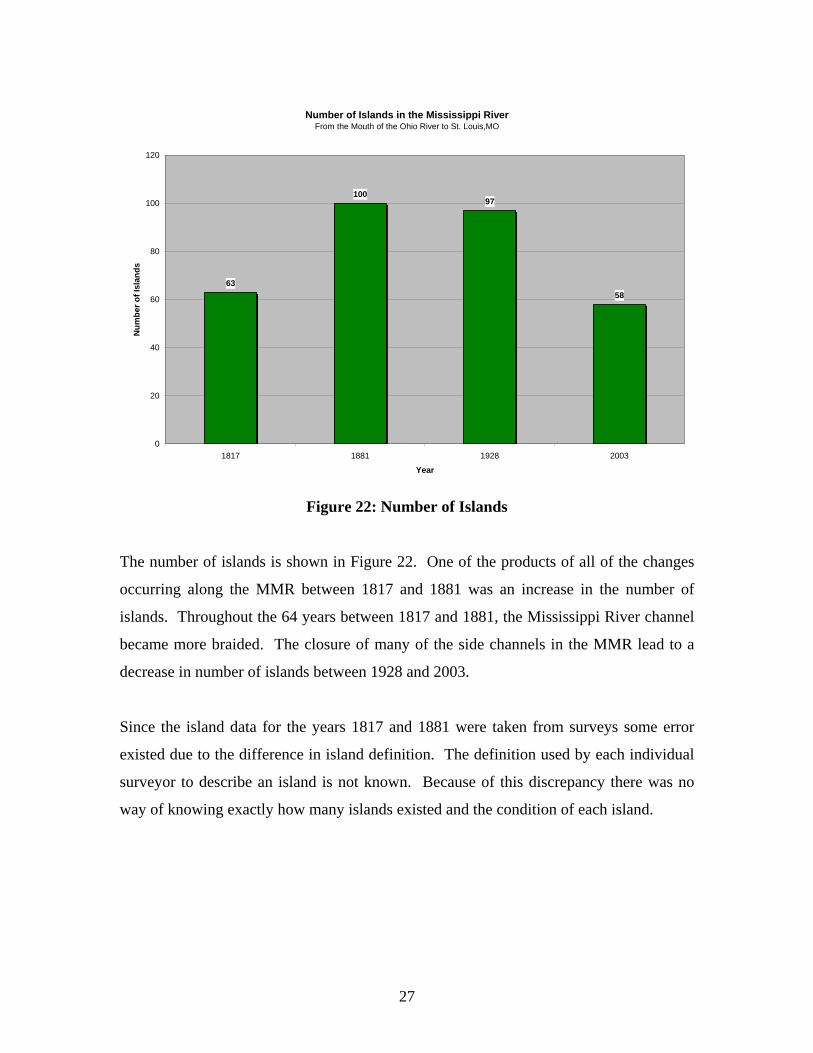
Figure 22: Number of Islands
The number of islands is shown in Figure 22. One of the products of all of the changes
occurring along the MMR between 1817 and 1881 was an increase in the number of
islands. Throughout the 64 years between 1817 and 1881, the Mississippi River channel
became more braided. The closure of many of the side channels in the MMR lead to a
decrease in number of islands between 1928 and 2003.
Since the island data for the years 1817 and 1881 were taken from surveys some error
existed due to the difference in island definition. The definition used by each individual
surveyor to describe an island is not known. Because of this discrepancy there was no
way of knowing exactly how many islands existed and the condition of each island.

28
Total Island Area of the Mississippi River From the Mouth of the Ohio River to St. Louis,MO
40.8
59.7
29.0
16.8
0.0
10.0
20.0
30.0
40.0
50.0
60.0
70.0
1817 1881 1928 2003
Year
Isla
nd A
rea
(mi2 )
Figure 23: Total Island Area
Average Island Area of the Mississippi River From the Mouth of the Ohio River to St. Louis,MO
0.65
0.60
0.30 0.29
0.00
0.10
0.20
0.30
0.40
0.50
0.60
0.70
1817 1881 1928 2003
Year
Ave
rage
Isla
nd A
rea
(mi2 )
Figure 24: Average Island Area
29
Figure 23 shows the total island area. Total island area in conjunction with the number of
islands is helpful in understanding the condition of the river. The dominant cause of the
increase in islands between 1817 and 1881 was the increased braiding, a product of the
conversion from a sinuous canaliform to a braided canaliform. A visual inspection of the
planforms in APPENDIX A shows a change in island alignment. Prior to the
construction of river training structures in 1881, large islands were scattered among the
channel and surrounded by wide side channels. After the construction of river training
structures, the islands were much smaller and were located away from the main channel
and surrounded by much narrower side channels. This is shown by the average island
area illustrated in Figure 24.
Surface Area of the Mississippi River From the Mouth of the Ohio River to St. Louis,MO
125.5
140.0
112.8
82.6
0.0
20.0
40.0
60.0
80.0
100.0
120.0
140.0
160.0
1817 1881 1928 2003
Year
Surf
ace
Are
a (m
i2 )
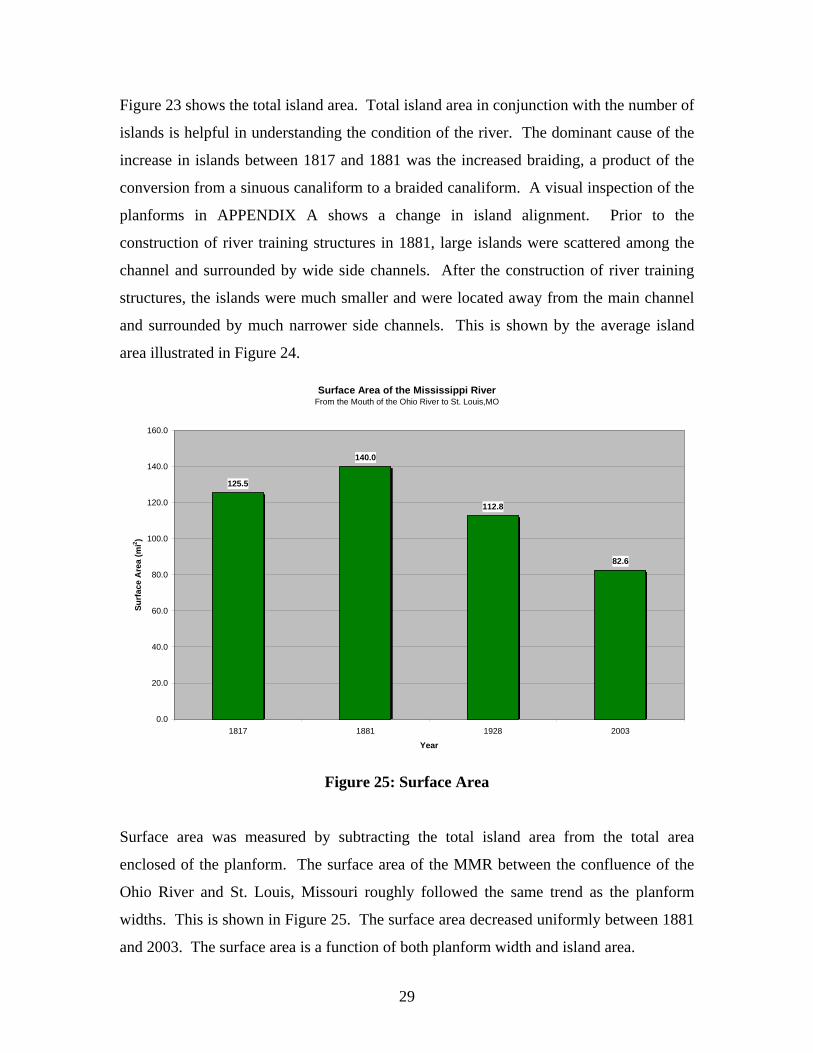
Figure 25: Surface Area
Surface area was measured by subtracting the total island area from the total area
enclosed of the planform. The surface area of the MMR between the confluence of the
Ohio River and St. Louis, Missouri roughly followed the same trend as the planform
widths. This is shown in Figure 25. The surface area decreased uniformly between 1881
and 2003. The surface area is a function of both planform width and island area.
30
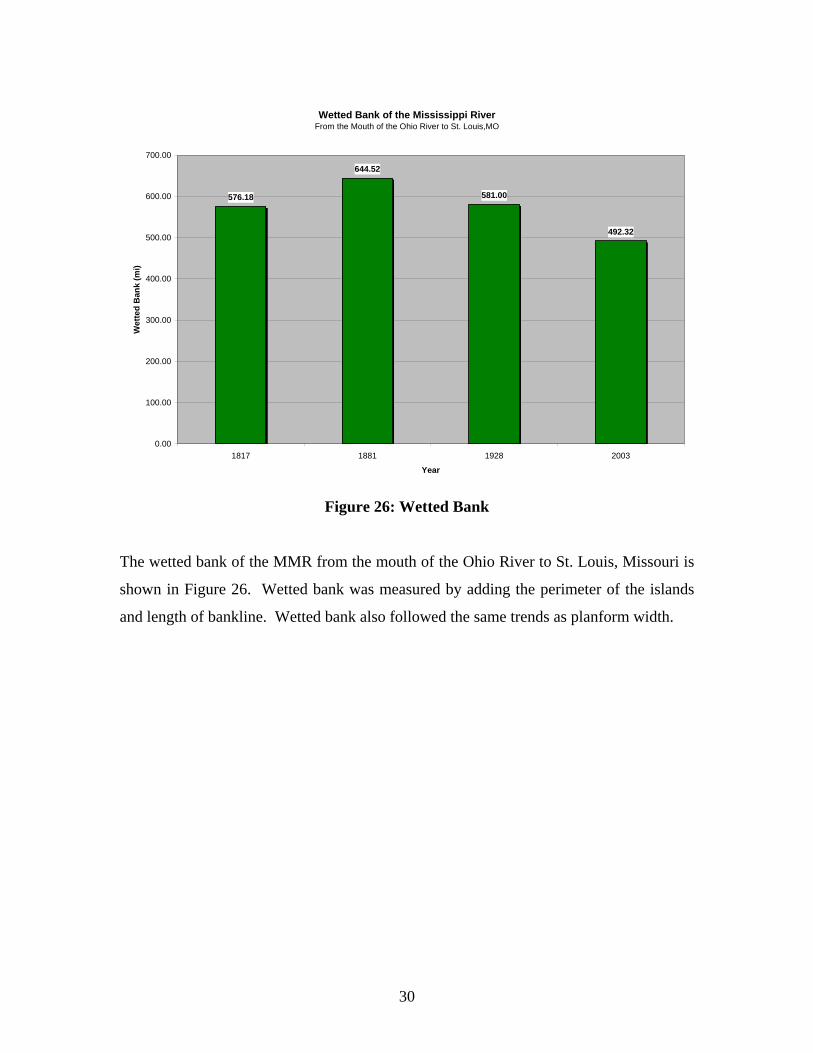
Wetted Bank of the Mississippi River From the Mouth of the Ohio River to St. Louis,MO
576.18
644.52
581.00
492.32
0.00
100.00
200.00
300.00
400.00
500.00
600.00
700.00
1817 1881 1928 2003
Year
Wet
ted
Ban
k (m
i)
Figure 26: Wetted Bank
The wetted bank of the MMR from the mouth of the Ohio River to St. Louis, Missouri is
shown in Figure 26. Wetted bank was measured by adding the perimeter of the islands
and length of bankline. Wetted bank also followed the same trends as planform width.

31
Cumulative Side Channel Length of the Mississippi River From the Mouth of the Ohio River to St. Louis,MO
123.2
157.4
121.2
67.4
0.0
20.0
40.0
60.0
80.0
100.0
120.0
140.0
160.0
180.0
1817 1881 1928 2003
Year
Cum
ulat
ive
Side
Cha
nnel
Len
gth
(mi)
Figure 27: Cumulative Side Channel Length
The cumulative side channel length, shown in Figure 27, increased between 1817 and
1881 with the increase in the number of islands. The cumulative side channel length
decreased between 1881 and 1928 with the decrease in the average size of the islands.
The decrease in cumulative side channel length 1928 and 2003 was caused by a decrease
in number of islands during the same time period.
In this study the MRC surveys were used to illustrate the extreme width of the
Mississippi River prior to the construction of river training structures. Since the surveys
were conduced in the years 1880 to 1882, 1884, 1888, 1889, and 1891 to 1899, some
river training structure construction had already been completed which narrowed the
planform width. When comparing the 1881 planform to the planforms of 1817 and 1866
some stretches along the banks showed an anomalous decrease in width as the result of
this construction. An effort was made to find another set of maps, charts, or surveys that
could be used to show the extreme width of the Mississippi River before any river
training structures were constructed. No other data could be found.

32
There were many stretches where the 1866 planform was wider than the planform of
1881. These areas were located mostly around St. Louis where structures were
constructed. Since the 1866 Bvt. Major General Warren maps start at Thebes Gap, a
comparison could only be made between Thebes Gap and St. Louis. This area was
isolated and the results are shown on Figure 28. The Kaskaskia Island reach was omitted
in order to better understand the average planform width throughout the study area.
The planform width in 1866 followed the trend between 1817 and 1881; the average
widening rate in the 49 years between 1817 and 1866 was 8.3 ft/yr whereas the average
widening rate in the 15 years between 1866 and 1881 was 8.5 ft/year.
Average River Width of the Mississippi River From Thebes Gap to St. Louis,MO, Excluding Kaskaskia Island Reach (RM 110-120)
4515
49235051
4354
2880
0
1000
2000
3000
4000
5000
6000
1817 1866 1881 1928 2003
Year
Ave
rage
Riv
er W
idth
(fee
t)
Figure 28: Average River Width, Thebes Gap to St. Louis
33
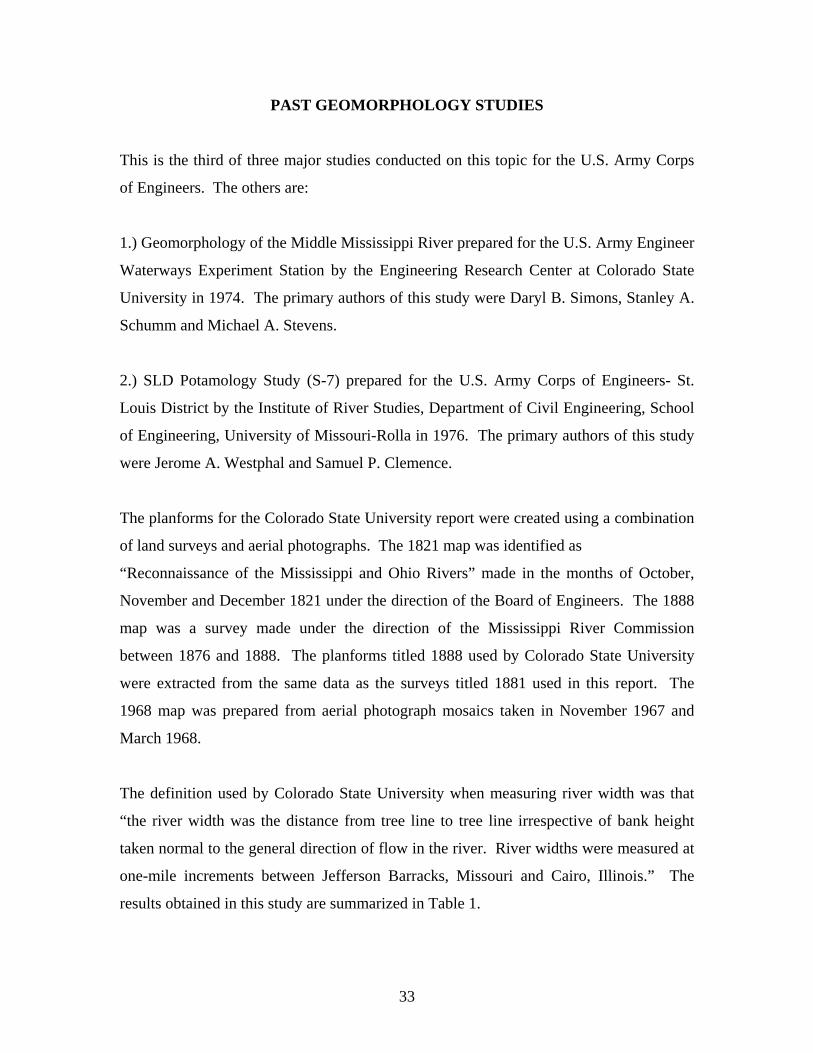
PAST GEOMORPHOLOGY STUDIES
This is the third of three major studies conducted on this topic for the U.S. Army Corps
of Engineers. The others are:
1.) Geomorphology of the Middle Mississippi River prepared for the U.S. Army Engineer
Waterways Experiment Station by the Engineering Research Center at Colorado State
University in 1974. The primary authors of this study were Daryl B. Simons, Stanley A.
Schumm and Michael A. Stevens.
2.) SLD Potamology Study (S-7) prepared for the U.S. Army Corps of Engineers- St.
Louis District by the Institute of River Studies, Department of Civil Engineering, School
of Engineering, University of Missouri-Rolla in 1976. The primary authors of this study
were Jerome A. Westphal and Samuel P. Clemence.
The planforms for the Colorado State University report were created using a combination
of land surveys and aerial photographs. The 1821 map was identified as
“Reconnaissance of the Mississippi and Ohio Rivers” made in the months of October,
November and December 1821 under the direction of the Board of Engineers. The 1888
map was a survey made under the direction of the Mississippi River Commission
between 1876 and 1888. The planforms titled 1888 used by Colorado State University
were extracted from the same data as the surveys titled 1881 used in this report. The
1968 map was prepared from aerial photograph mosaics taken in November 1967 and
March 1968.
The definition used by Colorado State University when measuring river width was that
“the river width was the distance from tree line to tree line irrespective of bank height
taken normal to the general direction of flow in the river. River widths were measured at
one-mile increments between Jefferson Barracks, Missouri and Cairo, Illinois.” The
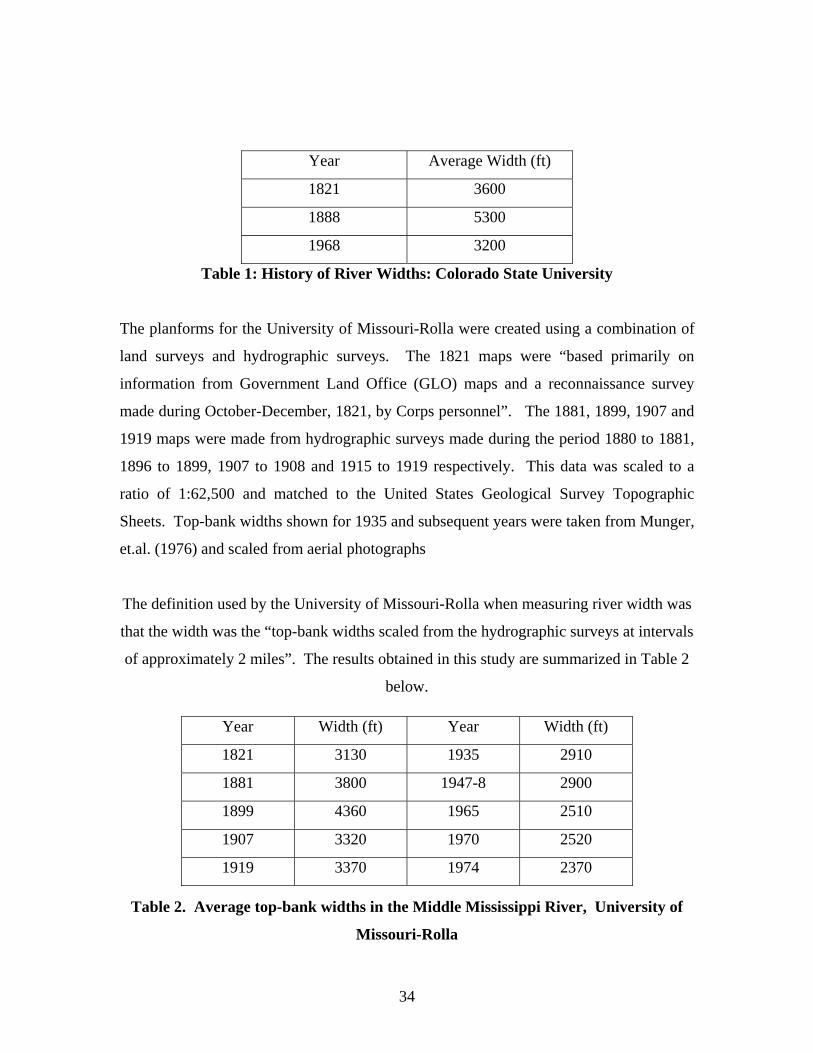
results obtained in this study are summarized in Table 1.
34
Year Average Width (ft)
1821 3600
1888 5300
1968 3200
Table 1: History of River Widths: Colorado State University
The planforms for the University of Missouri-Rolla were created using a combination of
land surveys and hydrographic surveys. The 1821 maps were “based primarily on
information from Government Land Office (GLO) maps and a reconnaissance survey
made during October-December, 1821, by Corps personnel”. The 1881, 1899, 1907 and
1919 maps were made from hydrographic surveys made during the period 1880 to 1881,
1896 to 1899, 1907 to 1908 and 1915 to 1919 respectively. This data was scaled to a
ratio of 1:62,500 and matched to the United States Geological Survey Topographic
Sheets. Top-bank widths shown for 1935 and subsequent years were taken from Munger,
et.al. (1976) and scaled from aerial photographs
The definition used by the University of Missouri-Rolla when measuring river width was
that the width was the “top-bank widths scaled from the hydrographic surveys at intervals
of approximately 2 miles”. The results obtained in this study are summarized in Table 2
below.
Table 2. Average top-bank widths in the Middle Mississippi River, University of
Missouri-Rolla
Year Width (ft) Year Width (ft)
1821 3130 1935 2910
1881 3800 1947-8 2900
1899 4360 1965 2510
1907 3320 1970 2520
1919 3370 1974 2370

35
DIFFERENCES IN STUDY RESULTS
A clear deviation in results exists between studies performed by Colorado State
University, University of Missouri-Rolla and AREC. This deviation is illustrated in
Table 3 and Figure 29. A large effort was made to understand the origin of the deviation
between the three studies.
Since such a deviation in results existed between the AREC study and previous studies,
quality control measures were used to assure the results obtained in the AREC study were
correct. These measures include performing a cadastral survey on the 1817 GLO data,
double checking the digital banklines for accuracy, and double checking the
measurements for accuracy.
Average Planform Width (feet)
University of
Missouri - Rolla
Colorado State
University
Applied River
Engineering Center
1821 3130 3600 5026 1881 3800 6529 1888 5300 1899 4360 1907 3320 1919 3370 1928 4380 1935 2910 1947 2900 1965 2510 1968 3200 1970 2520 1974 2370 2003 2974
Table 3: Average Planform Width in Each Study

36
Summary of Results: Average Planform Width
0
1000
2000
3000
4000
5000
6000
7000
1821 1881 1888 1899 1907 1919 1928 1935 1947 1965 1968 1970 1974 2003
Ave
rage
Pla
nfor
m W
idth
(fee
t)
University of Missouri-RollaColorado State UniversityAREC
Figure 29: Average Planform Width from Each Study
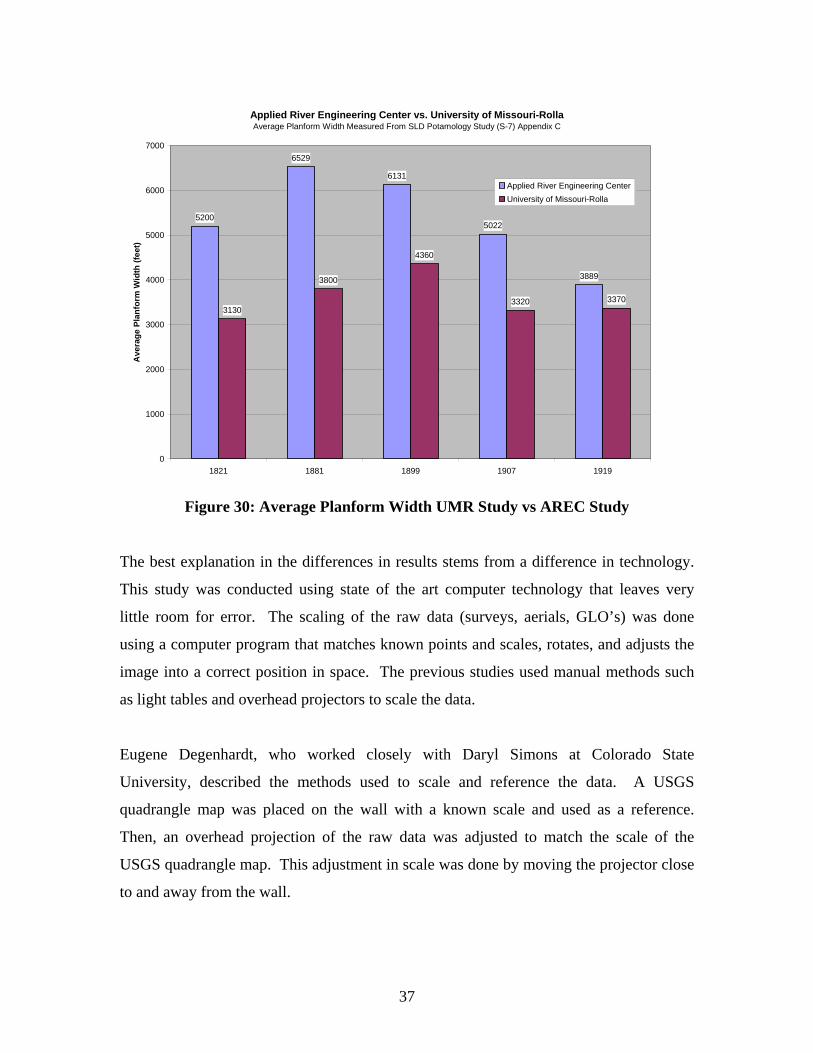
Figure 30 is a comparison of average river width measurements using the morphology
overlays from Appendix C of the Rolla Study. The banklines in the overlays were
scanned into digital format, georeferenced and traced. The digital banklines were then
measured and the results were compared to those published in Rolla Study. The purpose
of this exercise was to show the variation in results between the two studies. The
planforms measured by the Applied River Engineering Center was nearly the exact
planform used by the University of Missouri-Rolla. Although there are no globally
accepted results that can determine which study results are correct, an insight can be
found in the “Bank Protection on Mississippi and Missouri Rivers” report prepared under
the direction of the Chief of Engineers by Colonel T. H. Jackson in 1935. This report
stated that the average width of the Mississippi River between the mouths of the Missouri
and Ohio Rivers was 3500 feet. This width did not fit into the trend shown in the study
by the University of Missouri-Rolla.
37
Applied River Engineering Center vs. University of Missouri-RollaAverage Planform Width Measured From SLD Potamology Study (S-7) Appendix C
5200
6529
6131
5022
3889
3130
3800
4360
3320 3370
0
1000
2000
3000
4000
5000
6000
7000
1821 1881 1899 1907 1919
Ave
rage
Pla
nfor
m W
idth
(fee
t)
Applied River Engineering CenterUniversity of Missouri-Rolla
Figure 30: Average Planform Width UMR Study vs AREC Study
The best explanation in the differences in results stems from a difference in technology.
This study was conducted using state of the art computer technology that leaves very
little room for error. The scaling of the raw data (surveys, aerials, GLO’s) was done
using a computer program that matches known points and scales, rotates, and adjusts the
image into a correct position in space. The previous studies used manual methods such
as light tables and overhead projectors to scale the data.
Eugene Degenhardt, who worked closely with Daryl Simons at Colorado State
University, described the methods used to scale and reference the data. A USGS
quadrangle map was placed on the wall with a known scale and used as a reference.
Then, an overhead projection of the raw data was adjusted to match the scale of the
USGS quadrangle map. This adjustment in scale was done by moving the projector close
to and away from the wall.
38
The problems associated with this methodology are the obvious human error that is
introduced along with the limitation of not being able to morph the data to fit to the
USGS quadrangle map. Morphing is the process of stretching, rotating, and scaling a
digital image so all known points fit into their correct position in space. A good example
of this is the distortion found in all aerial photographs. Due to radial distortion the only
part of the photograph that has the correct scale is the direct center. The farther an object
is from the center of the picture the more distorted the scale. By using digitized images
and computer processing this error can be accounted for by morphing the picture.
There is also the possibility that a math error was the cause of the discrepancy. All of the
data collected in this study was stored and analyzed using a spreadsheet. In the previous
two studies all of the data was tabulated and calculated by hand. Daryl Simons and
Jerome Westphal, in phone conversations with Robert Davinroy agreed that a math error
could be the cause of the discrepancy.
SUMMARY/CONCLUSIONS
The MMR went through a transformation from a sinuous canaliform to a braided
canaliform in the 64 years between 1817 and 1881. Through the construction of river
training structures, the U.S. Army Corps of Engineers transformed the river back into a
sinuous channel over the past 122 years while maintaining a nine-foot low water channel
for navigation. The average planform width in 2003 is 59% of the planform width in
1817. Although side channel closure structures have eliminated some of the larger
islands, the Middle Mississippi River contains 82% of the number of islands and 81.7%
of the wetted bank observed in 1817.
In order to better understand the changes made to the Mississippi River over the past 186
years we must look at the historical perception of the river. In the years prior to 1817, the
Mississippi River was used primarily for protection from enemies, as a water supply, and
transportation. The introduction of the steamboat changed the river into a major means

39
of transporting goods and people. Since the major function of the Mississippi River at
that time was as a highway for steamboats, the main objective was to maintain a
navigable channel through the use of river training structures. This mindset existed for
over 150 years. Not until the modern environmental movement of the last 30 years was
the Mississippi River valued as a diverse and important ecosystem as well.
The modern environmental movement did not begin in this country until around 1962
with the publication of Silent Spring by Rachel Carson. Silent Spring, a book about the
effects of pesticides on songbird populations, lead to the introduction of modern ecology
and an increase in environmental awareness. Politicians took notice and passed the
National Environmental Policy Act in 1969 and created the Environmental Protection
Agency (EPA) in 1970. In 1972 the Clean Water Act was passed.
Since the introduction of the modern environmental movement the U.S. Army Corps of
Engineers, along with environmental federal and state agencies, has focused not only on
maintaining a safe and dependable navigation channel, but also on providing
environmental habitat and diversity. Over the past thirty-five years many changes have
been made to the navigation structures on the MMR to create and maintain aquatic
habitat. Some examples are rootless dikes, notched dikes, chevrons, bendway weirs and
the opening of previously closed side channels. These new structures along with
innovative river engineering can concurrently develop the modern day river channel and
achieve environmental restoration and sustainability.

40
FUTURE RESTORATION
The past study effort focused on establishing a better understanding of the historical
planform changes that have occurred on the Middle Mississippi River during European
settlement. This can be used to serve as reference for future restoration initiatives.
The desired future river does not necessarily have to resemble the river of 1817 to be
considered restored or environmentally sustainable. In fact, unless navigation ceases and
landowners evacuate the floodplain, this is a physical impossibility. However, with that
being said, modern river engineering methods combined with the latest fisheries and
waterfowl management strategies can develop a river that achieves all of the goals of a
healthy ecosystem.
A tremendous opportunity for creating new habitat above and beyond the constraints of
the planform rests on the fact that a substantial amount of land exists alongside most of
the river between the riverbanks and the agricultural levees. This land is mostly in
private ownership. A very small portion of it is actually farmed because most of the area
is subject to periodic flooding. Hence, most of the land is forested. There also exists
many small lakes formed by borrow areas created by the construction of the levees.
Unlike many of the rivers in Europe where restoration has been limited because the
levees have been constructed along or near the riverbanks, a far greater potential for
additional river restoration exists on the Middle Mississippi River.
Within this land exist old remnant channels, sloughs, oxbows, and wetlands. Over time
many of these features have become filled with sediment, making them barely
discernable or in many cases non-existent. Using ground based excavation, dredging,
and/or a combination of river engineering structures, these features can be restored and
connected to the modern day river, producing a new river planform never before seen or
realized.

41
Examining a variety of data including the historical planforms, aerial photography, and
conducting field reconnaissance, a blueprint for restoration was developed. This
blueprint utilized many of the historical remnant features while at the same time
considering the preservation of the navigation channel and ensuring the integrity of the
levees. Any of these conceptual additions to the existing planform are possible, but
collaboration among the stakeholders is paramount for these efforts to become a reality.
The blueprint serves as a reference for what the river may look like in the future, but may
easily be modified according to specific needs, constraints, or other considerations.
Blueprint for restoration can be found in Appendix A.
The proposed restoration shown in the blueprint for restoration reclaims 965 feet of
average planform width. This is approximately 50% of the difference in average
planform width between 2003 and 1817. Two hundred and twenty six miles of
additional wetted bank have been reclaimed in the proposed blueprint for restoration.
The virtual planform has twenty-five percent more wetted bank than the 1817 planform.
The proposed restoration adds an additional 9.53 square miles of area to the 2003
planform.
42
REFERENCES
Carroll, Capt. William, (Streckful Steamers, St. Louis, Missouri), Personal letters to Mr.
C.N. Strauser pertaining to annual arrivals of steamboats at St. Louis, MO. Between 1817 and 1858; November 9, November 10, and December 4, 1976
Collot, Victor, 1826, “A Journey in North America,” published for Arthur Bertrand,
Paris, France. Davinroy, Robert D., 2005, “Upper Mississippi River Comprehensive Plan,” Chapter 7,
p11. Degenhardt, Eugene A., 2005, personal conversation, Value Engineer, U.S. Army Corps
of Engineers, St. Louis District. Degenhardt, Eugene A., 1973, “Channel Stabilization of the Middle Mississippi River, “
Thesis, presented to Colorado State University, Fort Collins, Colo., in partial fulfillment of the requirements for the degree of M.S., August.
Ernst, O.H. 1880. “Improvement of Mississippi River Between the Mouths of the Illinois
and Ohio Rivers, “ Annual Report to the Chief of Engineers, U.S. Army Corps of Engineers, St. Louis, Mo, p 1373
Ernst, O.H. 1881 “Improvement of the Mississippi River Between the Mouths of the
Illinois and Ohio Rivers,” Annual Report to the Chief of Engineers, U.S. Army Corps of Engineers, St. Louis, MO, p 1536
Government Land Office, State of Missouri, Land Surveys, 1817 Government Land Office, State of Illinois, Land Surveys, 1821 Lee, Robert E. 1843, House Document C, 28th Congress, 1st Session. Norris, Terry. 1997, “Where Did the Villages Go? Steamboats, Deforestation, and
Archaeological Loss in the Mississippi Valley.” Rpt. in Common Fields- An Environmental History of St. Louis. Ed. Andrew Hurley. Missouri Historical Society Press, St. Louis. P 74
“Mississippi River Commission Chronology”. Mississippi River Commission. May 19,
2005.<http://www.mvd.usace.army.mil/MRC-History-Center/commission/TimeLine/timeline.html>
Mississippi River Commission, Detail Map of the Upper Mississippi River from the
Mouth of the Ohio River to Minneapolis, Minnesota in 89 Sheets, 1881
43
“Physical Growth of the City of Saint Louis”. St. Louis City Plan Commission. May 19, 2005. <http://stlouis.missouri.org/heritage/History69>
Shreve, H.M., 1835, “Annual Report of Work Done for the Improvement of the
Navigation of the Ohio, Missouri and Mississippi Rivers, “ House of Representatives Document Number 2, 24th Congress, 1st session, 1835
Simons, D. B., phone conversation with Rob Davinroy, Associate Dean, Engineering
Research Center, Colorado State University (2003) Simons, D. B., Schum, S. A., and Stevens, M.A. 1974 “Geomorphology of the Middle
Mississippi, “U.S. Army Corps of Engineers Waterways Experiment Station. Strauser, Claude N., 1978. “Restoration of the Middle Mississippi River”. U.S. Army
Corps of Engineers. May 19, 2005. <http://mvs-wc.mvs.usace.army.mil /restore.html>
Trotten, J.G., 1822. “Report of the Board of Engineers on the Ohio and Mississippi River,
“House of Representatives Document Number 35, 17th Congress, 2nd session, December.
Twain, Mark, “Life on the Mississippi, “The Heritage Press, New York, 1944, first
published in 1844 Warren, Bvt. Major General G. K, Map of the Mississippi River from the Junction of the
Minnesota to the Junction of the Ohio River. 22 Sheets. U.S. Army Corps of Engineers, St. Louis District, 1869
Westphal, Jerome A., phone conversation with Rob Davinroy, Associate Professor,
Institute of River Studies, University of Missouri-Rolla (2003) Westphal, Jerome A. and Clemence, Samuel P.,1976. “SLD Potamology Study (S-7).”
Institute of River Studies, Department of Civil Engineering, School of Engineering, University of Missouri-Rolla.
Zar, Jerrold H.,1999, “Biostatistical Analysis”, Fourth Edition, Prentice Hall, Inc. Upper
Saddle River, NJ p129 28th Congress, 1st Session, House Document 2, 1843, p135