geomorphology of the chihuahuan desert based on po
TRANSCRIPT

Journal of Maps, 2011, 249-259
Geomorphology of the Chihuahuan Desert based on po-tential dust emissions
MATTHEW C. BADDOCK1, THOMAS E. GILL2,5, JOANNA E. BULLARD3, MIGUELDOMINGUEZ ACOSTA2,4 and NANCY I. RIVERA RIVERA5
1United States Department of Agriculture - Agricultural Research Service, 3810 4th Street, Lubbock, TX 79415, USA; [email protected] of Geological Sciences, University of Texas at El Paso, 500 West University Avenue, El Paso, TX 79968, USA.3Department of Geography, University of Loughborough, Loughborough, Leicestershire LE11 3TU, UK.4Departamento de Ingenieria Civil, Universidad Autonoma de Ciudad Juarez, 450 N. Avenida del Charro, Ciudad Juarez, Chihua-hua 32315, Mexico.5Environmental Science and Engineering Program, University of Texas at El Paso, 500 West University Avenue, El Paso, TX 79968,USA.
Abstract
The Chihuahuan Desert of central northern Mexico and southern Arizona, New Mexico and Texas, USA,is a regionally significant dust ’hot-spot’ in North America. Typical of other such hot-spots, this desertconsists of a mosaic of geomorphological settings, each of which has a varying propensity for dust emis-sion. Recently, a classification system of dust emission potential based on surface geomorphic charac-teristics that establishes a common framework for describing the land surface has been proposed. Theclassification is readily applicable to different dust source regions and designed to facilitate comparisonof the relative potential dust contributions and emissivity of varying geomorphological environments insuch regions.
The map here (1:3,500,000) was compiled by applying the new classification to a base map of polygonsfrom existing soil and landform maps that were produced by national government agencies. Within thestudy area, 11 of the 17 possible geomorphic classes were present, the most extensive being unarmoured,unincised high relief alluvial surfaces, which covered 43% of the area.
As an example of how empirical dust source point data can be used with the classification, the satellite-observed origins of dust plumes for 26 major wind erosion events from 2001 to 2009 were overlain on themap. Despite a total area of only 4%, ephemeral lakes were the source of 48% of the observed plumes.This map and the relationships derived from it provide the basis for developing equivalent maps in otherdusty regions, and mark a step toward improving the representation and documentation of the strengthof dust sources in numerical mineral aerosol models.
(Received 31st January 2011; Revised 22nd June 2011; Accepted 18th July 2011)
ISSN 1744-5647doi:10.4113/jom.2011.1178
249

Journal of Maps, 2011, 249-259 Baddock, M.C. et al
1. Introduction and Rationale
The world’s major sources of aerosol emission are predominantly closed basins in semi-arid environments (Prospero et al., 2002; Washington et al., 2003). These dust source re-gions exhibit considerable geomorphic heterogeneity and within them, at any one time,smaller sub-basin scale dust emission ‘hot-spots’ can be identified. Some hot-spots arepersistent and emit dust regularly (seasonally or annually), while others are sporadic orephemeral where emission is triggered by factors such as timing of localized sedimentinput. To better understand the dynamics of dust hot-spots, researchers are startingto map these regions as mosaics of different geomorphic types (e.g. Wang et al., 2008;Bullard et al., 2008), each of which has a different signature of dust emission potential.
Accurate numerical modelling of dust emission and transport requires quantitative in-formation about the relative aerosol contribution from different land surface types (e.g.Zender et al., 2003). A number of attempts have been made to determine the relativeimportance of different surface types for dust emissions by determining relationshipsbetween empirical dust point source data and mapped surface characteristics. How-ever, the use of different geomorphic mapping schemes by different groups of research-ers limits the extent to which the results can be compared across regions (Bullard, 2010;Bullard et al., 2009). In response to this, the QUEST (Quantifying and Understandingthe Earth System) Working Group on Dust proposed a common, geomorphology-basedclassification scheme designed to be applicable worldwide to facilitate the comparisonof dust emission from hot-spots in different regions (Table 1). Such a scheme would rep-resent a basis for the parameterisation of dominant dust emission zones in the reducedscale global maps used in dust-cycle models. A key element of the QUEST classifica-tion is that it can be applied using data that are easily available, globally-consistent andverifiable. It is therefore based on a limited number of easily identifiable geomorphiccategories that can be defined using satellite remote sensing, aerial photographs, topo-graphic, soil and geological maps, complemented by field data. The development andjustification of the classification is discussed in detail by Bullard et al. (in press). Herewe map the distribution of these geomorphic categories in the Chihuahuan Desert.
The Chihuahuan Desert (Figure 1) is the third largest desert in the American continent.It lies in a relatively high-elevation basin and range region (ranging approximately 400-3100 m a.s.l.) generally south of the Colorado Plateau and between the Sierra MadreOriental and Sierra Madre Occidental ranges and is bisected by the USA-Mexico bor-der. This desert represents a substantial, but annually variable, source of airborne dustwithin the North American continent (Prospero et al., 2002). Although dust events mayoccur at any time of year, the strongest regional dust outbreaks are during the dry winterand spring months when strong cyclones cross over or just to the north of the region(Lee et al., 2009; Rivera Rivera et al., 2009) and emanate from unvegetated or poorly ve-getated surfaces, including dry playas, scrublands and fallow agricultural fields (Rivera
250

Journal of Maps, 2011, 249-259 Baddock, M.C. et al
Maingeomorphology
class
Geomorphologysub-division
Code Importancefor dustemission
Area
(km2)
Area
(%)
% ofdustplumes
Wet 1a Low 243 <0.1 0
Ephemeral 1b High-Med 8905 2.8 29.5
Dry –consolidated
1c Low - - -Lakes
Dry – nonconsolidated
1d High-Med 3564 1.1 18.4
Armoured,incised
2a Low - - -
Armoured,unincised
2b Low - - -
Unarmoured,incised
2c Medium 32 <0.1 0High Reliefalluvial systems
Unarmoured,unincised
2d Med-High 138728 43.0 20.7
Armoured –incised
3a Low - - -
Armoured -unincised
3b Medium - - -
Unarmoured –incised
3c Low 436 0.1 0Low Reliefalluvial systems
Unarmoured–unincised
3d Medium 64683 20.1 12.0
Stony surfaces 4 Low 141 <0.1 0.5
Sand Sheet 5a Low-Med 7178 2.2 1.8
Aeolian sanddunes
5b Low-High 9450 2.9 13.8Aeolian systems
Loess 6 Low-Med - - -
Low emissionsurfaces
7 Low 89090 27.6 3.2
Table 1. The QUEST group (Bullard et al., 2009) classification of dust source geomorphology (first four columns), and the classific-ation as applied to the Chihuahuan Desert (right hand three columns). Percentage of dust sources per geomorphic class using thesource point data in Figure 2 is shown in the grey column.
Rivera et al., 2010). El Paso, Texas / Ciudad Juarez, Chihuahua, the largest metropolitanarea within the desert, experiences approximately 15 dusty days per year (with visibil-ity <10 km) (Novlan et al., 2007). Dust from the Chihuahuan Desert can be transportedconsiderable distances across the North American continent (Doggett et al., 2002).
251
Journal of Maps, 2011, 249-259 Baddock, M.C. et al
106°W108°W
32°N
30°N
!!
!!
!!
!!
!!
!!
!!
!!
!!
!!
!! ! ! ! ! ! ! ! ! ! ! ! ! ! ! ! ! ! ! ! !
!!
!!
!!
!!
!!
!!
!!
!!
!!
!!
!
!!!!!!!!!!!!!!!!!!!!!
102°W107°W
33°N
28°N
MEXICOUSA
AZNM
TX
Chih.Coah.
Dgo.
! !! !
! !! !
! !! !
! !! !
! !! !
! !! !
! !! !
! !! !
! !! !
! !! !
! !! !
! !! !
A B
0 500 km 0 100 km
Rio Grande
Pecos
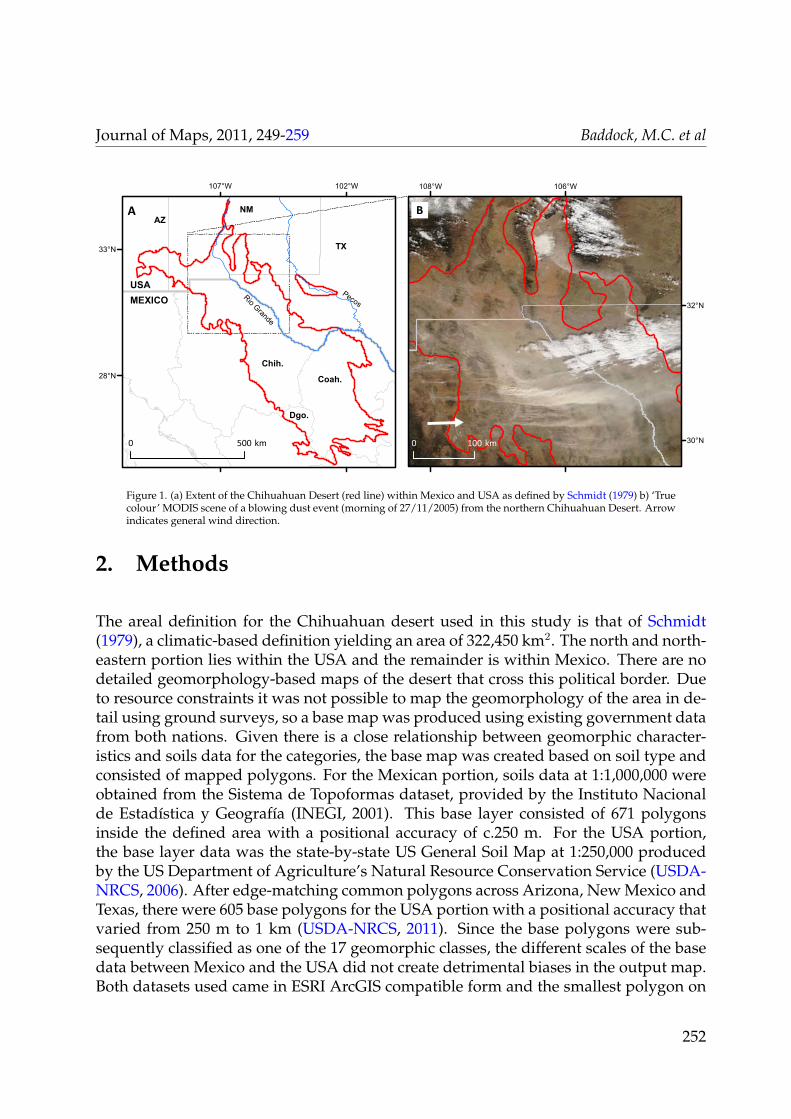
Figure 1. (a) Extent of the Chihuahuan Desert (red line) within Mexico and USA as defined by Schmidt (1979) b) ‘Truecolour’ MODIS scene of a blowing dust event (morning of 27/11/2005) from the northern Chihuahuan Desert. Arrowindicates general wind direction.
2. Methods
The areal definition for the Chihuahuan desert used in this study is that of Schmidt(1979), a climatic-based definition yielding an area of 322,450 km2. The north and north-eastern portion lies within the USA and the remainder is within Mexico. There are nodetailed geomorphology-based maps of the desert that cross this political border. Dueto resource constraints it was not possible to map the geomorphology of the area in de-tail using ground surveys, so a base map was produced using existing government datafrom both nations. Given there is a close relationship between geomorphic character-istics and soils data for the categories, the base map was created based on soil type andconsisted of mapped polygons. For the Mexican portion, soils data at 1:1,000,000 wereobtained from the Sistema de Topoformas dataset, provided by the Instituto Nacionalde Estadística y Geografía (INEGI, 2001). This base layer consisted of 671 polygonsinside the defined area with a positional accuracy of c.250 m. For the USA portion,the base layer data was the state-by-state US General Soil Map at 1:250,000 producedby the US Department of Agriculture’s Natural Resource Conservation Service (USDA-NRCS, 2006). After edge-matching common polygons across Arizona, New Mexico andTexas, there were 605 base polygons for the USA portion with a positional accuracy thatvaried from 250 m to 1 km (USDA-NRCS, 2011). Since the base polygons were sub-sequently classified as one of the 17 geomorphic classes, the different scales of the basedata between Mexico and the USA did not create detrimental biases in the output map.Both datasets used came in ESRI ArcGIS compatible form and the smallest polygon on
252
Journal of Maps, 2011, 249-259 Baddock, M.C. et al
the base map has an area of 1 km2. Where map units terminated at the internationalboundary, care was taken to keep the geomorphic attribution consistent.
After establishing the initial base map of landscape units, a range of different datasources was used to assign a geomorphic category from the classification (Table 1).These sources included georegistered surface geology and soils maps (plus the descript-ive layers associated with the original base polygon datasets), satellite imagery, inform-ation in published literature (e.g. Hawley et al., 1969; Langford, 2000; Castiglia and Faw-cett, 2006; Hall et al., 2010), expert knowledge and dedicated verification field sorties.Digital Elevation Models and simple contour maps were used to differentiate high andlow relief terrain. As well as using Google Earth, the primary satellite imagery sourcewas the mosaic of the NASA GeoCover project for circa 2000. The latter has worldwidecoverage created from Landsat ETM+ (at 14.25 m spatial resolution) (Tucker et al., 2004).
Where the geomorphological variability of the landscape was more complex than in-dicated in the primary dataset, for example two or more different geomorphic typeswithin a single polygon, base layer polygons were sub-divided. This was most commonin playa areas, since multiple different dry lake geomorphic classifications can exist inclose proximity to one another. Once each polygon in the base map was categorizedby geomorphology, adjacent polygons with the same geomorphic characteristics weremerged with the result that the smallest polygon increased in size to 2 km2.
3. Geomorphic Categories in the Chihuahuan Desert
Of the 17 geomorphic types identified by Bullard et al. (2009), 11 were present in theChihuahuan Desert (Table 1).
The majority of Chihuahuan Desert lakes have a hydrological regime in which inund-ation is only occasional so these were mapped as ephemeral lakes (1b). Dry, non-consolidated lakes (1d) usually comprised the outer parts of tectonically uplifted por-tions of relic Quaternary lakes not known to have been supplied with loose sedimentsduring the historical flood record. These ephemeral and dry lakes are distributed through-out the desert (Castiglia and Fawcett, 2006; Scuderi et al., 2010). Perennial water bodieswere classified as 1a.
No specific criteria were used to distinguish high and low relief alluvial landscape units,rather, the two were distinguished based on variations in relative relief. Bajada surfaceswere classified as high relief alluvial systems (2d) as they are transitional between thesteeper exposed rock/bare mountainsides and flat depositional plains, and are charac-terised by surface wash processes. Channels are typically not well-developed on the
253

Journal of Maps, 2011, 249-259 Baddock, M.C. et al
bajadas so they were considered unincised, and the predominance of sand-sized sedi-ment classifies them as unarmoured. This surface geomorphology occurs in extensiveareas throughout the far northwest and central areas of the desert whereas the rest of theregion has larger expanses of low relief alluvial deposits with poorly developed chan-nels and no armouring (3d). This latter area includes the wide floodplains of perennialrivers (such as the middle to northern Rio Grande / Rio Bravo del Norte section) andephemeral rivers (e.g. Rio Del Carmen). Parts of the Rio Grande further downstream areincised (3c). Stony desert surfaces (4) are of very limited extent within the ChihuauhanDesert.
Aeolian deposits in the Chihuahuan Desert are located mainly in the north and southcentral areas and are dominated by coarse-grained sand sheets (5a) and dunes (5b) withno loess deposits identified. There is an extensive area of coppice dunes in the northcentral desert straddling the USA-Mexico border west of El Paso, and the largest dun-efield of unvegetated bedforms (400 km2) is part of the White Sands complex. Sandsheets cover a few basins in the northeast edge of the desert in Texas and New Mexico.
Although the scale of the map captures the gross geomorphic characteristics of the re-gion, there are areas where geomorphic surfaces vary over small distances, or wheretwo or more units are closely coupled. For example, there are areas where sand dunesare superimposed on dry lakes such that the interdune areas expose lake bed; in otherareas floodplain sediments have evidently been re-worked into aeolian features. Thegeomorphology in these cases is mapped according to the spatially dominant surfacetype.
Surfaces with low emission potential (7), such as extensive exposed mountain and es-carpment rocky areas, are rarely dust sources in this region unless they are subjected toanthropogenic disturbance (e.g. mining). They are predominantly in the south of thedesert.
4. Comparison with Point Sources of Dust Emission
The map can be combined with empirical dust source data to determine the relative im-portance of each geomorphic surface type in terms of dust emissions. To illustrate this,a dataset of dust source points identified using an established remote sensing technique(e.g. Bullard et al., 2008; Rivera Rivera et al., 2010) for 26 dust events between 2001 and2009 was overlain on the map (Figure 2) and is summarized in Table 1. Although eph-emeral and dry lakes cover only a small proportion of the region (<4%) they account fornearly half (48%) of the dust plumes. In contrast, only 21% of the dust plumes mappedare associated with the high relief alluvial systems which cover over 43% of the Chihu-
254

Journal of Maps, 2011, 249-259 Baddock, M.C. et al
106°W
106°W
108°W
108°W110°W
32°N
32°N
30°N
30°N
28°N
28°N0 100 km
Classification categories
Pluvial Lake Palomas complex
White Sands complex
1a - Wet lake
1b - Ephemeral lake
1d - Dry lake, unconsolidated
2c - High relief alluvial (incised, unarmoured)
2d - High relief alluvial (unincised, unarmoured)
3c - Low relief alluvial (incised, unarmoured)
3d - Low relief alluvial (unincised, unarmoured)
4 - Stony surface
5a - Aeolian sand sheet
5b - Aeolian sand dunes
7 - Low emission surfaces
MEXICO
USA
Classification categories
Figure 2. Detailed view of the geomorphic classification for the area containing all satellite-determined dust sourcepoints (red dots) from 26 studied dust events occurring 2001-2009. No sources were observed south of 29.5◦N. Dustsource data summarised in greyed column of Table 1.
255

Journal of Maps, 2011, 249-259 Baddock, M.C. et al
ahuan Desert. The dataset used only provides an indication of dust plume frequency(not relative plume size or concentration), but the number of dust plumes per unit areasuggests that intermittent or dry lakes are more important for dust emissions than issuggested by their limited spatial coverage.
5. Conclusion
We have presented a new map of the geomorphology of the Chihuahuan Desert usinga classification scheme designed to improve our understanding and assist numericalmodelling of dust emissions. Of the 17 possible geomorphic classes, 11 were identi-fied and mapped, with High Relief Alluvial (unincised, unarmoured) accounting for43% of total area, Low Emission Surfaces 28% and Low Relief Alluvial (unincised, un-armoured) 20%. Overlaying dust point sources on the map illustrates the relationshipbetween surface types (e.g. ephemeral lakes and alluvial systems) and aeolian dustemissions.
Although this classification scheme is applicable to any dust source area of interest, itsease of application depends on factors such as quality of pre-existing datasets, famili-arity with the study region and desired level of detail. The baseline for this map ofthe Chihuahuan Desert was derived from pre-existing high quality soil and geologypolygon data. Application of the classification does not necessarily require such inputs,since surface types could be mapped from any available base maps or digitized entirelyoriginally from satellite imagery (e.g. Ballantine et al., 2005). The main disadvantage ofcreating an entirely original classification map will be the time demands of digitizingall polygons.
The mapping scheme effectively, although somewhat qualitatively, reflects the key geo-morphic factors controlling dust emission. Its scale, while providing less detail thantypical regional geomorphic maps, is much more complex than is typically used in nu-merical models of dust emission (Bullard et al., in review). Application of this schemeto the Chihuahuan Desert illustrates a more sophisticated delineation of emitting andnon-emitting surfaces, and thus should improve the parameterization of aerosol sourcesin dust-cycle models. The authors hope that this exercise will provide the basis for thedevelopment of a global series of maps of aeolian dust source areas.
256

Journal of Maps, 2011, 249-259 Baddock, M.C. et al
Software
The base data and interpretation layers were all managed, and the final map built, usingESRI ArcGIS 9.3 and Adobe Illustrator.
Acknowledgments
Thanks to Porfirio Peinado, Joseph Mbuh and Jeff Lee. Gill and Dominguez were sup-ported in part by grant 003661-0027-2007 from the Norman Hackerman Advanced Re-search Program of the Texas Higher Education Coordinating Board. Rivera and Riveraand Gill were supported in part by NOAA through the Educational Partnership Pro-gram for Minority Serving Institutions (EPP/MSI) Cooperative Agreement NA17AE1623.We are also grateful for the comments of Colin Pain, Paul Hesse and Grant McTainshwhose reviews helped improve the manuscript, and Bernhard Jenny of ETH Zurich forhis detailed cartographic critique.
ReferencesBALLANTINE, J. A. C., OKIN, G. S., PRENTISS, D. E. and ROBERTS, D. A. (2005) Mapping North
African landforms using continental scale unmixing of MODIS imagery, Remote Sensing of Environ-ment, 97, 470–483.
BULLARD, J. E. (2010) Bridging the gap between field data and global models: current strategies inaeolian research, Earth Surface Processes and Landforms, 35, 496–499.
BULLARD, J. E., BADDOCK, M., MCTAINSH, G. and LEYS, J. (2008) Sub-basin scale dust sourcegeomorphology detected using MODIS, Geophysical Research Letters, 35, L15404.
BULLARD, J. E., HARRISON, S. P., BADDOCK, M., DRAKE, N., GILL, T. E., MCTAINSH, G. H.and SUN, Y. (in press) Preferential dust sources: a geomorphological classification designed for use inglobal dust-cycle models, Journal of Geophysical Research - Earth Surface.
BULLARD, J. E., HARRISON, S. P., DRAKE, N. and GILL, T. E. (2009) Preferential dust sources inglobal aerosol models: a new classification based on geomorphology, Eos (Transactions, AmericanGeophysical Union), 90, EP23D–01.
CASTIGLIA, P. J. and FAWCETT, P. J. (2006) Large Holocene lakes and climate change in the Chihua-huan Desert, Geology, 34, 113–116.
DOGGETT, A. L., GILL, T. E., PETERSON, R. E., BORY, A. J. M. and BISCAYE, P. E. (2002) Meteor-ological characteristics of a severe wind and dust emission event; southwestern USA, 6-7 April 2001,In 21st Conference on Severe Local Storms, Preprints, American Meteorological Society, pp. 78–80.
257

Journal of Maps, 2011, 249-259 Baddock, M.C. et al
HALL, S. A., MILLER, M. R. and GOBLE, R. J. (2010) Geochronology of the Bolson sand sheet, NewMexico and Texas, and its archaeological significance, Geological Society of America Bulletin, 122,1950–1967.
HAWLEY, J. W., KOTTLOWSKI, F. E., STRAIN, W. S., SEAGER, W. R., KING, W. E. and LE MONE,D. V. (1969) The Santa Fe Group in the south-central New Mexico border region, New Mexico StateBureau of Mines and Mineral Resources Circular, 104, 52-76, 52 pp.
LANGFORD, R. P. (2000) Nabkha (coppice dune) fields of south-central New Mexico, U.S.A, Journal ofArid Environments, 46, 25–41.
LEE, J. A., GILL, T. E., MULLIGAN, K. R., DOMÍNGUEZ ACOSTA, M. and PEREZ, A. E. (2009)Land use/land cover and point sources of the December 15, 2003 dust storm in southwestern NorthAmerica, Geomorphology, 105, 18–27.
NOVLAN, D. J., HARDIMAN, M. and GILL, T. E. (2007) A synoptic climatology of blowing dustevents in El Paso, TExas from 1932-2005, In Preprints, 16th Conference on Applied Climatology, Amer-ican Meteorological Society, pp. J3.12, 13.
PROSPERO, J. M., GINOUX, P., TORRES, O., NICHOLSON, S. E. and GILL, T. E. (2002) Environ-mental characterization of global sources of atmospheric soil dust identified with the Nimbus 7 TotalOzone Mapping Spectrometer (TOMS) absorbing aerosol product, Reviews of Geophyics, 40, 1002, doi:10.1029/2000RG000095.
RIVERA RIVERA, N. I., GILL, T. E., BLEIWEISS, M. P. and HAND, J. L. (2010) Source characteristicsof hazardous Chihuahuan Desert dust outbreaks, Atmospheric Environment, 44, 2457–2468.
RIVERA RIVERA, N. I., GILL, T. E., GEBHART, K. A., HAND, J. L., BLEIWEISS, M. P. andFITZGERALD, R. M. (2009) Wind modeling of Chihuahuan Desert dust outbreaks, Atmospheric En-vironment, 43, 347–354.
SCHMIDT, R. H. (1979) A climatic delineation of the “real" Chihuahuan Desert, Journal of Arid Envir-onments, 2, 243–250.
SCUDERI, L. A., LAUDADIO, C. K. and FAWCETT, P. J. (2010) Monitoring playa lake inundation inthe western United States: Modern analogues to late-Holocene lake level change, Quaternary Research,73, 48–58.
TUCKER, C. J., GRANT, D. and DYKSTRA, J. (2004) NASA’s global orthorectified Landsat data set,Photogrammetric Engineering and Remote Sensing, 70, 313–322.
USDA-NRCS (2006) U.S. General Soil Map (STATSGO2) for the states of Arizona, New Mexico and Texas[Online]. Available from: http://soildatamart.nrcs.usda.gov, [Last accessed: 14 February 20011].
USDA-NRCS (2011) Digital General Soil Map of US: Metadata [Online]. Available from: http://soildatamart.nrcs.gov/Metadata.aspx?Survey=US, [Last accessed: 4 January 20011].
WANG, X., ZIA, D., WANG, T., XUE, X. and LI, J. (2008) Dust sources in arid and semiarid China andsouthern Mongolia: impacts of geomorphological setting and surface materials, Geomorphology, 97,583–600.
WASHINGTON, R., TODD, M., MIDDLETON, N. J. and GOUDIE, A. S. (2003) Dust-storm sourceareas determined by the Total Ozone Monitoring Spectrometer and surface observations, Annals of theAssociation of American Geographers, 93, 297–313.
258

Journal of Maps, 2011, 249-259 Baddock, M.C. et al
ZENDER, C. S., NEWMAN, D. J. and TORRES, O. (2003) Spatial heterogeneity in aeolian erodibility:uniform, topographic, geomorphic and hydrologic hypotheses, Journal of Geophysical Research, 108,4543, doi: 10.1029/2002JD003039.
259