geometric structure and desorption … and inviting manner of imparting his knowledge on the ......
TRANSCRIPT
GEOMETRIC STRUCTURE AND DESORPTION KINETICS OF CO ON THE
Cr2O3(0001)/Cr(110) SURFACE
THESIS
Presented to the Graduate Council of Texas State University – San Marcos
in Partial Fulfillment of the Requirements
for the Degree
Master of SCIENCE
by
Gabriel Arellano, B.S.
San Marcos, Texas May 2010

GEOMETRIC STRUCTURE AND DESORPTION KINETICS OF CO ON THE
Cr2O3(0001)/Cr(110) SURFACE
Committees Members Approved:
Carl A. Ventrice, Jr., Chair
Nikoleta Theodoropoulou
Wilhelmus J. Geerts
Approved:
J. Michael Willoughby Dean of the Graduate College

COPYRIGHT
by
Gabriel Arellano
2010

iv
ACKNOWLEDGEMENTS
I am indebted to Dr. Carl A Ventrice Jr. for his dedication as a mentor throughout
my research, as an instructor here at Texas State University-San Marcos and for his
patience and inviting manner of imparting his knowledge on the subject of Physics and
everyday mechanics. Dr. Ventrice revitalized my interest in Physics by making the
subject interesting, sensibly applicable and approachable and by never dismissing my
questions or understanding about the subject. My loving appreciation is also extended to
my friends and classmates here at Texas State; Nick Clark, Chris Cumby, Dan Fields,
Greg Hodges, Rob Kilbourn, Chris Lohn, Nick Miller, Dan Ralls, Simona Rieman,
Jennifer Walters, Jason Williams and Craig and to my friends and classmates at the
University of Texas at Austin; Jay Palermo, Arturo Perez, Yingyue Li Boretz and Maia.
Their humor, consideration and persistence were my therapy and motivation throughout
my scholastic endeavors. To my best friends; Cesar R. Favela, Humberto E. Rodriguez,
Richard Coronado, Felipe S. Ulloa, Tommy Murillo and Jason Williams; I thank you for
pulling me out of my studies and helping me relax and for reminding me of the truly
important qualities of life. I can never fully thank my mother, Chela Arellano, and my
father, Lalo Arellano, for happily and unquestionably devoting so much of their life, their
love and their guidance in raising me. I hope that they are as proud of me as their child
as I am of them as my parents. To my brothers and sisters; Mickey, Magali, Becky,
Rafael and Lupe, I thank you for always loving and accepting me for who I am and for
who I want to be, but mostly for the humbling manner in which you sincerely show your

v
love and pride for me and for each other. To my beautiful wife, Lindsay Scott Rose-
Arellano, I thank God for you, for you have shared all the hardships and blessings that
have come with loving me as a husband and as a father with unwavering patience,
attentiveness and with an unfathomable sense of humor. Finally, to my beautiful
daughter Amalia Isabel Arellano, I thank you because, through you, I get to see the
beauty of this world and reflect on the wonders of life and because you have made me a
happier and better person.

vi
TABLE OF CONTENTS
ACKNOWLEDGEMENTS............................................................................................... iv
LIST OF FIGURES ......................................................................................................... viii
LIST OF TABLES...............................................................................................................x
ABSTRACT....................................................................................................................... xi
CHAPTER
I. INTRODUCTION ..............................................................................................1
II. CRYSTAL LATTICES AND ELECTRON DIFFRACTION............................5
A. OVERVIEW OF CRYSTAL STRUCTURE ..............................................5
B. THE Cr(110) SURFACE .............................................................................6
C. THE Cr2O3(0001) SURFACE .....................................................................8
D. ELECTRON DIFFRACTION FROM A CRYSTAL SURFACE.............10
E. CONSTRUCTING THE RECIPROCAL LATTICE OF Cr(110).............18
III. EXPERIMENTAL TECHNIQUE...................................................................20
A. ULTRA HIGH VACUUM ........................................................................20
B. VACUUM TECHNIQUES........................................................................24
C. LOW ENERGY ELECTRON DIFFRACTION OPTICS .........................28
D. CRYSTAL SAMPLE HOLDER ...............................................................30
E. TEMPERATURE-PROGRAMMED DESORPTION ..............................33
F. ANALYSIS OF ACTIVATION ENERGY USING TPD ANALYSIS ....36
IV. EXPERIMENTAL RESULTS ........................................................................39
A. PREPARATION OF THE Cr(110) SURFACE ........................................39

vii
B. GROWTH OF EPITAXIAL Cr2O3(0001) ON Cr(110) ............................43
C. TEMPERATURE DEPENDENT LEED ANALYSES OF
Cr2O3(0001)/Cr(110).................................................................................45
D. ADSORPTION OF CARBON MONOXIDE ON Cr2O3(0001)/Cr(110)..47
i. CO DOSING SEQUENCE................................................................47
ii. DEPENDENCE OF TPD SPECTRA ON HEATING RATE...........51
iii. ACTIVATION ENERGY ANALYSIS ............................................54
V. DISCUSSION ..................................................................................................57
VI. CONCLUSIONS .............................................................................................61
REFERENCES ..................................................................................................................63

viii
LIST OF FIGURES
Figure Page
2-1. Five Bravais Lattices for 2-dimensional surface structures. ....................................6
2-2. Schematic of Chromium (Cr)...................................................................................7
2-3. Schematic of Cr2O3(0001) crystal............................................................................9
2-4. Plane wave incident on a spherical scattering center.............................................11
2-5. Electron plane wave scattering from two electrons ...............................................13
2-6. Coordinate system and position vectors of electron cloud and jth atom ................15
2-7. Theoretical real lattice drawing of Cr(110) ...........................................................18
2-8. Theoretical Reciprocal Lattice Drawing of Cr(110) based on the Laue condition .......................................................................................................18
2-9. Observed LEED image of Cr(110) at room temperature with overlaid
theoretical reciprocal lattice of Cr(110).................................................................19 3-1. Ultra-High Vacuum chamber with pumping system labeled.................................26
3-2. Ultra-High Vacuum chamber with mass spectrometer and x, y, z manipulator ....27
3-3. Schematic of electron gun and detector of LEED .................................................29
3-4. Interior view of ultra-high vacuum chamber .........................................................31
3-5. x,y,z manipulator and ultra-high vacuum chamber viewport housing Cr(110) sample ....................................................................................................................32
3-6. Schematic of a quadrupole mass spectrometer (QMS)..........................................34
4-1. LEED analysis of Cr(110) after several sputter/anneal cycles at room temperature ...............................................................................................42

ix
4-2. LEED analysis of Cr2O3(0001)/Cr(110) for this study ..........................................44 4-3. LEED analysis of Cr2O3(0001)/Cr(110) at 300 K, 150 K and 90 K from a
previous study ........................................................................................................45 4-4 LEED analysis of Cr2O3(0001)/Cr(110) at ~ 300 K and 125 K for this study ......46 4-5. TPD spectra of CO from Cr2O3(0001)/Cr(110) at a heating rate of 10 ºC/min
for several doses of CO ...........................................................................................49 4-6. LEED analysis of CO/Cr2O3(0001)/Cr(110) for doses of 1 L and 10 L................50 4-7. Pressure versus temperature curves for several heating rates for a CO dose of
1.0 L .......................................................................................................................53 4-8. Arrhenius plot assuming first order desorption kinetics for a dose
of 1.0 L of CO........................................................................................................56

x
LIST OF TABLES
Table Page
4-1. Areas calculated from pressure versus time curve and corresponding temperature of the maximum of the TPD peak......................................................50
4-2 Areas calculated from pressure versus time curve and the temperature of the
maximum of the TPD peak for heating rates ranging from 5 ºC/min to 50 ºC/min for a dose of 1.0 L of CO .......................................................................................54
4-3 Temperature of the maximum of the TPD peak for each dose of 1.0 L of CO .....55

xi
ABSTRACT
GEOMETRIC STRUCTURE AND DESORPTION KINETICS OF CO ON THE
Cr2O3(0001)/Cr(110) SURFACE
by
Gabriel Arellano, B.S.
Texas State University – San Marcos
May 2010
SUPERVISING PROFESSOR: CARL A. VENTRICE Jr.
Understanding the interaction of simple molecules such as carbon monoxide on
metal oxide surfaces is important for many industrial applications. For instance, Cr2O3 is
an industrial catalyst used for the reduction on nitrogen oxide compounds and for the
polymerization of various hydrocarbons. Previous groups have studied the adsorption of
CO on the Cr2O3(0001)/Cr(110) surface and found that it lies flat on the surface instead
of an upright geometry, which is observed on most other metal and metal oxide surfaces.
In addition, there is only one published measurement of the activation energy for
desorption of CO from Cr2O3(0001), and this value is approximately twice as high as the
value calculated using quantum chemical cluster theory.

xii
To determine the geometric structure of the clean and CO covered
Cr2O3(0001)/Cr(110) surface, we have performed temperature dependent low energy
electron diffraction measurements of these surfaces. Our diffraction measurements
reveal an unreconstructed clean Cr2O3(0001)/Cr(110) surface over a temperature range of
room temperature to 120 K. The diffraction pattern of the surface at a saturation
coverage of CO shows only a slight increase in diffuse background with no overlayer
reconstruction being observed. This is consistent with previous reports that CO
molecules are easily desorbed by low energy electrons.
To determine the desorption kinetics of CO from the Cr2O3(0001)/Cr(110)
surface, we have performed temperature programmed desorption measurements. At a
crystal temperature of 120 K, it was found that a saturation coverage of CO was obtained
for a CO dose of ~1 L. The maximum of the desorption curve was observed to shift to
higher temperature by only 4 K as the coverage approached saturation, which indicates a
1st order kinetics with an attractive adsorbate-adsorbate interaction. The activation
energy for CO desorption was measured to be 49.2 ±2.6 kJ/mol using the Redhead
method with heating rates ranging from 5 °C/min to 50 °C/min.

1
CHAPTER I
INTRODUCTION
Chromium oxides are used in many industrial applications such as catalysts for
polymerization and hydrocarbon reformation reactions, passivation of stainless steels,
binder layers in magnetic media, and the active region of some gas sensors. To obtain a
fundamental understanding of the surface properties of chromium oxide, it is beneficial to
study the geometry and the desorption kinetics of simple molecules on the surfaces of this
transition metal oxide.
Most industrial catalysts are used in powder form to increase the available surface
area of the catalyst. Because of this, it is difficult to relate the interaction of the reacting
molecules with a particular surface site since there will be several different terminations
and a high defect density for a powdered material. To get a better understanding of the
atomic scale interactions at the surface of a transition metal oxide, it is preferable to study
adsorption on well-ordered surfaces of single crystals. Since insulating metal oxide
crystals are ionic, the surfaces that are the most stable will be the non-polar surfaces,
which are the surfaces with no net dipole moment normal to the surface. For Cr2O3, the
two primary non-polar surface terminations are (0001) and
�
(011 2). Since most
transition metal oxides are insulating, it becomes difficult to perform surface studies
using electrons because of sample charging effects. One method of circumventing this
problem is to study a thin film of the transition metal oxide on a metal substrate, which

2
allows excess charge to tunnel into the substrate. Since Cr2O3 grows epitaxially on the
Cr(110) surface with a (0001) termination, this provides an excellent template for surface
science studies of molecular adsorption.
The geometric structure of the clean Cr2O3(0001)/Cr(110) surface has been
studied using various surface sensitive experimental techniques.3-11 An interesting
property of this surface that was observed by previous groups using low energy electron
diffraction (LEED) is the presence of a weak (√3x√3) R30º reconstruction at room
temperature that becomes more distinct below ~200 K and dissapears below ~100 K.1,2
This reconstruction was observed to be reversible and was attributed to a surface
magnetic transition. However, a recent temperature dependent LEED study of the
Cr2O3(0001)/Cr(110) surface did not observe the (√3x√3) R30º reconstruction at any
temperature down to ~120 K.12 Since CO adsorption on the Cr2O3(0001)/Cr(110) surface
results in a (√3x√3) R30º overlayer structure, it was proposed by Redding that the higher
background chamber pressure of the previous studies may have resulted in CO adsorption
on the surface instead of a surface reconstruction of the clean Cr2O3(0001) surface.
There have been several studies of the adsorption of CO on the
Cr2O3(0001)/Cr(110) surface using a variety of surface sensitive experimental
techniques.13-20 As mentioned previously, CO is observed to form a (√3x√3) R30º
overlayer structure at saturation coverage of a monolayer.2 Since the CO layer is easily
desorbed by low energy electrons, the LEED pattern of the CO is observed to disappear
within about 10 s. For most single crystal surfaces, CO is observed to adsorb in a
standing up configuration, usually with the C end of the molecule bonding to the surface.
However, angle-resolved ultra-violet photoelectron spectroscopy (ARUPS)

3
measurements of CO on Cr2O3(0001)/Cr(110) have provided evidence for an unusual
lying-down geometry.2 Because of the sensitivity of the CO layer to secondary electrons,
these measurements were performed in a background pressure of 7.5 x 10⁻⁶ Torr of CO.
One of the issues regarding the adsorption of CO on Cr2O3(0001) that has not been fully
resolved is the activation energy for desorption. A previous study of this system using
quantum chemical cluster calculations has predicted an activation energy of 28 kJ/mol;
whereas, thermal desorption spectroscopy (TDS) measurements resulted in an estimated
activation energy of 45 kJ/mol.20
In this thesis project, we have measured the temperature dependent surface
structure of the clean Cr2O3(0001)/Cr(110) surface with LEED and also found no
(√3x√3) R30º reconstruction at temperatures down to 120 K. In addition, we have
performed LEED measurements of the CO covered Cr2O3(0001) surface and have only
observed a slight increase in diffuse background with no overlayer reconstruction, which
is consistent with desorption of the CO due to the incident electron beam. Therefore, we
conclude that there must be another mechanism for the observed temperature dependent
(√3x√3) R30º reconstruction by other groups. The most probable cause for this
discrepancy is the much larger terrace step widths of our crystal since the surface
alignment is 0.1° compared to 0.5° for the previously published results.1
To determine the desorption kinetics of CO from the Cr2O3(0001)/Cr(110)
surface, we have performed temperature programmed desorption (TPD) measurements.
Only a slight change in the temperature of the desorption peak maximum is observed as
the overlayer coverage is increased. This is consistent with a 1st order desorption kinetics
and provides evidence that the CO is adsorbing molecularly (i.e., the CO does not

4
dissociate into atomic C and O on the Cr2O3(0001) surface). An activation energy for
desorption has been measured using the Redhead method and results in a value of 49.2
±2.6 kJ/mol.

5
CHAPTER II
CRYSTAL LATTICES AND ELECTRON DIFFRACTION
A. OVERVIEW OF CRYSTAL STRUCTURE
A 3-dimensional crystal lattice is defined by a regular array of points in space,
where each lattice point has the same translational symmetry.25 The positions of the
lattice points are defined by three translation vectors a, b and c. Therefore, a translation
vector can be defined as
T = n1 a + n2 b + n3 c, [2-1]
where n1, n2, and n3 are integers. This resulting structural array constitutes a crystal
lattice. The translation vectors a, b and c construct a primitive cell and enclose the
smallest volume defined as
�
a ⋅ (b× c) .25 A surface is 2-dimensional and is normally
defined only by the position vectors a and b. When a surface is formed, the crystal loses
its perfect translational symmetry perpendicular to the surface. Therefore, the surfaces of
crystals always form two-dimensional lattices, known as nets.26 There are five types of
two-dimensional Bravais lattices: square, primitive rectangular, centered rectangular,
hexagonal, and oblique, as shown below in Figure 2-1.

6
B. THE Cr(110) SURFACE
Chromium crystallizes in the body-centered cubic (BCC) structure.27 The BCC
structure consists of atoms located at the corners of a cube and one atom located at the
center of the cube. The lattice constant for a cubic crystal is defined as the length of the
sides of the cube and is a0 = 2.88 Å for chromium, as seen in Figure 2-2a. The (110)
surface of chromium forms a centered rectangular lattice with dimensions a1 = a0 and a2
= √2a0, as shown in Figure 2-2b. This surface is quasi-hexagonal with lattice constants
a1’ = a0 and a2’ =
�
32
ao, = 0.866 a0 with both lattice vectors separated by an angle β =
125˚, as shown in Fig. 2-2c. For a true hexagonal lattice both lattice constants would
have the same distance and would be separated by an angle of 120˚.
Figure 2-1: Five Bravais Lattices for 2-dimensional surface structures.

7
Figure 2-2: Schematic of chromium (Cr). The (a) body-centered cubic, BCC, crystal with lattice constant ao = 2.88 Å, the (b) (110) plane with lattice constants ao and √2ao, and the (c) quasi-hexagonal surface with lattice constants ao and (√3/2)ao.
(a)
(b)
(c)
x1
x2
x3
110 PLANE
2ao
a0
! " 109o
# " 125o
2ao
ao
3
2a
o
x1
x2
x3
2ao
a0

8
C. THE Cr2O3(0001) SURFACE
Chromium oxide (Cr2O3) crystallizes in the corundum structure.27 This structure
is a hexagonal lattice, which can be viewed as an ABAB stacking of close-packed layers
of oxygen atoms with a hexagonal arrangement of chromium atoms on either side of the
oxygen layers. The chromium atoms form a (√3 x √3) R30˚ arrangement with respect to
the close-packed oxygen sublattice, as shown in Figure 2-3a. The chromium layers on
either side of the oxygen plane are shifted laterally with respect to each other, as shown
in Fig. 2-3b. The lattice constants of Cr2O3 are a0 = 4.95 Å and c0 = 13.58 Å, which
corresponds to six oxygen stacking planes.
The oxidation of the Cr(110) surface results in the formation of an epitaxial
Cr2O3(0001) overlayer structure. The close-packed oxygen sublattice is reasonably well
lattice matched to the Cr(110) surface. The oxygen-oxygen nearest-neighbor distance is
aOx = ao/√3 = 2.86 Å; whereas, the chromium-chromium next-nearest-neighbor distance
is a1’ = a0 = 2.88 Å. This results in a lattice mismatch of only -0.7% in the [100]
direction.

9
(a)
(b)
(c)
Figure 2-3: Schematic of Cr2O3(0001) crystal. The (a) top view of Cr2O3(0001) surface, the (b) side view of Cr2O3(0001) surface, where the blue circles represent oxygen atoms and the grey circles represent chromium atoms, and the (c) the conventional cell of the hexagonal lattice.
aOx
aCr
aOx
aCr
X1
X2
X4
co
ao
X3

10
D. ELECTRON DIFFRACTION FROM A CRYSTAL SURFACE
To derive information about the real crystal structure from the related LEED
pattern, a relationship must be established between the reciprocal lattice structure and the
real lattice structure. The diffraction pattern obtained from LEED analysis represents the
reciprocal lattice structure. The diffraction pattern is generated from the constructive
interference of scattered electrons. The scattered electrons originate from the interaction
between the electron beam and the atoms of the crystal. The electron beam-atom
interaction can be compared to the interaction between an incident plane wave and a
collection of spherical scattering centers.28 The plane wave that represents the incident
electron beam can be defined as a wave function
�
Ψ(r,t) = Aei(k
o⋅r'−ωt ), [2-2]
where ko is the wave vector of the incident electron beam, r is the position vector of the
plane at incidence, and ω is the angular frequency. If the incident electron beam scatters
from one electron, as shown in Figure 2-4, the scattered wave-function can be expressed
as
�
Ψ(r,t) = fe
A
r '−re
ik⋅(r'−r)−ωt[ ], [2-3]
where |r'-r| is the electron-detector disance,29,30 A is the amplitude of the incident wave, r
is the radial distance from an arbitrary origin to the electron, and r' is the radial distance
from the same arbitrary origin to a detector, k' is the scattered wave vector, and fe is the

11
electron scattering length and is proportional to the incident wave by a factor of
�
eik
o⋅r' .
Disregarding the constant of proportionality, expression [2-2] can then be rewritten as
Figure 2-4: Plane wave incident on a spherical scattering center. Wave vector ko, incident on a spherical scattering center at r and scattered wave, with wave vector k’, detected at r’ from an arbitrary origin in space.
Plane Wave
rr’
Scattered Wave (k’)
j
i
k
Detector
Incident Wave (ko)

12
�
Ψ(r,t) =A
r '−re
iΔk⋅re
ik '⋅(r−r' )−ωt[ ], [2-4]
where Δk = ko- k'25, 26, 29, 30 is the difference in wave vector between the incident and
scattered wave respectively and (ko – k')·r' is the phase difference.29, 30 Applying the
same formulism to the case of the plane wave incident on two electrons, expression [2-4]
becomes
�
Ψ(r,t) =A
r − r *e
i(k'⋅r'−ωt )e− iΔk⋅r1 + e
−iΔk⋅r2[ ], [2-5]
where r – r* = r – r1 = r – r2 since the electrons are approximately equidistant from the
detector,30 r1 and r2 are position vectors from the origin to electrons in position P1 and P2
respectively.29 For elastic collision where |k'| = |k|, the phase difference,
�
δ , is then
�
δ =
�
D ⋅ S'−D ⋅ So( )k =
�
P2N − P2M( )2π λ , [2-6]
where D is r1 – r2, and
�
P2N − P2M( ) is the path length difference between the wave
incident at P1 and the incident wave at P2 as can be seen in Figure 2-5 below.

13
Figure 2-5: Electron plane wave scattering from two electrons. Electron beam scattering from two electrons at P1 and P2, where ko and k’ are wave vectors of the incident and scattered waves, respectively, and D is the separation of the electrons at P2 and P1.
Plane Wave
r1
r2
Scattered Wave (k’)
j
i
k
M
P1
P2
N
r
Detector
Incident Wave (ko)
Incident Wave (ko)
Scattered Wave (k’)
D
ko=Sok
ko=Sok
k’=S’k
k’=S’k

14
Physically, the observable quantity is the intensity, or
�
Ψ*(r,t)Ψ(r,t) =A2
r '−r 2 eiΔk⋅ r1 −r2( ) + e
− iΔk⋅ r1 −r2( ) +2[ ] [2-7]
which can be restated as
�
Ψ*(r,t)Ψ(r,t) = 4 A2 cos2 12Δk ⋅ r1 − r2( )[ ]. [2-8]
It is then evident from [2-8] that only for integer multiples of 2π for the argument of the
cos2 function is the intensity a maximum. For the more general case of scattering from
an atom, the scattered wave function is evaluated as a volume integral over the electron
density, ρ(r'), surrounding the atom at a distance r' from the atom,29, 30
�
Ψ(r,t) =A
r '−re
i(k'⋅r−ωt )e−iΔk⋅r'ρ r'( )dτ
τ∫ . [2-9]
Using expression [2-7] over all the atoms in a crystal yields a scattered wave function
defined as
�
Ψ(r,t) =A
r '−re
i(k'⋅r−ωt )e−iΔk⋅r
j
j
∑ e− iΔk⋅r"ρ r"( )dτ
τ∫ , [2-10]

15
where the summation accounts for all the atoms in the rjth position with respect to an
origin and the integral is for all the electrons at a distance r" from the atom, Figure 2-6.
Figure 2-6: Coordinate system and position vectors of electron cloud and jth atom. The grey circle represents the jth atom at position rj and the black oval represents an electron cloud at a position r'. The distance from the jth atom to the electron is r" = r' – rj.
j
r’
rj
r”
i
k
16
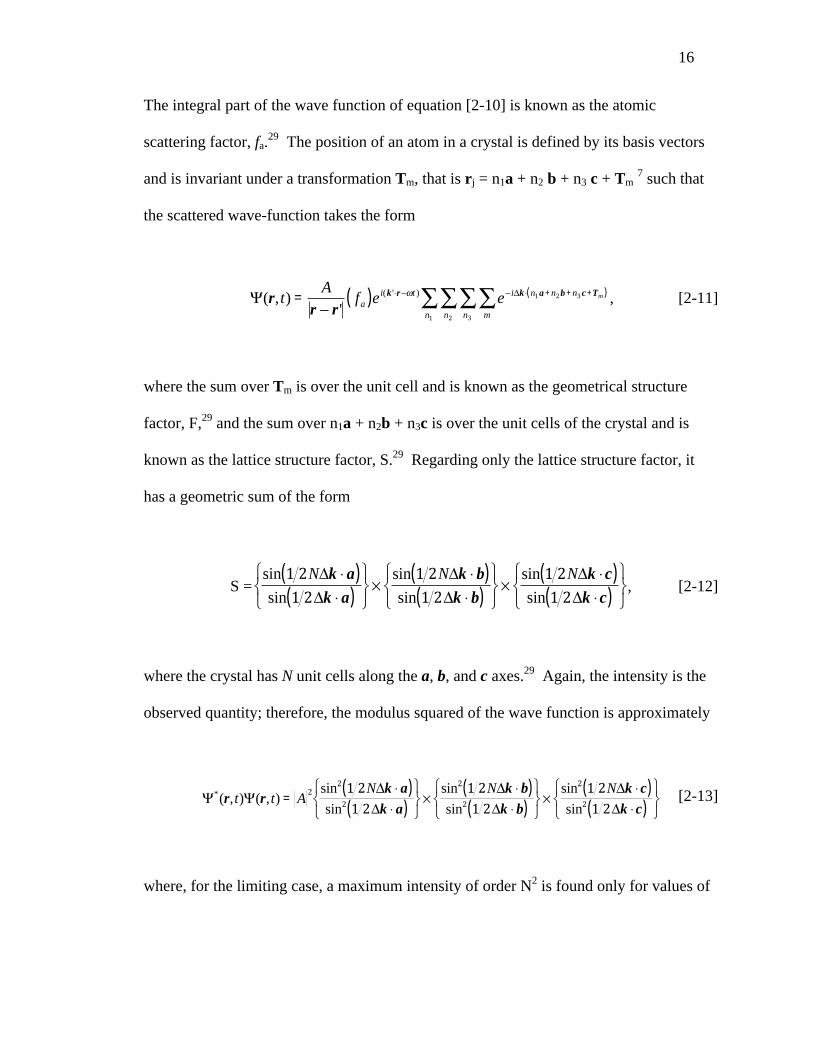
The integral part of the wave function of equation [2-10] is known as the atomic
scattering factor, fa.29 The position of an atom in a crystal is defined by its basis vectors
and is invariant under a transformation Tm, that is rj = n1a + n2 b + n3 c + Tm 7 such that
the scattered wave-function takes the form
�
Ψ(r,t) =A
r − r 'f
a( )ei(k '⋅r−ωt )e−iΔk⋅ n1a +n2b +n3c +T
m( )
m
∑n3
∑n2
∑n1
∑ , [2-11]
where the sum over Tm is over the unit cell and is known as the geometrical structure
factor, F,29 and the sum over n1a + n2b + n3c is over the unit cells of the crystal and is
known as the lattice structure factor, S.29 Regarding only the lattice structure factor, it
has a geometric sum of the form
S =
�
sin 1 2NΔk ⋅ a( )sin 1 2Δk ⋅ a( )
⎧ ⎨ ⎩
⎫ ⎬ ⎭ ×
sin 1 2NΔk ⋅ b( )sin 1 2Δk ⋅ b( )
⎧ ⎨ ⎩
⎫ ⎬ ⎭ ×
sin 1 2NΔk ⋅c( )sin 1 2Δk ⋅c( )
⎧ ⎨ ⎩
⎫ ⎬ ⎭
, [2-12]
where the crystal has N unit cells along the a, b, and c axes.29 Again, the intensity is the
observed quantity; therefore, the modulus squared of the wave function is approximately
�
Ψ*(r,t)Ψ(r,t) = A2 sin2 1 2NΔk ⋅ a( )
sin2 1 2Δk ⋅ a( )⎧ ⎨ ⎩
⎫ ⎬ ⎭ ×
sin2 1 2NΔk ⋅ b( )sin2 1 2Δk ⋅ b( )
⎧ ⎨ ⎩
⎫ ⎬ ⎭ ×
sin2 1 2NΔk ⋅c( )sin2 1 2Δk ⋅c( )
⎧ ⎨ ⎩
⎫ ⎬ ⎭
[2-13]
where, for the limiting case, a maximum intensity of order N2 is found only for values of

17
�
Δk ⋅ a = 2πh1, [2-14]
�
Δk ⋅ b = 2πh2, [2-15]
�
Δk ⋅c = 2πh3 , [2-16]
which are known as the Laue equations 25, 26, 29 for integer values of h1, h2 and h3.
Three vectors that satisfy the Laue equations are 25, 29, 30
B1 = 2π
�
b × ca ⋅ b × c( ) , [2-17]
B2 = 2π
�
c × aa ⋅ b × c( ) , [2-18]
B3 = 2π
�
a × ba ⋅ b × c( ) , [2-19]
and Δk can be defined as
Δk = h1 B1 + h2 B2 + h3 B3, [2-20]
which is known as the Laue condition.30 Vectors that satisfy the Laue condition are
called reciprocal lattice vectors, and when applied to the Laue equations yield terms of
the kind
a⋅B1 = 2π [2-21]
b⋅B2 = 2π [2-22]
c⋅B3 = 2π [2-23]

18
E. CONSTRUCTING THE RECIPROCAL LATTICE OF Cr(110)
As mentioned previously, Cr crystallizes as a BCC. The Cr(110) plane is quasi-
hexagonal with real lattice constants defined as,
a =
�
ai^, [2-24]
b =
�
− a 2i^ +
�
a 2 j^
, [2-25]
c =
�
k^
, [2-26]
where c is a unit vector in
�
k^
since this is a surface experiment, Figure 2-7. The
calculated reciprocal lattice constants using 2-17 – 2-19 in conjunction with 2-21 – 2-23
are,
B1 =
�
2π 22a
j^
+12a
i^⎛
⎝ ⎜ ⎞ ⎠ ⎟ , B2 =
�
2π 2a
j^⎛
⎝ ⎜ ⎞ ⎠ ⎟ , A3= 2π
�
k^
, figure 2-8. [2-27]
Figure 2-7: Theoretical real lattice drawing of Cr(110).
Figure 2-8: Theoretical reciprocal lattice drawing of Cr(110) based on the Laue condition.
!a
2 i^+ a
2j^
a i^
a2
a
j^
i^
2a x2
^
22a x2
^+
12a
x1^

19
Figure 2-9: Observed LEED image of Cr(110) at room temperature with overlaid theoretical reciprocal lattice of Cr(110). The image demonstrates the correlation between the theoretical image derived from the Laue equations and the pattern observed with LEED.

20
CHAPTER III
EXPERIMENTAL TECHNIQUES
A. ULTRA HIGH VACUUM
Ultra high vacuum (UHV) conditions are satisfied when a pressure of 1x10⁻⁹ Torr
or lower is achieved. Under UHV conditions, a clean surface can be analyzed without
the influence of contamination from the residual gasses in the chamber for several
hours.26 A typical 3-dimensional solid will have a density of ~1023 atoms/cm3; whereas,
a typical 2-dimensional surface will have ~1015 atoms/cm2.26 For instance, the bulk
atomic density of Cr is nbulk = 8.4 x 1022 cm-3 and the atomic density of the (110) surface
is σ(110) = 1.7 x 1015 cm-2. The atoms at a surface have a lower coordination than those in
the bulk. In other words, the surface atoms interact with other atoms in the plane of the
surface and below the surface. The fact that there are no atoms above the surface with
which to interact can result in changes of the chemical, electronic, and magnetic
properties of the surface atoms when compared to the atoms within the bulk of the
crystal.

21
For a dilute gas, the molecules have a Maxwell-Boltzmann average thermal
velocity,
�
v , defined as
�
v =8kT
πm , [3-1]
where k = 1.38x10⁻²³ is the Boltzmann constant, T is the absolute temperature in
Kelvin, and m is the molecular mass (e.g., 32 amu for O2). The atoms impinge on a
square centimeter of the surface at an average flux, Φg, defined as
Φg= [3-2]
where n = is the number of gas molecules per unit volume. Substituting the
expression for the average thermal velocity into the expression for the flux and assuming
that the gas acts as an ideal gas,
PV = NkT, [3-3]
where P is the pressure in Torr, V is the volume in cm3, and N is the number of gas
molecules, the incident flux can be defined as 26

22
�
Φg
=P
2πmkT= 3.5 ×10²² P
mT (molecules·cm-2·s-1). [3-4]
Therefore, the incident particle flux is directly proportional to the pressure for a given
temperature T. To reduce surface contamination from surrounding gas molecules, a low
pressure must be maintained.
When molecules impinge on a surface, some of them will bind to the surface,
which is called adsorption, and some will interact weakly and return to the gas phase.
Therefore, one can define a sticking coefficient, S, which is the probability that an
impinging molecule binds to the surface. As previously stated, a crystalline surface has
approximately 1015 adsorption sites per square centimeter. If a diatomic gas molecule
adsorbs on the surface dissociatively, a flux of 5 x 10¹⁴ molecules·cm-2·s-1 will result in
the formation of a monolayer on the surface within approximately one second if the
sticking coefficient S is unity. For oxygen (m = 32 amu) at room temperature
(T = 300 K), the pressure dependent flux is
�
ΦO2
= 3.6 ×10²⁰P (molecules·cm-2·s-1). [3-5]
For reactive surfaces where the sticking coefficient is close to one, an oxygen pressure of
10-6 Torr will result in the formation of a monolayer of atomic oxygen on a surface within
approximately one second.
For surface science studies, the amount of gas molecules dosed onto a surface is
measured in units of Langmuir, which is defined as

23
1 L = 1 x 10⁻⁶ Torr·s. [3-6]
Therefore, a dose of one L will produce approximately a monolayer of adsorbed gas
molecules on a reactive surface at room temperature. The time to form a monolayer of
gas molecules on a surface is given by
�
τ ≈10−6
S ⋅P (seconds). [3-7]
From Eqtn. 3-7, it can be seen that at a pressure of 10-6 Torr a new monolayer will form
every second on reactive surfaces. However, at a pressure of 10-10 Torr it will take at
least 10,000 s (~3 hr) to form a monolayer of adsorbed gas molecules on the surface. It
then becomes evident that surface analysis should be performed under UHV conditions to
prevent the influence of surface contamination from gases within the vacuum chamber.

24
B. VACUUM TECHNIQUES
The measurements for this thesis project were performed in a stainless steel UHV
chamber. This UHV chamber with pumps, quadrupole mass spectrometer, and x,y,z,
manipulator is shown in Figure 3-1 and Figure 3-2. The pressure was maintained by a
combination of vacuum pumps. A rotary vane pump, which is an oil lubricated
compression pump, can achieve pressures as low as 1 x 10⁻³ Torr. The pump has a
zeolite trap to capture oil that would diffuse into the UHV chamber, causing
contamination of the system. The rotary vane pump is connected to a turbo molecular
pump, which is then connected directly to the UHV chamber. In other words, the rotary
vane pump backs the turbo molecular pump. The turbo molecular pump has a series of
fan blades that rotate at frequencies of roughly 60,000 rpm and pump gases in the
chamber by momentum transfer. The turbo molecular pump can achieve a pressure as
low at 10-11 Torr if a backing pressure of 10-3 Torr is maintained. The UHV chamber also
has an ion pump and a titanium sublimation pump (TSP). The ion pump works by field
emitting electrons from titanium plates into central electrodes, which can cause ionization
of gas molecules within the pump. Once the gas molecules are ionized, they are
accelerated towards the titanium plates, where they imbed in the titanium and are
reactively pumped away. Large magnets are used to increase the pumping speed by
causing the field emitted electrons to follow a helical path, which increases the
probability of interacting with gas molecules in the pump. Since the molecules are
captured by reacting with the titanium plates, ion pumps cannot be used for pumping
inert gases such as argon or neon. The TSP uses a layer of clean titanium to pump
reactive gases such as water and hydrogen. Titanium is evaporated from a titanium alloy

25
wire by resistance heating, which is known as flashing the TSP. The evaporated titanium
sticks to the walls of the vacuum can that houses the TSP.
When the UHV system is initially pumped down from atmospheric pressure, the
combination of the ion pump and the turbo molecular pump will only reduce the pressure
to about 10-7 Torr initially. This is because there is a large flux of gas molecules,
primarily water, desorbing from the walls of the vacuum chamber. To achieve UHV, the
chamber and the pumps must be baked for at least 24 hours at an approximate
temperature of 150 ˚C. After bake out, the base pressure for this UHV chamber was
4 x10-11 Torr. Once UHV is achieved, the TSP is flashed for nearly 90 seconds at the
start of every day before any work was carried out so that a fresh layer of titanium would
be available to pump reactive gases in the chamber during the day. As a final note,
besides creating a clean environment for studying crystal surfaces, UHV conditions also
decrease the mean free path collision rate between residual gas molecules. This decrease
provides an ideal environment where low energy electron diffraction (LEED) and
temperature programmed desorption (TPD) analyses can be performed without
interference with the residual gas molecules in the chamber.

26
Figure 3-1: Ultra-High Vacuum chamber with pumping system labeled.
Titanium Sublimation Pump
Turbo Molecular Pump
Ion Pump
Rotary Vane Pump Oxygen
Flask
Argon Flask

27
Dewar
Argon Flask
Turbomolecular Pump
Cr(110) Sample in Vacuum Chamber
Quadrupole Mass Spectrometer
x-y-z Manipulator
Variable Leak Valve
Figure 3-2: Ultra-High Vacuum chamber with quadrupole mass spectrometer and x,y,z manipulator. The oxygen flask is not seen since it is directly behind the argon flask.

28
C. LOW ENERGY ELECTRON DIFFRACTION OPTICS
The technique used to determine the surface crystal structure was low energy
electron diffraction (LEED). A LEED optics consists of an electron gun to emit,
accelerate and direct electrons towards a target crystal where the electrons then back-
scatter, a series of hemispherical grids to reject the inelastically back-scattered electrons
and to accelerate the elastically back-scattered electrons towards the detector, and a
hemispherical fluorescent screen to detect the electrons. A schematic of the electron gun
and the detector are shown in Figure 3-3.12
The electron gun for this experiment houses a Wehnelt cylinder that contains a
heated filament for the thermionic emission electrons. The filament is biased negatively
with respect to the grounded nozzle of the electron gun, so that the electrons leave the
gun at ground potential with a kinetic energy of E = eVfil. The nozzle of the electron gun
and the crystal are both held at ground to prevent electron deflection by stray electric
fields. In addition, the LEED optics are surrounded by a metal can made of µ-metal,
which shields stray magnetic fields that can also deflect the electrons. The electrons are
then incident on the crystal and back-scatter. The back-scattered electrons then come in
contact with four grids. The first grid is held at ground to create an electric field-free
region between the crystal sample and the fluorescent screen. The second and third grids
are held at small negative potentials, with respect to the electron beam potential, and act
to filter out the inelastically scattered electrons. The fourth grid is held at ground and the
fluorescent screen is held at approximately 3kV. The elastic electrons are then
accelerated between the fourth grid and the screen, acquiring an energy that allows light
to be emitted when they strike the phosphorescent screen.

29
Figure 3-3: Schematic of electron gun and detector of LEED. The electron gun consists of (a) heater filament/cathode, (b) Wehnelt cylinder, (c) anode held at ground potential, and (d) focusing rings. The detector is composed of four hemispherical grids (e) and (f) held at ground potential, (g) held at a potential less than the accelerating potential to filter out inelastically scattered electrons, and (h) collector (phosphor screen) held at a potential between 2kV and 5kV. The sample (i) is held a ground potential.

30
D. CRYSTAL SAMPLE HOLDER
The crystal sample holder shown below in Figure 3-4 is made of oxygen free high
conductivity (OFHC) copper. It is attached to a Dewar that is then attached to an x-y-z
manipulator. The manipulator allows the tilt angle φ to be adjusted for crystal alignment.
It also has a differentially pumped rotary motion feedthrough to allow rotation of the
sample through a full θ = 360°, Figure 3-5 below. The Dewar can be manually filled
with liquid nitrogen to cool the crystal to temperatures approaching 120 K. Compressed
air can also be blown into the Dewar to prevent overheating of the sample holder during
annealing of the crystal. The crystal is affixed to a molybdenum insert by two 0.005 inch
tantalum wires that are spot welded to the edges of the crystal. The insert is fastened onto
the copper sample holder by two molybdenum leaf springs. A type K (chromel-alumel)
thermocouple is spot welded to the edge of the crystal so that its temperature can be
monitored. The crystal can be radiatively heated from a tungsten filament located behind
the molybdenum insert. The maximum temperature that can be achieved using this
method is ~973 K. The crystal can also be heated using an electron beam by biasing the
sample at +750V while running a current through the tungsten filament. This is generally
a cleaner method of heating the sample since most of the power is dissipated by the
electron beam as it interacts with the crystal. With radiative heating, most of the
radiation is reflected off of the crystal and is eventually absorbed by the sample holder
and the rest of the chamber. The main drawback of e-beam heating is that the heating
rate is nonlinear, which can result in overheating of the sample if the filament current is
too high.

31
Figure 3-4: Interior view of ultra-high vacuum chamber. The image shows the (a) LEED shutter, the (b) quadruple mass spectrometer detector, the (c) thermocouple leads, the (d) Cr(110) sample, the (e) Dewar, and the (f) sample holder.

32
Dewar
x-y-z Manipulator
Vacuum chamber view port and Cr(110) sample
Coaxial cable connection for either grounding the sample during sputter ingcycles or for applying +750 V during annealing cycles
Figure 3-5: x,y,z manipulator and ultra-high vacuum chamber viewport housing Cr(110) sample.

33
E. TEMPERATURE PROGRAMMED DESORPTION
Temperature programmed desorption (TPD) analysis is a technique used for
measuring the interaction of gas molecules with a surface. With this technique, the
activation energy for desorption, the desorption kinetics, and the relative coverage of the
desorbing species can be determined. The TPD measurements consist of heating a
sample, usually in a linear rate, while measuring the partial pressures of the desorbed
molecules with a mass spectrometer. TPD analysis has become a standard investigative
method in surface science experiments. Though it only divulges basic chemical
processes of a surface, it can lead to results that require further investigation using more
sophisticated instrumentation and theory. Though TPD studies were conducted as early
as 1933 by Taylor and Langmuir, it was G. Ehrlich who first used TPD at low pressures
and rapid heating rates to characterize the desorption kinetics of cesium on a tungsten
substrate.31 P.A. Redhead adapted Ehrlich’s method by using slower heating rates.32 The
slower heating rates allowed Redhead to observe the existence of more binding states on
surfaces and it also gave a linear dependence of temperature to time instead of the
hyperbolic dependence that existed using Ehrlich’s rapid heating rates.31 It is Redhead’s
slow heating rate method of TPD analysis that is used in this study.
The TPD system used to study the kinetics of the CO/Cr2O3(0001)/Cr(110) crystal
is composed of a quadrupole mass spectrometer (QMS), which is also called a residual
gas analyzer (RGA), a preamplifier, a data acquisition (DAQ) board, a computer, and a
power supply for the heater filament. The preamplifier is used to amplify the
thermocouple voltage, thus reducing noise. The DAQ board allows the computer to read
the thermocouple voltage and to send a signal to control the filament power supply. Two

34
programs, which were written in LABView, were used for the TPD measurements. One
program used a proportional feedback control to create the constant heating rate and
collect the temperature vs. time data. The other program collected the partial pressure vs.
time data.33
The QMS measures the mass to charge ratio m/z of ionized atoms and molecules.
The desorbed CO molecules from the Cr2O3(001)/Cr(110) surface are ionized by a beam
of 70 eV electrons at the front section of the QMS. The ionized gas is then accelerated
through a potential field towards four electrically charged rods. A DC source and a radio
frequency (RF) source are connected to the rods.26 Each pair has its own DC and RF
source associated with it, with the DC signal superimposed on the RF signal. The pairs
of rods are at equal and opposite potentials. The RF source is swept over a frequency
spectrum and serves as a discriminator, since at given radio frequencies only ions with a
certain characteristic mass to charge ratio m/z will resonate through the rods and be
detected as seen below in the figure 3-6.35
Figure 3-6: Schematic of quadrupole mass spectrometer (QMS)

35
The thermocouple signal is amplified by a preamp with a gain of G = 101 to
increase the signal to noise level. A LABView program was used to read in the
temperature of the crystal and to send a signal to the filament power supply to ramp up
the temperature of the crystal, thus creating a temperature vs. time file. The conversion
of the thermocouple voltage to a temperature was achieved by using two different
polynomial conversion factors: one for 73 K to 273 K and another from 273 K to
773 K.35 A linear heating rate was achieved using a proportional feedback control. In
addition to the heating rate, the temperature ramp program also controls the maximum
input current to the sample filament, maximum execution time, time delay between data
collection points, and maximum sample temperature. A second LABView program was
used to measure the partial pressures of up to eight different types of molecules, creating
a partial pressure vs. time file. The communication between the QMS controller and the
computer was done via the COM port of the computer. The programs graphically display
the acquired data in real time, making it possible to visually ensure that the temperature
increase is linear with time and to see the partial pressures of the desorbing gas
molecules. Though the programs had already been created for a previous study,33 the
temperature control program had to be modified to detect temperatures below 273 K by
adding a second polynomial conversion factor.

36
F. ANALYSIS OF ACTIVATION ENERGY USING TPD ANALYSIS
One of the main goals of this experiment is to measure the activation energy for
the desorption of CO from the Cr2O3(0001)/Cr(110) surface. As previously stated, the
TPD analysis for this study uses the slow heating rate method that P.A. Redhead
developed.32 The rate of desorption of molecules from a surface is given by the Polanyi-
Wigner expression
�
r(θ) = −dθdt
= −vn× e
−E
a
RT ×θ n , [3-8]
where θ is the fractional surface coverage, Ea is the activation energy, vn is a pre-
exponential factor indicating the number of attempts of desorption a molecule undergoes
per second, R is the ideal gas constant, T is the temperature, n is the kinetic order of the
desorption. A kinetic order of 0 is attributed to desorption of a multilayer of an
adsorbate, a kinetic order of 1 is attributed to direct desorption of a molecular species,
and a kinetic order of 2 is attributed to a multi-step desorption process (e.g.,
recombination of atomic oxygen before desorption as molecular oxygen) 31. The product,
�
νn× e
−E
a
RT
⎛ ⎝ ⎜
⎞ ⎠ ⎟ , is known as the Arrhenius equation, which gives the dependence of the
desorption rate on the temperature for a chemical reaction. By using a computer
controlled feedback loop, the temperature of the surface is heated at a linear rate
T=To+βt, [3-9]

37
where T is the instantaneous temperature, To is the initial temperature, β is the heating
rate (°C/s), and t is the time in seconds. The surface coverage is temperature dependent
θ=θ(T) [3-10]
such that an instantaneous surface coverage change with temperature is defined by
�
dθdT
=dθdt
×dt
dT=
dθdt
×1β .
[3-11]
Substituting expression [3-8] into expression [3-11] yields
�
dθdT
=1β× v
n× e
(−E
a
RT)×θ n . [3-12]
The temperature at which the maximum of the pressure vs. time curve occurs can be
found by taking the derivative of the change in adsorbate coverage with respect to
temperature and setting this expression to zero 33
�
d
dT
dθdT
⎛ ⎝
⎞ ⎠
Tpeak
= −ν
nθ n
βE
a
RTpeak
2 e
−E
a
RTpeak +
νnnθ n−1
βdθdT
e
−E
a
RTpeak = 0 . [3-13]
This results in

38
�
nθ n−1 νβ
e
−E
a
RTpeak = −
Ea
RTpeak
2 [3-14]
by substituting expression [3-12] into [3-13] and cancelling like terms. This can be
rewritten as
�
lnT
peak
2
β⎛
⎝ ⎜ ⎞
⎠ ⎟ =E
a
R
1T
peak
+ ln Ea
Rnθ n−1νn
⎛ ⎝ ⎜
⎞ ⎠ ⎟ [3-15]
For first order kinetics (n = 1), which is expected for CO desorption from the
Cr2O3(0001)\Cr(110) crystal surface, the intercept of expression [3-8] no longer depends
on the coverage. By plotting
�
lnΤpeak
2
β⎛
⎝ ⎜ ⎞
⎠ ⎟ versus for various heating rates, the
slope of the curve can be determined. The activation energy can be determined by taking
the product of the slope and the gas constant R.

39
CHAPTER IV
EXPERIMENTAL RESULTS
A. PREPARATION OF THE Cr(110) SURFACE
The experiments were conducted in an UHV environment with a base pressure of
approximately 4 x 10-11 Torr. Before any sample preparation was performed, the TSP
was flashed for 1.5 min at 45 A. To clean the crystal surface, it was sputtered with argon
ions followed by annealing to heal the surface. Since the chromium crystal had a large
amount of carbon and nitrogen impurities in the bulk, several sputter/anneal cycles were
needed to obtain a clean Cr(110) surface. Prior to the measurements performed in this
study, the crystal had been through approximately a month of daily sputter-anneal cycles,
but the bare Cr(110) surface still showed streaks and spots associated with carbon and
nitrogen overlayer structures. The first two sputter/anneal cycles done for this study were
performed at room temperature. To enhance the removal of bulk impurities, proceeding
sputter/anneal cycles were conducted at a temperature of approximately 773 K.
The sputtering process consisted of first introducing argon gas into the chamber
up to a pressure of approximately 5 x 10⁻⁵ Torr with both the turbo pump and ion pump
gate valves closed. A photo of the UHV system is shown in Figure 4-1. For hot
sputtering, the sample filament was then connected to a current source which was ramped
to 2.5 A via a LABView program. The ion gun acceleration voltage was set to 1000 V

40
and the ion gun filament current to 2.2 A. The current from the sample to ground was
monitored during the sputter cycle and was typically about 8 µA. The duration of each
sputter cycle was 40 minutes, and the maximum temperature during the sputter cycle
ranged between 283 K and 818 K.
Before performing the high temperature anneals, the gate valve to the turbo pump
was first opened and then the gate valve to the ion pump was opened once the chamber
pressure fell below 5 x 10⁻⁹ Torr, (see Figures 3-1a and 3-3). Electron-beam (e-beam)
heating was used to perform the high temperature anneals. This was done by setting the
filament current to 2.45 A and biasing the crystal at +750 V, which extracts electrons
from the heater filament. The current from the high voltage power supply (emission
current) was monitored using a multimeter and was typically about 5 mA. The sample
was annealed for five minutes at a temperature of 993 K. The sample was allowed to
cool to room temperature before another sputter/anneal cycle was conducted.
The cleanliness of the crystal surface was determined from the images observed
from LEED analysis. For a clean crystal, sharp bright spots with no streaks and low
diffuse background should be observed.1, 26 As mentioned previously, new chromium
single crystals typically have large amounts of nitrogen and carbon impurities. The first
studies of the Cr(110) crystal were performed in a previous study.12 A LEED image after
the first 10 days of sputter-anneal cycles performed in the aforementioned study is shown
in Figure 4-1a. Streaks and extra spots can be seen in this image, which are due to the
segregation of carbon and nitrogen impurities to the surface. To prepare a clean surface
for the growth of the epitaxial oxide, the first few weeks of my study involved the daily
or sometimes twice daily sputtering and annealing of the Cr(110) crystal. LEED analyses

41
were conducted after the second through fifth, tenth and eighteenth sputter/anneal cycles.
The analysis performed before the oxidation of the surface still revealed some streaks and
extra spots in the LEED pattern, as shown in Figure 4-1b. Notably, approximately one
more month of sputter/anneal cycles were performed in a study 37 that followed the
completion of this research project. The extra month of sputter/anneal cycles resulted in
the formation of a clean Cr(110) surface without any extra spots or streaks associated
with C or N segregation, as seen in Figure 4-1c.

42
(a)
(b)
(c)
Figure 4-1 LEED analysis of Cr(110) after several sputter/anneal cycles at room temperature. The LEED images were recorded at an electron beam energy of 75 eV after (a) 12 of 15 sputter/anneal cycles performed in a previous study 12. (b) after 17 of 19 sputter/anneal cycles in my study and (c) after 2 of 36 sputter/anneal cycles performed in a study37 immediately following my research project.

43
B. GROWTH OF EPITAXIAL Cr2O3(0001) ON Cr(110)
Exposing the chromium surface to oxygen at elevated temperatures will remove
any carbon at the surface by the formation of CO and CO2 and will also displace any
surface nitrogen since the binding affinity of oxygen with chromium is greater than that
of nitrogen with chromium. Therefore, the formation of the epitaxial Cr2O3(0001)
surface was performed even though all of the carbon and nitrogen impurities had not been
removed from the Cr(110) surface. To form the oxide, the ion pump gate valve was
closed, and the turbo pump gate valve was left open while oxygen was progressively
introduced to backfill the chamber to a pressure of approximately 1 x 10⁻⁶ Torr. The
filament current was then ramped to 2.2 A to quickly raise the temperature to 550 K.
Once a temperature of 550 K was obtained, the filament current was reduced to 2.0 A to
maintain the crystal at a temperature of 550 K for 1 minute. The filament current was
then increased to 2.6 A to increase the temperature to 775 K. The filament current was
then reduced to 2.5 A for 2 minutes to maintain the crystal at 775 K. The oxygen leak
valve was then shut off, and the crystal was flashed to approximately 1000 K in UHV
using e-beam heating. LEED analysis was then conducted to confirm presence of a well-
ordered Cr2O3(0001) surface structure, as shown below in Figure 4-2. Even though the
LEED pattern of the Cr(110) surface before oxidation did exhibit some streaks, no streaks
or extra spots were observed for the LEED pattern of the Cr2O3(0001) surface.

44
Figure 4-2: LEED analysis of Cr2O3(0001)/Cr(110) at room temperature for this study. The images were recorded with an electron beam energy of (a) 54.5 eV, (b) 75.0 eV and (c) 112.8 eV.
(a)
(b)
(c)

45
C. TEMPERATURE DEPENDENT LEED ANALYSES OF Cr2O3(0001)/Cr(110)
The temperature dependence of the Cr2O3(0001)/Cr(110) surface was previously
studied by another group.1 They observed a diffuse (√3X√3) R30º superstructure at room
temperature that became more pronounced at 150 K and vanished between 90 K and 100
K, as shown in Figure 4-3. This transition was attributed to the antiferromagnetic
coupling of the surface chromium ions. As mentioned earlier, a previous study 12
repeated these temperature dependent LEED measurements with the crystal used in this
(a) (b)
(c)
Figure 4-3: LEED analysis of Cr2O3(0001)/Cr(110) at 300 K, 150 K and 90 K from a previous study. The images were recorded with an electron beam energy of 24 eV with a √3x√3 R30º reconstruction surrounding the (0,0) diffraction spot that is (a) diffuse at 300 K, (b) most pronounced at 150 K and (c) not present at 90 K. From ref. [1].

46
study and found no (√3X√3) R30º superstructure over a temperature range of 140 K to
675 K. Since it is possible that nitrogen and carbon impurities in the near surface region
might have affected the Cr2O3 overlayer structure, these temperature dependent LEED
measurements were repeated on a cleaner Cr(110) substrate as part of this research
project. LEED measurements of the Cr2O3(0001)/Cr(110) surface were performed at
room temperature and at approximately 120 K as shown in Figure 4-4. No evidence of a
(√3x√3)R30o surface structure reconstruction was observed.
Figure 4-4: LEED analysis of Cr2O3(0001)/Cr(110) at ~ 300 K and 125 K for this study. The images were recorded with an electron beam energy of 54.5 eV for temperatures of (a) ~ 300 K and (b) 125 K.
(a) (b)

47
D. ADSORPTION OF CARBON MONOXIDE ON Cr2O3(0001)/Cr(110)
i. CO Dosing Sequence
Before dosing the crystal with CO, it was flashed for 1 minute at 750 K and
allowed to cool to room temperature before being cooled using liquid nitrogen. The
liquid nitrogen-cooling process took up to one hour to approach typical temperatures
between 140 K and 122 K . The cooling process was necessary since CO does not stick
on the Cr2O3(0001) surface at room temperature. Carbon monoxide was then supplied to
the vacuum chamber through a variable leak valve that was connected to a CO lecture
bottle. A CO dosing sequence was performed to determine the saturation dosage for the
Cr2O3(0001) surface. In Figure 4-5 the TPD spectra for dosages of 0.1 L, 0.2 L, 0.3 L,
0.5 L, 10 L, and 20 L can be seen, where 1 Langmuir (L) is defined as 1x10⁻⁶ Torr·s. For
these measurements, the linear translator of the mass spectrometer was set at 42 mm each
time, which results in the collimator of the mass spectrometer being within a couple of
millimeters of the surface of the crystal. The parameters of the TPD measurements were
a heating rate of 10 oC/min, an initial current of 0.5 A, a feedback constant of .0015, a
final current of 3.5 A, a shut off temperature of 475 K, and a time delay of 1000 ms. To
determine the relative coverages associated with each dosage, the areas under the
pressure versus time curves were calculated. A compilation of these relative coverages is
given in Table 4-1. As can be seen in the table, the saturation coverage is achieved at
approximately 0.5 L.
A previous study 2 reported that the saturation coverage of CO on the
Cr2O3(0001) surface exibits a (√3x√3)R30o symmetry. However, this pattern was only
observed within the first 10 s after the introduction of CO, which indicates that the CO is

48
easily desorbed by low energy electron interactions. The LEED images of the CO
covered surface after dosing 1L and 10L at 147 K are shown in Figure 4-6. These images
were taken after a few minutes of exposure to the electron beam. As with the previous
measurements,2 no overlayer reconstruction is observed, which is expected if the CO is
sensitive to electron beam desorption.
The TPD spectra represented in Figure 4-5 also show an overall shift of 4 K in the
temperature of the TPD peak from initial coverage to saturation, as noted in Table 4-2.
The slight shift in peak desorption temperatures indicates that CO desorbs from the
Cr2O3(0001)/Cr(110) surface as a 1st order kinetics, which has been found in previous
studies. This indicates that the CO molecules adsorb molecularly (i.e., they do not
dissociate upon adsorption). The slight increase in the temperature of the desorption peak
with coverage probably results from an attractive CO-CO interaction.
It is important to understand that area under the pressure versus temperature
graphs do not represent the adsorbate surface coverage. To extract information regarding
the adsorbate surface coverage, it is necessary to compute and analyze the areas under the
pressure versus time curves. For this study, analysis of the area under the pressure versus
time curves verified that CO saturated on the chrome oxide surface at approximately 0.5
L as was observed graphically and tabulated in Table 4-1.

49
Figure 4-5: TPD spectra of CO from the Cr2O3(0001)/Cr(110) surface at a heating rate of 10 ºC/min for different doses of CO. TPD spectra for doses of 0.5 L, 10 L, and 20 L are similar, indicating that CO adsorption saturates at a dose of ~0.5L. The slight shift in the temperature of the TPD peak indicates that CO desorbs as a 1st order kinetics. NOTE: The ordinate of the pressure vs. temperature graph is offset in order to better resolve the TPD spectra at the different doses.
3.0x10⁻⁹
2.5
2.0
1.5
1.0
0.5
Part
ial P
ress
ure
(Tor
r)
220200180160140
Temperature (K)
20 L 10 L 0.5 L 0.3 L 0.2 L 0.1 L
Tdep = 120 K! = 10 ˚C/min
m/z = 28

50
Temperature Programmed Desorption of CO from Cr2O3(0001)/Cr(110)
Area under the Pressure versus Time curve
CO Dose (L) Area (Torr*s) Peak Temperature (K)
0.1 1.30 x 10⁻⁸
0.2 2.65 x 10⁻⁸ 166
0.3 3.28 x 10⁻⁸ 166
0.5 6.26 x 10⁻⁸ 168
10 6.41 x 10⁻⁸ 169
20 6.57 x 10⁻⁸ 170
(a) (b)
Figure 4-6: LEED analysis of CO/Cr2O3(0001)/Cr(110) for doses of 1 L and 10 L. The analysis was conducted at 147 K with an electron beam energy of 55 eV and a CO dose of (a) 1 L and (b) 10 L.
Table 4-1: Areas calculated from pressure versus time curve and corresponding temperature of the maximum of the TPD peak. A CO dose of 1 L was used in this study to ensure that a saturation layer of CO was adsorbed on the Cr2O3(0001)/Cr(001) crystal surface.

51
ii. Dependence of TPD Spectra on Heating Rate
For a fixed CO coverage, the temperature at which the peak desorption pressure
occurs depends on the heating rate. An example of this is shown in Figure 4-7 for 1 L
CO on Cr2O3(0001)/Cr(110) with heating rates of 5, 10, 25, and 50 °C/min. The
desorption rate, dθ/dT, depends on the surface coverage θ and the Boltzmann factor, as
defined by
�
dθdT
=1β×υ
n× e
(−E
a
RT)×θ n (equation 3-12). As the temperature increases, the
probability of desorption increases, resulting in a decrease in the surface coverage. Since
there is a finite amount of adsorbate on the surface, increasing the temperature will
eventually result in a change from an increasing desorption rate to a decreasing
desorption rate, resulting in a peak in the TPD curve. For higher heating rates, the TPD
peak will shift to higher temperatures than for lower heating rates, as shown in
Figure 4-7. The reason for this is that the desorption probability increases with
temperature, so a fast heating rate results in less time at a particular temperature for the
adsorbate atoms to desorb.
In this study, the crystal surface was cooled to within 120 K, then a saturation
layer of 1 L of CO was dosed onto surface as described in section (i) above. To achieve a
1 L dose of CO, it was introduced via a leak valve at a background pressure of 5 x 10⁻⁹
Torr for 200 seconds with the gate valve to the ion pump closed. After 200 seconds the
CO leak valve was shut and the gate valve to the ion pump was opened to the chamber
after a pressure in the 1 x 10⁻¹⁰ Torr was obtained. The chamber was then monitored
using the QMS, prior to heating the sample, to verify pressure stability of the chamber
with respect to any degassing particles. Once it was determined that the chamber

52
environment was stable, TPD analysis was preformed for various heating rates. TPD
analysis for heating rates of 5 ºC/min, 10 ºC/min, 25 ºC/min and 50 ºC/min were
performed on two separate days. During the TPD analysis, the gate valve to the turbo
pump and the gate valve to the ion pump were left open to ensure that the registered CO
desorption pressure at the mass spectrometer was proportional to the rate of desorption
from the crystal surface. The temperature of the TPD peak maximum, as observed in the
pressure versus temperature graph for CO desorption from the Cr2O3(0001)/Cr(110)
surface, increases with increasing heating rate. The areas under the pressure-time curves
and the corresponding peak maxima temperatures of desorption for each heating rate is
presented in Table 4.2. For a saturation coverage of CO, the area under the pressure-time
curve should be independent of heating rate. As seen in Table 4-2, there is only a 6%
difference between the lowest and highest area.
The values for the areas under the pressure-time curves listed in Table 4-1 are
about 20% larger than those listed in Table 4-2. This most likely is the result of a
difference in the position of the mass spectrometer during the measurements. For the
first series of measurements, the position of the linear translator was determined by
reading directly off of its scale. For subsequent measurements, a ruler along with the
scale markings on the linear translator were used to determine the position of the mass
spectrometer, which probably caused a change in its absolute position.

53
Figure 4-7: Pressure versus temperature curves for several heating rates for a CO dose of 1.0 L. The inset shows a temperature versus time graph for the heating rate of 10ºC/min.
4.0x10⁻⁹
3.0
2.0
1.0
Part
ial P
ress
ure
(Tor
r)
200180160140
Temperature (K)
50 ºC/min 25 ºC/min 10 ºC/min 5 ºC/min
CO (1 L)Tdep = 120 K
m/z = 28

54
Temperature Programmed Desorption of CO from Cr2O3(0001)/CO(110)
Average Desorption Peak Temperature
Heating Rates (ºC/min) Area (Torr*s) Peak
Temperature (K)
5 4.9 x 10⁻⁸ 165
10 5.0 x 10⁻⁸ 168
25 4.7 x 10⁻⁸ 171
50 4.7 x 10⁻⁸ 174
iii. Activation Energy Analysis
CO desorption from the Cr2O3(0001)/Cr(110) surface, for a linear heating rate,
was found to desorb as a first order kinetics. Employing the Redhead method, which is
valid for a first order desorption, n = 1, and a linear heating rate, β =
�
∂T∂t
= constant, a
coverage independent expression is found that relates the activation energy, Ea, to the
temperature of the desorption rate maximum, Tpeak, and to the heating rate, β. The
activation energy is calculated from the slope of the graph of the
�
ln Tpeak
2
β⎛ ⎝ ⎜
⎞ ⎠ ⎟ versus
�
1T
peak
⎛ ⎝
⎞ ⎠ for various heating rates. For this study, heating rates of 5 ºC/min, 10 ºC/min,
25 ºC/min and 50 ºC/min were used. Three runs were performed with each heating rate
except 10 ºC/min, where two measurements were made. The temperatures, Tpeak, and
Table 4-2: Areas calculated from pressure versus time curve and the temperature of the maximum of the TPD peak for heating rates ranging from 5 ºC/min to 50 ºC/min for a dose of 1.0 L of CO. Pressure versus temperature curves are shown in Figure 4-7.

55
corresponding heating rates that are listed in Table 4-3, were plotted and a linear
regression line was fit to the points as shown in Figure 4-8. The value of the slope of the
equation of the linear regression resulted in an activation energy of 49.2 ± 2.6 kJ/mol.
Heating Rate, ß (ºC/min) Tpeak(K)
5 164 168 168
10 165 168 *
25 171 172 171
50 175 177 174
*Data lost due to software failure
Table 4-3: Temperature of the maximum of the TPD peak for each dose of 1.0 L of CO.

56
Figure 4-8: Arrhenius plot assuming first order desorption kinetics for a dose of 1.0 L of CO. The product of the slope of the linear fit line and the gas constant, R, yields a value for the activation energy, Ea, for desorption.
12.5
12.0
11.5
11.0
10.5
ln [(
T pea
k)2 /R
H]
6.0x10-35.95.85.71/Tpeak (K-1)
Activation EnergyEa = 49.2 ± 2.6 kJ/mol

57
CHAPTER V
DISCUSSION
The presence of extra spots in the LEED pattern of the Cr(110) surface during the
first several months of cleaning the crystal with sputter/anneal cycles provides evidence
that bulk impurities (most likely nitrogen and carbon) were diffusing to the surface
during the annealing process. Even though the Cr(110) surface had some impurities, the
growth of the oxide resulted in a well-ordered surface structure of Cr2O3(0001)/Cr(110)
as observed in the LEED analysis. This provides evidence that exposure to oxygen
helped clean the surface of the nitrogen and carbon impurities.
LEED analyses of the Cr2O3(0001)/Cr(110) surface at temperatures as low as 120
K failed to reveal the presence of a (√3x√3) R30o superstructure as discussed in a
previous study.1 The absence of the superstructure in our studies could be attributed to
the lower base pressure of the chamber. The base pressure of the chamber in our studies
was 4x10-11 Torr, while the base pressure in the Bender study was 2x10⁻¹⁰ Torr. It could
be that for the measurements of Bender et al. gas molecules in the chamber were
adsorbing on the surface as the temperature was reduced below 150 K, resulting in an
ordered overlayer of adsorbates. Since CO adsorption on the Cr2O3(0001)/Cr(110)
surface has been observed to give rise to a (√3x√3) R30o superstructure,2 the
superstructure observed in a different study1 could have been from CO adsorption from
the residual gas in the chamber. In addition, CO2, which is also present as a residual gas

58
in UHV, could possibly have adsorbed on the surface, producing an overlayer structure.
The disappearance of the (√3x√3) R30o superstructure below 100 K as observed by
another group1 could have resulted from multilayer adsorption of CO2 since this occurs at
about 90 K.
Another factor that must be considered in possibly explaining the lack of a
(√3x√3) R30o superstructure is that the tolerance of the alignment of the Cr(110) crystal
surface used in our study was more precise than the tolerance of the crystal surface in a
previous study.1 The Cr(110) crystal in our study was oriented to within ±0.1º from the
[110] direction, the crystal used in the previous study1 was oriented to within ±0.5º from
the [110] direction. The tolerance in the orientation of the (110) surface for our study
produces a terrace length that is five times greater than the terrace length for the crystal
used by another research group.1 Since strain in the overlayer is relieved at step edges,
the oxide films grown on a misaligned crystal will have smaller terraces and thus less
residual strain within the film. This might also have led to geometrical differences
between the Cr2O3(0001)/Cr(110) surface of the crystal used in my study and the surface
of the crystal used in a similar study.1
Temperature programmed desorption measurements of CO from the
Cr2O3(0001)/Cr(110) surface at heating rates of 5, 10, 25 and 50 ºC/min were conducted.
The TPD measurements were conducted with the mass spectrometer positioned within a
few millimeters of the crystal surface and within ±0.5 mm of the same location for each
measurement. The adsorption temperatures were always between 120 K and 140 K.
Temperatures below 120 K were not attainable due the limited heat transfer rate from the
crystal to the Dewar. This limitation was primarily caused by using tantalum wires,

59
which are poor thermal conductors, to mount the crystal to the molybdenum insert. To
lower the temperature further, tungsten wires should be used instead. However, it is
much more difficult to spot weld tungsten to either chromium or molybdenum. The
capability to drop below temperatures of 120 K would have allowed for further
investigation of the adsorption of CO just beyond the first monolayer on the
Cr2O3(0001)/Cr(110) surface as it has been done in other studies including the one by
Bender et al. To achieve true multilayer adsorption, a liquid He dewar would be needed
since previous studies have shown that the multilayer desorbs near 30 K.
The TPD data are currently taken using two separate programs, run
simultaneously. The one program creates the linear temperature ramp and collects the
temperature and time signature. The second program measures the partial pressures of up
to 8 different gases and also collects the time signature. A linear time dependent
temperature equation was calculated to match each temperature datum to each pressure
datum with respect to the time the datum that was stored. The reason that two programs
are run simultaneously is to prevent conflicts with trying to read/write to the Hiden
controller and the NI data acquisition board within the same LabView program. If a
method for performing both duties within that same program could be found, this would
simplify the data analysis.
One of the main goals of this research project was to accurately measure the
activation energy for CO desorption from the Cr2O3(0001)/Cr(110) surface. A previous
study had predicted a value of 28 kJ/mol using cluster calculation; whereas, they had
estimated an activation energy of 45 kJ/mol using TPD. My measurements result in a
value of 49.2 ±2.6 kJ/mol. In addition, my uptake measurements are consistent with a

60
first order desorption kinetics. Therefore, it is clear that the cluster calculations are
underestimating the activation energy for desorption by about a factor of two.

61
CHAPTER VI
CONCLUSIONS
It was determined that the chromium crystal, Cr(110), needed several months of
sputtering and annealing cycles to remove enough of the bulk impurities to result in a
surface with minimal streaking in the LEED pattern. Although all of the extra LEED
spots from impurity atoms on the Cr(110) surface were not removed during this
measurement time, oxidation of the surface was found to result in a well ordered
Cr2O3(0001)/Cr(110) surface. This was evidenced by the hexagonal LEED pattern with
low diffuse background, which meant that a well structured Cr2O3(0001) surface was
successfully grown on the Cr(110) surface.
LEED analyses of the Cr2O3(0001)/Cr(110) surface at room temperature and at
temperatures as low as 120 K did not show a temperature dependent (√3x√3) R30º
surface reconstruction, as was observed by previous groups.1,2 The most likely reason for
this result is either the better base pressure of our UHV chamber or differences in the
residual strain in the Cr2O3(0001) film from a better surface alignment.
TPD measurements were performed with increasing CO dosages on the
Cr2O3(0001)/Cr(110) surface, and it was determined that a saturation of CO was achieved
for a dose of approximately 0.5 L. The slight shift in the temperature of the TPD peak to
higher temperature as the CO dose was increased, provides evidence for a 1st order
desorption kinetics with an attractive adsorbate-adsorbate interaction. By applying the

62
Redhead method for a first order desorption kinetics, an activation energy of 49.2 ± 2.6
kJ/mol was determined. This value agrees well with a value of 45 kJ/mol found in a
previous study.20

63
References
1. M. Bender, D. Ehrlich, I. N. Yekovkin, F. Rhor, M. Baüer. H. Kuhlenbeck, H.-J. Freund, and V. Staemmler, Structural Rearrangement and Surface Magnetism on Oxide Surfaces: A Temperature- Dependent Low-Energy Electron Diffraction- Electron Energy Loss Spectroscopy Study of Cr2O3(111)/Cr(110), J. Phys.: Condens. Matter 7, 5289 (1995).
2. C. Xu, B. Dillman, H. Kuhlenbeck, and H.-J. Freund, Unusual State of Adsorbed CO:
CO(√3x√3)R30º/Cr2O3(111), Phys. Rev. Lett. 67, 3551 (1991). 3. F. Rohr, M. Bäumer, H. -J. Freund, J. A. Mejias, V. Staemmler, S. Müller, L.
Hammer and K. Heinz, Strong relaxations at the Cr2O3(0001) surface as determined via low-energy electron diffraction and molecular dynamics simulations, Surf. Sci. 372, L291 (1997).
4. A. J. Rowley, M. Wilson and P. A. Madden, Crystal structure and surface relaxation
in with a transferable oxide interaction potential, J. Phys.: Condens. Matter 11, 8 (1999).
5. C. Rehbein , N. M. Harrison, A. Wander, Structure of the α-Cr2O3 (0001) surface:
An ab initio total-energy study, Phys. Rev. B 54, 14066 (1996).
6. X.-G. Wang and J. R. Smith, Surface phase diagram for Cr2O3(0001): Ab initio density functional study, Phys. Rev. B 68, 201402 (2003).
7. A. Rohrbach, J. Hafner, and G. Kresse, Ab initio study of the (0001) surfaces of hematite and chromia: Influence of strong electronic correlations, Phys. Rev. B 70, 125426 (2004).
8. Maike Lübbe and Wolfgang Moritz, A LEED analysis of the clean surfaces of α-Fe2O3(0001) and α-Cr2O3(0001) bulk single crystals, J. Phys.: Condens. Matter 21, 134010 (2009).
9. K. Wolter, D. Scarano, J. Fritsch, H. Kuhlenbeck, A. Zecchina and H. -J. Freund, Observation of a localized surface phonon on an oxide surface, Chem. Phys. Lett. 320, 206 (2000).
10. T. Gloege, H. L. Meyerheim, , W. Moritz and D. Wolf, X-ray structure analysis of the Cr2O3(0001)-(1×1) surface: evidence for Cr interstitial, Surf. Sci. Lett. 441, L917 (1999).

64
11. E. J. Samuelsen, M. T. Hutchings and G. Shirane, Inelastic neutron scattering investigation of spin waves and magnetic interactions in Cr2O3, Physica 48, 13 (1970).
12. S. Redding, Low Energy Electron Diffraction Study of Epitaxial Cr2O3(0001) Films
Grown on Cr(110) (University Honors Thesis, Texas State University–San Marcos, TX 2009).
13. H. Kuhlenbeck, C. Xu, B. Dillman, M. Habel, B. Adam, D. Ehrlich, S. Wohlrab, H.-J.
Freund, U. A. Ditzinger, H. Neddermeyer, M. Neuber, and M. Neumann, Adsorption and reaction on oxide surfaces: carbon monoxide and carbon dioxide on chromium oxide (Cr2O3)(111), Phys. Chem. 96, 15 (1992).
14. M. I. Zaki and H. Knözinger, An infrared spectroscopy study of carbon monoxide adsorption on α-chromia surfaces: Probing oxidation states of coordinatively unsaturated surface cations, J. Catal. 119, 2 (1989).
15. D. Scarano and A. Zecchina, Adsorbate-adsorbent and adsorbate-adsorbate interactions in CO overlayers adsorbed on α-Cr203 as investigated by infrared spectroscopy, Spectrochim. Acta 43A, 12 (1987).
16. D. Scarano, A. Zecchina, and A. Reller, IR study of CO adsorption on α-Cr2O3, Surf. Sci. 198, 11 (1988).
17. D. Scarano, G. Spoto, S. Bordiga, G. Ricchiardi and A. Zecchina, Revisiting the α-Cr2O3/CO interaction: an FTIR and HRTEM study, J. Electron. Spectrosc. Relat. Phenom. 64/65, 307 (1993).
18. A. Zecchina, D. Scarano, S. Bordiga, G. Ricchiardi, G. Spoto and F. Geobaldo, IR studies of CO and NO adsorbed on well characterized oxide single microcrystals, Catal. Today 27, 403 (1996).
19. I. Beauport, K. Al-Shamery and H.-J. Freund, Rotational alignment in the UV-laser induced desorption of CO from Cr2O3(0001), Chem. Phys. Lett. 256, 6 (1996).
20. M. Pykavy, V. Staemmler, O. Seiferth, H.-J. Freund, Adsorption of CO on
Cr2O3(0001), Appl. Surf. Sci. 253, 7108 (2007). 21. P. S. Robert, H. Geisler, C. A. Ventrice, J. van Ek, S. Chaturvedi, J. A. Rodriguez, M.
Kuhn, and U. Diebold, Novel Electronic and Magnetic Properties of Ultrathin Chromium Oxide Films Grown on Pt (111), J. Vac. Sci. Technol. A 16(3), 990 (1998).
22. S. Funk, T. Nurka, B. Hokkanen, U. Burghaus, CO2 Adsortpion on Cr(110) and
Cr2O3(001)/Cr(110), Appl. Surf. Sci. 253, 7108 (2007).

65
23. D. P. Mann, T. Paraskeva, K. F .E. Pratt, I. P. Parkin, and D. E. Williams, Metal Oxide Semiconductor Gas sensors Utilizing a Cr-Zeolite Catalytic Layer for Improved Selectivity, Meas. Sci. Technol. 16, 1193 (2005).
24. Charles Kittel, Introduction to Solid State Physics, 8th Ed. (John Wiley and Sons, Inc.,
Hoboken, NJ 2005), pp. 4, 15, 25-32, 489, 491. 25. G. Ertl and J. Küppers, Low Energy Electrons and Surface Chemistry, (Verlag
Chemie, Weinheim 1974), pp. 1-10, 129-144. 26. A. W. Hull, X-Ray Crystal Analysis of Thirteen Common Metals, Phys. Rev. 17, 571
(1921). 27. R. W. G Wyckoff, Crystal Structures: Inorganic Compounds RXn, RnMX2, RnMX3, 2nd
Ed., Volume 2, (John Wiley and Sons, Inc., New York, NY 1964), pp. 6-8. 28. M. A. Omar, Elementary Solid State Physics, (Addison-Wesley, London 1975),
pp.37-46. 29. J. R. Christman, Fundamentals of Solid State Physics, (Wiley, New York, NY 1988),
pp. 75-85. 30. R. L Park, (1985). Methods of Experimental Physics-Solid State Physics: Surfaces ,
Vol. 22 (Academic Press, Inc., Orlando, FL 1985), pp.425-464. 31. P. A. Redhead, Chemisorption on Polycrystalline Tungsten. Part 1. – Carbon
Monoxide, Trans. Faraday Soc. 57, 641 (1961).
32. N. Clark, (2009). Design of a Temperture Programmed Desorption System for the Measurement of the Desorption Kinetics of Molecules from Surfaces (M.S. Thesis, Texas State University-San Marcos, TX 2009).
33. M. Schmid, M. Pinczolits, W. Hebenstreit, P. Varga, The Nitrogen-Induced
Herringbone Reconstruction of Cr(110), Surf. Sci. 389, L1140 (1997). 34. National Aeronautics and Space Administration, Atmospheric Experiments
Laboratory, http://ael.gsfc.nasa.gov/images/saturn/msSchematic.gif. 35. ITS-90 Thermocouple Direct and Inverse Polynomials. Type K Thermocouple.
http://www.omega.com/temperature/Z/pdf/z198-201.pdf, p. Z-196. 36. J. Walters. (2010). Measurement of the Adsorption Kinetics of CO and CO2 on
Cr(110) (M.S. Thesis, Texas State University-San Marcos, TX 2010).

VITA
Gabriel Arellano was born in El Paso, TX to Eduardo Arellano and Gabriela
Manriquez de Arellano. He has one older brother, Miguel Hector Arellano, two older
sisters, Gabriela Arellano and Rebeca Arellano, and two younger brothers, Rafael
Arellano and Guadalupe Arellano.
Gabriel Arellano attended Vilas Elementary, Lamar Middle School and finally El
Paso High School before beginning his collegiate career at the University of Texas at El
Paso. Gabriel Arellano had an interest in architecture and transferred to the University of
Texas at Austin in order to study the subject. During his early studies, Gabriel Arellano
found that he had a greater interest in Physics and decided to study and major in the
subject. Gabriel Arellano successfully completed his undergraduate work and earned his
Bachelor of Science in Physics from the University of Texas at Austin. After a few
years, Gabriel Arellano applied and was accepted to the Master of Science in Physics
program at Texas State University-San Marcos. Gabriel Arellano was able to
successfully complete the program in 2 years under the careful guidance of Dr. Carl A.
Ventrice Jr. Gabriel Arellano currently works for Austin Community College as a Sr.
Computer Lab Support Technician and as a tutor in the subjects of Physics, Mathematics
and Spanish.
Gabriel Arellano enjoys swimming, running and cycling. Gabriel Arellano, who
once played the violin exceptionally well and who played classical guitar not so well,
expects to begin anew with guitar lessons and continue where he left off several years

ago. Gabriel Arellano lives in Austin, TX and is happily married to his beautiful wife,
Lindsay Scott Rose-Arellano. He and Lindsay have a beautiful three-year old daughter
named Amalia Isabel Arellano; who is definitely a force of nature. More importantly,
Ama is a playful, kind, intelligent, jovial child with an incredible sense of humor. They
love working on their house, visiting with friends and taking trips to visit family,
especially their parents. Gabriel Arellano is not sure of what’s in store for his future, but
with all the love from his wife, daughter, brothers, sisters, parents, extended family and
friends he looks forward to what may come.
Permanent Address: 1308 Alguno Road
Austin, TX 78757
This thesis was typed by Gabriel Arellano.