geomembrane damage due to static and cyclic shearing …
TRANSCRIPT

Technical Paper submitted to Geosynthetics International, FINAL JULY 5, 2011
GEOMEMBRANE DAMAGE DUE TO STATIC AND CYCLIC SHEARING OVER COMPACTED GRAVELLY SAND
Patrick J. Fox, Jason D. Ross, Joseph M. Sura, and Richard S. Thiel
ABSTRACT: Several large-scale laboratory tests were conducted on multi-interface geomembrane liner specimens to assess damage effects from static pressure, cyclic loading, and large displacement static shear. The specimens consisted of compacted subgrade soil, a LLDPE or HDPE smooth geomembrane, and overlying potash salt. The subgrade soil was gravelly sand with 25 percent gravel content. Failure occurred at the geomembrane/soil interface for each shear test. Cyclic loading data indicated the LLDPE geomembrane had slightly lower values of interface shear stiffness and damping ratio than the HDPE geomembrane. Shear stiffness was essentially constant and damping ratio decreased with continued cycling for both geomembranes. Geomembrane damage for the static pressure and cyclic loading tests consisted of minor to moderate dimpling with no holes created. Damage was considerably more severe for the large displacement shear tests and consisted of deep scratching and gouging of the geomembranes. Two holes were created in the LLDPE specimen and no holes were created in the HDPE specimen as a result of shear displacement. The findings indicate that severe geomembrane damage can result from shear displacement against a compacted subgrade soil with gravel. Considering that shear displacements commonly occur within landfill liner systems due to such mechanisms as waste settlement, the findings suggest that additional research is needed on expected levels of shear-induced damage for geomembranes placed adjacent to soil layers with coarse particles, including compacted clay liners containing gravel.
KEYWORDS: Geomembrane, Compacted Soil, Interface Shear, Cyclic Loading, Damage
AUTHORS: Patrick J. Fox, Professor, Department of Structural Engineering, University of California-San Diego, 245 SERF, 9500 Gilman Drive, La Jolla, CA 92093-0085, Telephone: 1/858-822-0431, Telefax: 1/858-822-2260, E-mail: [email protected];
Jason D. Ross, Staff Engineer, BBC&M Engineering, Inc., Dublin, OH 43016, Telephone: 1/614-793-2226, Telefax: 1/614-793-2410, E-mail: [email protected];
Joseph M. Sura, Staff Engineer, Geosyntec Consultants, Kennesaw, GA 30144, Telephone: 1/216-470-4392, Telefax: 1/678-202-9501, E-mail: [email protected];
Richard S. Thiel, President, Thiel Engineering, Oregon House, CA 95962, Telephone: 1/530-692-9114, Telefax: 1/530-692-9115, E-mail: [email protected].

1 INTRODUCTION
Geomembranes are critical components of hydraulic barrier systems in a large number of
applications ranging from landfills to canals to heap leach pads. In order to provide an effective
barrier, damage in the form of tears, holes, and bad seams must be minimized and great expense
is often incurred to prevent, locate, and repair such damage. This includes stringent quality
assurance/quality control procedures from factory to completed installation. As the risk of
geomembrane damage is generally considered to be greatest after installation (Nosko and Touze-
Foltz 2002, Giroud and Touze-Foltz 2003), protection layers are also often placed on
geomembranes to limit damage during the process of covering with soil and from the weight of
overlying materials. These protection layers include geotextiles, sand-filled cushions, rubber tire
shreds, geonets, geocomposites, and GCLs (Heerten 1993, Darilek et al. 1995, Reddy et al. 1996,
Guglielmetti et al. 1997). Considerable research has been conducted to assess potential damage
due to sustained pressure after installation (Wilson-Fahmy et al. 1996, Narejo et al. 1996,
Koerner et al. 1996, Tognon et al. 2000, Dickinson and Brachman 2008, Brachman and Gudina
2008); however, the potential for geomembrane damage due to interface shear has not received
comparable attention.
Assessment of geomembrane integrity under interface shear conditions is important because
relative displacements can occur due to common mechanisms such as waste settlement and stress
transfer from nearby slopes. Some studies have investigated shear-induced damage effects for
geomembranes placed against other geosynthetics (Frost and Lee 2001, Triplett and Fox 2001, Li
and Gilbert 2006), and against soils including sands, silty sands, sand-clay mixtures, and pure
clays (Ling et al. 2001, DeJong and Westgate 2005, Flemming et al. 2006); however, to the
writers’ knowledge no studies have been conducted to investigate shear-induced damage for
geomembranes against soils containing gravel. Such applications are common. For example,
geomembranes are often placed on gravelly subgrades or covered with gravelly overliner soils
for heap leach pads, and landfill liner systems often contain drainage layers and compacted clay
liners with appreciable gravel content. These applications typically involve high normal stress
conditions, which may further increase risk to the integrity of the geomembrane.
The current paper presents a limited experimental study of damage to geomembranes placed
on compacted soil containing gravel and subjected to static pressure, cyclic loading, and large
displacement static shear. The study was motivated by an evaluation of geomembrane integrity

under expected operational conditions for a potash reclamation facility in New Mexico, USA. In
this application, the liner system design consists of a single geomembrane placed on compacted
subgrade soil. Brine solution is ponded on the liner and, after complete evaporation, the salts are
recovered using construction equipment (i.e., scrapers). Although a scraper will not come closer
than approximately 450 vertical mm of the geomembrane, design engineers were concerned
about the ability of the geomembrane to withstand static and dynamic loads due to scraper
operations during salt removal. To address this concern, several large-scale shear tests were
conducted for two common types of geomembranes to assess potential damage. Results are
presented for static pressure, cyclic loading, and static shear tests and the findings are discussed
with regard to geomembrane performance for each loading condition.
2 MATERIALS
The experimental program was conducted using two geomembrane products manufactured
by GSE Environmental (Houston, Texas, USA). The first product was a smooth linear low
density polyethylene (LLDPE) geomembrane with a nominal thickness of 1.5 mm (60 mils).
The second product was a smooth high density polyethylene (HDPE) geomembrane with a
nominal thickness of 1.5 mm (60 mils). Table 1 provides a summary of material properties for
both geomembranes.
Subgrade soil samples were obtained on site from two test pits (TP-1, TP-2). Initial moisture
contents w are provided in Table 2. Each soil sample was passed through a 19 mm sieve to
remove large particles and the subsequent particle size distribution curves are shown in Figure 1.
The soils had similar textures consisting of gravelly sand with pieces of white caliche. A
Standard Proctor test was conducted on each soil sample and the optimum moisture contents are
provided in Table 2. Once the optimum moisture contents were established, each soil was
prepared to a moisture content 2 percent dry of optimum and then the soils were mixed in a 1:1
ratio to create the final subgrade soil for the experimental program. The final subgrade had 25
percent gravel content.
Potash salt from the field site was passed through a 12.7 mm sieve and the subsequent
particle size distribution curve is shown in Figure 1. The salt consisted almost entirely of sand-
sized particles (3 percent gravel) and had an initial moisture content of 0.8 percent (Table 2).

3 EXPERIMENTAL PROGRAM
3.1 Specimen Preparation
Static normal stress, cyclic shear stress, and post-cyclic static shear tests were conducted on
multi-interface specimens using the large dynamic direct shear machine described by Fox et al.
(2006). The test chamber measures 305 × 1067 mm in plan and provides a shearing surface area
of 0.325 m2. Specimens were sheared between a rigid pullout plate and the floor of the test
chamber, each of which is covered with an aggressive gripping surface. The shearing system is
powered by a 245 kN hydraulic actuator that can impart bidirectional (i.e., back-and-forth)
motion to the pullout plate with a maximum displacement amplitude of 254 mm. The maximum
frequency for sinusoidal loading (± 25 mm) is 4 Hz. The actuator can also be used to conduct
static shear tests at a constant slow displacement rate.
Each test specimen consisted of subgrade, geomembrane, and potash salt. Subgrade soil was
compacted in three lifts to a final thickness of approximately 75 mm. New subgrade soil was
used for each test. The first two lifts were heavily compacted using a hand tamper and, to be
conservative, the final lift was moderately tamped to provide a rougher surface than would be
normally expected in the field. Subgrade soil densities are not available due to the difficulty of
measurement. Figure 2 shows a typical view of the subgrade soil after compaction in the test
chamber. A specimen of either the LLDPE or HDPE geomembrane was placed on the subgrade
with extra length provided on both ends to allow additional geomembrane material to enter the
chamber during the shearing process and thus maintain constant shearing surface area.
Approximately 50 mm of potash salt was then placed on the geomembrane and lightly tamped.
The pullout plate was laid over the salt and a constant normal stress of 958 kPa was applied to
the specimen for 24 h. No additional water was provided to the specimen during preparation or
testing.
3.2 Geomembrane Integrity Tests
The integrity of geomembrane specimens was assessed at each stage of testing using a bright
light integrity test and a water integrity test. For the bright light integrity test, the geomembrane
specimen was held against a bright halogen lamp in a dark room and visually inspected for holes.
The water integrity test was used to identify any non-visible holes that were missed during the
bright light integrity test. For the water integrity test, the geomembrane was subjected to a static

water head of 150 mm for a minimum of 15 min. Paper towels placed underneath the
geomembrane were used to detect leaks.
3.3 Test Procedures
The experimental program consisted of four tests. Test 5 (LLDPE) and Test 6 (HDPE) were
static pressure tests in which geomembrane specimens were subjected to a constant normal stress
of 958 kPa for 24 h. After the stress was released, the specimens were immediately
photographed and subjected to bright light and water integrity tests.
Test 3 (LLDPE) and Test 4 (HDPE) were more comprehensive and included static pressure,
cyclic loading, and static shearing stages. The static pressure stage was identical to Tests 5 and
6. After the static pressure stage, the normal stress remained constant and each specimen was
subjected to 20 cycles of force-controlled sinusoidal loading with a nominal shear stress
amplitude of 192 kPa and a frequency of 0.5 Hz. The level of cyclic loading corresponds to a
mobilized interface friction angle of 11.3° and was intended to simulate the dynamic shear stress
imposed on a geomembrane by salt removal activities. After cyclic loading, the normal stress
was released and the geomembrane specimen was carefully removed from the test chamber
while marking its precise location on the compacted subgrade soil. The specimen was
immediately photographed, subjected to bright light and water integrity tests, and then
repositioned on the subgrade to the same location. The normal stress (958 kPa) was reapplied
and, after 2 h, a static shearing test was conducted at a rate of 10 mm/min. to a final displacement
of 130 mm. At the conclusion of static shear, final moisture contents were taken from the
subgrade soil (Table 2) and the geomembrane specimen was again photographed and subjected
to bright light and water integrity tests.
4 RESULTS
4.1 Static Pressure Tests
The LLDPE and HDPE geomembranes were relatively undamaged in Tests 5 and 6. Bright
light and water integrity tests indicated that no holes were created after the application of static
pressure (958 kPa) for 24 h. Both tests produced minor to moderate dimpling of the
geomembrane. The dimples resulted from stress concentrations over coarse particles in the
subgrade soil. A typical photograph of this effect is shown in Figure 3.

4.2 Cyclic Loading Tests
Tests 3 and 4 produced cyclic loading data for the test specimens. Post-test inspections
indicated that shear failure occurred at the geomembrane/subgrade interface in each case.
Figures 4 and 5 present the measured cyclic loading data. The nominal shear stress amplitude of
192 kPa was approximately achieved for 20 sinusoidal cycles at 0.5 Hz. The average shear stress
amplitude ranged from 185 to 190 kPa for LLDPE and from 188 to 194 kPa for HDPE. Shear
displacements were also essentially sinusoidal and had nearly uniform amplitudes. Measured
displacements correspond to shear of each multi-interface specimen as a whole and not
specifically the geomembrane/subgrade failure surface. The average displacement amplitude
was 1.29 mm for LLDPE and 1.05 mm for HDPE. For both geomembranes, displacement
amplitude does not show a consistent trend with increasing number of cycles. The shear stress
vs. shear displacement plots display similar hysteresis loops and indicate little change with
continued cycling.
Cyclic shear parameters were calculated using the method of Nye and Fox (2007) and are
shown in Figure 6. Values of shear stiffness were slightly higher for the HDPE geomembrane
because shear displacements were slightly lower. Higher interface shear stiffness is also
consistent with the higher density and stiffness of HDPE. Shear stiffness for both
geomembranes was essentially constant with continued cycling because displacement amplitude
was essentially constant, which is also indicated by constant values of stiffness degradation
index. Damping ratios for both geomembranes decreased with increasing number of cycles and
were consistently higher for HDPE than for LLDPE. Area reduction of the hysteresis loops with
continued cycling is responsible for the decreases in damping ratio.
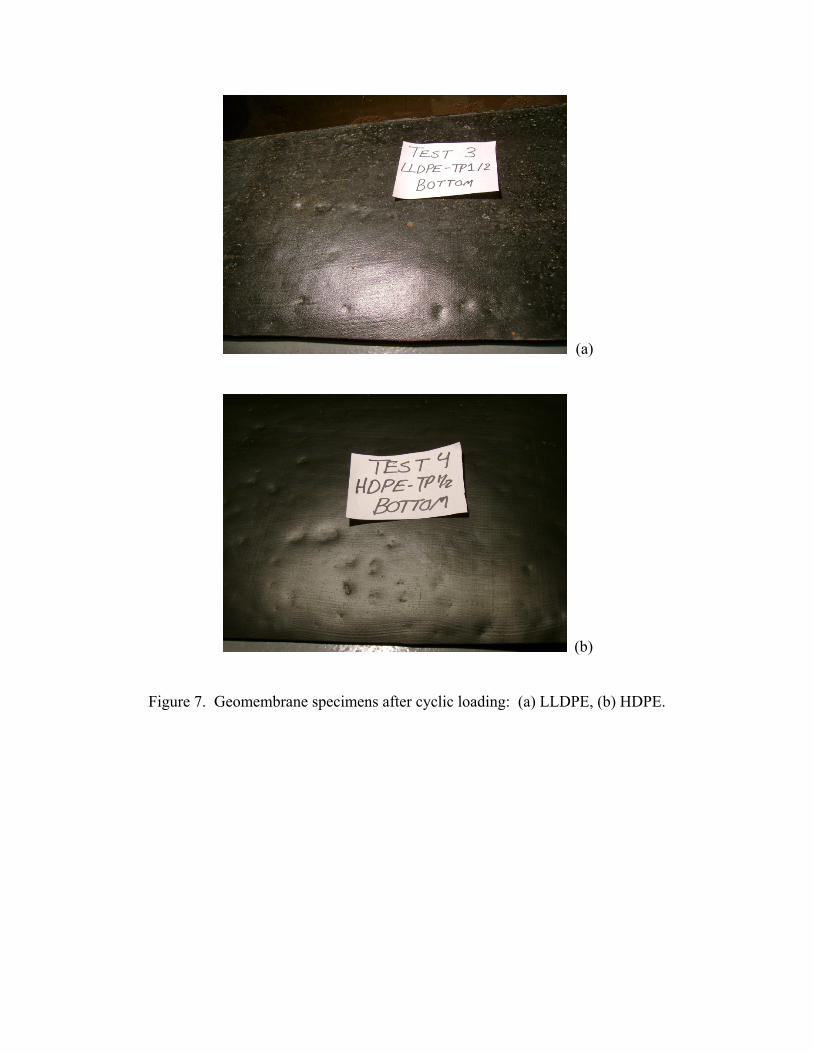
Figure 7 presents photographs of the LLDPE and HDPE specimens after cyclic loading.
Visual inspections revealed moderate dimpling on both specimens that was only slightly more
severe than for the static pressure tests (Tests 5 and 6). The bright light and water integrity tests
indicated no holes for either geomembrane specimen.
4.3 Static Shearing Tests
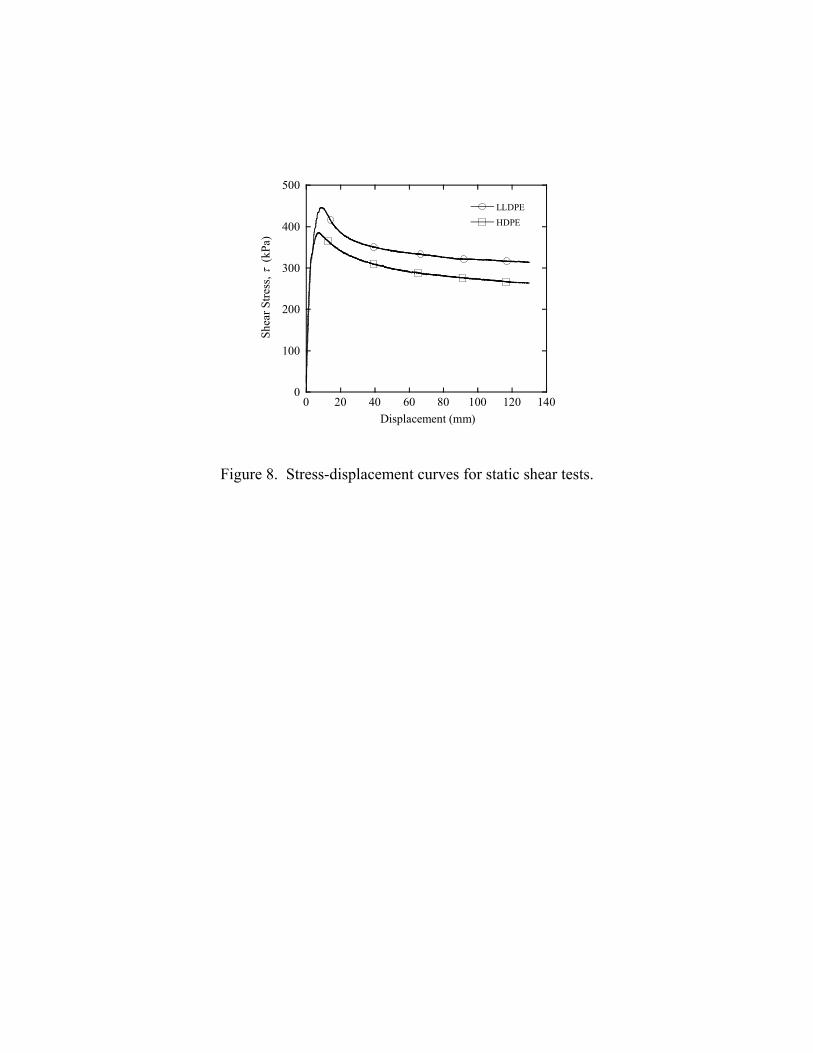
After cyclic loading, the geomembranes were sheared to large displacement (130 mm). The
shear stress-displacement relationships for both specimens are shown in Figure 8. Shear failure

occurred between the geomembrane and the subgrade soil in each case. Peak ( p ) and large
displacement ( 130 ) shear strengths and corresponding secant interface friction angles are
provided in Table 3. The curves show similar response with the LLDPE specimen yielding
higher strengths, which is likely due to the greater ability of this geomembrane to conform to
undulations of the rough soil subgrade. Peak and large displacement secant friction angles for
LLDPE are larger than HDPE by approximately 3°.
Post-test visual inspections indicated that the underside of both geomembranes experienced
significant damage as a result of interface shear. Damage included severe scratch and gouge
marks approximately 130 mm in length and tearing of holes for the LLDPE. Each of the damage
marks was associated with a gravel particle protruding from the soil subgrade. Figure 9 shows
photographs of the geomembrane specimens. The bright light integrity test revealed two holes in
the LLDPE geomembrane and the water integrity test did not reveal any additional holes. No
holes were indicated by either integrity test for the HDPE geomembrane. The stiffer HDPE
material did not conform as closely to protruding gravel particles and thus experienced less
damage during shear. Throughout the testing program, all geomembrane damage was associated
with the soil subgrade and no damage occurred from the overlying potash salt.
5 CONCLUSIONS AND IMPLICATIONS FOR PRACTICE
Geomembranes must be protected from stress concentrations to prevent puncture and to limit
the potential for stress cracking over time. Stress concentrations commonly arise from coarse
particles (e.g., gravel) in an underlying subgrade soil or overlying drainage layer. Previous
research studies have generally focused on the effects of static pressure to assess the potential for
geomembrane damage from such particles. Results from the foregoing large-scale laboratory
tests have indicated that far greater damage can occur due to interface shear displacement. In the
current study, both LLDPE and HDPE geomembranes experienced minor to moderate dimpling
as a result of static pressure and cyclic loading over a subgrade soil consisting of gravelly sand.
However, much more severe damage was observed after shear to large displacement. Shear-
induced damage included deep scratch and gouge marks for both geomembranes and two holes
formed for the LLDPE specimen. Damage was likely greater for LLDPE due to the greater
ability of this material to conform more closely to the rough soil subgrade prior to shear. This is
an interesting result considering that stiffer geomembranes are generally more susceptible to

puncture damage than flexible geomembranes (Stark et al. 2008). Lower levels of damage to the
HDPE geomembrane may have resulted from the short duration of tests conducted. If the static
pressure was sustained for a longer period of time, the HDPE would be expected to creep and
conform more closely with the soil subgrade and thus experience more damage during shear.
The same mechanism may produce more shear-induced damage for the LLDPE geomembrane as
well. Thus, long term sustained pressure prior to shear, such as for an actual liner system, may
produce higher levels of damage for both geomembranes.
The observed physical damage would compromise containment function and result in stress
concentrations that may increase the likelihood for stress cracking at those locations (Rowe and
Sangam 2002). Considering that shear displacements can occur within a landfill liner system
due to common mechanisms such as waste settlement, the findings suggest that additional
research is needed on expected levels of shear-induced damage for geomembranes placed
adjacent to soil layers with coarse particles, including compacted clay liners containing gravel.
The experimental program also provided information with regard to cyclic loading of a
geomembrane/coarse soil interface. Cyclic loading data indicated the LLDPE geomembrane had
slightly lower values of interface shear stiffness and damping ratio than the HDPE
geomembrane. Shear stiffness was essentially constant and damping ratio decreased with
continued cycling for both geomembranes. The limited amount of testing in this study is
insufficient to discount the effects of material variability and additional work is needed to verify
the foregoing results.
6 ACKNOWLEDGEMENTS
Financial support for this investigation was provided by Grant No. CMMI-0800030 from the
Geotechnical Engineering Program of the U.S. National Science Foundation and by a grant from
GSE Environmental Inc. of Houston, Texas, USA. Geosynthetic and soil materials were
provided by GSE. This support is gratefully acknowledged. We also thank Dr. Craig H.
Benson, Distinguished Professor at the University of Wisconsin-Madison, for helpful
information with regard to typical gradation requirements for compacted clay liners.

7 REFERENCES
Brachman, R. W. I., and Gudina, S. (2008). “Geomembrane strains from coarse gravel and
wrinkles in a GM/GCL composite liner,” Geotextiles and Geomembranes, 26(6), 488-497.
Darilek, G., Menzel, R., and Johnson, A. (1995). “Minimizing geomembrane liner damage while
emplacing protective soil,” Proceedings, Geosynthetics ‘95, Nashville, Tennessee, USA,
IFAI, 2, 669-676.
DeJong, J. T., and Westgate, Z. J. (2005). “Role of overconsolidation on sand-geomembrane
interface response and material damage evolution,” Geotextiles and Geomembranes, 23(6),
486-512.
Dickinson, S., and Brachman, R. W. I. (2008). “Assessment of alternative protection layers for a
geomembrane–geosynthetic clay liner (GM–GCL) composite liner,” Canadian Geotechnical
Journal, 45 (11), 1594-1610.
Fleming, I. R., Sharma, J. S., and Jogi, M. B. (2006). “Shear strength of geomembrane-soil
interface under unsaturated conditions,” Geotextiles and Geomembranes, 24(5), 274-284.
Fox, P. J., Nye, C. J., Morrison, T. C., Hunter, J. G., and Olsta, J. T. (2006). “Large dynamic
direct shear machine for geosynthetic clay liners” Geotechnical Testing Journal, 29(5), 392-
400.
Frost, J. D., and Lee, S. W. (2001). “Microscale study of geomembrane-geotextile interactions,”
Geosynthetics International, 8(6), 577-597.
Giroud, J. P., and Touze-Foltz, N., eds. (2003). “Geomembranes in landfills: discussion at the
7th International Conference on Geosynthetics,” Geosynthetics International, 10(4), 124-133.
Guglielmetti, J. L., Sprague, C. J., and Coyle, M. J. (1997). “Geomembrane installation and
construction survivability,” Proceedings, Geosynthetics ‘97, Long Beach, California, USA,
IFAI, 1, 235-251.
Heerten, G. (1993). “Geotextile and/or GCL protection systems for geomembranes,”
Geosynthetic Liner Systems: Innovations, Concerns and Designs, Koerner, R. M. and
Wilson-Fahmy, R. F., eds., IFAI, 155-167.
Koerner, R. M., Wilson-Fahmy, R. F., and Narejo, D. (1996). “Puncture protection of
geomembranes. Part III: Examples,” Geosynthetics International, 3(5), 655-675.
Li, M.-H., and Gilbert, R. B. (2006). “Mechanism of post-peak strength reduction for textured
geomembrane-nonwoven geotextile interfaces,” Geosynthetics International, 13(5), 206-209.

Ling, H. I., Pamuk, A., Dechasakulsom, M., Mohri, Y., and Burke, C. (2001). “Interactions
between PVC geomembranes and compacted clays,” Journal of Geotechnical and
Geoenvironmental Engineering, 127(11), 950-954.
Narejo, D., Koerner, R. M. and Wilson-Fahmy, R. F., (1996). “Puncture protection of
geomembranes. Part II: Experimental,” Geosynthetics International, 3(5), 629-653.
Nosko, V., and Touze-Foltz, N. (2000). “Geomembrane liner failure: modeling of its influence
on contaminant transfer,” Proceedings, Second European Conference on Geosynthetics,
Bologna, Italy, 557-560.
Nye, C. J., and Fox, P. J. (2007). “Dynamic shear behavior of a needle-punched geosynthetic
clay liner,” Journal of Geotechnical and Geoenvironmental Engineering, 133(8), 973-983.
Reddy, K. R., Bandi, S. R., Rohr, J. J., Finy, M., and Siebken, J. (1996). “Field evaluation of
protective covers for landfill geomembrane liners under construction loading,” Geosynthetics
International, 3(6), 679-700.
Rowe, R. K., and Sangam, H. P. (2002). “Durability of HDPE geomembranes,” Geotextiles and
Geomembranes, 20(2), 77-95.
Stark, T. D., Boerman, T. R., and Connor, C. J. (2008). “Puncture resistance of PVC
geomembranes using the truncated cone test,” Geosynthetics International, 15(6), 480-486.
Tognon, A. R., Rowe, R. K., and Moore, I. D. (2000). “Geomembrane strain observed in large-
scale testing of protection layers,” Journal of Geotechnical and Geoenvironmental
Engineering, 126(12), 1194-1208.
Triplett, E. J., and Fox, P. J. (2001). “Shear strength of HDPE geomembrane/geosynthetic clay
liner interfaces,” Journal of Geotechnical and Geoenvironmental Engineering, 127(6), 543-
552.
Wilson-Fahmy, R. F., Narejo, D., and Koerner, R. M. (1996). “Puncture protection of
geomembranes. Part I: Theory,” Geosynthetics International, 3(5), 605-628.

Table 1. Material properties for geomembranes.
Geomembrane Average
Thickness
(mm)
Minimum
Thickness
(mm)
Density
(g/cc)
MD
Strength
at Break
(kN/m)
TD
Strength
at Break
(kN/m)
MD
Elongation
at Break
(%)
TD
Elongation
at Break
(%)
MD Tear
Resistance
(N)
TD Tear
Resistance
(N)
Puncture
Resistance
(N)
LLDPE 1.57 1.47 0.926 60.9 58.5 1059 960 187 182 534
HDPE 1.55 1.50 0.943 48.2 53.6 761 859 214 205 636
MD = machine direction; TD = transverse direction
Table 2. Subgrade soil moisture contents for experimental program.
Soil
Standard Proctor Test Final w (%)
Initial w
(%)
Optimum w
(%) Test 3 - LLDPE Test 4 - HDPE
TP-1 3.40 13.10 12.90 12.20
TP-2 3.69 15.70
Salt 0.80 – –
Table 3. Shear strengths and secant interface friction angles for static shear tests.
Geomembrane
Peak shear strength
( p )
Large displacement shear strength
( 130 )
Peak secant interface friction
angle ( p )
Large displacement
secant interface friction angle
( 130 )
LLDPE 446 kPa 313 kPa 25.0° 18.1° HDPE 385 kPa 263 kPa 21.9° 15.4°

0
20
40
60
80
100
0.1 1 10 100
TP-1TP-2SaltP
erce
nt F
iner
Particle Size (mm)
Sand Gravel
Figure 1. Particle size distribution curves.

Figure 2. Typical surface of subgrade soil prior to placement of geomembrane.

Figure 3. LLDPE geomembrane after static pressure test.

-200
-100
0
100
200
0 5 10 15 20 25 30 35 40
Time, t (s)
She
ar S
tres
s,
(kP
a)
-1.5
-1.0
-0.5
0
0.5
1.0
1.5
0 5 10 15 20 25 30 35 40
Time, t (s)
Dis
plac
emen
t (m
m)
(a) (b)
-200
-100
0
100
200
-1.5 -1.0 -0.5 0 0.5 1.0 1.5Displacement (mm)
She
ar S
tres
s,
(kP
a)
(c)
Figure 4. Cyclic loading measurements for LLDPE geomembrane: a) shear stress vs. time, b)
shear displacement vs. time, and c) shear stress vs. shear displacement.

-200
-100
0
100
200
0 5 10 15 20 25 30 35 40
Time, t (s)
Shea
r S
tres
s,
(kP
a)
-1.5
-1.0
-0.5
0
0.5
1.0
1.5
0 5 10 15 20 25 30 35 40
Time, t (s)
Dis
plac
emen
t (m
m)
(a) (b)
-200
-100
0
100
200
-1.5 -1.0 -0.5 0 0.5 1.0 1.5
Shea
r S
tres
s,
(kP
a)
Displacement (mm)
(c)
Figure 5. Cyclic loading measurements for HDPE geomembrane: a) shear stress vs. time, b)
shear displacement vs. time, and c) shear stress vs. shear displacement.

150
160
170
180
190
200
0 5 10 15 20 25
LLDPE
HDPE
She
ar S
tiff
ness
, K (
kPa/
mm
)
Number of Cycles, N
0.8
0.9
1.0
1.1
1.2
0 5 10 15 20 25
LLDPE
HDPE
Deg
rada
tion
Ind
ex,
Number of Cycles, N
(a) (b)
0.018
0.020
0.022
0.024
0.026
0.028
0 5 10 15 20 25
LLDPE
HDPE
Dam
ping
Rat
io,
Number of Cycles, N
(c)
Figure 6. Cyclic loading parameters: a) shear stiffness, b) degradation index, and c) damping
ratio.
(a)
(b)
Figure 7. Geomembrane specimens after cyclic loading: (a) LLDPE, (b) HDPE.
0
100
200
300
400
500
0 20 40 60 80 100 120 140
LLDPE
HDPE
Displacement (mm)
She
ar S
tres
s,
(kP
a)
Figure 8. Stress-displacement curves for static shear tests.

(a)
(b)
Figure 9. Geomembrane specimens after cyclic loading and static shear: (a) LLDPE, (b) HDPE.