geomechanical analysis and design considerations … library/research/oil-gas/natural gas... ·...
TRANSCRIPT

Geomechanical Analysis and Design Considerations for
Thin-Bedded Salt Caverns
Final Report
June 1, 2003 to May 30, 2005
Michael S. Bruno, PhD. PE June 15th, 2005
DE-FC26-03NT41813 (GTI Contract 8701)
Terralog Technologies USA 332 E. Foothill Blvd., Suite B
Arcadia, CA 91006
Point of Contact: Dr. Michael Bruno
Phone: (626) 305-8460 Fax: (626) 305-8462
Email: [email protected]

Geomechanical Analysis of Thin Bedded Salt Caverns
DE-FC26-03NT41813 2
“This report was prepared as an account of work sponsored by an agency of the United States Government. Neither the United States Government nor any agency thereof, nor any of their employees, makes any warranty, express or implied, or assumes any legal liability or responsibility for the accuracy, completeness, or usefulness of any information, apparatus, product or process disclosed, or represents that its use would not infringe privately owned rights. Reference herein to any specific commercial product process, or service by trade name, trademark, manufacturer, or otherwise does not necessarily constitute or imply its endorsement, recommendation, or favoring by the United States Government or any agency thereof. The views and opinions of authors expressed herein do not necessarily state or reflect those of the United States Government or any agency thereof.”

Geomechanical Analysis of Thin Bedded Salt Caverns
DE-FC26-03NT41813 3
Abstract The bedded salt formations located throughout the United States are layered and interspersed with non-salt materials such as anhydrite, shale, dolomite and limestone. The salt layers often contain significant impurities. GRI and DOE have initialized this research proposal in order to increase the gas storage capabilities by providing operators with improved geotechnical design and operating guidelines for thin bedded salt caverns. Terralog has summarized the geologic conditions, pressure conditions, and critical design factors that may lead to:
• Fracture in heterogeneous materials; • Differential deformation and bedding plane slip; • Propagation of damage around single and multiple cavern; • Improved design recommendations for single and multiple cavern configurations
in various bedded salt environments. The existing caverns within both the Permian Basin Complex and the Michigan and Appalachian Basins are normally found between 300 m to 1,000 m (1,000 ft to 3,300 ft) depth depending on local geology and salt dissolution depth. Currently, active cavern operations are found in the Midland and Anadarko Basins within the Permian Basin Complex and in the Appalachian and Michigan Basins. The Palo Duro and Delaware Basins within the Permian Basin Complex also offer salt cavern development potential. Terralog developed a number of numerical models for caverns located in thin bedded salt. A modified creep viscoplastic model has been developed and implemented in Flac3D to simulate the response of salt at the Permian, Michigan and Appalachian Basins. The formulation of the viscoplastic salt model, which is based on an empirical creep law developed for Waste Isolation Pilot Plant (WIPP) Program, is combined with the Drucker-Prager model to include the formation of damage and failure. The Permian salt lab test data provided by Pfeifle et al. 1983, are used to validate the assumptions made in the material model development. For the actual cavern simulations two baseline models are developed for single and multiple caverns, respectively. Different parameters that affect damage propagation and deformation of salt cavern, such as cavern pressure, operating conditions, cavern height/diameter ratio, overburden stiffness and roof thickness are analyzed and the respective results summarized. For multiple horizontal caverns numerical models are developed to determine the cavern interaction and the minimum safe center to center distance. A step by step methodology for operators to assess critical cavern design parameters for thin bedded salt formations is also presented.

Geomechanical Analysis of Thin Bedded Salt Caverns
DE-FC26-03NT41813 4
TABLE OF CONTENTS
ABSTRACT....................................................................................................................... 3
TABLE OF CONTENTS ................................................................................................. 4
LIST OF FIGURES .......................................................................................................... 7
LIST OF TABLES .......................................................................................................... 11
1 EXECUTIVE SUMMARY ......................................................................................... 12
2 INTRODUCTION........................................................................................................ 16
3 EXPERIMENTAL....................................................................................................... 18
4 RESULTS AND DISCUSSION .................................................................................. 18
4.1 Geological Review............................................................................................ 18
4.1.1 Permian Basin Complex ........................................................................... 18
4.1.1.1 Geologic Setting.................................................................................... 20
4.1.1.2 Midland Basin....................................................................................... 22
4.1.1.2.1 Midland Basin Cavern Sonar Review............................................. 28
4.1.1.3 Delaware Basin ..................................................................................... 31
4.1.1.4 Palo Duro Basin .................................................................................... 35
4.1.1.5 Dalhart Basin ........................................................................................ 42
4.1.1.6 Anadarko Basin..................................................................................... 44
4.1.1.6.1 Anadarko Basin Cavern Sonar Review........................................... 48
4.1.1.7 Salt Dissolution in Permian Basin Complex......................................... 51
4.1.1.8 Results and Discussion for the Permian Basin Complex...................... 51
4.1.2 Michigan and Appalachian Basins............................................................ 53
4.1.2.1 Geologic Setting.................................................................................... 54
4.1.2.2 Michigan Basin ..................................................................................... 55
4.1.2.2.1 Michigan Basin Cavern Sonar Review........................................... 57
4.1.2.3 Appalachian Basin ................................................................................ 62
4.1.2.3.1 Appalachian Basin Cavern Sonar Review ...................................... 65

Geomechanical Analysis of Thin Bedded Salt Caverns
DE-FC26-03NT41813 5
4.1.2.4 Salt Dissolution and Collapses in Michigan and Appalachian Basins . 68
4.1.2.5 Results and Discussion for the Michigan and Appalachian Basins...... 68
5 GEOMECHANICAL ANALYSIS OF SALT CAVERNS....................................... 70
5.1 Modeling Salt Behavior .................................................................................... 70
5.1.1 Modeling of Creep .................................................................................... 70
5.1.2 Failure Model for Salt............................................................................... 74
5.1.3 Sample Problems ...................................................................................... 80
5.2 Typical Mechanical Properties for Bedded Salt Materials ............................... 86
5.3 Single Cavern Geomechanical Models............................................................. 93
5.3.1 Single Cavern Model Description and Simulation Matrix ....................... 94
5.3.2 Single Cavern Baseline Simulation Results.............................................. 98
5.3.3 Creep Deformation in Baseline Model ................................................... 103
5.3.4 Influence of Cavern Pressure on Salt Stress and Stability...................... 104
5.3.5 Influence of Cavern Height to Diameter Ratio on Cavern Deformation and
Stability ................................................................................................................. 108
5.3.6 Influence of Overburden Stiffness on Cavern Behaviors ....................... 113
5.3.7 Influence of Roof Thickness on Cavern Deformation and Stability....... 114
5.3.8 Influence of Interface Properties on Cavern Stability and Interface Slip115
5.4 Multiple Horizontal Cavern Geomechanical Models ..................................... 117
5.4.1 Multiple Horizontal Cavern Model Description and Simulation Matrix 117
5.4.2 Multiple Horizontal Cavern Baseline Simulation Results ...................... 119
5.4.3 Influence of Horizontal Caverns Separation Distance on Cavern
Deformation and Stability....................................................................................... 122
5.5 Conclusion and Discussion ............................................................................. 124
6 DESIGN CONSIDERATIONS................................................................................. 127
6.1 Site Selection .................................................................................................. 127
6.1.1 Site Selection Criteria ............................................................................. 127
6.1.2 Proximity and Risk to and from other Industrial Facilities..................... 127
6.1.3 Cavern Spacing Considerations .............................................................. 128
6.2 Design and Development Criteria................................................................... 128

Geomechanical Analysis of Thin Bedded Salt Caverns
DE-FC26-03NT41813 6
6.2.1 Assessment of Neighboring Activities.................................................... 128
6.2.2 Geotechnical Studies............................................................................... 128
6.2.3 Subsidence .............................................................................................. 129
6.2.4 Operating Pressure .................................................................................. 129
6.2.5 Maximum Injection and Withdrawal Rates ............................................ 129
6.2.6 General Design Conditions ..................................................................... 129
6.3 Development (Solution Mining) ..................................................................... 130
6.3.1 Cavern Shape .......................................................................................... 130
6.3.2 Cavern Integrity ...................................................................................... 130
6.3.3 Stored Fluid as Roof Control .................................................................. 130
6.3.4 Intercavern Communication.................................................................... 131
7 STEP BY STEP METHODOLOGY TO ASSESS CRITICAL CAVERN DESIGN
......................................................................................................................................... 132
7.1 Evaluate Geologic Setting............................................................................... 133
7.2 Evaluate Mechanical Properties for Salt and Non-Salt Interbeds................... 133
7.3 Evaluate In-Situ Stresses................................................................................. 134
7.4 Evaluate Geomechanical Response to Cavern Creation and Pressure Cycling....
......................................................................................................................... 135
8 SUMMARY AND CONCLUSIONS ........................................................................ 136
9 REFERENCES........................................................................................................... 139

Geomechanical Analysis of Thin Bedded Salt Caverns
DE-FC26-03NT41813 7
List of Figures Figure 2-1: Major bedded salt Basins in US..................................................................... 16
Figure 4-1: Structural element for Permian Basin complex. ............................................ 19
Figure 4-2: Midland Basin schematic stratigraphic column. ............................................ 23
Figure 4-3: Generalized depth to top Salado formation................................................... 26
Figure 4-4: Salado formation isopach.............................................................................. 27
Figure 4-5: Typical salt cavern configurations in Midland Basin. .................................. 30
Figure 4-6: Delaware Basin schematic stratigraphic column. ......................................... 32
Figure 4-7: Castile formation isopach.............................................................................. 34
Figure 4-8: Palo Duro schematic stratigraphic column. .................................................. 36
Figure 4-9: Isopach and depth to top Lower Clear Fork Formation and equivalent Lower
Cimarron Formation.................................................................................................. 38
Figure 4-10: Isopach and depth to top Upper Clear Fork Formation. ............................. 39
Figure 4-11: Isopach and depth to top San Andres Formation and equivalent Blaine and
Flowerpot Strata........................................................................................................ 41
Figure 4-12: Isopach and depth to top of Seven Rivers formation in the Palo Duro Basin.
................................................................................................................................... 42
Figure 4-13: Dalhart schematic stratigraphic column...................................................... 43
Figure 4-14: Anadarko Basin schematic stratigraphic column........................................ 45
Figure 4-15: Isopach and depth to top Hutchison Member in Anadarko Basin. ............. 47
Figure 4-16: Typical cavern configurations in the Anadarko Basin................................ 50
Figure 4-17: Michigan and Appalachian Basins structural elements. ............................. 54
Figure 4-18: Michigan Basin schematic stratigraphic column. ....................................... 56
Figure 4-19: Isopach and depth to top Salina Salt in Michigan Basin............................. 60
Figure 4-20: Typical cavern configuration in Michigan Basin........................................ 61
Figure 4-21: Appalachian Basin schematic stratigraphic column. .................................. 63
Figure 4-22: Isopach and depth to Top Salina Salt in Appalachian Basin. ..................... 65
Figure 4-23: Typical cavern in the Appalachian Basin. .................................................. 67

Geomechanical Analysis of Thin Bedded Salt Caverns
DE-FC26-03NT41813 8
Figure 5-1: Drucker-Prager criterion used in this study compared to the exponential
Mises-Schleicher criterion. ....................................................................................... 76
Figure 5-2: Total creep strain in loading direction for unconfined compression test with
total stress of 10 MPa (red)....................................................................................... 78
Figure 5-3: Axial creep strain rate for unconfined compression test with axial
compression of 10 MPa. ........................................................................................... 78
Figure 5-4: Unit cube element subjected to uniaxial tensile loading................................ 81
Figure 5-5: Response of Permian salt subjected to uniaxial tensile loading.................... 81
Figure 5-6: Unit cube element subjected to uniaxial compressive loading. ..................... 82
Figure 5-7: Response of Permian salt subjected to uniaxial compression loading........... 82
Figure 5-8: Unit cube element subjected to triaxial compression test. ............................. 83
Figure 5-9: Response of Permian salt subjected to triaxial compression, confinement is 5
MPa. .......................................................................................................................... 84
Figure 5-10: Response of Permian salt subjected to triaxial compression loading,
confinement pressure is 10 MPa. .............................................................................. 84
Figure 5-11: Unit cube element subjected to creep test. ................................................... 85
Figure 5-12: Creep response of Permian salt. Confinement pressure is 15 MPa, stress
difference equal to 5 MPa. The temperature of the simulation is 100°C.................. 86
Figure 5-13: Geomechanical model to analyze single bedded salt caverns. The numerical
model is based on a typical cavern geometry. .......................................................... 94
Figure 5-14: Baseline model for analyzing single bedded salt caverns............................ 96
Figure 5-15: Pressure cycles simulated over a one year period........................................ 98
Figure 5-16: Contour plot of equilibrium shear stress and interface slip for baseline model
with H/D = (1/2) for a hydrostatic cavern pressure of 8.8 MPa (1276 psi). ........... 100
Figure 5-17: Spatial distribution of micro-cracks for the baseline model in equilibrium
with a hydrostatic cavern pressure of 8.8 MPa (1276 psi)...................................... 101
Figure 5-18: Contour plot of displacement magnitude for baseline model in equilibrium
with a hydrostatic cavern pressure of 8.8 MPa (1276 psi)...................................... 101
Figure 5-19: Contour plot of shear stress and location of interface slip for baseline model
after 1 year of pressure cycling............................................................................... 102

Geomechanical Analysis of Thin Bedded Salt Caverns
DE-FC26-03NT41813 9
Figure 5-20: Spatial distribution of damage in form of micro-cracks and location of
interface slippage for baseline model after 1 year pressure cycling. ...................... 102
Figure 5-21: Contour plot of displacement magnitude and location of interface slippage
for baseline model after 1 year pressure cycling. ................................................... 103
Figure 5-22: Vertical displacement of the cavern roof over 5-year period due to creep.
Cavern pressure is constant and equal to 8.8 MPa (1276 psi). ............................... 104
Figure 5-23: Contour plot of the shear stress around the cavern (H/D=1/2) after one year
of operation at a hydrostatic pressure of 8.8 MPa (1276 psi). ................................ 105
Figure 5-24: Contour plot of damage around the cavern (H/D=1/2) after one year of
operation at a hydrostatic pressure of 8.8 MPa (1276 psi). .................................... 106
Figure 5-25: Contour plot of displacement magnitude of a cavern with H/D ratio of (1/2)
after one year of operation at a hydrostatic pressure of 8.8 MPa (1276 psi). ......... 106
Figure 5-26: Propagation of micro-cracks around the cavern (H/D=1/2) and location of
slippage after one year of operation at a pressure drawdown to 4.4 MPa (638 psi).
................................................................................................................................. 107
Figure 5-27: Displacement magnitude and location of slippage after one year of operation
at a pressure drawdown to 4.4 MPa (638 psi)......................................................... 107
Figure 5-28: Extent of damage for a larger cavern with (H/D=1/4) after 1 year of cyclic
pressure operations.................................................................................................. 109
Figure 5-29: Contour plot of displacement magnitude of larger cavern with (H/D=1/4)
after 1 year of cyclic pressure operations. .............................................................. 109
Figure 5-30: Distribution of micro-cracks for the cavern with H/D=(1/1) after 1 year of
cyclic pressure operations. ...................................................................................... 110
Figure 5-31: Contour plot of displacement magnitude for the cavern with H/D=(1/1) after
1 year of cyclic pressure operations........................................................................ 110
Figure 5-32: Damaged regions and location of interface slip for a larger cavern with
H/D=(1/4) after a 1 year operation with pressure drawdown to 4.4 MPa (638 psi).
................................................................................................................................. 111
Figure 5-33: Contour plot of displacement magnitude for a larger cavern with H/D=(1/4)
after a 1 year operation with pressure drawdown to 4.4 MPa (638 psi). ................ 111

Geomechanical Analysis of Thin Bedded Salt Caverns
DE-FC26-03NT41813 10
Figure 5-34: Distribution of micro-cracks and interface slip of a cavern with H/D ratio of
(1/1) after 1 year operation with pressure drawdown to 4.4 MPa (638 psi). .......... 112
Figure 5-35: Contour plot of displacement magnitude of a cavern with H/D ratio of (1/1)
after 1 year operation with pressure drawdown to 4.4 MPa (638 psi). ................... 112
Figure 5-36: Tensile failure in the anhydrite layer, distribution of micro-cracks in the salt
and location of interface slip with reduced overburden stiffness. .......................... 113
Figure 5-37: Contour plot of displacement magnitude and location of interface slip with
reduced overburden stiffness. ................................................................................. 114
Figure 5-38: Regions of micro-cracks and extension of interface slip for cavern geometry
with double roof thickness after one year of pressure cycling operation. .............. 115
Figure 5-39: Displacement magnitude and extension of interface slip for cavern geometry
with double roof thickness after one year of pressure cycling operation. .............. 115
Figure 5-40: Regions of micro-cracks and extension of interface slip for softer interface
properties (Friction angle reduced to 5 degrees)..................................................... 116
Figure 5-41: Contour plot of displacement magnitude for softer interface properties
(Friction angle reduced to 5 degrees)...................................................................... 117
Figure 5-42: Three dimensional multiple horizontal caverns baseline model. .............. 119
Figure 5-43: Plot of displacement magnitude for caverns in equilibrium with cavern
pressure of 8.8 MPa (1276 psi). Center to center distance is 2 cavern diameters. . 120
Figure 5-44: Distribution of damage and interface slip of caverns with center to center
distance of 2 cavern diameters. Cavern pressure is 8.8 MPA (1276 psi). .............. 120
Figure 5-45: Contour plot of displacement magnitude after 1 year of pressure cycling.
Center to center distance is 2 cavern diameters. ..................................................... 121
Figure 5-46: Distribution of micro-cracks and location of interface slip after 1 year of
pressure cycling. Center to center distance is 2 cavern diameters. ......................... 121
Figure 5-47: Plot of displacement magnitude for caverns in equilibrium with cavern
pressure of 8.8 MPa (1276 psi). Center to center distance is 3 cavern diameters. . 123
Figure 5-48: Plot of displacement magnitude for caverns after one year of pressure
cycling. Center to center distance is 3 cavern diameters. ....................................... 123
Figure 7-1: Step by step methodology for geomechanical analysis of bedded salt caverns.
................................................................................................................................. 133

Geomechanical Analysis of Thin Bedded Salt Caverns
DE-FC26-03NT41813 11
List of Tables Table 4-1: Major salt deposition in Permian Basin complex............................................ 21
Table 4-2: Midland Basin active underground hydrocarbon storage data....................... 29
Table 4-3: Anadarko Basin active underground hydrocarbon storage data..................... 49
Table 4-4: Michigan Basin active underground hydrocarbon storage data. .................... 59
Table 4-5: Appalachian Basin active underground hydrocarbon storage data. ............... 66
Table 5-1: Summary of material parameter used for the one-element test case............... 80
Table 5-2: Summary of nonsalt material parameters for Permian Basin.......................... 93
Table 5-3: Simulation matrix for single cavern numerical investigations. ...................... 95
Table 5-4: Material properties for salt and non-salt used in the baseline model ............. 96
Table 5-5: Simulation matrix for multiple horizontal caverns numerical investigations.
................................................................................................................................. 118

Geomechanical Analysis of Thin Bedded Salt Caverns
DE-FC26-03NT41813 12
1 Executive Summary The primary objective of this GRI/DOE project is to increase the gas storage capabilities by providing operators with improved geotechnical design and operating guidelines for thin bedded salt caverns. In this final report, Terralog has summarized the geologic conditions, pressure conditions and critical design factors that may lead to:
• Fracture in heterogeneous materials; • Differential deformation and bedding plane slip; • Propagation of damage around cavern and ultimately failure.
We also provide design recommendations for single and multiple cavern configurations in various bedded salt environments. In Section 5, we identify several potential salt layers that can be targets for salt cavern development. Terralog recommends a minimum 50 m (165 ft) thick salt layer and minimum 300 m (1,000 ft) depth for salt cavern development. The exact depth to cavern is dependent on locally geology and salt dissolution. Currently, active cavern operations are found in the Midland and Anadarko Basins within the Permian Basin Complex and in the Appalachian and Michigan Basins.
The Midland Basin has the largest salt cavern operations with 13 operators operating approximately 100 wells. Salado is the dominant salt bearing unit where all the active caverns are found. The thickest Salado salt can be found in the southwestern part of the Basin in less than 600 m (2,000 ft) depth. Midland Basin offers deeper potential salt units where the cost for cavern development should be considered. The Salado salt is also the dominant halite unit within the Delaware Basin. The Salado in Delaware Basin is too shallow for salt cavern siting. Thick salt units may be found locally within the Castile Formation especially in the northern part of the Basin. The Palo Duro Basin offers salt cavern development potential in the San Andres Formation on the southwest side of the Basin, and locally on the eastern part of the Basin within the Upper Clear Fork Formation and on the south within the Seven Rivers Formation. There is no salt cavern potential within the Dalhart Basin where the dominant Blaine salt unit is too thin, and the Upper Clear Fork salt is too shallow for cavern development. Two operators are actively operating over 25 wells in the Anadarko Basin within the Lower Cimarron Salt Formation. Hutchison Member salt offer potential cavern siting in the northeast portion of the Anadarko Basin, where locally thick salt may be found in less than 900 m (3000 ft).

Geomechanical Analysis of Thin Bedded Salt Caverns
DE-FC26-03NT41813 13
Six operators operate approximately 30 caverns within the Michigan Basin in the Salina salt. All wells are located within the southern rim of the Basin where the caverns are found in less than 1,200 m (4,000 ft) depth. There are at least 2 halite beds about 50 m (165 ft) thick salt in the Salina Formation. Within the Appalachian Basin, 3 operators operate over 15 caverns in New York State, while Marathon Ashland operates one cavern with 2 wells in Ohio State. Caverns are excavated in the thick Salina salt in less than 1,050 m (3,500 ft) in the northern part of the Appalachian Basin in New York State and in 1,100 m (3,600 ft) depth in Ohio, on the western side of the Appalachian Basin.
In Section 6, Terralog summarizes numerical results of a parametric analysis of caverns located within thin bedded salt. A modified creep viscoplastic model has been developed and implemented in Flac3D to simulate the salt material behavior at the Permian, Michigan and Appalachian Basins. The viscoplastic salt model is based on an empirical creep law developed for Waste Isolation Pilot Plant (WIPP) Program and combined with the Drucker-Prager model for damage and ultimately failure. The Permian salt lab test data (Pfeifle et al., 1983) are used to verify and validate the modified material model. A baseline model with specified geometric dimensions is first selected and subjected to predefined cyclic pressure operations. The amount of damage around the cavern wall and roof is evaluated and used as comparison to other results. Design parameters are varied to evaluate how they may affect propagation of damage and the deformation of cavern. These are the cavern pressure, operating conditions, cavern size expressed in terms of height/diameter (H/D) ratio, overburden stiffness and roof thickness. The simulations performed can be summarized into two main categories, the first involves a single cavern; the second multiple caverns:
The baseline results, for the single cavern simulations, shows a shear stress distribution primarily around the cavern top and bottom corners, salt damage mainly around the cavern sidewall and slippage in the top interface between the salt formation and the anhydrite layer. During cyclic pressure operations, the shear-stress zones propagate into a wider region, which is responsible for an increase in the amount of slippage in the interface. During cyclic pressure loading, the magnitude of the maximum shear stress does not increase, which results in no additional damage (micro-cracks) in the surrounding salt.
In addition to the cyclic pressure operation, two other pressure operations are considered, including a hydrostatic pressure load and a direct pressure drawdown. All operations are continued for 1 year and the time dependent cavern response is monitored. Hydrostatic pressure results in most stable conditions of the cavern, involving a rather limited amount of damage in close proximity to the cavern. However, reducing pressure from 8.8 MPA (1276 psi) to 4.4 MPA (638 psi), the damaged regions expand through the entire roof thickness and in the lateral

Geomechanical Analysis of Thin Bedded Salt Caverns
DE-FC26-03NT41813 14
direction. Obviously, an increase in damage increases the likelihood of cavern collapse, most probably in the form of roof failure
The effect of cavern size and shape, expressed in terms of a Height/Diameter (H/D) ratio, on the propagation of the damaged region is investigated. The results indicate that for a larger cavern the tendencies of closure accelerates, the damaged region as well as the amount and extension of slippage increases. Both conditions, a cyclic pressure operations and direct pressure drawdown to 4.4 MPa (638 psi) are simulated. Reducing the cavern pressure from hydrostatic to 4.4 MPa (638 psi), increases the risk of salt cavern collapse independent of the size and shape of the cavern itself. The influence of the overburden stiffness is considered a critical parameter on the overall cavern response. In this report the corresponding results are given when the overburden stiffness is reduced by an order of magnitude. It is shown that a substantial part of the weight of the overburden material is carried by the anhydrite layer and by the cavern roof itself. For this particular case, the anhydrite reaches it tensile limit and fails. This failure implies that the cavern roof is subjected to a much higher load and therefore the amount and extension of damage increases substantially. Also, for the single cavern case, the effect of the roof thickness is evaluated. For this particular case the thickness of the salt layer is increased from 54 m (177 ft) to 78 m (256 ft). This allows doubling the roof thickness without moving the location of the cavern itself. We found that increasing the roof thickness reduces the amount of damage in salt. Finally, an attempt is made to investigate the influence of the interface strength on the cavern response. The interface strength is modeled as pressure dependent by introducing a constant friction angle. To reduce the interface strength, the friction angle is reduced. This shows that the interface strength is primary responsible on how much load is transferred to the cavern roof. Reducing the interface strength increases the amount and extent of damage. The second category into which the simulations have been divided, concentrates on the determination of the minimum safe center to center distance of multiple horizontal caverns. We found that a center to center distance of two cavern diameters is not sufficient to eliminate the mutual interaction. Increasing the center to center distance to three cavern diameters, does indeed eliminate almost entirely any interaction. It should be pointed out that in both cases the interaction stresses are within the elastic limit and therefore, at least in theory, no damage and no micro-cracks are generated in the intermediate cavern region. For this category we consider hydrostatic pressure loading as well as cycling pressure operation. Both simulations extend over a one year period.

Geomechanical Analysis of Thin Bedded Salt Caverns
DE-FC26-03NT41813 15
Concluding, when multiple caverns are present, the acceptance level of certain operational conditions depends not only on formation properties and on the distance between the caverns itself, but also on how aggressive the operational conditions are. It is strongly recommended that numerical simulations be preformed to improve the complex interaction. In Section 7, we have summarized the general industry guidelines compiled from IOGCC (1998), CSA Standard Z341 Series -02 (2002) and the Railroad Commission of Texas. When there are discrepancies, the most stringent requirements are cited and when ever possible, the American standards will be preferred. Terralog also provides a Step by Step methodology to assess critical cavern design parameters for thin bedded salt formations. The basic process involves estimating the current rock strength and formation stress values with the best available data, calculating induced stresses due to cavern creation and pressure cycling, and then comparing the induced stresses to the estimated limiting strength and stress values. The specific steps taken for a given project will depend on the available data and the desired solution accuracy. These design steps have been summarized in Section 8.

Geomechanical Analysis of Thin Bedded Salt Caverns
DE-FC26-03NT41813 16
2 Introduction The first task for this DOE Solicitation DE-PS26-02NT41488 is to review and summarize for operators the geologic settings for major bedded salt Basins in the United States, and the typical geomechanical properties and implications for cavern development and operations. For this DOE Solicitation, Terralog Technologies focused on the Michigan-Appalachian Basins and the Permian Basins Complex. See Figure 2-1 for major bedded salt Basins in the United States.
Figure 2-1: Major bedded salt Basins in US. When siting a salt cavern, the following should be considered:
• A minimum 300 m (1,000 ft) depth and below any known salt dissolution is recommended for locating salt caverns. The salt cavern should be deep enough to prevent surface erosion and dissolution by circulating ground water. Also, the rate of plastic flow of rock salt resulting from overburden pressure increases exponentially with depth.
• Based on our simulation, a minimum of 50 m (1650 ft) thick salt layer is recommended for salt cavern development. The salt should be extensive in both the vertical and lateral directions and be relatively homogeneous to provide for
Williston Basin Michigan Basin
Appalachian Basin
Permian Basin
Gulf Coast
Source: National Petroleum Technology Office

Geomechanical Analysis of Thin Bedded Salt Caverns
DE-FC26-03NT41813 17
adequate heat dissipation. Heat dissipation can be impaired by impurities near the storage cavern.
Task 1 of this DOE Solicitation is to review and summarize these geologic characteristics within the Permian Basin Complex and the Michigan and Appalachian Basins. A detailed geologic literature search using Georef was performed on the Michigan, Appalachian and the Permian Basins Complex. Detailed geologic characterization is important and necessary pre-requisite for analytical or numerical investigations on the geomechanical processes in bedded salt formation, allowing us to establish a realistic range of scenarios for future parametric model investigations. Based on this geological review, Terralog has identified other potential salt layers that can be developed for future cavern development. Terralog have also reviewed and summarized for operators typical mechanical properties for bedded salt materials in the area, including typical interbedded materials such as anhydrite, dolomite, shale, sandstone and limestone. This effort is to define the different material properties that may be encountered in thin-bedded salt development, the resulting deformation behavior of interfaces and composite layers due to cavern pressure cycling. Based on the collected data, Terralog has investigated and performed various 2D and 3D simulations to determine the minimum and maximum pressure limits for thin bedded salt caverns in a variety of typical situations occurring within the Permian Basin Complex and the Michigan and Appalachian Basins.

Geomechanical Analysis of Thin Bedded Salt Caverns
DE-FC26-03NT41813 18
3 Experimental No experiment was performed for this project. All results are analytical and are described in details under “Results and Discussion” section of the report.
4 Results and Discussion
4.1 Geological Review
4.1.1 Permian Basin Complex The Permian Basin Complex consists of an interconnected group of Basins that were at times connected by shallow seaways. They are, from the northeast to the southwest, the Anadarko, Palo Duro, Midland and Delaware Basins. A smaller adjacent basin, the Dalhart Basin, lies to the northwest of the margin between the Anadarko and Palo Duro Basins. A structural element map for the Permian Basin Complex is shown in Figure 4-1.

Geomechanical Analysis of Thin Bedded Salt Caverns
DE-FC26-03NT41813 19
Figure 4-1: Structural element for Permian Basin complex.
From Johnson and Gonzales, 1978
Geomechanical Analysis of Thin Bedded Salt Caverns
DE-FC26-03NT41813 20
4.1.1.1 Geologic Setting Pre-Permian sedimentation in the Permian Basin Complex ranges from 1,000-9,000 m (3,000-30,000 ft) thick of mainly Cambrian to Devonian carbonates, and Mississippian to Pennsylvanian clastics and carbonates (Johnson and Gonzales, 1978). The Permian Basin Complex formed because of rapid subsidence that took place during the Mississippian-Pennsylvanian Periods. There were simultaneous mountain building occurring to the east of the Permian Basin Complex, and rapid filling of the basins. By the middle of the Permian Period, the basins had been leveled off (Terralog, Dec. 30, 2001). Complex faulting created platforms and arches subdividing the Permian Basin Complex into the five separate basins: Anadarko, Palo Duro, Dalhart, Midland and Delaware Basins. During Permian time, a broad and shallow inland sea covered much of southwest United States. Then restricted access to the open ocean developed, and a prolonged period of over 30 million years caused the deposition of evaporites in the late Permian Period (Terralog, Dec. 30, 2001). Evaporites formed because of evaporation of seawater. There are numerous evaporite cycles within the Permian Basin Complex. An evaporite cycle typically began with a flooding event and deposition of limestones and dolomites at the base, which was then overlain by the precipitation of anhydrite or gypsum. Build up of sediment further restricted the water movement, which caused the precipitation of halite (salt). Mud, silt and sand deposited by aeolian and fluvial processes maybe interbedded with halite. Normal marine water entered the Delaware and Midland Basins from open ocean to the southwest (Johnson and Gonzales, 1978). Typically clastic sediments were deposited in the alluvial and nearshore environment while the evaporites were deposited in the central part of the inland sea or Basins. Evaporites such as anhydrite, dolomite and halite (salt) were precipitated and accumulated. The oldest salt, the Hutchison Salt Member was found in the northern Anadarko Basin, Kansas and Oklahoma border in Leonardian (late Early Permian) time. Evaporites accumulation moved southward. By later Leonardian time, salt accumulation had migrated into the Dalhart and Palo Duro Basins. By late Guadalupian (Late Permian) time, evaporite deposits had reached the Delaware and Midland Basins. The youngest salt, the Salado Salt was widespread in the Delaware and Midland Basins by Ochoan (latest Late Permian) time (Johnson and Gonzales, 1978). Table 4-1 shows this progression of salt deposition within the Permian Basin Complex.

Geomechanical Analysis of Thin Bedded Salt Caverns
DE-FC26-03NT41813 21
Table 4-1: Major salt deposition in Permian Basin complex. AGE/ SERIES
MIDLAND BASIN
DELAWARE BASIN
PALO DURO BASIN
DALHART BASIN
ANADARKO BASIN
Tria
ssic
to T
ertia
ry
Undiff. Tertiary to Triassic
Undiff. Tertiary to Triassic
Undiff. Tertiary to Triassic
Undiff. Tertiary to Triassic
Undiff. Tertiary to Triassic
Dewey Lake Dewey Lake Dewey Lake Dewey Lake Quartermaster Alibates Rustler Alibates Alibates Alibates
Och
oan
Salado Salado Salado Salado Tansill Castile Tansill Tansill Yates Yates Yates
Cloud Chief
7 Rivers 7 Rivers 7 Rivers Queen Queen Queen
Arte
sia
Gp
Grayburg
Bell Canyon
Arte
sia
Gp
Grayburg Grayburg
Whitehorse
Cherry Canyon
Upp
er P
erm
ian
Gua
dalu
pian
San Andres
Brushy Canyon
San Andres
Blaine
Blaine/ Flowerpot
Sparberry Glorieta Glorieta Glorieta Dean Upper Clear
Fork Upper Clear Fork
Upper Cimarron
Tubb Tubb Cimarron Anhydrite
Lower Clear Fork
Lower Clear Fork C
lear
For
k G
p Lower Cimarron
Red Cave Red Cave Hennessey
Low
er P
erm
ian
Leon
ardi
an
Bone Spring
Witchita Gp
Wichita Gp
Wellington Hutchison Mrb
Compiled from McGookey, Gustavson and Hoadley, 1988, Johnson and Gonzales, 1978,
Hovorka and Nava 2000, Gustavson, Finley and McGillis, 1980
Legend: Red---Formation with major salt accumulation

Geomechanical Analysis of Thin Bedded Salt Caverns
DE-FC26-03NT41813 22
Basin evolution after evaporite deposition is important for salt cavern siting because the salt geometry was modified by burial dissolution (Hovorka and Nava, 2000). The Permian Basin Complex region was tectonically stable after the deposition of salts. Minor amounts of subsidence and warping were noted. The Permian and younger strata are virtually free of deformation and in most areas have less than ½º dip (Johnson and Gonzales, 1978). Faults that displace Permian salt bearing rocks in the region are rare. Permian rocks are locally faulted and sharply flexed along the Amarillo-Wichita Uplift and the Matador Arch (Johnson and Gonzales, 1978). At other areas, strata overlying the salt sequence are disturbed because of localized salt dissolution causing the younger strata to collapse. Salt dissolution prior to Cretaceous deposition has been reported in many parts within the Permian Basin Complex (Hovorka and Nava, 2000).
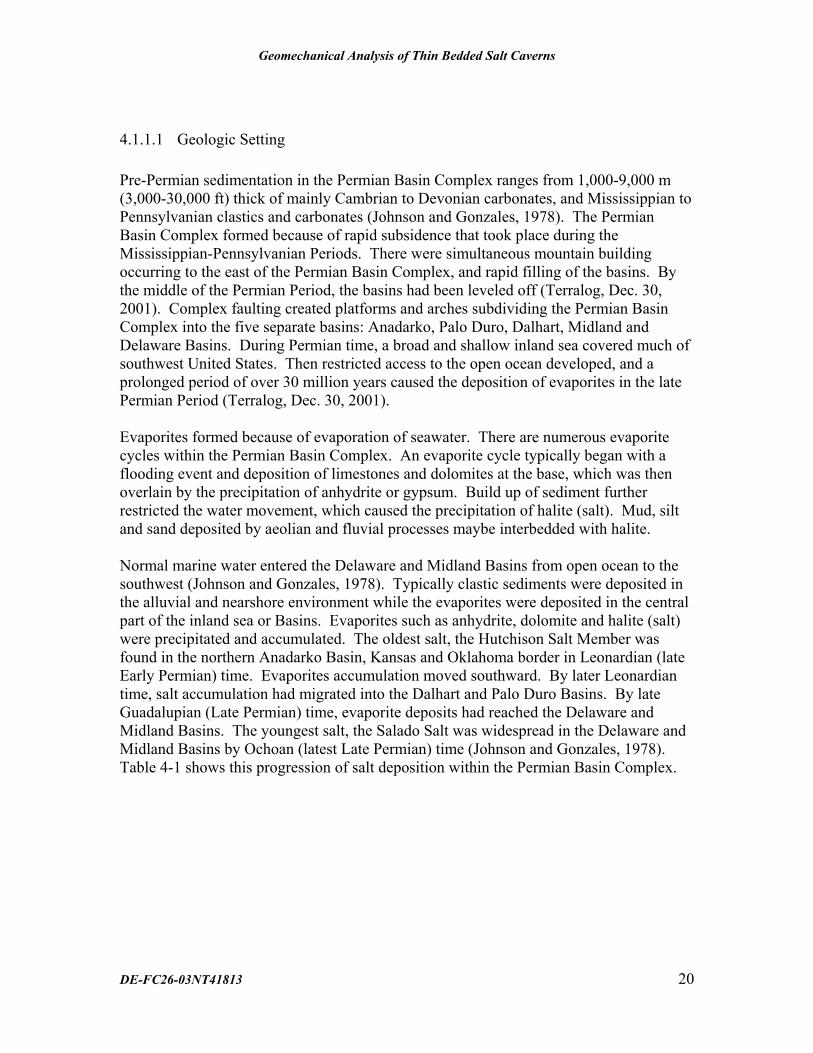
4.1.1.2 Midland Basin There are 4 salt bearing formations: Salado, Tansill, Seven Rivers and Queen. Midland Basin has the most salt caverns storage operation within the Permian Basin Complex. A total of 13 operators are actively operating approximately 100 wells within the Midland Basin. (See Table 4-2). All the salt storage caverns operation is found within the Salado Formation, the dominant salt bearing unit. (See Figure 4-3.) Beside the Salado Formation, the Queen Formation offer additional salt cavern siting especially in the northern part of the basin.

Geomechanical Analysis of Thin Bedded Salt Caverns
DE-FC26-03NT41813 23
Figure 4-2: Midland Basin schematic stratigraphic column.
Modified from Hovorka and Nava, 2000, Johnson and Gonzales, 1978
Terti
ary
-
Tria
ssic
Dewey Lake100-200
THICK(ft)
FORMATIONLITHOLOGY
Alibates100-400
Salado
Clastic red beds
2 anhydrite beds 10-50’ thick, silici-clastics
6 mastercycles: insoluble residue, multiple halite-mudstone cycles and anhydrite. All caverns found here. No major thickness, salt quality changes throughout basin.
M60: 175-225’ thick cycle, 100’ halite w/2-3 halite-mudstone cycles.
M50: 50-75’ thick cycle, 3-5 halite-mudstone cycles.
M40: 100-200’ thick cycle, discontinuous.
M30: 50-200’ thick cycle, max. 9 halite-mudstone cycles.
M20: 175’ thick cycle, 3-50’ anhydrite, 5-6 halite-mudstone cycles.
M10: 50-150’ thick cycle.
Tansill100-200
3-5 anhydrite beds, 3-4 halite beds, halite in the east and northern part, dolomite, anhydrite silici-clastics at basin center.
Yates100-175 Silt, fine sandstones
7 Rivers Interbedded mudstones, salt, anhydrite and dolomite. 500?
U P
P E
R
P E
R M
I A
N
Sandstones
Queen and
Grayburg580?
400-1000
Interbedded halite-mudstone mix, halite and clastic redbeds, dolomite at bottom
0-2100
Tertiary and Cretaceous to Triassic sediments
LITHOLOGY
Undifferentiated mudstones and sandstones
Arte
sia
Gro
up
FM.TOP
(ft)
600-2300
1000-3200
1200-3400
1400-3600
Dolomites
Anhydrite
Salt/salt dissolution
Halite-mudstone mix
Insoluble residue Mudstones
Clastics: RedbedsAnhydrite
Salt/salt dissolution
Halite-mudstone mix
Insoluble residue Mudstones
Clastics: Redbeds

Geomechanical Analysis of Thin Bedded Salt Caverns
DE-FC26-03NT41813 24
The Tansill, Seven Rivers and Queen salt bearing formations belong in the Artesia Group. In the Midland Basin, the Artesia Group can reach up to 600 m (2,000 ft) thick, and the aggregate salt bed may reach 50% (Terralog, Dec. 30, 2001). Artesia Group is predominantly shale and anhydrite in the north, and sands and carbonates in the south. The lowest most salt bearing formation in the Midland Basin is the Queen Formation within the Artesia Group where halite beds were intermixed with redbeds sandstones and mudstones. Approximately 30-90 m (100-300 ft) thick salt beds were recorded in Cochran 14 well in the northern part of the Midland Basin at 1,000 m (3,400 ft) depth (Hovorka and Nava, 2000). The Seven Rivers Formation is composed of cyclically interbedded mudstones, salt, anhydrite and dolomite. Several thick anhydrite beds are found within this formation. Typical salt beds are 2-20 m (6-60 ft) thick and interbedded with mudstones, anhydrite and sandstones (Johnson and Gonzales, 1978). Locally over 30 m (100 ft) thick salt was found in Cochran 14 well in the north (Hovorka and Nava, 2000). The depth to salt appears to be at 600-1,200 m (2,000-4,000 ft) in most part of the Midland Basin (Johnson and Gonzales, 1978). The Tansill Formation averages 30-60 m (100-200 ft) thick, is highly cyclic and laterally heterogeneous. At the northern and eastern margin of the Midland Basin, Tansill Formation is composed of 3-4 halite beds with abundant clastic interbeds. At the center of the Midland Basin, Tansill is predominantly anhydrite or dolomite with halite interbeds. Halite becomes more dominant up section. Tansill can be found at approximately 200 m (700 ft) depth at the eastern Basin margin, 300 m (900 ft) depth at the southwest along the Central Basin Platform, and below 1,000 m (3,200 ft) depth at the north-central Basin location (Hovorka and Nava, 2000). The dominant and youngest salt bearing unit in the Midland Basin is the Salado Formation. Bedded halite is the most common lithology. Salado Formation contains 6 regionally traceable master cycles of anhydrite, mudstones and halite overlain by an insoluble residue (Hovorka and Nava, 2000).
Master cycle 10: is the bottom most cycle and this interval is 15-50 m (50-165 ft) thick. A persistent insoluble residue bed is identified at the top of the cycle. This interval is thin and discontinuous. Master cycle 20: is 50 m (165 ft) thick interval and has the thickest and most distinctive anhydrite bed (up to 10 m or 30 ft). Five to 6 halite-mudstone sequences are found within this interval. Master cycle 30: ranges from 15-60 m (50 to 200 ft) thick, and can contain up to 9 halite-mudstone sequences.

Geomechanical Analysis of Thin Bedded Salt Caverns
DE-FC26-03NT41813 25
Master cycle 40: is discontinuous and ranges from 30-60 m (100-200 ft) thick. Six to 10 halite-mudstone sequences are identified. Master cycle 50: is continuous and well defined across the Midland Basin. This interval is 20 m (75 ft) thick containing 3 to 5 halite-mudstone sequences. Master cycle 60: is top most cycle and this interval is 50-70 m (165-225 ft) thick. Halite is clean and can be as much as 30 m (100 ft) thick. This interval contains 2 to 3 halite-mudstone sequences.
Thin lamina of anhydrite, mudstones and siltstones were deposited during prolong exposure of the halite flat. Cores recovered from the Salado shows anhydrite is in 5-15% aggregate percentage and halite is in 53-85% aggregate percentage. The cores also show the clayey insoluble residue to be brecciated with abundant fractures, small faults and joints (Hovorka and Nava, 2000). Salt had been locally dissolved within this formation. Top of Salado is located below 300 m (1,000 ft) at the eastern and southern Basin margin; while at the Basin center it was located between 550-700 m (1,800-2,300 ft) depth (Figure 4-3). The thickest salt thickness appears to be on the southwest margin of the Midland Basin, closer to the Central Basin Platform. Approximately 450 m (1,500 ft) of salt were recorded 10km (25 miles) east and southeast of Carlsbad (Terralog, Dec. 30, 2001). As seen from Figure 4-3 and Figure 4-4, the thickest salt found along the southwest margin can be reached below 600 m (2,000 ft) depth.
Geomechanical Analysis of Thin Bedded Salt Caverns
DE-FC26-03NT41813 26
Figure 4-3: Generalized depth to top Salado formation. From Hovorka and Nava, 2000

Geomechanical Analysis of Thin Bedded Salt Caverns
DE-FC26-03NT41813 27
Figure 4-4: Salado formation isopach. From Johnson and Gonzales, 1978

Geomechanical Analysis of Thin Bedded Salt Caverns
DE-FC26-03NT41813 28
4.1.1.2.1 Midland Basin Cavern Sonar Review
Terralog has obtained over 50 sonar surveys of salt caverns within the Midland Basin. The data is presented in Table 4-2. All the caverns are within the Salado Formation. Terralog review shows that the average cavern in the Midland Basin has a height of 29m (95 ft) and diameter of 38m (125 ft). The minimum height of the cavern is as small as 8m or 27ft, while the maximum is recorded at 70 m (230 ft). The minimum cavern diameter is 5 m (15 ft) while the maximum is at 96m (316ft) wide. Terralog’s simulation recommends a cavern height of 30 m (100 ft) in 50 m (165 ft) thick salt as the most stable configuration. Approximately half of the operations surveyed within the Midland Basin have stack caverns. The cavern shape varies from narrow cylindrical to stack pancakes to upside down cone shapes. The average capacity of the cavern is 248,182 barrels. See Figure 4-5 for typical salt cavern configurations in the Midland Basin.
The salt caverns on the eastern part of the Basin are located between 300-450 m (1,000 to 1,400 ft) depth, while the caverns are located around 700 m (2,300 ft) depth in the north. At Basin’s center the salt caverns are found between 750-850 m (2,500 to 2,800 ft) depth. Unocal operates their salt caverns at 650-800 m (2,100 to 2,600 ft) depth in Winkler County in the southwest portion of the Basin. (See Figure 4-3).

Geomechanical Analysis of Thin Bedded Salt Caverns
DE-FC26-03NT41813 29
Table 4-2: Midland Basin active underground hydrocarbon storage data.
CompanyCavern
No.Product Stored
Main Roof
Bottom Depth (ft)
Ave. Height (ft)
Ave. Diameter
Cavern Volumn
Ht/W Ratio Shape
Unocal/Union Oil Co. 1a natural gas 2105 2165 60 60 30,199 1.0000 cylinder1b natural gas 2212 2315 103 160 368,647 0.6438 stack pancakes1c natural gas 2455 2530 75 220 507,505 0.3409 cylinder1d natural gas 2603 2650 47 382 958,867 0.1230 cylinder
Unocal/Union Oil Co. 2a natural gas 2055 2140 85 120 171,126 0.7083 upside down cone2b natural gas 2202 2290 88 255 800,012 0.3451 stack pancakes2c natural gas 2432 2488 56 230 414,169 0.2435 stack pancakes2d natural gas 2580 2660 80 181 366,421 0.4420 cylinder
Mid-America Pipeline Co. 1 Y Grade 2540 2587 47 316 656,154 0.1487 cylinderMid-America Pipeline Co. 2 Y Grade 2550 2685 135 145 396,829 0.9310 stack pancakesMid-America Pipeline Co. 3 butane 2640 2730 90 145 264,553 0.6207 upside down coneMid-America Pipeline Co. 4 Y Grade 2618 2713 95 130 224,463 0.7308 stack upside down conesMid-America Pipeline Co. 5 butane 2623 2710 87 125 190,052 0.6960 stack upside down conesMid-America Pipeline Co. 6 propane 2610 2665 55 200 307,579 0.2750 cylinderMid-America Pipeline Co. 7 Y Grade 2620 2682 62 134 155,645 0.4627 stack pancakesMid-America Pipeline Co. 8 propane 2640 2715 75 160 268,432 0.4688 upside down coneMid-America Pipeline Co. 9 E/P mix 2607 2700 93 175 398,192 0.5314 stack upside down conesMid-America Pipeline Co. 11a gasoline 2600 2627 27 44 7,308 0.6136 stack pancakes
11b gasoline 2648 2730 82 70 56,175 1.1714 stack upside down conesMid-America Pipeline Co. 12a propane 2573 2621 48 85 48,486 0.5647 stack pancakes
12b propane 2643 2710 67 107 107,245 0.6262 upside down coneMid-America Pipeline Co. 13 propane 2625 2738 113 87 119,578 1.2989 stack pancakesMid-America Pipeline Co. 14 E/P mix 2640 2746 106 94 130,947 1.1277 cylinder
Amoco Production Co. 1 n/a 2417 2682 265 75 208,402 3.5333 upside down cone w/long neckAmoco Production Co. 2a n/a 2335 2408 73 36 13,227 2.0278 stack upside down cones
2b n/a 2408 2425 17 273 177,136 0.0623 upside down coneAmoco Production Co. 3a n/a 2325 2382 57 23 4,216 2.4783 cylinder
3b n/a 2400 2525 125 76 100,942 1.6447 diamondChevron Pipeline Co. 1a Y Grade 1368 1450 82 55 34,679 1.4909 stack pancakes
1b Y Grade 1450 1507 57 146 169,869 0.3904 cylinderChevron Pipeline Co. 2a Y Grade 1195 1354 159 15 5,002 10.6000 stack pancakes
2b Y Grade 1381 1512 131 78 111,428 1.6795 stack pancakesChevron Pipeline Co. 3a Y Grade 1205 1435 230 24 18,522 9.5833 stack pancakes
3b Y Grade 1445 1483 38 115 70,261 0.3304 chevronAlon USA, LP 1001a propane 977 1060 83 25 7,253 3.3200 upside down cone
1001b propane 1080 1190 110 92 130,167 1.1957 stack pancakesAlon USA, LP 1004a butane 985 1085 100 23 7,396 4.3478 stack upside down cones
1004b butane 1107 1200 93 59 45,261 1.5763 stack upside down conesAlon USA, LP 1005a propylene 1070 1165 95 46 28,104 2.0652 stack upside down cones
1005b propylene 1205 1240 35 140 95,909 0.2500 upside down coneAlon USA, LP 1007a butylene 995 1175 180 28 19,730 6.4286 stack pancakes
1007b butylene 1205 1245 40 128 91,625 0.3125 cylinderOneok 1 natural gas 2790 3020 230 200 1,286,238 1.1500 cylinderOneok 2 natural gas 2728 2910 182 230 1,346,048 0.7913 bell
Average 95 125 248182
Small letter in Cavern No. column denotes separate cavern within the same well.

Geomechanical Analysis of Thin Bedded Salt Caverns
DE-FC26-03NT41813 30
Figure 4-5: Typical salt cavern configurations in Midland Basin.
Unocal Keystone GSU #2 well
Upside down cone
Stack pancakes
Stack pancakes
cylinder
Upside down cone
Stack pancakes
Stack pancakes
cylinder

Geomechanical Analysis of Thin Bedded Salt Caverns
DE-FC26-03NT41813 31
4.1.1.3 Delaware Basin The Salado and Castile are the two salt bearing units in the Delaware Basin. In Ochoa time, the sea gradually retreated to the south while fine-grained redbed clastics were deposited to the north (Hills, 1968). Both the Salado and Castile salts are found on the northern and eastern part of the Delaware Basin only. The Salado Formation is the dominant salt bearing formation in the Delaware Basin where Unit 5 can be over 50 m (165 ft) thick salt beds. However, this formation is found in less than 300 m (1,000 ft) depth, too shallow for cavern development. Locally, the Castile salt may be developed for caverns, especially in the northern part of the basin.

Geomechanical Analysis of Thin Bedded Salt Caverns
DE-FC26-03NT41813 32
Figure 4-6: Delaware Basin schematic stratigraphic column. Modified from Cromwell, 1984, Hovorka and Nava, 2000, Johnson, 1986
Terti
ary
-
Tria
ssic
Dewey Lake400-500
THICK(ft)
FORMATIONLITHOLOGY
Rustler230-400
Salado
mudstones, siltstones and sands
2 anhydrite beds with dolomites, sands and mudstones
8 units of halite with basal anhydrite, minor dolomite, mudstones and insoluble residues.
Unit 8: ave. 250’ thick, basal anhydrite 40’ thick, halite with 5-10’ thick mudstone interbeds.
Unit 7: ave. 250’ thick, basal anhydrite 30-70’, halite w/5-10’ mudstones
Unit 6: ave. 100’ thick, basal anhydrite 30-40’ thick, halite 50-120’ thick.
Unit 5: max 400’ thick, basal anhydrite 20’ thick, thickest salt section, salt 100-250’ thick.
Unit 4: 60’ thick, basal anhydrite 20’ thick, persistent mudstone 5-10’ thick, unit very uniform throughout.
Units 3 & 2: about 1000’ thick, basal anhydrite 50-100’ thick, halite with mudstone interbeds.
Unit 1: 100-200’ thick, no basal anhydrite.
Castile1800
4 thick anhydrite beds, lower 3 anydrite beds merged as one unit in the east. Max. salt 800’ thick.
Bell Canyon800-1500 Silt, sandstones, mudstones and dolomites.
U P
P E
R
P E
R M
I A
N
Sandstones
850-2200
0-400
Tertiary and Triassic sediments
Undifferentiated red mudstones and sands
LITHOLOGY FM. TOP
(ft)
0-200
700-1200
2700-3400
400-600
Anhydrite
Salt/salt dissolution
Mudstones
Dolomites

Geomechanical Analysis of Thin Bedded Salt Caverns
DE-FC26-03NT41813 33
Castile Formation has been divided into 4 thick anhydrite units. Each unit is separated by laminated halite (Hovorka and Nava, 2000). Castile evaporites were deposited in rapidly alternating flooded and exposed shelf as the Basin was filled with halite and anhydrite/gypsum. Castile Formation is restricted to the Delaware Basin (Johnson and Gonzales, 1978). The lower 3 units are traceable throughout the Delaware Basin, and merged into a single massive unit of anhydrite towards the Central Basin Platform (Hovorka and Nava, 2000). The entire formation can reach 550 m (1,800 ft) thick. Halite is found on the northern and eastern Delaware Basin. The thickest halite accumulation is on the northern boundary where 250 m (800 ft) of halite (Figure 4-7) have been recorded 10km (25 miles) southeast of Carlsbad (Terralog, Dec. 30, 2001). Top of Castile can be found below 1,000 m (3,400 ft) depth in most part of the Delaware Basin.

Geomechanical Analysis of Thin Bedded Salt Caverns
DE-FC26-03NT41813 34
Figure 4-7: Castile formation isopach. From: Johnson and Gonzales, 1978
Salado Formation is predominantly halite with basal anhydrite. It can be divided into 8 units according to Johnson, (1986). See Figure 4-6. Each halite unit may also contain minor amount of anhydrite, dolomite and shale/mudstone interbeds. Top of Salado can be found below 200 m (700 ft) from surface across most of the Delaware Basin (Figure 4-3). Halite beds typically between 10-30 m (40-100 ft) thick are found only on the northern and eastern part of the Delaware Basin against the Central Basin Platform. The basal anhydrite is usually 10-15 m (30-50 ft) thick (Johnson, 1986). The varying salt thickness is mostly due to salt dissolution. All units are found to have salt dissolution across the Central Basin Platform and on the eastern Delaware Basin margin.

Geomechanical Analysis of Thin Bedded Salt Caverns
DE-FC26-03NT41813 35
Unit 1: is predominantly halite and lacks the basal anhydrite. This interval is about 30 m (100 ft) thick and has a net 6-10 m (20-30 ft) thick anhydrite incursion within the halite. Unit 2: lower anhydrite bed is 10-15 m (35-50 ft) thick while the halite above is 12-30 m (40-100 ft) thick. There is localized salt dissolution and this interval is about 180 m (600 ft) thick. Unit 3: has an anhydrite bed 20-30 m (70-100 ft) at the base and overlain by halite with anhydrite and mudstone interbeds. Unit 3 is about 180 m (600 ft) thick and has salt dissolution on the eastern Basin margin towards the Central Basin Platform. Unit 4: is very uniform (10-20 m or 30-60 ft thick) throughout the Delaware Basin. Its basal anhydrite is 5-7m (15-25 ft) thick while the salt is 6-10 m (20-30 ft) thick. On top of the salt is a persistent mudstone bed 2-3m (5-10 ft) thick. Unit 5 has the thickest salt section within the Salado Formation. The halite is 30-75 m (100-250 ft) thick, while the basal anhydrite is 5-6m (15-20 ft). Minor amount of mudstone and anhydrite interbeds are also found within this 120 m (400 ft) thick interval. There is recorded salt dissolution within this unit. Unit 6: has a 10 m (30-40 ft) thick basal anhydrite, a 15-20 m (50-70 ft) thick halite with several 2-3m (5-10 ft) mudstone interbeds. This interval is 30 m (100 ft) thick. Unit 7: has a 7-10 m (25-30 ft) thick basal anhydrite. The halite above is 20-35 m (70-120 ft) thick with several 2-3m (5-10 ft) mudstone beds. This interval is also fairly uniform, averaging 75 m (250 ft) thick. Unit 8: defines the top of Salado Formation. Its basal anhydrite is about 10 m (35-40 ft) thick, and halite about 10-30 m (40-90 ft) thick with several 2-3m (5-10 ft) mudstones beds. The total interval is fairly uniform across the Delaware Basin, which is about 60 m (200 ft) thick.
4.1.1.4 Palo Duro Basin There are 6 major salt bearing formations within the Palo Duro Basin. They are the Salado Formation, the Tansill and Seven Rivers Formations within the Artesia Group, the San Andres Formation, the Upper and the Lower Clear Fork Formations. The San Andres salt is most extensive within the Palo Duro Basin and can be found at 300-900 m (1,000-3,000 ft) depth. See Figure 4-8. The Seven Rivers, Unit 4 within the San Andres and the Upper Clear Fork salts offer caverns development potential where over 50 m (165 ft) thick salt layers can be found locally.

Geomechanical Analysis of Thin Bedded Salt Caverns
DE-FC26-03NT41813 36
Figure 4-8: Palo Duro schematic stratigraphic column.
Modified from Stone and Webster Engineering Corp., 1983, McGookey, Gustavson and Hoadley, 1988, McGillis and Presley, 1981
Terti
ary
-
Tria
ssic
Dewey Lake
THICK(ft)
FORMATIONLITHOLOGY
Alibates
Salado/Tansill
7 Rivers
Queens & Grayburg
150-600
Mudst in north, anhydrite in south
U P
P E
R
P E
R M
I A
N
Sandstones
100-600
0-2000
Tertiary to Triassic sediments
Undifferentiated mudstones and sandstones
500-1300
Yates
Salt thickest in NE part of basin, at 1000-3000’ depth, interbeds with dolomite, anhydrite, mudstones
Unit 5: salt 100’ thick, persistent
Unit 4: salt 175-200’ thick
Unit 3: salt 75-125’ thick
Unit 2: max. 75’ thick salt
Unit 1: no salt
Silt & very fine sands
San Andres
Mudstones
Mostly mudstones, minor anhydrite
Upper Clear Fork
Tubb
Lower Clear Fork
Red Cave
Anhydrite, dolomite and mudstones
0-250
50-80
Formed one salt sequence in the south, mudstones, anhydrite and redbeds
Silt, very fine sands, mudstones100
200-500
200-300
Salt max.200’ in south, at 1000-3000’ depth, mudstones, anhydriteRedbeds, mudstones interbedw/minor salt
Glorieta
Redbeds, mudstones in north dolomites in south, salt thick in north
Redbeds
500-600
50
150-400
LITHOLOGY FM. TOP (ft)
Cle
ar F
ork
Gp
650-2200
1000-3000
500-1500
0-1200
0-1400
550-2100
800-2700
Anhydrite
Salt/salt Dissolution
Mudstones Dolomites
Redbeds, clastics
Anhydrite
Salt/salt Dissolution
Mudstones Dolomites
Redbeds, clastics
LOW
ER
PER
MIA
N
1200-3000
2000-4000

Geomechanical Analysis of Thin Bedded Salt Caverns
DE-FC26-03NT41813 37
The oldest salt is the Lower Clear Fork which ranges from 60-150 m (200-500 ft) within most of the Palo Duro Basin (Figure 4-9). The thickest halite accumulation is at the northern border of the Basin. Individual halite beds are 2-8m (5-25 ft) thick and interbedded with anhydrite and mudstones. Salt is found below 900 m (3,000 ft) in most part of the Palo Duro Basin (Johnson and Gonzales, 1987). Salt within the Upper Clear Fork commonly can attain more than 100 m (300 ft) thickness within this Basin. Maximum 200 m (600 ft) was recorded in the west (Johnson and Gonzales, 1987). Individual salt beds are typically 2-6m (5-20 ft), and salt generally make up 30-50% of the unit (Johnson and Gonzales, 1987). This halite is typically found between 600-1,200 m (2,000-4,000 ft) depth (Figure 4-10).

Geomechanical Analysis of Thin Bedded Salt Caverns
DE-FC26-03NT41813 38
Figure 4-9: Isopach and depth to top Lower Clear Fork Formation and equivalent
Lower Cimarron Formation. From Johnson and Gonzales, 1978

Geomechanical Analysis of Thin Bedded Salt Caverns
DE-FC26-03NT41813 39
Figure 4-10: Isopach and depth to top Upper Clear Fork Formation. From Johnson and Gonzales, 1978
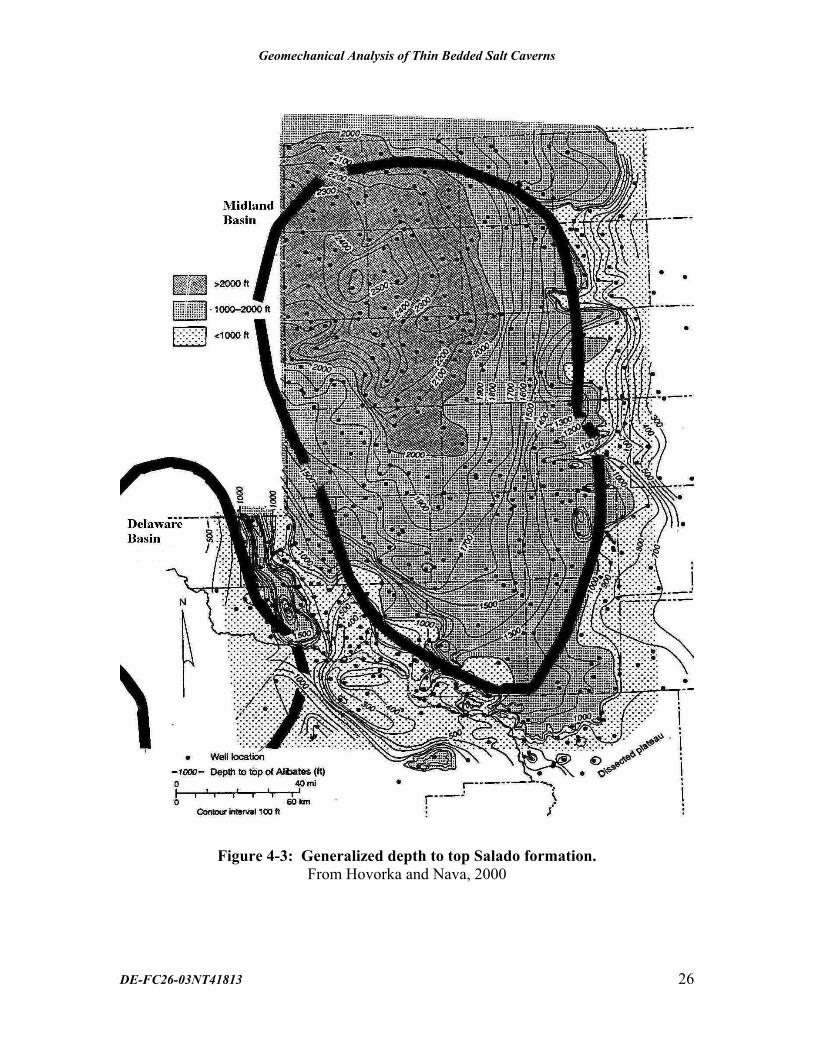
The most extensive halite formation within the Palo Duro Basin is the San Andres salt, which can be divided into the upper and lower members. The halite within the upper member San Andres Formation is widespread and is found throughout the Palo Duro Basin. The upper salt member is frequently interbedded with anhydrite, and each salt bed can vary greatly in thickness. The lower member of the San Andres Formation can be further divided into 5 units. All units have halite except for Unit 1 (Stone and Webster Engineering Corp., 1983). Salt occurs in separate 3-6m (10-20 ft) beds, but can be as massive as 15-60 m (50-200 ft) thick locally (Johnson and Gonzales, 1978). Mudstones and some anhydrite are common non-salt strata in the north but increasingly became dolomitic in the south. The entire San Andres Formation can reach 450 m (1,500 ft) thick in the western margin of the Palo Duro Basin and mostly found in 300-900 m (1,000-3,000 ft) below land surface (Johnson and Gonzales, 1987; Figure 4-11). The entire San Andres Formation is commonly 20-40% salt (Johnson and Gonzales, 1978). Salt dissolution is also recorded within the San Andres Formation along the Amarillo Wichita Uplift (McGookey, Gustavson and Hoadley, 1988).
Unit 1: has no salt instead is predominantly dolomite. Unit 2: is the thinnest halite unit. Only 20 m (75 ft) of salt can be found locally in the northwestern part of the Basin.

Geomechanical Analysis of Thin Bedded Salt Caverns
DE-FC26-03NT41813 40
Unit 3: is found in the northwestern part of the Basin, is thinner and less continuous. Unit 3 halite is about 20-40 m (75-125 ft) thick. Unit 4: is the thickest salt unit and is continuous across the central and northern part of the Basin. The 50-60 m (165-200 ft) thick halite is found over the 10-20 m (30-60 ft) thick carbonate bed. Unit 5: is the upper most unit and contains a major persistent halite bed that can be traceable throughout the central and northern part of the Basin. This salt is 30 m (100 ft) thick and is capped by shale and anhydrite of the upper San Andres Formation. This salt unit thins rapidly towards the south.
Geomechanical Analysis of Thin Bedded Salt Caverns
DE-FC26-03NT41813 41
Figure 4-11: Isopach and depth to top San Andres Formation and equivalent Blaine
and Flowerpot Strata. From Johnson and Gonzales, 1978
Salt occurs over a wider area within the Seven Rivers Formation than in the Salado-Tansill Formations. Numerous shale and anhydrite interbeds are mixed with locally massive salt section (Stone and Webster Engineering Corp., 1983). Almost all the salt in

Geomechanical Analysis of Thin Bedded Salt Caverns
DE-FC26-03NT41813 42
the Seven Rivers Formation is found between 300-600 m (1,000-2,000 ft) depth. The thickest salt, about 150 m (500 ft) is found at the southern part of the Basin. Figure 4-12 shows thickness and depth to top of Seven Rivers Formation in the Palo Duro Basin.
Figure 4-12: Isopach and depth to top of Seven Rivers formation in the Palo Duro
Basin. From: Johnson and Gonzales, 1978
As suggested by McGillis and Presley, (1981), Salado-Tansill Formation should be treated as one unit as they form a single salt sequence within the Palo Duro Basin. In the Midland and the Delaware Basins, the Salado and the Tansill/Castile Formations form an extensive evaporite unit. However in the Palo Duro Basin, the Salado and Tansill contain interbedded mudstones, siltstones, minor amount of anhydrite, and the halite grades northward into redbeds (McGillis and Presley, 1981). The halite attains a maximum 60 m (200 ft) thick. Salt dissolution has been recorded in the Salado-Tansill Formation within this Basin.
4.1.1.5 Dalhart Basin There are 2 salt bearing units within the Dalhart Basin: the Blaine and Upper Clear Fork Formations. Blaine Formation is the dominant salt unit within this Basin where up to 120 m (400 ft) thick salt has been locally found in less than 300 m (1,000 ft) depth in the northern part of the Basin. There is no thick salt in the appropriate depth for salt cavern development within this basin.

Geomechanical Analysis of Thin Bedded Salt Caverns
DE-FC26-03NT41813 43
Figure 4-13: Dalhart schematic stratigraphic column.
Modified from Stone and Webster Engineering Corp., 1983, McGookey, Gustavson and Hoadley, 1988, Johnson and Gonzales, 1987.
Terti
ary
-
Tria
ssic
Dewey Lake
THICK(ft)
FORMATIONLITHOLOGY
Alibates
Salado
7 Rivers
500-600
Queens & Grayburg
+300
100’ thick salt
U P
P E
R
P E
R M
I A
N
300-600
400-1300
Tertiary to Triassic sediments
Undifferentiated mudstones and sandstones
Tansill
200-400
Yates
Thick anhyrite and salt in the north, turn into anhydrite and dolomites
Undifferentiated mudstones, dolomites, anhydrite and some sandstones
Blaine
Glorietta Sandstone bed with mudstone interbeds
Upper Clear Fork
Tubb
Lower Clear Fork
Red Cave
Undifferentiated mudstones and anhydrite
LITHOLOGY FM. TOP
(ft)
Mudstones
Dolomites
SandstonesAnhydrite
Salt/salt dissolution
2000-2700
400-800
1200-2200
LOW
E R
P
E R
M I
A N
Mudstones
Sandstones
Dolomites

Geomechanical Analysis of Thin Bedded Salt Caverns
DE-FC26-03NT41813 44
Stone and Webster Engineering Corp. (1983) reported about 100 ft thick salt in the Dallam County within the Upper Clear Fork Formation (Figure 4-10). Upper Clear Fork contains salty shale and salt and is separated from the Lower Clear Fork Formation by a thick anhydrite bed and mudstones. Individual salt is typically 2-3m (6 to 10 ft) thick and is interbedded with shale, anhydrite and dolomite beds. Salt layers generally make up 30-50% of the entire unit in most of the Dalhart Basin (Johnson and Gonzales, 1978). Upper Clear Fork salt can be found typically below 650 m (2,100 ft) depth (Terralog, Dec. 30, 2001). The dominant salt unit is the Blaine Formation, which is equivalent to the San Andres Formation in the Midland and the Palo Duro Basins (see Table 4-1). In the Dalhart Basin, 30-60 m (100-200 ft) salt grades to anhydrite and dolomite to the south (McGookey, Gustavson and Hoadley, 1988). Maximum 120 m (400 ft) of halite in found in northern Dalhart Basin (Johnson and Gonzales, 1978, Figure 4-11.) Typically, salt makes up 40-70% of the total formation thickness and can be found in less than 300 m (1,000 ft) depth (Johnson and Gonzales, 1978), too shallow for cavern development. Salt dissolution within the Blaine Formation is also reported toward the Cimarron Arch to the east (McGookey, Gustavson and Hoadley, 1988
4.1.1.6 Anadarko Basin Twenty-four sonar surveys from two operators were obtained from the Texas Railroad Commission. (See Table 4-3.) The main halite unit is the Lower Cimarron Salt Formation where all the operating salt caverns are found. Other salt bearing units are the Flower Pot Formation and the Hutchison Salt. In the northeastern part of the basin, Hutchison Formation offers potential for additional salt cavern development.

Geomechanical Analysis of Thin Bedded Salt Caverns
DE-FC26-03NT41813 45
Figure 4-14: Anadarko Basin schematic stratigraphic column.
Modified from Johnson and Gonzales, 1978, Terralog, Dec. 30, 2001, Gustavson, Finley, and McGillis, 1980.
Terti
ary
-
Tria
ssic
Quartermaster
THICK(ft)
FORMATIONLITHOLOGY
Alibates
Cloud Chief
Flower Pot
Glorieta
U P
P E
R
P E
R M
I A
N
Anhydrite
Salt
Mudstones
Carbonates
Sandstones
250-600
0-900
Tertiary to Triassic sediments
Undifferentiated mudstones and sandstones
Whitehorse
Blaine
Upper Cimarron
Top sand bed, mudstones thickest in the west
0-100Found only in localized norhernpart of the basin
Predominantly mudstones
100-200 Anhydrite with mudstones
Localized salt, pinch out towards Amarillo Uplift and Cimarron Arch. Salt dissolution.
Salty mudstones and anhydrite, thickest in SE part of the basin.
300-500
50-400
Cimarron Anhydrite350+ Mudstones and anhydrites
LITHOLOGY FM. TOP
(ft)
Lower Cimarron
Hennessey Predominantly mudstones
Cle
ar F
ork
Gp
5-25ft salt beds w/mudstones
Wellington
Hutchison Salt Mbr
5-25ft salt beds found in northeast part only, interbed w/ mudstones and anhydrites
180-600
0-500
400-900
300-800
700-1100
800-1300
LOW
ER P
ERM
IAN

Geomechanical Analysis of Thin Bedded Salt Caverns
DE-FC26-03NT41813 46
Hutchison Salt is the oldest salt unit in the Permian Basin Complex. It is restricted to the Kansas, Oklahoma and the northeast corner of the Anadarko Basin (Johnson and Gonzales, 1978), see Figure 4-15. Hutchison Salt Member belongs to the Wellington Formation and is typically 60-80 m (200-250 ft) thick. Hutchison Salt unit consists of interbedded salt, anhydrite and shale. Typically halite beds are 2-8 m (5-25 ft) thick. Halite represents about 40-50% of the formation and can be 95-97 % pure in central Kansas (Johnson and Gonzales, 1978). The top of Hutchison Salt can be reached at about 100 m (300 ft) depth in central Kansas area to approximately 1,200 m (4,000 ft) depth in the northeastern Anadarko Basin (Johnson and Gonzales, 1978). At least 3 underground mines and 25 solution mining sites have exploited the Hutchison Salt over the last century at the central Kansas where the salt is only 300-400 ft deep (Terralog, Dec. 30, 2001). Within the Anadarko Basin, Hutchison salt is about 300 ft thick (Figure 4-15), found only in the northeast.

Geomechanical Analysis of Thin Bedded Salt Caverns
DE-FC26-03NT41813 47
Figure 4-15: Isopach and depth to top Hutchison Member in Anadarko Basin. From: Johnson and Gonzales, 1978.
Lower Cimarron Formation is equivalent to the Lower Clear Fork Formation where the section is predominantly interbedded salt, shale and anhydrite. This is the main halite unit within the Anadarko Basin. Thirty to ninety meters (100-300 ft) thick halite

Geomechanical Analysis of Thin Bedded Salt Caverns
DE-FC26-03NT41813 48
normally make up about 30-70% of the unit (Johnson and Gonzales, 1978) and can be found at 600 m (2,000 ft) depth. Figure 4-9 shows Lower Cimarron Formation salt thickness and depth to top of salt bearing strata. There are two operators operating 24 salt cavern wells here within the Anadarko Basin at 425-550 m (1,400 ft to 1,800 ft) depth. Flower Pot Formation is a localized salt bed found only in the eastern part of the Anadarko Basin (Figure 4-11). This formation is the lateral equivalent of the San Andres Formation in Palo Duro Basin and the Blaine Formation in Dalhart Basin. The depth to the top of the salt is less than 300 m (1,000 ft) deep (Johnson and Gonzales, 1978), too shallow for cavern development. Approximately 15-120 m (50-400 ft) of halite can be found locally. This formation has salt dissolution.
4.1.1.6.1 Anadarko Basin Cavern Sonar Review
There are two operators operating 24 salt cavern wells within the Anadarko Basin. The data is presented in Table 4-3. All the caverns are found within the Lower Cimarron Formation. The average cavern in the Anadarko Basin has a height of 11 m (39 ft) and diameter of 48 m (158 ft). The cavern is primarily cylindrical in shape with an average capacity of 160,595 barrels, see Figure 4-16. The minimum height of the cavern is as small as 3m or 9ft, while the maximum is recorded at 33 m (110 ft). The minimum cavern diameter is 5 m (15 ft) while the maximum is at 82 m (270 ft) wide. All 24 salt caverns are located on the southwestern part of the Basin between 425-550 m (1,400 ft to 1,800 ft) depth, see Figure 4-9.

Geomechanical Analysis of Thin Bedded Salt Caverns
DE-FC26-03NT41813 49
Table 4-3: Anadarko Basin active underground hydrocarbon storage data.
CompanyCavern
No.Product Stored
Main Roof
Bottom Depth (ft)
Ave. Height (ft)
Ave. Diameter
Cavern Volumn
Ht/W Ratio Shape
Phillips Petroleum Co. 3 n/a 1438 1482 44 230 209,056 0.1913 cylinderPhillips Petroleum Co. 4 n/a 1472 1528 56 266 455,591 0.2105 cylinderPhillips Petroleum Co. 5 n/a 1331 1376 45 209 266,973 0.2153 cylinderPhillips Petroleum Co. 6 n/a 1426 1446 20 295 243,337 0.0678 cylinderPhillips Petroleum Co. 7 n/a 1415 1483 68 225 436,130 0.3022 cylinderPhillips Petroleum Co. 8 n/a 1450 1474 24 270 244,609 0.0889 cylinderPhillips Petroleum Co. 9 n/a 1447 1467 20 241 167,785 0.0830 cylinderPhillips Petroleum Co. 10 n/a 1450 1500 50 259 457,566 0.1931 cylinderPhillips Petroleum Co. 11 n/a 1472 1500 28 320 400,859 0.0875 upside down conePhillips Petroleum Co. 12a n/a 1456 1501 45 72 32,615 0.6250 cylinder
12b n/a 1501 1536 35 205 205,641 0.1707 cylinderPhillips Petroleum Co. 13 n/a 1490 1540 50 200 279,617 0.2500Phillips Petroleum Co. 14 n/a 1475 1525 50 180 226,490 0.2778 cylinderPhillips Petroleum Co. 21 n/a 1426 1536 110 94 135,888 1.1702 stack pancakesPhillips Petroleum Co. 22 n/a 1460 1510 50 130 118,138 0.3846 upside down conePhillips Petroleum Co. 23 n/a 1457 1520 63 115 116,485 0.5478 cylinderPhillips Petroleum Co. 24 n/a 1431 1461 30 200 167,770 0.1500 cylinder
Diamond Koch 1a propane 1737 1752 15 130 35,441 0.1154 cylinder1b propane 1755 1775 20 29 2,352 0.6897 upside down cone
Diamond Koch 2a n-butane 1690 1745 55 81 50,451 0.6790 stack pancakes2b n-butane 1776 1785 9 15 283 0.6000 upside down cone
Diamond Koch 3 n-butane 1723 1754 31 119 61,375 0.2605 stack pancakesDiamond Koch 4 n-butane 1700 1768 68 63 37,733 1.0794 upside down coneDiamond Koch 5 n-butane 1709 1734 25 82 23,502 0.3049 cylinderDiamond Koch 6a n-butane 1704 1737 33 82 31,022 0.4024 cylinder
6b n-butane 1752 1768 16 36 2,899 0.4444 upside down coneDiamond Koch 7 n-butane 1739 1774 35 101 49,917 0.3465 upside down coneDiamond Koch 9 iso-butane 1756 1766 10 163 37,146 0.0613 cylinder
Average 39 158 160595
Small letter in Cavern No. column denotes separate cavern within the same well.

Geomechanical Analysis of Thin Bedded Salt Caverns
DE-FC26-03NT41813 50
Figure 4-16: Typical cavern configurations in the Anadarko Basin.
Diamond Shamrock #6 well.
Cylinder
Upside down cone
Cylinder
Upside down cone
Geomechanical Analysis of Thin Bedded Salt Caverns
DE-FC26-03NT41813 51
4.1.1.7 Salt Dissolution in Permian Basin Complex Salt dissolution and subsequent collapse of overlying strata is common in the Permian Basin Complex. Terralog recommends a minimum depth of 300 m (1,000 ft) for cavern development, depending on local geology and salt dissolution depth. Most of the dissolution occurs within 400 m (1,300 ft) of the surface (McGookey, Gustavson and Hoadley, 1988). Salt is very soluble, however, anhydrite and gypsum dissolution do not cause major structural adjustments and collapse features according to Gustavson, Finley and McGillis (1980). All the salt bearing formations within the Permian Basin Complex have been affected locally by salt dissolution. The Hutchison Salt is undergoing dissolution locally along the eastern border in Kansas while the Lower Cimarron salt is being dissolved along the Kansas – Oklahoma line (Johnson and Gonzales, 1978). In the Palo Duro Basin, Flowerpot/Blaine Formation has been dissolved extensively along the Amarillo-Wichita Uplift and northward to the Oklahoma Panhandle and western Kansas. Both the Artesia Group and the Salado salts within the Palo Duro Basin are presently being dissolved (Johnson and Gonzales, 1978). At Wink Sink on the eastern part of the Delaware Basin, a sinkhole with a maximum width of 110 m (360 ft) and maximum depth of 33 m (110 ft) was created in June 1980. This cavity was developed because of salt dissolution in the Salado Formation, and the solution cavity migrated upward by successive roof failures until it finally breached the land surface (Johnson, 1986).
4.1.1.8 Results and Discussion for the Permian Basin Complex Each Basin within the Permian Basin Complex contains at least one thick halite bed over 50 m (165 ft) thick, the minimum thickness for stable cavern configuration. However, in the Dalhart Basin, the Blaine salt layer is located in less than 300 m (1,000 ft) from the surface, where salt dissolution may impair the cavern’s integrity. Active cavern operations are found in the Midland and Anadarko Basins only. Complex faulting created platforms and arches which divided the Permian Basin Complex into the five separate Basins: Anadarko, Palo Duro, Dalhart, Midland and Delaware Basins (Figure 4-1). Salt dissolution and subsequent collapse of overlying strata is common in the Permian Basin Complex. Most of the dissolution occurs within 400 m (1,300 ft) of the surface (McGookey, Gustavson and Hoadley, 1988). All the salt bearing formations within the Permian Basin Complex have been affected locally by salt dissolution. The Midland Basin has the most salt cavern operations. Thirteen operators are actively operating approximately 100 wells within the Midland Basin. Salado is the dominant salt bearing unit where all the active caverns are found. The thickest Salado salt can be found in the southwestern part of the Basin in less than 600 m (2,000 ft) depth. The Queen Formation offers another potential salt unit for cavern siting locally. However, it is

Geomechanical Analysis of Thin Bedded Salt Caverns
DE-FC26-03NT41813 52
below the Salado Formation. The cost for developing the lower salt layer has to be considered when the shallow Salado salts are available. The Salado salt is also the dominant halite unit within the Delaware Basin. Unit 5 is over 50 m (165 ft), but is found on the east side in less than 300 m (1,000 ft) depth. The Salado in Delaware Basin is too shallow for salt cavern siting. Thick salt unit may be found locally within the Castile Formation especially in the northern part of the Basin that can be used for cavern development. The San Andres Formation is the dominant salt within the Palo Duro Basin. Halite in Unit 4 is over 50 m (165 ft) thick and is found on the southwest side of the Basin. The top of the salt can be reached between 600-900 m (2,000-3,000 ft) from the surface. Upper Clear Fork salt can reach 120 m (400 ft) locally which may offers another possible cavern siting on the eastern part of the Basin. This Basin offers potential for salt cavern development. Within the Dalhart Basin, Blaine Formation is the dominant salt unit. The Blaine Formation is equivalent to the San Andres Formation in the Midland. Maximum 120 m (400 ft) of halite is found in northern Dalhart Basin (Johnson and Gonzales, 1987) in less than 300 m (1,000 ft) depth. This formation is too shallow for cavern siting. The Upper Clear Fork salt unit is not thick enough for cavern siting. Salt caverns operations are also found in the Anadarko Basin. Two operators are actively operating over 25 wells between 425-550 m (1,400 ft to 1,800 ft) depth. The caverns are found in the main halite unit, the Lower Cimarron Salt Formation. Thirty to ninety meters (100-300 ft) thick halite can be found in the southern and eastern portion of the Basin. Other potential salt unit for cavern siting is the Hutchison Member which is found only in the northeast portion of the Anadarko Basin, where locally thick salt may be found in less than 900 m (3000 ft).

Geomechanical Analysis of Thin Bedded Salt Caverns
DE-FC26-03NT41813 53
4.1.2 Michigan and Appalachian Basins The Michigan and the Appalachian Basins are closely linked in terms of sediments and lithology. Throughout the geologic history, northeast-southwest trending Findlay and Algonquin Arches separated the Michigan Basin from the Appalachian Basin. Many of the sedimentary units can be correlated between the two Basins. Michigan Basin lies in a tectonically stable interior of the North American craton. Michigan Basin is bounded on the north and northeast by the Canadian Shield, on the east and southeast by the Algonquin Arch in Ontario and the Findlay Arch in northern Ohio, on the southwest by the Kankakee Arch and on the west and northwest by the Wisconsin Arch and Wisconsin Dome. The Appalachian Basin is bounded on the west by the Findlay and Algonquin Arches, the Adirondack uplift on the north, and the Appalachian Mountains on the southeast. Figure 4-17 is the structural elements for the Michigan and Appalachian Basins.

Geomechanical Analysis of Thin Bedded Salt Caverns
DE-FC26-03NT41813 54
Figure 4-17: Michigan and Appalachian Basins structural elements.
From: Johnson and Gonzales, 1978.
4.1.2.1 Geologic Setting Throughout the Paleozoic, the Michigan Basin continued to subside faster than the Appalachian Basin and the surrounding regions. The Findlay and the Algonquin Arches separated Michigan Basin from the Appalachian Basin (Johnson and Gonzales, 1978). A shallow sea spread over the Great Lakes region as Paleozoic Era began. The sea transgressed and regressed depositing thick clastic and carbonate rocks. During the middle Silurian the Kankakee Arch developed across northeastern Illinois, separating the Michigan Basin from the Illinois Basin. The emergence of the Kankakee Arch greatly restricted the seawater circulation within the Michigan Basin (Michigan State University), in addition the development of the Middle Silurian age reefs may also had restricted the marine water within the Appalachian Basin, except on the southeast side in Ohio (Johnson and Gonzales, 1978). These restrictions lead to evaporation of the sea water and the deposition of halite within the Michigan and Appalachian Basins. The Appalachian Orogeny in Pennsylvanian and Permian time uplifted the land. The eastern area of the Appalachian Basin was intensely folded and faulted. This deformation became less intense towards the west (Johnson and Gonzales, 1978). In Pleistocene time, four episodes of glaciations covered the Michigan and Appalachian Basins with about 100 m (300 ft) of glacial drift.

Geomechanical Analysis of Thin Bedded Salt Caverns
DE-FC26-03NT41813 55
Over 600 m (2,000 ft) of Late Silurian Salina salt was found at the Michigan Basin center, while over 150 m (500 ft) was found in northeastern Appalachian Basin (Terralog, Dec. 30, 2001). Another halite sequence, the Early Devonian Detroit River salt was deposited in a later marine transgression but only to the more restricted northern Michigan Basin. The Michigan salt was deposited in deep water (>50 m or 300 ft), non-turbulent depositional environment, while the Appalachian salt was deposited in a shallow, near the sediment source and in less than 30 m (100 ft) of turbulent water (Terralog. Dec. 30, 2001). The Michigan Basin has been tectonically stable since the beginning of the Paleozoic. The sediments are flat lying (¼º to ½º) with minor folds or faults (Johnson and Gonzales, 1978). All strata dip gently into the Basin center. Approximately 4,300 m (14,000 ft) of sediments were found at the Basin center (Terralog, Dec.30, 2001). The north and northwestern Appalachian Basin also has flat lying strata that dips less than 1° to the southeast, indicating no faults or major folds. The Basin thickens to the southeast. A maximum 2,000-7,000 m (6,500-23,000 ft) of sandstones, limestones, shales and salt were found (Johnson and Gonzales, 1978). In the central and southeast, the effect of the Appalachian Orogeny had created folded, faulted structures and tectonically thickened salt accumulations (Terralog, Dec. 30, 2001). The area is tectonically stable after the Appalachian Orogeny.
4.1.2.2 Michigan Basin There are 6 operators operating approximately 30 caverns within the Michigan Basin. All the cavern wells are located within the Salina Formation on the southern rim of the Basin. There are two salt bearing units within the Michigan Basin. They are the Salina and the Detroit River Groups. The major period of subsidence in the Michigan Basin took place in Late Silurian, which accounts for the thick deposition of the Salina salt (Johnson and Gonzales, 1978). Marine regression in Late Silurian and the development of the Kankakee Arch across northeastern Illinois restricted the seawater circulation. Bedded salt was deposited as the seawater evaporated. Intermittent marine transgression allowed for over 600 m (2.000 ft) of salt deposition. Silurian Salt was deposited in deep >50 m or 300 ft water and in a non-turbulent depositional environment. The salt beds grade laterally into anhydrite beds on the shallow flanks. There is no salt outcrop due to salt dissolution (Terralog, Dec. 30, 2001). Figure 4-18 is the schematic stratigraphic column for the Michigan Basin. Northwest trending anticlines with salt filled cores were developed within Salina and younger rocks in the central part of the Michigan Basin. These structures are a result of strata draping over masses of Salina salt that was not affected by salt dissolution (Johnson and Gonzales, 1978).

Geomechanical Analysis of Thin Bedded Salt Caverns
DE-FC26-03NT41813 56
Figure 4-18: Michigan Basin schematic stratigraphic column.
Modified from Johnson and Gonzales, (1978) and Michigan well files
LITHOLOGY THICK(ft)
FORMATION/GROUP
LITHOLOGY FM.TOP (ft)
Qua
t.M
issi
ssip
pian
-Ju
rass
icD
EVO
NIA
NSI
LUR
IAN
Glacial drift
Undifferentiated shales, sandstones and limestones
Antrim Dark brown shales
Glacial drift, mud, sand and gravel
Traverse Gray limestones with gray shales on top
Dundee/Rogers City Dolomitic limestones
Detroit River Dolomite and anhydrite. Salt in the north
Bois Blanc Dolomite
Bass Islands Dolomite
Salina
Niagaran
Over 3,000ft of salt found at basin center. Can be divided into 7 units.
G: shale
F: 5-20’ salt beds, max. 100’ thick
C,D & E: dirty salt, 5-60’ salt beds
B: shale and dolomite interbeds, max. salt 300-500’ thick
A: clean thick salt, 75% pure and 180-500’ thick
Carbonate reef
60-90060-300
300-2,000
200-3,000
200-600
2,000-3,000
250-800
100-400400-1,500
80-800
100-650
2,000-4,000
3,000-8,000
Salt
Anhydrite
Dolomites
Limestones
Shales
Sandstones

Geomechanical Analysis of Thin Bedded Salt Caverns
DE-FC26-03NT41813 57
The major halite in Michigan Basin is in the late Silurian Salina salt. Salina Group can be divided into 7 units. The lithology has been summarized from Johnson and Gonzales, (1978). Over 900 m (3,000 ft) maximum thickness has been measured at the Basin center. All units are thickest at the Basin center and grades into anhydrites and shales at the Basin’s margin. The Salina salt can be reached between 900 m (3,000 ft) at the Basin margin, and approximately 2,500 m (8,200 ft) depth towards the Basin’s center. Figure 4-19 is Isopach and Depth to Top Salina salt in the Michigan Basin.
Salt A is the oldest unit and it rests unconformably over the Niagaran carbonates. The unit can be subdivided into A-1 and A-2 separated by a carbonate section. Over 60-150 m (180-500 ft) of clean A-1 salt can be found in the Basin interior. The A-2 salt is the thickest massive salt unit found in most parts of the Michigan Basin (Johnson and Gonzales, 1978). Approximately 100-150 m (300-500 ft) of salt has been measured. Generally A1 salt is over 50 m (150 ft) thick and is at least 75% pure (Terralog, Dec. 30, 2001). Salt B is thick and clean in the lower part, but has interbedded shales and dolomites in the upper part. Over 100-150 m (300-500 ft) of salt can be found (Johnson and Gonzales, 1978). Salts C, D and E salt units are dirty salt, mainly shales with 20-25% dolomites. Individual salt beds ranges from 2-30 m (5-60 ft) thick. Salt F is the youngest salt unit within the Salina Group. It consists of alternating clean and impure salt beds interbedded with shale, dolomite and anhydrite. The F salt is thickest at the Basin center where 300 m (1,000 ft) have been measured. Most salt beds are 2-6 m (5-20 ft) thick, but can reach 30 m (100 ft) thick (Johnson and Gonzales, 1978). Salt G is predominately a shale unit.
The Detroit River Group contains the youngest salt found within the Michigan-Appalachian Basins. Salt beds are typically 5-25 m (15-80 ft) thick and have anhydrite, limestone and dolomite interbeds. The Detroit River Group can reach 30-150 m (100-500 ft) in aggregate thickness in the northern part of the Michigan Basin, and can be found 600-900 m (2,000-3,000 ft) below the surface.
4.1.2.2.1 Michigan Basin Cavern Sonar Review
There are 6 operators operating approximately 30 caverns within the Michigan Basin. All the cavern wells are located within the Salina Formation on the southern rim of the Basin. The data is included in Table 4-4. The average cavern in the Michigan Basin has a height of 32 m (105 ft) and diameter of 40 m (134 ft). Terralog recommends a 30 m (100 ft) cavern height in 50 m (165 ft) thick salt layer as the most stable cavern

Geomechanical Analysis of Thin Bedded Salt Caverns
DE-FC26-03NT41813 58
configuration. The cavern shape varies from narrow cylindrical to stack pancakes to upside down cone shapes. For typical cavern shapes see Figure 4-20. The average capacity of the cavern is 304,694 barrels. The cavern ranges from a minimum height of 6 m (20 ft) to a maximum height of 60 m (198 ft), while the diameter ranges from 12 m (40 ft) to 62 m (204 ft). The shallowest caverns are located between 330 to 500 m (1,100 to 1,650 ft) depth in Wayne County in the southeast, while the caverns are located between 600 to 730 m (2,000 to 2400 ft) in St Clair County further east and between 1,100 to 1,200 m (3,600 to 3,900 ft) in Kent County to west. (See Figure 4-19).

Geomechanical Analysis of Thin Bedded Salt Caverns
DE-FC26-03NT41813 59
Table 4-4: Michigan Basin active underground hydrocarbon storage data.
CompanyCavern
No.Product Stored
Main Roof
Bottom Depth (ft)
Ave. Height (ft)
Ave. Diameter
Cavern Volumn
Ht/W Ratio Shape
Ohio Northwest Inc LPG#2 n/a 3695 3905 210 100 293598 2.1000 cylinderOhio Northwest Inc LPG#5 n/a 3755 3840 85 105 131018 0.8095 cylinderOhio Northwest Inc Fee #6 n/a 3764 3942 178 116 334865 1.5345 cylinderConsumers Power Co 2-CC/7005 NGL 1990 2158 168 98 225577 1.7143 stack pancakesConsumers Power Co 3-CC/7006 NGL 1988 2186 198 120 398622 1.6500 stack upside down conesConsumers Power Co 1-C5/7007 NGL 1986 2142 156 192 804008 0.8125 stack upside down conesConsumers Power Co 2-C5/7008 NGL 2007 2146 139 204 808740 0.6814 cylinderConsumers Power Co 1-C4/7009 NGL 1986 2100 114 196 612281 0.5816 cylinderConsumers Power Co 2-C4/7010 NGL 1985 2134 149 182 690021 0.8187 stack upside down conesConsumers Power Co 1-C3/7011 propane 1984 2134 150 180 679469 0.8333 cylinderConsumers Power Co 2-C3/7012 propane 1982 2130 148 196 794891 0.7551 cylinderAmoco Oil Co. A-1 propane 2345 2435 90 145 264553 0.6207 upside down coneAmoco Oil Co. A-3 propane 2332 2426 94 148 287862 0.6351 cylinderAmoco Oil Co. A-5 iso-butane 2348 2448 100 155 335890 0.6452 upside down coneAmoco Oil Co. A-6 iso-butane 2345 2440 95 160 340014 0.5938 upside down coneAmoco Oil Co. A-8 propane 2332 2430 98 140 268544 0.7000 upside down coneAmoco Oil Co. A-9 propane 2348 2416 68 195 361503 0.3487 stack pancakesAmoco Oil Co. A-10 propane 2346 2422 76 156 258581 0.4872 upside down coneSun Pipeine Co. 1 n/a 1188 1242 54 116 101588 0.4655 cylinderSun Pipeine Co. 2 n/a 1196 1264 68 98 91305 0.6939 stack pancakesSun Pipeine Co. 3 n/a 1180 1242 62 114 112651 0.5439 stack pancakesSun Pipeine Co. 4 n/a 1570 1668 98 98 131587 1.0000 stack pancakesSun Pipeine Co. 5 n/a 1602 1678 76 98 102047 0.7755 upside down coneSun Pipeine Co. 6a n/a 1170 1190 20 135 50960 0.1481 stack pancakes
6b n/a 1201 1248 47 160 168218 0.2938 upside down coneSun Pipeine Co. 7 n/a 1565 1645 80 110 135335 0.7273 stack pancakesSun Pipeine Co. 9a n/a 1498 1578 80 40 17895 2.0000 cylinder
9b n/a 1580 1656 76 70 52065 1.0857 stack pancakesAverage 106.32 136.68 316203
Small letter in Cavern No. column denotes separate cavern within the same well.

Geomechanical Analysis of Thin Bedded Salt Caverns
DE-FC26-03NT41813 60
Figure 4-19: Isopach and depth to top Salina Salt in Michigan Basin. From Johnson and Gonzales, 1978.

Geomechanical Analysis of Thin Bedded Salt Caverns
DE-FC26-03NT41813 61
Figure 4-20: Typical cavern configuration in Michigan Basin.
Amoco A-6 well
Upside down cone
Sun Pipeline #6 well
Stack pancakes
Upside down cone
Amoco A-6 well
Upside down cone
Sun Pipeline #6 well
Stack pancakes
Upside down cone

Geomechanical Analysis of Thin Bedded Salt Caverns
DE-FC26-03NT41813 62
4.1.2.3 Appalachian Basin Gas storage cavern operations are found in New York and Ohio States. There are three operators operating in the New York State portion of the Appalachian Basin. Terralog has acquired the sonar surveys from the two operators. The last operator will not release the information to Terralog and is not included in Table 4-5. In Ohio, 30 wells drilled by three operators have been permitted since 1960, but only 2 Marathon Ashland Oil wells (one cavern) are currently in operation while all others were plugged (Tomastik, 1997, Ohio Department of Natural Resources, 2001). Sonar survey is not required by Ohio Division of Mineral Resources Management. The only surveys were performed in the 1960’s during the initial operation of the caverns (personal communication with Tom Tomastik, Jan. 2004). The Appalachian Basin is an elongated northeast-southwest Basin. On the northwestern flanks, the sediments are largely undeformed. This area is referred to as the Appalachian Basin Platform (Terralog, Dec. 30, 2002). In the central and southeast, the effect of the Appalachian Orogeny compression had created folded, faulted structures and tectonically thickened salt accumulations (Terralog, Dec. 30, 2001). These salt anticlinal accumulations extend northward into south central New York where the Salina salt is less than 900 m (3,000 ft) below surface. The area is tectonically stable after the Appalachian Orogeny. The Basin thickens to the southeast. A maximum 2,000-7,000 m (6,500-23,000 ft) of sandstones, limestones, shales and salt were found (Johnson and Gonzales, 1978). Salt were deposited in a shallow, less than 30 m (100 ft) of turbulent water near the sediment source from the southeast (Terralog. Dec. 30, 2001). The Appalachian Basin therefore received more clastic load than the Michigan Basin. Appalachian salt was connected to the Michigan salt through the Chatham Sag, a low between the Findlay and Algonquin Arches.

Geomechanical Analysis of Thin Bedded Salt Caverns
DE-FC26-03NT41813 63
Figure 4-21: Appalachian Basin schematic stratigraphic column.
Modified from Johnson and Gonzales, 1978, Lytle, 1963, Smosna and Patchen, 1978, Tomastik, 1997.
1,000-3,000
LITHOLOGY THICK(ft)
FORMATION/GROUP
LITHOLOGY FM.TOP (ft)
Qua
t.D
EVO
NIA
N T
O P
ERM
IAN
SILU
RIA
N
Glacial drift
Undifferentiated shales, sandstones and limestones. Major bituminous coal deposits during Pennsylvanian time. Locally can contain oil and gas accumulation
Glacial drift, mud, sand and gravel
Bass Islands/ Keyser Dolomitic limestones and basal shales
Salina/
Tonoloway
Niagaran/Lock-port/McKenzie
500’ salt found at basin center, 100-200’ at margin. Can be divided into 7 units.
G: shale
F: major salt unit, 50-200’ typical salt bed thickness, max. 500’ thick at NE part of basin
C,D & E: thin salt beds stringers, shale, dolomite
B: shale and dolomite interbeds, salt 50-150’ thick
A: dolomite, anhydrite, shale with minor salt
Carbonates
0-3000-200
1,000-12,500
500-2,500
20-450
Salt
Anhydrite
Dolomites
Limestones
Shales Sandstones
200-300

Geomechanical Analysis of Thin Bedded Salt Caverns
DE-FC26-03NT41813 64
Salina Group is the only salt bearing unit in the Appalachian Basin. The Salina can be divided into 7 units. The thickest salt is in the northeastern part of the Basin where more than 150 m (500 ft) of halite have been recorded. Salina Group is 150-500 m (500-1,600 ft) thick, and can reach 750 m (2,500 ft) thick in the southeast. The top of salt can be reached between 300-900 m (1,000-3,000 ft) in the northeastern Basin margin. (See Figure 4-19). Halite is restricted to the A, B, D, E and F units.
Unit A is the lowermost unit and is composed of mainly dolomites, bedded anhydrites, and shales. Janssens and Grubaugh reported the first discovery of halite in Unit A outside of the Michigan Basin in 1996 (Tomastik, 1997). Halite was discovered in the Cuyahoga, Lorain and Medina Counties in Ohio while Janssens and Grubaugh were investigating the northern end of the Cambridge Arch. Maximum 4 m (14 ft) thick of salt was measured (Tomastik, 1997). Unit B rests unconformably over Unit A. Unit B is interbedded salt, shales, dolomites and anhydrites. This unit has the thickest and purest salt within the Salina Formation. Typically salt is 15-50 m (50-165 ft) thick, and is limited to the shallow part of the Basin in western New York to northeast Ohio. Unit B can be found between 600-750 m (2,000-2,500 ft) depth in Ohio (Johnson and Gonzales, 1978).
Unit C is predominantly gray to green anhydritic and dolomitic shales (Tomastik, 1996). Unit D contains 2 or more thins salt beds interbedded with shales. Unit D ranges from 10-40 m (30-130 ft) thick. Salt is locally thick in south central New York (Johnson and Gonzales, 1978). Unit E is characterized by shales and dolomites but locally contains 1 or 2 thin salt bed. Unit E is 15-60 m (50-200 ft) thick (Johnson and Gonzales, 1978). Unit F is the major salt bearing unit within the Appalachian Basin where series of pure and impure salt alternated with shales, dolomites and anhydrites. Unit F is the youngest salt unit and total thickness ranges from 60 m (200 ft) near the Basin margin to 300 m (1,000 ft) in the deepest part of the Basin (Johnson and Gonzales, 1978). Individual salt bed is commonly 3-25 m (10-80 ft) thick and can get an aggregate thickness of 30-60 m or 100-200 ft (Johnson and Gonzales, 1978). Unit F can be further divided into 4 salt beds, F1 to F4 in Ohio (Tomastik, 1996). In south central New York, typical salt beds are 20-50 m (60-165 ft) thick, and 150 m (500 ft) aggregate salt thickness can be attained throughout a large area. The top of salt in both Ohio and New York can be reached between 600-1,200 m (2,000-4,000 ft) depth (Tomastik, 1996).
Unit G is predominately shales and some anhydrite (Tomastik, 1997).

Geomechanical Analysis of Thin Bedded Salt Caverns
DE-FC26-03NT41813 65
Figure 4-22: Isopach and depth to Top Salina Salt in Appalachian Basin. From Johnson and Gonzales, 1978.
4.1.2.3.1 Appalachian Basin Cavern Sonar Review
Gas storage cavern operations are found in New York and Ohio States. One application was submitted to Pennsylvania Department of Environmental Protection, but the operation has not proceeded beyond permitting stage due to legal tangles between the operator and the owners. There are three operators operating in the New York portion of the Appalachian Basin. Terralog has acquired the sonar surveys from the two operators. The last operator will not release the information to Terralog and is not included in Table 4-5. In Ohio, 30 wells by three operators have been permitted since 1960, but only 11 wells have actually been used. Only 2 Marathon Ashland Oil wells (one cavern) are currently in operation while all others were plugged (Tomastik, 1997, Ohio Department of Natural Resources, 2001). Sonar survey is not required by Ohio Division of Mineral Resources Management. The only surveys were performed in the 1960’s during the initial operation of the caverns (personal communication with Tom Tomastik, Jan. 2004). The average cavern in the Appalachian Basin has a height of 80 m (261 ft) and diameter of 24 m (80 ft). The height of the cavern ranges from 7 to 157 m (23 to 515 ft), while the diameter ranges from 2 to 79 m (7 to 260 ft). The cavern shape is mostly cylindrical. See Figure 4-23 for typical cavern configurations. The average calculated capacity of the

Geomechanical Analysis of Thin Bedded Salt Caverns
DE-FC26-03NT41813 66
cavern is 147,885 barrels. The actual cavern capacity provided by the operator is 146,611 barrels. The difference is less than 1% which validates our calculation for this project.
Table 4-5: Appalachian Basin active underground hydrocarbon storage data.
CompanyCavern
No.Product Stored
Main Roof
Depth (ft)Bottom
Depth (ft)Ave.
Height (ft)
Ave. Diameter
(ft)
Calculated Cavern Volumn (bbls.)
Volume from
reports (bbls)
Ht/W Ratio Shape
NY LP Gas Storage Harford#1 LPG 3025 3100 75 200 419,426 362,628 0.3750 bellNY LP Gas Storage Hartford#2 LPG 2927 2950 23 180 104,185 57430 0.1278 stack pancakesNY LP Gas Storage Hartford#3 LPG 3030 3198 168 100 234,878 236158 1.6800 diamond
Bath Petroleum Storage Inc 1 LPG 2976 3153 177 96 228,060 228381 1.8438 cylindricalBath Petroleum Storage Inc 2 LPG 2922 3078 156 126 346,258 157714 1.2381Bath Petroleum Storage Inc 3 LPG 2969 3084 115 108 187,534 186214 1.0648Bath Petroleum Storage Inc 4 LPG 2949 3030 81 100 113,245 146405 0.8100 cylindricalBath Petroleum Storage Inc 5 LPG 2929 3175 246 64 140,873 166286 3.8438 cylindricalBath Petroleum Storage Inc 6 LPG 2961 3165 204 63 113,200 201286 3.2381 cylindricalBath Petroleum Storage Inc 7 LPG 2950 3200 250 63 138,725 261452 3.9683 cylindricalBath Petroleum Storage Inc 9 LPG 3000 3515 515 34 83,234 86548 15.1471Bath Petroleum Storage Inc 10 LPG 3004 3512 508 20 28,409 28310 25.4000Bath Petroleum Storage Inc 11 LPG 3109 3492 383 7 2,624 2429 54.7143Bath Petroleum Storage Inc 12 LPG 3009 3524 515 8 4,608 4810 64.3750Bath Petroleum Storage Inc 13 LPG 2964 3474 510 32 73,014 73119 15.9375
Ohio Fuel Gas Co 2352Standard Oil Co. Ohio 2001 80000Marathon-Ashland Ohio GS-1 3630Marathon-Ashland Ohio GS-2 3634Marathon-Ashland Ohio GS-4Marathon-Ashland Ohio GS-5Lake Undergd Storage Ohio A--121 1996Lake Undergd Storage Ohio A--122 1996 78568Lake Undergd Storage Ohio 124Lake Undergd Storage Ohio B--303 1959 2410Lake Undergd Storage Ohio B--304
Average 261.73 80.07 147,885 146,611
Ohio data per Tom Tomastik, personal communication and 1996, 1997, 2001 papers No sonar data, not required in Ohio. Average volume excludes Ohio data.

Geomechanical Analysis of Thin Bedded Salt Caverns
DE-FC26-03NT41813 67
Figure 4-23: Typical cavern in the Appalachian Basin.
Bath #6 well
cylinder
Hardford #3 well
diamond

Geomechanical Analysis of Thin Bedded Salt Caverns
DE-FC26-03NT41813 68
4.1.2.4 Salt Dissolution and Collapses in Michigan and Appalachian Basins Abrupt thinning and termination of salt units near the Basin margins and salt core anticlines are attributed to the salt dissolution within the Michigan Basin (Johnson and Gonzales, 1978). However, the collapses occurred within the Michigan Basin are due to cavities found within the overlying sandstones than salt dissolution (Johnson, 1986). In 1971, two sinkholes, North and Central Sinks formed on Grosse Ile, an island located on the Detroit River in Detroit, Michigan. The sites are within a brine field where solution mining for salt has been practiced for almost 20 years. The North Sink is 60 m (200 ft) in diameter, while the Central Sink has two depressions, one is 140 m (450 ft) in diameter, and the other sink is about 60 m (200 ft) in diameter (Johnson, 1986). Another collapse occurred at a nearby brine field in Windsor, Ontario in Canada. The subsidence is caused mainly by cavities within the overlying sandstone formation. The overlying friable sandstone formed a slurry with the groundwater; the slurry flowed downward into joints and other voids in the underlying dolomite and salt units forming cavities within the sandstone unit. When the sandstone unit can no longer span the cavity, it failed causing the overlying dolomite and glacial drift to collapse (Johnson, 1986). Salt is absent in outcrop and shallow depth in the Appalachian Basin. There is no mention of salt dissolution in the literature (Johnson and Gonzales, 1978).
4.1.2.5 Results and Discussion for the Michigan and Appalachian Basins The Silurian Salina Formation is the dominant salt in both the Michigan and the Appalachian Basins. There is at least one thick halite bed over 50 m (165 ft) within 900 m (3,000 ft) from the surface in both Basins. A shallow sea spread over the Great Lakes region as Paleozoic Era began with the Findlay and the Algonquin Arches separating the Michigan Basin from the Appalachian Basin (Johnson and Gonzales, 1978). The Michigan salt was deposited in deep non-turbulent depositional environment, while the Appalachian salt was deposited in a shallow turbulent depositional environment (Terralog. Dec. 30, 2001). In the Michigan Basin six operators operate approximately 30 caverns in the Salina salt. All wells are located within the southern rim of the Basin where the caverns are found in less than 1,200 m (4,000 ft) depth. There are at least 2 halite beds with >50 m (165 ft) thick salt in the Salina Formation. The major salt formation in the Appalachian Basin is also the Salina Formation. Four companies are currently operating gas storage caverns in the Appalachian Basin. Three operators operate over 15 caverns in the New York State, while Marathon Ashland operates one cavern with 2 wells in Ohio State. Caverns are excavated in the thick Salina salt in less than 1,050 m (3,500 ft) in the northern part of the Appalachian Basin in New

Geomechanical Analysis of Thin Bedded Salt Caverns
DE-FC26-03NT41813 69
York State. In Ohio State, the active cavern is located at 1,100 m (3,600 ft) depth on the western side of the Appalachian Basin.

Geomechanical Analysis of Thin Bedded Salt Caverns
DE-FC26-03NT41813 70
5 Geomechanical Analysis of Salt Caverns 5.1 Modeling Salt Behavior
Designing bedded salt caverns for natural gas and liquid storage must take into account the natural bedded salt mechanical properties, as well as the non-salt strata natural mechanical properties encountered. Field data including sonar surveys have shown that deformation and creep occurs around all caverns created in salt. Deformation of bedded salt caverns depends primarily on the time-dependent behaviour properties of the salt (intra-crystalline flow behaviour, or creep). Although elastic deformation and thermal expansion behaviours do not vary significantly from site to site, inelastic deformation, creep properties, and damage behaviours have been shown to vary dramatically between sites (Senseny, 1988, Senseny et al. 1992). Temperature, stress, moisture content, and fabric anisotropy (crystal imbrications or elongation) influence the mechanical behaviour of salt. The rate of deformation is primarily controlled by the stress difference and the temperature. The stress in the salt outside the cavern depends on the weight of the overburden, and is typically on the order of 1 psi/ft of depth. The pressure inside the cavern is equal to the weight of fluid or the operating gas pressure. This pressure is about 0.5 psi/ft if fluid filled (hydrostatic condition), or varying pressure if operated as a gas storage cavern (typically varying between 0.35 to 0.85 psi/ft). Therefore cavern deformation, creep, and salt damage risk increases with depth (due to both increasing stress and temperature) and with larger differences between the internal cavern pressure and the external in-situ stress. Moreover, the fact that salt creeps and deforms differently than typical rocks in heterogeneous layers the salt will expand but the other non-salt layers will not, thereby setting up shear stresses and bedding plane slips. Terralog has developed a modified creep viscoplastic model in Flac3D to simulate the salt material behavior at the Permian, Michigan and Appalachian Basins. We have used the Permian salt lab test data in reference Pfeifle et al. (1983) for our analysis. The Flac3D PWIPP model is a viscoplastic model based on empirical creep law model developed for Waste Isolation Pilot Plant (WIPP) Program combined with the Drucker-Prager model for damage.
5.1.1 Modeling of Creep
The creep law implemented in FLAC is activated by non-zero deviatoric components of the total stress tensor σ . If all deviatoric stress components are equal to zero, i.e. the state of stress is purely hydrostatic no viscous effects are present. The total strain can be written as the sum of deviatoric and hydrostatic strains in the form

Geomechanical Analysis of Thin Bedded Salt Caverns
DE-FC26-03NT41813 71
ijkkdijij δεεε
31
+= ,
(1)
where ijδ is the Kronecker delta and summation occurs over repeated indexes. Similar to the strain components, the stresses can be decomposed into a volumetric and a deviatoric part. We write
ijkkdijij δσσσ
31
+= . (2)
The hydrostatic strain describes the change in volume, while the deviatoric components account for the change in shape (at constant volume).
The creep law developed for the analysis of the Waste Isolation Pilot Plant (WIPP) stipulates an additive decomposition of the deviatoric strain rate components into elastic and viscous parts. In component form the decomposition reads
dvij
deij
dij εεε &&& += , (3)
where the dots indicate the rate form of the equation. The superscript de indicates the elastic components and the superscript dv the viscous part of the deviatoric strain tensor
dijε& . The elastic deviatoric strain components are related to the deviatoric stress
components by Hooke’s law
G
dijde
ij 2σ
ε&
& = . (4)
In the above equation the shear modulus is indicated by G and the rate of the deviatoric stress components by d
ijσ& . The viscous part of the total deviatoric strain shown in equation (3) is given by
εσσ
ε &&
=dijdv
ij 23 .
(5)
Where σ is the magnitude of d
ijσ& Equation (5) shows that the viscous deviatoric strain components do have the same principal directions as the corresponding deviatoric stress components. In addition to the deviatoric stress components, dv
ijε& depends also on the scalar value ε& . This scalar

Geomechanical Analysis of Thin Bedded Salt Caverns
DE-FC26-03NT41813 72
parameter is again given by two components, one is known as the primary creep rate pε& , the second as the secondary creep rate sε& . The additive decomposition is given by
sp εεε &&& += . (6) It is interesting to note that the primary creep rate pε& depends on the secondary creep rate through equation
*
**
if if
)(
)(
sss
sss
sps
ss
sp
p BA
BA
εεεε
εεεε
εεε
&&
&&
&&
&
&
&<≥
−
−= .
(7)
The constants A, B and *
ssε& in equation (7) are material constants to be determined from experimental data. The secondary creep rate sε& is given by
−
= RTQ
ns eDσε& ,
(8)
where Q is the activation energy, R is the universal gas constant and T is the temperature in degrees Kelvin. The stress magnitude σ is proportional to the deviatoric stress and is given by
23 d
ijdij σσ
σ = . (9)
Equation (8) shown above indicates clearly that the secondary (and thus the primary) creep rate is strongly influenced by the magnitudes of both the stress difference and the temperature. Finally, the volumetric response does not depend on time and is given in rate form by
Kkk
kk 3σ
ε&
& = , (10)
where K is the bulk modulus of the material. The state of stress in a standard triaxial compression or tension test is given by the vertical stress 1σ and by the confinement stresses 32 σσ = . For the triaxial compression test we have 321 σσσ => , for the triaxial extension test the magnitudes of the stress components changes such that 321 σσσ =< .

Geomechanical Analysis of Thin Bedded Salt Caverns
DE-FC26-03NT41813 73
To simplify the above 3-D representation of the creep law, we consider a triaxial compression test. In a triaxial compression test, using our principal coordinate system to represent the stress and strain components, there are no shear stresses and thus, following Hooke’s law, there are no shear strains. The deviatoric strain component in the loading direction is again additively decomposed into elastic and viscous parts
dvded111 εεε &&& += . (11)
The deviatoric strains along the 2- and 3-directions are equal and are given similarly to Equation (11) by
dvdedvdedd332232 εεεεεε &&&&&& +=+== . (12)
Given the three principal stress components 321 ,, σσσ , the deviatoric stress components become
( )211 32 σσσ −=d
(13)
and
( )212 31 σσσ −−=d .
(14)
Using equation (4) the elastic deviatoric strain components are given in rate form by
)(31
211 σσε &&& −=G
de (15)
and
)(61
2132 σσεε &&&& −−==G
dede . (16)
The viscous deviatoric strain components can similarly be written as
εσσσ
ε &&)( 21
1−
=dv (17)
and
εσσσ
εε &&&2
)( 2132
−−== dvdv ,
(18)

Geomechanical Analysis of Thin Bedded Salt Caverns
DE-FC26-03NT41813 74
where σ has been defined previously in equation (9). For the special case of triaxial compression, this equation simplifies to
3121 σσσσσ −=−= . (19) Please note that for the special case where all stresses become equal (hydrostatic state of stress), no viscous effects are present. Equations (18) and (19) simplify further to give
εε && =dv1 , (20)
232εεε&
&& −== dvdv . (21)
Equations (20) and (21) show that the deviatoric viscous strain rate components for a hydrostatic compression test depend only on the scalar parameter ε& , which is given as the sum of the primary and secondary creep rate, see equation (6). Equation (7) indicates that the primary creep rate depends directly from the secondary creep rate, which now simplifies to
−
−= RTQ
ns eD )( 21 σσε& .
(22)
Finally the rate of the volumetric response for hydrostatic compression becomes
Kkk 32 21 σσ
ε&&
&+
= . (23)
5.1.2 Failure Model for Salt
Drucker-Prager Model The failure criterion used with the PWIPP model is the Drucker-Prager criterion, with a tension cutoff. The failure envelope for this model is as
φφστ kqf s −+= , (24)
Where shear failure surface sf is defined by shear stress τ ( 2J=τ ) and 2J is the 2nd invariant of the deviatoric stress tensor, normal stress σ (σ = σkk/3) and φq , φk are material properties, and the tension cutoff is given by

Geomechanical Analysis of Thin Bedded Salt Caverns
DE-FC26-03NT41813 75
ttf σσ −= . (25) In equations (24) and (25), σ indicates the hydrostatic pressure. The material parameters for the Drucker-Prager model can be expressed in terms of the cohesion c and the friction angle φ obtained from evaluation of experiments. We have
φφφ sin
)sin3(36−
=q , (26)
And
φφφ cos
)sin3(36−
= ck (27)
The tension cutoff value tσ is obtained from Brazilian Indirect tensile tests, for example. We start by using a friction angle o33=φ and a cohesion c = 7.6 MPa. These values are representative values for Permian salt and do reasonable well reproduce available test data shown in, for example, Pfeifle et al. (1983). Therefore, the above listed model parameter become φq = 0.7684 and φk = 8.99 MPa. Furthermore, from a literature
review we assume a tension cutoff equal to tσ = 1.2 MPa. The above values provide onset of failure as shown in Figure 5-1. Figure 5-1 compares the Drucker-Prager criterion used in this study with the exponential Mises-Schleicher criterion given on page 30 in reference Pfeifle et al. (1983). The parameters for the Mises-Schleicher failure criteria are summarized in Table 4.2 of Pfeifle et al. (1983) and correspond to cycle 5 for Permian salt.

Geomechanical Analysis of Thin Bedded Salt Caverns
DE-FC26-03NT41813 76
Figure 5-1: Drucker-Prager criterion used in this study compared to the
exponential Mises-Schleicher criterion. From Pfeifle et al. (1983).
Softening and Failure Criterion Salt response is characterized by three important types of behavior and need to be implemented in any numerical code. These are the initial elastic response followed by accumulation of damage and dilation and eventual failure, the transient creep and the steady-state creep rate. The model WIPP combined with the Drucker-Prager plasticity criterion is implemented as PWIPP-Creep Viscoplastic Model in FLAC. In order to simulate the available material data shown in reference Pfeifle et al. (1983), for example, the viscoplastic model in FLAC was modified. The three principal modifications are:
• Initial elastic followed by the accumulation of damage during primary loading; • Volumetric dilation and eventual material failure based on a Drucker-Prager
failure criteria; • Loading-unloading response based on stiffness properties of an undamaged
material.
Material softening and dilation during primary loading is achieved through a work-hardening yield surface. After the initial elastic response, during which the material
Drucker-Prager criterion
Mises-Schleicher criterion
Drucker-Prager criterion
Mises-Schleicher criterion

Geomechanical Analysis of Thin Bedded Salt Caverns
DE-FC26-03NT41813 77
compacts, the volumetric response changes to dilation. Once the maximum strength criterion is satisfied, the material fails and the material strength returns to zero. Experimental data for Permian salt, see Figures C.11 to C.15 in Pfeifle et al. (1983), for example, show that during unloading and subsequent reloading the material response is based on the initial undamaged stiffness. This characteristic was implemented as well and is essential in this study which does include cyclic loading. The creep law describing primary and secondary creep rates is maintained as originally implemented. Parameter Determination
Consider an unconfined compression test with an applied constant stress of 10 MPa, for example. Thus, all elastic contributions given by equations (4) and (10) vanish since all stress rates are zero. Equation (17) shows that for uniaxial compression the axial deviatoric strain rate is equal to ε& and thus given by equations (6), (7) and (8). Equation (8) expresses the secondary creep rate, which using the material parameters in Table 5-1 becomes sε& = 0.000043/day. This is equal to the constant slope of the creep strain data shown in Figure 5-2. Given the values of A and B, the primary strain rate and primary strain is obtained from equation (7). The total strain rate and thus the total strain are given by the sum of the primary and secondary strain rates and strain components. The three fundamental features of a creep curve that must be described are the steady state or secondary creep rate and the primary or transition strain rate. Figure 5-2 shows the primary and secondary strains over a period of 10000 days. It is easily seen that the total strain is given by summing the two components. Sometimes it is difficult to accurately interpret raw creep data to determine the steady-state creep rate. It is therefore suggested to obtain the first derivative of the creep data and plot it as a function of time, see Figure 6-3. From this plot the true steady-state creep rate is given accurately by the asymptotic value. A uniaxial compression or triaxial compression test can then be used directly to find the material parameters for the WIPP model.

Geomechanical Analysis of Thin Bedded Salt Caverns
DE-FC26-03NT41813 78
Figure 5-2: Total creep strain in loading direction for unconfined compression test
with total stress of 10 MPa (red). The total primary creep is indicated by blue, the total secondary creep by magenta.
Figure 5-3: Axial creep strain rate for unconfined compression test with axial
compression of 10 MPa.
Total creep strain
Total primary creep
Total secondary creep
Total creep strain
Total primary creep
Total secondary creep

Geomechanical Analysis of Thin Bedded Salt Caverns
DE-FC26-03NT41813 79
At time t = 0 the primary strain pε = 0. Thus, from equation (7) it follows that the parameter A is given as the ratio of primary strain rate at time 0, )0( =tpε& , to the secondary strain rate sε& given by the final and constant slope of the creep curve in Figure 5-2.
s
p tA
εε
&
& )0( == = 15.625
(28)
where we used )0( =tpε& = 6.7E-4, see Figure 5-3. Similarly, Figure 5-2 shows that at a given time the primary creep rate is zero, i.e. 0=pε& and the primary creep remains constant. Thus, again from equation (7) we have
B = (max)p
Aε
= 210.013, (29)
where 0.0744 is the maximum primary creep strain shown in Figure 5-2. The exponent n in equations (8) and (22) is usually calculated by conducting a series of individual creep tests at different stress differences but identical temperatures. For constant temperature, equation (8) may be written in an alternative form
ns D σε *=& , (30)
where *D now incorporates the effect of temperature and the model parameter D. Transforming equation (30) using logarithm, we obtain log =sε& log *D + n log σ . (31)
This is a linear equation in the log space and the stress exponent n represents the slope of the line in logarithmic space. The value of n is an indication on the dependence of the steady-state strain rate on the deviatoric stress. Similarly, the activation energy Q in equation (8) is determined by performing a series of creep tests at constant stress difference but at different temperatures. Equation (8), for constant stress differences may be written as
−
= RTQ
s eD 'ε& , (32)
where 'D is a material model parameter incorporating the stress dependency and the model parameter D. Since R is constant equal to 1.987 cal/mole K, the value for the activation energy Q can be determined.

Geomechanical Analysis of Thin Bedded Salt Caverns
DE-FC26-03NT41813 80
All material model parameters used for the present study are summarized in Table 5-1.
5.1.3 Sample Problems
Uniaxial Tension Test A single element model is used to perform a uniaxial extension test on Permian salt to determine the tension cutoff. A simple schematic is shown in Figure 5-4. Figure 5-5 shows the resulting stress versus strain plot for the uniaxial tension test. The tension cutoff in uniaxial tension is reached when the stress component is equal to 1.2 MPa. During uniaxial tensile loading, the material softens, however once the state of stress reaches the tension failure line, the strength does not reduce to zero, i.e. the material does not break.
Table 5-1: Summary of material parameter used for the one-element test case.
Value Units Model Parameter 15.625 WIPP-model constant, A 210.013 WIPP-model constant, B 0.286 MPa^-n day^-1 WIPP-model constant, D 4.9 WIPP-model exponent, n 12000 cal/mol Activation energy, Q 0.0043 1/day Critical steady-state creep rate 1.987 cal/mol*K Gas constant, R 10000 MPa Elastic shear modulus, G 26078 MPa Elastic bulk modulus, K 0.40 MPa Hydrostatic tension limit, tσ 304 Kelvin Zone temperature, T 8.99 MPa Material parameter, kφ
0.7684 Material parameter, qφ 0.40 Material parameter, qk 2100 kg/m3 Density, ρ

Geomechanical Analysis of Thin Bedded Salt Caverns
DE-FC26-03NT41813 81
Figure 5-4: Unit cube element subjected to uniaxial tensile loading.
Figure 5-5: Response of Permian salt subjected to uniaxial tensile loading.
Uniaxial Compression Test The ultimate strength of the salt material can be determined by a uniaxial compression test on a unit cube shown in Figure 5-6.
σ

Geomechanical Analysis of Thin Bedded Salt Caverns
DE-FC26-03NT41813 82
Figure 5-6: Unit cube element subjected to uniaxial compressive loading.
Figure 5-7: Response of Permian salt subjected to uniaxial compression loading.
Experimental data are from Pfeifle et al. (1983). Figure 5-7 shows the stress-strain response obtained from the modified viscoplastic WIPP model for uniaxial compression test. The primary response is nonlinear, characterized by a reduction of the shear modulus G and the onset of dilation. Once the Drucker-Prager failure criterion, shown in Figure 5-1, is satisfied, the material fails. Experimental data are obtained from Figure C.11 in Pfeifle et al. (1983).
σ

Geomechanical Analysis of Thin Bedded Salt Caverns
DE-FC26-03NT41813 83
Triaxial Compression Tests Figure 5-8 shows a unit cube element under triaxial compression test to determine the material failure mode with 5 MPa confinement pressure. Once the confinement is applied, the vertical stress is increased until failure occurs. Figure 5-9 shows the corresponding results for the triaxial compression test. Experimental data are from Figure C.12, Pfeifle et al. (1983). The difference between the test data and numerical results can be explained by the use of the Drucker-Prager model, which shows a linear dependence on the second deviatoric stress invariant from the first stress invariant, see Figure 5-1. Figure 5-10 shows experimental and numerical data for triaxial compression test with a confinement of 10 MPa. Again, primary loading is associated with a gradual reduction of the shear stiffness and failure is initiated once the Drucker-Prager criterion is satisfied. Figure 5-10 also shows loading-unloading cycles during which the material response is described by the original values of the shear and bulk moduli. Experimental data are extracted from Figure C.13, Pfeifle et al. (1983).
Figure 5-8: Unit cube element subjected to triaxial compression test.
σ
5 MPa

Geomechanical Analysis of Thin Bedded Salt Caverns
DE-FC26-03NT41813 84
Figure 5-9: Response of Permian salt subjected to triaxial compression, confinement
is 5 MPa. Experimental data are from reference Pfeifle et al. (1983)
Figure 5-10: Response of Permian salt subjected to triaxial compression loading,
confinement pressure is 10 MPa. Experimental data are from Pfeifle et al. (1983). Loading and unloading responses are
shown as well.

Geomechanical Analysis of Thin Bedded Salt Caverns
DE-FC26-03NT41813 85
Creep Test A unit cube element is subjected to a constant vertical load and lateral loads to determine the creep response of the salt material. Figure 5-11 presents the schematic with constant lateral confinement loads of 15 MPa and a constant vertical load of 20 MPa. Figure 5-12 shows the creep response of Permian salt at 100°C and is compared with experimental data from Figure C.17 in Pfeifle et al. (1983). Numerical creep data for different temperature is easily obtained by changing the input parameter for the temperature, which is being used in equation (8) to calculate the secondary creep rate sε& . In Figure 5-12 only the primary and secondary creep stages are present. In the first stage, called primary rate, the strain rate begins with a very high value and decreases gradually to a constant rate called the secondary creep rate. The exponential reduction of the creep rate from the initial value to a steady state value is also shown in Figure 5-3. For a confining pressure less than 5 MPa, the material would eventually experience a tertiary creep during with the rate increases again until failure occurs. For a more detailed discussion on this issue, we refer to the Sandia report SAND2002-2063 by Fossum and Fredrich (2002).
Figure 5-11: Unit cube element subjected to creep test.
15 MPa 15 MPa
20 MPa

Geomechanical Analysis of Thin Bedded Salt Caverns
DE-FC26-03NT41813 86
Figure 5-12: Creep response of Permian salt. Confinement pressure is 15 MPa, stress difference equal to 5 MPa. The temperature of the simulation is 100°C
Experimental data are from Pfeifle et al. (1983). 5.2 Typical Mechanical Properties for Bedded Salt Materials Elastic Properties Published data was reviewed and summarized to find characteristic values of the elastic properties of salt. It is known that the mechanical properties of salt are site dependent and therefore only relevant data is here considered. As pointed out by Fossum and Fredrich (2002), the elastic and thermal properties do not change significantly form site to site, contrary to the inelastic and failure response, which are very site specific. A summary of the thermo-mechanical behavior of salt is given by Appendix A in Fossum and Fredrich (2002). In particular, the influence of temperature, stress, time, moisture and loading history on the deformation is given. In the report by Pfeifle et al. (1983), prepared for the Office of Nuclear Waste Isolation in Columbus, Ohio, results of a number of quasi-static triaxial compression tests at different confinement pressures and at different temperatures were summarized for the Permian Basin. The Young’s modulus E and the Poisson’s ratio ν are determined for a

Geomechanical Analysis of Thin Bedded Salt Caverns
DE-FC26-03NT41813 87
temperature of 24°C for each test from the unload-reload response of the stress-strain graphs. The modulus E is given by the slope of the axial stress difference versus axial strain curve
1εσ
∆∆
=E . (33)
The value of the Poisson’s ratio ν is given by the ratio of Young’s modulus and the slope of the lateral strain curve versus the axial stress difference
σεν
∆∆−
=E2
(34)
where σ∆ is the axial stress difference and 1ε∆ and 2ε∆ are the increments in the axial and lateral strains. The values of Young’s modulus for the Permian Basin are essentially equal to the average values reported for other salts in the United States and are between 27 GPa and 30 GPa. The Poisson’s ratio is found to be about 0.33. Furthermore, Pfeifle et al. (1983) report that the Young’s modulus increases slightly with the confining pressure (about 0.4 GPa/MPa), i.e. the Young’s modulus is a linear function of depth. This dependence was not observed for the Poisson’s ratio. Young’s modulus E decreases with temperature at about 0.04 GPa/°C, as expected. No temperature dependence was observed for the Poisson’s ratioν . Finally, increasing the temperature at a given stress greatly increases the inelastic deformation of salt. Young’s modulus E and the shear modulus G for Gulf Coast salt domes are given in the Sandia Report SAN2002-2063, Appendix F by Fossum and Fredrich (2002). The reported value for Young’s modulus E is 31 GPa, for G 12.4 GPa. This corresponds to a Poisson’s ratio of 0.25. Elastic salt rock properties are also given in the Sandia Report SAND-92-2183C by Hoffman and Ehgartner (1992) used to evaluate storage loss and cavern stability of underground cavern for the US Strategic Petroleum Reserve. The Young’s modulus E is 31 GPa, Poisson’s Ratio is 0.25. Thermo-mechanical properties for salt are listed in a paper by Nieland and Mellegard (2002) and used to evaluate the economic and technical feasibility of converting a conventional natural gas storage facility in bedded salt into a refrigerated storage facility for the purpose of increasing the working gas capacity. The thermal conductivity of natural rock salt and its dependence on low temperatures as well as other mechanical properties at refrigerated temperature (-30°C) were determined experimentally. The mechanical tests included (a) three triaxial compression tests to evaluate strength and elastic moduli, (b) three constant mean stress tests to evaluate dilatancy and (c) eight

Geomechanical Analysis of Thin Bedded Salt Caverns
DE-FC26-03NT41813 88
constant stress tests to evaluate creep rates with a decrease in temperature. Average values of mechanical properties obtained by testing at both ambient and sub-ambient temperatures are used. These are 25.2 GPa and 0.35 for Young’s modulus and Poisson’s ratio, respectively. An extensive testing program is summarized in the report by DeVries, Mellegard and Callahan (2002) on salt cores from the McIntosh Dome located northwest of Mobile, Alabama. (a) Indirect tensile tests, (b) unconfined compression tests, (c) confined constant strain rate tests, (d) confined constant mean stress dilation tests and (e) confined creep tests are performed, the corresponding results shown as stress-strain graphs and the results summarized in tabular form. Young’s modulus and the Poisson’s ratio were determined from 6 unconfined compression tests and from 6 confined constant strain rate tests. The values obtained from the constant strain rate tests are more representative of typical values expected for salt. The average value of Young’s modulus was 27.1 GPa and the average value for the Poisson’s Ratio was 0.321. These values are significantly different than the values obtained from unconfined compression tests. The values of Young’s modulus and Poisson ratio are estimated from unloading/reloading cycles in the load paths. Failure Criteria Failure of salt depends on the state of stress and on the loading rate. The strength of the material depends on the hydrostatic stress and increases with increasing pressure. For constant pressure, the strength is highest for triaxial compression and lowest for triaxial extension. In the report by Pfeifle et al. (1983) a number of Mohr circles were constructed at failure to determine the failure envelope. The exponential Mises-Schleicher formulation was selected to describe the observed failure mode. The form of the equation was
( ){ }1'2 exp1 IkJ βα −−+= , (35)
where '
2J is the second deviatoric stress invariant and 1I is the first stress invariant. The values of the fitting parameters given by Pfeifle et al. (1983) are: k = 1.1 MPa, α = 43.5 MPa and β = 0.0151 MPa-1. This failure envelope is shown in Figure 5-1. To represent the increase of strength with confining pressure, the Mohr-Coulomb criterion is often used to determine the angle of internal friction and the cohesion. This representation is valid for a limited range of normal stress. For higher value the failure response becomes nonlinear, see Pfeifle et al. (1995). In this study, we use the linear Drucker-Prager failure envelope, also shown in Figure 5-1. Unconfined compressive strength for 6 salt rock samples recovered from different depths is given by DeVries, Mellegard and Callahan (2002). The unconfined compressive

Geomechanical Analysis of Thin Bedded Salt Caverns
DE-FC26-03NT41813 89
strengths ranged from a low of 15.3 MPa to a high of 18.3 MPa. It is also shown that the unconfined compressive strength is similar to the strengths determined for other salts. The results obtained from 6 confined compressive constant strain rate tests show that the compressive strength increases, as expected, with increasing confining pressure. The compressive strength at the lowest confinement of 1MPa was 28 MPa, it increases to 43 MPa at the highest confining pressure of 10.3 MPa. Of particular interest are the confined constant mean stress tests, again by DeVries, Mellegard and Callahan (2002) pages 31-33 and page 55. The data of these tests were analyzed to identify the combination of values of the first stress invariant 1I and the second deviatoric stress invariant '
2J to determine the transition between salt compaction and dilation. It was found that a nonlinear criterion, compared to the more traditional linear relation, best represents the volumetric response of rock salt cores from the McIntosh Dome. The criterion divides the stress space into two distinct regions, one representing stress states where dilation will occur, the other region representing stress states where compaction dominates, see DeVries, Mellegard and Callahan (2002), pages 31-33. Finally, from DeVries, Mellegard and Callahan (2002), the unconfined tensile strength of salt recovered from different depths is obtained from indirect tensile (Brazilian) tests. The tensile strengths ranged from a low of 1.1 MPa to a high of 1.54 MPa, all tests performed at constant temperature of 20°C.

Geomechanical Analysis of Thin Bedded Salt Caverns
DE-FC26-03NT41813 90
Creep data for salt Salt exhibits creep when subjected to any nonzero deviatoric stress, which in general depend on the confinement pressure and on temperature. A large amount of triaxial compression creep test data is available in the literature. The specimens are, in general, first loaded hydrostatically to simulate the overburden pressure in the salt. Then, the axial load is applied rapidly to achieve a predefined axial stress difference. Keeping the confining pressure, stress difference and temperature constant, the deformations are measured over time. Fossum and Fredrich (2002) describe the creep response of salt as a function of the confining pressure. For confining pressures less than 5 MPa, salt specimens will experience three stages. During the initial response, known as primary or transient creep, the strain rate decreases from an initial high rate to a constant value. This is known as the secondary or steady-state creep rate. After the certain amount of deformation, during which the secondary creep rate is approximately constant, the strain rate increases again until failure occurs. This response is known as the tertiary creep. For a confining pressure above 5 MPa, the material exhibits only a primary and secondary creep, i.e. the creep after the initial decline remains constant. Therefore, the model described in the previous section is accurate for confining pressures of a least 5 MPa. As a matter of fact, the FLAC material model for WIPP analyses does not have an explicit dependence of the creep rate on the confining pressure. This very large database exists, in part, to satisfy the need to experimentally determine creep parameters necessitated by the Waste Isolation Pilot Plant (WIPP). However, since different creep laws are in general used, the corresponding creep material model parameters cannot, in general, directly be compared and we make no attempt here to do so. Pfeifle et al. (1983), for example, show experimental data for a total of 3 triaxial creep tests for rock salt at the Permian Basin at a confining pressure of 15 MPa for different depths investigated. Axial stress differences and temperatures for the three tests are (a) 5 MPa at 100°C, (b) 10 MPa at 100°C and (c) 5 MPa at 200°C. Test duration is always 2.4x10⁶ seconds. In Figure 5-12, the experimental creep data of Permian salt with a confinement pressure of 15 MPa and a stress difference of 5 MPa compared to a numerical fit. The temperature of the simulation is 100°C. The corresponding material model creep parameters are shown in Table 5-2. The Waste Isolation Pilot Plant (WIPP) is a research facility sited in a bedded salt formation in southeastern New Mexico. To accurately determine the time dependent strain of WIPP salt a number of triaxial compression creep tests were performed at stresses and temperatures in the ranges expected in a nuclear repository. These results are summarized in a report by Senseny (1986). A total of twenty-six constant stress creep tests were performed at temperatures of 25°C, 100°C and 200°C and at eleven stress differences between 2 MPa and 20 MPa. The confining pressure in all tests was 15 MPa. The test duration ranged from 0.24 x 10⁶ sec to 24.6 x 10⁶ sec. Senseny (1986) shows

Geomechanical Analysis of Thin Bedded Salt Caverns
DE-FC26-03NT41813 91
results of all tests as strain versus time curves. Nine of the tests were performed on argillaceous salt, the remaining on clean salt. It is found that in general, the argillaceous specimens deform more than the clean specimens at every condition, i.e. the transient strain limits as well as the steady-state strain rates are greater for argillaceous salt compared to clean salt. Specimen identification, confining pressures, temperatures, stresses and steady-state strain rates, and transient strain limits for all tests are given in tabular form. It is shown that the transient strain limit as well as the steady-state strain rate increases with increasing stress and temperature, as expected. Hoffman and Ehgartner (1992) provide creep parameters to determine the secondary or steady-state creep rate as shown by equation (8), transient creep was not considered. Munson (1998) provides a comprehensive overall evaluation using the same analysis framework of experimental creep data for a number of Gulf Coast salts domes. He found that one group of domal salts has a steady-state creep identical to the bedded salt layers of the Waste Isolation Pilot Plant (WIPP). The other group of domal salts creeps much slower than the WIPP salt. The difference in creep for the domal salts is roughly a factor of ten. Creep data available for each of the individual domal size are reproduced indicating test parameters, such as stress, temperature and final creep rate. Steady-state creep rates are plotted in logarithmic from against the creep stress. More recently, Munson (1999) expanded on his previous results and proposed a detailed transient analysis method, whereby both, the steady-state and transient behavior of domal salts is considered. The transient response has proven more sensitive to differences in the creep characteristics and provides improved methods of analysis of storage cavern operated by the Strategic Petroleum Reserve. Eight constant stress tests to evaluate creep rates at different temperatures were performed by Nieland and Mellegard (2002) five of them at sub-ambient temperatures, the remaining at a temperature of 40°C. As expected, the test a 0°C had a higher creep rate than the test at -20°C. It was also shown that the tests at low temperature had a much sharper transition between transient and steady-state creep than the tests conducted at 40°C. DeVries, Mellegard and Callahan (2002) report creep test results on 14 specimens performed at a temperature of 52°C. The dependence of the steady-state creep rate on changes in the applied axial stress difference is shown using an equation similar to equation (26) in this report. A slope of the graph of equation (27), in logarithmic space, allows determining n. The value for n so found is 5.6, which is a typical value for stress exponent as pointed out, for example, by Pfeifle et al. (1995).

Geomechanical Analysis of Thin Bedded Salt Caverns
DE-FC26-03NT41813 92
Mechanical properties of nonsalt rocks Pfeifle et al. (1983) report, among others, the mechanical properties of nonsalt material in the Permian Basin obtained from unconfined compression and indirect (Brazilian) tensile tests. The unconfined compression tests provide data to determine Young’s modulus and the Poisson’s ratio as well as the unconfined compression strength. The tensile strength was determined form the Brazilian tests. The complete stress-strain curves are given as an Appendix by Pfeifle et al. (1983). A summary of the elastic as well as strength parameters is given in Table 5-2. The elastic modulus for nonsalt rock was determined by fitting the stress-strain data between 20 and 60 percent of the unconfined strength. The Young’s modulus at this site ranges from 2200 MPa for mudstone/salt to 59100 MPa for anhydrite. The values for the unconfined compressive strength vary at the Permian Basin from 11.2 MPa for mudstone/salt to 148.1 MPa for anhydrite. The lowest value for the tensile strength is 2.4 MPa for mudstone/salt to 15 MPa for dolomite. The linear approximation based on a Drucker-Prager or Mohr-Coulomb formulation is suggested, possible coupled with a softening criteria. Similarly, Hoffman and Ehgartner (1992) provide elastic nonsalt properties for caprock and overburden for underground cavern at sites located along the Gulf of Mexico and used by the US Strategic Petroleum Reserve.

Geomechanical Analysis of Thin Bedded Salt Caverns
DE-FC26-03NT41813 93
Table 5-2: Summary of nonsalt material parameters for Permian Basin.
Source: Table 5.3, Pfeifle et al. (1983).
Elastic Parameters Strength Parameters
Young’s Modulus
(MPa) Poisson’s Ratio
Unconf, Comp. Strength (MPa)
Tensile Strength (MPa)
Mudstone 335 m 9400 0.25 34.5 5.0
Mudstone/Salt 390 m 2200 0.32 11.2 2.4
Siltstone 503 m 2500 0.26 15.3 -
Anhydrite 655 m 59100 0.36 148.1 11.7
Dolomite 832 m 32200 0.32 81.3 15.0
Mudstone 974 m 6400 0.34 38.7 5.8
Mudstone/Salt 1042 m 3100 0.30 23.7 2.6
5.3 Single Cavern Geomechanical Models Three dimensional geomechanical simulations of thin-bedded salt caverns are used to model physically realistic caverns as surveyed in the Permian, Michigan and Appalachian Basins. Assuming an axisymmetric layout in geology and loading conditions allows reducing a full 3-D model and corresponding computational time. Single and multiple cavern configurations are developed using Flac3D to investigate bedding plane slip and cavern deformation induced by pressure cycling and long term salt creep. Also, the minimum and maximum cavern pressures that may induce roof instability or excessive closure are analyzed. There are basic geomechanical processes that limit the maximum and minimum pressure in a bedded salt cavern. These are:
• The tensile fracturing strength of salt and interbedded non-salt material; • The formation stress components induced by the decline or increase of cavern
pressure at which bedding plane slip may occur between heterogeneous material layers;
• The minimum cavern pressure that may induce roof instability or excessive closures;
• The creep response of the material, which is a function of the deviatoric stress components. Ideally, if the cavern pressure is selected to create a hydrostatic state of stress in the surrounding material, the creep deformation vanishes. On the other hand, a low cavern pressure increases the deviatoric stress components and

Geomechanical Analysis of Thin Bedded Salt Caverns
DE-FC26-03NT41813 94
therefore creep deformation in the surrounding salt accelerating the cavern closure process.
Terralog has investigated sonic surveys and performed a number of simulations to determine the minimum and maximum pressure limits for thin bedded salt caverns in a variety of typical situations occurring at the Permian Basin Complex, the Michigan and the Appalachian Basins. Figure 5-13 presents a typical geomechanical model to investigate single bedded salt caverns as observed from a sonar survey.
FLAC3D 2.10
Terralog Technologies USA, Inc.Arcadia, CA 91006
Settings: Model Perspective11:52:43 Wed Jun 16 2004
Center: X: 3.476e+001 Y: 5.460e+000 Z: 7.750e+002
Rotation: X: 180.000 Y: 0.000 Z: 350.000
Dist: 3.223e+003 Mag.: 7.45Ang.: 22.500
Job Title: Typ1A_Mar25.dat: Baseline Model
Block GroupClasticAnhydriteSaltPre-Salt
Axes Linestyle
Figure 5-13: Geomechanical model to analyze single bedded salt caverns. The numerical model is based on a typical cavern geometry.
5.3.1 Single Cavern Model Description and Simulation Matrix Three dimensional geomechanical models have been developed by Terralog to investigate single cavern deformation and bedding plane slip for a variety of cavern configurations. Table 5-3 provides an overview of the geomechanical models assembled for this project. Numerical simulations include the baseline case and a number of variations to investigate the height to diameter ratio, the salt roof thickness, interface properties, different cavern pressures and reduced overburden stiffness on the overall cavern response. Each cavern simulation includes one year of pressure cycling with a minimum, mean, and maximum cavern pressure of 6.1 MPa (884.5 psi), 8.8 MPa (1276 psi) and 14.9 MPa (2160.5 psi), respectively. These values are obtained from pressure gradients of 0.0079 MPa/m (0.35 psi/ft), 0.0113MPa/m (0.50 psi/ft) and 0.0192MPa/m (0.85 psi/ft) at 777 m (2548 ft) respectively. In addition, the baseline model is used to investigate creep over a 15 year time frame under hydrostatic cavern pressure.

Geomechanical Analysis of Thin Bedded Salt Caverns
DE-FC26-03NT41813 95
Table 5-3: Simulation matrix for single cavern numerical investigations.
Model Number
H/D Ratio
Cavern Height
Cavern Diameter
Cavern Volume
Roof Thickness
Interface Friction Pressure
1 1/2 30 m (98.4 ft)
60 m (196.8 ft)
84780 m^3 (2991679 ft^3)
12 m 40 ft 15 deg Cyclic
2 1/4 30 m (98.4 ft)
120 m (393.6 ft)
339120 m^3 (11966715 ft^3)
12 m 40 ft
15 deg Cyclic
3 1/1 30 m (98.4 ft)
30 m (98.4 ft)
21195 m^3 (747920 ft^3)
12 m 40 ft
15 deg Cyclic
4 1/2 30 m (98.4 ft)
60 m (196.8 ft)
84780 m^3 (2991679 ft^3)
12 m 40 ft
15 deg Hydrostatic
5 1/4 30 m (98.4 ft)
120 m (393.6 ft)
339120 m^3 (11966715 ft^3)
12 m 40 ft
15 deg Hydrostatic
6 1/1 30 m (98.4 ft)
30 m (98.4 ft)
21195 m^3 (747920 ft^3)
12 m 40 ft
15 deg Hydrostatic
7 1/2 30 m (98.4 ft)
60 m (196.8 ft)
84780 m^3 (2991679 ft^3)
12 m 40 ft
15 deg Pressure Drawdown
8 1/4 30 m (98.4 ft)
120 m (393.6 ft)
339120 m^3 (11966715 ft^3)
12 m 40 ft
15 deg Pressure Drawdown
9 1/1 30 m (98.4 ft)
30 m (98.4 ft)
21195 m^3 (747920 ft^3)
12 m 40 ft
15 deg Pressure Drawdown
10 1/2 30 m (98.4 ft)
60 m (196.8 ft)
84780 m^3 (2991679 ft^3)
24 m 80 ft
15 deg Cyclic
11 1/2 30 m (98.4 ft)
60 m (196.8 ft)
84780 m^3 (2991679 ft^3)
12 m 40 ft
15 deg Cyclic
12 1/2 30 m (98.4 ft)
60 m (196.8 ft)
84780 m^3 (2991679 ft^3)
12 m 40 ft
5 deg Cyclic
The geometric layout of the baseline model is a cylindrical shaped cavern 30 m (98.4 ft) in height and 60 m (196.8 ft) in diameter, see Figure 6-14. This layout is best described in terms of the Height/Diameter (H/D) ratio, i.e. the baseline model has a H/D ratio of (1/2). For all simulations performed, the cavern main roof is located at the depth of 762 m (2500 ft) below the free surface. The cavern itself is located in the center of a 54 m (177 ft) thick salt layer, which is covered by a 5 m (16.4 ft) thick anhydrite layer. The thickness of the salt layer was increased to 78 m (256 ft) to investigate the cavern response when the cavern roof is increased to twice the thickness. A frictional slip interface is located between the anhydrite layer and the salt to study interface slippage. Similarly, a second slip interface is located between the salt and the underlining pre-salt material, see Figure 5-14. Finally, the salt temperature was not considered as a design variable and kept constant at 31 degree Celsius (304 degree Kelvin). In addition to the baseline model, parametric studies have been performed to investigate cavern damage as a function of different cavern pressures (hydrostatic, cyclic, and a pressure drawdown), a change in salt roof thickness, change in overburden stiffness and
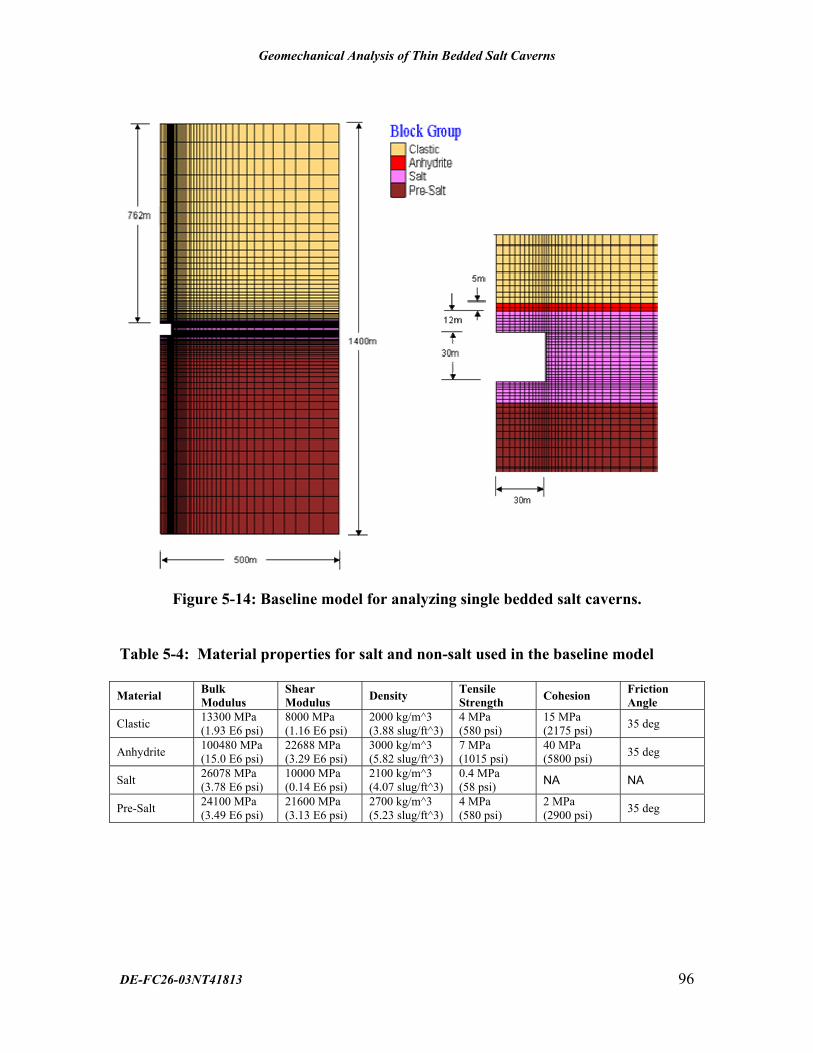
Geomechanical Analysis of Thin Bedded Salt Caverns
DE-FC26-03NT41813 96
Figure 5-14: Baseline model for analyzing single bedded salt caverns. Table 5-4: Material properties for salt and non-salt used in the baseline model Material Bulk
Modulus Shear Modulus Density Tensile
Strength Cohesion Friction Angle
Clastic 13300 MPa (1.93 E6 psi)
8000 MPa (1.16 E6 psi)
2000 kg/m^3 (3.88 slug/ft^3)
4 MPa (580 psi)
15 MPa (2175 psi) 35 deg
Anhydrite 100480 MPa (15.0 E6 psi)
22688 MPa (3.29 E6 psi)
3000 kg/m^3 (5.82 slug/ft^3)
7 MPa (1015 psi)
40 MPa (5800 psi) 35 deg
Salt 26078 MPa (3.78 E6 psi)
10000 MPa (0.14 E6 psi)
2100 kg/m^3 (4.07 slug/ft^3)
0.4 MPa (58 psi) NA NA
Pre-Salt 24100 MPa (3.49 E6 psi)
21600 MPa (3.13 E6 psi)
2700 kg/m^3 (5.23 slug/ft^3)
4 MPa (580 psi)
2 MPa (2900 psi) 35 deg

Geomechanical Analysis of Thin Bedded Salt Caverns
DE-FC26-03NT41813 97
PWIPP Material model for salt
WIPP Model Constant A 15.625 WIPP Model Constant B 210.013
WIPP Model Constant D 0.286 MPa^-n day^-1 (7.365E-12 psi^-n day^-1)
Activation Energy Q 12000 cal/mol Steady-State Creep Rate 0.0043 /day Gas Constant R 1.987 cal/mol K WIPP Model Exponent n 4.9
Bulk Modulus 26078 MPa (3.78 E6 psi)
Shear Modulus 10000 MPa (0.14 E6 psi)
Zone Temperature 304 deg K Material Parameter kphi 1.9 Material Parameter kkappa 0.1 Material Parameter qphi 0.2
Tensile Strength 0.4 MPa (58 psi)
in interface properties. Finally the stability and interaction of multiple caverns is studied with particular emphasis on cavern spacing. The geomechanical simulations are performed using FLAC3D, a software package developed by Itasca. The salt is modeled using a modified PWIPP creep model, which includes the initiation of damage, volumetric dilation and ultimately failure as shown by experimental data in the previous section. The non-salt material is described with a traditional Mohr-Coulomb model using published material parameters. A summary of material properties is given in Table 5-4. For each simulation a vertical stress is applied consistent with the density of overlying sediments (i.e. increasing with depth and equivalent to ∫≈ dzgρσ v ). The radial displacement at the outer surface of the model is fixed in order for the horizontal stress to develop in accordance with the vertical load and the proper Poisson ratio for the different lithologic layers. The simulation process may be summarized as follows:
1. Define initial geologic layers and initial stress conditions; 2. Excavate cavern, apply a constant internal cavern pressure equal to the hydrostatic
head of water of 8.8 MPa (1276 psi) at a depth of approximately 762 m (2500 ft); 3. Allow the model to reach equilibrium and subsequently to creep for 3 months; 4. Impose pressure cycling for the duration of 1 year during which the cavern
pressure oscillates between the minimum and maximum pressure. For the baseline case the minimum and maximum pressures are 6.1 MPa (884.5 psi) and 14.9 MPa (2160.5 psi), respectively.
Figure 5-15 shows the pressure cycles for a cavern whose center is located at the depth of 777 m (2549 ft). For each parametric simulation we evaluate the propagation of damage

Geomechanical Analysis of Thin Bedded Salt Caverns
DE-FC26-03NT41813 98
defined as the formation of micro-cracks and relevant displacement components, as well as possible bedding plane slip along the two interfaces.
FLAC3D 2.10
Terralog Technologies USA, Inc.Arcadia, CA 91006
Step 14100010:40:21 Thu Jun 17 2004
Job Title:
History
0.0 0.5 1.0 1.5 2.0 2.5 3.0 3.5 4.0 4.5
Time (days) x10^2
0.6
0.7
0.8
0.9
1.0
1.1
1.2
1.3
1.4
Cavern Pressure (MPa) x10^1
Rev 2 SZZ Stress Zone 10593 Linestyle 5.633e+000 <-> 1.496e+001
Vs. 10 Creep Time 0.000e+000 <-> 5.000e+002
Figure 5-15: Pressure cycles simulated over a one year period.
5.3.2 Single Cavern Baseline Simulation Results We start by first summarizing the results of the baseline model. All material parameters as well as geometric layout and dimensions were summarized in the previous subsections and are not repeated here. Figure 5-16 shows the distribution of shear stress σxz and the interface slip after mechanical equilibrium has been reached. The horizontal axis is indicated by x, the vertical by z. The state of stress shown in Figure 5-16 corresponds to a constant hydrostatic cavern pressure of 8.8 MPa (1276 psi). Due to long term creep, the salt layer away from the cavern boundaries is in a hydrostatic state of stress, i.e. the horizontal stress in the salt layer is much larger than the corresponding horizontal stress in the anhydrite or in the pre-salt. This difference in horizontal stress must be carried by the two interfaces, which obviously may fail when the stress difference exceeds a limit value. The local interface failure for the baseline case at equilibrium is indicated by circles in Figure 5-16. The interface properties in this model depend upon the hydrostatic stress, i.e. the interface strength increases with increasing pressure through a constant friction angle of 15

Geomechanical Analysis of Thin Bedded Salt Caverns
DE-FC26-03NT41813 99
degrees. Therefore, the upper interface is somewhat weaker compared to the interface between the salt and pre-salt layer. This is shown by the localized failure of the interface between salt and anhydrite above the upper right cavern corner, see circles in Figure 5-17. The modified salt model can essentially be divided into three phase. Initially, the material shows a linear elastic response up to a predefined pressure dependent damage surface. During this elastic response the material compacts and upon complete unloading the material returns to the unstressed reference state, i.e. the response is elastic with no accumulation of damage. The second phase can best be described by the formation of permanent micro-cracks and a corresponding volumetric dilation. Unloading during the second phase is still described by the initial material parameters. However the material does not return to the natural stress free configuration. Finally, after a certain amount of cracks have been formed the material fails and the material strength returns to zero. Figure 5-17 shows the propagation of damage in the salt layer after equilibrium is reached with the hydrostatic cavern pressure of 8.8 MPa (1276 psi). The contour plot in Figure 5-17 indicates by shear-p the location where micro-cracks have been formed in the past. Thus, p stands for past. Similarly, shear-n indicates the locations where micro-cracks are currently being formed. Thus, n stands for now. Similarly, slipped in the past and slipped now indicate the location where the interface failed in the past or is failing right now. Figure 5-17 shows the condition of the salt after mechanical equilibrium, corresponding to constant cavern pressure of 8.8 MPa. The highest concentration of micro-cracks is located in close proximity of the vertical cavern wall and extends into the cavern roof. The formation of micro-cracks is equivalent to a reduction in the material stiffness and therefore localization of deformation occurs in these areas. Undamaged salt compacts during loading, salt with micro-cracks, on the other hand, dilate. Figure 5-17 also shows the weak spot of the two material interfaces. This weakness allows slippage of the adjacent materials to occur. Figure 5-18 shows the contour plot of the displacement magnitude for equilibrium with a cavern pressure of 8.8 MPa (1276 psi). The largest displacement is recorded at the cavern roof at an approximate magnitude of 0.01 m (0.0328 ft).
Figure 5-15 shows that, following initial mechanical equilibrium, during the next three months, the cavern pressure is maintained constant and the material is allowed to creep. During these three months the magnitude of the deviatoric stress difference reduces, i.e. the state of stress moves closer to hydrostatic. In other words, no additional micro-cracks are generated. After the three month, the internal cavern pressure is reduced to the minimum predefined value of 6.1 MPa (884.5 psi). The lower limit of the cavern pressure is the most critical parameter and of upper most interest and importance to the user. Reducing the cavern pressure has the following implications:

Geomechanical Analysis of Thin Bedded Salt Caverns
DE-FC26-03NT41813 100
• The state of stress in the salt in close proximity to the cavern is no longer hydrostatic. This implies that additional damage in the form of micro-cracks may occur.
• An increase in deviatoric stress implies an increase in creep deformation and therefore faster cavern closure. In addition to a faster cavern closure, localized tensile stresses may develop in the cavern roof and side wall with possible tensile fracture and possible cavern collapse.
• A lower pressure in the two interfaces. Lower interface pressure implies a reduction in the interface strength. Thus, a lower cavern pressure increases the likelihood of interface slippage. Interface slippage implies faster cavern closer and possible roof instability.
After one year of pressure cycling the interface slippage propagates in the upper and lower interface as clearly indicated in Figure 5-19. This can be explained since the interface strength is pressure dependent and therefore the amount of damage in the interface depends directly on the minimum value of the cavern pressure. Figure 5-19 also shows that the shear deformation propagates over a wider area, even though the magnitude of the shear stress remains approximately the same. Due to the viscoelastic response of salt, stress redistribution occurs and no additional micro-cracks are formed in the salt due to pressure cycling, compare Figure 5-17 with Figure 5-20. The roof displacement due to cyclic operation over a one year period increases slightly, see Figure 5-21. The largest displacement now occurs along the vertical sidewall.
Figure 5-16: Contour plot of equilibrium shear stress and interface slip for baseline
model with H/D = (1/2) for a hydrostatic cavern pressure of 8.8 MPa (1276 psi).
Terralog Technologies USA, Inc.Terralog Technologies USA, Inc.

Geomechanical Analysis of Thin Bedded Salt Caverns
DE-FC26-03NT41813 101
Figure 5-17: Spatial distribution of micro-cracks for the baseline model in equilibrium with a hydrostatic cavern pressure of 8.8 MPa (1276 psi).
Figure 5-18: Contour plot of displacement magnitude for baseline model in equilibrium with a hydrostatic cavern pressure of 8.8 MPa (1276 psi).
Terralog Technologies USA, Inc.Terralog Technologies USA, Inc.
Terralog Technologies USA, Inc.Terralog Technologies USA, Inc.

Geomechanical Analysis of Thin Bedded Salt Caverns
DE-FC26-03NT41813 102
Figure 5-19: Contour plot of shear stress and location of interface slip for baseline model after 1 year of pressure cycling.
Figure 5-20: Spatial distribution of damage in form of micro-cracks and location of interface slippage for baseline model after 1 year pressure cycling.
Terralog Technologies USA, Inc.Terralog Technologies USA, Inc.
Terralog Technologies USA, Inc.Terralog Technologies USA, Inc.

Geomechanical Analysis of Thin Bedded Salt Caverns
DE-FC26-03NT41813 103
Terralog Technologies USA, Inc.Terralog Technologies USA, Inc.
Figure 5-21: Contour plot of displacement magnitude and location of interface slippage for baseline model after 1 year pressure cycling.
5.3.3 Creep Deformation in Baseline Model
We have seen in the previous subsection (see Figure 5-20 for example), that pressure cycling does not increase the amount of micro-cracks around the cavern. It is however well known that salt creeps and the magnitude depends on the magnitude of the deviatoric stress, see Equation (8) in Section 6. Of particular interest is therefore the long-term response of the single cavern to creep. Assume that the cavern pressure is constant over time and equal to 8.8 MPa (1276 psi). The vertical displacement component of the cavern roof generated by creep is shown in Figure 5-22 over a 15 year period, where the units of the vertical displacement are meter and the creep time is given in days. The recording of the creep displacement shown in Figure 5-22 is initiated after static equilibrium is reached, which is the reason why the graph does not start at the origin. This roof displacement and the corresponding cavern closure are therefore associated with creep deformation.
Figure 5-22 also shows that the creep rate, as expected, reduces with time and approaches the constant secondary creep rate.

Geomechanical Analysis of Thin Bedded Salt Caverns
DE-FC26-03NT41813 104
Figure 5-22: Vertical displacement of the cavern roof over 5-year period due to
creep. Cavern pressure is constant and equal to 8.8 MPa (1276 psi).
5.3.4 Influence of Cavern Pressure on Salt Stress and Stability In addition to pressure cycling described above, two additional operational situations are considered with the primary objective to analyze the stress distribution in salt and cavern roof stability. Both simulations involve constant cavern pressures and extend over a one year period in order to allow comparison with previous results. The first case involves a constant pressure of 8.8 MPa (1276 psi), the second involves a constant cavern pressure of 4.4 MPa (638 psi). The cavern pressure of 8.8 MPa (1276 psi) generates a nearly hydrostatic state of stress in proximity to the cavern. After the initial equilibrium condition is reached, no additional time dependent effects will be accumulated over a one year simulation. In fact, if the state of stress is close to hydrostatic, no micro-cracks will be generated over time and the strain due to creep essentially vanishes. This is best seen by comparing the shear stress distribution in Figure 5-23 with the distribution in Figure 5-19 and Figure 5-16. Similar conclusions are obtained by comparing with Figure 5-20 and Figure 5-17. Also, due to a constant hydrostatic cavern pressure of 8.8 MPa (1276 psi), the interface strength is capable of supporting the difference in horizontal stress between the salt layer and the surrounding material. Figure 5-23 shows the localized area where slippage of the interface occurred. It is less compared to the slippage after a one year of pressure cycling, see Figure 5-19. Finally, Figure 5-25 shows that the vertical displacement after one year

Geomechanical Analysis of Thin Bedded Salt Caverns
DE-FC26-03NT41813 105
of constant hydrostatic pressure is less compared with the displacement of a one year cyclic operation. This is to be expected since the vertical displacement depends on the minimum magnitude of the cavern pressure. The maximum displacement reduces to 0.018 m (0.06 ft) for constant hydrostatic pressure over a one year period. Lowering the cavern pressure to 4.4 MPa (638 psi), for example, the material in proximity to the cavern is not close to a state of hydrostatic stress and shear induced micro-cracks propagate through the entire roof thickness, cavern floor and extend substantially in lateral direction, see Figure 5-26. Depending on the magnitude of the cracks, the material may fail and the cavern collapse. A possible failure mode is collapse of the side wall, the cavern roof or both. This response is amplified by an extended slippage along the two interfaces, see Figure 5-26. Reducing the pressure to 4.4 MPa (638 psi) over a one year period increases the displacement magnitude by a factor of 3 to 0.055 m (0.1804 ft), see Figure 5-27.
Figure 5-23: Contour plot of the shear stress around the cavern (H/D=1/2) after one year of operation at a hydrostatic pressure of 8.8 MPa (1276 psi).
Terralog Technologies USA, Inc.Terralog Technologies USA, Inc.

Geomechanical Analysis of Thin Bedded Salt Caverns
DE-FC26-03NT41813 106
Figure 5-24: Contour plot of damage around the cavern (H/D=1/2) after one year of operation at a hydrostatic pressure of 8.8 MPa (1276 psi).
Figure 5-25: Contour plot of displacement magnitude of a cavern with H/D ratio of (1/2) after one year of operation at a hydrostatic pressure of 8.8 MPa (1276 psi).
Terralog Technologies USA, Inc.Terralog Technologies USA, Inc.
Terralog Technologies USA, Inc.Terralog Technologies USA, Inc.

Geomechanical Analysis of Thin Bedded Salt Caverns
DE-FC26-03NT41813 107
Figure 5-26: Propagation of micro-cracks around the cavern (H/D=1/2) and location of slippage after one year of operation at a pressure drawdown to 4.4 MPa (638 psi).
Figure 5-27: Displacement magnitude and location of slippage after one year of operation at a pressure drawdown to 4.4 MPa (638 psi).
Terralog Technologies USA, Inc.Terralog Technologies USA, Inc.
Terralog Technologies USA, Inc.Terralog Technologies USA, Inc.

Geomechanical Analysis of Thin Bedded Salt Caverns
DE-FC26-03NT41813 108
5.3.5 Influence of Cavern Height to Diameter Ratio on Cavern Deformation and Stability
The effect of cavern size, expressed in terms of the Height/Diameter (H/D) ratio, on cavern stability is investigated next. H/D ratios vary from the one used in the baseline model (1/2) to a larger value such as (1/4) and to a smaller ratio of (1/1). In all cases the height of the cavern is kept constant, i.e. H = 30 m (98.4 ft). Both, a cyclic pressure operation and a direct pressure drawdown to 4.4 MPa (638 psi) are simulated. The distribution of damage obtained from the cavern with H/D ratio of (1/4) subjected to a 1 year pressure cycling operation is shown in Figure 5-28 and should be compared with the results of the baseline case in Figure 5-20. It shows that the micro-cracks in the roof and the floor region are more localized and also extend over a larger region. Also, the region where slippage occurs in the two interfaces is more extended compared to the baseline case. It is interesting to note that the maximum displacement component increases from 0.03 m (0.0984 ft) in the baseline case shown in Figure 5-21 to only 0.04 m (0.13 ft), see Figure 5-29. Figure 5-30 shows the region with micro-cracks for a cavern with H/D ratio of (1/1) after a 1 year of pressure cycling operation. Compared to the base line case, the damaged region is smaller and involves essentially the vertical cavern wall. The material slippage, again after one year of pressure cycling, is located in the upper interface only. The contour plot of the displacement magnitude for this cavern ratio in Figure 5-31 shows that the maximum displacement magnitude after one year of pressure cycling operation reduces 0.02 m (0.0656 ft). Similar to the baseline case, the two cavern geometries with H/D ratios of (1/4) and (1/1) are analyzed for a cavern pressure drawdown to 4.4 MPa (638 psi) over a one year period during which creep deformation occurs. In both cases, see Figure 5-32 and Figure 5-34, the regions with micro-cracks extend through the entire roof thickness and floor, as well as a substantial amount in the radial direction. For the cavern with H/D ratio of (1/4) the displacement magnitude increases substantially to 0.15 m (0.49 ft), see Figure 5-33. The maximum displacement magnitude for a (1/1) cavern with constant pressure of 4.4 MPa (638 psi), shown in Figure 5-34, increases to 0.08 m (0.26 ft) over the same one year period. Again, this analysis shows that the most critical parameter is the lower pressure limit at which the cavern operates.

Geomechanical Analysis of Thin Bedded Salt Caverns
DE-FC26-03NT41813 109
Figure 5-28: Extent of damage for a larger cavern with (H/D=1/4) after 1 year of cyclic pressure operations.
Figure 5-29: Contour plot of displacement magnitude of larger cavern with (H/D=1/4) after 1 year of cyclic pressure operations.
Terralog Technologies USA, Inc.Terralog Technologies USA, Inc.
Terralog Technologies USA, Inc.Terralog Technologies USA, Inc.

Geomechanical Analysis of Thin Bedded Salt Caverns
DE-FC26-03NT41813 110
Figure 5-30: Distribution of micro-cracks for the cavern with H/D=(1/1) after 1 year of cyclic pressure operations.
Figure 5-31: Contour plot of displacement magnitude for the cavern with H/D=(1/1) after 1 year of cyclic pressure operations.
Terralog Technologies USA, Inc.Terralog Technologies USA, Inc.
Terralog Technologies USA, Inc.Terralog Technologies USA, Inc.

Geomechanical Analysis of Thin Bedded Salt Caverns
DE-FC26-03NT41813 111
Figure 5-32: Damaged regions and location of interface slip for a larger cavern with H/D=(1/4) after a 1 year operation with pressure drawdown to 4.4 MPa (638 psi).
Figure 5-33: Contour plot of displacement magnitude for a larger cavern with H/D=(1/4) after a 1 year operation with pressure drawdown to 4.4 MPa (638 psi).
Terralog Technologies USA, Inc.Terralog Technologies USA, Inc.
Terralog Technologies USA, Inc.Terralog Technologies USA, Inc.

Geomechanical Analysis of Thin Bedded Salt Caverns
DE-FC26-03NT41813 112
Figure 5-34: Distribution of micro-cracks and interface slip of a cavern with H/D ratio of (1/1) after 1 year operation with pressure drawdown to 4.4 MPa (638 psi).
Figure 5-35: Contour plot of displacement magnitude of a cavern with H/D ratio of (1/1) after 1 year operation with pressure drawdown to 4.4 MPa (638 psi).
Terralog Technologies USA, Inc.Terralog Technologies USA, Inc.
Terralog Technologies USA, Inc.Terralog Technologies USA, Inc.

Geomechanical Analysis of Thin Bedded Salt Caverns
DE-FC26-03NT41813 113
5.3.6 Influence of Overburden Stiffness on Cavern Behaviors In the baseline case we considered a 5 m thick anhydrite layer and a 745 m clastic overburden with stiffness properties listed in Table 5-4. In this subsection we reduce the stiffness of the overburden by a factor of 10 and determine the amount of damage generated around the cavern and the extension of interface slip. All remaining model parameters remain unchanged and pressure cycling over a one year period is assumed. Figure 5-36 shows the regions where shear damage occurred. In view of the priority given to this study, we do not focus on the damage in the overburden but consider regions close to the cavern only. It is interesting to observe the tensile failure of the anhydrite layer. This is not unexpected since a substantial part of the overburden weight is now transferred to the stiffer anhydrite and ultimately to the cavern roof. Tensile failure in the anhydrite layer implies an increase in the vertical displacement of the cavern roof and thus more damage in the salt itself, see Figure 5-36 and Figure 5-37. The vertical displacement of the cavern roof increases to 0.14 m (0.46 ft). Extension of slippage in the interface between salt and anhydrite now covers the entire cavern cross section. As may be expected, the stiffness of the overburden is a significant factor in evaluating roof stability of caverns.
Figure 5-36: Tensile failure in the anhydrite layer, distribution of micro-cracks in
the salt and location of interface slip with reduced overburden stiffness.

Geomechanical Analysis of Thin Bedded Salt Caverns
DE-FC26-03NT41813 114
Figure 5-37: Contour plot of displacement magnitude and location of interface slip
with reduced overburden stiffness.
5.3.7 Influence of Roof Thickness on Cavern Deformation and Stability
In this parametric simulation, the understanding of the effect of salt roof thickness on the on the overall cavern response and on the extension of damage is of primary importance. In this subsection we therefore compare the cavern response, using a roof thickness of 24 m (80 ft), to the base line case. We recall that the baseline case has a roof thickness of 12 m (40 ft). Figure 5-38 shows that the amount of damage in the roof is substantially reduced when compared to the damage in the baseline case, see Figure 5-20. There does not seem to be much of a reduction along the vertical wall of the cavern. Interface slip is still present on the interface between salt and anhydrite layer. Also, it is interesting to see that there is an increase of the vertical displacement of the cavern roof compared with the baseline case, see Figure 5-21 and Figure 5-39. The lateral displacement remains about the same.

Geomechanical Analysis of Thin Bedded Salt Caverns
DE-FC26-03NT41813 115
FLAC3D 2.10
Terralog Technologies, Inc. USAArcadia, CA
Step 147000 Model Perspective14:14:08 Thu Dec 09 2004
Center: X: 3.384e+001 Y: 4.056e+001 Z: 7.750e+002
Rotation: X: 180.000 Y: 0.000 Z: 350.000
Dist: 3.223e+003 Mag.: 7.81Ang.: 22.500
Job Title: Typ2B_NM_Cyclic_Nov24: H/D=1/2, Roof=24.4m, Mat Mod Nov 17, Cyclic Cav
Block StateNoneshear-p
Interface Shear Slipslipped nowslipped in past
Figure 5-38: Regions of micro-cracks and extension of interface slip for cavern
geometry with double roof thickness after one year of pressure cycling operation.
FLAC3D 2.10
Terralog Technologies, Inc. USAArcadia, CA
Step 147000 Model Perspective16:26:29 Mon Dec 13 2004
Center: X: 3.384e+001 Y: 4.056e+001 Z: 7.750e+002
Rotation: X: 180.000 Y: 0.000 Z: 350.000
Dist: 3.223e+003 Mag.: 8.71Ang.: 22.500
Job Title: Typ2B_NM_Cyclic_Nov24: H/D=1/2, Roof=24.4m, Mat Mod Nov 17, Cyclic Cav
Contour of Displacement Mag. Magfac = 0.000e+000
4.2415e-004 to 2.5000e-003 2.5000e-003 to 5.0000e-003 5.0000e-003 to 7.5000e-003 7.5000e-003 to 1.0000e-002 1.0000e-002 to 1.2500e-002 1.2500e-002 to 1.5000e-002 1.5000e-002 to 1.7500e-002 1.7500e-002 to 2.0000e-002 2.0000e-002 to 2.2500e-002 2.2500e-002 to 2.5000e-002 2.5000e-002 to 2.7500e-002 2.7500e-002 to 3.0000e-002 3.0000e-002 to 3.1930e-002
Interval = 2.5e-003
Interface Shear Slipslipped nowslipped in past
Figure 5-39: Displacement magnitude and extension of interface slip for cavern
geometry with double roof thickness after one year of pressure cycling operation.
5.3.8 Influence of Interface Properties on Cavern Stability and Interface Slip In this example, the effect of the interface strength on the propagation of damage in the salt surrounding the cavern is being investigated. As mentioned before, the interface

Geomechanical Analysis of Thin Bedded Salt Caverns
DE-FC26-03NT41813 116
strength depends directly on the pressure generated in the interface, i.e. the slip surface is described by a constant friction angle of 15 degrees. The results shown in Figure 5-40 are obtained by reducing the interface friction from the original 15 degrees to 5 degrees. Again, a one year pressure cycling period is considered. Figure 5-40 clearly shows the increased area where interface slip occurs in the top as well as in the bottom interface. This extended slippage zone implies that the state of stress in the cavern roof and cavern floor increases and the damaged regions extend compared to the baseline case, compare with Figure 5-20. As expected, the damage in the side wall does not increase compared to the base line case. The increased amount of damage is also seen when comparing the displacement magnitude to the baseline case, in particular the vertical displacement component of the cavern roof, see Figure 5-21 and Figure 5-41.
Figure 5-40: Regions of micro-cracks and extension of interface slip for softer interface properties (Friction angle reduced to 5 degrees).
Terralog Technologies USA, Inc.Terralog Technologies USA, Inc.

Geomechanical Analysis of Thin Bedded Salt Caverns
DE-FC26-03NT41813 117
Figure 5-41: Contour plot of displacement magnitude for softer interface properties (Friction angle reduced to 5 degrees).
5.4 Multiple Horizontal Cavern Geomechanical Models This section evaluates the interaction of multiple horizontal bedded salt caverns with unique salt and non-salt material properties in the Permian, Michigan and Appalachian Basins. The emphasis will be to determine the minimum safe distance of multiple caverns without compromising safety issues. Cost benefits may be obtained by increasing the number of horizontal caverns if cavern stability and storage losses due to neighboring caverns communication can be avoided. Terralog has developed full three dimensional geomechanical models of multiple horizontal caverns to evaluate the complex interaction generated by the close proximity of the caverns. Each simulation is subjected to cavern pressure cycling and long term salt creep.
5.4.1 Multiple Horizontal Cavern Model Description and Simulation Matrix Numerical models of a variety of multiple horizontal caverns configurations are developed to investigate cavern integrity and interaction between nearby caverns. Table 5-5 summarizes the main parameters of this investigation. The geometric layout of each cavern is given by an H/D ratio of (1/2), i.e. a total height of 30 m (98.4 ft) and a diameter of 60 m (196.8 ft). These dimensions correspond to a cavern volume of 84,780 cubic meters (2,991,679 ft3). Each cavern simulation involves one year of pressure cycling at a constant temperature of 31 degrees Celsius (304 degrees Kelvin) and with minimum, mean, and maximum cavern pressures equal to the single cavern studied
Terralog Technologies USA, Inc.Terralog Technologies USA, Inc.

Geomechanical Analysis of Thin Bedded Salt Caverns
DE-FC26-03NT41813 118
earlier. The baseline case is given by two identical horizontal caverns located at a center-to-center distance of 120 m (393.6 ft), equal to 2 cavern diameters. Figure 5-42 shows the configuration of the three dimensional multiple horizontal cavern baseline model. Table 5-5: Simulation matrix for multiple horizontal caverns numerical investigations.
Simulation Number
Number of Caverns
Cavern Height
Cavern Diameter
Center-Center Distance Pressure
1 2 30 m (98.4 ft)
60 m (196.8 ft)
120 m (393.6 ft) Hydrostatic
2 2 30 m (98.4 ft)
60 m (196.8 ft)
120 m (393.6 ft) Cyclic
3 2 30 m (98.4 ft)
60 m (196.8 ft)
180 m (590.4 ft) Hydrostatic
4 2 30 m (98.4 ft)
60 m (196.8 ft)
180 m (590.4 ft) Cyclic

Geomechanical Analysis of Thin Bedded Salt Caverns
DE-FC26-03NT41813 119
Figure 5-42: Three dimensional multiple horizontal caverns baseline model.
5.4.2 Multiple Horizontal Cavern Baseline Simulation Results
In this subsection we summarize the numerical results of the baseline model comprised of two identical caverns with a center to center distance of 120 m (393.6 ft) (equal to two cavern diameters) and 1-year cyclic pressure operations. Similar to the one cavern investigation considered in the previous section, we first determine the state of stress in the salt and overburden in equilibrium with a hydrostatic cavern pressure of 8.8 MPa (1276 psi). We select the displacement magnitude as a kinematics quantity to describe and visualize cavern interaction. Figure 5-43 shows the displacement magnitude at equilibrium with a hydrostatic cavern pressure of 8.8 MPa (1276 psi). Even though the magnitude of the displacement is non-zero in the intermediate region of the two caverns, the magnitude of the induced stress is small and stays in the elastic range, i.e. the stresses do no generate any damage in this region, see Figure 5-44. This figure also shows that micro-cracks are generated only in proximity of the caverns and the extend of slippage between the cavern roof and the anhydrite layer.
30 m
120 m120 m
230 m
60 m
Cavern
Diameter
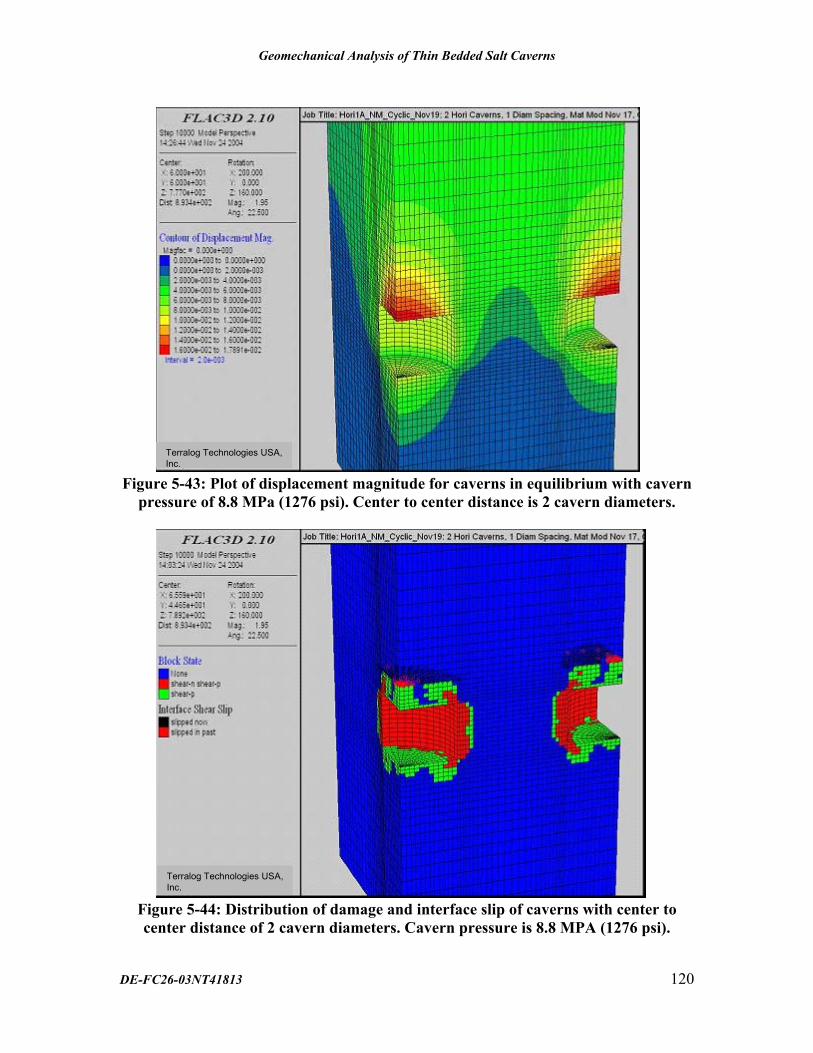
Geomechanical Analysis of Thin Bedded Salt Caverns
DE-FC26-03NT41813 120
Figure 5-43: Plot of displacement magnitude for caverns in equilibrium with cavern pressure of 8.8 MPa (1276 psi). Center to center distance is 2 cavern diameters.
Figure 5-44: Distribution of damage and interface slip of caverns with center to center distance of 2 cavern diameters. Cavern pressure is 8.8 MPA (1276 psi).
Terralog Technologies USA, Inc.Terralog Technologies USA, Inc.
Terralog Technologies USA, Inc.Terralog Technologies USA, Inc.

Geomechanical Analysis of Thin Bedded Salt Caverns
DE-FC26-03NT41813 121
Figure 5-45: Contour plot of displacement magnitude after 1 year of pressure cycling. Center to center distance is 2 cavern diameters.
Figure 5-46: Distribution of micro-cracks and location of interface slip after 1 year of pressure cycling. Center to center distance is 2 cavern diameters.
Terralog Technologies USA, Inc.Terralog Technologies USA, Inc.
Terralog Technologies USA, Inc.Terralog Technologies USA, Inc.

Geomechanical Analysis of Thin Bedded Salt Caverns
DE-FC26-03NT41813 122
Figure 5-45 and Figure 5-46 show the results of the baseline case after 1 year of pressure cycling. From Figure 5-43 and Figure 5-45, an increase in the lateral displacement of the cavern side wall from approximately 0.01 m (0.0328 ft) to 0.09 m (0.2952 ft) can be noted. An increase in the vertical displacement of the cavern roof also occurs. However, no additional cracks are generated. This may be observed by comparing Figure 5-44 and Figure 5-46. Figure 5-46 can be explained by the viscous response of salt. Creep tends to reduce the magnitude of any deviatoric stress component in the salt, which ultimately approaches a pure hydrostatic state of stress. Therefore, the cavern closure in this particular case is due to creep deformation only and not to additional damage in the material. Figure 5-44 and Figure 5-46 show that the amount of damage is larger compared to the results of the one cavern baseline case shown in Figure 5-17 and Figure 5-20. The model for the baseline case involving one cavern, whose results were shown in Figure 5-17 and Figure 5-20, assume axisymmetric geometry and loading. The reason for the difference in the amount of damage is in the size of the numerical model. The numerical model used to evaluate the cavern interaction is smaller and the effect of the boundary conditions influences the results in close proximity of the cavern. Based on these results it may be concluded that the interaction of these two caverns, located at a center to center distance of two cavern diameters, does affect the response during pressure cycling. The interaction is best seen by the increase in the lateral wall displacement, but no additional damage is generated.
5.4.3 Influence of Horizontal Caverns Separation Distance on Cavern Deformation and Stability
In this subsection, we investigate the effect of horizontal cavern distance on the displacement magnitude and on the accumulation of damage. We increase the center-to-center distance of two identical caverns to 180 m (590.4 ft), which is equivalent to three cavern diameters. Figure 5-47, which is the equilibrium configuration with cavern pressure of 8.8 MPa (1276 psi), shows that the magnitude of the displacement vanishes in the part of the region between the two caverns, compare with Figure 5-43. However, it is interesting to observe that at equilibrium, the vertical roof displacement and the lateral movement of the side wall coincides with the one found in our baseline case. The displacement magnitude increases after a one-year pressure cycling, see Figure 5-48. This applies for the cavern roof as well as for the side wall. However, it should be pointed out that the lateral movement of the vertical wall is somewhat smaller when compared to the baseline model, see Figure 5-45.

Geomechanical Analysis of Thin Bedded Salt Caverns
DE-FC26-03NT41813 123
Figure 5-47: Plot of displacement magnitude for caverns in equilibrium with cavern pressure of 8.8 MPa (1276 psi). Center to center distance is 3 cavern diameters.
Figure 5-48: Plot of displacement magnitude for caverns after one year of pressure cycling. Center to center distance is 3 cavern diameters.
Terralog Technologies USA, Inc.Terralog Technologies USA, Inc.
Terralog Technologies USA, Inc.Terralog Technologies USA, Inc.

Geomechanical Analysis of Thin Bedded Salt Caverns
DE-FC26-03NT41813 124
5.5 Conclusion and Discussion Designing bedded salt caverns for natural gas and liquid storage should take into account the mechanical properties of natural bedded salt in order to perform accurate numerical simulations. In this research, a modified creep viscoplastic model has been developed and implemented in Flac3D to simulate the response of cavern embedded into layered salt of the Permian, Michigan and Appalachian Basins. The original viscoplastic model is based on an empirical creep law developed for Waste Isolation Pilot Plant (WIPP) Program and combined with the Drucker-Prager yield model to describe damage. Experimental data for the Permian salt provided by Pfeifle et al. 1983, are used to validate the basic assumptions made in the development of the damage model. A number of one element numerical simulations have been performed to calibrate the model, such as uniaxial tension test, uniaxial compression test, triaxial compression test and creep test. The numerical results show that the modified creep model approximates experimental data reasonable well. With the modified creep viscoplastic model, bedded salt caverns for natural gas storage are simulated numerically considering various layer properties, e.g. salt, anhydrite layer, overburden clastic, and underlying pre-salt. A baseline model using a predefined cyclic pressure history is used to determine the stress distribution around the cavern and the distribution of damage with possible implication on the salt roof stability. Different design parameters are varied to determine the influence on the accumulation of damage in salt and on the deformation of the salt cavern. These are the lower limit of the cavern pressure, the cavern pressure history, operational conditions, and cavern size expressed in terms of height/diameter ratio, overburden stiffness, interface properties and roof thickness. The principal objective of this study is to identify how a single design parameter, for example pressure cycles, direct pressure drawdown or overburden stiffness affects the stability and deformation of the cavern with a given geometrical layout. Numerical models are also developed to analyze and to determine the interaction of multiple caverns. In particular, the influence of the center to center distance of multiple caverns on displacement magnitude and accumulation of damage, are investigated. We also consider the mechanical properties and the elasto-plastic response of non-salt strata above and below the salt cavern. Various formations are simulated in FLAC3D, including an elasto-plastic anhydrite layer, a Mohr-Coulomb type overburden clastic and an elastic underlying presalt. The simulations performed can be divided into two main categories: one with a single cavern, the other involving multiple caverns. For both categories a baseline 3D model is provided and the results for the stress distribution around the cavern and the accumulation of damage for two values of constant pressure as well as for cyclic pressure operations summarized. The effect of these design parameters can be quantified by comparing the results of the baseline models with those of different cavern configurations and operational conditions.

Geomechanical Analysis of Thin Bedded Salt Caverns
DE-FC26-03NT41813 125
The numerical simulations for the single and multiple cavern models involve an initial phase where mechanical equilibrium is being established. Following mechanical equilibrium for a constant cavern pressure, three months of creep deformation is simulated. During this time, the state of equilibrium stress changes, high deviatoric stress components get smaller due to creep deformations. In the long term the state of stress in salt becomes, boundary conditions permitting, hydrostatic. After three month of creep deformation, the cavern pressure changes and is subjected to two complete cycles. The baseline model of a single cavern shows, at equilibrium with the hydrostatic cavern pressure, a shear stress distribution around the cavern top and bottom corners. Furthermore, in order to reach equilibrium micro-cracks have been induced around the cavern sidewalls and slippage along the interface between the salt and anhydrite layers occurs. During cyclic pressure operations, no additional micro-cracks are generated. However additional interface slip occurs mainly due to the minimum cavern pressure reached during operations. Additional cavern closure during cycling is primarily due to creep deformation and interface slippage. In addition to pressure cycles, two other pressure operations are analyzed, including hydrostatic pressure at 8.8 MPa (1276 psi) and a direct pressure drawdown to 4.4 MPa (638 psi). All operations are simulated over a one year period. For the hydrostatic pressure the amount of damage around the cavern as well as the amount of slippage does not change over time. This is explained by the fact that both, damage and amount of slippage depend on the minimum cavern pressure encountered during operation. If the cavern pressure is reduced to 4.4 MPa and the cavern response is monitored for a one year period, shear induced micro-cracks propagate through the entire roof thickness, cavern floor and extend substantially in lateral direction. The influence of the cavern size on the amount and distribution of damage is investigated. Different geometries are conveniently expressed through the height to diameter ratio (H/D) and change from the one used in the baseline model (1/2) to the larger value of (1/4) and to the smaller ratio of (1/1). In all cases the height of the cavern is H=30 m (98.4 ft). Both, a cyclic pressure operation and a direct pressure drawdown to 4.4 MPa (638 psi) are analyzed. The amount of damage and interface slippages in the cavern with an H/D ratio of (1/4) after one year of pressure cycling increase and also extend over larger regions. For the smaller cavern with an H/D ratio of (1/1), the damaged region is smaller and involves primarily the vertical wall. Interface slippage occurs only in the interface above the cavern. The response of these models to a pressure drawdown to 4.4 MPa (638 psi) over a one year period is shown and compared to the baseline case. In both geometries, the damage propagates through the entire roof thickness and floor, as well as in the radial direction. Also, the maximum vertical displacement increases substantially when compared to the baseline case. This confirms that fact the most critical parameter is the lower pressure limit at which the cavern operates.

Geomechanical Analysis of Thin Bedded Salt Caverns
DE-FC26-03NT41813 126
The effect of the overburden stiffness on the cavern response shows that by reducing the stiffness by an order of magnitude, for example, a substantial part of the overburden weight is supported by the anhydrite layer and the cavern roof itself. As a consequence the interface and the anhydrite layer fail and the vertical displacement of the cavern roof increases with a corresponding increase in damage and slippage. Doubling the salt roof thickness does reduce the extension of damage in the roof itself. The transfer of horizontal stress between the salt and the anhydrite layer is still in excess of the interface strength, therefore slip conditions are present. Doubling the roof thickness, does not, as expected, influence the response along the vertical cavern wall.
It is difficult to determine accurate interface properties between salt and anhydrite and salt and presalt. In this study to values for the interface friction are assumed. The baseline case uses 15 degrees, the second value considered is 5 degrees to describe the slip surface for the interface. Reducing the interface strength through a reduced friction angle increases the area of slippage in the top as well as in the bottom interface. This increased slippage implies that the damaged regions in salt extend compared to the baseline case. The interaction of multiple horizontal bedded slat caverns is evaluated to determine the minimum save distance without compromising safety issues. Similar to the single cavern analyses, a baseline case is considered, which is first subjected to a hydrostatic pressure loading of 8.8 MPa (1276 psi) and then to pressure cycling over a one year period. The geometric dimensions of each cavern are equal to the baseline case of the single cavern model. However, the important value is the center to center distance, which initially is selected as 120 m (393.6 ft) and corresponds to 2 cavern diameters. Subsequently, to quantify the cavern to cavern interaction, this distance is increased to 180 m (590.4 ft), which corresponds to 3 cavern diameters, see Table 5-5. To describe und visualize the mutual cavern interaction, we select the displacement magnitude as our basic variable. Comparing the corresponding values for the same loading conditions, but different cavern distances, we find that for a distance of 180 m (590.4 ft) all interactions vanish. This is contrary to the results obtained for the 120 m (393.6 ft) center to center distance, where an increase in the lateral wall displacement is noted during pressure cycling. In the latter case, even though the interaction extends throughout the interconnecting region, the generated stresses are small and remain elastic, i.e. no permanent damage. As a conclusion, when multi caverns are present, the acceptance level of certain operational conditions depends not only on formation properties and on the distance between the caverns, but also on how aggressive the operational conditions can be. This should be evaluated with aid of numerical simulations before operations take place.

Geomechanical Analysis of Thin Bedded Salt Caverns
DE-FC26-03NT41813 127
6 Design Considerations Both technical and public requirements should be considered when locating storage caverns and related surface facilities. Technical considerations should include geology, topography, maintenance and effects on other subsurface activities, and safety issues. Public considerations should include monitoring and emergency response requirements. In this section we summarize design guidelines from the Interstate Oil and Gas Commission report on Natural Gas Storage in Salt Caverns (IOGCC; 1998), the Canadian Standards Association report on Storage of Hydrocarbons in Underground Formations (CSA Standard Z341 Series -02 ; 2002), and The Texas Railroad Commission Administrative Code, Title 16, Part 1. We discuss some of these guidelines in the context of simulation results obtained during our current study. 6.1 Site Selection Storage facilities should be located at sites that minimize effects on the surface and subsurface. Consideration should be given to the following:
6.1.1 Site Selection Criteria Underground storage operations should not adversely affect but should provide adequate protection to human and the environment. The following factors should be considered:
• Proximity to populated areas; • Concentrated industrial facilities; • Public rights of ways; • Environmentally sensitive wetlands or waters including underground sources of
drinking water; • Other subsurface activities such as neighboring caverns or hydrocarbon wells; • Present and predicted development of adjacent properties and municipal
boundaries; • Topography of the site and regional drainage; • Handling and disposal of brine produced by storage operations; • Access for emergency response; • Local climate.
6.1.2 Proximity and Risk to and from other Industrial Facilities Pipelines, railways, roadways, electrical lines, utilities and facilities with rights of way may affect the location or operation of the storage facility. The storage facilities should be protected from any accidental damage from the industrial facilities by distance and/or barricades.

Geomechanical Analysis of Thin Bedded Salt Caverns
DE-FC26-03NT41813 128
6.1.3 Cavern Spacing Considerations Our current simulation results show significant stress and deformation changes, and some salt damage, extends about a diameter away from each cavern, and would therefore overlap if spacing is 2:1 or less and produce cavern stability and communication risks. The IOGCC (1998) guidelines suggest that the ratio of S/D should be at least 4:1, where S equals the center to center distance of two caverns and D equals the averaged value of the maximum diameter of each of the two caverns. These are reasonable and conservative guidelines for most conditions, that can perhaps be relaxed on occasion under certain conditions with appropriate analysis. Our simulations indicate that for the conditions considered in this study, for example, a separation distance between two adjacent caverns of at least 3:1 would be sufficient to isolate effects from each cavern. We further point out that risks will increase if there is significant differences in cavern pressure between adjacent caverns (for example when placing a gas storage cavern that might cycle between high and low pressure near a liquid storage cavern that remains at hydrostatic pressure). IOGCC guidelines also suggest that caverns should be sited at least 30 m (100 ft) from the property boundary, and ideally should be sited at least twice the maximum diameter of the cavern.
6.2 Design and Development Criteria The design of the cavern should include a detailed Area of Review of the surrounding subsurface activities, geological and geophysical studies and operation criteria. These are discussed below.
6.2.1 Assessment of Neighboring Activities An AOR (Area of Review) of all subsurface activities including active and abandoned wells within 1 km (1/2 mile) from the perimeter of the storage zone should be reviewed for effect on operations, potential gas migration, general safety, potential loss of products, mode of operation, maximum and minimum operating pressures, subsidence and environmental impacts. Active or abandoned conventional subsurface mining activities within 20 km (12 miles) radius should also be reviewed.
6.2.2 Geotechnical Studies Geological and geophysical review on 1 km (1/2 mile) radius from the subsurface perimeter of the storage cavern should be performed to assess the suitability of the gas storage cavern operation. This should include assessment of the regional and local tectonic activity, regional and local faulting, structure anomalies, and formation evaluation from surface to 100 m (300 ft) below the storage zone. This study should include containment properties of the surrounding formation, identification of any potential permeable zones, regional stresses and strains, mechanical and chemical

Geomechanical Analysis of Thin Bedded Salt Caverns
DE-FC26-03NT41813 129
properties of the salt and confining rock formations, cavern closure and stability, surface subsidence and effects from neighboring activities. Geologic cross sections, maps and isopachs should show a distance of 1 km (1/2 mile) around the perimeter of the storage zone. The map should show all wells, faults and other artificial structures drawn on top and base of the storage zone. Map showing any fluid interfaces should also be included.
6.2.3 Subsidence Potential ground subsidence for the proposed cavern site should be assessed using subsidence modeling. If the assessment indicates significant subsidence overlying the proposed storage operation, the operator should design and implement a subsidence monitoring program and conduct annual surveys to measure changes in the elevation.
6.2.4 Operating Pressure
Operating pressure limits should be based on existing regulations, and/or site specific geomechanical studies and testing. Our own analyses and simulations suggest that:
• There will be some risk to fracturing and gas escape if maximum operating pressure exceeds 80% of the fracture pressure of the storage and caprock formation.
• In some conditions there will also be increased risk for cavern stability and salt damage if minimum operating pressures are dropped below about 25% of the lithostatic pressure (or about 0.25 psi/ft or about 5.5 kPa/m). We compare these observations, for example to the Canadian Standards Associations (CSA) where the minimum operating pressure is recommended to be maintained above 3.4 kPa/m of depth to the casing shoe.
6.2.5 Maximum Injection and Withdrawal Rates The maximum injection and withdrawal rates should be based on cavern stability, cavern geomechanical behavior, casing and tubing size and configuration, yield strength, collapse ratings, vibration harmonics and erosion studies.
6.2.6 General Design Conditions Design and construction of the storage facilities should minimize the possibility of exploration, fire damage or damage to the emergency shutdown system. Selection of materials and equipment should take into account depth of storage zone, type of hydrocarbon stored, fugitive emissions, associated fluids produced, washing fluid, operating pressure, surface and subsurface temperature, intended service life of the project and local geology.

Geomechanical Analysis of Thin Bedded Salt Caverns
DE-FC26-03NT41813 130
6.3 Development (Solution Mining) Salt cavern should be developed by solution mining. The cavern shape is critical to the development of the salt caverns. Cavern shape also offers protection from uncontrolled salt dissolution to the cavern roof and casing seat. If the mechanical integrity of a cavern storage system cannot be demonstrated, the cavern shall not be used for hydrocarbon storage.
6.3.1 Cavern Shape Salt caverns should be developed by solution mining with facilitation from computer simulations. The cavern shape can be controlled by hydrocarbon blanket material, water injection rate, salinity of the injected water, water injection and brine removal locations. Evidence of cavern and roof shape control during development can be obtained by monitoring and periodically verifying the roof blanket material location and the total volume of salt removed from the cavern. The flow rate and saturation level of the mining fluids and produced brine should be monitored on a daily basis, while the volume and location of the roof control fluid should be monitored on a monthly basis. The configuration of the roof of each gas storage cavern in bedded salt shall be determined by downhole log or alternate method approved by the regulatory agency at least once every 5 years. A sonar survey of the completed cavern should be performed prior to the commissioning of the storage cavern.
6.3.2 Cavern Integrity Prior to usage, the cavern should be tested for cavern integrity by Mechanical Integrity Test (MIT). MIT will demonstrate the integrity of the wellbore, casing shoe, cavern cavity and wellhead. The MIT should be a nitrogen or gas brine interface test and should be conducted at 1.1 times the maximum operating pressure, but should not be more than 80% of the local formation fracture gradient (CSA, 2002). In bedded salt where permeable interbeds are present, a brine pressure test should also be performed to verify cavern tightness. After the commission of the cavern, periodical testing should be performed to demonstrate the consistency of the cavern integrity. This may include nitrogen or natural gas brine interface tests or shut in gas pressure tests and can be performed at less than the maximum operating pressure.
6.3.3 Stored Fluid as Roof Control When the stored products are intended to be used as the roof control fluid during cavern development, the integrity resting requirements described in Section 6.3.2 above should be met prior to introducing the control fluid to the borehole and starting of solution mining.

Geomechanical Analysis of Thin Bedded Salt Caverns
DE-FC26-03NT41813 131
6.3.4 Intercavern Communication Interconnected caverns should be treated and operated as a cavern gallery with the maximum dimension equal to the largest outside dimension of the gallery. Hydraulic fracturing or uncontrolled coalescence of caverns should not be developed for natural gas storage caverns.

Geomechanical Analysis of Thin Bedded Salt Caverns
DE-FC26-03NT41813 132
7 Step by Step Methodology to Assess Critical Cavern Design There are three basic geomechanical processes that limit maximum and minimum pressures in a bedded salt cavern. These are:
1. The tensile fracturing pressure for the salt material and non-salt interbed materials;
2. The formation stresses, induced by cavern pressure decline or increase, at which bedding plane slip might be induced between heterogeneous material layers;
3. The minimum cavern pressure that might induce roof instability or excessive closure.
Figure 7-1 presents a step-by-step process to assess design and operating conditions for caverns in bedded salt. The basic process involves estimating the current rock strength and formation stress values with the best available data, calculating induced stresses due to cavern creation and pressure cycling, and then comparing the induced stresses to the estimated limiting strength and stress values. The most accurate estimation techniques for the mechanical properties and stress are those encountered first in the diagram (towards the left). The specific steps taken for a given project will depend on the available data and the desired solution accuracy. These design steps may be summarized as follows:
• Evaluate the geologic setting, including detailed stratigraphy, lithology, and number and type of interbeds;
• Determine the mechanical properties of the salt and non-salt interbed materials; • Determine the in situ stresses and fracture pressures for individual formations; • Evaluate fracture pressure variations after cavern development; • Evaluate stresses induced by pressure cycling with geomechanical modeling; • Compare stresses induced by pressure cycling with estimated in situ stresses and
formation fracture pressures; and, • Evaluate bedding plane slip and potential impact on cavern integrity.
We discuss in the following sections each of these steps.

Geomechanical Analysis of Thin Bedded Salt Caverns
DE-FC26-03NT41813 133
Figure 7-1: Step by step methodology for geomechanical analysis of bedded salt
caverns. 7.1 Evaluate Geologic Setting The first requirement is to accurately evaluate the geologic setting, detailing the stratigraphy and lithology for the interval over which the cavern is placed and for the overburden above the cavern. The location and type of non-salt, any non-salt interbeds of significant thickness (greater than a few feet or a few percent of the cavern height) should be identified. The best approach is to evaluate core-data over the entire interval. If that is not available, than log data (gamma, SP, density, acoustic logs) for the local area should be examined. If those are also unavailable, than as a preliminary step, a range of potential stratigraphic models can be assembled from regional geologic data, and evaluated in a parametric mode.
7.2 Evaluate Mechanical Properties for Salt and Non-Salt Interbeds The key mechanical properties required to assess cavern and formation geomechanical response to pressure cycling are the stiffness properties (Young’s modulus and Poisson’s
Evaluate geomechanical response to cavern creation and pressure cycling
Measure stiffness andstrength properties in lab
Measure stiffness andstrength properties in lab
Estimate stiffness and strength propertiesEstimate stiffness and strength properties
Evaluate min and max horiz stress
Evaluate min and max horiz stress
Hyd. Fracture data available ?
Yes
Hyd. Fracture data available ?
Hyd. Fracture data available ?
Yes
Quality leak-off data available ?
Yes
Quality leak-off data available ?
Yes
Constrain stress tensorConstrain stress tensor
Core available ?
Yes
Logs available ?
Yes
No
Breakout/image data available ?
Yes
Breakout/image data available ?
Yes
Constrain stress tensorConstrain stress tensor
No No
Evaluate salt and non-saltMechanical properties
Determine in-situ stresses andformation fracture pressures
Estimate from regional stress data and lithology/depth correlations
Estimate from regional stress data and lithology/depth correlations
( Analytical and Numerical Modeling)( Analytical and Numerical Modeling)
Characterize stratigraphy and lithology
Characterize stratigraphy and lithology
Characterize stratigraphy and lithologyCharacterize stratigraphy and lithology
Core available ?
Yes
Logs available ?
Yes
NoEvaluate Geologic Setting( number and type of interbeds)

Geomechanical Analysis of Thin Bedded Salt Caverns
DE-FC26-03NT41813 134
ratio) and the strength properties (shear strength and friction angle) for the salt and the non-salt interbeds and the creep properties for the salt material. The Young’s modulus prescribes the magnitude of rock strain in one direction induced by stresses in the same direction. The Poisson’s Ratio is a measure of the lateral expansion or contraction of the rock induced by stresses in the vertical direction. The material shear strength determines the amount of shear stress that the rock can withstand at a given confining load before yielding, and the friction angle prescribes how the shear strength increases with confining stress. As shown in Figure 7-1, the most accurate way to estimate rock properties is by direct laboratory measurements on core samples. When core measurements are not available for formation materials, stiffness and strength properties must be estimated from available geophysical log data and lithology correlations from the literature. Because of large uncertainty in these estimation techniques, the analysis results (which scale with stiffness properties) are only qualitative in nature, and should be recognized as order of magnitude type estimates. Rock stiffness properties are primarily determined from acoustic logs; and it is best when both compression and shear velocity data is recorded and they can be calibrated against core data. For an isotropic elastic material the two independent stiffness constants, Young’s Modulus and Poisson’s Ratio, are directly related to the compression and shear wave velocities. Empirical correlations are then used to relate rock strength properties to the stiffness properties or velocities, often with additional clay content and/or porosity dependencies. The fundamental problem in using acoustic logs alone to determine rock properties is that wave velocities are inherently measures of small incremental stress-strain behavior. The properties needed for geomechanical analysis, however, are those associated with large strain behavior. This difference is sometimes framed in terms of dynamic vs. static properties, but more insight is gained by thinking of the differences in terms of small deformation (elastic) and large deformation (inelastic) properties. Moduli determined by acoustic velocities are almost always higher than those determined in large strain laboratory measurements, see, for example, Jizba and Nur, 1990. For soft materials, i.e. those with Young’s Moduli less that about 1E6, adjustments are required to determine equivalent static properties from the measured dynamic properties. The dynamic to static scaling factor for such materials can be on the order of 2 to 10. Fortunately, for low porosity salt materials, static material properties are typically within 20% to 30% of measured dynamic properties. 7.3 Evaluate In-Situ Stresses The preferred technique to determine in situ stresses is through hydraulic fracture stress measurements. If hydraulic fracture measurements are not available, then the analyst should review any available leak-off and borehole breakout data. The final option is to review regional stress data and lithology/depth correlations for the area.

Geomechanical Analysis of Thin Bedded Salt Caverns
DE-FC26-03NT41813 135
Stress estimates obtained from any of these methods are invariably supplemented with data from the literature when available. It is common to assume that the vertical stress is one of the principal stresses and that it is equal to the stress caused by the weight of the overburden material. For example, for the case of intermediate strike-slip to thrust-faulting, the minimum horizontal stress Sh and the maximum horizontal stress SH are both roughly of similar magnitude and are approximately equal to the vertical stress Sv gradient, usually assumed for continental Basins to be about 0.0226 MPa/m (1.0 psi/ft). The gradient of 0.0226 MPa/m (1.0 psi/ft) which is commonly used may be high for regions where there are large intervals of high porosity rocks within the overburden. 7.4 Evaluate Geomechanical Response to Cavern Creation and Pressure
Cycling
To evaluate stresses surrounding the cavern and in the caprock induced by cavern creation and subsequent gas pressure cycling, analytical estimates followed by geomechanical modeling should be employed. The analytical and numerical framework summarized in Section 6 can first be applied to estimate horizontal stresses around the cavern in individual layers. These should then be compared to the far-field horizontal in-situ stresses, and the minimum value used as a fracture pressure limit. A numerical model, of the type described in Section 6 in this report, may then be assembled and applied to investigate cavern closure and formation interface shear arising from expansion and contraction of the cavern during pressure cycling. Input data for the model can be applied from the geologic review, the estimate of mechanical properties and the estimate of stresses determined in the previous steps. When there is uncertainty (as is often the case) in input data, it is useful to perform parametric simulations for a range of assumed properties. The preliminary geomechanical review and simulation results should then be evaluated to answer the following questions:
• Does the proposed maximum cavern pressure exceed the estimated fracture pressure for the weakest lithology?
• Will pressure cycling induce bedding plane slip? If so, how much slip and will that cause potential communication problems (for example with nearby faults or other caverns?
• Are the stresses induced in the overburden enough to cause potential faulting and bedding plane slip, leading to possible roof caving or well casing damage?

Geomechanical Analysis of Thin Bedded Salt Caverns
DE-FC26-03NT41813 136
8 Summary and Conclusions In this final report, Terralog has summarized the geologic conditions, pressure conditions, and critical design factors that may lead to:
• Fracture in heterogeneous materials; • Differential deformation and bedding plane slip; • Layered roof instability; • Provided design recommendations for single and multiple cavern configurations
in various bedded salt environments.
The primary objective of this GTI/DOE project is to increase the gas storage capabilities by providing operators with improved geotechnical design and operating guidelines for thin bedded salt caverns.
Terralog collected and summarized the cavern operations that are currently active in the Midland and Anadarko Basins within the Permian Basin Complex and in the Appalachian and Michigan Basins, and identifies several potential salt layers that can be target for salt cavern development. Terralog has identified a minimum 50 m (165 ft) salt thickness and in minimum 300 m (1,000 ft) depth as ideal for salt cavern location. We have performed and analyzed a number of numerical models to investigate cavern stability issues in thin bedded salt under various cavern configurations and operational conditions. A baseline model with specified cyclic pressure operations is evaluated in terms of rock stresses and salt stability. Different parameters that affect salt stability and deformation of salt cavern, such as cavern pressure, operating conditions, different cavern height/diameter ratios, overburden stiffness, roof thickness, number of caverns and cavern spacing are analyzed. The baseline results indicate high shear stress mainly concentrates around the cavern top and bottom corners. Salt failure mainly occurs around the cavern sidewalls, while interface slippage mainly occurs at the top boundary between the salt formation and the anhydrite roof. With designed cyclic pressure operations, the high shear-stress zones around the top and bottom corners spread out to a wider range, which leads to more slippage along the interface. The magnitude of maximum shear stress does not increase as a consequence of cyclic pressure loading, which results in no additional micro-cracks in the surrounding salt. Besides pressure cycling, two other pressure operations are analyzed, including hydrostatic pressure and a direct pressure drawdown. Cavern pressure equal to hydrostatic pressure results in the least amount of damage, while the worst conditions occurs when cavern pressure has been lowered from hydrostatic 8.8 MPa (1276 psi) to 4.4 MPa (638 psi), which may lead to the cavern collapse. The cyclic pressure operation is acceptable in terms of cavern stability.

Geomechanical Analysis of Thin Bedded Salt Caverns
DE-FC26-03NT41813 137
The effect of cavern size, in terms of a Height/Diameter (H/D) ratio, on the extension of damage in salt is investigated. The results indicate that damage in the roof and floor region is more localized and also involves a larger region next to the side wall. The region where slippage occurs in the two interfaces is more extended compared to the baseline case. When cavern pressure is directly decreased from hydrostatic to 4.4 MPa (638 psi), salt around the caverns is heavily damaged and there is a real risk of collapse no matter the cavern size. When the stiffness of the overburden clastic formation is reduced, a substantial amount of the overburden weight is transferred to the cavern roof. This will be subjected to large deformation with a corresponding increase in damaged regions. Therefore soft overburden has a negative affect on cavern stability. The influence of the salt roof thickness on cavern response is of primary interest. To directly evaluate the change in accumulated damage, a numerical model with double roof thickness is compared to the baseline case. We found that the damage in the roof is reduced, however it does not seem to affect the interface slip and the damage along the vertical cavern wall. Numerical results involving two horizontal caverns with a center to center distance of 2 cavern diameters indicate an interaction between the two caverns. The interaction manifests itself in an increase in lateral wall displacement. When the spacing between the caverns increases to three of cavern diameter, such effect becomes negligible under the specified one year cyclic pressure operations. As a conclusion, when multi caverns are present, the acceptance level of certain operational conditions depends not only on formation properties and the distance between the caverns, but also on how aggressive the operational conditions can be. This should be evaluated with aid of numerical simulations before operations can take place. We have summarized the general industry guidelines compiled from IOGCC (1998), CSA Standard Z341 Series -02 (2002) and Railroad Commission of Texas, and we have discussed these in the context of our current simulation results. Finally, Terralog has provided a Step by Step methodology to assess critical cavern design parameters for thin bedded salt formations. The basic process involves estimation of the current salt strength and formation stress values using the best available data, calculating induced stresses due to cavern creation and pressure cycling, and then comparing the equilibrium stresses to the limiting strength and stress values of salt. The specific steps taken for a given project will depend on the available data and the desired solution accuracy.

Geomechanical Analysis of Thin Bedded Salt Caverns
DE-FC26-03NT41813 138
This report summarizes our research results and modeling efforts to improve the understanding of cavern stability in thin bedded salt caverns for gas storage. It provides the operators with geotechnical design and operating considerations that are based on 3D numerical simulations.

Geomechanical Analysis of Thin Bedded Salt Caverns
DE-FC26-03NT41813 139
9 References CSA, 2002, Z341 Series -02, Storage of Hydrocarbons in Underground Formations, Canadian Standards Association, Kalra, Sudi edited, 134pp. Cromwell, D.W., 1984, The Upper Delaware Mountain Group, Permian (Guadalupian), southeast New Mexico and West Texas in Mazzullo, S.J., ed., The Geologic Evolution of the Permian Basin section, Midland, Texas, Permian Basin Section – SEPM, Symposium, p.32-34 DeVries K.L., Mellegard K.D., Callahan G.D., 2002, Salt Damage Criterion Proof-of-Concept Research, Technical Report RSI-1675, November 2002. Fossum A.F. and Fredrich J.T., 2002, Salt mechanics primer for near-salt and sub-salt deepwater Gulf of Mexico field developments. SANDIA Report, SANDIA 2002-2063, July 2002. Gustavson, T.C., Finley, R.J. and McGillis, K.A., 1980, Regional Dissolution of Permian Salt in the Anadarko, Dalhart and Palo Duro Basins of the Texas Panhandle, Texas Bureau of Economic Geology, Report of Investigations No. 106
Hoffman E.L. and Ehgartner B.L., 1992, Evaluating the Effects of the Number of Caverns on the Performance of Underground Oil Storage Facilities. Sandia Report, SANDIA-92-2183C, 1992 Hovorka, S.D. and Nava R., 2000, Characterization of Bedded Salt for Storage Salt Caverns – A Case Study from the Midland Basin, Texas, National Petroleum Technology Office, DOE/BC/15030-1 IOGCC, 1998, Natural Gas Storage in Salt Caverns, A Guide for State Regulators, Interstate Oil and Gas Compact Commission, 45pp. Jizba, D. and Nur, A, 1990, Static and dynamic moduli of tight gas sandstones and their relation to formation properties, SPWLA 31st Annual Logging Symposium, Paper BB Johnson, K.S., 1986, Salt Dissolution and Collapse at the Wink Sink in West Texas, Office of Nuclear Waste Isolation, Battelle Memorial Institute, BMI/ONWI-598 Johnson, K.S. and Gonzales, S., 1978, Salt Deposits in the United States and Regional Geologic Characteristics Important for Storage of Radioactive Waste, Office of Waste Isolation, Y/OWI/SUB-7414/1 Lytle, W.S., 1963, Underground Gas Storage in Pennsylvanian, Pennsylvanian Geological Survey, Bulletin M46.

Geomechanical Analysis of Thin Bedded Salt Caverns
DE-FC26-03NT41813 140
McGillis, K.A. and Presley, M.W., 1981, Tansill, Salado, and Alibates Formations: Upper Permian Evaporite/ Carbonate Strata of the Texas Panhandle, Texas Bureau of Economic Geology, Geological Circular 81-8 McGookey, D., Gustavson, T.C. and Hoadley, A.D., 1988, Regional Structural Cross Sections, Mid Permian to Quaternary Strata, Texas Panhandle and Eastern New Mexico, Distribution of Evaporites and Areas of Evaporite Dissolution and Collapse, Texas Bureau of Economic Geology Michigan State University, www.geo.msu.edu/geo333/miBasin.html
Munson, D.E., 1998, Analysis of Multistage and other Creep Data for Domal Salts, Sandia Report, SAND98-2276, 1998. Munson, D.E.,1999, Multimechanism-Deformation Parameters of Domal Salts using Transient Creep Analysis, Sandia Report, SAND99-2104, 1999. Nieland J.D. and Mellegard K.D., 2002, Storage of Chilled Natural Gas in Bedded Salt Storage Caverns Economic and technical Feasibility. SMRI Spring Meeting, Alberta Canada, 2002. Ohio Department of Natural Resources, 2002, Report on Ohio Mineral Industries, complied by Mark E. Wolfe. Pfeifle, T.W., Mellegard, K.D., Senseny P.E., 1983, Preliminary constitutive properties for salt and nonsalt rocks from four potential repository sites. Technical Report. RE/SPEC Inc., July 1983. Pfeifle, T.W., Vogt, T.J., Brekken G.A.,1995, Correlation of Chemical, Mineralogic and Physical Characteristics of Gulf Coast Dome Salt to Deformation and Strength Properties. SMRI 1996 Spring Meeting, Houston, TX, 1995. Senseny P.E., Triaxial Compression Creep Tests on Salt from the Waste Isolation Pilot Plant, Topical report RSI-0294, 1986. Smosna, R. and Patchen, D., 1978, Silurian Evolution of Central Appalachian Basin, American Association of Petroleum Geologists, Bulletin, v.62, no.11, p.2308-2328. Stone and Webster Engineering Corp., 1983, Major Salt Beds of the Palo Duro and Dalhart Basins, Texas, Office of Nuclear Waste Isolation, Battelle Memorial Institute, BMI/ONWI-518 Terralog, Dec. 30, 2001, Geomechanical Analysis of Pressure Limits for Thin Bedded Salt Caverns, GRI Contract 8355, Final Report Texas Railroad Commission, Texas Administrative Code, Title 16, Part 1, Chapter 3.

Geomechanical Analysis of Thin Bedded Salt Caverns
DE-FC26-03NT41813 141
Tomastik, T.E., 1996, An Examination of the Geology of the Bass Islands and Salina groups in Ohio and Its Effect on Salt Solution Mining and Underground Storage, Solution Mining Research Institute, Meeting Paper, Oct.20-23, 1996, p.175-206. Tomastik, T.E., 1997, The Sedimentology of the Bass Islands and Salina Groups in Ohio and Its Effect on Salt Solution Mining and Underground Storage, USA, in Carbonates and Evaporites, Friedman, Gerald M. Editor, vol.12, no.2, p.236-253. Tomastik, T.E., 2004, personal communication, Jan. 26, 2004.

Geomechanical Analysis of Thin Bedded Salt Caverns
DE-FC26-03NT41813 142